

Form N-CSRS NORTHERN LIGHTS FUND For: Sep 30
 Tweet
Tweet Share
Shareunited
states
securities and exchange commission
washington, d.c. 20549
form n-csr
certified shareholder report of registered management
investment companies
Investment Company Act file number 811-22655
Northern Lights Fund Trust III
(Exact name of registrant as specified in charter)
225 Pictoria Drive, Suite 450, Cincinnati, OH 45246
(Address of principal executive offices) (Zip code)
CT Corporation Trust Company
1209 Orange Street, Wilmington, DE 19801
(Name and address of agent for service)
Registrant's telephone number, including area code: 631-470-2600
Date of fiscal year end: 3/31
Date of reporting period: 9/30/22
Item 1. Reports to Stockholders.

| Centerstone Investors ♦ Semi-Annual Report ♦ September 30, 2022 |
TABLE OF CONTENTS

| 3 | CENTERSTONE’S DISTINCT INVESTMENT APPROACH |
| 4 | CENTERSTONE’S OPERATING PRINCIPLES |
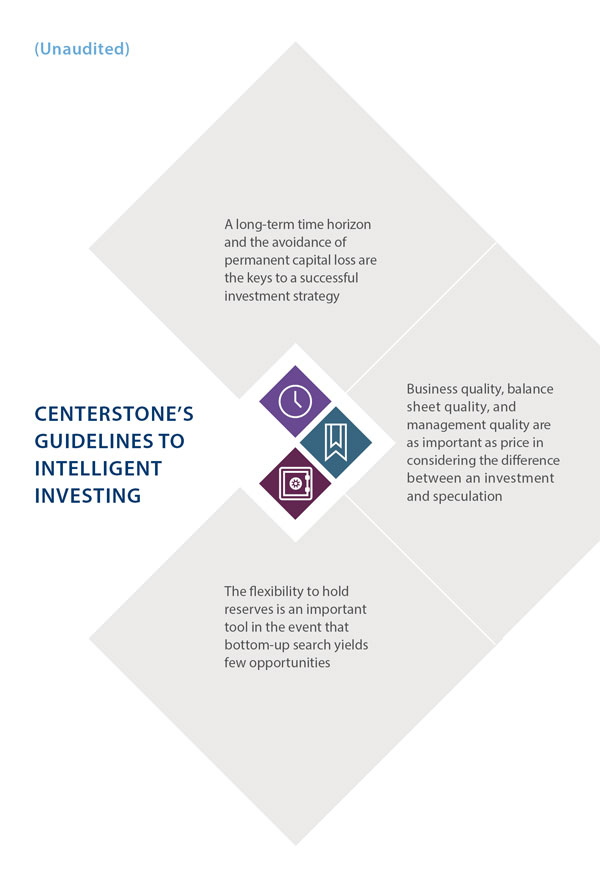
| 5 | CENTERSTONE’S GUIDELINES TO INTELLIGENT INVESTING |
| 6 | SHAREHOLDER LETTER |
| CENTERSTONE INVESTORS FUND | |
| 12 | Centerstone Investors Fund Overview |
| 14 | Schedule of Investments |
| CENTERSTONE INTERNATIONAL FUND | |
| 20 | Centerstone International Fund Overview |
| 22 | Schedule of Investments |
| 27 | STATEMENTS OF ASSETS AND LIABILITIES |
| 29 | STATEMENTS OF OPERATIONS |
| 30 | STATEMENTS OF CHANGES IN NET ASSETS |
| FINANCIAL HIGHLIGHTS | |
| 32 | Centerstone Investors Fund |
| 36 | Centerstone International Fund |
| 40 | NOTES TO FINANCIAL STATEMENTS |
| 64 | FUNDS’ EXPENSES |
| 66 | SUPPLEMENTAL INFORMATION |
| 73 | PRIVACY NOTICE |
| Centerstone Investors ♦ Semi-Annual Report ♦ September 30, 2022 | 1 |
| 2 | Centerstone Investors ♦ Semi-Annual Report ♦ September 30, 2022 |
| CENTERSTONE’S DISTINCT INVESTMENT APPROACH |
| (Unaudited) |
Successful investing requires a strong dose of common sense. As a result, we approach security analysis from a different perspective. We are business analysts, not “equity” analysts. Business analysis is a more holistic approach which includes the entirety of a firm’s capital structure and allows us, in our opinion, to more accurately gauge the prospects for impairment in business value.
|
| “Successful investing requires a strong dose of common sense. As a result, we approach security analysis from a different perspective. We are business analysts, not ‘equity’ analysts.” |
|
|

As the name of the firm states, we are investors, which implies a long-term time horizon. Since most peers operate on an annual cycle, they attempt to maximize short-term gains. Being privately owned with an employee ownership culture allows us, in our opinion, to more effectively align our interests with our investors.
We define risk simply as the chance for permanent loss of capital. Our distinct investment approach seeks to minimize losses at a portfolio level by trying to have adequate diversification of risks. We will default to cash and high quality bonds in the absence of qualifying investments. It is our belief that our risk management techniques on a security-level and portfolio-level attempt to address the risk most commonly defined by shareholders: volatility.
| Centerstone Investors ♦ Semi-Annual Report ♦ September 30, 2022 | 3 |
| CENTERSTONE’S OPERATING PRINCIPLES |
| (Unaudited) |

TIME HORIZON
| ♦ | Long-term investment horizon |
| ♦ | Emphasis on long-term earnings power, rather than current earnings |
MARGIN OF SAFETY AND INTRINSIC VALUE
| ♦ | Invest in a security after we have determined that the market price is lower than its intrinsic value, the difference being our margin of safety |
| ♦ | Margin of safety affords us a cushion to potentially avoid paying more than its intrinsic value |
SEEK TO MANAGE RISK THROUGH BOTTOM-UP RESEARCH
| ♦ | In our opinion, it is important to avoid highly leveraged businesses, specifically because they are more exposed to an impairment of value during periods of industry or economic distress |
| ♦ | Focus our efforts on understanding the likelihood of a change in the earnings power of a business due to changing competitive dynamics, technological challenges and regulations, among other factors |
| ♦ | In most cases, we will avoid shareholder-unfriendly businesses as it relates to management’s capital allocation decisions |
GENERAL MARKET RISK WITHIN A BOTTOM-UP APPROACH
| ♦ | In environments with an insufficient margin of safety, fully invested portfolio mandates can become too exposed to the risk of loss by owning potentially overvalued securities, while a more flexible policy may help to reduce that risk by holding a reserve in cash and high quality debt instruments |
| 4 | Centerstone Investors ♦ Semi-Annual Report ♦ September 30, 2022 |
(Unaudited)
| Centerstone Investors ♦ Semi-Annual Report ♦ September 30, 2022 | 5 |

 Abhay Deshpande, CFA CHIEF INVESTMENT OFFICER |
DEAR
FELLOW CENTERSTONE SHAREHOLDERS, For the six-month period ended September 30, 2022, we saw the ongoing tug-of-war between parties on either side of the recession question. While real-time data has yet to show a broad-based decline in economic activity, forward-looking indicators, such as The Conference Board Leading Economic Index (LEI), are starting to provide weight to the idea that a recession is looming. A consumer retrenchment should not come as a surprise, considering the enormous number of roadblocks that have materialized over the past 12 months. Global markets have reacted in kind, with the period full of volatility in almost every asset class. |
The last time I recall a period like this was in 1994 when both bonds and stocks took a tumble. At the time, many commentators also assumed a major recession was at hand and that stocks were historically expensive and would fall significantly. Indeed, some pockets of the stock market, especially interest rate-sensitive ones, fell by more than 30% that year. However, things began to recover by early 1995 and a recession never materialized. I have no idea if something similar is in store this time but with all the gloom on the table, I think some perspective is needed. First, no one knows the future. Second, no one knows how markets will react to whatever the future holds. The only strategy I have found that works consistently over the long run is investing in good businesses run by capable managers. That explains why, despite all the gloom, we have added several new securities to the portfolios over the six-month period.
| 6 | Centerstone Investors ♦ Semi-Annual Report ♦ September 30, 2022 |
| SHAREHOLDER LETTER |
| September 30, 2022 |
| (Unaudited) |
WEIGHING MACHINE
As global investors at Centerstone, top-down uncertainties have always been a part of our landscape. For the better part of the three decades that I have been investing on behalf of clients, I cannot recall a year where all was calm across our investing universe. Since 1990, we have had a litany of wars, bubbles, terrorism, banking and political crises, and currency shocks. The fall of communism and the rise of China was an ever-present backdrop as well. And oh, a viral outbreak as the cherry on top. Each time the crisis has a different name, but the only thing that is known for certain is that the crisis eventually ends. However, while these or any others emerge, stock prices can fluctuate wildly. The reason for this volatility relates to Ben Graham’s wisdom that “in the short run, the market is a voting machine but in the long run it is a weighing machine.”
Fear causes a lot of people to do the wrong thing at the wrong time. It is my belief that the root cause of that fear is not knowing what something is worth. If you had perfect knowledge and knew all the details of the company you invested in and knew what its actual value was, you would be better placed than someone who was merely speculating on rumors, guesses, or economic forecasts. At Centerstone, we attempt to do the former by applying a rigorous analytic process to a broad array of publicly available information to gauge the intrinsic value of a company. Our goal is to know the companies in our portfolios better than anyone else. In that sense, we are firmly on the “weighing” side of Graham’s scale. To paraphrase Graham, although the market offers to buy or sell your stock every day, there is no requirement to transact until the offered price and the company itself meets one’s criteria.
| Centerstone Investors ♦ Semi-Annual Report ♦ September 30, 2022 | 7 |
REVERSION TO THE MEAN?
Our preference is for companies with good balance sheets, good businesses and good management teams. Provided the company’s stock price is also well below its intrinsic value, we are interested buyers. And we are willing to hold that position for years. Frequently we have companies that are acquired by competitors, management teams, or private equity. These events verify our internal valuation methodology. By and large, over the life of the Centerstone Investors Fund (CENTX) and the Centerstone International Fund (CINTX), private market transactions have confirmed our process, as takeout values have tended to be close to our intrinsic value estimates. At least two more companies we currently own appear to be acquisition targets, with potential acquisition prices well above the pre-negotiation prices.
Beyond these two, most companies in the Funds continue to trade significantly below intrinsic value, providing some potential latency for the future. This should come as no surprise as non-US stocks continue to trade for relatively low valuations. At this point, we believe foreign stocks are now both relatively and absolutely undervalued. The value components of the foreign markets, which are even cheaper, now seem attractive enough to offset even the worst-case possibilities that the doom-and-gloom crowd expects. It is often said that the best time to invest is when prospects appear the bleakest.
Over the years, we have experienced the tendency towards mean reversion. When foreign markets become leaders again, the Funds are set up to benefit from this potential leadership change. Irrespective of the market or macro backdrop, we look for businesses that have solid balance sheets, durable business models and shareholder-friendly management teams that can live through any market environment. We believe our portfolios will drive strong long-term performance as our holdings demonstrate these attributes.
| 8 | Centerstone Investors ♦ Semi-Annual Report ♦ September 30, 2022 |
| SHAREHOLDER LETTER |
| September 30, 2022 |
| (Unaudited) |
DISCUSSION OF FUND PERFORMANCE
CENTERSTONE INVESTORS FUND
For the six-month period ended September 30, 2022, the Centerstone Investors Fund Class I shares (CENTX) returned -17.24% and Class A shares (CETAX) returned -17.31% compared with -21.41% for the MSCI ACWI Index. The Fund’s reserves* made up 10.14% of the portfolio as of September 30, 2022.
During the period, the Centerstone Investors Fund’s five largest contributors to performance were CDK Global (United States, US Equity, Information Technology), Ross Stores (United States, US Equity, Consumer Discretionary), Carlisle (United States, US Equity, Industrials), O’Reilly Automotive (United States, US Equity, Consumer Discretionary) and T. Hasegawa (Japan, Foreign Equity, Materials), collectively adding 0.54% to performance. The five largest detractors were Air Liquide (France, Foreign Equity, Materials), SPDR Gold (United States, Gold ETF), Ubisoft Entertainment (France, Foreign Equity, Communication Services), Scotts Miracle-Gro (United States, US Equity, Materials) and Henry Schein (United States, US Equity, Health Care), collectively subtracting 3.98% from performance.
CENTERSTONE INTERNATIONAL FUND
For the six-month period ended September 30, 2022, the Centerstone International Fund Class I shares (CINTX) returned -20.43% and Class A shares (CSIAX) returned -20.55% compared with -22.27% for the MSCI ACWI Ex-US Index. The Fund’s reserves* made up 2.32% of the portfolio as of September 30, 2022.
| Centerstone Investors ♦ Semi-Annual Report ♦ September 30, 2022 | 9 |
During the period, the Centerstone International Fund’s five largest contributors to performance were Fresnillo (Mexico, Foreign Equity, Materials), Perrigo (Ireland, Foreign Equity, Health Care), Oversea-Chinese Banking (Singapore, Foreign Equity, Financials), CCU (Chile, Foreign Equity, Consumer Staples) and T. Hasegawa (Japan, Foreign Equity, Materials), collectively adding 0.84% to performance. The five largest detractors were Coast Capital Midas Fund LP^ (Canada, Private Fund, Materials), Megacable (Mexico, Foreign Equity, Communication Services), Ubisoft Entertainment (France, Foreign Equity, Communication Services), SPDR Gold (United States, Gold ETF) and Vopak (Netherlands, Foreign Equity, Energy), collectively subtracting 4.93% from performance.
We appreciate our partnership and we look forward to writing you again.
Sincerely,

Abhay Deshpande, CFA
CHIEF INVESTMENT OFFICER
| * | Reserve positions may include cash & cash equivalents, treasury securities and short-term high quality bonds. |
| ^ | OceanaGold Corp (a security traded on the Canadian Securities Exchange) is the main underlying holding of Coast Capital Midas Fund LP. |
The commentary represents the opinion of Centerstone Investors as of September 2022, and is subject to change based on market and other conditions. These opinions are not intended to be a forecast of future events, a guarantee of future results or investment advice. Any statistics contained here have been obtained from sources believed to be reliable, but the accuracy of this information cannot be guaranteed. The views expressed herein may change at any time subsequent to the date of issue hereof. The information provided is not to be construed as a recommendation or an offer to buy or sell or the solicitation of an offer to buy or sell any fund or security.
The MSCI ACWI Index is a free float-adjusted market capitalization weighted index that is designed to measure the equity market performance of developed and emerging markets.
The MSCI ACWI ex-US Index is a free float-adjusted market capitalization index that is designed to measure the equity market performance of developed and emerging markets, excluding the US.
All indices provide total returns in US dollars with net dividends reinvested. Investors are not able to invest directly in the indices referenced and unmanaged index returns do not reflect any fees, expenses or sales charges. The referenced indices are shown for general market comparisons.
6987-NLD-10/31/2022
| 10 | Centerstone Investors ♦ Semi-Annual Report ♦ September 30, 2022 |
| Centerstone Investors ♦ Semi-Annual Report ♦ September 30, 2022 | 11 |
| |
CENTERSTONE
INVESTORS FUND OVERVIEW (Unaudited) |
 |
 |
 |
| Seeks long-term growth of capital | Global investments across industries, market capitalizations and capital structure | Invest in global equities and fixed income, with a bottom-up value approach. Weightings will vary depending on opportunities |
| PERFORMANCE | 1 Month | YTD | 1 Year | 3 Year | 5 Year | Since Inception* | ||||||
| Class I (CENTX) | -7.89% | -19.83% | -18.80% | -1.28% | 0.16% | 2.23% | ||||||
| Class A (CETAX) | -7.84 | -19.97 | -18.96 | -1.50 | -0.09 | 1.97 | ||||||
| Class A (CETAX) with Sales Charge† | -12.47 | -23.98 | -23.03 | -3.18 | -1.11 | 1.15 | ||||||
| Class C (CENNX) | -7.97 | -20.43 | -19.62 | -2.27 | -0.84 | 1.28 |
| * | Inception date is May 3, 2016 |
| † | Class A Maximum Sales Charge is 5.00% |
The performance data quoted here represents past performance. Current performance may be lower or higher than the performance data quoted above. Past performance is no guarantee of future results. The investment return and principal value of an investment will fluctuate so that investor’s shares, when redeemed, may be worth more or less than their original cost. The returns shown do not reflect the deduction of taxes that a shareholder would pay on Fund distributions or on the redemptions of Fund shares. The total annual operating expenses before any fee waivers as stated in the fee table to the Fund’s prospectus dated August 1, 2022 are 1.42%, 2.17% and 1.17% for the Class A, C and I shares, respectively. The Fund’s advisor has contractually agreed to waive a portion of its advisory fee and has agreed to reimburse the Fund for other expenses, until at least August 1, 2024, so that the Total Annual Operating Expenses After Fee Waiver and Reimbursement (excluding: (i) any front-end or contingent deferred loads; (ii) brokerage fees and commissions; (iii) acquired fund fees and expenses; (iv) borrowing costs (such as interest and dividend expense on securities sold short); (v) taxes; and (vi) extraordinary expenses, such as litigation expenses (which may include indemnification of Fund officers and Trustees, contractual indemnification of Fund service providers (other than the Adviser))) will not exceed 1.35%, 2.10% and 1.10% of average daily net assets attributable to Class A, Class C, and Class I shares, respectively. These fee waivers and expense reimbursements are subject to possible recoupment from the Investors Fund within the three years after the fees have been waived or reimbursed, if such recoupment can be achieved within the lesser of the foregoing expense limits or the expense limits in place at the time of recoupment. This agreement may be terminated by the Board of Trustees only on 60 days’ written notice to the Adviser. Class A shares redeemed within the first 18 months of purchase may be assessed a 1.00% contingent deferred sales charge. Class C shares redeemed within 12 months after purchase will be charged a 1.00% contingent deferred sales charge. For performance information current to the most recent month-end, please call toll-free 877.314.9006.
| TOP 10 HOLDINGS§ | % of Portfolio | % of Portfolio | ||
| Gold & Gold-Related (US) | 6.92% | Coast Capital Midas Fund LP^ (CAN) | 2.44% | |
| Perrigo (US) | 3.25 | O’Reilly Automotive (US) | 2.28 | |
| Air Liquide (FRA) | 3.24 | Loomis (SWE) | 2.00 | |
| Henry Schein (US) | 2.76 | PHI Group (US) | 1.96 | |
| ISS (DNK) | 2.68 | TC Energy (CAN) | 1.88 | |
| TOTAL | 29.41% |
| § | Holdings in cash, cash equivalents and short term instruments have been excluded. |
| ^ | OceanaGold Corp (a security traded on the Canadian Securities Exchange) is the main underlying holding of Coast Capital Midas Fund LP. |
The security holdings are presented to illustrate examples of the securities that the Fund has bought and the diversity of areas in which the Fund may invest, and may not be representative of the Fund’s current or future investments. Portfolio holdings are subject to change and should not be considered investment advice.
| 12 | Centerstone Investors ♦ Semi-Annual Report ♦ September 30, 2022 |
| CLASS I | CLASS A | CLASS C | |||
| CENTX | ♦ | CETAX | ♦ | CENNX | |
| (Unaudited) | |||||
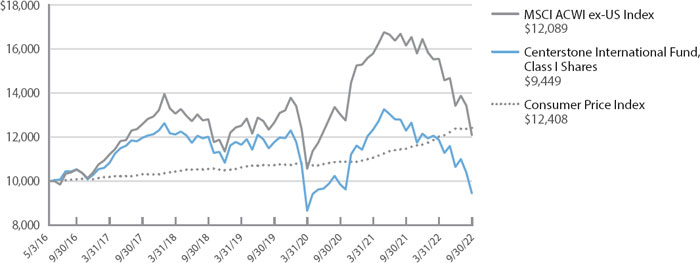
| GROWTH OF A $10,000 INITIAL INVESTMENT |
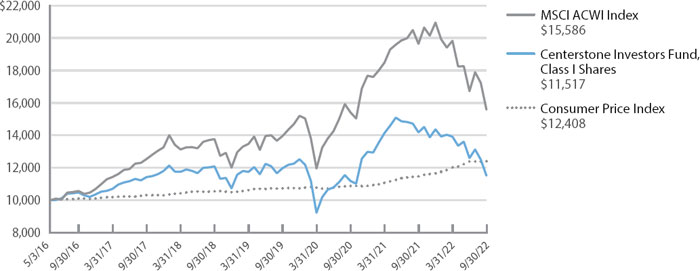
Fund inception date is May 3, 2016.
The MSCI ACWI Index is a free float-adjusted market capitalization weighted index that is designed to measure the equity market performance of developed and emerging markets. The index is not available for direct investment.
The Consumer Price Index (CPI) represents the change in price of goods and services purchased for consumption by households.
All indices provide total returns in US dollars with net dividends reinvested.
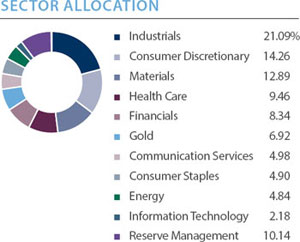
Centerstone Investors customizes its own sector, asset class and region classifications. On occasion, these classifications may differ from those used by other sources, which may result in differences. Allocation percentages are based on total value of portfolio securities excluding short-term investments.
 |
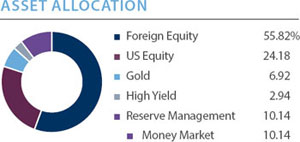 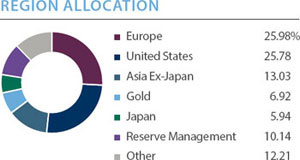 |
Centerstone Investors customizes its own sector, asset class and region classifications. On occasion, these classifications may differ from those used by other sources, which may result in differences. Allocation percentages are based on total value of portfolio securities excluding short-term investments.
| Centerstone Investors ♦ Semi-Annual Report ♦ September 30, 2022 | 13 |
| CENTERSTONE INVESTORS FUND |
| SCHEDULE OF INVESTMENTS (Unaudited) |
| September 30, 2022 |
| Shares | Security | Fair Value | ||||||
| COMMON STOCKS — 73.3% | ||||||||
| Bermuda - 0.9% | ||||||||
| 2,060,413 | PAX Global Technology Ltd. | $ | 1,559,362 | |||||
| Canada - 5.3% | ||||||||
| 20,894 | Franco-Nevada Corporation | 2,496,416 | ||||||
| 497,052 | Jaguar Mining, Inc. | 1,101,233 | ||||||
| 136,400 | Quebecor, Inc., Class B(a) | 2,515,355 | ||||||
| 81,109 | TC Energy Corporation(a) | 3,267,474 | ||||||
| 9,380,478 | ||||||||
| Cayman Islands - 2.2% | ||||||||
| 10,000 | Alibaba Group Holding Ltd. - ADR(b) | 799,900 | ||||||
| 2,214,019 | NagaCorp Ltd.(b) | 1,450,002 | ||||||
| 50,000 | Tencent Holdings Ltd. - ADR(a) | 1,691,000 | ||||||
| 3,940,902 | ||||||||
| Chile - 1.8% | ||||||||
| 234,349 | Cia Cervecerias Unidas S.A. - ADR | 2,526,282 | ||||||
| 102,546,552 | Vina San Pedro Tarapaca S.A. | 625,019 | ||||||
| 3,151,301 | ||||||||
| Denmark - 2.7% | ||||||||
| 307,285 | ISS A/S(b) | 4,736,893 | ||||||
| Finland - 1.0% | ||||||||
| 282,201 | Wartsila OYJ Abp(a) | 1,802,422 | ||||||
| France - 8.6% | ||||||||
| 50,066 | Air Liquide S.A. | 5,721,692 | ||||||
| 40,439 | Eiffage S.A. | 3,242,469 | ||||||
| 12,250 | Schneider Electric S.E. | 1,383,452 | ||||||
| 28,679 | Sodexo S.A. | 2,153,500 | ||||||
| 58,550 | Ubisoft Entertainment S.A.(b) | 1,608,875 | ||||||
| 30,800 | Worldline S.A.(b) | 1,217,221 | ||||||
| 15,327,209 | ||||||||
| Germany - 2.6% | ||||||||
| 62,763 | Fraport A.G. Frankfurt Airport Services Worldwide(b) | 2,256,555 | ||||||
| 41,500 | Porsche Automobil Holding S.E. | 2,337,909 | ||||||
| 4,594,464 | ||||||||
| Indonesia - 1.5% | ||||||||
| 1,750,445 | Gudang Garam Tbk P.T. | 2,634,428 | ||||||
See Accompanying Notes to Financial Statements.
| 14 | Centerstone Investors ♦ Semi-Annual Report ♦ September 30, 2022 |
| CENTERSTONE INVESTORS FUND |
| SCHEDULE OF INVESTMENTS (Unaudited) (Continued) |
| September 30, 2022 |
| Shares | Security | Fair Value | ||||||
| COMMON STOCKS – 73.3% (continued) | ||||||||
| Ireland - 3.9% | ||||||||
| 160,853 | Perrigo Company PLC | $ | 5,736,018 | |||||
| 118,000 | Ryanair Holdings plc(b) | 1,206,750 | ||||||
| 6,942,768 | ||||||||
| Israel - 0.9% | ||||||||
| 209,400 | ICL Group Ltd. | 1,678,390 | ||||||
| Japan - 5.9% | ||||||||
| 123,334 | Aica Kogyo Company Ltd. | 2,671,172 | ||||||
| 9,896 | FANUC Corporation | 1,389,540 | ||||||
| 176,051 | Nagaileben Company Ltd. | 2,371,292 | ||||||
| 142,905 | Sekisui Jushi Corporation | 1,627,188 | ||||||
| 7,602 | Shimano, Inc. | 1,189,448 | ||||||
| 60,000 | T Hasegawa Company Ltd. | 1,242,382 | ||||||
| 10,491,022 | ||||||||
| Korea (Republic Of) - 0.9% | ||||||||
| 40,148 | S-1 Corporation | 1,604,576 | ||||||
| Malaysia - 1.6% | ||||||||
| 2,996,312 | Genting Bhd. | 2,880,777 | ||||||
| Mexico - 1.7% | ||||||||
| 1,469,351 | Megacable Holdings S.A.B. de C.V. | 2,960,080 | ||||||
| Netherlands - 1.0% | ||||||||
| 97,445 | Koninklijke Vopak N.V. | 1,772,730 | ||||||
| Singapore - 3.3% | ||||||||
| 377,369 | Oversea-Chinese Banking Corporation Ltd. | 3,092,227 | ||||||
| 420,000 | Singapore Exchange Ltd. | 2,755,455 | ||||||
| 5,847,682 | ||||||||
| Spain - 0.5% | ||||||||
| 44,818 | Cia de Distribucion Integral Logista Holdings S.A. | 816,644 | ||||||
| Sweden - 2.9% | ||||||||
| 143,374 | Loomis A.B. | 3,533,260 | ||||||
| 191,781 | Mekonomen A.B. | 1,578,103 | ||||||
| 5,111,363 | ||||||||
| Switzerland - 0.6% | ||||||||
| 98,570 | Softwareone Holding A.G.(a) | 1,070,587 | ||||||
| Thailand - 2.5% | ||||||||
| 631,400 | Bangkok Bank PCL | 2,267,477 | ||||||
| 547,930 | Siam City Cement PCL | 2,209,870 | ||||||
| 4,477,347 | ||||||||
| United Kingdom - 0.7% | ||||||||
| 1,116,536 | Firstgroup plc | 1,300,013 | ||||||
See Accompanying Notes to Financial Statements.
| Centerstone Investors ♦ Semi-Annual Report ♦ September 30, 2022 | 15 |
| CENTERSTONE INVESTORS FUND |
| SCHEDULE OF INVESTMENTS (Unaudited) (Continued) |
| September 30, 2022 |
| Shares | Security | Fair Value | ||||||
| COMMON STOCKS – 73.3% (continued) | ||||||||
| United States - 20.3% | ||||||||
| 12,299 | 3M Company | $ | 1,359,040 | |||||
| 13,845 | Brunswick Corporation | 906,155 | ||||||
| 4,785 | Carlisle Companies, Inc. | 1,341,762 | ||||||
| 10,740 | CarMax, Inc.(b) | 709,055 | ||||||
| 45,892 | Dentsply Sirona, Inc. | 1,301,039 | ||||||
| 22,557 | Emerson Electric Company | 1,651,623 | ||||||
| 74,155 | Henry Schein, Inc.(b) | 4,877,174 | ||||||
| 53,000 | IAA, Inc.(b) | 1,688,050 | ||||||
| 7,594 | McDonald’s Corporation | 1,752,240 | ||||||
| 21,916 | Mohawk Industries, Inc.(b) | 1,998,520 | ||||||
| 2,986 | Neogen Corporation(b) | 41,714 | ||||||
| 5,727 | O’Reilly Automotive, Inc.(b) | 4,028,084 | ||||||
| 270,940 | PHI Group, Inc.(a) | 3,454,485 | ||||||
| 17,600 | Ross Stores, Inc. | 1,483,152 | ||||||
| 23,795 | Scotts Miracle-Gro Company (The)(a) | 1,017,236 | ||||||
| 52,512 | Sonoco Products Company | 2,979,006 | ||||||
| 22,000 | Walmart, Inc. | 2,853,400 | ||||||
| 5,417 | WW Grainger, Inc. | 2,649,942 | ||||||
| 36,091,677 | ||||||||
| TOTAL COMMON STOCKS (Cost $156,599,035) | 130,173,115 | |||||||
| EXCHANGE-TRADED FUNDS — 7.5% | ||||||||
| United States - 7.5% | ||||||||
| 79,027 | SPDR Gold Shares(b) | 12,223,106 | ||||||
| 19,360 | SPDR S&P Regional Banking ETF(a) | 1,139,917 | ||||||
| 13,363,023 | ||||||||
| TOTAL EXCHANGE-TRADED FUNDS (Cost $11,208,399) | 13,363,023 | |||||||
| PREFERRED STOCKS — 3.1% | ||||||||
| United States - 3.1% | ||||||||
| 100,000 | Bank of America Corporation | 1,960,000 | ||||||
| 98,132 | JPMorgan Chase & Company(a) | 1,770,301 | ||||||
| 100,000 | Wells Fargo & Company | 1,719,000 | ||||||
| 5,449,301 | ||||||||
| TOTAL PREFERRED STOCKS (Cost $6,218,887) | 5,449,301 | |||||||
See Accompanying Notes to Financial Statements.
| 16 | Centerstone Investors ♦ Semi-Annual Report ♦ September 30, 2022 |
| CENTERSTONE INVESTORS FUND |
| SCHEDULE OF INVESTMENTS (Unaudited) (Continued) |
| September 30, 2022 |
| Shares | Security | Fair Value | ||||||||||
| PRIVATE INVESTMENT FUNDS — 2.4% | ||||||||||||
| United States - 2.4% | ||||||||||||
| 2,691,200 | Coast Capital Midas Fund LP(b),(c),(d),(e),(f ) | $ | 4,300,538 | |||||||||
| TOTAL PRIVATE INVESTMENT FUNDS (Cost $4,800,000) | 4,300,538 | |||||||||||
| Principal Amount ($) |
Coupon Rate (%) | Maturity | Fair Value | |||||||||
| CORPORATE BONDS — 2.9% | ||||||||||||
| Ireland — 1.3% | ||||||||||||
| 2,500,000 USD | Perrigo Finance Unlimited Company | 3.9000 | 12/15/24 | 2,332,850 | ||||||||
| United States — 1.6% | ||||||||||||
| 2,000,000 USD | Bath & Body Works, Inc. | 6.6940 | 01/15/27 | 1,866,491 | ||||||||
| 1,000,000 USD | IAA, Inc.(g) | 5.5000 | 06/15/27 | 912,500 | ||||||||
| 2,778,991 | ||||||||||||
| TOTAL CORPORATE BONDS (Cost $5,454,661) | 5,111,841 | |||||||||||
| Shares | Security | Fair Value | ||||||||||
| SHORT-TERM INVESTMENTS — 12.3% | ||||||||||||
| COLLATERAL FOR SECURITIES LOANED - 2.3% | ||||||||||||
| 4,033,069 | State Street Navigator Securities Lending Government Money Market Portfolio, 3.07% (Cost $4,033,069)(h),(i) | 4,033,069 | ||||||||||
| MONEY MARKET FUNDS - 10.0% | ||||||||||||
| 17,869,519 | State Street Institutional Treasury Plus Money Market Fund, Trust Class, 2.89% (Cost $17,869,519)(h) | 17,869,519 | ||||||||||
| TOTAL SHORT-TERM INVESTMENTS (Cost $21,902,588) | 21,902,588 | |||||||||||
| TOTAL INVESTMENTS - 101.5% (Cost $206,183,570) | $ | 180,300,406 | ||||||||||
| LIABILITIES IN EXCESS OF OTHER ASSETS - (1.5)% | (2,665,410 | ) | ||||||||||
| NET ASSETS - 100.0% | $ | 177,634,996 | ||||||||||
See Accompanying Notes to Financial Statements.
| Centerstone Investors ♦ Semi-Annual Report ♦ September 30, 2022 | 17 |
| CENTERSTONE INVESTORS FUND |
| SCHEDULE OF INVESTMENTS (Unaudited) (Continued) |
| September 30, 2022 |
| ADR | - | American Depositary Receipt |
| A/S | - | Anonim Sirketi |
| ETF | - | Exchange-Traded Fund |
| LP | - | Limited Partnership |
| LTD | - | Limited Company |
| N.V. | - | Naamioze Vennootschap |
| OYJ | - | Julkinen osakeyhtiö |
| PLC | - | Public Limited Company |
| P.T. | - | Perseroan Terbatas |
| S.A. | - | Société Anonyme |
| SPDR | - | Standard & Poor’s Depositary Receipt |
| (a) | Security, or a portion of the security, is out on loan at September 30, 2022. Total loaned securities had a value of $7,573,420 at September 30, 2022. | |
| (b) | Non-income producing security. | |
| (c) | Illiquid security. The total fair value of these securities as of September 30, 2022 was $4,300,538, representing 2.4% of net assets. | |
| (d) | The value of this security has been determined in good faith under policies adopted by the Board of Trustees. | |
| (e) | Investment is valued using net asset value (or its equivalent) as a practical expedient. Total value of all such securities as September 30, 2022, amounted to $4,300,538, which represents approximately 2.4% of the net assets of the Fund. OceanaGold Corporation (a security traded on the Toronto Stock Exchange) is the only underlying holding of Coast Capital Midas Fund LP. | |
| (f) | Restricted security. | |
| (g) | Security exempt from registration under Rule 144A or Section 4(2) of the Securities Act of 1933. The security may be resold in transactions exempt from registration, normally to qualified institutional buyers. As of September 30, 2022 the total market value of 144A securities is $912,500 or 0.5% of net assets. | |
| (h) | Rate disclosed is the seven day effective yield as of September 30, 2022. | |
| (i) | The loaned securities were secured with short-term investment cash collateral of $4,033,069 and non-cash collateral of $4,060,052. The non-cash collateral consists of short-term investments and long-term bonds and is held for benefit of the Fund at the Fund’s custodian. The Fund cannot pledge or resell the collateral. |
See Accompanying Notes to Financial Statements.
| 18 | Centerstone Investors ♦ Semi-Annual Report ♦ September 30, 2022 |
| CENTERSTONE INVESTORS FUND |
| SCHEDULE OF INVESTMENTS (Unaudited) (Continued) |
| September 30, 2022 |
As of September 30, 2022 the following Forward Foreign Currency Contracts were open:
FORWARD FOREIGN CURRENCY AND SPOT CONTRACTS
| Foreign Currency | Settlement Date | Counterparty | Local Currency Amount Purchased/ Sold | U.S. Dollar Equivalent | U.S. Dollar Value at September 30, 2022 | Unrealized Appreciation* | ||||||||||||
| To Sell: | ||||||||||||||||||
| Euro | 02/23/2023 | State Street Bank | 15,300,000 | $ | 15,570,420 | $ | 15,159,714 | $ | 410,706 | |||||||||
| 15,570,420 | 15,159,714 | 410,706 | ||||||||||||||||
| Total | $ | 410,706 | ||||||||||||||||
| * | The amount represents fair value derivative instruments subject to foreign currency risk exposure as of September 30, 2022 |
See Accompanying Notes to Financial Statements.
| Centerstone Investors ♦ Semi-Annual Report ♦ September 30, 2022 | 19 |
|
CENTERSTONE
INTERNATIONAL FUND OVERVIEW (Unaudited) |
|
|
|
| Seeks long-term growth of capital | Non-US investments across industries, market capitalizations and capital structure | Invest majority of assets in foreign equities with flexibility to invest in fixed income, with a bottom-up value approach |
| PERFORMANCE | 1 Month | YTD | 1 Year | 3 Year | 5 Year | Since Inception* | ||||||
| Class I (CINTX) | -9.04% | -22.26% | -23.14% | -7.06% | -4.62% | -0.88% | ||||||
| Class A (CSIAX) | -9.06 | -22.52 | -23.39 | -7.32 | -4.87 | -1.11 | ||||||
| Class A (CSIAX) with Sales Charge† | -13.63 | -26.38 | -27.21 | -8.89 | -5.83 | -1.91 | ||||||
| Class C (CSINX) | -9.08 | -22.91 | -23.91 | -7.98 | -5.58 | -1.79 |
| * | Inception date is May 3, 2016 |
| † | Class A Maximum Sales Charge is 5.00% |
The performance data quoted here represents past performance. Current performance may be lower or higher than the performance data quoted above. Past performance is no guarantee of future results. The investment return and principal value of an investment will fluctuate so that investor’s shares, when redeemed, may be worth more or less than their original cost. The returns shown do not reflect the deduction of taxes that a shareholder would pay on Fund distributions or on the redemptions of Fund shares. The total annual operating expenses before any fee waivers as stated in the fee table to the Fund’s prospectus dated August 1, 2022 are 1.75%, 2.50% and 1.50% for the Class A, C and I shares, respectively. The Fund’s advisor has contractually agreed to waive a portion of its advisory fee and has agreed to reimburse the Fund for other expenses, until at least August 1, 2024, so that the Total Annual Operating Expenses After Fee Waiver and Reimbursement (excluding: (i) any front-end or contingent deferred loads; (ii) brokerage fees and commissions; (iii) acquired fund fees and expenses; (iv) borrowing costs (such as interest and dividend expense on securities sold short); (v) taxes; and (vi) extraordinary expenses, such as litigation expenses (which may include indemnification of Fund officers and Trustees, contractual indemnification of Fund service providers (other than the Adviser))) will not exceed 1.35%, 2.10% and 1.10% of average daily net assets attributable to Class A, Class C, and Class I shares, respectively. These fee waivers and expense reimbursements are subject to possible recoupment from the Investors Fund within the three years after the fees have been waived or reimbursed, if such recoupment can be achieved within the lesser of the foregoing expense limits or the expense limits in place at the time of recoupment. This agreement may be terminated by the Board of Trustees only on 60 days’ written notice to the Adviser. Class A shares redeemed within the first 18 months of purchase may be assessed a 1.00% contingent deferred sales charge. Class C shares redeemed within 12 months after purchase will be charged a 1.00% contingent deferred sales charge. For performance information current to the most recent month-end, please call toll-free 877.314.9006.
| TOP 10 HOLDINGS§ | % of Portfolio | % of Portfolio | ||
| Gold & Gold-Related (US) | 7.55% | Perrigo (US) | 3.70% | |
| Coast Capital Midas Fund LP^ (CAN) | 4.37 | Eiffage (FRA) | 3.59 | |
| ISS (DNK) | 4.13 | TC Energy (CAN) | 3.40 | |
| Air Liquide (FRA) | 3.92 | Genting (MYS) | 3.26 | |
| Loomis (SWE) | 3.82 | Megacable (MEX) | 3.02 | |
| TOTAL | 40.76% | |||
| § | Holdings in cash, cash equivalents and short term instruments have been excluded. |
| ^ | OceanaGold Corp (a security traded on the Canadian Securities Exchange) is the main underlying holding of Coast Capital Midas Fund LP. The security holdings are presented to illustrate examples of the securities that the Fund has bought and the diversity of areas in which the Fund may invest, and may not be representative of the Fund’s current or future investments. Portfolio holdings are subject to change and should not be considered investment advice. |
| 20 | Centerstone Investors ♦ Semi-Annual Report ♦ September 30, 2022 |
| CLASS I | CLASS A | CLASS C | |||
| CINTX | ♦ | CSIAX | ♦ | CSINX | |
| (Unaudited) | |||||
| GROWTH OF A $10,000 INITIAL INVESTMENT |
Fund inception date is May 3, 2016.
The MSCI ACWI ex-US Index is a free float-adjusted market capitalization index that is designed to measure the equity market performance of developed and emerging markets, excluding the US. The index is not available for direct investment.
The Consumer Price Index (CPI) represents the change in price of goods and services purchased for consumption by households.
All indices provide total returns in US dollars with net dividends reinvested.
 |
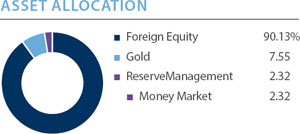 |
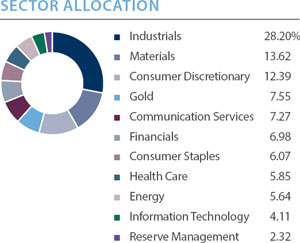
Centerstone Investors customizes its own sector, asset class and region classifications. On occasion, these classifications may differ from those used by other sources, which may result in differences. Allocation percentages are based on total value of portfolio securities excluding short-term investments.
| Centerstone Investors ♦ Semi-Annual Report ♦ September 30, 2022 | 21 |
| CENTERSTONE INTERNATIONAL FUND |
| SCHEDULE OF INVESTMENTS (Unaudited) |
| September 30, 2022 |
| Shares | Security | Fair Value | ||||||
| COMMON STOCKS — 84.5% | ||||||||
| Bermuda - 2.7% | ||||||||
| 888,587 | PAX Global Technology Ltd. | $ | 672,501 | |||||
| Canada - 6.4% | ||||||||
| 99,048 | Jaguar Mining, Inc. | 219,444 | ||||||
| 28,480 | Quebecor, Inc., Class B(a) | 525,200 | ||||||
| 20,447 | TC Energy Corporation(a) | 823,707 | ||||||
| 1,568,351 | ||||||||
| Cayman Islands - 3.4% | ||||||||
| 1,400 | Alibaba Group Holding Ltd. - ADR(b) | 111,986 | ||||||
| 772,007 | NagaCorp Ltd.(b) | 505,602 | ||||||
| 6,800 | Tencent Holdings Ltd. - ADR(a) | 229,976 | ||||||
| 847,564 | ||||||||
| Chile - 3.9% | ||||||||
| 42,927 | Cia Cervecerias Unidas S.A. - ADR | 462,753 | ||||||
| 84,677,397 | Vina San Pedro Tarapaca S.A. | 516,107 | ||||||
| 978,860 | ||||||||
| Denmark - 4.1% | ||||||||
| 66,001 | ISS A/S(b) | 1,017,426 | ||||||
| Finland - 2.5% | ||||||||
| 97,382 | Wartsila OYJ Abp(a) | 621,980 | ||||||
| France - 13.0% | ||||||||
| 8,445 | Air Liquide S.A. | 965,119 | ||||||
| 11,001 | Eiffage S.A. | 882,079 | ||||||
| 2,205 | Schneider Electric S.E. | 249,021 | ||||||
| 8,944 | Sodexo S.A. | 671,603 | ||||||
| 10,414 | Ubisoft Entertainment S.A.(b) | 286,163 | ||||||
| 4,005 | Worldline S.A.(b) | 158,278 | ||||||
| 3,212,263 | ||||||||
| Germany - 3.3% | ||||||||
| 13,744 | Fraport A.G. Frankfurt Airport Services Worldwide(b) | 494,147 | ||||||
| 5,900 | Porsche Automobil Holding S.E. | 332,377 | ||||||
| 826,524 | ||||||||
| Indonesia - 2.0% | ||||||||
| 337,955 | Gudang Garam Tbk P.T. | 508,624 | ||||||
| Ireland - 4.3% | ||||||||
| 25,507 | Perrigo Company PLC | 909,579 | ||||||
| 16,500 | Ryanair Holdings plc(b) | 168,741 | ||||||
| 1,078,320 | ||||||||
See Accompanying Notes to Financial Statements.
| 22 | Centerstone Investors ♦ Semi-Annual Report ♦ September 30, 2022 |
| CENTERSTONE INTERNATIONAL FUND |
| SCHEDULE OF INVESTMENTS (Unaudited) (Continued) |
| September 30, 2022 |
| Shares | Security | Fair Value | ||||||
| COMMON STOCKS — 84.5% (continued) | ||||||||
| Israel - 1.6% | ||||||||
| 51,127 | ICL Group Ltd. | $ | 409,795 | |||||
| Japan - 8.3% | ||||||||
| 24,581 | Aica Kogyo Company Ltd. | 532,375 | ||||||
| 1,314 | FANUC Corporation | 184,504 | ||||||
| 39,324 | Nagaileben Company Ltd. | 529,669 | ||||||
| 42,745 | Sekisui Jushi Corporation | 486,716 | ||||||
| 988 | Shimano, Inc. | 154,588 | ||||||
| 8,000 | T Hasegawa Company Ltd. | 165,651 | ||||||
| 2,053,503 | ||||||||
| Korea (Republic Of) - 2.4% | ||||||||
| 15,173 | S-1 Corporation | 606,412 | ||||||
| Malaysia - 3.2% | ||||||||
| 830,588 | Genting Bhd. | 798,561 | ||||||
| Mexico - 3.0% | ||||||||
| 368,587 | Megacable Holdings S.A.B. de C.V. | 742,537 | ||||||
| Netherlands - 2.2% | ||||||||
| 30,285 | Koninklijke Vopak N.V. | 550,948 | ||||||
| Singapore - 4.2% | ||||||||
| 82,901 | Oversea-Chinese Banking Corporation Ltd. | 679,305 | ||||||
| 58,000 | Singapore Exchange Ltd. | 380,515 | ||||||
| 1,059,820 | ||||||||
| Spain - 0.6% | ||||||||
| 8,679 | Cia de Distribucion Integral Logista Holdings S.A. | 158,143 | ||||||
| Sweden - 5.7% | ||||||||
| 38,134 | Loomis A.B. | 939,762 | ||||||
| 57,096 | Mekonomen A.B. | 469,824 | ||||||
| 1,409,586 | ||||||||
| Switzerland - 0.7% | ||||||||
| 16,455 | Softwareone Holding A.G. | 178,721 | ||||||
| Thailand - 4.7% | ||||||||
| 182,300 | Bangkok Bank PCL | 654,674 | ||||||
| 126,934 | Siam City Cement PCL | 511,941 | ||||||
| 1,166,615 | ||||||||
| United Kingdom - 2.3% | ||||||||
| 501,874 | Firstgroup plc | 584,345 | ||||||
| TOTAL COMMON STOCKS (Cost $27,629,781) | 21,051,399 | |||||||
See Accompanying Notes to Financial Statements.
| Centerstone Investors ♦ Semi-Annual Report ♦ September 30, 2022 | 23 |
| CENTERSTONE INTERNATIONAL FUND |
| SCHEDULE OF INVESTMENTS (Unaudited) (Continued) |
| September 30, 2022 |
| Shares | Security | Fair Value | ||||||
| EXCHANGE-TRADED FUNDS — 7.4% | ||||||||
| United States - 7.4% | ||||||||
| 12,003 | SPDR Gold Shares(b) | $ | 1,856,504 | |||||
| TOTAL EXCHANGE-TRADED FUNDS (Cost $1,487,407) | 1,856,504 | |||||||
| PRIVATE INVESTMENT FUNDS — 4.3% | ||||||||
| United States - 4.3% | ||||||||
| 672,800 | Coast Capital Midas Fund LP(b),(c),(d),(e),(f ) | 1,075,134 | ||||||
| TOTAL PRIVATE INVESTMENT FUNDS (Cost $1,200,000) | 1,075,134 | |||||||
| SHORT-TERM INVESTMENTS — 6.7% | ||||||||
| COLLATERAL FOR SECURITIES LOANED - 4.4% | ||||||||
| 1,096,828 | State Street Navigator Securities Lending Government Money Market Portfolio, 3.07% (Cost $1,096,828)(g),(h) | 1,096,828 | ||||||
| MONEY MARKET FUNDS - 2.3% | ||||||||
| 569,718 | State Street Institutional Treasury Plus Money Market Fund Trust Class, Trust Class, 2.89% (Cost $569,718)(g) | 569,718 | ||||||
| TOTAL SHORT-TERM INVESTMENTS (Cost $1,666,546) | 1,666,546 | |||||||
| TOTAL INVESTMENTS - 102.9% (Cost $31,983,734) | $ | 25,649,583 | ||||||
| LIABILITIES IN EXCESS OF OTHER ASSETS - (2.9)% | (712,309 | ) | ||||||
| NET ASSETS - 100.0% | $ | 24,937,274 | ||||||
| ADR | - | American Depositary Receipt |
| A/S | - | Anonim Sirketi |
| LP | - | Limited Partnership |
| LTD | - | Limited Company |
| N.V. | - | Naamioze Vennootschap |
| OYJ | - | Julkinen osakeyhtiö |
| PLC | - | Public Limited Company |
| P.T. | - | Perseroan Terbatas |
| S.A. | - | Société Anonyme |
| SPDR | - | Standard & Poor’s Depositary Receipt |
See Accompanying Notes to Financial Statements.
| 24 | Centerstone Investors ♦ Semi-Annual Report ♦ September 30, 2022 |
| CENTERSTONE INTERNATIONAL FUND |
| SCHEDULE OF INVESTMENTS (Unaudited) (Continued) |
| September 30, 2022 |
| (a) | Security, or a portion of the security, is out on loan at September 30, 2022. Total loaned securities had a value of $1,869,014 at September 30, 2022. | |
| (b) | Non-income producing security. | |
| (c) | Illiquid security. The total fair value of these securities as of September 30, 2022 was $1,075,134, representing 4.3% of net assets. | |
| (d) | The value of this security has been determined in good faith under policies adopted by the Board of Trustees. | |
| (e) | Investment is valued using net asset value (or its equivalent) as practical expedient. Total value of all such securities as September 30, 2022, amounted to $1,075,134 which represents approximately 4.3% of the net assets of the Fund. OceanaGold Corporation (a security traded on the Toronto Stock Exchange) is the only underlying holding of Coast Capital Midas Fund LP. | |
| (f) | Restricted security. | |
| (g) | Rate disclosed is the seven day effective yield as of September 30, 2022. | |
| (h) | The loaned securities were secured with short-term investment cash collateral of $1,096,828 and non-cash collateral of $918,302. The non-cash collateral consists of short-term investments and long-term bonds and is held for benefit of the Fund at the Fund’s custodian. The Fund cannot pledge or resell the collateral. |
See Accompanying Notes to Financial Statements.
| Centerstone Investors ♦ Semi-Annual Report ♦ September 30, 2022 | 25 |
| CENTERSTONE INTERNATIONAL FUND |
| SCHEDULE OF INVESTMENTS (Unaudited) (Continued) |
| September 30, 2022 |
As of September 30, 2022 the following Forward Foreign Currency Contracts were open:
FORWARD FOREIGN CURRENCY AND SPOT CONTRACTS
| Foreign Currency | Settlement Date | Counterparty | Local Currency Amount Purchased/ Sold | U.S. Dollar Equivalent | U.S. Dollar Value at September 30, 2022 | Unrealized Appreciation* | ||||||||||||
| To Sell: | ||||||||||||||||||
| Euro | 02/23/2023 | State Street Bank | 3,300,000 | $ | 3,358,326 | $ | 3,269,742 | $ | 88,584 | |||||||||
| 3,358,326 | 3,269,742 | 88,584 | ||||||||||||||||
| Total | $ | 88,584 | ||||||||||||||||
| * | The amount represents fair value derivative instruments subject to foreign currency risk exposure as of September 30, 2022 |
See Accompanying Notes to Financial Statements.
| 26 | Centerstone Investors ♦ Semi-Annual Report ♦ September 30, 2022 |
| CENTERSTONE INVESTORS |
| STATEMENTS OF ASSETS AND LIABILITIES (Unaudited) |
| September 30, 2022 |
| Centerstone | Centerstone | |||||||
| Investors | International | |||||||
| Fund | Fund | |||||||
| Assets: | ||||||||
| Investments in securities, at cost | $ | 206,183,570 | $ | 31,983,734 | ||||
| Investments in securities, at value # | $ | 180,300,406 | $ | 25,649,583 | ||||
| Interest and dividends receivable | 370,614 | 64,038 | ||||||
| Foreign tax reclaim receivable | 534,324 | 342,815 | ||||||
| Receivable for fund shares sold | 332,890 | 590 | ||||||
| Unrealized appreciation on open | ||||||||
| forward foreign currency contracts | 410,706 | 88,584 | ||||||
| Prepaid expenses and other assets | 25,015 | 8,158 | ||||||
| Total Assets | 181,973,955 | 26,153,768 | ||||||
| Liabilities: | ||||||||
| Foreign currency at value (Cost $14,232 and $1,775, respectively) | 14,242 | 1,785 | ||||||
| Collateral on securities loaned (see Note 2) | 4,033,069 | 1,096,828 | ||||||
| Payable for fund shares redeemed | 44,368 | 25,721 | ||||||
| Payable to advisor | 123,849 | 1,365 | ||||||
| Payable for shareholder servicing fees | 36,964 | 10,157 | ||||||
| Payable for distribution fees | 11,999 | 2,376 | ||||||
| Payable for custody fees | 45,431 | 45,252 | ||||||
| Accrued expenses and other liabilities | 29,037 | 33,010 | ||||||
| Total Liabilities | 4,338,959 | 1,216,494 | ||||||
| Net Assets | $ | 177,634,996 | $ | 24,937,274 | ||||
| Net Assets consist of: | ||||||||
| Paid in capital (par value $0.001 per share) | $ | 216,914,327 | $ | 57,854,777 | ||||
| Accumulated losses | (39,279,331 | ) | (32,917,503 | ) | ||||
| Net Assets | $ | 177,634,996 | $ | 24,937,274 | ||||
| # | Includes $7,573,420 and $1,869,014 of securities out on loan, respectively. |
See Accompanying Notes to Financial Statements.
| Centerstone Investors ♦ Semi-Annual Report ♦ September 30, 2022 | 27 |
| CENTERSTONE INVESTORS |
| STATEMENTS OF ASSETS AND LIABILITIES (Unaudited) (Continued) |
| September 30, 2022 |
| Centerstone | Centerstone | |||||||
| Investors | International | |||||||
| Fund | Fund | |||||||
| Net Asset Value Per Share | ||||||||
| Class I Shares: | ||||||||
| Net Assets | $ | 149,504,872 | $ | 15,743,074 | ||||
| Shares of beneficial interest outstanding (no par value; unlimited shares authorized) | 14,225,253 | 1,863,835 | ||||||
| Net asset value, offering and redemption price per share* | $ | 10.51 | $ | 8.45 | ||||
| Class A Shares:** | ||||||||
| Net Assets | $ | 19,237,403 | $ | 8,702,802 | ||||
| Shares of beneficial interest outstanding (no par value; unlimited shares authorized) | 1,839,320 | 1,031,881 | ||||||
| Net asset value, and redemption price per share* | $ | 10.46 | $ | 8.43 | ||||
| Offering price per share (NAV per share plus maximum sales charge of 5%) | $ | 11.01 | $ | 8.87 | ||||
| Class C Shares: | ||||||||
| Net Assets | $ | 8,892,721 | $ | 491,398 | ||||
| Shares of beneficial interest outstanding (no par value; unlimited shares authorized) | 864,917 | 59,133 | ||||||
| Net asset value, offering and redemption price per share* | $ | 10.28 | $ | 8.31 | ||||
| Redemption proceeds per share (NAV per share less maximum contingent deferred sales charge)^ | $ | 10.18 | $ | 8.23 | ||||
| * | Each Fund will deduct a 2.00% redemption fee on the redemption amount if you sell your shares less than 30 days after purchase. |
| ** | A maximum contingent deferred sales charge (“CDSC”) of 1.00% may apply to certain redemptions of Class A shares made within the first 18 months of their purchase when an initial sales charge was not paid on the purchase. |
| ^ | If you redeem Class C shares within 12 months after purchase, you will be charged a CDSC of up to 1.00%. The charge will apply to the lesser of the original cost of the Class C shares being redeemed or the proceeds of your redemption. |
See Accompanying Notes to Financial Statements.
| 28 | Centerstone Investors ♦ Semi-Annual Report ♦ September 30, 2022 |
| CENTERSTONE INVESTORS |
| STATEMENTS OF OPERATIONS (Unaudited) |
| Six Months Ended September 30, 2022 |
| Centerstone | Centerstone | |||||||
| Investors | International | |||||||
| Fund | Fund | |||||||
| Investment Income: | ||||||||
| Interest income | $ | 252,140 | $ | 3,076 | ||||
| Dividend income | 3,513,862 | 719,767 | ||||||
| Less: Foreign withholding taxes | (352,051 | ) | (82,610 | ) | ||||
| Securities lending income, net | 8,231 | 1,213 | ||||||
| Total Investment Income | 3,422,182 | 641,446 | ||||||
| Operating Expenses: | ||||||||
| Investment advisory fees | 1,067,513 | 148,441 | ||||||
| Distribution fees - Class A Shares | 28,526 | 12,624 | ||||||
| Distribution fees - Class C Shares | 52,981 | 3,141 | ||||||
| Shareholder servicing fees | 132,732 | 34,483 | ||||||
| Administration fees | 50,841 | 21,415 | ||||||
| Custodian fees | 41,542 | 31,183 | ||||||
| Registration & filing fees | 30,081 | 28,082 | ||||||
| Chief Compliance Officer fees | 9,059 | 4,560 | ||||||
| Legal fees | 8,032 | 7,571 | ||||||
| Trustees’ fees | 6,515 | 6,379 | ||||||
| Others expenses | 30,054 | 20,455 | ||||||
| Total Operating Expenses | 1,457,876 | 318,334 | ||||||
| Less: Fees waived by the advisor | (74,973 | ) | (121,580 | ) | ||||
| Net Operating Expenses | 1,382,903 | 196,754 | ||||||
| Net Investment Income | 2,039,279 | 444,692 | ||||||
| Realized and Unrealized Gain (Loss) on Investments and Foreign Currency: | ||||||||
| Net realized gain (loss) from: | ||||||||
| Investments | (13,628,236 | ) | (2,374,296 | ) | ||||
| Forward foreign currency contracts | (541,585 | ) | (55,435 | ) | ||||
| (14,169,821 | ) | (2,429,731 | ) | |||||
| Net change in unrealized appreciation (depreciation) from: | ||||||||
| Investments | (30,090,483 | ) | (5,175,071 | ) | ||||
| Foreign currency translations | (47,646 | ) | (33,536 | ) | ||||
| Forward foreign currency contracts | 410,706 | 88,584 | ||||||
| (29,727,423 | ) | (5,120,023 | ) | |||||
| Net Realized and Unrealized Loss | (43,897,244 | ) | (7,549,754 | ) | ||||
| Net Decrease in Net Assets Resulting From Operations | $ | (41,857,965 | ) | $ | (7,105,062 | ) | ||
See Accompanying Notes to Financial Statements.
| Centerstone Investors ♦ Semi-Annual Report ♦ September 30, 2022 | 29 |
| CENTERSTONE INVESTORS |
| STATEMENTS OF CHANGES IN NET ASSETS |
| Centerstone | Centerstone | |||||||||||||||
| Investors Fund | International Fund | |||||||||||||||
| Six Months | Six Months | |||||||||||||||
| Ended | Ended | |||||||||||||||
| September 30, | Year Ended | September 30, | Year Ended | |||||||||||||
| 2022 | March 31, | 2022 | March 31, | |||||||||||||
| (Unaudited) | 2022 | (Unaudited) | 2022 | |||||||||||||
| Operations: | ||||||||||||||||
| Net investment income | $ | 2,039,279 | $ | 1,948,931 | $ | 444,692 | $ | 535,819 | ||||||||
| Net realized gain (loss) from investments, forward foreign currency contracts and securities sold short | (14,169,821 | ) | 16,338,583 | (2,429,731 | ) | 539,287 | ||||||||||
| Net change in unrealized depreciation on investments,foreign currency translations,foreign currency translations and securities sold short | (29,727,423 | ) | (23,621,197 | ) | (5,120,023 | ) | (2,964,863 | ) | ||||||||
| Net Decrease in Net Assets Resulting From Operations | (41,857,965 | ) | (5,333,683 | ) | (7,105,062 | ) | (1,889,757 | ) | ||||||||
| Distributions to Shareholders From: | ||||||||||||||||
| Tax Return of Capital | ||||||||||||||||
| Class I | — | — | — | (32,392 | ) | |||||||||||
| Class A | — | — | — | (7,898 | ) | |||||||||||
| Class C | — | — | — | (296 | ) | |||||||||||
| Total Distributions Paid | ||||||||||||||||
| Class I | — | (3,239,347 | ) | — | (925,363 | ) | ||||||||||
| Class A | — | (261,766 | ) | — | (225,639 | ) | ||||||||||
| Class C | — | (28,475 | ) | — | (8,459 | ) | ||||||||||
| Total Distributions to Shareholders | — | (3,529,588 | ) | — | (1,200,047 | ) | ||||||||||
See Accompanying Notes to Financial Statements.
| 30 | Centerstone Investors ♦ Semi-Annual Report ♦ September 30, 2022 |
| CENTERSTONE INVESTORS |
| STATEMENTS OF CHANGES IN NET ASSETS (Continued) |
| Centerstone | Centerstone | |||||||||||||||
| Investors Fund | International Fund | |||||||||||||||
| Six Months | Six Months | |||||||||||||||
| Ended | Ended | |||||||||||||||
| September 30, | Year Ended | September 30, | Year Ended | |||||||||||||
| 2022 | March 31, | 2022 | March 31, | |||||||||||||
| (Unaudited) | 2022 | (Unaudited) | 2022 | |||||||||||||
| Fund Share Transactions of Beneficial Interest: | ||||||||||||||||
| Net proceeds from shares sold | ||||||||||||||||
| Class I | 6,434,215 | 39,240,153 | 333,960 | 6,874,016 | ||||||||||||
| Class A | 1,023,147 | 7,136,460 | 274,643 | 1,880,857 | ||||||||||||
| Class C | 129,615 | 968,389 | — | 52,958 | ||||||||||||
| Reinvestment of distributions | ||||||||||||||||
| Class I | — | 2,986,653 | — | 909,847 | ||||||||||||
| Class A | — | 259,596 | — | 227,769 | ||||||||||||
| Class C | — | 27,471 | — | 7,469 | ||||||||||||
| Redemption fee proceeds | ||||||||||||||||
| Class I | — | 1,945 | — | 1 | ||||||||||||
| Class A | — | 219 | — | 199 | ||||||||||||
| Cost of shares redeemed | ||||||||||||||||
| Class I | (69,722,815 | ) | (23,774,459 | ) | (7,037,255 | ) | (32,259,972 | ) | ||||||||
| Class A | (2,565,762 | ) | (7,331,167 | ) | (304,117 | ) | (2,451,272 | ) | ||||||||
| Class C | (900,543 | ) | (1,307,365 | ) | (97,464 | ) | (312,468 | ) | ||||||||
| Net Increase (Decrease) in Net Assets From Share Transactions of Beneficial Interest | (65,602,143 | ) | 18,207,895 | (6,830,233 | ) | (25,070,596 | ) | |||||||||
| Total Increase (Decrease) in Net Assets | (107,460,108 | ) | 9,344,624 | (13,935,295 | ) | (28,160,400 | ) | |||||||||
| Net Assets: | ||||||||||||||||
| Beginning of Period | 285,095,104 | 275,750,480 | 38,872,569 | 67,032,969 | ||||||||||||
| End of Period | $ | 177,634,996 | $ | 285,095,104 | $ | 24,937,274 | $ | 38,872,569 | ||||||||
See Accompanying Notes to Financial Statements.
| Centerstone Investors ♦ Semi-Annual Report ♦ September 30, 2022 | 31 |
| CENTERSTONE INVESTORS FUND |
| FINANCIAL HIGHLIGHTS |
The table sets forth financial data for one share of beneficial interest outstanding in each period:
| Income from | Less | |||||||||||||||||||||||||||
| investment operations: | distributions: | |||||||||||||||||||||||||||
| Net | Total | |||||||||||||||||||||||||||
| Net | realized | income | From | |||||||||||||||||||||||||
| asset | Net | and | (loss) from | net | From | |||||||||||||||||||||||
| value, | invest- | unreal- | invest- | invest- | net | Total | ||||||||||||||||||||||
| beginning | ment | ized gain | ment | ment | realized | distribu- | ||||||||||||||||||||||
| of period | income* | (loss) | operations | income | gains | tions | ||||||||||||||||||||||
| Class I | ||||||||||||||||||||||||||||
| Six Months Ended | ||||||||||||||||||||||||||||
| September 30, 2022 (Unaudited) | $ | 12.70 | 0.11 | (2.30 | ) | (2.19 | ) | — | — | — | ||||||||||||||||||
| Year Ended March 31, 2022 | $ | 13.07 | 0.10 | (0.31 | ) | (0.21 | ) | (0.16 | ) | — | (0.16 | ) | ||||||||||||||||
| Year Ended March 31, 2021 | $ | 8.59 | 0.08 | 4.48 | 4.56 | (0.08 | ) | — | (0.08 | ) | ||||||||||||||||||
| Year Ended March 31, 2020 | $ | 11.18 | 0.12 | (2.46 | ) | (2.34 | ) | (0.16 | ) | (0.09 | ) | (0.25 | ) | |||||||||||||||
| Year Ended March 31, 2019 | $ | 11.55 | 0.14 | (0.16 | ) | (0.02 | ) | (0.12 | ) | (0.23 | ) | (0.35 | ) | |||||||||||||||
| Year Ended March 31, 2018 | $ | 10.64 | 0.10 | 0.94 | 1.04 | (0.05 | ) | (0.08 | ) | (0.13 | ) | |||||||||||||||||
| Class A | ||||||||||||||||||||||||||||
| Six Months Ended | ||||||||||||||||||||||||||||
| September 30, 2022 (Unaudited) | $ | 12.65 | 0.09 | (2.28 | ) | (2.19 | ) | — | — | — | ||||||||||||||||||
| Year Ended March 31, 2022 | $ | 13.02 | 0.06 | (0.30 | ) | (0.24 | ) | (0.13 | ) | — | (0.13 | ) | ||||||||||||||||
| Year Ended March 31, 2021 | $ | 8.56 | 0.05 | 4.46 | 4.51 | (0.05 | ) | — | (0.05 | ) | ||||||||||||||||||
| Year Ended March 31, 2020 | $ | 11.14 | 0.09 | (2.45 | ) | (2.36 | ) | (0.13 | ) | (0.09 | ) | (0.22 | ) | |||||||||||||||
| Year Ended March 31, 2019 | $ | 11.51 | 0.12 | (0.16 | ) | (0.04 | ) | (0.10 | ) | (0.23 | ) | (0.33 | ) | |||||||||||||||
| Year Ended March 31, 2018 | $ | 10.62 | 0.07 | 0.94 | 1.01 | (0.04 | ) | (0.08 | ) | (0.12 | ) | |||||||||||||||||
| * | The net investment income per share data was determined using the average shares outstanding throughout the period. |
| (1) | Amount is less than $0.005 per share. |
| (2) | Assumes reinvestment of all dividends and distributions, if any. Total return does not reflect any sales charges, if any, or the deductions of taxes that a shareholder would pay on distributions or on the redemption of shares. |
| (3) | Not annualized. |
| (4) | Annualized for periods less than one year. |
| (5) | The ratios include 0.00% and 0.02% for the years ended March 31, 2022 and March 31, 2021, respectively, attributed to dividends from securities sold short. |
See Accompanying Notes to Financial Statements.
| 32 | Centerstone Investors ♦ Semi-Annual Report ♦ September 30, 2022 |
| Ratios/ | Ratios of net invest- | |||||||||||||||||||||||||||||||||
| Supplemen- | Ratios of expenses | ment income (loss) | ||||||||||||||||||||||||||||||||
| tal Data: | to average net assets | to average net assets | ||||||||||||||||||||||||||||||||
| Paid in | Net | Net | ||||||||||||||||||||||||||||||||
| capital | asset | assets, | ||||||||||||||||||||||||||||||||
| from | value, | end of | Before | After | Before | After | Portfolio | |||||||||||||||||||||||||||
| redemp- | end of | Total | period | fee | fee | fee | fee | turnover | ||||||||||||||||||||||||||
| tion fees | period | return(2) | (in 000s) | waivers | waivers | waivers | waivers | rate | ||||||||||||||||||||||||||
| — | $ | 10.51 | (17.24 | )%(3) | $ | 149,505 | 1.16 | %(4) | 1.10 | %(4) | 1.73 | %(4) | 1.80 | %(4) | 11.95 | %(3) | ||||||||||||||||||
| 0.00 | (1) | $ | 12.70 | (1.58 | )% | $ | 248,482 | 1.11 | %(5) | 1.10 | %(5) | 0.71 | %(5) | 0.72 | %(5) | 31.56 | % | |||||||||||||||||
| 0.00 | (1) | $ | 13.07 | 53.22 | % | $ | 237,904 | 1.23 | %(5) | 1.12 | %(5) | 0.60 | %(5) | 0.72 | %(5) | 34.65 | % | |||||||||||||||||
| 0.00 | (1) | $ | 8.59 | (21.46 | )% | $ | 221,360 | 1.17 | % | 1.10 | % | 1.04 | % | 1.11 | % | 49.72 | % | |||||||||||||||||
| 0.00 | (1) | $ | 11.18 | (0.02 | )% | $ | 349,734 | 1.18 | % | 1.10 | % | 1.20 | % | 1.28 | % | 33.65 | % | |||||||||||||||||
| 0.00 | $ | 11.55 | 9.82 | % | $ | 264,705 | 1.34 | % | 1.10 | % | 0.65 | % | 0.88 | % | 20.55 | % | ||||||||||||||||||
| — | $ | 10.46 | (17.31 | )%(3) | $ | 19,237 | 1.41 | %(4) | 1.35 | %(4) | 1.45 | %(4) | 1.51 | %(4) | 11.95 | %(3) | ||||||||||||||||||
| 0.00 | (1) | $ | 12.65 | (1.84 | )% | $ | 24,982 | 1.36 | %(5) | 1.35 | %(5) | 0.46 | %(5) | 0.47 | %(5) | 31.56 | % | |||||||||||||||||
| 0.00 | (1) | $ | 13.02 | 52.79 | % | $ | 25,590 | 1.48 | %(5) | 1.37 | %(5) | 0.34 | %(5) | 0.45 | %(5) | 34.65 | % | |||||||||||||||||
| 0.00 | (1) | $ | 8.56 | (21.63 | )% | $ | 18,764 | 1.42 | % | 1.35 | % | 0.75 | % | 0.82 | % | 49.72 | % | |||||||||||||||||
| 0.00 | (1) | $ | 11.14 | (0.25 | )% | $ | 31,492 | 1.43 | % | 1.35 | % | 0.94 | % | 1.02 | % | 33.65 | % | |||||||||||||||||
| 0.00 | (1) | $ | 11.51 | 9.49 | % | $ | 28,609 | 1.59 | % | 1.35 | % | 0.41 | % | 0.65 | % | 20.55 | % | |||||||||||||||||
See Accompanying Notes to Financial Statements.
| Centerstone Investors ♦ Semi-Annual Report ♦ September 30, 2022 | 33 |
| CENTERSTONE INVESTORS FUND |
| FINANCIAL HIGHLIGHTS (Continued) |
The table sets forth financial data for one share of beneficial interest outstanding in each period:
| Income from | Less | |||||||||||||||||||||||||||
| investment operations: | distributions: | |||||||||||||||||||||||||||
| Net | Total | |||||||||||||||||||||||||||
| Net | Net | realized | income | From | ||||||||||||||||||||||||
| asset | invest- | and | (loss) from | net | From | |||||||||||||||||||||||
| value, | ment | unreal- | invest- | invest- | net | Total | ||||||||||||||||||||||
| beginning | income | ized gain | ment | ment | realized | distribu- | ||||||||||||||||||||||
| of period | (loss)* | (loss) | operations | income | gains | tions | ||||||||||||||||||||||
| Class C | ||||||||||||||||||||||||||||
| Six Months Ended | ||||||||||||||||||||||||||||
| September 30, 2022 (Unaudited) | $ | 12.49 | 0.04 | (2.25 | ) | (2.21 | ) | — | — | — | ||||||||||||||||||
| Year Ended March 31, 2022 | $ | 12.85 | (0.04 | ) | (0.29 | ) | (0.33 | ) | (0.03 | ) | — | (0.03 | ) | |||||||||||||||
| Year Ended March 31, 2021 | $ | 8.47 | (0.03 | ) | 4.41 | 4.38 | — | — | — | |||||||||||||||||||
| Year Ended March 31, 2020 | $ | 11.03 | 0.01 | (2.43 | ) | (2.42 | ) | (0.05 | ) | (0.09 | ) | (0.14 | ) | |||||||||||||||
| Year Ended March 31, 2019 | $ | 11.43 | 0.02 | (0.15 | ) | (0.13 | ) | (0.04 | ) | (0.23 | ) | (0.27 | ) | |||||||||||||||
| Year Ended March 31, 2018 | $ | 10.59 | (0.03 | ) | 0.96 | 0.93 | (0.01 | ) | (0.08 | ) | (0.09 | ) | ||||||||||||||||
| * | The net investment income per share data was determined using the average shares outstanding throughout the period. |
| (1) | Amount is less than $0.005 per share. |
| (2) | Assumes reinvestment of all dividends and distributions, if any. Total return does not reflect any sales charges, if any, or the deductions of taxes that a shareholder would pay on distributions or on the redemption of shares. |
| (3) | Not annualized. |
| (4) | Annualized for periods less than one year. |
| (5) | The ratios include 0.00% and 0.02% for the years ended March 31, 2022 and March 31, 2021, respectively, attributed to dividends from securities sold short. |
See Accompanying Notes to Financial Statements.
| 34 | Centerstone Investors ♦ Semi-Annual Report ♦ September 30, 2022 |
| Ratios/ | Ratios of net invest- | |||||||||||||||||||||||||||||||||
| Supplemen- | Ratios of expenses | ment income (loss) | ||||||||||||||||||||||||||||||||
| tal Data: | to average net assets | to average net assets | ||||||||||||||||||||||||||||||||
| Paid in | Net | Net | ||||||||||||||||||||||||||||||||
| capital | asset | assets, | ||||||||||||||||||||||||||||||||
| from | value, | end of | Before | After | Before | After | Portfolio | |||||||||||||||||||||||||||
| redemp- | end of | Total | period | fee | fee | fee | fee | turnover | ||||||||||||||||||||||||||
| tion fees | period | return(2) | (in 000s) | waivers | waivers | waivers | waivers | rate | ||||||||||||||||||||||||||
| — | $ | 10.28 | (17.63 | )%(3) | $ | 8,893 | 2.16 | %(4) | 2.10 | %(4) | 0.69 | %(4) | 0.76 | %(4) | 11.95 | %(3) | ||||||||||||||||||
| — | $ | 12.49 | (2.56 | )% | $ | 11,632 | 2.11 | %(5) | 2.10 | %(5) | (0.29 | )%(5) | (0.28 | )%(5) | 31.56 | % | ||||||||||||||||||
| 0.00 | (1) | $ | 12.85 | 51.71 | % | $ | 12,256 | 2.23 | %(5) | 2.12 | %(5) | (0.40 | )%(5) | (0.28 | )%(5) | 34.65 | % | |||||||||||||||||
| 0.00 | (1) | $ | 8.47 | (22.24 | )% | $ | 11,637 | 2.17 | % | 2.10 | % | 0.03 | % | 0.11 | % | 49.72 | % | |||||||||||||||||
| 0.00 | (1) | $ | 11.03 | (1.00 | )% | $ | 15,688 | 2.18 | % | 2.10 | % | 0.09 | % | 0.18 | % | 33.65 | % | |||||||||||||||||
| 0.00 | (1) | $ | 11.43 | 8.74 | % | $ | 8,164 | 2.34 | % | 2.10 | % | (0.57 | )% | (0.30 | )% | 20.55 | % | |||||||||||||||||
See Accompanying Notes to Financial Statements.
| Centerstone Investors ♦ Semi-Annual Report ♦ September 30, 2022 | 35 |
| CENTERSTONE INTERNATIONAL FUND |
| FINANCIAL HIGHLIGHTS |
The table sets forth financial data for one share of beneficial interest outstanding in each period:
| Income from | Less | |||||||||||||||||||||||||||||||
| investment operations: | distributions: | |||||||||||||||||||||||||||||||
| Total | ||||||||||||||||||||||||||||||||
| Net | income | |||||||||||||||||||||||||||||||
| Net | realized | (loss) | ||||||||||||||||||||||||||||||
| asset | Net | and | from | From | ||||||||||||||||||||||||||||
| value, | invest- | unreal- | invest- | net | From | Tax | ||||||||||||||||||||||||||
| begin- | ment | ized | ment | invest- | net | return | Total | |||||||||||||||||||||||||
| ning of | in- | gain | opera- | ment | realized | of | distri- | |||||||||||||||||||||||||
| period | come* | (loss) | tions | income | gains | capital | butions | |||||||||||||||||||||||||
| Class I | ||||||||||||||||||||||||||||||||
| Six Months Ended | ||||||||||||||||||||||||||||||||
| September 30, 2022 (Unaudited) | $ | 10.62 | 0.14 | (2.31 | ) | (2.17 | ) | — | — | — | — | |||||||||||||||||||||
| Year Ended March 31, 2022 | $ | 11.29 | 0.11 | (0.53 | ) | (0.42 | ) | (0.24 | ) | — | (0.01 | ) | (0.25 | ) | ||||||||||||||||||
| Year Ended March 31, 2021 | $ | 7.98 | 0.09 | 3.30 | 3.39 | (0.08 | ) | — | — | (0.08 | ) | |||||||||||||||||||||
| Year Ended March 31, 2020 | $ | 10.97 | 0.16 | (2.92 | ) | (2.76 | ) | (0.21 | ) | (0.02 | ) | — | (0.23 | ) | ||||||||||||||||||
| Year Ended March 31, 2019 | $ | 11.82 | 0.16 | (0.62 | ) | (0.46 | ) | (0.15 | ) | (0.24 | ) | — | (0.39 | ) | ||||||||||||||||||
| Year Ended March 31, 2018 | $ | 10.75 | 0.09 | 1.18 | 1.27 | (0.03 | ) | (0.17 | ) | — | (0.20 | ) | ||||||||||||||||||||
| Class A | ||||||||||||||||||||||||||||||||
| Six Months Ended | ||||||||||||||||||||||||||||||||
| September 30, 2022 (Unaudited) | $ | 10.61 | 0.12 | (2.30 | ) | (2.18 | ) | — | — | — | — | |||||||||||||||||||||
| Year Ended March 31, 2022 | $ | 11.28 | 0.08 | (0.53 | ) | (0.45 | ) | (0.21 | ) | — | (0.01 | ) | (0.22 | ) | ||||||||||||||||||
| Year Ended March 31, 2021 | $ | 7.98 | 0.06 | 3.29 | 3.35 | (0.05 | ) | — | — | (0.05 | ) | |||||||||||||||||||||
| Year Ended March 31, 2020 | $ | 10.96 | 0.15 | (2.93 | ) | (2.78 | ) | (0.18 | ) | (0.02 | ) | — | (0.20 | ) | ||||||||||||||||||
| Year Ended March 31, 2019 | $ | 11.81 | 0.15 | (0.64 | ) | (0.49 | ) | (0.12 | ) | (0.24 | ) | — | (0.36 | ) | ||||||||||||||||||
| Year Ended March 31, 2018 | $ | 10.75 | 0.06 | 1.18 | 1.24 | (0.01 | ) | (0.17 | ) | — | (0.18 | ) | ||||||||||||||||||||
| * | The net investment income per share data was determined using the average shares outstanding throughout the period. |
| (1) | Amount is less than $0.005 per share. |
| (2) | Assumes reinvestment of all dividends and distributions, if any. Total return does not reflect any sales charges, if any, or the deductions of taxes that a shareholder would pay on distributions or on the redemption of shares. |
| (3) | Not annualized. |
| (4) | Annualized for periods less than one year. |
See Accompanying Notes to Financial Statements.
| 36 | Centerstone Investors ♦ Semi-Annual Report ♦ September 30, 2022 |
| Ratios/ | Ratios of net | |||||||||||||||||||||||||||||||||
| Supplemen- | Ratios of expenses | investment income | ||||||||||||||||||||||||||||||||
| tal Data: | to average net assets | to average net assets | ||||||||||||||||||||||||||||||||
| Paid in | Net | Net | ||||||||||||||||||||||||||||||||
| capital | asset | assets, | ||||||||||||||||||||||||||||||||
| from | value, | end of | Before | After | Before | After | Portfolio | |||||||||||||||||||||||||||
| redemp- | end of | Total | period | fee | fee | fee | fee | turnover | ||||||||||||||||||||||||||
| tion fees | period | return(2) | (in 000s) | waivers | waivers | waivers | waivers | rate | ||||||||||||||||||||||||||
| — | $ | 8.45 | (20.43 | )%(3) | $ | 15,743 | 1.84 | %(4) | 1.10 | %(4) | 2.08 | %(4) | 2.81 | %(4) | 6.14 | %(3) | ||||||||||||||||||
| 0.00 | (1) | $ | 10.62 | (3.74 | )% | $ | 27,168 | 1.45 | % | 1.10 | % | 0.63 | % | 0.98 | % | 19.69 | % | |||||||||||||||||
| 0.00 | (1) | $ | 11.29 | 42.49 | % | $ | 53,982 | 1.62 | % | 1.10 | % | 0.42 | % | 0.94 | % | 22.87 | % | |||||||||||||||||
| 0.00 | (1) | $ | 7.98 | (25.70 | )% | $ | 65,732 | 1.30 | % | 1.10 | % | 1.25 | % | 1.45 | % | 30.37 | % | |||||||||||||||||
| 0.00 | (1) | $ | 10.97 | (3.78 | )% | $ | 168,337 | 1.29 | % | 1.10 | % | 1.22 | % | 1.41 | % | 34.01 | % | |||||||||||||||||
| 0.00 | (1) | $ | 11.82 | 11.90 | % | $ | 135,303 | 1.50 | % | 1.10 | % | 0.33 | % | 0.73 | % | 20.86 | % | |||||||||||||||||
| — | $ | 8.43 | (20.55 | )%(3) | $ | 8,703 | 2.09 | %(4) | 1.35 | %(4) | 1.77 | %(4) | 2.51 | %(4) | 6.14 | %(3) | ||||||||||||||||||
| 0.00 | (1) | $ | 10.61 | (4.00 | )% | $ | 10,978 | 1.70 | % | 1.35 | % | 0.34 | % | 0.73 | % | 19.69 | % | |||||||||||||||||
| 0.00 | (1) | $ | 11.28 | 42.03 | % | $ | 12,019 | 1.87 | % | 1.35 | % | 0.10 | % | 0.63 | % | 22.87 | % | |||||||||||||||||
| 0.00 | (1) | $ | 7.98 | (25.84 | )% | $ | 11,919 | 1.55 | % | 1.35 | % | 1.15 | % | 1.35 | % | 30.37 | % | |||||||||||||||||
| 0.00 | (1) | $ | 10.96 | (4.05 | )% | $ | 20,619 | 1.54 | % | 1.35 | % | 1.13 | % | 1.33 | % | 34.01 | % | |||||||||||||||||
| 0.00 | (1) | $ | 11.81 | 11.53 | % | $ | 22,772 | 1.75 | % | 1.35 | % | 0.13 | % | 0.54 | % | 20.86 | % | |||||||||||||||||
See Accompanying Notes to Financial Statements.
| Centerstone Investors ♦ Semi-Annual Report ♦ September 30, 2022 | 37 |
| CENTERSTONE INTERNATIONAL FUND |
| FINANCIAL HIGHLIGHTS (Continued) |
The table sets forth financial data for one share of beneficial interest outstanding in each period:
| Income from | Less | |||||||||||||||||||||||||||||||
| investment operations: | distributions: | |||||||||||||||||||||||||||||||
| Total | ||||||||||||||||||||||||||||||||
| Net | income | |||||||||||||||||||||||||||||||
| Net | realized | (loss) | ||||||||||||||||||||||||||||||
| asset | Net | and | from | From | ||||||||||||||||||||||||||||
| value, | invest- | unreal- | invest- | net | From | Tax | ||||||||||||||||||||||||||
| begin- | ment | ized | ment | invest- | net | return | Total | |||||||||||||||||||||||||
| ning of | income | gain | opera- | ment | realized | of | distri- | |||||||||||||||||||||||||
| period | (loss)* | (loss) | tions | income | gains | capital | butions | |||||||||||||||||||||||||
| Class C | ||||||||||||||||||||||||||||||||
| Six Months Ended | ||||||||||||||||||||||||||||||||
| September 30, 2022 (Unaudited) | $ | 10.50 | 0.09 | (2.28 | ) | (2.19 | ) | — | — | — | — | |||||||||||||||||||||
| Year Ended March 31, 2022 | $ | 11.14 | 0.00 | (1) | (0.53 | ) | (0.53 | ) | (0.11 | ) | — | (0.00 | )(1) | (0.11 | ) | |||||||||||||||||
| Year Ended March 31, 2021 | $ | 7.90 | 0.00 | (1) | 3.24 | 3.24 | — | — | — | — | ||||||||||||||||||||||
| Year Ended March 31, 2020 | $ | 10.85 | 0.05 | (2.88 | ) | (2.83 | ) | (0.10 | ) | (0.02 | ) | — | (0.12 | ) | ||||||||||||||||||
| Year Ended March 31, 2019 | $ | 11.71 | 0.05 | (0.62 | ) | (0.57 | ) | (0.05 | ) | (0.24 | ) | — | (0.29 | ) | ||||||||||||||||||
| Year Ended March 31, 2018 | $ | 10.73 | (0.04 | ) | 1.19 | 1.15 | — | (0.17 | ) | — | (0.17 | ) | ||||||||||||||||||||
| * | The net investment income per share data was determined using the average shares outstanding throughout the period. |
| (1) | Amount is less than $0.005 per share. |
| (2) | Assumes reinvestment of all dividends and distributions, if any. Total return does not reflect any sales charges, if any, or the deductions of taxes that a shareholder would pay on distributions or on the redemption of shares. |
| (3) | Not annualized. |
| (4) | Annualized for periods less than one year. |
See Accompanying Notes to Financial Statements.
| 38 | Centerstone Investors ♦ Semi-Annual Report ♦ September 30, 2022 |
| Ratios/ | Ratios of net invest- | |||||||||||||||||||||||||||||||||
| Supplemen- | Ratios of expenses | ment income (loss) | ||||||||||||||||||||||||||||||||
| tal Data: | to average net assets | to average net assets | ||||||||||||||||||||||||||||||||
| Paid in | Net | Net | ||||||||||||||||||||||||||||||||
| capital | asset | assets, | ||||||||||||||||||||||||||||||||
| from | value, | end of | Before | After | Before | After | Portfolio | |||||||||||||||||||||||||||
| redemp- | end of | Total | period | fee | fee | fee | fee | turnover | ||||||||||||||||||||||||||
| tion fees | period | return(2) | (in 000s) | waivers | waivers | waivers | waivers | rate | ||||||||||||||||||||||||||
| — | $ | 8.31 | (20.86 | )%(3) | $ | 491 | 2.84 | %(4) | 2.10 | %(4) | 1.07 | %(4) | 1.81 | %(4) | 6.14 | %(3) | ||||||||||||||||||
| — | $ | 10.50 | (4.73 | )% | $ | 726 | 2.45 | % | 2.10 | % | (0.39 | )% | (0.02 | )% | 19.69 | % | ||||||||||||||||||
| 0.00 | (1) | $ | 11.14 | 41.01 | % | $ | 1,032 | 2.62 | % | 2.10 | % | (0.57 | )% | (0.04 | )% | 22.87 | % | |||||||||||||||||
| 0.00 | (1) | $ | 7.90 | (26.39 | )% | $ | 1,696 | 2.30 | % | 2.10 | % | 0.30 | % | 0.50 | % | 30.37 | % | |||||||||||||||||
| 0.00 | (1) | $ | 10.85 | (4.83 | )% | $ | 9,475 | 2.29 | % | 2.10 | % | 0.22 | % | 0.41 | % | 34.01 | % | |||||||||||||||||
| 0.00 | (1) | $ | 11.71 | 10.70 | % | $ | 5,810 | 2.50 | % | 2.10 | % | (0.74 | )% | (0.34 | )% | 20.86 | % | |||||||||||||||||
See Accompanying Notes to Financial Statements.
| Centerstone Investors ♦ Semi-Annual Report ♦ September 30, 2022 | 39 |
| CENTERSTONE INVESTORS |
| NOTES TO FINANCIAL STATEMENTS (Unaudited) |
| September 30, 2022 |
| 1. | ORGANIZATION |
The Centerstone Investors Fund and the Centerstone International Fund (each a “Fund” and collectively the “Funds”) are diversified series of shares of beneficial interest of Northern Lights Fund Trust III, (the “Trust”), a statutory trust organized under the laws of the State of Delaware on December 5, 2011, and registered under the Investment Company Act of 1940, as amended (the “1940 Act”), as an open-end management investment company. Each Fund reorganized on March 5, 2021 from their predecessor fund to a series of Northern Lights Fund Trust III. The Centerstone Investors Fund seeks long-term growth of capital by investing in a range of securities and asset classes from markets around the world, including the US market. The Centerstone International Fund seeks long-term growth of capital by investing in a range of securities and asset classes primarily from foreign (non-US) markets. Centerstone Investors, LLC (the “Advisor”) manages the Funds. The Funds’ inception date is May 3, 2016.
All classes of shares for each of the Funds have identical rights to earnings, assets and voting privileges, except for class-specific expenses and exclusive rights to vote on matters affecting only individual classes.
| 2. | SUMMARY OF SIGNIFICANT ACCOUNTING POLICIES |
The following is a summary of significant accounting policies followed by the Funds in preparation of their financial statements. The policies are in conformity with accounting principles generally accepted in the United States of America (“GAAP”). The preparation of the financial statements requires management to make estimates and assumptions that affect the reported amounts of assets and liabilities and disclosure of contingent assets and liabilities at the date of the financial statements and the reported amounts of income and expenses for the year then ended. Actual results could differ from those estimates. Each Fund is an investment company and accordingly follows the investment company accounting and reporting guidance of the Financial Accounting Standards Board (“FASB”) Accounting Standards Codification Topic 946 “Financial Services Investment Companies” including Accounting Standards Update 2013-08.
| 40 | Centerstone Investors ♦ Semi-Annual Report ♦ September 30, 2022 |
| CENTERSTONE INVESTORS |
| NOTES TO FINANCIAL STATEMENTS (Unaudited) (Continued) |
| September 30, 2022 |
| a. | Investment Valuation – The Funds record their investments at fair value. In determining each Fund’s Net Asset Value (“NAV”) per share as of the close of the New York Stock Exchange (“NYSE”), currently 4:00 pm Eastern Time (“ET”) (the “Valuation Time”), securities traded on one or more securities exchanges for which market quotations are readily available are valued at current market value using the last reported sales price. NASDAQ traded securities are valued using the NASDAQ Official Closing Price (“NOCP”). If no sale price is reported, the mean between the current bid and ask is used. If market quotations are not readily available at the Valuation Time, the Trust’s Board of Trustees (the “Board”) has designated the Advisor as its Valuation Desingee. Securities not traded or dealt in on any securities exchange and for which over-the-counter market (whether domestic or foreign) quotations are readily available generally shall be valued at the last sale price or, in the absence of a sale, at the current mean price on such over-the-counter market, (and if there is only a bid or only an ask price on such date, valuation will be at such bid or ask price for long or short positions, respectively). Debt securities, whether listed on an exchange or traded in the over-the-counter market for which market quotations are readily available, are generally priced at the current bid price. Debt securities may be valued at prices supplied by the relevant pricing agent(s) based on broker or dealer supplied valuations or matrix pricing, a method of valuing securities by reference to the value of other securities with similar characteristics, such as rating, interest rate and maturity. Absent special circumstances, valuations for a specific type of instrument will all be made through the same pricing agent. |
Exchange–traded options; futures and options on futures are valued at the settlement price determined by the exchange.
The value of foreign currencies and of foreign securities whose value is quoted or calculated in a foreign currency shall be converted into US dollars based on foreign exchange rates provided by a major banking institution(s) or currency dealer(s) selected by the pricing agent providing such price, or by the Fair Value Committee in the case of securities for
| Centerstone Investors ♦ Semi-Annual Report ♦ September 30, 2022 | 41 |
| CENTERSTONE INVESTORS |
| NOTES TO FINANCIAL STATEMENTS (Unaudited) (Continued) |
| September 30, 2022 |
which the Fair Value Committee provides a fair value determination, at 4:00 pm ET or the nearest time prior to the Valuation Time, at which such foreign currency quotations are available.
Money market-type instruments that have a remaining maturity of 60 days or less are valued at bid prices from a pricing vendor, unless the Advisor believes another valuation is more appropriate.
Forward currency contracts shall be valued at the forward currency contract rates, determined at 4:00 pm ET or the nearest time prior to the Valuation Time, provided by a bank or dealer that the pricing agent or, if applicable, the Advisor believes to be reliable.
The Fund may hold securities, such as private investments, interests in commodity pools, other non-traded securities or temporarily illiquid securities, for which market quotations are not readily available or are determined to be unreliable. These securities will be valued using the “fair value” procedures approved by the Board. The Board has delegated execution of these procedures to the Adviser as its valuation designee (the “Valuation Designee”). The Board may also enlist third party consultants such a valuation specialist at a public accounting firm, valuation consultant or financial officer of a security issuer on an as-needed basis to assist the Valuation Designee in determining a security-specific fair value. The Board is responsible for reviewing and approving fair value methodologies utilized by the Valuation Designee, which approval shall be based upon whether the Valuation Designee followed the valuation procedures established by the Board.
Fair Valuation Process – The applicable investments are valued by the Valuation Designee pursuant to valuation procedures established by the Board. For example, fair value determinations are required for the following securities: (i) securities for which market quotations are insufficient or not readily available on a particular business day (including securities for which there is a short and temporary lapse in the provision of a price by the regular pricing source); (ii) securities for which, in the judgment of the Valuation Designee, the prices or values available do
| 42 | Centerstone Investors ♦ Semi-Annual Report ♦ September 30, 2022 |
| CENTERSTONE INVESTORS |
| NOTES TO FINANCIAL STATEMENTS (Unaudited) (Continued) |
| September 30, 2022 |
not represent the fair value of the instrument; factors which may cause the Valuation Designee to make such a judgment include, but are not limited to, the following: only a bid price or an asked price is available; the spread between bid and asked prices is substantial; the frequency of sales; the thinness of the market; the size of reported trades; and actions of the securities markets, such as the suspension or limitation of trading; (iii) securities determined to be illiquid; and (iv) securities with respect to which an event that will affect the value thereof has occurred (a “significant event”) since the closing prices were established on the principal exchange on which they are traded, but prior to a Fund’s calculation of its net asset value. Specifically, interests in commodity pools or managed futures pools are valued on a daily basis by reference to the closing market prices of each futures contract or other asset held by a pool, as adjusted for pool expenses. Restricted or illiquid securities, such as private investments or non-traded securities are valued based upon the current bid for the security from two or more independent dealers or other parties reasonably familiar with the facts and circumstances of the security (who should take into consideration all relevant factors as may be appropriate under the circumstances). If a current bid from such independent dealers or other independent parties is unavailable, the Valuation Designee shall determine, the fair value of such security using the following factors: (i) the type of security; (ii) the cost at date of purchase; (iii) the size and nature of the Fund’s holdings; (iv) the discount from market value of unrestricted securities of the same class at the time of purchase and subsequent thereto; (v) information as to any transactions or offers with respect to the security; (vi) the nature and duration of restrictions on disposition of the security and the existence of any registration rights; (vii) how the yield of the security compares to similar securities of companies of similar or equal creditworthiness; (viii) the level of recent trades of similar or comparable securities; (ix) the liquidity characteristics of the security; (x) current market conditions; and (xi) the market value of any securities into which the security is convertible or exchangeable.
| Centerstone Investors ♦ Semi-Annual Report ♦ September 30, 2022 | 43 |
| CENTERSTONE INVESTORS |
| NOTES TO FINANCIAL STATEMENTS (Unaudited) (Continued) |
| September 30, 2022 |
The Funds utilize various methods to measure the fair value of most of their investments on a recurring basis. GAAP establishes a hierarchy that prioritizes inputs to valuation methods. The three levels of input are:
Level 1 – Unadjusted quoted prices in active markets for identical assets and liabilities.
Level 2 – Observable inputs other than quoted prices included in Level 1 that are observable for the asset or liability, either directly or indirectly. These inputs may include quoted prices for the identical instrument on an inactive market, prices for similar instruments, interest rates, prepayment speeds, credit risk, yield curves, default rates and similar data.
Level 3 – Unobservable inputs for the asset or liability, to the extent relevant observable inputs are not available, representing the Funds’ own assumptions about the assumptions a market participant would use in valuing the asset or liability, and would be based on the best information available.
The availability of observable inputs can vary from security to security and is affected by a wide variety of factors, including, for example, the type of security, whether the security is new and not yet established in the marketplace, the liquidity of markets and other characteristics particular to the security. To the extent that valuation is based on models or inputs that are less observable or unobservable in the market, the determination of fair value requires more judgment. Accordingly, the degree of judgment exercised in determining fair value is greatest for instruments categorized in Level 3.
The inputs used to measure fair value may fall into different levels of the fair value hierarchy. In such cases, for disclosure purposes, the level in the fair value hierarchy within which the fair value measurement falls in its entirety, is determined based on the lowest level input that is significant to the fair value measurement in its entirety. The inputs or methodology used for valuing securities are not necessarily an indication of the risk associated with investing in those securities.
| 44 | Centerstone Investors ♦ Semi-Annual Report ♦ September 30, 2022 |
| CENTERSTONE INVESTORS |
| NOTES TO FINANCIAL STATEMENTS (Unaudited) (Continued) |
| September 30, 2022 |
The inputs or methodology used for valuing securities are not necessarily an indication of the risk associated with investing in those securities. The following tables summarize the inputs used for the six months ended as of September 30, 2022, for the Funds’ assets and liabilities measured at fair value:
| Centerstone Investors Fund | ||||||||||||||||
| Assets* | Level 1 | Level 2 | Level 3 | Total | ||||||||||||
| Common Stocks# | $ | 59,810,454 | $ | 70,362,661 | $ | — | $ | 130,173,115 | ||||||||
| Exchange-Traded Funds | 13,363,023 | — | — | 13,363,023 | ||||||||||||
| Preferred Stocks | 5,449,301 | — | — | 5,449,301 | ||||||||||||
| Corporate Bonds | — | 5,111,841 | — | 5,111,841 | ||||||||||||
| Collateral for Securities Loaned | 4,033,069 | — | — | 4,033,069 | ||||||||||||
| Money Market Funds | 17,869,519 | — | — | 17,869,519 | ||||||||||||
| Forward Foreign Currency Contracts** | 410,706 | — | — | 410,706 | ||||||||||||
| Total Assets | $ | 100,936,072 | $ | 75,474,502 | $ | — | $ | 176,410,574 | ||||||||
| Investments valued as practical expedient: | 4,300,538 | |||||||||||||||
| Total Investments: | $ | 180,711,112 | ||||||||||||||
| Centerstone International Fund | ||||||||||||||||
| Assets* | Level 1 | Level 2 | Level 3 | Total | ||||||||||||
| Common Stocks# | $ | 4,541,289 | $ | 16,510,110 | $ | — | $ | 21,051,399 | ||||||||
| Exchange-Traded Funds | 1,856,504 | — | — | 1,856,504 | ||||||||||||
| Collateral for Securities Loaned | 1,096,828 | — | — | 1,096,828 | ||||||||||||
| Money Market Fund | 569,718 | — | — | 569,718 | ||||||||||||
| Forward Foreign Currency Contracts** | 88,584 | — | — | 88,584 | ||||||||||||
| Total Assets | $ | 8,152,923 | $ | 16,510,110 | $ | — | $ | 24,663,033 | ||||||||
| Investments valued as practical expedient: | 1,075,134 | |||||||||||||||
| Total Investments: | $ | 25,738,167 | ||||||||||||||
| * | Refer to the Schedule of Investments for country classification. |
| # | As of September 30, 2022, foreign common stocks were mostly classified as level 2 securities due to fair value factor pricing by the Fund’s pricing agent. |
| ** | Forward Foreign Currency Contracts are valued at gross unrealized appreciation (depreciation) on the investment. |
The Funds did not hold any Level 3 securities as of September 30, 2022
| Centerstone Investors ♦ Semi-Annual Report ♦ September 30, 2022 | 45 |
| CENTERSTONE INVESTORS |
| NOTES TO FINANCIAL STATEMENTS (Unaudited) (Continued) |
| September 30, 2022 |
In determining fair values as of September 30, 2022, the Advisor has, as a practical expedient, estimated fair value of each Private Investment Fund using the NAV (or its equivalent) provided by the Portfolio Fund Management of each Private Investment Fund as of that date. Each investment for which fair value is measured using the Private Investment Fund’s NAV as a practical expedient is not required to be categorized within the fair value hierarchy. Accordingly, Private Investment Funds with a fair value of $4,300,538 and $1,075,134 for the Centerstone Investors Fund and Centerstone International Fund, respectively, have not been categorized.
| b. | Exchange Traded Funds – The Funds may invest in exchange traded funds (“ETFs”). ETFs are a type of fund bought and sold on a securities exchange. An ETF trades like common stock and represents a fixed portfolio of securities. The risks of owning an ETF generally reflect the risks of owning the underlying securities they are designed to track, although the lack of liquidity in an ETF could result in it being more volatile. Additionally, ETFs have fees and expenses that reduce their value. |
| c. | Security Transactions and Related Income – Security transactions are accounted for on a trade date basis. Interest income is recognized on an accrual basis. Discounts are accreted and premiums are amortized on securities purchased over the lives of the respective securities using the effective interest method. Dividend income is recorded on the ex-dividend date. Realized gains or losses from sales of securities are determined by comparing the identified cost of the security lot sold with the net sales proceeds. |
| d. | Foreign Currency Translations – The books and records of the Funds are maintained in US dollars. The market values of securities which are not traded in US currency are recorded in the financial statements after translation to US dollars based on the applicable exchange rates at the end of the period. The costs of such securities are translated at exchange rates prevailing when acquired. Related interest, dividends and withholding taxes are accrued at the rates of exchange prevailing on the respective dates of such transactions. |
| 46 | Centerstone Investors ♦ Semi-Annual Report ♦ September 30, 2022 |
| CENTERSTONE INVESTORS |
| NOTES TO FINANCIAL STATEMENTS (Unaudited) (Continued) |
| September 30, 2022 |
Net realized gains and losses on foreign currency transactions represent net gains and losses from currency realized between the trade and settlement dates on securities transactions and the difference between income accrued versus income received. The effect of changes in foreign currency exchange rates on investments in securities are included with the net realized and unrealized gain or loss on investment securities.
| e. | Forward Foreign Currency Contracts – As foreign securities are purchased and sold, the Funds may enter into forward currency exchange contracts in order to hedge against foreign currency exchange rate risks. The market value of the contracts fluctuate with changes in currency exchange rates. The contract is marked-to-market daily and the change in market value is recorded by the Funds as an unrealized gain or loss. As foreign securities are sold, a portion of the contract is generally closed and the Funds record a realized gain or loss equal to the difference between the value of the contract at the time it was opened and the value at the time it was closed. |
A Fund may also enter into forward currency contracts as an investment strategy consistent with the Fund’s investment objective.
A Fund investing in foreign exchange contracts is exposed to risk if the value of the currency changes unfavorably, if the counterparties to the contracts are unable to meet the terms of their contracts or if the Fund is unable to enter into a closing position.
Forward foreign currency contracts outstanding, as of September 30, 2022, are listed after each Fund’s Schedule of Investments. For the six months ended September 30, 2022, the average monthly outstanding currency purchased or sold in US dollars for forward foreign currency contracts totaled $7,147,044 and $1,196,432 for the Centerstone Investors Fund and Centerstone International Fund, respectively.
| f. | Options Transactions – The Funds may engage in option transactions involving individual securities and stock indexes. An option involves either: (a) the right or the obligation to buy or sell a specific instrument at a specific price until the expiration date of the option; or (b) the right |
| Centerstone Investors ♦ Semi-Annual Report ♦ September 30, 2022 | 47 |
| CENTERSTONE INVESTORS |
| NOTES TO FINANCIAL STATEMENTS (Unaudited) (Continued) |
| September 30, 2022 |
to receive payments or the obligation to make payments representing the difference between the closing price of a stock index and the exercise price of the option expressed in dollars times a specified multiple until the expiration date of the option. Options are sold (written) on securities and stock indexes. The purchaser of an option on a security pays the seller (the writer) a premium for the right granted but is not obligated to buy or sell the underlying security. The purchaser of an option on a stock index pays the seller a premium for the right granted, and in return the seller of such an option is obligated to make the payment. A writer of an option may terminate the obligation prior to expiration of the option by making an offsetting purchase of an identical option. Options are traded on organized exchanges and in the over-the counter market. To cover the potential obligations involved in writing options, a Fund will own the underlying security, or in the case of an option on a market index, will hold a portfolio of stocks substantially replicating the movement of the index.
The purchase and writing of options requires additional skills and techniques beyond normal portfolio management, and involves certain risks. The purchase of options limits a Fund’s potential loss to the amount of the premium paid and can afford the Fund the opportunity to profit from favorable movements in the price of an underlying security to a greater extent than if transactions were effected in the security directly. However, the purchase of an option could result in a Fund losing a greater percentage of its investment than if the transaction were effected directly. When a Fund writes a call option, it will receive a premium, but it will give up the opportunity to profit from a price increase in the underlying security above the exercise price as long as its obligation as a writer continues, and it will retain the risk of loss should the price of the security decline. When a Fund writes a put option, it will assume the risk that the price of the underlying security or instrument will fall below the exercise price, in which case the Fund may be required to purchase the security or instrument at a higher price than the market price of the security or instrument. In addition, there can be no assurance that a
| 48 | Centerstone Investors ♦ Semi-Annual Report ♦ September 30, 2022 |
| CENTERSTONE INVESTORS |
| NOTES TO FINANCIAL STATEMENTS (Unaudited) (Continued) |
| September 30, 2022 |
Fund can effect a closing transaction on a particular option it has written. Further, the total premium paid for any option may be lost if the Fund does not exercise the option or, in the case of over-the-counter options, the writer does not perform its obligations.
| g. | Short Sales – The Funds may sell a security short in anticipation of a decline in the market value of the security. When a Fund engages in a short sale, it sells a security which it does not own. To complete the transaction, a Fund must borrow the security in order to deliver it to the buyer. The Fund must replace the borrowed security by purchasing it at the market price at the time of replacement, which may be more or less than the price at which the Fund sold the security. The Fund will incur a loss as a result of the short sale if the price of the security increases between the date of the short sale and the date on which the Fund replaces the borrowed security. The Fund will realize a profit if the security declines in price between those dates. Any potential gain is limited to the price at which the Fund sold the security short, and any potential loss is unlimited in size. |
In connection with its short sales, a Fund will be required to maintain a segregated account with the Fund’s custodian of cash or liquid assets equal to (i) the current market value of the securities sold short, less (ii) any collateral deposited with its broker (not including the proceeds from the short sales). Depending on arrangements made with the broker or custodian, a Fund may not receive any payments (including interest) on collateral deposited with the broker or custodian.
The Funds may also sell a security short “against the box.” Short sales “against the box” are short sales of securities that a Fund owns or has the right to obtain (equivalent in kind or amount to the securities sold short). If a Fund enters into a short sale against the box, it will be required to set aside securities equivalent in kind and amount to the securities sold short (or securities convertible or exchangeable into such securities) and will be required to hold such securities while the short sale is outstanding. The Funds will incur transaction costs, including interest expenses, in connection with opening, maintaining, and closing short sales against the box.
| Centerstone Investors ♦ Semi-Annual Report ♦ September 30, 2022 | 49 |
| CENTERSTONE INVESTORS |
| NOTES TO FINANCIAL STATEMENTS (Unaudited) (Continued) |
| September 30, 2022 |
| h. | Impact of Derivatives on the Statements of Assets and Liabilities and Statements of Operations – The following is a summary of the location of derivative investments of each Fund in the Statement of Assets and Liabilities as of September 30, 2022: |
| Location on the Statements of Assets and Liabilities | |
| Derivative Investment Type | Asset Derivatives |
| Currency contracts | Unrealized appreciation on open forward foreign currency contracts |
The following table sets forth the fair value of each Fund’s derivative contracts by primary risk exposure as of September 30, 2022:
| Asset Derivatives Investment value | ||||
| Currency Contracts | ||||
| Centerstone Investors Fund | ||||
| Forward Foreign Currency Contracts | $ | 410,706 | ||
| Centerstone International Fund | ||||
| Forward Foreign Currency Contracts | $ | 88,584 | ||
The following is a summary of each Fund’s realized gain (loss) and change in unrealized appreciation (depreciation) on derivative investments recognized in the Statements of Operations categorized by primary risk exposure for the six months ended September 30, 2022:
| Derivative Investment Type | Location of Gain (Loss) on Derivatives |
| Currency contracts | Net realized gain (loss) from: |
| Forward foreign currency contracts | |
| Net change in unrealized appreciation (depreciation) from: | |
| Forward foreign currency contracts |
| Realized gain (loss) on derivatives recognized in the Statements of Operations | ||||||||
| Derivative Investment type | Centerstone Investors Fund | Centerstone International Fund | ||||||
| Forward Foreign Currency Contracts | $ | (541,585 | ) | $ | (55,435 | ) | ||
| Changes in unrealized appreciation/(depreciation) | ||||
| on derivatives recognized in the Statements of Operations | ||||
| Derivative Investment type | Currency Contracts | |||
| Currency Contracts Centerstone Investors Fund Forward Foreign Currency Contracts | $ | 410,706 | ||
| Centerstone International Fund Forward Foreign Currency Contracts | $ | 88,584 | ||
| 50 | Centerstone Investors ♦ Semi-Annual Report ♦ September 30, 2022 |
| CENTERSTONE INVESTORS |
| NOTES TO FINANCIAL STATEMENTS (Unaudited) (Continued) |
| September 30, 2022 |
| i. | Offsetting of Financial Assets and Derivative Assets – The Funds’ policies are to recognize a net asset or liability equal to the unrealized amount on forward foreign currency contracts. The following table shows additional information regarding the offsetting of assets and liabilities at September 30, 2022: |
| Gross | Net Amounts | Gross Amounts Not | ||||||||||||||||||||||
| Amounts | of Assets | Offset in the Statement | ||||||||||||||||||||||
| Gross | Offset in the | Presented in | of Assets & Liabilities | |||||||||||||||||||||
| Amounts of | Statement | the Statement | Cash | |||||||||||||||||||||
| Recognized | of Assets & | of Assets & | Financial | Collateral | Net | |||||||||||||||||||
| Assets: | Assets | Liabilities | Liabilities | Instruments | Received | Amount | ||||||||||||||||||
| Centerstone Investor Fund | ||||||||||||||||||||||||
| Description: | ||||||||||||||||||||||||
| Forward Foreign Currency Contracts | $ | 410,706 | $ | — | $ | 410,706 | $ | — | $ | — | $ | 410,706 | ||||||||||||
| Total | $ | 410,706 | $ | — | $ | 410,706 | $ | — | $ | — | $ | 410,706 | ||||||||||||
| Centerstone Investor Fund | ||||||||||||||||||||||||
| Description: | ||||||||||||||||||||||||
| Forward Foreign Currency Contracts | $ | 88,584 | $ | — | $ | 88,584 | $ | — | $ | — | $ | 88,584 | ||||||||||||
| Total | $ | 88,584 | $ | — | $ | 88,584 | $ | — | $ | — | $ | 88,584 | ||||||||||||
| j. | Lending Portfolio Securities – For the purpose of achieving income, each Fund may lend its portfolio securities, provided (1) the loan is secured continuously by collateral consisting generally of cash, US Government securities, letters of credit or other collateral as deemed appropriate by the Board, in an amount at least equal to the current market value of the loaned securities, (2) the Fund may at any time call the loan and obtain the return of securities loaned, (3) the Fund will receive any interest or dividends received on the loaned securities, and (4) the aggregate value of the securities loaned will not at any time exceed one-third of the total assets of the Fund. |
| Centerstone Investors ♦ Semi-Annual Report ♦ September 30, 2022 | 51 |
| CENTERSTONE INVESTORS |
| NOTES TO FINANCIAL STATEMENTS (Unaudited) (Continued) |
| September 30, 2022 |
As with other extensions of credit, there are risks that collateral could be inadequate in the event of the borrower failing financially, which could result in actual financial loss, and risks that recovery of loaned securities could be delayed, which could result in interference with portfolio management decisions or exercise of ownership rights. Each Fund will be responsible for the risks associated with the investment of cash collateral, including the risk that the Fund may lose money on the investment or may fail to earn sufficient income to meet its obligations to the borrower. In addition, each Fund may lose its right to vote its shares of the loaned securities at a shareholders meeting if the Advisor does not recall or does not timely recall the loaned securities, or if the borrower fails to return the recalled securities in advance of the record date for the meeting.
Securities lending involves counterparty risk, including the risk that the loaned securities may not be returned or returned in a timely manner and/or a loss of rights in the collateral if the borrower or the lending agent defaults or fails financially. This risk is increased when a Fund’s loans are concentrated with a single or limited number of borrowers. While there are no limits on the number of borrowers to which each Fund may lend securities, in practice, a Fund may end up lending securities to only one or a small group of borrowers.
Cash collateral may be invested by a Fund in short-term investments including money-market funds. Investment of cash collateral offers the opportunity for a Fund to profit from income earned by this collateral pool, but also the risk of loss, should the value of the Fund’s shares in the collateral pool decrease below their initial value.
The agreement provides that after predetermined rebates to borrowers, the Funds each retain a portion of their respective net securities lending income and pay State Street the remaining portion.
| 52 | Centerstone Investors ♦ Semi-Annual Report ♦ September 30, 2022 |
| CENTERSTONE INVESTORS |
| NOTES TO FINANCIAL STATEMENTS (Unaudited) (Continued) |
| September 30, 2022 |
The following table is a summary of the Funds’ securities loaned and related collateral which are subject to a netting agreement as of September 30, 2022:
| Gross | Gross | Gross Amounts Not | ||||||||||||||||||||||
| Amounts | Amounts | Offset in the Statement | ||||||||||||||||||||||
| Gross | Offset in the | Offset in the | of Assets & Liabilities | |||||||||||||||||||||
| Amounts of | Statement | Statement | Financial | Cash | ||||||||||||||||||||
| Recognized | of Assets & | of Assets & | Instruments | Collateral | Net | |||||||||||||||||||
| Assets: | Assets | Liabilities | Liabilities | Pledged* | Received | Amount | ||||||||||||||||||
| Centerstone Investor Fund | ||||||||||||||||||||||||
| Description: | ||||||||||||||||||||||||
| Securities Loaned | $ | 7,573,420 | $ | — | $ | 7,573,420 | $ | 3,540,351 | $ | 4,033,069 | * | $ | — | |||||||||||
| Total | $ | 7,573,420 | $ | — | $ | 7,573,420 | $ | 3,540,351 | $ | 4,033,069 | $ | — | ||||||||||||
| Centerstone International Fund | ||||||||||||||||||||||||
| Description: | ||||||||||||||||||||||||
| Securities Loaned | $ | 1,869,014 | $ | — | $ | 1,869,014 | $ | 772,186 | $ | 1,096,828 | * | $ | — | |||||||||||
| Total | $ | 1,869,014 | $ | — | $ | 1,869,014 | $ | 772,186 | $ | 1,096,828 | $ | — | ||||||||||||
| * | The amount is limited to the asset balance and accordingly does not include excess collateral pledged. Non-cash collateral is not reflected in the Funds’ records as the Funds do not have control of this collateral. |
The fair value of the securities loaned for the Centerstone Investors Fund and Centerstone International Fund totaled $7,573,420 and $1,869,014 at September 30, 2022, respectively. The securities loaned are noted in the Schedules of Investments. The fair value of the “Collateral for Securities Loaned” on the Schedule of Investments includes cash collateral received and reinvested that totaled $4,033,069 for the Centerstone Investors Fund and $1,096,828 for the Centerstone International Fund at September 30, 2022, respectively. This amount is offset by a liability recorded as “Collateral on securities loaned.” The contractual maturity of securities lending transactions is on an overnight and continuous basis. At September 30, 2022, Centerstone Investors Fund and Centerstone International Fund received non-cash collateral of $4,060,052 and $918,302, respectively. The non-cash collateral consists of U.S. treasury notes and U.S. treasury inflation indexed bonds, with coupon rates ranging from 0.01% to 6.125% and maturity dates from 11/10/22 to 2/15/2052 and is held for benefit of each Fund at the Fund’s custodian. The Funds cannot pledge or resell the collateral.
| Centerstone Investors ♦ Semi-Annual Report ♦ September 30, 2022 | 53 |
| CENTERSTONE INVESTORS |
| NOTES TO FINANCIAL STATEMENTS (Unaudited) (Continued) |
| September 30, 2022 |
| k. | Foreign Securities Risk – Investing in securities of foreign issuers and currency transactions may involve certain considerations and risks not typically associated with investments in the United States. These risks include revaluation of currencies, adverse fluctuations in foreign currency values and possible adverse political, social and economic developments, including those particular to a specific industry, country or region. These conditions could cause the securities and their markets to be less liquid and prices more volatile than those of comparable US companies and US government securities. |
The ability of issuers of debt securities held by the Funds to meet their obligations may be affected by economic and political developments particular to a specific industry, country, state or region. Investments in lower grade debt securities are subject to special risks, including greater price volatility and a greater risk of loss of principal and interest.
| l. | Federal Income Taxes – It is each Fund’s policy to continue to comply with all sections of the Internal Revenue Code applicable to regulated investment companies and to distribute all of its taxable income and gains, if any, to its shareholders and therefore, no provision for federal income tax has been made. Each Fund is treated as a separate taxpayer for federal income tax purposes. The Funds recognize the tax benefits of uncertain tax positions only when the position is “more likely than not” to be sustained assuming examination by tax authorities. Management has analyzed the Funds’ tax positions and has concluded that no liability for unrecognized tax benefits should be recorded related to uncertain tax positions taken on returns filed for open tax years of 2020 through 2022, or expected to be taken in the Funds’ March 31, 2023 year-end tax returns. The Funds identify their major tax jurisdiction as US federal, Ohio and foreign jurisdictions where a Fund makes significant investments. Neither Fund is aware of any tax positions for which it is reasonably possible that the total amounts of unrecognized tax benefits will change materially in the next twelve months. The Funds recognize interest and penalties, if any, related to unrecognized tax benefits as income tax expense in the Statements of Operations. During the year ended March 31, 2022, the Funds did not incur any interest or penalties. |
| 54 | Centerstone Investors ♦ Semi-Annual Report ♦ September 30, 2022 |
| CENTERSTONE INVESTORS |
| NOTES TO FINANCIAL STATEMENTS (Unaudited) (Continued) |
| September 30, 2022 |
| m. | Distributions to Shareholders – It is each Fund’s policy to distribute its respective net investment income and net capital gains, if any, annually. Distributions of net investment income and net capital gains are determined in accordance with income tax regulations which may differ from GAAP. Differences in dividends from net investment income per share between the classes are due to service and distribution related expenses. Dividends and distributions to shareholders are recorded on the ex-date. |
| n. | Class Accounting – Each class represents an interest in the same assets of the Fund and classes are identical except for differences in their sales charge structures, ongoing service fees and distribution charges. All classes of shares of a Fund have equal voting privileges with respect to such Fund except that each class has exclusive voting rights with respect to its service and/or distribution plans. A Fund’s income, expenses (other than class specific distribution and service fees) and realized and unrealized gains and losses are allocated proportionately each day based upon the relative net assets of each class of such Fund. |
| o. | Foreign Taxes – Withholding taxes on foreign dividends have been provided for in accordance with the Trust’s understanding of the applicable country’s tax rules and rates. Each Fund may be subject to foreign taxes (a portion of which may be reclaimable) on income. |
| p. | Indemnification – The Trust indemnifies its officers and the Board for certain liabilities that may arise from the performance of their duties to the Trust. Additionally, in the normal course of business, the Funds enter into contracts that contain a variety of representations and warranties and which provide general indemnities. The Funds’ maximum exposure under these arrangements is unknown, as this would involve future claims that may be made against the Funds that have not yet occurred. However, based on experience, the risk of loss due to these warranties and indemnities appears to be remote. |
| q. | Expenses – Expenses of the Trust that are directly identifiable to a specific fund are charged to that fund. Expenses, which are not readily identifiable to a specific fund, are allocated in such a manner as deemed equitable, taking into consideration the nature and type of expense and the relative sizes of the funds in the Trust. |
| Centerstone Investors ♦ Semi-Annual Report ♦ September 30, 2022 | 55 |
| CENTERSTONE INVESTORS |
| NOTES TO FINANCIAL STATEMENTS (Unaudited) (Continued) |
| September 30, 2022 |
| r. | Market Risk – The value of each Fund’s portfolio holdings may fluctuate in response to events specific to the companies or markets in which the Fund invests, as well as economic, political, or social events in the United States or abroad. Each Fund is subject to the risk that the securities markets will move down, sometimes rapidly and unpredictably, based on overall economic conditions and other factors, which may negatively affect the Fund’s performance. Securities markets may experience long periods of decline in value. |
Local, state, regional, national or global events such as war, acts of terrorism, the spread of infectious illness or other public health issues, recessions, or other events could have a significant impact on a Fund and its investments and could result in decreases to the Fund’s net asset value. Political, geopolitical, natural and other events, including war, terrorism, trade disputes, government shutdowns, market closures, natural and environmental disasters, climate change and climate-related events, epidemics, pandemics and other public health crises and related events and governments’ reactions to such events have led, and in the future may lead, to economic uncertainty, decreased economic activity, increased market volatility and other disruptive effects on U.S. and global economies and markets. Such events may have significant adverse direct or indirect effects on a Fund and its investments. For example, a widespread health crisis such as a global pandemic could cause substantial market volatility, exchange trading suspensions and closures, impact the ability to complete redemptions, and affect Fund performance. A health crisis may exacerbate other preexisting political, social and economic risks. In addition, the increasing interconnectedness of markets around the world may result in many markets being affected by events or conditions in a single country or region or events affecting a single or small number of issuers.
An outbreak of infectious respiratory illness caused by a novel coronavirus known as COVID-19 was first detected in December 2019 and spread globally. On March 11, 2020, the World Health Organization announced that it had made the assessment that COVID-19 could be characterized as a pandemic. COVID-19 resulted in travel restrictions, closed international borders, enhanced health screenings at ports of entry and elsewhere,
| 56 | Centerstone Investors ♦ Semi-Annual Report ♦ September 30, 2022 |
| CENTERSTONE INVESTORS |
| NOTES TO FINANCIAL STATEMENTS (Unaudited) (Continued) |
| September 30, 2022 |
disruption of and delays in healthcare service preparation and delivery, prolonged quarantines, cancellations, business and school closings, supply chain disruptions, and lower consumer demand, as well as general concern and uncertainty. The impact of COVID-19, and other infectious illness outbreaks that may arise in the future, could adversely affect the economies of many nations or the entire global economy, individual issuers and capital markets in ways that cannot necessarily be foreseen. In addition, the impact of infectious illnesses in emerging market countries may be greater due to generally less established healthcare systems. Public health crises caused by the COVID-19 outbreak may exacerbate other pre-existing political, social and economic risks in certain countries or globally. The duration of the COVID-19 outbreak and its effects cannot be determined with certainty. The value of a Fund and the securities in which the Fund invests may be adversely affected by impacts caused by COVID-19 and other epidemics and pandemics that may arise in the future.
| 3. | INVESTMENT ADVISORY AGREEMENT AND TRANSACTIONS WITH RELATED PARTIES |
| a. | Management Fees – The Advisor serves as each Fund’s investment advisor. Pursuant to an investment advisory agreement with the Trust, on behalf of the Funds, the Advisor, subject to the oversight of the Board and in conformity with the stated policies of the Funds, manages all business activities of the Funds. As compensation for its services, each Fund pays the Advisor an annualized rate of 0.90% of each Fund’s respective average daily net assets, accrued daily and paid monthly. For the six months ended September 30, 2022, the Advisor earned advisory fees of $1,067,513 and $148,441 for the Centerstone Investors Fund and Centerstone International Fund, respectively. |
Pursuant to an operating expense limitation agreement between the Advisor and the Trust, the Advisor has agreed to waive its fees and/or expenses for each Fund to ensure that Total Annual Fund Operating Expenses (excluding any front-end or contingent deferred loads, brokerage fees and commissions, acquired fund fees and expenses, borrowing costs (such as interest and dividend expense on securities sold short), taxes and extraordinary expenses such as litigation) for a Fund does not exceed
| Centerstone Investors ♦ Semi-Annual Report ♦ September 30, 2022 | 57 |
| CENTERSTONE INVESTORS |
| NOTES TO FINANCIAL STATEMENTS (Unaudited) (Continued) |
| September 30, 2022 |
1.35%, 2.10% and 1.10%, of such Fund’s average net assets, for Class A, Class C and Class I shares, respectively, through July 31, 2023. This operating expense limitation agreement can be terminated only by, or with the consent of, the Board. The Advisor is permitted to receive reimbursement from a Fund for fees it waived and Fund expenses it paid, subject to the limitation that: (1) the reimbursement for fees and expenses will be made only if payable within three years from the date the fees and expenses were initially waived or paid; and (2) the reimbursement may not be made if it would cause the expense limitation currently in effect or in effect at the time of the waiver or payment, whichever is lower, to be exceeded.
During the six months ended September 30, 2022, the Advisor waived fees totaling $74,973 and $121,580 for the Centerstone Investors Fund and Centerstone International Fund, respectively. As more fully described above, waivers and expense payments may be recouped by the Advisor from the Funds, to the extent that overall expenses fall below the expense limitation, within three years of when the amounts were waived or paid.
The following amounts are subject to recapture by the Funds until the following dates:
| 3/31/2023 | 3/31/2024 | 3/31/2025 | ||||||||||
| Centerstone Investor Fund | $ | 296,599 | $ | 275,573 | $ | 27,474 | ||||||
| Centerstone International Fund | 370,304 | 353,349 | 209,844 | |||||||||
Each Fund was reorganized on March 5, 2021 from a series of Centerstone Investors Trust to a series of Northern Lights Fund Trust III (the “Reorganization”). Prior to the reorganization, the Funds had advisory and expense limitation agreements with Centerstone Investors Trust. The fees charged to the Funds did not change as a result of the Reorganization and the amounts waived by the predecessor funds are still subject to recapture by the Advisor.
| b. | Distributor – The Distributor of the Funds is Northern Lights Distributors, LLC (the “Distributor”). The Trust has adopted, with respect to the Funds, the Trust’s Master Distribution and Shareholder Servicing Plan for the Funds’ Class A and Class C shares (the “Plan”) pursuant to Rule 12b-1 under the 1940 Act, to pay for certain distribution activities and shareholder services. The Plan provides a monthly service and/or distribution fee that |
| 58 | Centerstone Investors ♦ Semi-Annual Report ♦ September 30, 2022 |
| CENTERSTONE INVESTORS |
| NOTES TO FINANCIAL STATEMENTS (Unaudited) (Continued) |
| September 30, 2022 |
is calculated at an annual rate of 0.25% and 1.00% per year of the average daily net assets of each Fund’s Class A and Class C shares and paid to the Distributor to be used to pay for distribution and shareholder servicing activities. For the six months ended September 30, 2022, the Funds incurred distribution Fees of $81,507 and $15,765 for the Centerstone Investors Fund and Centerstone International Fund, respectively.
The Distributor acts as the Funds’ principal underwriter in a continuous public offering of the Funds’ shares. The table below shows the amount the Distributor received in underwriting commissions and the amount that was retained by the principal underwriter during the six months ended September 30, 2022 for the Centerstone Investors Fund. The distributor received $0 in underwriting commissions for the Centerstone International Fund during the six months ended September 30, 2022.
| Centerstone Investors Fund | ||||||||
| Class A | $ | 1,419 | $ | 121 | ||||
| Class C | 1,797 | 441 | ||||||
| c. | Administration, Fund Accounting and Transfer Agency Fees |
Ultimus Fund Solutions, LLC (“UFS”) – UFS, an affiliate of the Distributor, provides administration, fund accounting, and transfer agent services to the Trust. Pursuant to a separate servicing agreement with UFS, the Funds pays UFS customary fees for providing administration, fund accounting and transfer agency services to the Funds. Certain officers of the Trust are also officers of UFS and are not paid any fees directly by the Funds for serving in such capacities.
Northern Lights Compliance Services, LLC (“NLCS”) – NLCS, an affiliate of UFS and the Distributor, provides a Chief Compliance Officer to the Trust, as well as related compliance services, pursuant to a consulting agreement between NLCS and the Trust. Under the terms of such agreement, NLCS receives customary fees from the Funds.
BluGiant, LLC (“BluGiant”) – BluGiant, an affiliate of UFS and the Distributor, provides EDGAR conversion and filing services as well as print management services for the Funds on an ad-hoc basis. For the provision of these services, BluGiant receives customary fees from the Funds.
| Centerstone Investors ♦ Semi-Annual Report ♦ September 30, 2022 | 59 |
| CENTERSTONE INVESTORS |
| NOTES TO FINANCIAL STATEMENTS (Unaudited) (Continued) |
| September 30, 2022 |
| 4. | INVESTMENT TRANSACTIONS |
The cost of purchases and the proceeds from sales of investments, other than short-term investments, for the six months ended September 30, 2022 were as follows:
| Purchases | Sale Proceeds | |||||||||||||||
| (excluding U.S. | (excluding U.S. | Purchases of | Proceeds of U.S. | |||||||||||||
| Government | Government | U.S. Government | Government | |||||||||||||
| Fund | Securities) | Securities) | Securities | Securities | ||||||||||||
| Centerstone Investors Fund | $ | 24,887,899 | $ | 63,840,521 | $ | — | $ | 24,223,438 | ||||||||
| Centerstone International Fund | 1,954,408 | 8,853,302 | — | — | ||||||||||||
| 5. | SHARES OF BENEFICIAL INTEREST |
At September 30, 2022, each Fund had an unlimited number of shares authorized with no par value.
Following is a summary of shareholder transactions for each Fund for the six months ended September 30, 2022:
| Net Increase/ | ||||||||||||||||
| Distributions | (Decrease) in | |||||||||||||||
| Fund | Issued | Reinvested | Redeemed | Shares | ||||||||||||
| Class I Shares | ||||||||||||||||
| Centerstone Investors Fund | 542,175 | — | (5,883,382 | ) | (5,341,207 | ) | ||||||||||
| Centerstone International Fund | 34,602 | — | (729,847 | ) | (695,245 | ) | ||||||||||
| Class A Shares | ||||||||||||||||
| Centerstone Investors Fund | 86,983 | — | (221,894 | ) | (134,911 | ) | ||||||||||
| Centerstone International Fund | 28,442 | — | (30,913 | ) | (2,471 | ) | ||||||||||
| Class C Shares | ||||||||||||||||
| Centerstone Investors Fund | 10,981 | — | (77,650 | ) | (66,669 | ) | ||||||||||
| Centerstone International Fund | — | — | (10,040 | ) | (10,040 | ) | ||||||||||
| 60 | Centerstone Investors ♦ Semi-Annual Report ♦ September 30, 2022 |
| CENTERSTONE INVESTORS |
| NOTES TO FINANCIAL STATEMENTS (Unaudited) (Continued) |
| September 30, 2022 |
| 6. | AGGREGATE UNREALIZED APPRECIATION AND DEPRECIATION – TAX BASIS |
The Statement of Assets and Liabilities represents cost for financial reporting purposes. Aggregate cost for federal tax purposes is $210,858,013 and $33,778,225 for the Centerstone Investors Fund and Centerstone International Fund, respectively, and differs from market value by net unrealized appreciation (depreciation) which consisted of:
| Gross | Gross | Net Unrealized | ||||||||||
| Unrealized | Unrealized | Appreciation/ | ||||||||||
| Appreciation | Depreciation | (Depreciation) | ||||||||||
| Centerstone Investors Fund | $ | 13,174,537 | $ | (43,732,144 | ) | $ | (30,557,607 | ) | ||||
| Centerstone International Fund | 1,590,166 | (9,718,808 | ) | (8,128,642 | ) | |||||||
| 7. | REDEMPTION FEES |
Each Fund may assess a short-term redemption fee of 2.00% of the total redemption amount if a shareholder sells its shares after holding them for less than 30 days. The redemption fee is paid directly to the Fund in which the short-term redemption occurs. For the six months ended September 30, 2022, the Centerstone Investors Fund and the Centerstone International Fund both assessed $0 in redemption fees.
| 8. | BENEFICIAL OWNERSHIP |
The beneficial ownership, either directly or indirectly, of more than 25% of the outstanding voting securities of a Fund creates the presumption of control of the Fund, under Section 2(a)(a) of the 1940 Act. As of September 30, 2022, Charles Schwab & Co. Inc. held in omnibus accounts for the benefit of others approximately 30% and 39% of the outstanding voting securities of the Centerstone Investors Fund and Centerstone International Fund, respectively and UBS held in omnibus accounts for the benefit of others approximately 31% of the outstanding voting securities of the Centerstone International Fund.
| Centerstone Investors ♦ Semi-Annual Report ♦ September 30, 2022 | 61 |
| CENTERSTONE INVESTORS |
| NOTES TO FINANCIAL STATEMENTS (Unaudited) (Continued) |
| September 30, 2022 |
| 9. | INVESTMENT IN RESTRICTED SECURITIES |
Restricted securities include securities that have not been registered under the Securities Act of 1933, as amended, and securities that are subject to restrictions on resale. Each Fund may invest in restricted securities that are consistent with the Fund’s investment objectives and investment strategies. The Funds will not invest in a restricted security if, immediately after and as a result of the investment in such security, more than 15% of a Fund’s net assets would be invested in illiquid securities. In some cases, the issuer of restricted securities has agreed to register such securities for resale, at the issuer’s expense either upon demand by the Funds or in connection with another registered offering of the securities. Investments in restricted securities are valued at fair value as determined in good faith in accordance with procedures adopted by the Board. It is possible that the estimated value may differ significantly from the amount that might ultimately be realized in the near term, and the difference could be material.
As of September 30, 2022, the Centerstone Investors Fund and the Centerstone International Fund were invested in the following restricted securities:
| Centerstone Investors Fund | ||||||||||||||||
| Initial | % of | |||||||||||||||
| Security | Acquisition Date | Shares | Cost | Value | Net Assets | |||||||||||
| Coast Capital Midas Fund LP | 2/1/2021 | 2,691,200 | $ | 4,800,000 | $ | 4,300,538 | 2.4% | |||||||||
| Centerstone International Fund | ||||||||||||||||
| Initial | % of | |||||||||||||||
| Security | Acquisition Date | Shares | Cost | Value | Net Assets | |||||||||||
| Coast Capital Midas Fund LP | 2/1/2021 | 672,800 | $ | 1,200,000 | $ | 1,075,134 | 4.3% | |||||||||
| 62 | Centerstone Investors ♦ Semi-Annual Report ♦ September 30, 2022 |
| CENTERSTONE INVESTORS |
| NOTES TO FINANCIAL STATEMENTS (Unaudited) (Continued) |
| September 30, 2022 |
| 10. | NEW REGULATORY UPDATES |
In October 2020, the Securities and Exchange Commission (the “SEC”) adopted new regulations governing the use of derivatives by registered investment companies (“Rule 18f-4”). Rule 18f-4 imposes limits on the amount of derivatives a fund can enter into, eliminates the asset segregation framework currently used by funds to comply with Section 18 of the 1940 Act, treats derivatives as senior securities and requires funds whose use of derivatives is more than a limited specified exposure amount to establish and maintain a comprehensive derivatives risk management program and appoint a derivatives risk manager.
| 11. | SUBSEQUENT EVENTS |
Subsequent events after the date of the Statements of Assets and Liabilities have been evaluated through the date the financial statements were issued. Management has determined that no events or transactions occurred requiring adjustment or disclosure in the financial statements.
| Centerstone Investors ♦ Semi-Annual Report ♦ September 30, 2022 | 63 |
| CENTERSTONE INVESTORS |
| FUNDS’ EXPENSES (Unaudited) |
Example
Shareholders of mutual funds will pay (1) transactional costs, such as sales load, and (2) ongoing expenses, such as advisory fees, distribution and service fees (12b-1), and other fund expenses. The following examples are intended to help you understand the ongoing cost (in dollars) of investing in a fund and to compare these costs with the ongoing costs of investing in other mutual funds. Please note, the expenses shown in the tables are meant to highlight ongoing costs only and do not reflect any transactional costs, such as sales charges (loads), or contingent deferred sales charges on redemptions which may be assessed by mutual funds. This Example is based on an investment of $1,000 invested at the beginning of the period and held for the entire period as indicated below.
Actual Expenses
The columns under the heading entitled “Actual” help you estimate the actual expenses you paid over the period. The “Actual-Ending Account Value” shown is derived from each Fund’s actual return, and the “Actual-Expenses Paid During Period” shows the dollar amount that would have been paid by an investor who started with $1,000 in the Fund. To estimate the expenses you paid on your account during this period, simply divide your account value by $1,000 (for example, an $8,600 account value divided by $1,000 = 8.6), then multiply the result by the number in the column under the heading entitled “Actual-Expenses Paid During Period.”
Hypothetical Examples for Comparison Purposes
The columns under the heading entitled “Hypothetical” provide information about hypothetical account value and hypothetical expenses based on each Fund’s actual expense ratio and an assumed rate of return of 5% per year before expenses, which is not the Fund’s actual return. The hypothetical account values and expenses may not be used to estimate the actual ending account balance or expenses you paid for the period. You may use this information to compare the ongoing costs of investing in the Fund and other funds. To do so, compare this 5% hypothetical example with the 5% hypothetical examples that appear in the shareholder reports of other funds.
| 64 | Centerstone Investors ♦ Semi-Annual Report ♦ September 30, 2022 |
| CENTERSTONE INVESTORS |
| FUNDS’ EXPENSES (Unaudited) (Continued) |
Please note that the expenses shown in the table are meant to highlight your ongoing costs only and do not reflect any transactional costs which may be applicable to your account. Therefore, the last column of the table (Hypothetical- Expenses Paid During Period) is useful in comparing ongoing costs only and will not help you determine the relative total costs of owning different funds. In addition, if these transactional costs were included, your costs would have been higher.
| Hypothetical | ||||||||||||
| Actual(1) | (5% return before expenses) | |||||||||||
| Expenses | Expenses | |||||||||||
| Fund’s | Beginning | Ending | Paid During | Ending | Paid During | |||||||
| Annualized | Account | Account | Period* | Account | Period* | |||||||
| Expense | Value* | Value | 4/1/22- | Value | 4/1/22- | |||||||
| Ratio | 4/1/22 | 9/30/22 | 9/30/22 | 9/30/22 | 9/30/22 | |||||||
| Class I: | ||||||||||||
| Investors Fund | 1.10% | $1,000.00 | $827.60 | $5.04 | $1,019.55 | $5.57 | ||||||
| International Fund | 1.10% | $1,000.00 | $795.70 | $4.95 | $1,019.55 | $5.57 | ||||||
| Class A: | ||||||||||||
| Investors Fund | 1.35% | $1,000.00 | $826.90 | $6.18 | $1,018.30 | $6.83 | ||||||
| International Fund | 1.35% | $1,000.00 | $794.50 | $6.07 | $1,018.30 | $6.83 | ||||||
| Class C: | ||||||||||||
| Investors Fund | 2.10% | $1,000.00 | $823.70 | $9.60 | $1,014.54 | $10.61 | ||||||
| International Fund | 2.10% | $1,000.00 | $791.40 | $9.43 | $1,014.54 | $10.61 | ||||||
| (1) | Past performance does not guarantee future results. Assumes reinvestment of all dividends and capital gain distributions, if any, at net asset value and does not reflect the deduction of the applicable sales charge, exchange fees or redemption fees. Had the effect of sales charges been reflected, expenses would have been higher and returns lower. Total return is not annualized, as it may not be representative of the total return for the year. |
| * | Expenses Paid During Period are equal to the Fund’s annualized expense ratio, multiplied by the average account value over the period, multiplied by 183 days and divided by 365 (to reflect the one-half year period). |
| Centerstone Investors ♦ Semi-Annual Report ♦ September 30, 2022 | 65 |
| CENTERSTONE INVESTORS |
| SUPPLEMENTAL INFORMATION (Unaudited) |
| September 30, 2022 |
Approval of Advisory Agreement – Centerstone Investors Fund and Centerstone International Fund*
In connection with a meeting held on November 23-24, 2020, the Board, including a majority of the Trustees who are not “interested persons,” as that term is defined in the 1940 Act, discussed the approval of the investment advisory agreement (the “Advisory Agreement”) between Centerstone Investors LLC (“CI” or the “Adviser”) and the Trust, with respect to Centerstone Investors Fund (“CS Investors”) and Centerstone International Fund (“CS International” and together with CS Investors, the “New Funds”). In considering the approval of the Advisory Agreement, the Board received materials specifically relating to the New Funds and the Advisory Agreement.
The Board relied upon the advice of independent legal counsel and its own business judgment in determining the material factors to be considered in evaluating the Advisory Agreement and the weight to be given to each such factor. The Board’s conclusions were based on an evaluation of all of the information provided and were not the result of any one factor. Moreover, each Trustee may have afforded different weight to the various factors in reaching conclusions with respect to the Advisory Agreement.
Nature, Extent and Quality of Service. The Board noted that CI was founded in 2016 and that its key investment personnel had many years of financial industry experience and broad investment backgrounds. The Board discussed that CI followed a value investing approach that focused on an investment’s long-term earnings power rather than current earnings. The Board observed that CI’s investment process used proprietary research and fundamental business analysis to identify companies demonstrating financial strength, business model durability and competent management with market prices that were at a discount from their intrinsic values. The Board acknowledged that CI had wide-ranging risk management and mitigation processes. The Board recognized that CI utilized various pre- and post-trade compliance checklists to ensure compliance with investment restrictions and portfolio guidelines. The Board noted that CI’s best execution committee reviewed
| * | Due to timing of the contract renewal schedule, these deliberations may or may not relate to the current performance results of the New Funds. |
| 66 | Centerstone Investors ♦ Semi-Annual Report ♦ September 30, 2022 |
| CENTERSTONE INVESTORS |
| SUPPLEMENTAL INFORMATION (Unaudited) (Continued) |
the quality of trade execution and rated broker-dealers on several different benchmarks. The Board commented that CI represented that it had no material regulatory, compliance or litigation issues since its inception in 2016. The Board determined that the CI could be expected to provide adequate service to the New Funds and their respective shareholders.
Performance.
CS Investors – The Board reviewed the performance information provided by CI regarding the predecessor fund to CS Investors. The Board noted that the predecessor fund had underperformed its peer group, Morningstar category and the MSCI ACWI Index across all periods. The Board recognized that value investing had been out of favor and that the benchmark consisted of a combination of growth and value stocks. The Board acknowledged that the predecessor fund held small and mid-cap stocks, both of which underperformed large-cap stocks, and that the predecessor fund was underweight to the technology sector. The Board considered that CI was intentional about staying the course with value investing and that value investing was best reviewed over a full market cycle. The Board concluded therefore that CI should be permitted to manage CS Investors’ portfolio over a full market cycle for investors seeking a value-oriented strategy.
CS International – The Board reviewed the performance information provided by CI regarding the predecessor to CS International. The Board noted that the predecessor fund had underperformed its peer group, Morningstar category and the MSCI ACWI Ex USA Index across all periods. The Board recognized that value investing had been out of favor and that the benchmark consisted of a combination of growth and value stocks. The Board acknowledged that the benchmark was fully invested and excluded fees, whereas the predecessor fund held cash reserves during a predominantly bullish equity environment. The Board considered that CI was intentional about staying the course with value investing and that value investing was best reviewed over a full market cycle. The Board concluded therefore that CI should be permitted to manage CS International’s portfolio over a full market cycle for investors seeking a value-oriented strategy.
| Centerstone Investors ♦ Semi-Annual Report ♦ September 30, 2022 | 67 |
| CENTERSTONE INVESTORS |
| SUPPLEMENTAL INFORMATION (Unaudited) (Continued) |
Fees and Expenses. The Board observed that CI’s proposed 0.90% annual advisory fee that would be charged to each New Fund was identical to the fee charged by CI to each Predecessor Fund and was higher than the advisory fee of each New Fund’s peer group and Morningstar category averages and medians, but lower than the highs of each. The Board commented that each New Fund’s 1.10% net expense ratio was higher than each New Fund’s peer group and Morningstar category averages and medians, but well below the highs of each. The Board noted that CI believed the proposed advisory fee for each New Fund to be reasonable given the specialized and actively managed nature of each New Fund’s strategy and CI’s risk-management focus. Given these and other considerations, the Board concluded that the proposed advisory fee for each New Fund was not unreasonable.
Economies of Scale. The Board discussed the anticipated size of each New Fund and its respective prospects for growth. The Board concluded that, based on the anticipated size of the New Funds, meaningful economies justifying breakpoints would be unlikely during the initial term of the investment advisory agreement, but noted that CI had agreed to discuss the implementation of breakpoints as each New Fund’s assets grew and CI achieved economies of scale related to its operations. The Board agreed to monitor and revisit the issue at the appropriate time.
Profitability. The Board reviewed CI’s projected profitability analysis in connection with each New Fund. They also consider the anticipated benefits of soft dollars used to support CI’s research efforts. The Board noted that CI expected to realize a reasonable profit over the initial two-year term of the investment advisory agreement with respect to each New Fund. The Board concluded that CI’s expected level of profitability was not excessive.
Conclusion. Having requested and received such information from CI as the Board believed to be reasonably necessary to evaluate the terms of the Advisory Agreement, and as assisted by the advice of independent counsel, the Board concluded that the proposed advisory fees were not unreasonable and that approval of the Advisory Agreement was in the best interests of the Trust and future shareholders of each New Fund.
| 68 | Centerstone Investors ♦ Semi-Annual Report ♦ September 30, 2022 |
| CENTERSTONE INVESTORS |
| SUPPLEMENTAL INFORMATION (Unaudited) (Continued) |
How to Obtain Proxy Voting Information
Information regarding how the Funds voted proxies relating to portfolio securities for the most recent 12-month period ended June 30 as well as a description of the policies and procedures that the Funds use to determine how to vote proxies is available without charge, upon request, by calling 877.314.9006 or by referring to the Securities and Exchange Commission’s (“SEC”) website at http://www.sec.gov.
How to Obtain 1st and 3rd Fiscal Quarter Portfolio Holdings
Each Fund files its complete schedule of portfolio holdings with the SEC for the first and third quarters of each fiscal year as an exhibit to its reports on Form N-PORT, within sixty days after the end of the period. Form N-PORT reports are available at the SEC’s website at www.sec.gov. The information on Form N-PORT is available without charge, upon request, by calling 877.314.9006.
| Centerstone Investors ♦ Semi-Annual Report ♦ September 30, 2022 | 69 |
| CENTERSTONE INVESTORS |
| SUPPLEMENTAL INFORMATION (Unaudited) (Continued) |
| September 30, 2022 |
The Trustees and officers of the Trust, together with information as to their principal business occupations during the past five years and other information, are shown below. Unless otherwise noted, the address of each Trustee and officer is 225 Pictoria Drive, Suite 450, Cincinnati, Ohio 45246.
Independent Trustees
| Name,
Address, Year of Birth |
Position(s)
Held with Registrant |
Length
of Service and Term |
Principal Occupation(s) During Past 5 Years |
| Patricia
Luscombe 1961 |
Trustee | Since January 2015, Indefinite | Managing Director of the Valuations and Opinions Group, Lincoln International LLC (since August 2007). |
| John
V. Palancia 1954 |
Trustee, Chairman | Trustee, since February 2012, Indefinite; Chairman of the Board since May 2014. | Retired (since 2011); formerly, Director of Global Futures Operations Control, Merrill Lynch, Pierce, Fenner & Smith, Inc. (1975-2011). |
| Mark
H. Taylor 1964 |
Trustee, Chairman of the Audit Committee | Since February 2012, Indefinite | Director, Lynn Pippenger School of Accountancy, Muma College of Business, University of South Florida (since August 2019); Chair, Department of Accountancy and Andrew D. Braden Professor of Accounting and Auditing, Weatherhead School of Management, Case Western Reserve University (2009-2019); President, American Accounting Association (since August 2022); Vice President-Finance, American Accounting Association (2017-2020); President, Auditing Section of the American Accounting Association (2012-2015); AICPA Auditing Standards Board Member (2009-2012); Academic Fellow, United States Securities and Exchange Commission (2005-2006). |
| Jeffery
D. Young 1956 |
Trustee | Since January 2015, Indefinite | Co-owner and Vice President, Latin America Agriculture Development Corp. (since May 2015); President, Celeritas Rail Consulting (since June 2014); Asst. Vice President - Transportation Systems, Union Pacific Railroad Company (June 1976 to April 2014). |
| * | As of September 30, 2022, the Trust was comprised of 32 active portfolios managed by 16 unaffiliated investment advisers. The term “Fund Complex” applies only to the Funds. The Funds do not hold themselves out as related to any other series within the Trust for investment purposes, nor do they share the same investment adviser with any other series. |
| ** | Only includes directorships held within the past 5 years in a company with a class of securities registered pursuant to Section 12 of the Securities Exchange Act of 1934 or subject to the requirements of Section 15(d) of the Securities Exchange Act of 1934, or any company registered as an investment company under the 1940 Act. |
| 70 | Centerstone Investors ♦ Semi-Annual Report ♦ September 30, 2022 |
| Number
of Funds Overseen In The Fund Complex* |
Other Directorships Held During Past 5 Years** |
| 2 | Northern Lights Fund Trust III (for series not affiliated with the Fund since 2015); Monetta Mutual Funds (since November 2015). |
| 2 | Northern Lights Fund Trust III (for series not affiliated with the Fund since 2012); Northern Lights Fund Trust (since 2011); Northern Lights Variable Trust (since 2011); Alternative Strategies Fund (since 2012). |
| 2 | Northern Lights Fund Trust III (for series not affiliated with the Fund since 2012); Northern Lights Fund Trust (since 2007); Northern Lights Variable Trust (since 2007); Alternative Strategies Fund (since June 2010). |
| 2 | Northern Lights Fund Trust III (for series not affiliated with the Fund since 2015). |
| Centerstone Investors ♦ Semi-Annual Report ♦ September 30, 2022 | 71 |
| CENTERSTONE INVESTORS |
| SUPPLEMENTAL INFORMATION (Unaudited) (Continued) |
| September 30, 2022 |
Officers of the Trust
| Name,
Address, Year of Birth |
Position(s)
Held with Registrant |
Length
of Service and Term |
Principal Occupation(s) During Past 5 Years |
| Eric
Kane 1981 |
President | Since August 2022, indefinite | Vice President and Senior Managing Counsel, Ultimus Fund Solutions, LLC (since 2022); Vice President and Managing Counsel, Ultimus Fund Solutions, LLC (2020-2022); Vice President and Counsel, Gemini Fund Services, LLC (2017-2020); Assistant Vice President, Gemini Fund Services, LLC (2014- 2017). |
| Brian
Curley 1970 |
Treasurer | Since February 2013, indefinite | Vice President, Ultimus Fund Solutions, LLC (since 2020); Vice President, Gemini Fund Services, LLC (2015-2020). |
| Viktoriya
Pallino 1995 |
Secretary | Since August 2022, indefinite | Legal Administrator II, Ultimus Fund Solutions, LLC (since 2021); Legal Administrator I, Ultimus Fund Solutions, LLC (2019-2021); Legal Administration Associate, Gemini Fund Services, LLC (2017-2019). |
| William
Kimme 1962 |
Chief Compliance Officer | Since February 2012, indefinite | Senior Compliance Officer of Northern Lights Compliance Services, LLC (since 2011). |
The Funds’ Statement of Additional Information includes additional information about the Trustees and is available free of charge, upon request, by calling toll-free at 877.314.9006.
| 72 | Centerstone Investors ♦ Semi-Annual Report ♦ September 30, 2022 |
| NORTHERN LIGHTS FUND TRUST III | |
| PRIVACY NOTICE | Rev. June 2021 |
| |
| FACTS | WHAT
DOES NORTHERN LIGHTS FUND TRUST III DO WITH YOUR PERSONAL INFORMATION? | |
| Why? | Financial companies choose how they share your personal information. Federal law gives consumers the right to limit some but not all sharing. Federal law also requires us to tell you how we collect, share, and protect your personal information. Please read this notice carefully to understand what we do. | |
| What? | The types of personal information we collect and share depend on the product or service you have with us. This information can include: | |
w Social Security number
w Assets
w Retirement Assets
w Transaction History
w Checking Account Information |
w Purchase History
w Account Balances
w Account Transactions
w Wire Transfer Instructions
| |
When you are no longer our customer, we continue to share your information as described in this notice. | ||
| How? | All financial companies need to share customers’ personal information to run their everyday business. In the section below, we list the reasons financial companies can share their customers’ personal information; the reasons Northern Lights Fund Trust III chooses to share; and whether you can limit this sharing. | |
| Reasons
we can share your personal information |
Does
Northern Lights Fund Trust III share? |
Can
you limit this sharing? |
For our everyday business purposes – such as to process your transactions, maintain your account(s), respond to court orders and legal investigations, or report to credit bureaus |
Yes | No |
For our marketing purposes – to offer our products and services to you |
No | We don’t share |
| For joint marketing with other financial companies | No | We don’t share |
For our affiliates’ everyday business purposes – information about your transactions and experiences |
No | We don’t share |
For our affiliates’ everyday business purposes – information about your creditworthiness |
No | We don’t share |
| For nonaffiliates to market to you | No | We don’t share |
| Questions? | Call (631) 490-4300 |
| Centerstone Investors ♦ Semi-Annual Report ♦ September 30, 2022 | 73 |
| NORTHERN LIGHTS FUND TRUST III |
| PRIVACY NOTICE |
|
WHAT WE DO | |
| How does Northern Lights Fund Trust III protect my personal information? | To protect your personal information from unauthorized access and use, we use security measures that comply with federal law. These measures include computer safeguards and secured files and buildings. Our service providers are held accountable for adhering to strict policies and procedures to prevent any misuse of your nonpublic personal information. |
| How does Northern Lights Fund Trust III collect my personal information? | We collect your personal information, for example, when you
w Open an account
w Provide account information
w Give us your contact information
w Make deposits or withdrawals from your account
w Make a wire transfer
w Tell us where to send the money
w Tells us who receives the money
w Show your government-issued ID
w Show your driver’s license
We also collect your personal information from other companies. |
| Why can’t I limit all sharing? | Federal law gives you the right to limit only
w Sharing for affiliates’ everyday business purposes – information about your creditworthiness
w Affiliates from using your information to market to you
w Sharing for nonaffiliates to market to you.
State laws and individual companies may give you additional rights to limit sharing. |
| DEFINITIONS | |
| Affiliates | Companies related by common ownership or control. They can be financial and nonfinancial companies.
w Northern Lights Fund Trust III does not share with our affiliates. |
| Nonaffiliates | Companies not related by common ownership or control. They can be financial and nonfinancial companies.
w Northern Lights Fund Trust III does not share with nonaffiliates so they can market to you. |
| Joint marketing | A formal agreement between nonaffiliated financial companies that together market financial products or services to you.
w Northern Lights Fund Trust III doesn’t jointly market. |
| 74 | Centerstone Investors ♦ Semi-Annual Report ♦ September 30, 2022 |
| CENTERSTONE INVESTORS |
| Investment Advisor |
| Centerstone Investors, LLC |
| 228 Park Avenue S |
| Suite 75938 |
| New York, NY 10003 |
| Independent Registered Public Accounting Firm |
| Public Accounting Firm |
| Cohen & Company, Ltd |
| 1350 Euclid Avenue |
| Suite 800 |
| Cleveland, OH 44115 |
| Legal Counsel |
| Thompson Hine LLP |
| 41 South High Street |
| Suite 1700 |
| Columbus, OH 43215 |
| Custodian |
| State Street Bank and Trust Company |
| One Lincoln Street |
| Boston, MA 02111 |
| Transfer Agent, Fund Accountant and Fund Administrator |
| Ultimus Fund Solutions, LLC |
| 225 Pictoria Drive |
| Suite 450 |
| Cincinnati, OH 45246 |
| Distributor |
| Northern Lights Distributors, LLC |
| 4221 North 203rd Street |
| Suite 100 |
| Elkhorn, NE 68022 |
| Centerstone Investors ♦ Semi-Annual Report ♦ September 30, 2022 | 75 |
| 76 | Centerstone Investors ♦ Semi-Annual Report ♦ September 30, 2022 |
| Centerstone Investors ♦ Semi-Annual Report ♦ September 30, 2022 | 77 |
(b) Not applicable
Item 2. Code of Ethics. Not applicable.
Item 3. Audit Committee Financial Expert. Not applicable.
Item 4. Principal Accountant Fees and Services. Not applicable.
Item 5. Audit Committee of Listed Companies. Not applicable to open-end investment companies.
Item 6. Schedule of Investments.
| (a) | Schedule of investments in securities of unaffiliated issuers is included under Item 1. |
| (b) | Not applicable. |
Item 7. Disclosure of Proxy Voting Policies and Procedures for Closed-End Funds. Not applicable to open-end investment companies.
Item 8. Portfolio Managers of Closed-End Management Investment Companies. Not applicable to open-end investment companies.
Item 9. Purchases of Equity Securities by Closed-End Funds. Not applicable to open-end investment companies.
Item 10. Submission of Matters to a Vote of Security Holders. None.
Item 11. Controls and Procedures.
(a) Based on an evaluation of the Registrant’s disclosure controls and procedures as of a date within 90 days of filing date of this Form N-CSR, the principal executive officer and principal financial officer of the Registrant have concluded that the disclosure controls and procedures of the Registrant are reasonably designed to ensure that the information required in filings on Form N-CSR is recorded, processed, summarized, and reported by the filing date, including that information required to be disclosed is accumulated and communicated to the Registrant’s management, including the Registrant’s principal executive officer and principal financial officer, as appropriate to allow timely decisions regarding required disclosure.
(b) There were no significant changes in the Registrant’s internal control over financial reporting that occurred during the period covered by this report that have materially affected, or are reasonably likely to materially affect, the Registrant’s internal control over financial reporting.
Item 12. Disclosure of Securities Lending Activities for Closed-End Management Investment Companies.
Not applicable to open-end investment companies.
Item 13. Exhibits.
(a)(1) Not applicable.
(a)(3) Not applicable.
SIGNATURES
Pursuant to the requirements of the Securities Exchange Act of 1934 and the Investment Company Act of 1940, the registrant has duly caused this report to be signed on its behalf by the undersigned, thereunto duly authorized.
(Registrant) Northern Lights Fund Trust III
By (Signature and Title)
/s/ Eric Kane
Eric Kane, Principal Executive Officer/President
Date 12/8/2022
Pursuant to the requirements of the Securities Exchange Act of 1934 and the Investment Company Act of 1940, this report has been signed below by the following persons on behalf of the registrant and in the capacities and on the dates indicated.
By (Signature and Title)
/s/ Eric Kane
Eric Kane, Principal Executive Officer/President
Date 12/8/2022
By (Signature and Title)
/s/ Brian Curley
Brian Curley, Principal Financial Officer/Treasurer
Date 12/8/2022
ATTACHMENTS / EXHIBITS
Serious News for Serious Traders! Try StreetInsider.com Premium Free!
You May Also Be Interested In
- Composition of the Nomination Committee of Orion Corporation
- RROCKET Burns 50% of Its Supply to Fuel Growth and Investor Confidence
- iZafe Group's Quarterly Report January-March 2024
Create E-mail Alert Related Categories
SEC FilingsSign up for StreetInsider Free!
Receive full access to all new and archived articles, unlimited portfolio tracking, e-mail alerts, custom newswires and RSS feeds - and more!
