

Form N-CSRS Horizon Funds For: May 31
 Tweet
Tweet Share
Share
UNITED STATES
SECURITIES AND EXCHANGE COMMISSION
Washington, D.C. 20549
FORM N-CSR
CERTIFIED SHAREHOLDER REPORT OF REGISTERED
MANAGEMENT
INVESTMENT COMPANIES
Investment Company Act file number 811-23063
Horizon Funds
(Exact name of registrant as specified in charter)
6210 Ardrey Kell Road, Suite 300
Charlotte, North Carolina 28277
(Address of principal executive offices) (Zip code)
Matthew Chambers
Horizon Funds
6210 Ardrey Kell Road, Suite 300
Charlotte, North Carolina 28277
(Name and address of agent for service)
(866) 371-2399
Registrant's telephone number, including area code
Date of fiscal year end: November 30, 2022
Date of reporting period: December 1, 2021 through May 31, 2022
Item 1. Reports to Stockholders.
| (a) |
HORIZON FUNDS |
Semi-Annual Report |
Horizon Active Asset Allocation Fund |
Horizon Active Risk Assist® Fund |
|||||
Investor Class
Advisor Class
Institutional Class |
Shares
Shares
Shares |
AAANX
HASAX
HASIX |
Investor Class
Advisor Class
Institutional Class |
Shares
Shares
Shares |
ARANX
ARAAX
ACRIX |
|
Horizon Active Income Fund |
Horizon Active Dividend Fund |
|||||
Investor Class
Advisor Class
Institutional Class |
Shares
Shares
Shares |
AIMNX
AIHAX
AIRIX |
Investor Class
Advisor Class |
Shares
Shares |
HNDDX
HADUX |
|
Horizon Defined Risk Fund |
Horizon U.S. Defensive Equity Fund |
|||||
Investor Class
Advisor Class |
Shares
Shares |
HNDRX
HADRX |
Investor Class
Advisor Class |
Shares
Shares |
USRAX
USRTX |
|
Horizon ESG Defensive Core Fund |
||
Investor Class
Advisor Class |
Shares
Shares |
HESGX
HESAX |
May 31, 2022 |
Investor Information: 1-855-754-7932
This report and the financial statements contained herein are submitted for the general information of shareholders and are not authorized for distribution to prospective investors unless preceded or accompanied by an effective prospectus. Nothing herein contained is to be considered an offer of sale or solicitation of an offer to buy shares of HORIZON ACTIVE ASSET ALLOCATION FUND, HORIZON ACTIVE RISK ASSIST® FUND, HORIZON ACTIVE INCOME FUND, HORIZON ACTIVE DIVIDEND FUND, HORIZON DEFINED RISK FUND, HORIZON U.S. DEFENSIVE EQUITY FUND and HORIZON ESG DEFENSIVE CORE FUND. Such offering is made only by prospectus, which includes details as to offering price and other material information.
Horizon Funds |
Table of Contents |
|
Portfolio Review |
1 |
Portfolio Composition |
8 |
Portfolio of Investments |
10 |
Statements of Assets and Liabilities |
60 |
Statements of Operations |
62 |
Statements of Changes in Net Assets |
64 |
Financial Highlights |
71 |
Notes to Financial Statements |
88 |
Disclosure of Fund Expenses |
105 |
Statement Regarding Liquidity Risk Management Program |
106 |
Additional Information |
107 |
Horizon Active Asset Allocation Fund
Portfolio Review (Unaudited)
May 31, 2022
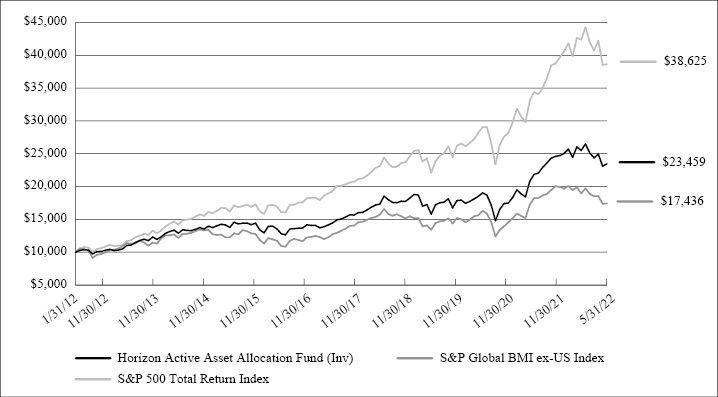
The chart above assumes an initial gross investment of $10,000 made on January 31, 2012. The Fund’s performance figures are for the period ended May 31, 2022. The Performance data quoted is historical. Past performance is no guarantee of future results. Current performance may be higher or lower than the performance data quoted. The principal value and investment return of an investment will fluctuate so that your shares, when redeemed, may be worth more or less than their original cost. The returns shown do not reflect the deduction of taxes that a shareholder would pay on Fund distributions or on the redemptions of Fund shares. In the absence of fee waivers and reimbursements, when they are necessary to keep expenses at the expense cap, total return would be reduced. Performance figures for periods greater than one year are annualized.
Average Annual Total Returns |
One Year |
Five Year |
Since |
Horizon Active Asset Allocation Fund - Investor Class(3) |
-4.63% |
8.37% |
8.60% |
Horizon Active Asset Allocation Fund - Advisor Class(3) |
-4.80% |
8.24% |
8.98% |
Horizon Active Asset Allocation Fund - Institutional Class(3) |
-4.53% |
8.50% |
9.80% |
S&P 500 Total Return Index |
-0.30% |
13.38% |
13.97%(2) |
S&P Global BMI ex-US Index |
-13.01% |
4.49% |
5.53%(2) |
|
(1) |
Inception date is January 31, 2012 for Investor Class Shares, September 4, 2015 for Advisor Class Shares and September 9, 2016 for Institutional Class Shares. |
|
(2) |
The Since Commencement of Operations returns shown are from the commencement date of Horizon Active Asset Allocation Fund - Investor Class. The returns for the S&P 500 Total Return Index and S&P Global BMI ex-US Index since the commencement date of the Horizon Active Asset Allocation Fund - Advisor Class are 14.17% and 6.49%, respectively. The returns for the S&P 500 Total Return Index and S&P Global BMI ex-US Index since the commencement date of the Horizon Active Asset Allocation Fund - Institutional Class are 14.37% and 5.99%, respectively. |
|
(3) |
The returns reflect the actual performance for each period and do not include the impact of any adjustments made for financial reporting required by Generally Accepted Accounting Principles (GAAP). |
The S&P 500 Total Return Index is an unmanaged market capitalization-weighted index which is comprised of the largest U.S. domiciled companies and includes the reinvestment of all dividends. Index returns do not reflect the effects of fees or expenses. Investors cannot invest directly in an index or benchmark.
The S&P Global BMI ex-US Index is a comprehensive, rules-based index that represents the composition of global stock markets. Index returns do not reflect the effects of fees or expenses. Investors cannot invest directly in an index or benchmark.
1
Horizon Active Risk Assist® Fund |

The chart above assumes an initial gross investment of $10,000 made on August 28, 2014. The Fund’s performance figures are for the period ended May 31, 2022. The Performance data quoted is historical. Past performance is no guarantee of future results. Current performance may be higher or lower than the performance data quoted. The principal value and investment return of an investment will fluctuate so that your shares, when redeemed, may be worth more or less than their original cost. The returns shown do not reflect the deduction of taxes that a shareholder would pay on Fund distributions or on the redemptions of Fund shares. In the absence of fee waivers and reimbursements, when they are necessary to keep expenses at the expense cap, total return would be reduced. Performance figures for periods greater than one year are annualized.
Average Annual Total Returns |
One Year |
Five Year |
Since |
Horizon Active Risk Assist® Fund - Investor Class(3) |
-6.46% |
4.27% |
3.77% |
Horizon Active Risk Assist® Fund - Advisor Class(3) |
-6.62% |
4.10% |
5.04% |
Horizon Active Risk Assist® Fund - Institutional Class(3) |
-6.41% |
4.37% |
5.84% |
Bloomberg Barclays Aggregate Bond Index |
-8.22% |
1.18% |
1.62%(2) |
S&P 500 Total Return Index |
-0.30% |
13.38% |
11.90%(2) |
S&P Global BMI ex-US Index |
-13.01% |
4.49% |
3.46%(2) |
|
(1) |
Inception date is August 28, 2014 for Investor Class Shares, September 4, 2015 for Advisor Class Shares and September 9, 2016 for Institutional Class Shares. |
|
(2) |
The Since Commencement of Operations returns shown are from the commencement date of Horizon Active Risk Assist® Fund - Investor Class. The returns for the Bloomberg Barclays Aggregate Bond Index, S&P 500 Total Return Index, and S&P Global BMI ex-US Index since the commencement date of the Horizon Active Risk Assist® Fund - Advisor Class are 1.58%, 14.17%, and 6.49%, respectively. The returns for the Bloomberg Barclays Aggregate Bond Index, S&P 500 Total Return Index, and S&P Global BMI ex-US Index since the commencement date of the Horizon Active Risk Assist® Fund - Institutional Class are 0.99%, 14.37%, and 5.99%, respectively. |
|
(3) |
The returns reflect the actual performance for each period and do not include the impact of any adjustments made for financial reporting required by Generally Accepted Accounting Principles (GAAP). |
The Bloomberg Barclays Aggregate Bond Index is a market-capitalization-weighted index that covers the USD denominated, investment-grade (rated Baa3 or above by Moody’s), fixed-rate, and taxable areas of the bond market. Index returns do not reflect the effects of fees or expenses. Investors cannot invest directly in an index or benchmark.
The S&P 500 Total Return Index is an unmanaged market capitalization-weighted index which is comprised of the largest U.S. domiciled companies and includes the reinvestment of all dividends. Index returns do not reflect the effects of fees or expenses. Investors cannot invest directly in an index or benchmark.
The S&P Global BMI ex-US Index is a comprehensive, rules-based index that represents the composition of global stock markets. Index returns do not reflect the effects of fees or expenses. Investors cannot invest directly in an index or benchmark.
2
Horizon Active Income Fund |

The chart above assumes an initial gross investment of $10,000 made on September 30, 2013. The Fund’s performance figures are for the period ended May 31, 2022. The Performance data quoted is historical. Past performance is no guarantee of future results. Current performance may be higher or lower than the performance data quoted. The principal value and investment return of an investment will fluctuate so that your shares, when redeemed, may be worth more or less than their original cost. The returns shown do not reflect the deduction of taxes that a shareholder would pay on Fund distributions or on the redemptions of Fund shares. In the absence of fee waivers and reimbursements, when they are necessary to keep expenses at the expense cap, total return would be reduced. Performance figures for periods greater than one year are annualized.
Average Annual Total Returns |
One Year |
Five Year |
Since |
Horizon Active Income Fund - Investor Class(3) |
-10.16% |
-0.20% |
0.27% |
Horizon Active Income Fund - Advisor Class(3) |
-10.24% |
-0.35% |
0.08% |
Horizon Active Income Fund - Institutional Class(3) |
-10.00% |
-0.14% |
-0.18% |
Bloomberg Barclays Aggregate Bond Index |
-8.22% |
1.18% |
1.98%(2) |
|
(1) |
Inception date is September 30, 2013 for Investor Class Shares, February 8, 2016 for Advisor Class Shares and September 9, 2016 for Institutional Class Shares. |
|
(2) |
The Since Commencement of Operations returns shown are from the commencement date of Horizon Active Income Fund - Investor Class. The returns for the Bloomberg Barclays Aggregate Bond Index since the commencement date of the Horizon Active Income Fund - Advisor Class and the Horizon Active Income Fund - Institutional Class are 1.40% and 0.99%, respectively. |
|
(3) |
The returns reflect the actual performance for each period and do not include the impact of any adjustments made for financial reporting required by Generally Accepted Accounting Principles (GAAP). |
The Bloomberg Barclays Aggregate Bond Index is a market-capitalization-weighted index that covers the USD denominated, investment-grade (rated Baa3 or above by Moody’s), fixed-rate, and taxable areas of the bond market. Index returns do not reflect the effects of fees or expenses. Investors cannot invest directly in an index or benchmark.
3
Horizon Active Dividend Fund |

The chart above assumes an initial gross investment of $10,000 made on December 28, 2016. The Fund’s performance figures are for the period ended May 31, 2022. The Performance data quoted is historical. Past performance is no guarantee of future results. Current performance may be higher or lower than the performance data quoted. The principal value and investment return of an investment will fluctuate so that your shares, when redeemed, may be worth more or less than their original cost. The returns shown do not reflect the deduction of taxes that a shareholder would pay on Fund distributions or on the redemptions of Fund shares. In the absence of fee waivers and reimbursements, when they are necessary to keep expenses at the expense cap, total return would be reduced. Performance figures for periods greater than one year are annualized.
Average Annual Total Returns |
One Year |
Five Year |
Since |
Horizon Active Dividend Fund - Investor Class(4) |
1.39% |
6.87% |
7.76% |
Horizon Active Dividend Fund - Advisor Class(4) |
1.23% |
N/A |
6.46% |
MSCI World High Dividend Yield Index(3) |
2.54% |
7.81% |
9.20%(2) |
S&P Global 100 Index |
2.26% |
12.64% |
13.79%(2) |
|
(1) |
Inception date is December 28, 2016 for Investor Class Shares and June 20, 2017 for Advisor Class Shares. |
|
(2) |
The Since Commencement of Operations returns shown are from the commencement date of Horizon Active Dividend Fund - Investor Class. The returns for the MSCI World High Dividend Yield Index and S&P Global 100 Index - Advisor Class are 7.78% and 12.70%, respectively. |
|
(3) |
The MSCI World High Dividend Yield Index has replaced the S&P Global 100 Index as the Fund’s primary bencharmk index. The Advisor believes that the new index is more appropriate given the Fund’s holdings. |
|
(4) |
The returns reflect the actual performance for each period and do not include the impact of any adjustments made for financial reporting required by Generally Accepted Accounting Principles (GAAP). |
The MSCI World High Dividend Yield Index is based on the MSCI World Index, its parent index, and includes large- and mid-cap stocks across 23 developed markets countries. The index is designed to reflect the performance of equities in the parent index (excluding REITs) with higher dividend income and quality characteristics than average dividend yields that are both sustainable and persistent. The index also applies quality screens and reviews 12-month past performance to omit stocks with potentially deteriorating fundamentals that could force them to cut or reduce dividends. Investors cannot directly invest in an index.
The S&P Global 100 Index measures the performance of multi-national, blue chip companies of major importance in the global equity markets. Index returns do not reflect the effects of fees or expenses. Investors cannot invest directly in an index or benchmark.
4
Horizon Defined Risk Fund |

The chart above assumes an initial gross investment of $10,000 made on December 28, 2017. The Fund’s performance figures are for the period ended May 31, 2022. The Performance data quoted is historical. Past performance is no guarantee of future results. Current performance may be higher or lower than the performance data quoted. The principal value and investment return of an investment will fluctuate so that your shares, when redeemed, may be worth more or less than their original cost. The returns shown do not reflect the deduction of taxes that a shareholder would pay on Fund distributions or on the redemptions of Fund shares. In the absence of fee waivers and reimbursements, when they are necessary to keep expenses at the expense cap, total return would be reduced. Performance figures for periods greater than one year are annualized.
Average Annual Total Returns |
One Year |
Since |
Horizon Defined Risk Fund - Investor Class(3) |
-0.09% |
4.53% |
Horizon Defined Risk Fund - Advisor Class(3) |
-0.27% |
4.21% |
Bloomberg Barclays US Treasury 1-3 Years Index |
-3.06% |
1.18%(2) |
S&P 500 Total Return Index |
-0.30% |
12.19%(2) |
|
(1) |
Inception date is December 28, 2017 for Investor Class Shares and February 2, 2018 for Advisor Class Shares. |
|
(2) |
The Since Commencement of Operations returns shown are from the commencement date of Horizon Defined Risk Fund - Investor Class. The returns for the Bloomberg Barclays US Treasury 1-3 Years Index and the S&P 500 Total Return Index since the commencement date of the Horizon Defined Risk Fund - Advisor Class are 1.28%, and 11.74%, respectively. |
|
(3) |
The returns reflect the actual performance for each period and do not include the impact of any adjustments made for financial reporting required by Generally Accepted Accounting Principles (GAAP). |
The Bloomberg Barclays U S Treasury 1-3 Years Index measures the performance of the US government bond market and includes public obligations of the U.S. Treasury with a maturity between 1 and up to (but not including) 3 years. Index returns do not reflect the effects of fees or expenses. Investors cannot invest directly in an index or benchmark.
The S&P 500 Total Return Index is an unmanaged market capitalization-weighted index which is comprised of the largest U.S. domiciled companies and includes the reinvestment of all dividends. Index returns do not reflect the effects of fees or expenses. Investors cannot invest directly in an index or benchmark.
5
Horizon U.S. Defensive Equity Fund |

The chart above assumes an initial gross investment of $10,000 made on June 26, 2019. The Fund’s performance figures are for the period ended May 31, 2022. The Performance data quoted is historical. Past performance is no guarantee of future results. Current performance may be higher or lower than the performance data quoted. The principal value and investment return of an investment will fluctuate so that your shares, when redeemed, may be worth more or less than their original cost. The returns shown do not reflect the deduction of taxes that a shareholder would pay on Fund distributions or on the redemptions of Fund shares. In the absence of fee waivers and reimbursements, when they are necessary to keep expenses at the expense cap, total return would be reduced. Performance figures for periods greater than one year are annualized.
Average Annual Total Returns |
One Year |
Since |
Horizon U.S. Defensive Equity Fund - Investor Class(3) |
1.22% |
9.28% |
Horizon U.S. Defensive Equity Fund - Advisor Class(3) |
1.03% |
9.24% |
S&P 500 Total Return Index |
-0.30% |
14.55%(2) |
|
(1) |
Inception date is June 26, 2019 for Investor Class Shares and January 31, 2020 for Advisor Class Shares |
|
(2) |
The Since Commencement of Operations returns shown are from the commencement date of Horizon U.S. Defensive Equity Fund - Investor Class. The returns for the S&P 500 Total Return Index since the commencement date of the Horizon U.S. Defensive Equity Fund - Advisor Class are 13.01%. |
|
(3) |
The returns reflect the actual performance for each period and do not include the impact of any adjustments made for financial reporting required by Generally Accepted Accounting Principles (GAAP). |
The S&P 500 Total Return Index is an unmanaged market capitalization-weighted index which is comprised of the largest U.S. domiciled companies and includes the reinvestment of all dividends. Index returns do not reflect the effects of fees or expenses. Investors cannot invest directly in an index or benchmark.
6
Horizon ESG Defensive Core Fund |

The chart above assumes an initial gross investment of $10,000 made on December 26, 2019. The Fund’s performance figures are for the period ended May 31, 2022. The Performance data quoted is historical. Past performance is no guarantee of future results. Current performance may be higher or lower than the performance data quoted. The principal value and investment return of an investment will fluctuate so that your shares, when redeemed, may be worth more or less than their original cost. The returns shown do not reflect the deduction of taxes that a shareholder would pay on Fund distributions or on the redemptions of Fund shares. In the absence of fee waivers and reimbursements, when they are necessary to keep expenses at the expense cap, total return would be reduced. Performance figures for periods greater than one year are annualized.
Average Annual Total Returns |
One Year |
Since |
Horizon ESG Defensive Core Fund - Investor Class(3) |
-0.89% |
13.30% |
Horizon ESG Defensive Core Fund - Advisor Class(3) |
-1.07% |
13.17% |
MSCI USA Index |
-2.28% |
12.17%(2) |
|
(1) |
Inception date is December 26, 2019 for Investor Class Shares and January 8, 2020 for Advisor Class Shares. |
|
(2) |
The Since Commencement of Operations returns shown are from the commencement date of Horizon ESG Defensive Core Fund - Investor Class. The return for the MSCI USA Index since the commencement date of the Horizon ESG Defensive Core Fund - Advisor Class is 12.11%. |
|
(3) |
The returns reflect the actual performance for each period and do not include the impact of any adjustments made for financial reporting required by Generally Accepted Accounting Principles (GAAP). |
The MSCI USA Index is designed to measure the performance of the large and mid cap segments of the US market. With 616 constituents, the index covers approximately 85% of the free float-adjusted market capitalization in the US Index returns do not reflect the effects of fees or expenses. Investors cannot invest directly in an index or benchmark.
7
Horizon Funds
Portfolio Composition (Unaudited)
May 31, 2022
Horizon Active Asset Allocation Fund Portfolio Composition as of May 31, 2022:
% of Total |
|
Investment Companies |
73.5% |
Short-Term Investments |
2.5% |
Investments Purchased With Proceeds From Securities Lending |
24.0% |
100.0% |
Horizon Active Risk Assist® Fund Portfolio Composition as of May 31, 2022:
% of Total |
|
Investment Companies |
81.7% |
Common Stocks |
2.0% |
Purchased Call Options |
0.2% |
Purchased Put Options |
0.0%(a) |
Short-Term Investments |
3.3% |
Investments Purchased With Proceeds From Securities Lending |
12.8% |
100.0% |
Horizon Active Income Fund Portfolio Composition as of May 31, 2022:
% of Total |
|
Investment Companies |
83.4% |
Short-Term Investments |
0.7% |
Investments Purchased With Proceeds From Securities Lending |
15.9% |
100.0% |
Horizon Active Dividend Fund Portfolio Composition as of May 31, 2022:
% of Total |
|
Common Stocks |
95.5% |
Preferred Stocks |
0.2% |
Short-Term Investments |
1.8% |
Investments Purchased With Proceeds From Securities Lending |
2.5% |
100.0% |
8
Horizon Funds |
Horizon Defined Risk Fund Portfolio Composition as of May 31, 2022:
% of Total |
|
Common Stocks |
91.7% |
Purchased Put Options |
4.6% |
Short-Term Investments |
3.7% |
Investments Purchased With Proceeds From Securities Lending |
0.0%(a) |
100.0% |
Horizon U.S. Defensive Equity Fund Portfolio Composition as of May 31, 2022:
% of Total |
|
Common Stocks |
97.5% |
Short-Term Investments |
2.5% |
100.0% |
Horizon ESG Defensive Core Fund Portfolio Composition as of May 31, 2022:
% of Total |
|
Investment Companies |
29.5% |
Common Stocks |
68.3% |
Short-Term Investments |
2.2% |
100.0% |
Data expressed excludes written options. Please refer to the Portfolio of Investments in this report for a detailed analysis of the Funds’ holdings.
|
(a) |
Rounds to less than 0.1% |
9
Horizon Active Asset Allocation Fund
Portfolio of Investments (Unaudited)
May 31, 2022
Shares |
Value |
|||||||||||
INVESTMENT COMPANIES - 96.7% |
||||||||||||
Exchange Traded Funds - 96.7% |
||||||||||||
| 96,856 | Consumer Staples Select Sector SPDR Fund |
$ | 7,212,866 | |||||||||
| 289,155 | Energy Select Sector SPDR Fund |
25,214,316 | ||||||||||
| 215,421 | Invesco QQQ Trust Series 1 (a) |
66,409,986 | ||||||||||
| 636,108 | Invesco S&P 500 Equal Weight ETF (a) |
94,735,564 | ||||||||||
| 202,275 | iShares Core S&P Mid-Cap ETF (a) |
50,807,434 | ||||||||||
| 507,675 | iShares Core S&P Small-Cap ETF |
51,417,324 | ||||||||||
| 292,869 | iShares Edge MSCI USA Quality Factor ETF |
36,101,962 | ||||||||||
| 1,231,446 | iShares International Select Dividend ETF (a) |
38,692,033 | ||||||||||
| 283,748 | iShares Latin America 40 ETF (a) |
8,066,956 | ||||||||||
| 293,613 | iShares MSCI Australia ETF (a) |
7,246,369 | ||||||||||
| 194,024 | iShares MSCI Canada ETF (a) |
7,339,928 | ||||||||||
| 534,571 | iShares MSCI Japan ETF (a) |
30,791,290 | ||||||||||
| 790,640 | iShares MSCI USA Minimum Volatility ETF |
58,080,414 | ||||||||||
| 529,080 | iShares Select Dividend ETF |
68,843,889 | ||||||||||
| 107,858 | Schwab U.S. Large-Cap Value ETF (a) |
7,417,395 | ||||||||||
| 104,414 | Overlay Shares Large Cap Equity ETF |
3,569,915 | ||||||||||
| 630,907 | SPDR Portfolio Emerging Markets ETF |
23,040,724 | ||||||||||
| 1,830,322 | SPDR Portfolio S&P 500 Value ETF |
73,853,493 | ||||||||||
| 564,709 | Xtrackers MSCI USA ESG Leaders Equity ETF |
21,351,647 | ||||||||||
| 194,809 | Xtrackers S&P 500 ESG ETF |
7,266,376 | ||||||||||
| 842,720 | WisdomTree U.S. Quality Dividend Growth Fund |
51,793,571 | ||||||||||
TOTAL INVESTMENT COMPANIES (Cost - $753,684,320) |
739,253,452 | |||||||||||
SHORT TERM INVESTMENTS - 3.3% |
||||||||||||
Money Market Funds - 3.3% |
||||||||||||
| 24,759,239 | First American Treasury Obligations Fund, Class X. 0.67% (b) |
24,759,239 | ||||||||||
TOTAL SHORT TERM INVESTMENTS (Cost - $24,759,239) |
24,759,239 | |||||||||||
INVESTMENTS PURCHASED WITH PROCEEDS FROM SECURITIES LENDING - 31.5% |
||||||||||||
| 200,699,189 | First American Government Obligations Fund, Class X, 0.65% (b) |
240,825,029 | ||||||||||
TOTAL INVESTMENTS PURCHASED WITH PROCEEDS FROM SECURITIES LENDING (Cost - $240,825,029) |
240,825,029 | |||||||||||
TOTAL INVESTMENTS - 131.5% (Cost - $1,019,268,588) |
1,004,837,720 | |||||||||||
Liabilities in Excess of Other Assets - (31.5)% |
(240,516,405 | ) | ||||||||||
NET ASSETS - 100.0% |
$ | 764,321,315 | ||||||||||
Percentages are stated as a percent of net assets.
|
(a) |
All or a portion of this security is out on loan as of May 31, 2022. |
|
(b) |
Interest rate reflects the seven-day yield on May 31, 2022. |
See accompanying notes to financial statements.
10
Horizon Active Risk Assist® Fund |
Shares |
Value |
|||||||||||
INVESTMENT COMPANIES - 95.8% |
||||||||||||
Exchange Traded Funds - 95.8% |
||||||||||||
| 235,075 | Invesco QQQ Trust Series 1 (f) |
$ | 72,468,921 | |||||||||
| 347,081 | Invesco S&P 500 Equal Weight ETF (f) |
51,690,773 | ||||||||||
| 597,015 | iShares Core MSCI Total International Stock ETF |
37,629,855 | ||||||||||
| 363,560 | iShares Core S&P Small-Cap ETF |
36,821,357 | ||||||||||
| 175,070 | iShares Core S&P Mid-Cap ETF (f) |
43,974,083 | ||||||||||
| 295,434 | iShares Edge MSCI USA Quality Factor ETF |
36,418,149 | ||||||||||
| 983,001 | iShares MSCI USA Minimum Volatility ETF |
72,211,253 | ||||||||||
| 393,843 | iShares Select Dividend ETF (f) |
51,246,851 | ||||||||||
| 5,469,119 | SPDR Bloomberg 1-3 Month T-Bill ETF (f)(h) |
500,150,933 | ||||||||||
| 2,774,352 | SPDR Portfolio Developed World ex-US ETF (f) |
90,138,697 | ||||||||||
| 1,028,383 | SPDR Portfolio Emerging Markets ETF |
37,556,547 | ||||||||||
| 507,181 | SPDR Portfolio S&P 500 Growth ETF (e) |
28,954,963 | ||||||||||
| 1,439,208 | SPDR Portfolio S&P 500 Value ETF (e)(f) |
58,072,043 | ||||||||||
| 819,091 | WisdomTree U.S. Quality Dividend Growth Fund (f) |
50,341,333 | ||||||||||
| 576,694 | Xtrackers MSCI USA ESG Leaders Equity ETF |
21,804,800 | ||||||||||
| 196,866 | Xtrackers S&P 500 ESG ETF (e) |
7,343,102 | ||||||||||
TOTAL INVESTMENT COMPANIES (Cost - $1,221,081,029) |
1,196,823,660 | |||||||||||
COMMON STOCKS - 2.3% |
||||||||||||
Accommodation and Food Services - 0.0% (b) |
||||||||||||
| 1,598 | Caesars Entertainment, Inc. (a) |
80,172 | ||||||||||
| 5,871 | Penn National Gaming, Inc. (a) |
187,637 | ||||||||||
| 267,809 | ||||||||||||
Advertising - 0.0% (b) |
||||||||||||
| 3,266 | Interpublic Group of Cos., Inc. |
105,263 | ||||||||||
| 1,142 | Omnicom Group, Inc. |
85,205 | ||||||||||
| 190,468 | ||||||||||||
Aerospace/Defense - 0.1% |
||||||||||||
| 248 | General Dynamics Corp. |
55,778 | ||||||||||
| 2,186 | Howmet Aerospace, Inc. |
78,193 | ||||||||||
| 166 | L3Harris Technologies, Inc. |
39,989 | ||||||||||
| 162 | Lockheed Martin Corp. |
71,298 | ||||||||||
| 102 | Northrop Grumman Corp. |
47,733 | ||||||||||
| 239 | Teledyne Technologies, Inc. (a) |
96,831 | ||||||||||
| 49 | TransDigm Group, Inc. (a) |
29,663 | ||||||||||
| 419,485 | ||||||||||||
Agriculture - 0.0% (b) |
||||||||||||
| 1,059 | Altria Group, Inc. |
57,281 | ||||||||||
| 689 | Archer Daniels Midland Co. |
62,575 | ||||||||||
| 119,856 | ||||||||||||
Airlines - 0.0% (b) |
||||||||||||
| 3,042 | Alaska Air Group, Inc. (a) |
146,807 | ||||||||||
See accompanying notes to financial statements.
11
Horizon Active Risk Assist® Fund |
Shares |
Value |
|||||||||||
| 4,742 | American Airlines Group, Inc. (a) |
$ | 84,740 | |||||||||
| 900 | Delta Air Lines, Inc. (a) |
37,521 | ||||||||||
| 750 | Southwest Airlines Co. (a) |
34,395 | ||||||||||
| 1,329 | United Airlines Holdings, Inc. (a) |
63,300 | ||||||||||
| 366,763 | ||||||||||||
Apparel - 0.1% |
||||||||||||
| 3,430 | PVH Corp. |
243,084 | ||||||||||
| 4,607 | Tapestry, Inc. |
158,942 | ||||||||||
| 20,090 | Under Armour, Inc., Class A (a) |
212,552 | ||||||||||
| 1,198 | VF Corp. |
60,451 | ||||||||||
| 675,029 | ||||||||||||
Auto Manufacturers - 0.0% (b) |
||||||||||||
| 163 | Cummins, Inc. |
34,087 | ||||||||||
| 2,881 | Ford Motor Co. |
39,412 | ||||||||||
| 474 | General Motors Co. (a) |
18,334 | ||||||||||
| 366 | PACCAR, Inc. |
31,783 | ||||||||||
| 123,616 | ||||||||||||
Auto Parts & Equipment - 0.0% (b) |
||||||||||||
| 402 | Aptiv PLC (a) |
42,708 | ||||||||||
| 3,177 | BorgWarner, Inc. |
128,097 | ||||||||||
| 170,805 | ||||||||||||
Banks - 0.1% |
||||||||||||
| 688 | Bank of New York Mellon Corp. |
32,068 | ||||||||||
| 1,357 | Citizens Financial Group, Inc. |
56,153 | ||||||||||
| 1,274 | Comerica, Inc. |
106,009 | ||||||||||
| 1,110 | Fifth Third Bancorp |
43,767 | ||||||||||
| 286 | First Republic Bank |
44,339 | ||||||||||
| 4,163 | Huntington Bancshares, Inc. |
57,782 | ||||||||||
| 3,026 | KeyCorp |
60,399 | ||||||||||
| 208 | M&T Bank Corp. |
37,434 | ||||||||||
| 454 | Northern Trust Corp. |
50,734 | ||||||||||
| 92 | PNC Financial Services Group, Inc. |
16,138 | ||||||||||
| 2,651 | Regions Financial Corp. |
58,561 | ||||||||||
| 598 | State Street Corp. |
43,349 | ||||||||||
| 78 | SVB Financial Group (a) |
38,108 | ||||||||||
| 338 | Truist Financial Corp. |
16,812 | ||||||||||
| 2,265 | Zions Bancorp NA |
129,196 | ||||||||||
| 790,849 | ||||||||||||
Beverages - 0.0% (b) |
||||||||||||
| 526 | Brown-Forman Corp. |
34,779 | ||||||||||
| 2,510 | Coca-Cola Co. |
159,084 | ||||||||||
| 1,664 | Molson Coors Brewing Co. |
92,918 | ||||||||||
| 267 | Monster Beverage Corp. (a) |
23,795 | ||||||||||
| 310,576 | ||||||||||||
See accompanying notes to financial statements.
12
Horizon Active Risk Assist® Fund |
Shares |
Value |
|||||||||||
Biotechnology - 0.0% (b) |
||||||||||||
| 185 | Biogen, Inc. (a) |
$ | 37,000 | |||||||||
| 141 | Bio-Rad Laboratories, Inc.. Class A (a) |
75,828 | ||||||||||
| 1,024 | Corteva, Inc. |
64,123 | ||||||||||
| 216 | Gilead Sciences, Inc. |
14,008 | ||||||||||
| 121 | Illumina, Inc. (a) |
28,977 | ||||||||||
| 814 | Incyte Corp. (a) |
61,775 | ||||||||||
| 83 | Regeneron Pharmaceuticals, Inc. (a) |
55,173 | ||||||||||
| 231 | Vertex Pharmaceuticals, Inc. (a) |
62,058 | ||||||||||
| 398,942 | ||||||||||||
Building Materials - 0.0% (b) |
||||||||||||
| 752 | Carrier Global Corp. |
29,561 | ||||||||||
| 1,389 | Fortune Brands Home & Security, Inc. |
96,327 | ||||||||||
| 477 | Johnson Controls International PLC |
26,002 | ||||||||||
| 148 | Martin Marietta Materials, Inc. |
50,228 | ||||||||||
| 1,355 | Masco Corp. |
76,815 | ||||||||||
| 285 | Vulcan Materials Co. |
46,988 | ||||||||||
| 325,921 | ||||||||||||
Chemicals - 0.1% |
||||||||||||
| 86 | Air Products & Chemicals, Inc. |
21,170 | ||||||||||
| 169 | Albemarle Corp. |
44,011 | ||||||||||
| 452 | Celanese Corp. |
70,747 | ||||||||||
| 757 | CF Industries Holdings, Inc. |
74,769 | ||||||||||
| 317 | Dow, Inc. |
21,550 | ||||||||||
| 495 | DuPont de Nemours, Inc. |
33,586 | ||||||||||
| 748 | Eastman Chemical Co. |
82,400 | ||||||||||
| 729 | FMC Corp. |
89,361 | ||||||||||
| 264 | International Flavors & Fragrances, Inc. |
34,893 | ||||||||||
| 274 | LyondellBasell Industries NV, Class A |
31,304 | ||||||||||
| 1,154 | Mosaic Co. |
72,298 | ||||||||||
| 272 | PPG Industries, Inc. |
34,405 | ||||||||||
| 53 | Sherwin-Williams Co. |
14,206 | ||||||||||
| 624,700 | ||||||||||||
Commercial Services - 0.1% |
||||||||||||
| 295 | Automatic Data Processing, Inc. |
65,767 | ||||||||||
| 101 | Cintas Corp. |
40,231 | ||||||||||
| 135 | Ecolab, Inc. |
22,128 | ||||||||||
| 182 | Equifax, Inc. |
36,870 | ||||||||||
| 465 | FleetCor Technologies, Inc. (a) |
115,697 | ||||||||||
| 424 | Gartner, Inc. (a) |
111,258 | ||||||||||
| 445 | Global Payments, Inc. |
58,313 | ||||||||||
| 406 | MarketAxess Holdings, Inc. |
114,362 | ||||||||||
| 65 | Moody’s Corp. |
19,602 | ||||||||||
See accompanying notes to financial statements.
13
Horizon Active Risk Assist® Fund |
Shares |
Value |
|||||||||||
| 240 | PayPal Holdings, Inc. (a) |
$ | 20,450 | |||||||||
| 605 | Quanta Services, Inc. |
71,995 | ||||||||||
| 979 | Robert Half International, Inc. |
88,257 | ||||||||||
| 1,655 | Rollins, Inc. |
58,686 | ||||||||||
| 149 | United Rentals, Inc. (a) |
44,429 | ||||||||||
| 244 | Verisk Analytics, Inc. |
42,680 | ||||||||||
| 910,725 | ||||||||||||
Computers - 0.1% |
||||||||||||
| 1,892 | Apple, Inc. |
281,605 | ||||||||||
| 894 | Cognizant Technology Solutions Corp., Class A |
66,782 | ||||||||||
| 8,967 | DXC Technology Co. (a) |
315,818 | ||||||||||
| 278 | Fortinet, Inc. (a) |
81,771 | ||||||||||
| 5,474 | Hewlett Packard Enterprise Co. |
85,394 | ||||||||||
| 1,975 | HP, Inc. |
76,709 | ||||||||||
| 111 | International Business Machines Corp. |
15,411 | ||||||||||
| 726 | Leidos Holdings, Inc. |
75,867 | ||||||||||
| 1,510 | NetApp, Inc. |
108,645 | ||||||||||
| 1,671 | Western Digital Corp. (a) |
101,413 | ||||||||||
| 1,209,415 | ||||||||||||
Cosmetics/Personal Care - 0.0% (b) |
||||||||||||
| 206 | Colgate-Palmolive Co. |
16,235 | ||||||||||
| 1,165 | Procter & Gamble Co. |
172,280 | ||||||||||
| 188,515 | ||||||||||||
Distribution/Wholesale - 0.0% (b) |
||||||||||||
| 318 | Copart, Inc. (a) |
36,420 | ||||||||||
| 563 | Fastenal Co. |
30,154 | ||||||||||
| 1,445 | LKQ Corp. |
74,259 | ||||||||||
| 114 | WW Grainger, Inc. |
55,526 | ||||||||||
| 196,359 | ||||||||||||
Diversified Financial Services - 0.1% |
||||||||||||
| 285 | American Express Co. |
48,114 | ||||||||||
| 137 | Ameriprise Financial, Inc. |
37,849 | ||||||||||
| 169 | Capital One Financial Corp. |
21,608 | ||||||||||
| 207 | CME Group, Inc. |
41,158 | ||||||||||
| 319 | Discover Financial Services |
36,203 | ||||||||||
| 3,413 | Franklin Resources, Inc. |
92,424 | ||||||||||
| 192 | Intercontinental Exchange, Inc. |
19,659 | ||||||||||
| 7,081 | Invesco, Ltd. |
136,947 | ||||||||||
| 282 | Nasdaq, Inc. |
43,783 | ||||||||||
| 703 | Raymond James Financial, Inc. |
69,239 | ||||||||||
| 1,527 | Synchrony Financial |
56,560 | ||||||||||
| 293 | T. Rowe Price Group, Inc. |
37,237 | ||||||||||
| 640,781 | ||||||||||||
See accompanying notes to financial statements.
14
Horizon Active Risk Assist® Fund |
Shares |
Value |
|||||||||||
Electric - 0.1% |
||||||||||||
| 3,559 | AES Corp. |
$ | 78,440 | |||||||||
| 1,202 | Alliant Energy Corp. |
76,712 | ||||||||||
| 473 | Ameren Corp. |
45,025 | ||||||||||
| 517 | American Electric Power Co., Inc. |
52,749 | ||||||||||
| 2,363 | CenterPoint Energy, Inc. |
75,734 | ||||||||||
| 772 | CMS Energy Corp. |
54,843 | ||||||||||
| 623 | Consolidated Edison, Inc. |
61,839 | ||||||||||
| 185 | Dominion Energy, Inc. |
15,581 | ||||||||||
| 304 | DTE Energy Co. |
40,344 | ||||||||||
| 573 | Edison International |
40,058 | ||||||||||
| 368 | Entergy Corp. |
44,278 | ||||||||||
| 1,004 | Evergy, Inc. |
70,220 | ||||||||||
| 374 | Eversource Energy |
34,528 | ||||||||||
| 480 | Exelon Corp. |
23,592 | ||||||||||
| 1,485 | FirstEnergy Corp. |
63,796 | ||||||||||
| 2,535 | NRG Energy, Inc. |
116,711 | ||||||||||
| 1,712 | Pinnacle West Capital Corp. |
132,937 | ||||||||||
| 1,717 | PPL Corp. |
51,819 | ||||||||||
| 435 | Public Service Enterprise Group, Inc. |
29,815 | ||||||||||
| 353 | Sempra Energy |
57,842 | ||||||||||
| 594 | Southern Co. |
44,942 | ||||||||||
| 325 | WEC Energy Group, Inc. |
34,148 | ||||||||||
| 354 | Xcel Energy, Inc. |
26,670 | ||||||||||
| 1,272,623 | ||||||||||||
Electrical Components & Equipment - 0.0% (b) |
||||||||||||
| 263 | AMETEK, Inc. |
31,947 | ||||||||||
| 206 | Emerson Electric Co. |
18,264 | ||||||||||
| 50,211 | ||||||||||||
Electronics - 0.1% |
||||||||||||
| 246 | Agilent Technologies, Inc. |
31,380 | ||||||||||
| 824 | Allegion PLC |
92,000 | ||||||||||
| 616 | Amphenol Corp., Class A |
43,650 | ||||||||||
| 711 | Fortive Corp. |
43,918 | ||||||||||
| 502 | Garmin, Ltd. |
53,021 | ||||||||||
| 528 | Keysight Technologies, Inc. (a) |
76,877 | ||||||||||
| 28 | Mettler-Toledo International, Inc. (a) |
36,011 | ||||||||||
| 385 | PerkinElmer, Inc. |
57,623 | ||||||||||
| 89 | Roper Technologies, Inc. |
39,377 | ||||||||||
| 352 | TE Connectivity, Ltd. |
45,545 | ||||||||||
| 167 | Waters Corp. (a) |
54,768 | ||||||||||
| 574,170 | ||||||||||||
See accompanying notes to financial statements.
15
Horizon Active Risk Assist® Fund |
Shares |
Value |
|||||||||||
Engineering & Construction - 0.0% (b) |
||||||||||||
| 469 | Jacobs Engineering Group, Inc. |
$ | 65,702 | |||||||||
Entertainment - 0.0% (b) |
||||||||||||
| 844 | Live Nation Entertainment, Inc. (a) |
80,222 | ||||||||||
Environmental Control - 0.0% (b) |
||||||||||||
| 2,211 | Pentair PLC |
110,926 | ||||||||||
| 336 | Republic Services, Inc. |
44,970 | ||||||||||
| 255 | Waste Management, Inc. |
40,420 | ||||||||||
| 196,316 | ||||||||||||
Finance and Insurance - 0.0% (b) |
||||||||||||
| 1,339 | Brown & Brown, Inc. |
79,497 | ||||||||||
| 357 | Signature Bank/New York NY |
77,208 | ||||||||||
| 290 | US Bancorp |
15,390 | ||||||||||
| 172,095 | ||||||||||||
Food - 0.1% |
||||||||||||
| 1,383 | Campbell Soup Co. |
66,260 | ||||||||||
| 1,700 | Conagra Brands, Inc. |
55,913 | ||||||||||
| 335 | General Mills, Inc. |
23,400 | ||||||||||
| 264 | Hershey Co. |
55,891 | ||||||||||
| 1,091 | Hormel Foods Corp. |
53,099 | ||||||||||
| 474 | J.M. Smucker Co. |
59,425 | ||||||||||
| 572 | Kellogg Co. |
39,891 | ||||||||||
| 447 | Kraft Heinz Co. |
16,910 | ||||||||||
| 1,077 | Kroger Co. |
57,049 | ||||||||||
| 1,836 | Lamb Weston Holdings, Inc. |
124,077 | ||||||||||
| 405 | McCormick & Co., Inc. |
37,552 | ||||||||||
| 286 | Sysco Corp. |
24,075 | ||||||||||
| 589 | Tyson Foods, Inc., Class A |
52,780 | ||||||||||
| 666,322 | ||||||||||||
Forest Products & Paper - 0.0% (b) |
||||||||||||
| 1,208 | International Paper Co. |
58,528 | ||||||||||
Gas - 0.0% (b) |
||||||||||||
| 715 | Atmos Energy Corp. |
83,162 | ||||||||||
| 3,400 | NiSource, Inc. |
106,930 | ||||||||||
| 190,092 | ||||||||||||
Hand/Machine Tools - 0.0% (b) |
||||||||||||
| 365 | Snap-on, Inc. |
80,986 | ||||||||||
| 397 | Stanley Black & Decker, Inc. |
47,120 | ||||||||||
| 128,106 | ||||||||||||
Health Care and Social Assistance - 0.0% (b) |
||||||||||||
| 224 | Molina Healthcare, Inc. (a) |
65,009 | ||||||||||
See accompanying notes to financial statements.
16
Horizon Active Risk Assist® Fund |
Shares |
Value |
|||||||||||
Healthcare Products - 0.1% |
||||||||||||
| 372 | ABIOMED, Inc. (a) |
$ | 98,096 | |||||||||
| 178 | Align Technology, Inc. (a) |
49,420 | ||||||||||
| 384 | Baxter International, Inc. |
29,203 | ||||||||||
| 461 | Boston Scientific Corp. (a) |
18,906 | ||||||||||
| 197 | Cooper Cos., Inc. |
69,096 | ||||||||||
| 3,219 | Dentsply Sirona, Inc. |
127,344 | ||||||||||
| 175 | Edwards Lifesciences Corp. (a) |
17,649 | ||||||||||
| 764 | Hologic, Inc. (a) |
57,506 | ||||||||||
| 98 | IDEXX Laboratories, Inc. (a) |
38,379 | ||||||||||
| 180 | ResMed, Inc. |
36,623 | ||||||||||
| 216 | STERIS PLC |
49,291 | ||||||||||
| 310 | Teleflex, Inc. |
89,199 | ||||||||||
| 154 | West Pharmaceutical Services, Inc. |
47,799 | ||||||||||
| 359 | Zimmer Biomet Holdings, Inc. |
43,155 | ||||||||||
| 771,666 | ||||||||||||
Healthcare Services - 0.1% |
||||||||||||
| 142 | Anthem, Inc. |
72,365 | ||||||||||
| 1,009 | DaVita, Inc. (a) |
98,367 | ||||||||||
| 69 | HCA Healthcare, Inc. |
14,518 | ||||||||||
| 44 | Humana, Inc. |
19,986 | ||||||||||
| 126 | IQVIA Holdings, Inc. (a) |
27,121 | ||||||||||
| 183 | Laboratory Corp. of America Holdings |
45,150 | ||||||||||
| 482 | Quest Diagnostics, Inc. |
67,972 | ||||||||||
| 545 | UnitedHealth Group, Inc. |
270,745 | ||||||||||
| 873 | Universal Health Services, Inc., Class B |
108,784 | ||||||||||
| 725,008 | ||||||||||||
Home Builders - 0.0% (b) |
||||||||||||
| 616 | DR Horton, Inc. |
46,292 | ||||||||||
| 602 | Lennar Corp., Class A |
48,311 | ||||||||||
| 20 | NVR, Inc. (a) |
89,012 | ||||||||||
| 2,410 | PulteGroup, Inc. |
109,077 | ||||||||||
| 292,692 | ||||||||||||
Home Furnishings - 0.0% (b) |
||||||||||||
| 517 | Whirlpool Corp. |
95,252 | ||||||||||
Household Products/Wares - 0.0% (b) |
||||||||||||
| 413 | Avery Dennison Corp. |
71,267 | ||||||||||
| 454 | Church & Dwight Co., Inc. |
40,887 | ||||||||||
| 346 | Clorox Co. |
50,295 | ||||||||||
| 160 | Kimberly-Clark Corp. |
21,283 | ||||||||||
| 183,732 | ||||||||||||
See accompanying notes to financial statements.
17
Horizon Active Risk Assist® Fund |
Shares |
Value |
|||||||||||
Housewares - 0.0% (b) |
||||||||||||
| 4,817 | Newell Brands, Inc. |
$ | 103,277 | |||||||||
Information - 0.1% |
||||||||||||
| 4,167 | Ceridian HCM Holding, Inc. (a) |
234,602 | ||||||||||
| 197 | FactSet Research Systems, Inc. |
75,211 | ||||||||||
| 10,079 | Lumen Technologies, Inc. (f) |
123,367 | ||||||||||
| 1,291 | PTC, Inc. (a) |
150,440 | ||||||||||
| 1,620 | Warner Bros Discovery, Inc. (a) |
29,889 | ||||||||||
| 613,509 | ||||||||||||
Insurance - 0.1% |
||||||||||||
| 833 | Aflac, Inc. |
50,455 | ||||||||||
| 221 | Allstate Corp. |
30,209 | ||||||||||
| 733 | American International Group, Inc. |
43,012 | ||||||||||
| 60 | Aon PLC |
16,540 | ||||||||||
| 319 | Arthur J Gallagher & Co. |
51,659 | ||||||||||
| 629 | Assurant, Inc. |
111,138 | ||||||||||
| 928 | Berkshire Hathaway, Inc., Class B (a) |
293,229 | ||||||||||
| 201 | Chubb Ltd. |
42,469 | ||||||||||
| 508 | Cincinnati Financial Corp. |
64,953 | ||||||||||
| 327 | Everest Re Group Ltd. |
92,378 | ||||||||||
| 1,072 | Globe Life, Inc. |
104,595 | ||||||||||
| 624 | Hartford Financial Services Group, Inc. |
45,246 | ||||||||||
| 1,955 | Lincoln National Corp. |
113,253 | ||||||||||
| 1,249 | Loews Corp. |
81,797 | ||||||||||
| 217 | Marsh & McLennan Cos., Inc. |
34,709 | ||||||||||
| 288 | MetLife, Inc. |
19,408 | ||||||||||
| 1,034 | Principal Financial Group, Inc. |
75,410 | ||||||||||
| 419 | Progressive Corp. |
50,020 | ||||||||||
| 250 | Prudential Financial, Inc. |
26,563 | ||||||||||
| 268 | Travelers Cos., Inc. |
47,983 | ||||||||||
| 212 | Willis Towers Watson PLC |
44,747 | ||||||||||
| 1,131 | WR Berkley Corp. |
80,448 | ||||||||||
| 1,520,221 | ||||||||||||
Internet - 0.1% |
||||||||||||
| 465 | CDW Corp. |
78,985 | ||||||||||
| 761 | eBay, Inc. |
37,038 | ||||||||||
| 462 | Expedia Group, Inc. (a) |
59,750 | ||||||||||
| 1,017 | F5 Networks, Inc. (a) |
165,812 | ||||||||||
| 85 | Netflix, Inc. (a) |
16,782 | ||||||||||
| 5,697 | NortonLifeLock, Inc. |
138,665 | ||||||||||
| 562 | VeriSign, Inc. (a) |
98,097 | ||||||||||
| 595,129 | ||||||||||||
See accompanying notes to financial statements.
18
Horizon Active Risk Assist® Fund |
Shares |
Value |
|||||||||||
Iron/Steel - 0.0% (b) |
||||||||||||
| 453 | Nucor Corp. |
$ | 60,004 | |||||||||
Leisure Time - 0.0% (b) |
||||||||||||
| 4,015 | Carnival Corp. (a) |
55,728 | ||||||||||
| 8,533 | Norwegian Cruise Line Holdings Ltd. (a)(f) |
136,614 | ||||||||||
| 959 | Royal Caribbean Cruises Ltd. (a) |
55,689 | ||||||||||
| 248,031 | ||||||||||||
Lodging - 0.0% (b) |
||||||||||||
| 341 | Hilton Worldwide Holdings, Inc. |
48,033 | ||||||||||
| 1,276 | Las Vegas Sands Corp. (a) |
45,247 | ||||||||||
| 283 | Marriott International, Inc. |
48,557 | ||||||||||
| 1,796 | MGM Resorts International |
62,806 | ||||||||||
| 2,205 | Wynn Resorts Ltd. (a) |
145,751 | ||||||||||
| 350,394 | ||||||||||||
Machinery - Diversified - 0.0% (b) |
||||||||||||
| 115 | Deere & Co. |
41,145 | ||||||||||
| 364 | Dover Corp. |
48,743 | ||||||||||
| 345 | IDEX Corp. |
66,085 | ||||||||||
| 1,190 | Ingersoll Rand, Inc. |
56,108 | ||||||||||
| 399 | Otis Worldwide Corp. |
29,686 | ||||||||||
| 179 | Rockwell Automation, Inc. |
38,163 | ||||||||||
| 754 | Wabtec Corp. |
71,223 | ||||||||||
| 709 | Xylem, Inc. |
59,733 | ||||||||||
| 410,886 | ||||||||||||
Manufacturing - 0.1% |
||||||||||||
| 202 | Bio-Techne Corp. |
74,686 | ||||||||||
| 623 | Catalent, Inc. (a) |
64,206 | ||||||||||
| 644 | Enphase Energy, Inc. (a) |
119,906 | ||||||||||
| 273 | Generac Holdings, Inc. (a) |
67,453 | ||||||||||
| 144 | Moderna, Inc. (a) |
20,928 | ||||||||||
| 211 | Monolithic Power Systems, Inc. |
95,032 | ||||||||||
| 357 | Nordson Corp. |
77,783 | ||||||||||
| 216 | NXP Semiconductors NV |
40,988 | ||||||||||
| 3,429 | Organon & Co. |
130,165 | ||||||||||
| 711 | Raytheon Technologies Corp. |
67,630 | ||||||||||
| 1,236 | Seagate Technology Holdings Plc |
104,652 | ||||||||||
| 560 | SolarEdge Technologies, Inc. (a) |
152,763 | ||||||||||
| 1,024 | Teradyne, Inc. |
111,882 | ||||||||||
| 304 | Tesla, Inc. (a) |
230,511 | ||||||||||
| 1,793 | Trimble, Inc. (a) |
122,014 | ||||||||||
| 1,480,599 | ||||||||||||
See accompanying notes to financial statements.
19
Horizon Active Risk Assist® Fund |
Shares |
Value |
|||||||||||
Media - 0.1% |
||||||||||||
| 33 | Charter Communications, Inc., Class A (a) |
$ | 16,729 | |||||||||
| 4,881 | DISH Network Corp., Class A (a) |
111,433 | ||||||||||
| 2,257 | Fox Corp. |
80,146 | ||||||||||
| 6,893 | News Corp., Class A |
119,938 | ||||||||||
| 2,431 | ViacomCBS, Inc., Class B |
83,456 | ||||||||||
| 411,702 | ||||||||||||
Mining - 0.0% (b) |
||||||||||||
| 1,396 | Freeport-McMoRan, Inc. |
54,556 | ||||||||||
| 801 | Newmont Goldcorp Corp. |
54,348 | ||||||||||
| 108,904 | ||||||||||||
Mining, Quarrying, and Oil and Gas Extraction - 0.0% (b) |
||||||||||||
| 2,208 | APA Corp. |
103,798 | ||||||||||
Miscellaneous Manufacturing - 0.0% (b) |
||||||||||||
| 1,643 | AO Smith Corp. |
98,777 | ||||||||||
| 108 | Eaton Corp PLC |
14,969 | ||||||||||
| 68 | Illinois Tool Works, Inc. |
14,149 | ||||||||||
| 98 | Parker-Hannifin Corp. |
26,672 | ||||||||||
| 962 | Textron, Inc. |
62,809 | ||||||||||
| 217 | Trane Technologies PLC |
29,959 | ||||||||||
| 247,335 | ||||||||||||
Office/Business Equipment - 0.0% (b) |
||||||||||||
| 299 | Zebra Technologies Corp., Class A (a) |
101,119 | ||||||||||
Oil & Gas - 0.1% |
||||||||||||
| 1,334 | Cabot Oil & Gas Corp. |
45,796 | ||||||||||
| 1,374 | Chevron Corp. |
239,983 | ||||||||||
| 937 | Devon Energy Corp. |
70,181 | ||||||||||
| 320 | Diamondback Energy, Inc. |
48,646 | ||||||||||
| 112 | EOG Resources, Inc. |
15,340 | ||||||||||
| 271 | Hess Corp. |
33,352 | ||||||||||
| 2,881 | Marathon Oil Corp. |
90,550 | ||||||||||
| 219 | Marathon Petroleum Corp. |
22,292 | ||||||||||
| 1,029 | Occidental Petroleum Corp. |
71,320 | ||||||||||
| 250 | Phillips 66 |
25,203 | ||||||||||
| 64 | Pioneer Natural Resources Co. |
17,788 | ||||||||||
| 164 | Valero Energy Corp. |
21,254 | ||||||||||
| 701,705 | ||||||||||||
Oil & Gas Services - 0.0% (b) |
||||||||||||
| 1,069 | Baker Hughes & GE Co., Class A |
38,463 | ||||||||||
See accompanying notes to financial statements.
20
Horizon Active Risk Assist® Fund |
Shares |
Value |
|||||||||||
| 1,703 | Halliburton Co. |
$ | 68,971 | |||||||||
| 451 | Schlumberger, Ltd. |
20,728 | ||||||||||
| 128,162 | ||||||||||||
Packaging & Containers - 0.0% (b) |
||||||||||||
| 4,254 | Amcor PLC |
55,728 | ||||||||||
| 429 | Packaging Corp of America |
67,473 | ||||||||||
| 1,890 | Sealed Air Corp. |
117,520 | ||||||||||
| 1,453 | Westrock Co. |
70,456 | ||||||||||
| 311,177 | ||||||||||||
Pharmaceuticals - 0.1% |
||||||||||||
| 1,206 | AbbVie, Inc. |
177,728 | ||||||||||
| 336 | AmerisourceBergen Corp. |
52,009 | ||||||||||
| 56 | Becton Dickinson & Co. |
14,325 | ||||||||||
| 1,351 | Bristol-Myers Squibb Co. |
101,933 | ||||||||||
| 1,256 | Cardinal Health, Inc. |
70,738 | ||||||||||
| 714 | CVS Health Corp. |
69,079 | ||||||||||
| 90 | DexCom, Inc. (a) |
26,815 | ||||||||||
| 606 | Eli Lilly & Co. |
189,945 | ||||||||||
| 1,113 | Henry Schein, Inc. (a) |
95,317 | ||||||||||
| 952 | Johnson & Johnson |
170,913 | ||||||||||
| 171 | McKesson Corp. |
56,206 | ||||||||||
| 2,921 | Pfizer, Inc. |
154,930 | ||||||||||
| 8,341 | Viatris, Inc. |
102,344 | ||||||||||
| 1,282,282 | ||||||||||||
Pipelines - 0.0% (b) |
||||||||||||
| 1,280 | Kinder Morgan, Inc. |
25,203 | ||||||||||
| 565 | ONEOK, Inc. |
37,205 | ||||||||||
| 682 | Williams Cos., Inc. |
25,275 | ||||||||||
| 87,683 | ||||||||||||
Professional, Scientific, and Technical Services - 0.0% (b) |
||||||||||||
| 368 | Charles River Laboratories International, Inc. (a) |
86,142 | ||||||||||
| 290 | EPAM Systems, Inc. (a) |
98,171 | ||||||||||
| 839 | Match Group, Inc. (a) |
66,096 | ||||||||||
| 250,409 | ||||||||||||
Real Estate - 0.0% (b) |
||||||||||||
| 496 | CBRE Group, Inc., Class A (a) |
41,089 | ||||||||||
Real Estate Investment Trusts - 0.1% |
||||||||||||
| 218 | Alexandria Real Estate Equities, Inc. |
36,177 | ||||||||||
| 170 | AvalonBay Communities, Inc. |
35,353 | ||||||||||
| 502 | Boston Properties, Inc. |
55,812 | ||||||||||
| 540 | Camden Property Trust |
77,484 | ||||||||||
| 76 | Crown Castle International Corp. |
14,413 | ||||||||||
See accompanying notes to financial statements.
21
Horizon Active Risk Assist® Fund |
Shares |
Value |
|||||||||||
| 202 | Digital Realty Trust, Inc. |
$ | 28,197 | |||||||||
| 1,062 | Duke Realty Corp. |
56,106 | ||||||||||
| 25 | Equinix, Inc. |
17,177 | ||||||||||
| 496 | Equity Residential |
38,108 | ||||||||||
| 175 | Essex Property Trust, Inc. |
49,674 | ||||||||||
| 347 | Extra Space Storage, Inc. |
61,835 | ||||||||||
| 1,046 | Federal Realty Investment Trust |
120,259 | ||||||||||
| 2,127 | Healthpeak Properties, Inc. |
63,151 | ||||||||||
| 4,280 | Host Hotels & Resorts, Inc. |
85,557 | ||||||||||
| 1,593 | Iron Mountain, Inc. |
85,863 | ||||||||||
| 3,610 | Kimco Realty Corp. |
85,377 | ||||||||||
| 276 | Mid-America Apartment Communities, Inc. |
49,956 | ||||||||||
| 494 | Prologis, Inc. |
62,975 | ||||||||||
| 190 | Public Storage |
62,822 | ||||||||||
| 413 | Realty Income Corp. |
28,175 | ||||||||||
| 1,343 | Regency Centers Corp. |
91,606 | ||||||||||
| 88 | SBA Communications Corp. |
29,622 | ||||||||||
| 219 | Simon Property Group, Inc. |
25,108 | ||||||||||
| 1,384 | UDR, Inc. |
66,155 | ||||||||||
| 862 | Ventas, Inc. |
48,910 | ||||||||||
| 4,376 | Vornado Realty Trust |
152,985 | ||||||||||
| 589 | Welltower, Inc. |
52,474 | ||||||||||
| 897 | Weyerhaeuser Co. |
35,449 | ||||||||||
| 1,616,780 | ||||||||||||
Retail - 0.1% |
||||||||||||
| 460 | Advance Auto Parts, Inc. |
87,336 | ||||||||||
| 29 | AutoZone, Inc. (a) |
59,730 | ||||||||||
| 572 | Best Buy Co., Inc. |
46,938 | ||||||||||
| 749 | CarMax, Inc. (a) |
74,353 | ||||||||||
| 20 | Chipotle Mexican Grill, Inc. (a) |
28,051 | ||||||||||
| 301 | Costco Wholesale Corp. |
140,332 | ||||||||||
| 511 | Darden Restaurants, Inc. |
63,875 | ||||||||||
| 192 | Dollar General Corp. |
42,305 | ||||||||||
| 362 | Dollar Tree, Inc. (a) |
58,039 | ||||||||||
| 254 | Domino’s Pizza, Inc. |
92,245 | ||||||||||
| 504 | Genuine Parts Co. |
68,912 | ||||||||||
| 194 | McDonald’s Corp. |
48,929 | ||||||||||
| 76 | O’Reilly Automotive, Inc. (a) |
48,425 | ||||||||||
| 341 | Ross Stores, Inc. |
28,992 | ||||||||||
| 116 | Target Corp. |
18,778 | ||||||||||
| 259 | TJX Cos., Inc. |
16,465 | ||||||||||
| 293 | Tractor Supply Co. |
54,896 | ||||||||||
| 175 | Ulta Beauty, Inc. (a) |
74,043 | ||||||||||
| 629 | Walgreens Boots Alliance, Inc. |
27,569 | ||||||||||
| 280 | Yum! Brands, Inc. |
34,012 | ||||||||||
| 1,114,225 | ||||||||||||
See accompanying notes to financial statements.
22
Horizon Active Risk Assist® Fund |
Shares |
Value |
|||||||||||
Retail Trade - 0.0% (b) |
||||||||||||
| 1,685 | Bath & Body Works, Inc. |
$ | 69,119 | |||||||||
| 1,110 | Etsy, Inc. (a) |
90,043 | ||||||||||
| 159,162 | ||||||||||||
Semiconductors - 0.1% |
||||||||||||
| 140 | Analog Devices, Inc. |
23,576 | ||||||||||
| 169 | Applied Materials, Inc. |
19,822 | ||||||||||
| 206 | Broadcom, Inc. |
119,507 | ||||||||||
| 3,448 | IPG Photonics Corp. (a) |
363,729 | ||||||||||
| 113 | KLA Corp. |
41,228 | ||||||||||
| 59 | Lam Research Corp. |
30,682 | ||||||||||
| 698 | Microchip Technology, Inc. |
50,710 | ||||||||||
| 329 | Micron Technology, Inc. |
24,293 | ||||||||||
| 766 | NVIDIA Corp. |
143,027 | ||||||||||
| 1,465 | Qorvo, Inc. (a) |
163,714 | ||||||||||
| 390 | QUALCOMM, Inc. |
55,856 | ||||||||||
| 1,022 | Skyworks Solutions, Inc. |
111,265 | ||||||||||
| 1,147,409 | ||||||||||||
Shipbuilding - 0.0% (b) |
||||||||||||
| 501 | Huntington Ingalls Industries, Inc. |
105,440 | ||||||||||
Software - 0.1% |
||||||||||||
| 1,344 | Akamai Technologies, Inc. (a) |
135,798 | ||||||||||
| 314 | ANSYS, Inc. (a) |
81,753 | ||||||||||
| 229 | Autodesk, Inc. (a) |
47,575 | ||||||||||
| 787 | Broadridge Financial Solutions, Inc. |
115,075 | ||||||||||
| 466 | Cadence Design Systems, Inc. (a) |
71,638 | ||||||||||
| 336 | Electronic Arts, Inc. |
46,586 | ||||||||||
| 313 | Fidelity National Information Services, Inc. |
32,709 | ||||||||||
| 309 | Fiserv, Inc. (a) |
30,956 | ||||||||||
| 42 | Intuit, Inc. |
17,407 | ||||||||||
| 837 | Jack Henry & Associates, Inc. |
157,456 | ||||||||||
| 80 | MSCI, Inc. |
35,388 | ||||||||||
| 613 | Paychex, Inc. |
75,908 | ||||||||||
| 359 | Paycom Software, Inc. (a) |
102,078 | ||||||||||
| 45 | ServiceNow, Inc. (a) |
21,036 | ||||||||||
| 241 | Synopsys, Inc. (a) |
76,927 | ||||||||||
| 876 | Take-Two Interactive Software, Inc. (a) |
109,088 | ||||||||||
| 336 | Tyler Technologies, Inc. (a) |
119,556 | ||||||||||
| 1,276,934 | ||||||||||||
Telecommunications - 0.0% (b) |
||||||||||||
| 800 | Arista Networks, Inc. (a) |
81,824 | ||||||||||
| 1,606 | Corning, Inc. |
57,527 | ||||||||||
See accompanying notes to financial statements.
23
Horizon Active Risk Assist® Fund |
Shares |
Value |
|||||||||||
| 6,161 | Juniper Networks, Inc. |
$ | 189,019 | |||||||||
| 348 | Motorola Solutions, Inc. |
76,470 | ||||||||||
| 303 | T-Mobile US, Inc. (a) |
40,387 | ||||||||||
| 445,227 | ||||||||||||
Textiles - 0.0% (b) |
||||||||||||
| 763 | Mohawk Industries, Inc. (a) |
107,934 | ||||||||||
Toys/Games/Hobbies - 0.0% (b) |
||||||||||||
| 907 | Hasbro, Inc. |
81,403 | ||||||||||
Transportation - 0.0% (b) |
||||||||||||
| 695 | CH Robinson Worldwide, Inc. |
75,414 | ||||||||||
| 457 | Expeditors International of Washington, Inc. |
49,740 | ||||||||||
| 81 | FedEx Corp. |
18,191 | ||||||||||
| 285 | JB Hunt Transport Services, Inc. |
49,185 | ||||||||||
| 60 | Norfolk Southern Corp. |
14,380 | ||||||||||
| 104 | Old Dominion Freight Line, Inc. |
26,857 | ||||||||||
| 233,767 | ||||||||||||
Utilities - 0.0% (b) |
||||||||||||
| 917 | Constellation Energy Corp. |
56,927 | ||||||||||
Water - 0.0% (b) |
||||||||||||
| 265 | American Water Works Co., Inc. |
40,081 | ||||||||||
Wholesale Trade - 0.0% (b) |
||||||||||||
| 167 | Pool Corp. |
66,570 | ||||||||||
TOTAL COMMON STOCKS (Cost - $29,218,919) |
29,127,634 | |||||||||||
Contracts |
Notional |
|||||||||||
PURCHASED OPTIONS - 0.3% (a)(c) |
||||||||||||
PURCHASED CALL OPTIONS - 0.3% |
||||||||||||
iShares China Large-Cap ETF |
||||||||||||
| 15,000 | Expiration: January 2023, Exercise Price: $35 |
$ | 47,790,000 | 2,745,000 | ||||||||
TOTAL PURCHASED CALL OPTIONS (Cost - $1,407,375) |
2,745,000 | |||||||||||
PURCHASED PUT OPTIONS - 0.0% (b) |
||||||||||||
CBOE Volatility Index (g) |
||||||||||||
| 5,000 | Expiration: July 2022, Exercise Price: $23 |
13,095,000 | 475,000 | |||||||||
TOTAL PURCHASED PUT OPTIONS (Cost - $1,276,625) |
475,000 | |||||||||||
TOTAL PURCHASED OPTIONS (Cost - $2,684,000) |
3,220,000 | |||||||||||
See accompanying notes to financial statements.
24
Horizon Active Risk Assist® Fund |
Shares |
Value |
|||||||||||
SHORT TERM INVESTMENTS - 3.8% |
||||||||||||
Money Market Funds - 3.8% |
||||||||||||
| 47,669,459 | First American Treasury Obligations Fund, Class X, 0.67% (d) |
$ | 47,669,459 | |||||||||
TOTAL SHORT TERM INVESTMENTS (Cost - $47,669,459) |
47,669,459 | |||||||||||
INVESTMENTS PURCHASED WITH PROCEEDS FROM SECURITIES LENDING - 15.1% |
||||||||||||
| 156,731,067 | First American Government Obligations Fund, Class X, 0.65% (d) |
188,066,349 | ||||||||||
TOTAL INVESTMENTS PURCHASED WITH PROCEEDS FROM SECURITIES LENDING (Cost - $188,066,349) |
188,066,349 | |||||||||||
TOTAL INVESTMENTS - 117.3% (Cost - $1,488,719,756) |
1,464,907,102 | |||||||||||
Liabilities in Excess of Other Assets - (17.3)% |
(215,743,254 | ) | ||||||||||
NET ASSETS - 100.0% |
$ | 1,249,163,848 | ||||||||||
Contracts |
Notional |
Value |
||||||||||
SCHEDULE OF WRITTEN OPTIONS - (0.1)% (a)(c) |
||||||||||||
WRITTEN CALL OPTIONS - (0.1)% |
||||||||||||
| 15,000 | iShares China Large-Cap ETF |
|||||||||||
Expiration: September 2022, Exercise Price $35 |
$ | 47,790,000 | 1,545,000 | |||||||||
TOTAL WRITTEN CALL OPTIONS (Premiums Received $655,125) |
1,545,000 | |||||||||||
WRITTEN PUT OPTIONS - (0.0)% (b) |
||||||||||||
| 10,000 | CBOE Volatility Index |
|||||||||||
Expiration: July 2022, Exercise Price $20 |
26,190,000 | 200,000 | ||||||||||
TOTAL WRITTEN PUT OPTIONS (Premiums Received $1,046,750) |
200,000 | |||||||||||
TOTAL OPTIONS WRITTEN (Premiums Received $1,701,875) |
$ | 1,745,000 | ||||||||||
Percentages are stated as a percent of net assets.
ADR - American Depositary Receipt
|
(a) |
Non-income producing security. |
|
(b) |
Rounds to less than 0.1% |
|
(c) |
Each option is exercisable into 100 shares of the underlying security. |
|
(d) |
Interest rate reflects seven-day yield on May 31, 2022. |
|
(e) |
All or a portion of the security is segregated as collateral for written options. The value of the securities segregated as collateral for written options is $43,677,200, which is 3.1% of total net assets. |
|
(f) |
All or a portion of this security is out on loan as of May 31, 2022. |
|
(g) |
Held in connection with a written option, see Schedule of Written Options for more details. |
|
(h) |
Fair value of this security exceeds 25% of the Fund’s net assets. Additional information for this security, including financial statements, is available from the SEC’s EDGAR database at www.sec.gov. |
See accompanying notes to financial statements.
25
Horizon Active Income Fund |
Shares |
Value |
|||||||||||
INVESTMENT COMPANIES - 99.1% |
||||||||||||
Exchange Traded Funds - 99.1% |
||||||||||||
| 1,325,049 | First Trust TCW Opportunistic Fixed Income ETF |
$ | 62,953,078 | |||||||||
| 753,640 | iShares 1-3 Year Treasury Bond ETF (c) |
62,815,894 | ||||||||||
| 367,444 | iShares 7-10 Year Treasury Bond ETF (c) |
37,964,314 | ||||||||||
| 407,125 | iShares Core U.S. Aggregate Bond ETF |
42,125,224 | ||||||||||
| 148,822 | iShares iBoxx Investment Grade Corporate Bond ETF (c) |
17,031,190 | ||||||||||
| 212,862 | iShares MBS ETF (c) |
21,109,525 | ||||||||||
| 436,138 | Janus Henderson Mortgage-Backed Securities ETF (c) |
21,244,238 | ||||||||||
| 92,269 | Overlay Shares Core Bond ETF |
2,070,784 | ||||||||||
| 752,823 | SPDR Bloomberg 1-3 Month T-Bill ETF (a) |
68,845,663 | ||||||||||
| 625,899 | SPDR Portfolio Long Term Treasury ETF (c) |
21,030,206 | ||||||||||
| 2,091,322 | SPDR Portfolio Short Term Corporate Bond ETF |
62,844,226 | ||||||||||
TOTAL INVESTMENT COMPANIES (Cost - $437,550,314) |
420,034,342 | |||||||||||
SHORT TERM INVESTMENTS - 0.9% |
||||||||||||
Money Market Funds - 0.9% |
||||||||||||
| 3,604,780 | First American Treasury Obligations Fund, Class X, 0.67% (b) |
3,604,780 | ||||||||||
TOTAL SHORT TERM INVESTMENTS (Cost - $3,604,780) |
3,604,780 | |||||||||||
INVESTMENTS PURCHASED WITH PROCEEDS FROM SECURITIES LENDING - 18.8% |
||||||||||||
| 66,491,628 | First American Government Obligations Fund, Class X, 0.65% (b) |
79,785,316 | ||||||||||
TOTAL INVESTMENTS PURCHASED WITH PROCEEDS FROM SECURITIES LENDING (Cost - $79,785,316) |
79,785,316 | |||||||||||
TOTAL INVESTMENTS - 118.8% (Cost - $520,940,410) |
503,424,438 | |||||||||||
Liabilities in Excess of Other Assets - (18.8)% |
(79,748,329 | ) | ||||||||||
NET ASSETS - 100.0% |
$ | 423,676,109 | ||||||||||
Percentages are stated as a percent of net assets.
|
(a) |
Non-income produceing security. |
|
(b) |
Interest rate reflects seven-day yield on May 31, 2022. |
|
(c) |
All or a portion of this security is out on loan as of May 31, 2022. |
See accompanying notes to financial statements.
26
Horizon Active Dividend Fund |
Shares |
Value |
|||||||||||
COMMON STOCKS - 97.7% |
||||||||||||
Aerospace/Defense - 2.5% |
||||||||||||
| 6,089 | Lockheed Martin Corp. |
$ | 2,679,830 | |||||||||
Beverages - 4.5% |
||||||||||||
| 42,260 | Coca-Cola Co. |
2,678,439 | ||||||||||
| 13,376 | PepsiCo, Inc. |
2,243,824 | ||||||||||
| 4,922,263 | ||||||||||||
Biotechnology - 1.1% |
||||||||||||
| 4,667 | Amgen, Inc. |
1,198,206 | ||||||||||
Chemicals - 1.4% |
||||||||||||
| 4,537 | Linde PLC |
1,473,073 | ||||||||||
Computers - 1.7% |
||||||||||||
| 6,279 | Accenture PLC, Class A |
1,874,030 | ||||||||||
Cosmetics/Personal Care - 4.3% |
||||||||||||
| 23,587 | Procter & Gamble Co. |
3,488,045 | ||||||||||
| 23,690 | Unilever PLC ADR |
1,144,938 | ||||||||||
| 4,632,983 | ||||||||||||
Diversified Financial Services - 4.4% |
||||||||||||
| 6,795 | American Express Co. |
1,147,132 | ||||||||||
| 2,705 | BlackRock, Inc. |
1,809,861 | ||||||||||
| 13,979 | Capital One Financial Corp. |
1,787,355 | ||||||||||
| 4,744,348 | ||||||||||||
Electronics - 1.1% |
||||||||||||
| 6,224 | Honeywell International, Inc. |
1,205,091 | ||||||||||
Finance and Insurance - 7.5% |
||||||||||||
| 23,761 | Ares Management Corp., Class A |
1,691,070 | ||||||||||
| 15,427 | Blackstone, Inc. |
1,817,146 | ||||||||||
| 13,096 | Reinsurance Group of America, Inc. |
1,648,132 | ||||||||||
| 16,044 | Toronto-Dominion Bank |
1,223,676 | ||||||||||
| 90,653 | UBS Group AG (a) |
1,710,622 | ||||||||||
| 8,090,646 | ||||||||||||
Healthcare Products - 2.9% |
||||||||||||
| 15,987 | Abbott Laboratories |
1,877,833 | ||||||||||
| 12,217 | Medtronic PLC |
1,223,533 | ||||||||||
| 3,101,366 | ||||||||||||
Home Builders - 1.6% |
||||||||||||
| 21,783 | Lennar Corp., Class A |
1,748,086 | ||||||||||
See accompanying notes to financial statements.
27
Horizon Active Dividend Fund |
Shares |
Value |
|||||||||||
Insurance - 1.5% |
||||||||||||
| 12,934 | Cincinnati Financial Corp. |
$ | 1,653,741 | |||||||||
Machinery - Construction & Mining - 1.0% |
||||||||||||
| 4,810 | Caterpillar, Inc. |
1,038,239 | ||||||||||
Manufacturing - 6.1% |
||||||||||||
| 5,330 | Diageo PLC (a) ADR |
996,550 | ||||||||||
| 28,088 | Equinor ASA ADR |
1,057,794 | ||||||||||
| 47,942 | Taiwan Semiconductor Manufacturing Co., Ltd. ADR |
4,568,873 | ||||||||||
| 6,623,217 | ||||||||||||
Media - 1.6% |
||||||||||||
| 40,272 | Comcast Corp., Class A |
1,783,244 | ||||||||||
Mining - 1.6% |
||||||||||||
| 27,565 | Southern Copper Corp. |
1,702,966 | ||||||||||
Mining, Quarrying, and Oil and Gas Extraction - 1.5% |
||||||||||||
| 77,324 | Barrick Gold Corp. |
1,584,369 | ||||||||||
Miscellaneous Manufacturing - 1.5% |
||||||||||||
| 6,120 | Parker-Hannifin Corp. |
1,665,680 | ||||||||||
Oil & Gas - 15.4% |
||||||||||||
| 18,682 | Chevron Corp. |
3,262,998 | ||||||||||
| 11,496 | ConocoPhillips |
1,291,690 | ||||||||||
| 22,962 | Devon Energy Corp. |
1,719,854 | ||||||||||
| 12,302 | Diamondback Energy, Inc. |
1,870,150 | ||||||||||
| 13,008 | EOG Resources, Inc. |
1,781,576 | ||||||||||
| 38,631 | Exxon Mobil Corp. |
3,708,576 | ||||||||||
| 5,970 | Pioneer Natural Resources Co. |
1,659,302 | ||||||||||
| 23,029 | Total SA ADR |
1,354,105 | ||||||||||
| 16,648,251 | ||||||||||||
Pharmaceuticals - 14.2% |
||||||||||||
| 16,187 | AbbVie, Inc. |
2,385,478 | ||||||||||
| 8,902 | Eli Lilly & Co. |
2,790,243 | ||||||||||
| 22,630 | GlaxoSmithKline PLC |
993,457 | ||||||||||
| 24,485 | Johnson & Johnson |
4,395,792 | ||||||||||
| 22,844 | Merck & Co., Inc. |
2,102,333 | ||||||||||
| 51,351 | Pfizer, Inc. |
2,723,657 | ||||||||||
| 15,390,960 | ||||||||||||
See accompanying notes to financial statements.
28
Horizon Active Dividend Fund |
Shares |
Value |
|||||||||||
Real Estate Investment Trusts - 1.5% |
||||||||||||
| 35,739 | Gaming and Leisure Properties, Inc. |
$ | 1,673,300 | |||||||||
Retail - 6.2% |
||||||||||||
| 8,197 | Advance Auto Parts, Inc. |
1,556,283 | ||||||||||
| 13,754 | Darden Restaurants, Inc. |
1,719,250 | ||||||||||
| 26,843 | Walmart, Inc. |
3,452,815 | ||||||||||
| 6,728,348 | ||||||||||||
Semiconductors - 6.7% |
||||||||||||
| 6,976 | Broadcom, Inc. |
4,046,987 | ||||||||||
| 38,040 | Intel Corp. |
1,689,737 | ||||||||||
| 8,397 | Texas Instruments, Inc. |
1,484,253 | ||||||||||
| 7,220,977 | ||||||||||||
Telecommunications - 1.8% |
||||||||||||
| 44,518 | Cisco Systems, Inc. |
2,005,536 | ||||||||||
Transportation - 2.6% |
||||||||||||
| 5,828 | Union Pacific Corp. |
1,280,878 | ||||||||||
| 8,326 | United Parcel Service, Inc., Class B |
1,517,413 | ||||||||||
| 2,798,291 | ||||||||||||
Wholesale Trade - 1.5% |
||||||||||||
| 6,506 | Watsco, Inc. |
1,663,129 | ||||||||||
TOTAL COMMON STOCKS (Cost - $100,885,993) |
105,850,170 | |||||||||||
See accompanying notes to financial statements.
29
Horizon Active Dividend Fund |
Shares |
Value |
|||||||||||
PREFERRED STOCKS - 0.2% |
||||||||||||
Manufacturing - 0.2% |
||||||||||||
| 9,473 | Pitney Bowes, Inc. |
$ | 205,753 | |||||||||
TOTAL PREFERRED STOCKS (Cost - $173,880) |
205,753 | |||||||||||
SHORT TERM INVESTMENTS - 1.9% |
||||||||||||
Money Market Funds - 1.9% |
||||||||||||
| 2,024,306 | First American Treasury Obligations Fund, Class X, 0.67% (b) |
2,024,306 | ||||||||||
TOTAL SHORT TERM INVESTMENTS (Cost - $2,024,306) |
2,024,306 | |||||||||||
INVESTMENTS PURCHASED WITH PROCEEDS |
||||||||||||
FROM SECURITIES LENDING - 2.5% |
||||||||||||
| 2,292,773 | First American Government Obligations Fund, Class X, 0.65% (b) |
2,751,168 | ||||||||||
TOTAL INVESTMENTS PURCHASED WITH PROCEEDS |
2,751,168 | |||||||||||
FROM SECURITIES LENDING (Cost - $2,751,168) |
||||||||||||
TOTAL INVESTMENTS - 102.3% (Cost - $105,835,347) |
110,831,397 | |||||||||||
Liabilities in Excess of Other Assets - (2.3)% |
(2,479,403 | ) | ||||||||||
NET ASSETS - 100.0% |
$ | 108,351,994 | ||||||||||
Percentages are stated as a percent of net assets.
ADR - American Depositary Receipt
|
(a) |
All or a portion of this security is out on loan as of May 31, 2022. |
|
(b) |
Interest rate reflects seven-day yield on May 31, 2022. |
See accompanying notes to financial statements.
30
Horizon Defined Risk Fund |
Shares |
Value |
|||||||||||
COMMON STOCKS - 93.2% |
||||||||||||
Accommodation and Food Services - 0.0% (b) |
||||||||||||
| 1,837 | Caesars Entertainment, Inc. (a) |
$ | 92,162 | |||||||||
| 1,323 | Penn National Gaming, Inc. (a) |
42,283 | ||||||||||
| 134,445 | ||||||||||||
Advertising - 0.1% |
||||||||||||
| 2,996 | Interpublic Group of Cos., Inc. |
96,561 | ||||||||||
| 1,560 | Omnicom Group, Inc. |
116,392 | ||||||||||
| 212,953 | ||||||||||||
Aerospace/Defense - 1.1% |
||||||||||||
| 4,562 | Boeing Co. (a) |
599,447 | ||||||||||
| 1,803 | General Dynamics Corp. |
405,513 | ||||||||||
| 3,058 | Howmet Aerospace, Inc. |
109,384 | ||||||||||
| 1,498 | L3Harris Technologies, Inc. |
360,868 | ||||||||||
| 1,871 | Lockheed Martin Corp. (f) |
823,446 | ||||||||||
| 1,137 | Northrop Grumman Corp. (f) |
532,082 | ||||||||||
| 355 | Teledyne Technologies, Inc. (a) |
143,828 | ||||||||||
| 424 | TransDigm Group, Inc. (a) |
256,677 | ||||||||||
| 3,231,245 | ||||||||||||
Agriculture - 0.8% |
||||||||||||
| 13,977 | Altria Group, Inc. (f) |
756,016 | ||||||||||
| 4,398 | Archer Daniels Midland Co. |
399,426 | ||||||||||
| 11,517 | Philip Morris International, Inc. (f) |
1,223,681 | ||||||||||
| 2,379,123 | ||||||||||||
Airlines - 0.2% |
||||||||||||
| 991 | Alaska Air Group, Inc. (a) |
47,826 | ||||||||||
| 5,277 | American Airlines Group, Inc. (a) |
94,300 | ||||||||||
| 5,098 | Delta Air Lines, Inc. (a) |
212,535 | ||||||||||
| 4,638 | Southwest Airlines Co. (a) |
212,699 | ||||||||||
| 2,651 | United Airlines Holdings, Inc. (a) |
126,267 | ||||||||||
| 693,627 | ||||||||||||
Apparel - 0.5% |
||||||||||||
| 9,849 | Nike, Inc. |
1,170,554 | ||||||||||
| 551 | PVH Corp. |
39,049 | ||||||||||
| 385 | Ralph Lauren Corp., Class A |
38,920 | ||||||||||
| 2,094 | Tapestry, Inc. |
72,243 | ||||||||||
| 1,512 | Under Armour, Inc., Class A (a) |
15,997 | ||||||||||
| 1,637 | Under Armour, Inc., Class C (a) |
15,879 | ||||||||||
| 2,427 | VF Corp. |
122,466 | ||||||||||
| 1,475,108 | ||||||||||||
Auto Manufacturers - 0.4% |
||||||||||||
| 1,075 | Cummins, Inc. |
224,804 | ||||||||||
| 31,162 | Ford Motor Co. (f) |
426,296 | ||||||||||
See accompanying notes to financial statements.
31
Horizon Defined Risk Fund |
Shares |
Value |
|||||||||||
| 11,208 | General Motors Co. (a)(f) |
$ | 433,526 | |||||||||
| 2,585 | PACCAR, Inc. |
224,481 | ||||||||||
| 1,309,107 | ||||||||||||
Auto Parts & Equipment - 0.1% |
||||||||||||
| 2,167 | Aptiv PLC (a) |
230,222 | ||||||||||
| 1,837 | BorgWarner, Inc. |
74,068 | ||||||||||
| 304,290 | ||||||||||||
Banks - 4.2% |
||||||||||||
| 54,885 | Bank of America Corp. |
2,041,722 | ||||||||||
| 5,627 | Bank of New York Mellon Corp. |
262,274 | ||||||||||
| 15,357 | Citigroup, Inc. |
820,217 | ||||||||||
| 3,789 | Citizens Financial Group, Inc. |
156,789 | ||||||||||
| 1,028 | Comerica, Inc. |
85,540 | ||||||||||
| 5,225 | Fifth Third Bancorp |
206,022 | ||||||||||
| 1,335 | First Republic Bank |
206,965 | ||||||||||
| 2,561 | Goldman Sachs Group, Inc. (f) |
837,063 | ||||||||||
| 10,999 | Huntington Bancshares, Inc. |
152,666 | ||||||||||
| 22,465 | JPMorgan Chase & Co. |
2,970,547 | ||||||||||
| 7,086 | KeyCorp |
141,437 | ||||||||||
| 1,349 | M&T Bank Corp. |
242,780 | ||||||||||
| 11,036 | Morgan Stanley |
950,641 | ||||||||||
| 1,581 | Northern Trust Corp. |
176,677 | ||||||||||
| 3,215 | PNC Financial Services Group, Inc. (f) |
563,943 | ||||||||||
| 7,343 | Regions Financial Corp. |
162,207 | ||||||||||
| 2,760 | State Street Corp. |
200,072 | ||||||||||
| 464 | SVB Financial Group (a) |
226,696 | ||||||||||
| 10,059 | Truist Financial Corp. (f) |
500,335 | ||||||||||
| 29,514 | Wells Fargo & Co. |
1,350,856 | ||||||||||
| 1,157 | Zions Bancorp NA |
65,995 | ||||||||||
| 12,321,444 | ||||||||||||
Beverages - 1.5% |
||||||||||||
| 1,379 | Brown-Forman Corp. |
91,179 | ||||||||||
| 29,289 | Coca-Cola Co. |
1,856,337 | ||||||||||
| 1,234 | Constellation Brands, Inc., Class A |
302,910 | ||||||||||
| 1,419 | Molson Coors Brewing Co. |
79,237 | ||||||||||
| 2,928 | Monster Beverage Corp. (a) |
260,943 | ||||||||||
| 10,377 | PepsiCo, Inc. |
1,740,742 | ||||||||||
| 4,331,348 | ||||||||||||
Biotechnology - 1.3% |
||||||||||||
| 4,189 | Amgen, Inc. |
1,075,484 | ||||||||||
| 1,134 | Biogen, Inc. (a) |
226,800 | ||||||||||
| 168 | Bio-Rad Laboratories, Inc. (a) |
90,349 | ||||||||||
| 5,759 | Corteva, Inc. |
360,629 | ||||||||||
| 9,369 | Gilead Sciences, Inc. (f) |
607,580 | ||||||||||
See accompanying notes to financial statements.
32
Horizon Defined Risk Fund |
Shares |
Value |
|||||||||||
| 1,324 | Illumina, Inc. (a)(f) |
$ | 317,071 | |||||||||
| 1,453 | Incyte Corp. (a) |
110,268 | ||||||||||
| 839 | Regeneron Pharmaceuticals, Inc. (a)(f) |
557,717 | ||||||||||
| 2,073 | Vertex Pharmaceuticals, Inc. (a) |
556,911 | ||||||||||
| 3,902,809 | ||||||||||||
Building Materials - 0.4% |
||||||||||||
| 6,354 | Carrier Global Corp. |
249,776 | ||||||||||
| 1,029 | Fortune Brands Home & Security, Inc. |
71,361 | ||||||||||
| 5,380 | Johnson Controls International PLC (f) |
293,264 | ||||||||||
| 487 | Martin Marietta Materials, Inc. |
165,278 | ||||||||||
| 1,802 | Masco Corp. |
102,155 | ||||||||||
| 1,025 | Vulcan Materials Co. |
168,992 | ||||||||||
| 1,050,826 | ||||||||||||
Chemicals - 1.5% |
||||||||||||
| 1,666 | Air Products & Chemicals, Inc. (f) |
410,103 | ||||||||||
| 952 | Albemarle Corp. |
247,920 | ||||||||||
| 838 | Celanese Corp. |
131,164 | ||||||||||
| 1,787 | CF Industries Holdings, Inc. |
176,502 | ||||||||||
| 5,623 | Dow, Inc. |
382,252 | ||||||||||
| 3,919 | DuPont de Nemours, Inc. |
265,904 | ||||||||||
| 982 | Eastman Chemical Co. |
108,177 | ||||||||||
| 1,011 | FMC Corp. |
123,928 | ||||||||||
| 1,947 | International Flavors & Fragrances, Inc. |
257,335 | ||||||||||
| 3,948 | Linde PLC (f) |
1,281,837 | ||||||||||
| 2,030 | LyondellBasell Industries NV, Class A |
231,927 | ||||||||||
| 3,173 | Mosaic Co. |
198,788 | ||||||||||
| 1,786 | PPG Industries, Inc. |
225,911 | ||||||||||
| 1,779 | Sherwin-Williams Co. (f) |
476,843 | ||||||||||
| 4,518,591 | ||||||||||||
Commercial Services - 1.7% |
||||||||||||
| 3,272 | Automatic Data Processing, Inc. (f) |
729,460 | ||||||||||
| 680 | Cintas Corp. |
270,865 | ||||||||||
| 1,879 | Ecolab, Inc. (f) |
307,987 | ||||||||||
| 932 | Equifax, Inc. |
188,805 | ||||||||||
| 626 | FleetCor Technologies, Inc. (a) |
155,755 | ||||||||||
| 655 | Gartner, Inc. (a) |
171,872 | ||||||||||
| 2,180 | Global Payments, Inc. |
285,667 | ||||||||||
| 296 | MarketAxess Holdings, Inc. |
83,377 | ||||||||||
| 1,267 | Moody’s Corp. (f) |
382,089 | ||||||||||
| 2,754 | Nielsen Holdings PLC |
70,392 | ||||||||||
| 8,989 | PayPal Holdings, Inc. (a) |
765,953 | ||||||||||
| 1,140 | Quanta Services, Inc. |
135,660 | ||||||||||
| 853 | Robert Half International, Inc. |
76,898 | ||||||||||
| 1,706 | Rollins, Inc. |
60,495 | ||||||||||
See accompanying notes to financial statements.
33
Horizon Defined Risk Fund |
Shares |
Value |
|||||||||||
| 2,777 | S&P Global, Inc. |
$ | 970,506 | |||||||||
| 552 | United Rentals, Inc. (a) |
164,595 | ||||||||||
| 1,270 | Verisk Analytics, Inc. |
222,148 | ||||||||||
| 5,042,524 | ||||||||||||
Computers - 7.5% |
||||||||||||
| 4,878 | Accenture PLC, Class A (f) |
1,455,888 | ||||||||||
| 121,200 | Apple, Inc. (f) |
18,039,408 | ||||||||||
| 3,890 | Cognizant Technology Solutions Corp., Class A |
290,583 | ||||||||||
| 1,942 | DXC Technology Co. (a) |
68,397 | ||||||||||
| 1,111 | Fortinet, Inc. (a) |
326,790 | ||||||||||
| 9,763 | Hewlett Packard Enterprise Co. |
152,303 | ||||||||||
| 8,173 | HP, Inc. |
317,439 | ||||||||||
| 6,886 | International Business Machines Corp. (f) |
956,052 | ||||||||||
| 1,079 | Leidos Holdings, Inc. |
112,755 | ||||||||||
| 1,734 | NetApp, Inc. |
124,761 | ||||||||||
| 2,469 | Western Digital Corp. (a) |
149,844 | ||||||||||
| 21,994,220 | ||||||||||||
Cosmetics/Personal Care - 1.2% |
||||||||||||
| 6,241 | Colgate-Palmolive Co. (f) |
491,853 | ||||||||||
| 1,790 | Estee Lauder Cos., Inc., Class A (f) |
455,824 | ||||||||||
| 18,093 | Procter & Gamble Co. |
2,675,593 | ||||||||||
| 3,623,270 | ||||||||||||
Distribution/Wholesale - 0.2% |
||||||||||||
| 1,623 | Copart, Inc. (a) |
185,882 | ||||||||||
| 4,301 | Fastenal Co. |
230,362 | ||||||||||
| 2,043 | LKQ Corp. |
104,990 | ||||||||||
| 331 | WW Grainger, Inc. |
161,220 | ||||||||||
| 682,454 | ||||||||||||
Diversified Financial Services - 3.6% |
||||||||||||
| 4,779 | American Express Co. (f) |
806,791 | ||||||||||
| 855 | Ameriprise Financial, Inc. |
236,211 | ||||||||||
| 1,106 | BlackRock, Inc. (f) |
740,003 | ||||||||||
| 3,190 | Capital One Financial Corp. (f) |
407,873 | ||||||||||
| 832 | CBOE Global Markets, Inc. |
93,442 | ||||||||||
| 11,841 | Charles Schwab Corp. (f) |
830,054 | ||||||||||
| 2,830 | CME Group, Inc. (f) |
562,689 | ||||||||||
| 2,226 | Discover Financial Services |
252,629 | ||||||||||
| 2,104 | Franklin Resources, Inc. |
56,976 | ||||||||||
| 4,337 | Intercontinental Exchange, Inc. (f) |
444,065 | ||||||||||
| 2,655 | Invesco, Ltd. |
51,348 | ||||||||||
| 6,859 | MasterCard, Inc. |
2,454,630 | ||||||||||
| 917 | Nasdaq, Inc. |
142,373 | ||||||||||
See accompanying notes to financial statements.
34
Horizon Defined Risk Fund |
Shares |
Value |
|||||||||||
| 1,453 | Raymond James Financial, Inc. |
$ | 143,106 | |||||||||
| 4,004 | Synchrony Financial |
148,308 | ||||||||||
| 1,783 | T. Rowe Price Group, Inc. |
226,602 | ||||||||||
| 13,070 | Visa, Inc. |
2,773,062 | ||||||||||
| 10,370,162 | ||||||||||||
Electric - 2.5% |
||||||||||||
| 5,187 | AES Corp. |
114,322 | ||||||||||
| 1,881 | Alliant Energy Corp. |
120,045 | ||||||||||
| 1,924 | Ameren Corp. |
183,146 | ||||||||||
| 3,793 | American Electric Power Co., Inc. |
387,000 | ||||||||||
| 4,731 | CenterPoint Energy, Inc. |
151,629 | ||||||||||
| 2,123 | CMS Energy Corp. |
150,818 | ||||||||||
| 2,631 | Consolidated Edison, Inc. |
261,153 | ||||||||||
| 6,087 | Dominion Energy, Inc. (f) |
512,647 | ||||||||||
| 1,454 | DTE Energy Co. |
192,960 | ||||||||||
| 5,779 | Duke Energy Corp. (f) |
650,253 | ||||||||||
| 2,834 | Edison International |
198,125 | ||||||||||
| 1,513 | Entergy Corp. |
182,044 | ||||||||||
| 1,734 | Evergy, Inc. |
121,276 | ||||||||||
| 2,570 | Eversource Energy |
237,262 | ||||||||||
| 7,430 | Exelon Corp. |
365,185 | ||||||||||
| 4,341 | FirstEnergy Corp. |
186,489 | ||||||||||
| 15,104 | NextEra Energy, Inc. (f) |
1,143,222 | ||||||||||
| 1,838 | NRG Energy, Inc. |
84,622 | ||||||||||
| 845 | Pinnacle West Capital Corp. |
65,614 | ||||||||||
| 5,815 | PPL Corp. |
175,497 | ||||||||||
| 3,784 | Public Service Enterprise Group, Inc. |
259,355 | ||||||||||
| 2,433 | Sempra Energy |
398,671 | ||||||||||
| 7,993 | Southern Co. (f) |
604,750 | ||||||||||
| 2,345 | WEC Energy Group, Inc. |
246,389 | ||||||||||
| 4,002 | Xcel Energy, Inc. |
301,511 | ||||||||||
| 7,293,985 | ||||||||||||
Electrical Components & Equipment - 0.2% |
||||||||||||
| 1,740 | AMETEK, Inc. |
211,358 | ||||||||||
| 4,641 | Emerson Electric Co. (f) |
411,471 | ||||||||||
| 622,829 | ||||||||||||
Electronics - 1.2% |
||||||||||||
| 2,425 | Agilent Technologies, Inc. |
309,333 | ||||||||||
| 665 | Allegion PLC |
74,247 | ||||||||||
| 4,536 | Amphenol Corp., Class A |
321,421 | ||||||||||
| 2,726 | Fortive Corp. |
168,385 | ||||||||||
| 1,170 | Garmin, Ltd. |
123,575 | ||||||||||
| 5,209 | Honeywell International, Inc. (f) |
1,008,567 | ||||||||||
See accompanying notes to financial statements.
35
Horizon Defined Risk Fund |
Shares |
Value |
|||||||||||
| 1,444 | Keysight Technologies, Inc. (a) |
$ | 210,246 | |||||||||
| 190 | Mettler-Toledo International, Inc. (a) |
244,363 | ||||||||||
| 974 | PerkinElmer, Inc. |
145,779 | ||||||||||
| 799 | Roper Technologies, Inc. |
353,510 | ||||||||||
| 2,523 | TE Connectivity, Ltd. |
326,451 | ||||||||||
| 479 | Waters Corp. (a) |
157,088 | ||||||||||
| 3,442,965 | ||||||||||||
Engineering & Construction - 0.0% (b) |
||||||||||||
| 1,022 | Jacobs Engineering Group, Inc. |
143,172 | ||||||||||
Entertainment - 0.0% (b) |
||||||||||||
| 1,103 | Live Nation Entertainment, Inc. (a) |
104,840 | ||||||||||
Environmental Control - 0.3% |
||||||||||||
| 1,222 | Pentair PLC |
61,308 | ||||||||||
| 1,620 | Republic Services, Inc. |
216,821 | ||||||||||
| 2,921 | Waste Management, Inc. (f) |
463,007 | ||||||||||
| 741,136 | ||||||||||||
Finance and Insurance - 0.3% |
||||||||||||
| 1,804 | Brown & Brown, Inc. |
107,104 | ||||||||||
| 504 | Signature Bank/New York NY |
109,000 | ||||||||||
| 10,074 | US Bancorp |
534,627 | ||||||||||
| 750,731 | ||||||||||||
Food - 1.0% |
||||||||||||
| 1,482 | Campbell Soup Co. |
71,003 | ||||||||||
| 3,554 | Conagra Brands, Inc. |
116,891 | ||||||||||
| 4,443 | General Mills, Inc. |
310,343 | ||||||||||
| 1,108 | Hershey Co. |
234,575 | ||||||||||
| 2,100 | Hormel Foods Corp. |
102,207 | ||||||||||
| 798 | J.M. Smucker Co. |
100,045 | ||||||||||
| 1,866 | Kellogg Co. |
130,135 | ||||||||||
| 5,244 | Kraft Heinz Co. |
198,380 | ||||||||||
| 4,948 | Kroger Co. |
262,096 | ||||||||||
| 1,093 | Lamb Weston Holdings, Inc. |
73,865 | ||||||||||
| 1,839 | McCormick & Co., Inc. |
170,512 | ||||||||||
| 10,401 | Mondelez International, Inc., Class A (f) |
661,088 | ||||||||||
| 3,924 | Sysco Corp. |
330,322 | ||||||||||
| 2,190 | Tyson Foods, Inc., Class A |
196,246 | ||||||||||
| 2,957,708 | ||||||||||||
Forest Products & Paper - 0.1% |
||||||||||||
| 2,946 | International Paper Co. |
142,734 | ||||||||||
See accompanying notes to financial statements.
36
Horizon Defined Risk Fund |
Shares |
Value |
|||||||||||
Gas - 0.1% |
||||||||||||
| 1,037 | Atmos Energy Corp. |
$ | 120,614 | |||||||||
| 2,927 | NiSource, Inc. |
92,054 | ||||||||||
| 212,668 | ||||||||||||
Hand/Machine Tools - 0.1% |
||||||||||||
| 408 | Snap-on, Inc. |
90,527 | ||||||||||
| 1,163 | Stanley Black & Decker, Inc. |
138,036 | ||||||||||
| 228,563 | ||||||||||||
Health Care and Social Assistance - 0.1% |
||||||||||||
| 459 | Molina Healthcare, Inc. (a) |
133,211 | ||||||||||
Healthcare Products - 3.5% |
||||||||||||
| 13,883 | Abbott Laboratories |
1,630,697 | ||||||||||
| 374 | ABIOMED, Inc. (a) |
98,624 | ||||||||||
| 579 | Align Technology, Inc. (a) |
160,754 | ||||||||||
| 3,702 | Baxter International, Inc. |
281,537 | ||||||||||
| 11,388 | Boston Scientific Corp. (a)(f) |
467,022 | ||||||||||
| 402 | Cooper Cos., Inc. |
140,998 | ||||||||||
| 4,982 | Danaher Corp. (f) |
1,314,351 | ||||||||||
| 1,681 | Dentsply Sirona, Inc. |
66,500 | ||||||||||
| 4,977 | Edwards Lifesciences Corp. (a)(f) |
501,930 | ||||||||||
| 1,967 | Hologic, Inc. (a) |
148,056 | ||||||||||
| 678 | IDEXX Laboratories, Inc. (a)(f) |
265,518 | ||||||||||
| 2,928 | Intuitive Surgical, Inc. (a)(f) |
666,530 | ||||||||||
| 10,491 | Medtronic PLC |
1,050,674 | ||||||||||
| 1,159 | ResMed, Inc. |
235,810 | ||||||||||
| 795 | STERIS PLC |
181,419 | ||||||||||
| 2,632 | Stryker Corp. (f) |
617,204 | ||||||||||
| 364 | Teleflex, Inc. |
104,737 | ||||||||||
| 3,119 | Thermo Fisher Scientific, Inc. (f) |
1,770,251 | ||||||||||
| 572 | West Pharmaceutical Services, Inc. |
177,537 | ||||||||||
| 1,637 | Zimmer Biomet Holdings, Inc. |
196,784 | ||||||||||
| 10,076,933 | ||||||||||||
Healthcare Services - 2.2% |
||||||||||||
| 1,877 | Anthem, Inc. (f) |
956,538 | ||||||||||
| 4,627 | Centene Corp. (a) |
376,823 | ||||||||||
| 451 | DaVita, Inc. (a) |
43,968 | ||||||||||
| 1,816 | HCA Healthcare, Inc. (f) |
382,087 | ||||||||||
| 979 | Humana, Inc. (f) |
444,691 | ||||||||||
| 1,501 | IQVIA Holdings, Inc. (a) |
323,090 | ||||||||||
| 729 | Laboratory Corp. of America Holdings |
179,859 | ||||||||||
| 910 | Quest Diagnostics, Inc. |
128,328 | ||||||||||
| 7,281 | UnitedHealth Group, Inc. |
3,617,055 | ||||||||||
See accompanying notes to financial statements.
37
Horizon Defined Risk Fund |
Shares |
Value |
|||||||||||
| 564 | Universal Health Services, Inc., Class B |
$ | 70,280 | |||||||||
| 6,522,719 | ||||||||||||
Home Builders - 0.2% |
||||||||||||
| 2,439 | DR Horton, Inc. |
183,291 | ||||||||||
| 1,986 | Lennar Corp., Class A |
159,376 | ||||||||||
| 20 | NVR, Inc. (a) |
89,012 | ||||||||||
| 1,902 | PulteGroup, Inc. |
86,085 | ||||||||||
| 517,764 | ||||||||||||
Home Furnishings - 0.0% (b) |
||||||||||||
| 447 | Whirlpool Corp. |
82,355 | ||||||||||
Household Products/Wares - 0.3% |
||||||||||||
| 621 | Avery Dennison Corp. |
107,160 | ||||||||||
| 1,789 | Church & Dwight Co., Inc. |
161,117 | ||||||||||
| 896 | Clorox Co. |
130,243 | ||||||||||
| 2,457 | Kimberly-Clark Corp. |
326,830 | ||||||||||
| 725,350 | ||||||||||||
Housewares - 0.0% (b) |
||||||||||||
| 2,598 | Newell Brands, Inc. |
55,701 | ||||||||||
Information - 0.2% |
||||||||||||
| 1,045 | Ceridian HCM Holding, Inc. (a) |
58,834 | ||||||||||
| 294 | FactSet Research Systems, Inc. |
112,243 | ||||||||||
| 6,810 | Lumen Technologies, Inc. (d) |
83,354 | ||||||||||
| 814 | PTC, Inc. (a) |
94,856 | ||||||||||
| 17,309 | Warner Bros Discovery, Inc. (a) |
319,351 | ||||||||||
| 668,638 | ||||||||||||
Insurance - 3.5% |
||||||||||||
| 4,543 | Aflac, Inc. |
275,170 | ||||||||||
| 2,134 | Allstate Corp. |
291,697 | ||||||||||
| 6,491 | American International Group, Inc. |
380,892 | ||||||||||
| 1,676 | Aon PLC (f) |
462,023 | ||||||||||
| 1,600 | Arthur J Gallagher & Co. |
259,104 | ||||||||||
| 448 | Assurant, Inc. |
79,157 | ||||||||||
| 14,030 | Berkshire Hathaway, Inc., Class B (a) |
4,433,199 | ||||||||||
| 3,283 | Chubb Ltd. (f) |
693,665 | ||||||||||
| 1,138 | Cincinnati Financial Corp. |
145,505 | ||||||||||
| 306 | Everest Re Group Ltd. |
86,445 | ||||||||||
| 718 | Globe Life, Inc. |
70,055 | ||||||||||
| 2,544 | Hartford Financial Services Group, Inc. |
184,465 | ||||||||||
| 1,310 | Lincoln National Corp. |
75,888 | ||||||||||
| 1,490 | Loews Corp. |
97,580 | ||||||||||
| 3,892 | Marsh & McLennan Cos., Inc. (f) |
622,525 | ||||||||||
See accompanying notes to financial statements.
38
Horizon Defined Risk Fund |
Shares |
Value |
|||||||||||
| 5,411 | MetLife, Inc. |
$ | 364,647 | |||||||||
| 1,869 | Principal Financial Group, Inc. |
136,306 | ||||||||||
| 4,402 | Progressive Corp. (f) |
525,511 | ||||||||||
| 2,855 | Prudential Financial, Inc. |
303,344 | ||||||||||
| 1,812 | Travelers Cos., Inc. |
324,421 | ||||||||||
| 937 | Willis Towers Watson PLC |
197,773 | ||||||||||
| 1,594 | WR Berkley Corp. |
113,381 | ||||||||||
| 10,122,753 | ||||||||||||
Internet - 6.8% |
||||||||||||
| 2,335 | Alphabet, Inc., Class A (a)(f) |
5,312,685 | ||||||||||
| 3,490 | Amazon.com, Inc. (a)(f) |
8,390,623 | ||||||||||
| 335 | Booking Holdings, Inc. (a)(f) |
751,593 | ||||||||||
| 1,054 | CDW Corp. |
179,032 | ||||||||||
| 4,592 | eBay, Inc. |
223,493 | ||||||||||
| 1,180 | Expedia Group, Inc. (a) |
152,609 | ||||||||||
| 458 | F5 Networks, Inc. (a) |
74,672 | ||||||||||
| 18,064 | Facebook, Inc., Class A (a)(f) |
3,497,913 | ||||||||||
| 3,513 | Netflix, Inc. (a)(f) |
693,607 | ||||||||||
| 4,412 | NortonLifeLock, Inc. |
107,388 | ||||||||||
| 6,241 | Twitter, Inc. (a)(f) |
247,144 | ||||||||||
| 761 | VeriSign, Inc. (a) |
132,833 | ||||||||||
| 19,763,592 | ||||||||||||
Iron/Steel - 0.1% |
||||||||||||
| 2,146 | Nucor Corp. |
284,259 | ||||||||||
Leisure Time - 0.1% |
||||||||||||
| 6,621 | Carnival Corp. (a) |
91,899 | ||||||||||
| 3,559 | Norwegian Cruise Line Holdings, Ltd. (a)(d) |
56,980 | ||||||||||
| 1,900 | Royal Caribbean Cruises, Ltd. (a) |
110,333 | ||||||||||
| 259,212 | ||||||||||||
Lodging - 0.3% |
||||||||||||
| 2,244 | Hilton Worldwide Holdings, Inc. |
316,090 | ||||||||||
| 2,807 | Las Vegas Sands Corp. (a) |
99,536 | ||||||||||
| 2,181 | Marriott International, Inc. |
374,216 | ||||||||||
| 3,045 | MGM Resorts International |
106,483 | ||||||||||
| 857 | Wynn Resorts, Ltd. (a) |
56,648 | ||||||||||
| 952,973 | ||||||||||||
Machinery - Construction & Mining - 0.3% |
||||||||||||
| 4,224 | Caterpillar, Inc. (f) |
911,750 | ||||||||||
Machinery - Diversified - 0.6% |
||||||||||||
| 2,188 | Deere & Co. (f) |
782,823 | ||||||||||
| 1,091 | Dover Corp. |
146,096 | ||||||||||
See accompanying notes to financial statements.
39
Horizon Defined Risk Fund |
Shares |
Value |
|||||||||||
| 566 | IDEX Corp. |
$ | 108,417 | |||||||||
| 3,083 | Ingersoll Rand, Inc. |
145,363 | ||||||||||
| 3,244 | Otis Worldwide Corp. |
241,353 | ||||||||||
| 908 | Rockwell Automation, Inc. |
193,586 | ||||||||||
| 1,465 | Wabtec Corp. |
138,384 | ||||||||||
| 1,347 | Xylem, Inc. |
113,485 | ||||||||||
| 1,869,507 | ||||||||||||
Manufacturing - 4.9% |
||||||||||||
| 2,143 | Alphabet, Inc. - Class C (a)(f) |
4,887,712 | ||||||||||
| 307 | Bio-Techne Corp. |
113,507 | ||||||||||
| 1,438 | Catalent, Inc. (a) |
148,200 | ||||||||||
| 1,143 | Enphase Energy, Inc. (a) |
212,815 | ||||||||||
| 502 | Generac Holdings, Inc. (a) |
124,034 | ||||||||||
| 8,846 | General Electric Co. (f) |
692,553 | ||||||||||
| 2,626 | Moderna, Inc. (a)(f) |
381,637 | ||||||||||
| 355 | Monolithic Power Systems, Inc. |
159,888 | ||||||||||
| 414 | Nordson Corp. |
90,202 | ||||||||||
| 2,073 | NXP Semiconductors NV (f) |
393,373 | ||||||||||
| 1,891 | Organon & Co. |
71,782 | ||||||||||
| 11,641 | Raytheon Technologies Corp. (f) |
1,107,292 | ||||||||||
| 1,542 | Seagate Technology Holdings PLC |
130,561 | ||||||||||
| 450 | SolarEdge Technologies, Inc. (a) |
122,756 | ||||||||||
| 1,288 | Teradyne, Inc. |
140,727 | ||||||||||
| 6,923 | Tesla, Inc. (a)(f) |
5,249,434 | ||||||||||
| 1,942 | Trimble, Inc. (a) |
132,153 | ||||||||||
| 14,158,626 | ||||||||||||
Media - 1.4% |
||||||||||||
| 891 | Charter Communications, Inc., Class A (a) |
451,675 | ||||||||||
| 34,341 | Comcast Corp. |
1,520,619 | ||||||||||
| 1,977 | DISH Network Corp., Class A (a) |
45,135 | ||||||||||
| 2,541 | Fox Corp. |
90,231 | ||||||||||
| 1,208 | Fox Corp. |
39,514 | ||||||||||
| 2,868 | News Corp., Class A |
49,903 | ||||||||||
| 900 | News Corp., Class B |
15,822 | ||||||||||
| 4,614 | ViacomCBS, Inc., Class B |
158,398 | ||||||||||
| 14,072 | Walt Disney Co. (a) |
1,554,112 | ||||||||||
| 3,925,409 | ||||||||||||
Mining - 0.3% |
||||||||||||
| 11,694 | Freeport-McMoRan, Inc. |
457,002 | ||||||||||
| 6,285 | Newmont Goldcorp Corp. |
426,437 | ||||||||||
| 883,439 | ||||||||||||
See accompanying notes to financial statements.
40
Horizon Defined Risk Fund |
Shares |
Value |
|||||||||||
Mining, Quarrying, and Oil and Gas Extraction - 0.1% |
||||||||||||
| 3,231 | APA Corp. |
$ | 151,889 | |||||||||
Miscellaneous Manufacturing - 0.7% |
||||||||||||
| 4,207 | 3M Co. |
628,063 | ||||||||||
| 1,005 | AO Smith Corp. |
60,421 | ||||||||||
| 2,973 | Eaton Corp PLC (f) |
412,058 | ||||||||||
| 2,147 | Illinois Tool Works, Inc. |
446,726 | ||||||||||
| 959 | Parker-Hannifin Corp. |
261,011 | ||||||||||
| 1,749 | Textron, Inc. |
114,192 | ||||||||||
| 1,745 | Trane Technologies PLC |
240,915 | ||||||||||
| 2,163,386 | ||||||||||||
Office/Business Equipment - 0.1% |
||||||||||||
| 413 | Zebra Technologies Corp., Class A (a) |
139,672 | ||||||||||
Oil & Gas - 4.0% |
||||||||||||
| 6,811 | Cabot Oil & Gas Corp. |
233,822 | ||||||||||
| 15,525 | Chevron Corp. |
2,711,597 | ||||||||||
| 10,833 | ConocoPhillips (f) |
1,217,196 | ||||||||||
| 5,223 | Devon Energy Corp. |
391,203 | ||||||||||
| 1,441 | Diamondback Energy, Inc. |
219,061 | ||||||||||
| 4,944 | EOG Resources, Inc. |
677,130 | ||||||||||
| 34,539 | Exxon Mobil Corp. |
3,315,744 | ||||||||||
| 2,238 | Hess Corp. |
275,431 | ||||||||||
| 6,791 | Marathon Oil Corp. |
213,441 | ||||||||||
| 4,557 | Marathon Petroleum Corp. |
463,857 | ||||||||||
| 7,475 | Occidental Petroleum Corp. |
518,092 | ||||||||||
| 3,752 | Phillips 66 |
378,239 | ||||||||||
| 1,860 | Pioneer Natural Resources Co. |
516,968 | ||||||||||
| 3,314 | Valero Energy Corp. |
429,494 | ||||||||||
| 11,561,275 | ||||||||||||
Oil & Gas Services - 0.4% |
||||||||||||
| 7,349 | Baker Hughes & GE Co., Class A |
264,417 | ||||||||||
| 7,442 | Halliburton Co. |
301,401 | ||||||||||
| 11,744 | Schlumberger, Ltd. |
539,754 | ||||||||||
| 1,105,572 | ||||||||||||
Packaging & Containers - 0.2% |
||||||||||||
| 11,555 | Amcor PLC |
151,370 | ||||||||||
| 2,510 | Ball Corp. |
177,934 | ||||||||||
| 714 | Packaging Corp of America |
112,298 | ||||||||||
| 1,137 | Sealed Air Corp. |
70,699 | ||||||||||
| 2,069 | Westrock Co. |
100,326 | ||||||||||
| 612,627 | ||||||||||||
See accompanying notes to financial statements.
41
Horizon Defined Risk Fund |
Shares |
Value |
|||||||||||
Pharmaceuticals - 5.7% |
||||||||||||
| 13,453 | AbbVie, Inc. (f) |
$ | 1,982,569 | |||||||||
| 1,148 | AmerisourceBergen Corp. |
177,699 | ||||||||||
| 2,185 | Becton Dickinson & Co. (f) |
558,923 | ||||||||||
| 16,472 | Bristol-Myers Squibb Co. (f) |
1,242,812 | ||||||||||
| 2,163 | Cardinal Health, Inc. |
121,820 | ||||||||||
| 2,474 | Cigna Corp. (f) |
663,749 | ||||||||||
| 10,031 | CVS Health Corp. (f) |
970,499 | ||||||||||
| 786 | DexCom, Inc. (a) |
234,181 | ||||||||||
| 6,118 | Eli Lilly & Co. (f) |
1,917,626 | ||||||||||
| 1,056 | Henry Schein, Inc. (a) |
90,436 | ||||||||||
| 19,704 | Johnson & Johnson |
3,537,459 | ||||||||||
| 1,154 | McKesson Corp. |
379,308 | ||||||||||
| 19,219 | Merck & Co., Inc. |
1,768,725 | ||||||||||
| 42,591 | Pfizer, Inc. |
2,259,027 | ||||||||||
| 8,556 | Viatris, Inc. |
104,982 | ||||||||||
| 3,698 | Zoetis, Inc., Class A (f) |
632,099 | ||||||||||
| 16,641,914 | ||||||||||||
Pipelines - 0.3% |
||||||||||||
| 15,226 | Kinder Morgan, Inc. |
299,800 | ||||||||||
| 3,523 | ONEOK, Inc. |
231,990 | ||||||||||
| 9,555 | Williams Cos., Inc. |
354,108 | ||||||||||
| 885,898 | ||||||||||||
Professional, Scientific, and Technical Services - 0.1% |
||||||||||||
| 400 | Charles River Laboratories International, Inc. (a) |
93,632 | ||||||||||
| 447 | EPAM Systems, Inc. (a) |
151,319 | ||||||||||
| 2,222 | Match Group, Inc. (a) |
175,049 | ||||||||||
| 420,000 | ||||||||||||
Real Estate - 0.1% |
||||||||||||
| 2,552 | CBRE Group, Inc., Class A (a) |
211,408 | ||||||||||
Real Estate Investment Trusts - 2.5% |
||||||||||||
| 1,152 | Alexandria Real Estate Equities, Inc. |
191,175 | ||||||||||
| 3,608 | American Tower Corp. (f) |
924,117 | ||||||||||
| 1,092 | AvalonBay Communities, Inc. |
227,092 | ||||||||||
| 1,096 | Boston Properties, Inc. |
121,853 | ||||||||||
| 803 | Camden Property Trust |
115,223 | ||||||||||
| 3,337 | Crown Castle International Corp. (f) |
632,862 | ||||||||||
| 2,244 | Digital Realty Trust, Inc. |
313,240 | ||||||||||
| 2,951 | Duke Realty Corp. |
155,901 | ||||||||||
| 732 | Equinix, Inc. (f) |
502,950 | ||||||||||
| 2,638 | Equity Residential |
202,678 | ||||||||||
| 510 | Essex Property Trust, Inc. |
144,764 | ||||||||||
| 1,082 | Extra Space Storage, Inc. |
192,812 | ||||||||||
See accompanying notes to financial statements.
42
Horizon Defined Risk Fund |
Shares |
Value |
|||||||||||
| 537 | Federal Realty Investment Trust |
$ | 61,739 | |||||||||
| 4,070 | Healthpeak Properties, Inc. |
120,838 | ||||||||||
| 5,599 | Host Hotels & Resorts, Inc. |
111,924 | ||||||||||
| 2,211 | Iron Mountain, Inc. |
119,173 | ||||||||||
| 4,694 | Kimco Realty Corp. |
111,013 | ||||||||||
| 896 | Mid-America Apartment Communities, Inc. |
162,176 | ||||||||||
| 5,875 | Prologis, Inc. (f) |
748,945 | ||||||||||
| 1,224 | Public Storage |
404,703 | ||||||||||
| 4,327 | Realty Income Corp. |
295,188 | ||||||||||
| 1,176 | Regency Centers Corp. |
80,215 | ||||||||||
| 866 | SBA Communications Corp. |
291,504 | ||||||||||
| 2,508 | Simon Property Group, Inc. |
287,542 | ||||||||||
| 2,347 | UDR, Inc. |
112,187 | ||||||||||
| 3,037 | Ventas, Inc. |
172,319 | ||||||||||
| 1,177 | Vornado Realty Trust |
41,148 | ||||||||||
| 3,289 | Welltower, Inc. |
293,017 | ||||||||||
| 5,730 | Weyerhaeuser Co. |
226,450 | ||||||||||
| 7,364,748 | ||||||||||||
Retail - 4.5% |
||||||||||||
| 464 | Advance Auto Parts, Inc. |
88,095 | ||||||||||
| 159 | AutoZone, Inc. (a) |
327,484 | ||||||||||
| 1,646 | Best Buy Co., Inc. |
135,071 | ||||||||||
| 1,230 | CarMax, Inc. (a) |
122,102 | ||||||||||
| 221 | Chipotle Mexican Grill, Inc. (a) |
309,964 | ||||||||||
| 3,391 | Costco Wholesale Corp. (f) |
1,580,952 | ||||||||||
| 1,001 | Darden Restaurants, Inc. |
125,125 | ||||||||||
| 1,762 | Dollar General Corp. (f) |
388,239 | ||||||||||
| 1,714 | Dollar Tree, Inc. (a) |
274,806 | ||||||||||
| 282 | Domino’s Pizza, Inc. |
102,414 | ||||||||||
| 1,071 | Genuine Parts Co. |
146,438 | ||||||||||
| 7,754 | Home Depot, Inc. |
2,347,523 | ||||||||||
| 4,968 | Lowe’s Cos., Inc. (f) |
970,250 | ||||||||||
| 5,687 | McDonald’s Corp. |
1,434,318 | ||||||||||
| 508 | O’Reilly Automotive, Inc. (a) |
323,682 | ||||||||||
| 2,755 | Ross Stores, Inc. |
234,230 | ||||||||||
| 9,033 | Starbucks Corp. (f) |
709,091 | ||||||||||
| 3,628 | Target Corp. (f) |
587,301 | ||||||||||
| 9,160 | TJX Cos., Inc. (f) |
582,301 | ||||||||||
| 877 | Tractor Supply Co. |
164,315 | ||||||||||
| 421 | Ulta Beauty, Inc. (a) |
178,125 | ||||||||||
| 5,383 | Walgreens Boots Alliance, Inc. |
235,937 | ||||||||||
| 10,505 | Walmart, Inc. |
1,351,258 | ||||||||||
| 2,277 | Yum! Brands, Inc. |
276,587 | ||||||||||
| 12,995,608 | ||||||||||||
See accompanying notes to financial statements.
43
Horizon Defined Risk Fund |
Shares |
Value |
|||||||||||
Retail Trade - 0.1% |
||||||||||||
| 2,084 | Bath & Body Works, Inc. |
$ | 85,486 | |||||||||
| 942 | Etsy, Inc. (a) |
76,415 | ||||||||||
| 161,901 | ||||||||||||
Semiconductors - 5.1% |
||||||||||||
| 13,673 | Advanced Micro Devices, Inc. (a)(f) |
1,392,732 | ||||||||||
| 4,065 | Analog Devices, Inc. (f) |
684,546 | ||||||||||
| 7,141 | Applied Materials, Inc. (f) |
837,568 | ||||||||||
| 3,207 | Broadcom, Inc. (f) |
1,860,477 | ||||||||||
| 31,630 | Intel Corp. |
1,405,004 | ||||||||||
| 261 | IPG Photonics Corp. (a) |
27,533 | ||||||||||
| 1,188 | KLA Corp. (f) |
433,442 | ||||||||||
| 1,127 | Lam Research Corp. (f) |
586,074 | ||||||||||
| 4,374 | Microchip Technology, Inc. |
317,771 | ||||||||||
| 8,735 | Micron Technology, Inc. (f) |
644,992 | ||||||||||
| 20,850 | NVIDIA Corp. (f) |
3,893,112 | ||||||||||
| 842 | Qorvo, Inc. (a) |
94,093 | ||||||||||
| 8,881 | QUALCOMM, Inc. (f) |
1,271,937 | ||||||||||
| 1,285 | Skyworks Solutions, Inc. |
139,898 | ||||||||||
| 7,092 | Texas Instruments, Inc. (f) |
1,253,582 | ||||||||||
| 14,842,761 | ||||||||||||
Shipbuilding - 0.0% (b) |
||||||||||||
| 311 | Huntington Ingalls Industries, Inc. |
65,453 | ||||||||||
Software - 8.9% |
||||||||||||
| 5,974 | Activision Blizzard, Inc. (f) |
465,255 | ||||||||||
| 3,707 | Adobe, Inc. (a) |
1,543,891 | ||||||||||
| 1,212 | Akamai Technologies, Inc. (a) |
122,460 | ||||||||||
| 686 | ANSYS, Inc. (a) |
178,607 | ||||||||||
| 1,721 | Autodesk, Inc. (a)(f) |
357,538 | ||||||||||
| 892 | Broadridge Financial Solutions, Inc. |
130,428 | ||||||||||
| 2,230 | Cadence Design Systems, Inc. (a) |
342,818 | ||||||||||
| 2,221 | Cerner Corp. |
210,662 | ||||||||||
| 947 | Citrix Systems, Inc. |
95,353 | ||||||||||
| 2,211 | Electronic Arts, Inc. |
306,555 | ||||||||||
| 4,745 | Fidelity National Information Services, Inc. (f) |
495,853 | ||||||||||
| 4,575 | Fiserv, Inc. (a) |
458,324 | ||||||||||
| 2,317 | Intuit, Inc. (f) |
960,304 | ||||||||||
| 578 | Jack Henry & Associates, Inc. |
108,733 | ||||||||||
| 58,892 | Microsoft Corp. (f) |
16,010,968 | ||||||||||
| 652 | MSCI, Inc. (f) |
288,412 | ||||||||||
| 12,010 | Oracle Corp. |
863,759 | ||||||||||
| 2,495 | Paychex, Inc. |
308,956 | ||||||||||
| 380 | Paycom Software, Inc. (a) |
108,049 | ||||||||||
See accompanying notes to financial statements.
44
Horizon Defined Risk Fund |
Shares |
Value |
|||||||||||
| 7,720 | Salesforce.com, Inc. (a) |
$ | 1,237,053 | |||||||||
| 1,606 | ServiceNow, Inc. (a) |
750,757 | ||||||||||
| 1,219 | Synopsys, Inc. (a)(f) |
389,105 | ||||||||||
| 943 | Take-Two Interactive Software, Inc. (a) |
117,432 | ||||||||||
| 319 | Tyler Technologies, Inc. (a) |
113,507 | ||||||||||
| 25,964,779 | ||||||||||||
Telecommunications - 1.9% |
||||||||||||
| 1,815 | Arista Networks, Inc. (a) |
185,638 | ||||||||||
| 55,085 | AT&T, Inc. |
1,172,760 | ||||||||||
| 32,137 | Cisco Systems, Inc. |
1,447,772 | ||||||||||
| 5,761 | Corning, Inc. |
206,359 | ||||||||||
| 2,560 | Juniper Networks, Inc. |
78,541 | ||||||||||
| 1,298 | Motorola Solutions, Inc. |
285,222 | ||||||||||
| 4,632 | T-Mobile US, Inc. (a)(f) |
617,399 | ||||||||||
| 31,451 | Verizon Communications, Inc. |
1,613,122 | ||||||||||
| 5,606,813 | ||||||||||||
Textiles - 0.0% (b) |
||||||||||||
| 424 | Mohawk Industries, Inc. (a) |
59,979 | ||||||||||
Toys/Games/Hobbies - 0.0% (b) |
||||||||||||
| 1,004 | Hasbro, Inc. |
90,109 | ||||||||||
Transportation - 1.4% |
||||||||||||
| 977 | CH Robinson Worldwide, Inc. |
106,014 | ||||||||||
| 17,327 | CSX Corp. (f) |
550,825 | ||||||||||
| 1,241 | Expeditors International of Washington, Inc. |
135,071 | ||||||||||
| 1,834 | FedEx Corp. (f) |
411,880 | ||||||||||
| 639 | JB Hunt Transport Services, Inc. |
110,279 | ||||||||||
| 1,840 | Norfolk Southern Corp. (f) |
440,974 | ||||||||||
| 723 | Old Dominion Freight Line, Inc. |
186,708 | ||||||||||
| 4,885 | Union Pacific Corp. (f) |
1,073,625 | ||||||||||
| 5,420 | United Parcel Service, Inc. (f) |
987,795 | ||||||||||
| 4,003,171 | ||||||||||||
See accompanying notes to financial statements.
45
Horizon Defined Risk Fund |
Shares |
Value |
|||||||||||
Utilities - 0.1% |
||||||||||||
| 2,571 | Constellation Energy Corp. |
$ | 159,608 | |||||||||
Water - 0.1% |
||||||||||||
| 1,384 | American Water Works Co., Inc. |
209,330 | ||||||||||
Wholesale Trade - 0.0%(b) |
||||||||||||
| 297 | Pool Corp. |
118,390 | ||||||||||
TOTAL COMMON STOCKS (Cost - $242,676,880) |
271,669,359 | |||||||||||
Contracts |
Notional |
|||||||||||
PURCHASED OPTIONS - 4.7% (a)(c)(g) |
||||||||||||
PURCHASED PUT OPTIONS - 4.7% |
||||||||||||
S&P 500 Index |
||||||||||||
| 230 | Expiration: June 2022, Exercise Price: $4,275 |
$ | 95,039,450 | 4,021,550 | ||||||||
| 250 | Expiration: July 2022, Exercise Price: $4,350 |
103,303,750 | 6,552,500 | |||||||||
| 240 | Expiration: August 2022, Exercise Price: $3,975 |
99,171,600 | 3,032,400 | |||||||||
TOTAL PURCHASED OPTIONS (Cost - $11,158,934) |
13,606,450 | |||||||||||
Shares |
||||||||||||
SHORT TERM INVESTMENTS - 3.8% |
||||||||||||
Money Market Funds - 3.8% |
||||||||||||
| 10,996,965 | First American Treasury Obligations Fund, Class X, 0.67% (e) |
10,996,965 | ||||||||||
TOTAL SHORT TERM INVESTMENTS (Cost - $10,996,965) |
10,996,965 | |||||||||||
INVESTMENTS PURCHASED WITH PROCEEDS FROM SECURITIES LENDING - 0.0% (b) |
||||||||||||
| 120,805 | First American Government Oblligations Fund, Class X, 0.65% (e) |
144,958 | ||||||||||
TOTAL INVESTMENTS PURCHASED WITH PROCEEDS FROM SECURITIES LENDING (Cost - $144,958) |
144,958 | |||||||||||
TOTAL INVESTMENTS - 101.7% (Cost - $264,977,737) |
296,417,732 | |||||||||||
Liabilities in Excess of Other Assets - (1.7)% |
(4,965,871 | ) | ||||||||||
NET ASSETS - 100.0% |
$ | 291,451,861 | ||||||||||
See accompanying notes to financial statements.
46
Horizon Defined Risk Fund |
Contracts |
Notional |
Value |
||||||||||
SCHEDULE OF WRITTEN OPTIONS - (2.0)% (a)(c) |
||||||||||||
SCHEDULE OF WRITTEN CALL OPTIONS - (0.7)% |
||||||||||||
S&P 500 Index |
||||||||||||
| 240 | Expiration: August 2022, Exercise Price $4,325 |
99,171,600 | $ | 2,042,400 | ||||||||
TOTAL WRITTEN CALL OPTIONS (Premiums Received $1,835,442) |
2,042,400 | |||||||||||
SCHEDULE OF WRITTEN PUT OPTIONS - (1.3)% |
||||||||||||
S&P 500 Index |
||||||||||||
| 250 | Expiration: July 2022, Exercise Price: $4,000 |
103,303,750 | 2,232,500 | |||||||||
| 230 | Expiration: June 2022, Exercise Price $3,900 |
95,039,450 | 554,300 | |||||||||
| 240 | Expiration: August 2022, Exercise Price $3,500 |
99,171,600 | 945,600 | |||||||||
TOTAL WRITTEN PUT OPTIONS (Premiums Received $4,672,176) |
3,732,400 | |||||||||||
TOTAL OPTIONS WRITTEN (Premiums Received $6,507,618) |
$ | 5,774,800 | ||||||||||
Percentages are stated as a percent of net assets.
|
(a) |
Non-income producing security. |
|
(b) |
Rounds to less than 0.1%. |
|
(c) |
Each option is exercisable into 100 shares of the underlying security. |
|
(d) |
All or a portion of this security is out on loan as of May 31, 2022. |
|
(e) |
Interest rate reflects seven-day yield on May 31, 2022. |
|
(f) |
All or a portion of the security is segregated as collateral for written options. The value of the securities segregated as collateral for written options is $70,224,274, which is 24.1% of total net assets. |
|
(g) |
Held in connection with a written option, see Schedule of Written Options for more details. |
See accompanying notes to financial statements.
47
Horizon U.S. Defensive Equity Fund |
Shares |
Value |
|||||||||||
COMMON STOCKS - 97.3% |
||||||||||||
Advertising - 0.2% |
||||||||||||
| 4,537 | Interpublic Group of Cos., Inc. |
$ | 146,227.00 | |||||||||
| 1,457 | Omnicom Group, Inc. |
108,707 | ||||||||||
| 254,934 | ||||||||||||
Aerospace/Defense - 2.3% |
||||||||||||
| 2,298 | General Dynamics Corp. |
516,843 | ||||||||||
| 1,219 | L3Harris Technologies, Inc. |
293,657 | ||||||||||
| 2,532 | Lockheed Martin Corp. |
1,114,359 | ||||||||||
| 1,417 | Northrop Grumman Corp. |
663,113 | ||||||||||
| 2,587,972 | ||||||||||||
Agriculture - 1.5% |
||||||||||||
| 5,854 | Archer Daniels Midland Co. |
531,660 | ||||||||||
| 11,076 | Philip Morris International, Inc. |
1,176,825 | ||||||||||
| 1,708,485 | ||||||||||||
Apparel - 0.3% |
||||||||||||
| 8,037 | Tapestry, Inc. |
277,277 | ||||||||||
Auto Manufacturers - 0.4% |
||||||||||||
| 33,796 | Ford Motor Co. |
462,329 | ||||||||||
Auto Parts & Equipment - 0.2% |
||||||||||||
| 6,252 | BorgWarner, Inc. |
252,081 | ||||||||||
Banks - 4.8% |
||||||||||||
| 13,834 | Citigroup, Inc. |
738,874 | ||||||||||
| 3,481 | Citizens Financial Group, Inc. |
144,044 | ||||||||||
| 18,175 | JPMorgan Chase & Co. |
2,403,280 | ||||||||||
| 2,528 | M&T Bank Corp. |
454,964 | ||||||||||
| 15,549 | Morgan Stanley |
1,339,391 | ||||||||||
| 10,870 | Regions Financial Corp. |
240,118 | ||||||||||
| 5,320,671 | ||||||||||||
Beverages - 1.9% |
||||||||||||
| 33,955 | Coca-Cola Co. |
2,152,068 | ||||||||||
Biotechnology - 1.9% |
||||||||||||
| 6,451 | Corteva, Inc. |
403,962 | ||||||||||
| 9,525 | Gilead Sciences, Inc. |
617,696 | ||||||||||
| 1,278 | Regeneron Pharmaceuticals, Inc. (a) |
849,538 | ||||||||||
| 774 | Vertex Pharmaceuticals, Inc. (a) |
207,935 | ||||||||||
| 2,079,131 | ||||||||||||
See accompanying notes to financial statements.
48
Horizon U.S. Defensive Equity Fund |
Shares |
Value |
|||||||||||
Chemicals - 1.4% |
||||||||||||
| 2,954 | CF Industries Holdings, Inc. |
$ | 291,767 | |||||||||
| 7,550 | Dow, Inc. |
513,249 | ||||||||||
| 4,030 | LyondellBasell Industries NV, Class A |
460,427 | ||||||||||
| 3,946 | Mosaic Co. |
247,217 | ||||||||||
| 1,512,660 | ||||||||||||
Commercial Services - 0.9% |
||||||||||||
| 1,496 | Gartner, Inc. (a) |
392,550 | ||||||||||
| 1,731 | Robert Half International, Inc. |
156,050 | ||||||||||
| 830 | S&P Global, Inc. |
290,068 | ||||||||||
| 515 | United Rentals, Inc. (a) |
153,563 | ||||||||||
| 992,231 | ||||||||||||
Computers - 7.8% |
||||||||||||
| 2,126 | Accenture PLC, Class A |
634,526 | ||||||||||
| 33,674 | Apple, Inc. |
5,012,038 | ||||||||||
| 5,775 | Cognizant Technology Solutions Corp., Class A |
431,392 | ||||||||||
| 1,448 | Fortinet, Inc. (a) |
425,915 | ||||||||||
| 23,794 | Hewlett Packard Enterprise Co. |
371,186 | ||||||||||
| 19,407 | HP, Inc. |
753,768 | ||||||||||
| 3,605 | International Business Machines Corp. |
500,518 | ||||||||||
| 1,459 | Leidos Holdings, Inc. |
152,466 | ||||||||||
| 5,463 | NetApp, Inc. |
393,063 | ||||||||||
| 8,674,872 | ||||||||||||
Cosmetics/Personal Care - 0.2% |
||||||||||||
| 2,827 | Colgate-Palmolive Co. |
222,796 | ||||||||||
Distribution/Wholesale - 0.5% |
||||||||||||
| 5,679 | LKQ Corp. |
291,844 | ||||||||||
| 467 | WW Grainger, Inc. |
227,462 | ||||||||||
| 519,306 | ||||||||||||
Diversified Financial Services - 2.0% |
||||||||||||
| 7,204 | American Express Co. |
1,216,179 | ||||||||||
| 3,387 | Capital One Financial Corp. |
433,062 | ||||||||||
| 2,515 | Discover Financial Services |
285,427 | ||||||||||
| 2,728 | Raymond James Financial, Inc. |
268,681 | ||||||||||
| 2,203,349 | ||||||||||||
Electric - 1.8% |
||||||||||||
| 1,875 | Alliant Energy Corp. |
119,662 | ||||||||||
| 2,847 | American Electric Power Co., Inc. |
290,479 | ||||||||||
| 2,430 | CMS Energy Corp. |
172,627 | ||||||||||
| 2,550 | Consolidated Edison, Inc. |
253,113 | ||||||||||
| 4,081 | Duke Energy Corp. |
459,194 | ||||||||||
| 2,016 | Evergy, Inc. |
140,999 | ||||||||||
See accompanying notes to financial statements.
49
Horizon U.S. Defensive Equity Fund |
Shares |
Value |
|||||||||||
| 4,070 | Exelon Corp. |
$ | 200,041 | |||||||||
| 4,912 | FirstEnergy Corp. |
211,020 | ||||||||||
| 3,127 | NRG Energy, Inc. |
143,967 | ||||||||||
| 1,991,102 | ||||||||||||
Electrical Components & Equipment - 0.2% |
||||||||||||
| 2,717 | Emerson Electric Co. |
240,889 | ||||||||||
Electronics - 0.2% |
||||||||||||
| 1,520 | PerkinElmer, Inc. |
227,498 | ||||||||||
Environmental Control - 0.9% |
||||||||||||
| 2,136 | Pentair PLC |
107,163 | ||||||||||
| 2,701 | Republic Services, Inc. |
361,502 | ||||||||||
| 3,248 | Waste Management, Inc. |
514,840 | ||||||||||
| 983,505 | ||||||||||||
Finance and Insurance - 0.2% |
||||||||||||
| 3,271 | Brown & Brown, Inc. |
194,199 | ||||||||||
Food - 1.5% |
||||||||||||
| 3,693 | General Mills, Inc. |
257,956 | ||||||||||
| 2,109 | Hershey Co. |
446,496 | ||||||||||
| 3,083 | Hormel Foods Corp. |
150,050 | ||||||||||
| 8,152 | Kroger Co. |
431,812 | ||||||||||
| 4,335 | Tyson Foods, Inc., Class A |
388,459 | ||||||||||
| 1,674,773 | ||||||||||||
Gas - 0.1% |
||||||||||||
| 3,756 | NiSource, Inc. |
118,126 | ||||||||||
Hand/Machine Tools - 0.1% |
||||||||||||
| 614 | Snap-on, Inc. |
136,234 | ||||||||||
Health Care and Social Assistance - 0.2% |
||||||||||||
| 790 | Molina Healthcare, Inc. (a) |
229,274 | ||||||||||
Healthcare Products - 0.2% |
||||||||||||
| 3,219 | Hologic, Inc. (a) |
242,294 | ||||||||||
Healthcare Services - 4.7% |
||||||||||||
| 1,457 | Anthem, Inc. |
742,502 | ||||||||||
| 3,192 | HCA Healthcare, Inc. |
671,597 | ||||||||||
| 1,090 | Laboratory Corp. of America Holdings |
268,925 | ||||||||||
See accompanying notes to financial statements.
50
Horizon U.S. Defensive Equity Fund |
Shares |
Value |
|||||||||||
| 1,726 | Quest Diagnostics, Inc. |
$ | 243,400 | |||||||||
| 6,621 | UnitedHealth Group, Inc. |
3,289,180 | ||||||||||
| 5,215,604 | ||||||||||||
Home Builders - 0.8% |
||||||||||||
| 3,358 | Lennar Corp., Class A |
269,479 | ||||||||||
| 80 | NVR, Inc. (a) |
356,050 | ||||||||||
| 5,914 | PulteGroup, Inc. |
267,668 | ||||||||||
| 893,197 | ||||||||||||
Household Products/Wares - 0.2% |
||||||||||||
| 1,811 | Church & Dwight Co., Inc. |
163,099 | ||||||||||
Information - 0.1% |
||||||||||||
| 404 | FactSet Research Systems, Inc. |
154,239 | ||||||||||
Insurance - 7.0% |
||||||||||||
| 2,964 | Allstate Corp. |
405,149 | ||||||||||
| 16,499 | Berkshire Hathaway, Inc., Class B (a) |
5,213,354 | ||||||||||
| 4,479 | Chubb Ltd. |
946,368 | ||||||||||
| 2,269 | Cincinnati Financial Corp. |
290,114 | ||||||||||
| 672 | Everest Re Group Ltd. |
189,840 | ||||||||||
| 2,588 | Travelers Cos., Inc. |
463,356 | ||||||||||
| 3,774 | WR Berkley Corp. |
268,445 | ||||||||||
| 7,776,626 | ||||||||||||
Internet - 5.1% |
||||||||||||
| 2,089 | Alphabet, Inc., Class A (a) |
4,752,976 | ||||||||||
| 129 | Booking Holdings, Inc. (a) |
289,419 | ||||||||||
| 1,372 | Expedia Group, Inc. (a) |
177,441 | ||||||||||
| 17,685 | NortonLifeLock, Inc. |
430,453 | ||||||||||
| 5,650,289 | ||||||||||||
Iron/Steel - 0.4% |
||||||||||||
| 3,283 | Nucor Corp. |
434,866 | ||||||||||
Machinery - Construction & Mining - 0.7% |
||||||||||||
| 3,762 | Caterpillar, Inc. |
812,028 | ||||||||||
Machinery - Diversified - 0.2% |
||||||||||||
| 1,173 | Dover Corp. |
157,077 | ||||||||||
| 1,218 | Wabtec Corp. |
115,052 | ||||||||||
| 272,129 | ||||||||||||
Manufacturing - 1.5% |
||||||||||||
| 2,936 | Moderna, Inc. (a) |
426,689 | ||||||||||
| 4,430 | Raytheon Technologies Corp. |
421,382 | ||||||||||
See accompanying notes to financial statements.
51
Horizon U.S. Defensive Equity Fund |
Shares |
Value |
|||||||||||
| 5,708 | Seagate Technology Holdings Plc |
$ | 483,296 | |||||||||
| 3,203 | Teradyne, Inc. |
349,960 | ||||||||||
| 1,681,327 | ||||||||||||
Media - 0.9% |
||||||||||||
| 17,233 | Comcast Corp., Class A |
763,077 | ||||||||||
| 6,188 | ViacomCBS, Inc., Class B |
212,434 | ||||||||||
| 975,511 | ||||||||||||
Mining - 0.6% |
||||||||||||
| 15,749 | Freeport-McMoRan, Inc. |
615,471 | ||||||||||
Mining, Quarrying, and Oil and Gas Extraction - 0.2% |
||||||||||||
| 4,677 | APA Corp. |
219,866 | ||||||||||
Miscellaneous Manufacturing - 0.2% |
||||||||||||
| 1,934 | AO Smith Corp. |
116,272 | ||||||||||
| 2,147 | Textron, Inc. |
140,178 | ||||||||||
| 256,450 | ||||||||||||
Oil & Gas - 10.0% |
||||||||||||
| 19,810 | Chevron Corp. |
3,460,015 | ||||||||||
| 14,453 | ConocoPhillips |
1,623,939 | ||||||||||
| 7,812 | Devon Energy Corp. |
585,119 | ||||||||||
| 6,422 | EOG Resources, Inc. |
879,557 | ||||||||||
| 44,755 | Exxon Mobil Corp. |
4,296,480 | ||||||||||
| 9,128 | Marathon Oil Corp. |
286,893 | ||||||||||
| 11,132,003 | ||||||||||||
Packaging & Containers - 0.3% |
||||||||||||
| 1,124 | Packaging Corp of America |
176,783 | ||||||||||
| 2,347 | Sealed Air Corp. |
145,936 | ||||||||||
| 322,719 | ||||||||||||
Pharmaceuticals - 9.3% |
||||||||||||
| 18,755 | AbbVie, Inc. |
2,763,924 | ||||||||||
| 20,369 | Bristol-Myers Squibb Co. |
1,536,841 | ||||||||||
| 13,479 | CVS Health Corp. |
1,304,093 | ||||||||||
| 1,936 | Henry Schein, Inc. (a) |
165,799 | ||||||||||
| 13,656 | Merck & Co., Inc. |
1,256,762 | ||||||||||
| 63,862 | Pfizer, Inc. |
3,387,241 | ||||||||||
| 10,414,660 | ||||||||||||
Real Estate Investment Trusts - 1.8% |
||||||||||||
| 2,041 | Duke Realty Corp. |
107,826 | ||||||||||
| 334 | Essex Property Trust, Inc. |
94,806 | ||||||||||
| 1,284 | Extra Space Storage, Inc. |
228,809 | ||||||||||
| 5,077 | Kimco Realty Corp. |
120,071 | ||||||||||
See accompanying notes to financial statements.
52
Horizon U.S. Defensive Equity Fund |
Shares |
Value |
|||||||||||
| 744 | Mid-America Apartment Communities, Inc. |
$ | 134,664 | |||||||||
| 2,185 | Prologis, Inc. |
278,544 | ||||||||||
| 1,600 | Public Storage |
529,024 | ||||||||||
| 1,643 | Regency Centers Corp. |
112,069 | ||||||||||
| 9,197 | Weyerhaeuser Co. |
363,465 | ||||||||||
| 1,969,278 | ||||||||||||
Retail - 6.4% |
||||||||||||
| 314 | AutoZone, Inc. (a) |
646,730 | ||||||||||
| 169 | Chipotle Mexican Grill, Inc. (a) |
237,031 | ||||||||||
| 3,361 | Costco Wholesale Corp. |
1,566,965 | ||||||||||
| 625 | Domino’s Pizza, Inc. |
226,981 | ||||||||||
| 6,632 | Lowe’s Cos., Inc. |
1,295,230 | ||||||||||
| 4,313 | McDonald’s Corp. |
1,087,782 | ||||||||||
| 1,005 | O’Reilly Automotive, Inc. (a) |
640,356 | ||||||||||
| 2,162 | Target Corp. |
349,985 | ||||||||||
| 1,601 | Tractor Supply Co. |
299,963 | ||||||||||
| 905 | Ulta Beauty, Inc. (a) |
382,906 | ||||||||||
| 3,175 | Yum! Brands, Inc. |
385,667 | ||||||||||
| 7,119,596 | ||||||||||||
Semiconductors - 4.1% |
||||||||||||
| 5,520 | Advanced Micro Devices, Inc. (a) |
562,267 | ||||||||||
| 906 | Lam Research Corp. |
471,147 | ||||||||||
| 8,018 | Micron Technology, Inc. |
592,049 | ||||||||||
| 8,950 | NVIDIA Corp. |
1,671,144 | ||||||||||
| 8,680 | QUALCOMM, Inc. |
1,243,150 | ||||||||||
| 4,539,757 | ||||||||||||
Software - 6.1% |
||||||||||||
| 3,682 | Akamai Technologies, Inc. (a) |
372,029 | ||||||||||
| 1,956 | Jack Henry & Associates, Inc. |
367,963 | ||||||||||
| 18,924 | Microsoft Corp. |
5,144,868 | ||||||||||
| 4,303 | Paychex, Inc. |
532,841 | ||||||||||
| 1,112 | Synopsys, Inc. (a) |
354,950 | ||||||||||
| 6,772,651 | ||||||||||||
Telecommunications - 2.0% |
||||||||||||
| 3,281 | Arista Networks, Inc. (a) |
335,581 | ||||||||||
| 23,465 | Cisco Systems, Inc. |
1,057,098 | ||||||||||
| 1,331 | T-Mobile US, Inc. (a) |
177,409 | ||||||||||
| 13,994 | Verizon Communications, Inc. |
717,752 | ||||||||||
| 2,287,840 | ||||||||||||
See accompanying notes to financial statements.
53
Horizon U.S. Defensive Equity Fund |
Shares |
Value |
|||||||||||
Transportation - 3.6% |
||||||||||||
| 19,392 | CSX Corp. |
$ | 616,472 | |||||||||
| 1,431 | Expeditors International of Washington, Inc. |
155,750 | ||||||||||
| 1,846 | Norfolk Southern Corp. |
442,412 | ||||||||||
| 5,124 | Union Pacific Corp. |
1,126,153 | ||||||||||
| 9,358 | United Parcel Service, Inc., Class B |
1,705,495 | ||||||||||
| 4,046,282 | ||||||||||||
TOTAL COMMON STOCKS (Cost - $108,137,278) |
108,983,544 | |||||||||||
SHORT TERM INVESTMENTS - 2.5% |
||||||||||||
Money Market Funds - 2.5% |
||||||||||||
| 2,764,258 | First American Treasury Obligations Fund, Class X, 0.67%, (b) |
2,764,258 | ||||||||||
TOTAL SHORT TERM INVESTMENTS (Cost - $2,764,258) |
2,764,258 | |||||||||||
TOTAL INVESTMENTS - 99.8% (Cost - $110,901,536) |
111,747,802 | |||||||||||
Other Assets in Excess of Liabilities - 0.2% |
184,194 | |||||||||||
NET ASSETS - 100.0% |
$ | 111,931,996 | ||||||||||
Percentages are stated as a percent of net assets.
|
(a) |
Non-income producing security. |
|
(b) |
Interest rate reflects seven-day yield on May 31, 2022. |
See accompanying notes to financial statements.
54
Horizon ESG Defensive Core Fund |
Shares |
Value |
|||||||||||
INVESTMENT COMPANIES - 29.5% |
||||||||||||
Exchange Traded Funds - 29.5% |
||||||||||||
| 498,517 | SPDR Bloomberg 1-3 Month T-Bill ETF (c) |
$ | 45,589,380 | |||||||||
TOTAL INVESTMENT COMPANIES (Cost - $45,586,626) |
45,589,380 | |||||||||||
COMMON STOCKS - 68.1% |
||||||||||||
Administrative and Support and Waste Management and Remediation Services - 0.8% |
||||||||||||
| 28,767 | Terminix Global Holdings, Inc. (a) |
1,248,775 | ||||||||||
Aerospace/Defense - 0.8% |
||||||||||||
| 32,928 | Howmet Aerospace, Inc. |
1,177,835 | ||||||||||
Apparel - 1.6% |
||||||||||||
| 17,829 | Nike, Inc. |
2,118,977 | ||||||||||
| 4,605 | PVH Corp. |
326,356 | ||||||||||
| 2,445,333 | ||||||||||||
Auto Manufacturers - 0.2% |
||||||||||||
| 26,182 | Ford Motor Co. |
358,170 | ||||||||||
Banks - 2.6% |
||||||||||||
| 45,979 | Bank of America Corp. |
1,710,419 | ||||||||||
| 4,386 | Goldman Sachs Group, Inc. |
1,433,564 | ||||||||||
| 6,370 | JPMorgan Chase & Co. |
842,305 | ||||||||||
| 3,986,288 | ||||||||||||
Beverages - 2.2% |
||||||||||||
| 14,047 | Molson Coors Brewing Co. |
784,385 | ||||||||||
| 15,595 | PepsiCo, Inc. |
2,616,061 | ||||||||||
| 3,400,446 | ||||||||||||
Biotechnology - 3.6% |
||||||||||||
| 8,884 | Amgen, Inc. |
2,280,878 | ||||||||||
| 4,866 | Biogen, Inc. (a) |
973,200 | ||||||||||
| 1,523 | Regeneron Pharmaceuticals, Inc. (a) |
1,012,399 | ||||||||||
| 4,974 | Vertex Pharmaceuticals, Inc. (a) |
1,336,265 | ||||||||||
| 5,602,742 | ||||||||||||
Chemicals - 1.6% |
||||||||||||
| 8,216 | DuPont de Nemours, Inc. |
557,456 | ||||||||||
| 5,029 | International Flavors & Fragrances, Inc. |
664,683 | ||||||||||
| 3,680 | Linde PLC |
1,194,822 | ||||||||||
| 2,416,961 | ||||||||||||
Commercial Services - 0.7% |
||||||||||||
| 2,567 | PayPal Holdings, Inc. (a) |
218,734 | ||||||||||
See accompanying notes to financial statements.
55
Horizon ESG Defensive Core Fund |
Shares |
Value |
|||||||||||
| 4,842 | Verisk Analytics, Inc. |
$ | 846,963 | |||||||||
| 1,065,697 | ||||||||||||
Computers - 5.3% |
||||||||||||
| 55,229 | Apple, Inc. |
8,220,284 | ||||||||||
Diversified Financial Services - 1.9% |
||||||||||||
| 9,273 | American Express Co. |
1,565,468 | ||||||||||
| 2,050 | Ameriprise Financial, Inc. |
566,353 | ||||||||||
| 24,393 | Invesco, Ltd. |
471,761 | ||||||||||
| 1,142 | MasterCard, Inc. |
408,688 | ||||||||||
| 3,012,270 | ||||||||||||
Electric - 0.3% |
||||||||||||
| 3,147 | Sempra Energy |
515,667 | ||||||||||
Environmental Control - 1.6% |
||||||||||||
| 17,959 | Republic Services, Inc. |
2,403,633 | ||||||||||
Finance and Insurance - 0.4% |
||||||||||||
| 9,502 | Tradeweb Markets, Inc. |
642,430 | ||||||||||
Food - 0.3% |
||||||||||||
| 7,224 | Kellogg Co. |
503,802 | ||||||||||
Healthcare Services - 1.9% |
||||||||||||
| 1,580 | Anthem, Inc. |
805,184 | ||||||||||
| 12,740 | Centene Corp. (a) |
1,037,546 | ||||||||||
| 5,091 | HCA Healthcare, Inc. |
1,071,146 | ||||||||||
| 2,913,876 | ||||||||||||
Information - 0.3% |
||||||||||||
| 3,312 | Warner Bros Discovery, Inc. (a) |
61,107 | ||||||||||
| 3,245 | Zoom Video Communications, Inc. (a) |
348,675 | ||||||||||
| 409,782 | ||||||||||||
Insurance - 2.0% |
||||||||||||
| 18,493 | Allstate Corp. |
2,527,808 | ||||||||||
| 8,833 | Hartford Financial Services Group, Inc. |
640,481 | ||||||||||
| 3,168,289 | ||||||||||||
Internet - 5.3% |
||||||||||||
| 2,777 | Alphabet, Inc., Class A (a) |
6,318,341 | ||||||||||
| 482 | Amazon.com, Inc. (a) |
1,158,820 | ||||||||||
| 3,447 | Meta Platforms, Inc., Class A (a) |
667,477 | ||||||||||
| 8,144,638 | ||||||||||||
See accompanying notes to financial statements.
56
Horizon ESG Defensive Core Fund |
Shares |
Value |
|||||||||||
Lodging - 1.0% |
||||||||||||
| 11,422 | Hilton Worldwide Holdings, Inc. |
$ | 1,608,903 | |||||||||
Machinery - Diversified - 0.5% |
||||||||||||
| 2,339 | Deere & Co. |
836,847 | ||||||||||
Manufacturing - 4.0% |
||||||||||||
| 5,468 | BioMarin Pharmaceutical, Inc. (a) |
410,811 | ||||||||||
| 7,548 | Enphase Energy, Inc. (a) |
1,405,362 | ||||||||||
| 13,904 | General Electric Co. |
1,088,544 | ||||||||||
| 15,471 | Keurig Dr Pepper, Inc. |
537,463 | ||||||||||
| 6,195 | Lear Corp. |
873,247 | ||||||||||
| 6,259 | Owens Corning |
598,235 | ||||||||||
| 1,326 | Tesla, Inc. (a) |
1,005,453 | ||||||||||
| 23,388 | Vertiv Holdings Co. |
257,034 | ||||||||||
| 6,176,149 | ||||||||||||
Media - 1.0% |
||||||||||||
| 14,002 | Walt Disney Co. (a) |
1,546,381 | ||||||||||
Mining - 0.4% |
||||||||||||
| 9,335 | Newmont Goldcorp Corp. |
633,380 | ||||||||||
Oil & Gas - 3.0% |
||||||||||||
| 4,728 | Chevron Corp. |
825,792 | ||||||||||
| 28,670 | Exxon Mobil Corp. |
2,752,320 | ||||||||||
| 7,930 | Valero Energy Corp. |
1,027,728 | ||||||||||
| 4,605,840 | ||||||||||||
Pharmaceuticals - 3.9% |
||||||||||||
| 5,075 | AmerisourceBergen Corp. |
785,559 | ||||||||||
| 21,250 | Bristol-Myers Squibb Co. |
1,603,313 | ||||||||||
| 10,567 | Cigna Corp. |
2,835,021 | ||||||||||
| 8,710 | Merck & Co., Inc. |
801,581 | ||||||||||
| 6,025,474 | ||||||||||||
Professional, Scientific, and Technical Services - 0.1% |
||||||||||||
| 23,402 | Adaptive Biotechnologies Corp. (a) |
183,004 | ||||||||||
Real Estate Investment Trusts - 2.3% |
||||||||||||
| 1,438 | Alexandria Real Estate Equities, Inc. |
238,636 | ||||||||||
| 8,843 | Digital Realty Trust, Inc. |
1,234,394 | ||||||||||
| 26,433 | Iron Mountain, Inc. |
1,424,739 | ||||||||||
| 20,030 | VICI Properties, Inc. |
617,925 | ||||||||||
| 3,515,694 | ||||||||||||
Retail - 1.1% |
||||||||||||
| 7,891 | Kohl’s Corp. |
318,165 | ||||||||||
See accompanying notes to financial statements.
57
Horizon ESG Defensive Core Fund |
Shares |
Value |
|||||||||||
| 5,054 | Lowe’s Cos., Inc. |
$ | 987,046 | |||||||||
| 5,800 | Starbucks Corp. |
455,300 | ||||||||||
| 1,760,511 | ||||||||||||
Retail Trade - 1.8% |
||||||||||||
| 44,046 | Albertsons Cos, Inc. |
1,345,605 | ||||||||||
| 2,998 | Five Below, Inc. (a) |
391,509 | ||||||||||
| 17,702 | KKR & Co, Inc. |
970,247 | ||||||||||
| 2,707,361 | ||||||||||||
Semiconductors - 2.4% |
||||||||||||
| 8,253 | Advanced Micro Devices, Inc. (a) |
840,651 | ||||||||||
| 27,096 | Intel Corp. |
1,203,604 | ||||||||||
| 6,772 | Micron Technology, Inc. |
500,044 | ||||||||||
| 3,655 | NVIDIA Corp. |
682,462 | ||||||||||
| 3,347 | QUALCOMM, Inc. |
479,357 | ||||||||||
| 3,706,118 | ||||||||||||
Software - 8.3% |
||||||||||||
| 6,174 | Fidelity National Information Services, Inc. |
645,183 | ||||||||||
| 32,344 | Microsoft Corp. |
8,793,363 | ||||||||||
| 1,200 | MSCI, Inc. |
530,820 | ||||||||||
| 17,638 | Oracle Corp. |
1,268,525 | ||||||||||
| 7,257 | salesforce.com, Inc. (a) |
1,162,862 | ||||||||||
| 3,501 | Take-Two Interactive Software, Inc. (a) |
435,979 | ||||||||||
| 12,836,732 | ||||||||||||
Telecommunications - 0.9% |
||||||||||||
| 13,689 | AT&T, Inc. |
291,439 | ||||||||||
| 23,947 | Cisco Systems, Inc. |
1,078,812 | ||||||||||
| 1,370,251 | ||||||||||||
Textiles - 0.7% |
||||||||||||
| 7,514 | Mohawk Industries, Inc. (a) |
1,062,930 | ||||||||||
Transportation - 1.1% |
||||||||||||
| 9,533 | United Parcel Service, Inc. |
1,737,389 | ||||||||||
Transportation and Warehousing - 0.3% |
||||||||||||
| 19,200 | Uber Technologies, Inc. (a) |
445,440 | ||||||||||
Utilities - 0.7% |
||||||||||||
| 3,908 | Cheniere Energy, Inc. |
534,497 | ||||||||||
| 19,682 | MDU Resources Group, Inc. |
538,893 | ||||||||||
| 1,073,390 | ||||||||||||
See accompanying notes to financial statements.
58
Horizon ESG Defensive Core Fund |
Shares |
Value |
|||||||||||
Water - 1.2% |
||||||||||||
| 12,358 | American Water Works Co., Inc. |
$ | 1,869,148 | |||||||||
TOTAL COMMON STOCKS (Cost - $110,207,723) |
105,337,860 | |||||||||||
SHORT TERM INVESTMENTS - 2.2% |
||||||||||||
Money Market Funds - 2.2% |
||||||||||||
| 3,330,007 | First American Treasury Obligations Fund, Class X, 0.67% (b) |
3,330,007 | ||||||||||
TOTAL SHORT TERM INVESTMENTS (Cost - $3,330,007) |
3,330,007 | |||||||||||
TOTAL INVESTMENTS - 99.8% (Cost - $159,124,356) |
154,257,247 | |||||||||||
Other Assets in Excess of Liabilities - 0.2% |
351,753 | |||||||||||
NET ASSETS - 100.0% |
$ | 154,609,000 | ||||||||||
Percentages are stated as a percent of net assets.
|
(a) |
Non-income producing security. |
|
(b) |
Interest rate reflects seven-day yield on May 31, 2022. |
|
(c) |
Fair value of this security exceeds 25% of the Fund’s net assets. Additional information for this security, including financial statements, is available from the SEC’s EDGAR database at www.sec.gov. |
See accompanying notes to financial statements.
59
Horizon Funds
Statements of Assets and Liabilities (Unaudited)
May 31, 2022
Horizon Active |
Horizon Active |
Horizon Active |
Horizon Active |
|||||||||||||
Assets: |
||||||||||||||||
Investments in Unaffiliated Securities, at Cost |
$ | 1,019,268,588 | $ | 1,488,719,756 | $ | 520,940,410 | $ | 105,835,347 | ||||||||
Investments in Unaffiliated Securities, at Value (a) |
$ | 1,004,837,720 | $ | 1,464,907,102 | $ | 503,424,438 | $ | 110,831,397 | ||||||||
Receivable for Investment Securities Sold |
— | 209,166,966 | — | — | ||||||||||||
Receivable for Fund Shares Sold |
1,633,964 | 4,862,883 | 791,423 | 96,760 | ||||||||||||
Dividends and Interest Receivable |
12,667 | 59,750 | 1,994 | 282,366 | ||||||||||||
Dividend Reclaims |
— | — | — | 99,738 | ||||||||||||
Prepaid Expenses and Other Assets |
99,498 | 76,068 | 66,980 | 57,024 | ||||||||||||
Total Assets |
1,006,583,849 | 1,679,072,769 | 504,284,835 | 111,367,285 | ||||||||||||
Liabilities: |
||||||||||||||||
Options Written, at Value (Premiums received $0, $1,701,875, $0 and $0) |
— | 1,745,000 | — | — | ||||||||||||
Collateral Received for Securities Loaned (Note 5) |
240,825,029 | 188,066,349 | 79,785,316 | 2,751,168 | ||||||||||||
Payable for Investment Securities Purchased |
— | 238,084,000 | — | — | ||||||||||||
Payable for Fund Shares Redeemed |
378,615 | 726,997 | 393,599 | 126,819 | ||||||||||||
Accrued Administration Fees |
38,382 | 75,139 | 28,845 | 8,613 | ||||||||||||
Accrued Advisory Fees |
627,435 | 1,016,345 | 276,205 | 67,567 | ||||||||||||
Accrued Custodian Fees |
16,550 | 32,429 | 10,315 | 3,990 | ||||||||||||
Accrued Legal Fees |
42,118 | 51,698 | 23,971 | 7,495 | ||||||||||||
Accrued Distribution Fees (12b-1) - Advisor Class |
13,629 | 2,005 | 364 | 27,254 | ||||||||||||
Accrued Shareholder Servicing Fees - Investor Class |
244,208 | — | 14,047 | — | ||||||||||||
Accrued Trustees Fees |
3,621 | 5,297 | 3,359 | 809 | ||||||||||||
Accrued Expenses and Other Liabilities |
72,947 | 103,662 | 72,705 | 21,576 | ||||||||||||
Total Liabilities |
242,262,534 | 429,908,921 | 80,608,726 | 3,015,291 | ||||||||||||
Net Assets |
$ | 764,321,315 | $ | 1,249,163,848 | $ | 423,676,109 | $ | 108,351,994 | ||||||||
Composition of Net Assets: |
||||||||||||||||
Net assets consisted of: |
||||||||||||||||
Paid in Capital |
$ | 778,043,702 | $ | 1,270,184,857 | $ | 484,064,036 | $ | 105,065,728 | ||||||||
Distributable Earnings/(Accumulated Deficit) |
(13,722,387 | ) | (21,021,009 | ) | (60,387,927 | ) | 3,286,266 | |||||||||
Net Assets |
$ | 764,321,315 | $ | 1,249,163,848 | $ | 423,676,109 | $ | 108,351,994 | ||||||||
Investor Class Shares: |
||||||||||||||||
Net Asset Value Per Share: |
||||||||||||||||
Net Assets |
$ | 738,778,877 | $ | 1,209,400,373 | $ | 418,158,185 | $ | 102,764,191 | ||||||||
Shares of Beneficial Interest Outstanding |
57,092,746 | 55,311,796 | 48,773,432 | 1,646,741 | ||||||||||||
Net Asset Value, (Net Assets / Shares Outstanding) Offering and Redemption Price Per Share |
$ | 12.94 | $ | 21.87 | $ | 8.57 | $ | 62.40 | ||||||||
Advisor Class Shares: |
||||||||||||||||
Net Assets |
$ | 3,612,619 | $ | 7,163,996 | $ | 3,789,379 | $ | 5,587,803 | ||||||||
Shares of Beneficial Interest Outstanding |
280,582 | 328,200 | 439,219 | 89,465 | ||||||||||||
Net Asset Value, (Net Assets / Shares Outstanding) Offering and Redemption Price Per Share |
$ | 12.88 | $ | 21.83 | $ | 8.63 | $ | 62.46 | ||||||||
Institutional Class Shares: |
||||||||||||||||
Net Assets |
$ | 21,929,819 | $ | 32,599,479 | $ | 1,728,545 | $ | — | ||||||||
Shares of Beneficial Interest Outstanding |
1,688,768 | 1,487,759 | 202,412 | — | ||||||||||||
Net Asset Value, (Net Assets / Shares Outstanding) Offering and Redemption Price Per Share |
$ | 12.99 | $ | 21.91 | $ | 8.54 | $ | — | ||||||||
(a) Includes loaned securities with a value of: |
$ | 233,782,680 | $ | 183,407,331 | $ | 77,576,609 | $ | 2,679,961 | ||||||||
See accompanying notes to financial statements.
60
Horizon Funds |
Horizon Defined |
Horizon |
Horizon ESG |
||||||||||
Assets: |
||||||||||||
Investments in Unaffiliated Securities, at Cost |
$ | 264,977,737 | $ | 110,901,536 | $ | 159,124,356 | ||||||
Investments in Unaffiliated Securities, at Value (a) |
$ | 296,417,732 | $ | 111,747,802 | $ | 154,257,247 | ||||||
Cash |
2,589 | — | — | |||||||||
Receivable for Investment Securities Sold |
— | — | 13,297,513 | |||||||||
Receivable for Fund Shares Sold |
1,076,010 | 152,476 | 578,958 | |||||||||
Dividends and Interest Receivable |
407,786 | 213,300 | 146,628 | |||||||||
Prepaid Expenses and Other Assets |
46,355 | 51,987 | 49,899 | |||||||||
Total Assets |
297,950,472 | 112,165,565 | 168,330,245 | |||||||||
Liabilities: |
||||||||||||
Options Written, at Value (Premiums Received $6,507,618, $0 and $0) |
5,774,800 | — | — | |||||||||
Collateral Received for Securities Loaned (Note 5) |
144,958 | — | — | |||||||||
Payable for Investment Securities Purchased |
— | — | 13,440,944 | |||||||||
Payable for Fund Shares Redeemed |
217,740 | 57,343 | 51,500 | |||||||||
Accrued Administration Fees |
10,804 | 12,182 | 8,070 | |||||||||
Accrued Advisory Fees |
210,781 | 81,951 | 107,449 | |||||||||
Accrued Custodian Fees |
35,747 | 33,980 | 5,444 | |||||||||
Accrued Legal Fees |
13,914 | 7,172 | 9,733 | |||||||||
Accrued Registration Fees |
8,327 | 2,844 | — | |||||||||
Accrued Distribution Fees (12b-1) - Investor Class |
12,795 | — | 35,672 | |||||||||
Accrued Distribution Fees (12b-1) - Advisor Class |
28,099 | — | 38,918 | |||||||||
Accrued Transfer Agent Fees |
4,613 | 10,240 | 12,206 | |||||||||
Accrued Trustees Fees |
549 | 3,633 | — | |||||||||
Accrued Printing and Mailing Fees |
20,691 | 13,764 | — | |||||||||
Accrued Expenses and Other Liabilities |
14,793 | 10,460 | 11,309 | |||||||||
Total Liabilities |
6,498,611 | 233,569 | 13,721,245 | |||||||||
Net Assets |
$ | 291,451,861 | $ | 111,931,996 | $ | 154,609,000 | ||||||
Composition of Net Assets: |
||||||||||||
Net assets consisted of: |
||||||||||||
Paid in Capital |
$ | 267,443,441 | $ | 106,201,720 | $ | 160,832,864 | ||||||
Distributable Earnings/(Accumulated Deficit) |
24,008,420 | 5,730,276 | (6,223,864 | ) | ||||||||
Net Assets |
$ | 291,451,861 | $ | 111,931,996 | $ | 154,609,000 | ||||||
Investor Class Shares: |
||||||||||||
Net Asset Value Per Share: |
||||||||||||
Net Assets |
$ | 281,977,331 | $ | 111,673,181 | $ | 125,663,496 | ||||||
Shares of Beneficial Interest Outstanding |
4,730,490 | 4,337,632 | 3,910,261 | |||||||||
Net Asset Value, (Net Assets / Shares Outstanding) Offering and Redemption Price Per Share |
$ | 59.61 | $ | 25.75 | $ | 32.14 | ||||||
Advisor Class Shares: |
||||||||||||
Net Assets |
$ | 9,474,530 | $ | 258,815 | $ | 28,945,504 | ||||||
Shares of Beneficial Interest Outstanding |
158,944 | 10,069 | 904,226 | |||||||||
Net Asset Value, (Net Assets / Shares Outstanding) Offering and Redemption Price Per Share |
$ | 59.61 | $ | 25.70 | 32.01 | |||||||
(a) Includes loaned securities with a value of: |
$ | 138,913 | $ | — | $ | — | ||||||
See accompanying notes to financial statements.
61
Horizon Funds
Statements of Operations (Unaudited)
For the Period Ended May 31, 2022
Horizon Active |
Horizon Active |
Horizon Active |
Horizon Active |
|||||||||||||
Investment Income: |
||||||||||||||||
Dividend Income from unaffiliated securities (net of foreign withholdings tax of $0, $12, $0 and $30,199) |
$ | 7,882,687 | $ | 11,158,790 | $ | 5,137,416 | $ | 1,944,275 | ||||||||
Interest Income |
19,554 | 30,636 | 5,054 | 1,198 | ||||||||||||
Total Investment Income |
7,902,241 | 11,189,426 | 5,142,470 | 1,945,473 | ||||||||||||
Expenses: |
||||||||||||||||
Investment Advisory Fees |
3,701,079 | 5,964,576 | 1,682,510 | 500,529 | ||||||||||||
Shareholder Servicing Fees - Investor Class |
363,607 | 581,456 | 215,527 | — | ||||||||||||
Administrative & Accounting Service Fees |
146,518 | 230,261 | 93,387 | 34,977 | ||||||||||||
Transfer Agent Fees |
75,772 | 75,366 | 43,665 | 19,058 | ||||||||||||
Registration Fees |
43,635 | 52,654 | 29,497 | 22,623 | ||||||||||||
Trustees’ Fees and Expenses |
37,312 | 60,175 | 22,793 | 7,256 | ||||||||||||
Legal Fees |
32,952 | 50,846 | 19,860 | 6,136 | ||||||||||||
Chief Compliance Officer & Compliance Fees |
22,481 | 35,563 | 14,404 | 4,611 | ||||||||||||
Custodian Fees |
17,018 | 32,896 | 10,743 | 5,698 | ||||||||||||
Printing and Postage Expenses |
10,170 | 9,986 | 6,475 | 12,546 | ||||||||||||
Audit Fees |
7,528 | 8,820 | 5,285 | 4,288 | ||||||||||||
Insurance Fees |
7,280 | 12,012 | 4,550 | 1,636 | ||||||||||||
Miscellaneous Expenses |
7,031 | 11,245 | 11,112 | 8,157 | ||||||||||||
Distribution Fees (12b-1) - Advisor Class |
5,009 | 10,141 | 5,221 | 13,164 | ||||||||||||
Distribution Fees (12b-1) - Investor Class |
— | — | — | 61,472 | ||||||||||||
Interest Expense |
536 | 1,139 | — | 635 | ||||||||||||
Total Expenses |
4,477,928 | 7,137,136 | 2,165,029 | 702,786 | ||||||||||||
Securities Lending Expense Offset |
(313,527 | ) | (304,549 | ) | (315,825 | ) | (2,289 | ) | ||||||||
Fees Recouped by the Adviser |
— | — | — | 2,884 | ||||||||||||
Net Expenses |
4,164,401 | 6,832,587 | 1,849,204 | 703,381 | ||||||||||||
Net Investment Income |
3,737,840 | 4,356,839 | 3,293,266 | 1,242,092 | ||||||||||||
Net Realized and Unrealized Gain (Loss) on Investments: |
||||||||||||||||
Net Realized Gain (Loss) on: |
||||||||||||||||
Unaffiliated Investments |
1,698,749 | 14,992,223 | (37,004,717 | ) | (1,248,900 | ) | ||||||||||
Net Long-Term Capital Gain Distributions |
— | — | 345,851 | — | ||||||||||||
Purchased Options |
(730,042 | ) | (7,951,728 | ) | (84,650 | ) | (728,536 | ) | ||||||||
Written Options |
366,481 | 2,095,529 | — | 291,904 | ||||||||||||
Foreign Currency |
— | — | — | (157 | ) | |||||||||||
Net Change in Unrealized Appreciation (Depreciation) on: |
||||||||||||||||
Unaffiliated Investments |
(68,495,833 | ) | (134,737,624 | ) | (16,298,570 | ) | 3,347,932 | |||||||||
Purchased Options |
— | 4,097,319 | — | — | ||||||||||||
Written Options |
— | (294,387 | ) | — | — | |||||||||||
Net Realized and Unrealized Gain (Loss) on Investments |
(67,160,645 | ) | (121,798,668 | ) | (53,042,086 | ) | 1,662,243 | |||||||||
Net Increase (Decrease) in Net Assets Resulting From Operations |
$ | (63,422,805 | ) | $ | (117,441,829 | ) | $ | (49,748,820 | ) | $ | 2,904,335 | |||||
See accompanying notes to financial statements.
62
Horizon Funds |
Horizon Defined |
Horizon |
Horizon ESG |
||||||||||
Investment Income: |
||||||||||||
Dividend Income from unaffiliated securities (net of foreign withholdings tax of $256, $0 and $0) |
$ | 2,111,957 | $ | 1,090,397 | $ | 1,034,820 | ||||||
Interest Income |
8,936 | 1,583 | 2,719 | |||||||||
Total Investment Income |
2,120,893 | 1,091,980 | 1,037,539 | |||||||||
Expenses: |
||||||||||||
Investment Advisory Fees |
1,196,180 | 512,662 | 620,434 | |||||||||
Administrative & Accounting Service Fees |
67,937 | 34,096 | 39,427 | |||||||||
Transfer Agent Fees |
23,751 | 29,137 | 22,159 | |||||||||
Registration Fees |
20,614 | 26,525 | 31,045 | |||||||||
Trustees’ Fees and Expenses |
14,040 | 6,234 | 6,989 | |||||||||
Legal Fees |
12,012 | 5,804 | 8,417 | |||||||||
Chief Compliance Officer & Compliance Fees |
8,863 | 4,389 | 4,436 | |||||||||
Custodian Fees |
25,862 | 11,288 | 8,149 | |||||||||
Printing and Postage Expenses |
6,862 | 6,586 | 6,200 | |||||||||
Audit Fees |
8,110 | 5,047 | 4,559 | |||||||||
Insurance Fees |
2,366 | 1,148 | 1,273 | |||||||||
Miscellaneous Expenses |
3,433 | 3,032 | 2,919 | |||||||||
Distribution Fees (12b-1) - Advisor Class |
25,163 | 635 | 47,188 | |||||||||
Distribution Fees (12b-1) - Investor Class |
139,457 | 63,829 | 64,420 | |||||||||
Interest Expense |
63,861 | — | 4,595 | |||||||||
Total Expenses |
1,618,511 | 710,412 | 872,210 | |||||||||
Securities Lending Expense Offset |
(3,382 | ) | (1,870 | ) | (2,542 | ) | ||||||
Fees Recouped by the Adviser |
64,512 | 15,472 | 40,435 | |||||||||
Fees Waived by the Adviser |
(45,649 | ) | (25,131 | ) | (10,930 | ) | ||||||
Net Expenses |
1,633,992 | 698,883 | 899,173 | |||||||||
Net Investment Income |
486,901 | 393,097 | 138,366 | |||||||||
Net Realized and Unrealized Loss on Investments: |
||||||||||||
Net Realized Gain (Loss) on: |
||||||||||||
Unaffiliated Investments |
8,523,474 | 4,705,427 | (1,322,257 | ) | ||||||||
Purchased Options |
(4,574,753 | ) | — | — | ||||||||
Written Options |
8,360,907 | — | — | |||||||||
Net Change in Unrealized Appreciation (Depreciation) on: |
||||||||||||
Unaffiliated Investments |
(39,082,532 | ) | (10,659,229 | ) | (15,199,707 | ) | ||||||
Purchased Options |
4,811,936 | — | — | |||||||||
Written Options |
1,303,057 | — | — | |||||||||
Net Realized and Unrealized Loss on Investments |
(20,657,911 | ) | (5,953,802 | ) | (16,521,964 | ) | ||||||
Net Decrease in Net Assets Resulting From Operations |
$ | (20,171,010 | ) | $ | (5,560,705 | ) | $ | (16,383,598 | ) | |||
See accompanying notes to financial statements.
63
Horizon Active Asset Allocation Fund
Statements of Changes in Net Assets
For the |
For the |
|||||||
(Unaudited) |
||||||||
Operations: |
||||||||
Net Investment Income |
$ | 3,737,840 | $ | 2,320,356 | ||||
Net Realized Gain on Investments |
1,335,188 | 111,071,166 | ||||||
Net Change in Unrealized Appreciation (Depreciation) on Investments |
(68,495,833 | ) | 8,531,036 | |||||
Net Increase (Decrease) in Net Assets Resulting From Operations |
(63,422,805 | ) | 121,922,558 | |||||
Distributions to Shareholders From: |
||||||||
Distributable Earnings |
||||||||
Investor Class |
(99,771,775 | ) | (34,106,308 | ) | ||||
Advisor Class |
(555,980 | ) | (242,577 | ) | ||||
Institutional Class |
(1,228,725 | ) | (102,761 | ) | ||||
Total Distributions to Shareholders |
(101,556,480 | ) | (34,451,646 | ) | ||||
Capital Share Transactions: |
||||||||
Proceeds from Shares Issued |
||||||||
Investor Class |
196,296,662 | 227,419,365 | ||||||
Advisor Class |
879,323 | 3,254,356 | ||||||
Institutional Class |
15,451,291 | 7,550,592 | ||||||
Distributions Reinvested |
||||||||
Investor Class |
96,237,129 | 32,878,445 | ||||||
Advisor Class |
477,816 | 175,788 | ||||||
Institutional Class |
1,228,725 | 102,761 | ||||||
Cost of Shares Redeemed |
||||||||
Investor Class |
(122,004,171 | ) | (138,514,355 | ) | ||||
Advisor Class |
(719,094 | ) | (10,335,613 | ) | ||||
Institutional Class |
(851,442 | ) | (958,583 | ) | ||||
Net Increase in Net Assets Resulting From Beneficial Interest Transactions |
186,996,239 | 121,572,756 | ||||||
Increase in Net Assets |
22,016,954 | 209,043,668 | ||||||
Net Assets: |
||||||||
Beginning of Period/Year |
742,304,361 | 533,260,693 | ||||||
End of Period/Year |
$ | 764,321,315 | $ | 742,304,361 | ||||
Share Activity: |
||||||||
Investor Class: |
||||||||
Shares Issued |
14,243,645 | 14,784,166 | ||||||
Shares Reinvested |
6,569,087 | 2,412,212 | ||||||
Shares Redeemed |
(8,829,797 | ) | (9,138,510 | ) | ||||
Net Increase |
11,982,935 | 8,057,868 | ||||||
Advisor Class: |
||||||||
Shares Issued |
60,814 | 212,938 | ||||||
Shares Reinvested |
32,750 | 12,935 | ||||||
Shares Redeemed |
(54,809 | ) | (701,409 | ) | ||||
Net Increase (Decrease) |
38,755 | (475,536 | ) | |||||
Institutional Class: |
||||||||
Shares Issued |
1,118,651 | 480,872 | ||||||
Shares Reinvested |
83,587 | 7,523 | ||||||
Shares Redeemed |
(61,561 | ) | (62,991 | ) | ||||
Net Increase |
1,140,677 | 425,404 | ||||||
See accompanying notes to financial statements.
64
Horizon Active Risk Assist® Fund |
For the |
For the |
|||||||
(Unaudited) |
||||||||
Operations: |
||||||||
Net Investment Income |
$ | 4,356,839 | $ | 3,614,211 | ||||
Net Realized Gain on Investments |
9,136,024 | 138,822,828 | ||||||
Net Change in Unrealized Appreciation (Depreciation) on Investments |
(130,934,692 | ) | 39,478,273 | |||||
Net Increase (Decrease) in Net Assets Resulting From Operations |
(117,441,829 | ) | 181,915,312 | |||||
Distributions to Shareholders From: |
||||||||
Distributable Earnings |
||||||||
Investor Class |
(92,274,740 | ) | (2,892,895 | ) | ||||
Advisor Class |
(670,237 | ) | (21,213 | ) | ||||
Institutional Class |
(2,756,632 | ) | (191,051 | ) | ||||
Total Distributions to Shareholders |
(95,701,609 | ) | (3,105,159 | ) | ||||
Capital Share Transactions: |
||||||||
Proceeds from Shares Issued |
||||||||
Investor Class |
293,322,024 | 487,069,905 | ||||||
Advisor Class |
1,676,745 | 5,093,043 | ||||||
Institutional Class |
5,151,532 | 13,298,835 | ||||||
Distributions Reinvested |
||||||||
Investor Class |
89,219,671 | 2,802,160 | ||||||
Advisor Class |
506,313 | 11,471 | ||||||
Institutional Class |
2,756,632 | 191,051 | ||||||
Cost of Shares Redeemed |
||||||||
Investor Class |
(124,193,603 | ) | (269,268,764 | ) | ||||
Advisor Class |
(1,871,724 | ) | (4,336,374 | ) | ||||
Institutional Class |
(3,519,211 | ) | (26,148,481 | ) | ||||
Net Increase in Net Assets Resulting From Beneficial Interest Transactions |
263,048,379 | 208,712,846 | ||||||
Increase in Net Assets |
49,904,941 | 387,522,999 | ||||||
Net Assets: |
||||||||
Beginning of Period/Year |
1,199,258,907 | 811,735,908 | ||||||
End of Period/Year |
$ | 1,249,163,848 | $ | 1,199,258,907 | ||||
Share Activity: |
||||||||
Investor Class: |
||||||||
Shares Issued |
12,730,369 | 19,982,192 | ||||||
Shares Reinvested |
3,540,463 | 126,053 | ||||||
Shares Redeemed |
(5,231,727 | ) | (11,010,288 | ) | ||||
Net Increase |
11,039,105 | 9,097,957 | ||||||
Advisor Class: |
||||||||
Shares Issued |
72,331 | 203,354 | ||||||
Shares Reinvested |
20,116 | 516 | ||||||
Shares Redeemed |
(82,927 | ) | (179,653 | ) | ||||
Net Increase |
9,520 | 24,217 | ||||||
Institutional Class: |
||||||||
Shares Issued |
217,585 | 528,056 | ||||||
Shares Reinvested |
109,217 | 8,583 | ||||||
Shares Redeemed |
(149,608 | ) | (1,087,228 | ) | ||||
Net Increase (Decrease) |
177,194 | (550,589 | ) | |||||
See accompanying notes to financial statements.
65
Horizon Active Income Fund |
For the |
For the |
|||||||
(Unaudited) |
||||||||
Operations: |
||||||||
Net Investment Income |
$ | 3,293,266 | $ | 8,295,232 | ||||
Net Realized Gain (Loss) on Investments |
(36,743,516 | ) | 4,881,604 | |||||
Net Change in Unrealized Depreciation on Investments |
(16,298,570 | ) | (12,630,691 | ) | ||||
Net Increase (Decrease) in Net Assets Resulting From Operations |
(49,748,820 | ) | 546,145 | |||||
Distributions to Shareholders From: |
||||||||
Distributable Earnings |
||||||||
Investor Class |
(5,203,799 | ) | (8,093,689 | ) | ||||
Advisor Class |
(45,308 | ) | (66,528 | ) | ||||
Institutional Class |
(23,523 | ) | (11,668 | ) | ||||
Total Distributions to Shareholders |
(5,272,630 | ) | (8,171,885 | ) | ||||
Capital Share Transactions: |
||||||||
Proceeds from Shares Issued |
||||||||
Investor Class |
78,367,064 | 141,229,985 | ||||||
Advisor Class |
283,666 | 1,459,593 | ||||||
Institutional Class |
99,515 | 1,827,312 | ||||||
Distributions Reinvested |
||||||||
Investor Class |
5,034,584 | 7,655,394 | ||||||
Advisor Class |
41,254 | 60,743 | ||||||
Institutional Class |
23,523 | 11,669 | ||||||
Cost of Shares Redeemed |
||||||||
Investor Class |
(43,951,996 | ) | (139,310,713 | ) | ||||
Advisor Class |
(10,461 | ) | (955,809 | ) | ||||
Institutional Class |
(402,470 | ) | (177,553 | ) | ||||
Net Increase in Net Assets Resulting From Beneficial Interest Transactions |
39,484,679 | 11,800,621 | ||||||
Increase (Decrease) in Net Assets |
(15,536,771 | ) | 4,174,881 | |||||
Net Assets: |
||||||||
Beginning of Period/Year |
439,212,880 | 435,037,999 | ||||||
End of Period/Year |
$ | 423,676,109 | $ | 439,212,880 | ||||
Share Activity: |
||||||||
Investor Class: |
||||||||
Shares Issued |
8,532,095 | 14,430,458 | ||||||
Shares Reinvested |
543,402 | 780,131 | ||||||
Shares Redeemed |
(4,862,482 | ) | (14,191,720 | ) | ||||
Net Increase |
4,213,015 | 1,018,869 | ||||||
Advisor Class: |
||||||||
Shares Issued |
31,283 | 148,383 | ||||||
Shares Reinvested |
4,407 | 6,155 | ||||||
Shares Redeemed |
(45,756 | ) | (96,666 | ) | ||||
Net Increase (Decrease) |
(10,066 | ) | 57,872 | |||||
Institutional Class: |
||||||||
Shares Issued |
10,929 | 188,513 | ||||||
Shares Reinvested |
2,545 | 1,196 | ||||||
Shares Redeemed |
(1,141 | ) | (18,280 | ) | ||||
Net Increase |
12,333 | 171,429 | ||||||
See accompanying notes to financial statements.
66
Horizon Active Dividend Fund |
For the |
For the |
|||||||
(Unaudited) |
||||||||
Operations: |
||||||||
Net Investment Income |
$ | 1,242,092 | $ | 2,118,554 | ||||
Net Realized Gain (Loss) on Investments |
(1,685,689 | ) | 24,626,582 | |||||
Net Change in Unrealized Appreciation (Depreciation) on Investments |
3,347,932 | (8,305,569 | ) | |||||
Net Increase in Net Assets Resulting From Operations |
2,904,335 | 18,439,567 | ||||||
Distributions to Shareholders From: |
||||||||
Distributable Earnings |
||||||||
Investor Class |
(4,494,051 | ) | (1,968,824 | ) | ||||
Advisor Class |
(365,210 | ) | (153,721 | ) | ||||
Total Distributions to Shareholders |
(4,859,261 | ) | (2,122,545 | ) | ||||
Capital Share Transactions: |
||||||||
Proceeds from Shares Issued |
||||||||
Investor Class |
15,683,905 | 36,122,278 | ||||||
Advisor Class |
1,378,715 | 5,302,054 | ||||||
Distributions Reinvested |
||||||||
Investor Class |
4,493,350 | 1,968,366 | ||||||
Advisor Class |
301,724 | 121,012 | ||||||
Cost of Shares Redeemed |
||||||||
Investor Class |
(38,939,714 | ) | (34,672,833 | ) | ||||
Advisor Class |
(6,821,512 | ) | (4,502,876 | ) | ||||
Net Increase (Decrease) in Net Assets Resulting From Beneficial Interest Transactions |
(23,903,532 | ) | 4,338,001 | |||||
Increase (Decrease) in Net Assets |
(25,858,458 | ) | 20,655,023 | |||||
Net Assets: |
||||||||
Beginning of Period/Year |
134,210,452 | 113,555,429 | ||||||
End of Period/Year |
$ | 108,351,994 | $ | 134,210,452 | ||||
Share Activity: |
||||||||
Investor Class: |
||||||||
Shares Issued |
248,368 | 585,198 | ||||||
Shares Reinvested |
70,246 | 32,484 | ||||||
Shares Redeemed |
(627,781 | ) | (566,407 | ) | ||||
Net Increase (Decrease) |
(309,167 | ) | 51,275 | |||||
Advisor Class: |
||||||||
Shares Issued |
21,715 | 85,855 | ||||||
Shares Reinvested |
4,696 | 1,979 | ||||||
Shares Redeemed |
(110,507 | ) | (73,957 | ) | ||||
Net Increase (Decrease) |
(84,096 | ) | 13,877 | |||||
See accompanying notes to financial statements.
67
Horizon Defined Risk Fund |
For the |
For the |
|||||||
(Unaudited) |
||||||||
Operations: |
||||||||
Net Investment Income |
$ | 486,901 | $ | 790,086 | ||||
Net Realized Gain (Loss) on Investments |
12,309,628 | (600,537 | ) | |||||
Net Change in Unrealized Appreciation (Depreciation) on Investments |
(32,967,539 | ) | 25,356,887 | |||||
Net Increase (Decrease) in Net Assets Resulting From Operations |
(20,171,010 | ) | 25,546,436 | |||||
Distributions to Shareholders From: |
||||||||
Distributable Earnings |
||||||||
Investor Class |
(737,808 | ) | (1,227,816 | ) | ||||
Advisor Class |
(24,320 | ) | (96,990 | ) | ||||
Total Distributions to Shareholders |
(762,128 | ) | (1,324,806 | ) | ||||
Capital Share Transactions: |
||||||||
Proceeds from Shares Issued |
||||||||
Investor Class |
125,190,095 | 115,234,241 | ||||||
Advisor Class |
10,274,512 | 5,188,089 | ||||||
Distributions Reinvested |
||||||||
Investor Class |
737,630 | 1,227,606 | ||||||
Advisor Class |
18,974 | 79,341 | ||||||
Cost of Shares Redeemed |
||||||||
Investor Class |
(71,884,434 | ) | (102,424,408 | ) | ||||
Advisor Class |
(18,828,577 | ) | (12,446,407 | ) | ||||
Net Increase in Net Assets Resulting From Beneficial Interest Transactions |
45,508,200 | 6,858,462 | ||||||
Increase in Net Assets |
24,575,062 | 31,080,092 | ||||||
Net Assets: |
||||||||
Beginning of Period/Year |
266,876,799 | 235,796,707 | ||||||
End of Period/Year |
$ | 291,451,861 | $ | 266,876,799 | ||||
Share Activity: |
||||||||
Investor Class: |
||||||||
Shares Issued |
2,032,131 | 1,905,755 | ||||||
Shares Reinvested |
11,281 | 21,402 | ||||||
Shares Redeemed |
(1,204,293 | ) | (1,738,726 | ) | ||||
Net Increase |
839,119 | 188,431 | ||||||
Advisor Class: |
||||||||
Shares Issued |
163,603 | 86,687 | ||||||
Shares Reinvested |
290 | 1,382 | ||||||
Shares Redeemed |
(317,274 | ) | (211,432 | ) | ||||
Net Decrease |
(153,381 | ) | (123,363 | ) | ||||
See accompanying notes to financial statements.
68
Horizon U.S. Defensive Equity Fund |
For the |
For the |
|||||||
(Unaudited) |
||||||||
Operations: |
||||||||
Net Investment Income |
$ | 393,097 | $ | 739,881 | ||||
Net Realized Gain on Investments |
4,705,427 | 42,206,376 | ||||||
Net Change in Unrealized Depreciation on Investments |
(10,659,229 | ) | (8,489,917 | ) | ||||
Net Increase (Decrease) in Net Assets Resulting From Operations |
(5,560,705 | ) | 34,456,340 | |||||
Distributions to Shareholders From: |
||||||||
Distributable Earnings |
||||||||
Investor Class |
(27,097,405 | ) | (630,763 | ) | ||||
Advisor Class |
(116,302 | ) | (2,114 | ) | ||||
Total Distributions to Shareholders |
(27,213,707 | ) | (632,877 | ) | ||||
Capital Share Transactions: |
||||||||
Proceeds from Shares Issued |
||||||||
Investor Class |
33,821,442 | 67,919,425 | ||||||
Advisor Class |
36,720 | 471,245 | ||||||
Distributions Reinvested |
||||||||
Investor Class |
27,092,996 | 630,700 | ||||||
Advisor Class |
108,577 | 1,793 | ||||||
Cost of Shares Redeemed |
||||||||
Investor Class |
(45,057,380 | ) | (179,674,447 | ) | ||||
Advisor Class |
(289,330 | ) | (794,678 | ) | ||||
Net Increase (Decrease) in Net Assets Resulting From Beneficial Interest Transactions |
15,713,025 | (111,445,962 | ) | |||||
Decrease in Net Assets |
(17,061,387 | ) | (77,622,499 | ) | ||||
Net Assets: |
||||||||
Beginning of Period/Year |
128,993,383 | 206,615,882 | ||||||
End of Period/Year |
$ | 111,931,996 | $ | 128,993,383 | ||||
Share Activity: |
||||||||
Investor Class: |
||||||||
Shares Issued |
1,266,623 | 2,194,419 | ||||||
Shares Reinvested |
960,404 | 23,010 | ||||||
Shares Redeemed |
(1,720,235 | ) | (5,958,565 | ) | ||||
Net Increase (Decrease) |
506,792 | (3,741,136 | ) | |||||
Advisor Class: |
||||||||
Shares Issued |
1,309 | 15,089 | ||||||
Shares Reinvested |
3,853 | 65 | ||||||
Shares Redeemed |
(11,349 | ) | (25,777 | ) | ||||
Net Decrease |
(6,187 | ) | (10,623 | ) | ||||
See accompanying notes to financial statements.
69
Horizon ESG Defensive Core Fund |
For the |
For the |
|||||||
(Unaudited) |
||||||||
Operations: |
||||||||
Net Investment Income |
$ | 138,366 | $ | 246,460 | ||||
Net Realized Gain (Loss) on Investments |
(1,322,257 | ) | 3,842,643 | |||||
Net Change in Unrealized Appreciation (Depreciation) on Investments |
(15,199,707 | ) | 9,409,842 | |||||
Net Increase (Decrease) in Net Assets Resulting From Operations |
(16,383,598 | ) | 13,498,945 | |||||
Distributions to Shareholders From: |
||||||||
Distributable Earnings |
||||||||
Investor Class |
(3,104,199 | ) | (129,856 | ) | ||||
Advisor Class |
(907,265 | ) | (116,569 | ) | ||||
Total Distributions to Shareholders |
(4,011,464 | ) | (246,425 | ) | ||||
Capital Share Transactions: |
||||||||
Proceeds from Shares Issued |
||||||||
Investor Class |
51,680,247 | 116,890,815 | ||||||
Advisor Class |
18,384,185 | 33,554,687 | ||||||
Distributions Reinvested |
||||||||
Investor Class |
3,103,217 | 129,856 | ||||||
Advisor Class |
904,064 | 116,569 | ||||||
Cost of Shares Redeemed |
||||||||
Investor Class |
(33,771,453 | ) | (10,958,613 | ) | ||||
Advisor Class |
(20,816,354 | ) | (5,733,229 | ) | ||||
Net Increase in Net Assets Resulting From Beneficial Interest Transactions |
19,483,906 | 134,000,085 | ||||||
Increase (Decrease) in Net Assets |
(911,156 | ) | 147,252,605 | |||||
Net Assets: |
||||||||
Beginning of Period/Year |
155,520,156 | 8,267,551 | ||||||
End of Period/Year |
$ | 154,609,000 | $ | 155,520,156 | ||||
Share Activity: |
||||||||
Investor Class: |
||||||||
Shares Issued |
1,516,067 | 3,505,622 | ||||||
Shares Reinvested |
84,144 | 4,473 | ||||||
Shares Redeemed |
(1,023,936 | ) | (314,559 | ) | ||||
Net Increase |
576,275 | 3,195,536 | ||||||
Advisor Class: |
||||||||
Shares Issued |
532,518 | 995,465 | ||||||
Shares Reinvested |
24,594 | 4,025 | ||||||
Shares Redeemed |
(632,201 | ) | (169,431 | ) | ||||
Net Increase (Decrease) |
(75,089 | ) | 830,059 | |||||
See accompanying notes to financial statements.
70
Horizon Active Asset Allocation Fund
Financial Highlights
The table below sets forth financial data for one share of beneficial interest outstanding throughout each period/year.
Investor Class |
||||||||||||||||||||||||
For the |
For the |
For the |
For the |
For the |
For the |
|||||||||||||||||||
(Unaudited) |
||||||||||||||||||||||||
Net Asset Value, Beginning of Period/Year |
$ | 16.17 | $ | 14.07 | $ | 12.61 | $ | 12.68 | $ | 14.20 | $ | 11.56 | ||||||||||||
Income From Investment Operations: |
||||||||||||||||||||||||
Net investment income (c,f) |
0.07 | 0.06 | 0.09 | 0.08 | 0.07 | (h) | 0.08 | |||||||||||||||||
Net gain (loss) from investments (both realized and unrealized) |
(1.11 | ) | 2.96 | 1.46 | 0.65 | (0.02 | )(h) | 2.66 | ||||||||||||||||
Total from investment operations |
(1.04 | ) | 3.02 | 1.55 | 0.73 | 0.05 | 2.74 | |||||||||||||||||
Less Distributions: |
||||||||||||||||||||||||
From net investment income |
(0.10 | ) | (0.07 | ) | (0.09 | ) | (0.08 | ) | (0.07 | ) | (0.10 | ) | ||||||||||||
From net realized gains |
(2.09 | ) | (0.85 | ) | — | (0.72 | ) | (1.50 | ) | — | ||||||||||||||
Total Distributions |
(2.19 | ) | (0.92 | ) | (0.09 | ) | (0.80 | ) | (1.57 | ) | (0.10 | ) | ||||||||||||
Net Asset Value, Beginning of Period/Year |
$ | 12.94 | $ | 16.17 | $ | 14.07 | $ | 12.61 | $ | 12.68 | $ | 14.20 | ||||||||||||
Total Return |
(7.99 | )%(j) | 22.63 | % | 12.32 | % | 7.23 | % | 0.46 | % | 23.76 | % | ||||||||||||
Ratios/Supplemental Data |
||||||||||||||||||||||||
Net assets, end of period/year (in 000’s) |
$ | 738,779 | $ | 729,517 | $ | 521,477 | $ | 508,839 | $ | 477,097 | $ | 393,833 | ||||||||||||
Ratio to average net assets: |
||||||||||||||||||||||||
Gross expenses (d,e) |
1.20 | %(i) | 1.23 | % | 1.25 | % | 1.21 | % | 1.28 | %(g) | 1.48 | % | ||||||||||||
Net expenses (a,d) |
1.12 | %(i) | 1.14 | % | 1.20 | % | 1.24 | % | 1.27 | %(g) | 1.36 | %(b) | ||||||||||||
Net investment income net of reimbursement (recapture) and securities lending expense offset (d,f) |
1.01 | %(i) | 0.35 | % | 0.75 | % | 0.66 | % | 0.56 | % | 0.61 | % | ||||||||||||
Portfolio turnover rate |
92 | %(j) | 142 | % | 208 | % | 279 | % | 256 | % | 168 | % | ||||||||||||
Portfolio turnover is calculated for the Fund as a whole.
|
(a) |
The ratio of expenses to average net assets includes interest expense which was 0.00%, 0.00%, 0.00%, 0.01%, 0.00%, and 0.00%, respectively. |
|
(b) |
Effective July 1, 2017, Shareholder Servicing Fees for Investor Class shares decreased from 0.25% to 0.10% of average daily net assets. |
|
(c) |
Per share amounts are calculated using the average shares method. |
|
(d) |
Does not reflect the expenses of the underlying funds in which the Fund invests. |
|
(e) |
Represents the ratio of expenses to average net assets absent securities lending expense offset, fee waivers and/or expense reimbursements by the Adviser. |
|
(f) |
Recognition of net investment income by the Fund is affected by the timing of the declaration of dividends by the underlying investment companies in which the Fund invests. The ratio does not include net investment income of the investment companies in which the Fund invests. |
|
(g) |
Effective March 30, 2018, the Operating Expense Limit for the Investor Class decreased from 1.27% to 1.17%. This excludes 0.10% of Shareholder Servicing Fees (See Note 3). |
|
(h) |
Due to timing of shareholder transactions, and allocations of expenses among share classes, the per unit amounts presented may not coincide with the aggregate presentation on the Statements of Operations. |
|
(i) |
Annualized. |
|
(j) |
Not annualized. |
See accompanying notes to financial statements.
71
Horizon Active Asset Allocation Fund |
The table below sets forth financial data for one share of beneficial interest outstanding throughout each period/year.
Advisor Class |
||||||||||||||||||||||||
For the |
For the |
For the |
For the |
For the |
For the |
|||||||||||||||||||
(Unaudited) |
||||||||||||||||||||||||
Net Asset Value, Beginning of Period/Year |
$ | 16.10 | $ | 14.01 | $ | 12.55 | $ | 12.62 | $ | 14.16 | $ | 11.56 | ||||||||||||
Income From Investment Operations: |
||||||||||||||||||||||||
Net investment income (b,f) |
0.06 | 0.03 | 0.08 | 0.07 | 0.05 | (e) | 0.05 | |||||||||||||||||
Net gain (loss) from investments (both realized and unrealized) |
(1.10 | ) | 2.95 | 1.45 | 0.65 | (0.02 | )(e) | 2.68 | ||||||||||||||||
Total from investment operations |
(1.04 | ) | 2.98 | 1.53 | 0.72 | 0.03 | 2.73 | |||||||||||||||||
Less Distributions: |
||||||||||||||||||||||||
From net investment income |
(0.09 | ) | (0.04 | ) | (0.07 | ) | (0.07 | ) | (0.07 | ) | (0.13 | ) | ||||||||||||
From net realized gains |
(2.09 | ) | (0.85 | ) | — | (0.72 | ) | (1.50 | ) | — | ||||||||||||||
Total Distributions |
(2.18 | ) | (0.89 | ) | (0.07 | ) | (0.79 | ) | (1.57 | ) | (0.13 | ) | ||||||||||||
Net Asset Value, End of Period/Year |
$ | 12.88 | $ | 16.10 | $ | 14.01 | $ | 12.55 | $ | 12.62 | $ | 14.16 | ||||||||||||
Total Return |
(8.05 | )%(i) | 22.43 | % | 12.24 | % | 7.12 | % | 0.29 | % | 23.64 | % | ||||||||||||
Ratios/Supplemental Data |
||||||||||||||||||||||||
Net assets, end of period/year (in 000’s) |
$ | 3,613 | $ | 3,893 | $ | 10,052 | $ | 7,879 | $ | 7,187 | $ | 5,084 | ||||||||||||
Ratio to average net assets: |
||||||||||||||||||||||||
Gross expenses (c,d) |
1.35 | %(h) | 1.38 | % | 1.41 | % | 1.39 | % | 1.43 | %(g) | 1.55 | % | ||||||||||||
Net expenses (a,c) |
1.27 | %(h) | 1.29 | % | 1.25 | % | 1.39 | % | 1.42 | %(g) | 1.42 | % | ||||||||||||
Net investment income net of reimbursement (recapture) and securities lending expense offset (c,f) |
0.85 | %(h) | 0.21 | % | 0.63 | % | 0.57 | % | 0.38 | % | 0.35 | % | ||||||||||||
Portfolio turnover rate |
92 | %(i) | 142 | % | 208 | % | 279 | % | 256 | % | 168 | % | ||||||||||||
Portfolio turnover is calculated for the Fund as a whole.
|
(a) |
The ratio of expenses to average net assets includes interest expense which was 0.00%, 0.00%, 0.00%, 0.00%, 0.00%, and 0.00% respectively. |
|
(b) |
Per share amounts are calculated using the average shares method. |
|
(c) |
Does not reflect the expenses of the underlying funds in which the Fund invests. |
|
(d) |
Represents the ratio of expenses to average net assets absent securities lending expense offset, fee waivers and/or expense reimbursements by the Adviser. |
|
(e) |
Due to timing of shareholder transactions, and allocations of expenses among share classes, the per unit amounts presented may not coincide with the aggregate presentation on the Statements of Operations. |
|
(f) |
Recognition of net investment income by the Fund is affected by the timing of the declaration of dividends by the underlying investment companies in which the Fund invests. The ratio does not include net investment income of the investment companies in which the Fund invests. |
|
(g) |
Effective March 30, 2018, the Operating Expense Limit for the Advisor Class decreased from 1.42% to 1.17% and now excludes 0.25% of Distribution Fees (12b-1) (See Note 3). |
|
(h) |
Annualized. |
|
(i) |
Not annualized. |
See accompanying notes to financial statements.
72
Horizon Active Asset Allocation Fund |
The table below sets forth financial data for one share of beneficial interest outstanding throughout each period/year.
Institutional Class |
||||||||||||||||||||||||
For the |
For the |
For the |
For the |
For the |
For the |
|||||||||||||||||||
(Unaudited) |
||||||||||||||||||||||||
Net Asset Value, Beginning of Period/Year |
$ | 16.23 | $ | 14.11 | $ | 12.64 | $ | 12.71 | $ | 14.22 | $ | 11.59 | ||||||||||||
Income From Investment Operations: |
||||||||||||||||||||||||
Net investment income (b,f) |
0.05 | 0.08 | 0.12 | 0.10 | 0.09 | (e) | 0.05 | |||||||||||||||||
Net gain (loss) from investments (both realized and unrealized) |
(1.08 | ) | 2.97 | 1.44 | 0.65 | (0.03 | )(e) | 2.71 | ||||||||||||||||
Total from investment operations |
(1.03 | ) | 3.05 | 1.56 | 0.75 | 0.06 | 2.76 | |||||||||||||||||
Less Distributions: |
||||||||||||||||||||||||
From net investment income |
(0.12 | ) | (0.08 | ) | (0.09 | ) | (0.10 | ) | (0.07 | ) | (0.13 | ) | ||||||||||||
From net realized gains |
(2.09 | ) | (0.85 | ) | — | (0.72 | ) | (1.50 | ) | — | ||||||||||||||
Total Distributions |
(2.21 | ) | (0.93 | ) | (0.09 | ) | (0.82 | ) | (1.57 | ) | (0.13 | ) | ||||||||||||
Net Asset Value, End of Period/Year |
$ | 12.99 | $ | 16.23 | $ | 14.11 | $ | 12.64 | $ | 12.71 | $ | 14.22 | ||||||||||||
Total Return |
(7.94 | )%(h) | 22.82 | % | 12.44 | % | 7.33 | % | 0.55 | % | 23.92 | % | ||||||||||||
Ratios/Supplemental Data |
||||||||||||||||||||||||
Net assets, end of period/year (in 000’s) |
$ | 21,930 | $ | 8,894 | $ | 1,732 | $ | 28,631 | $ | 30,230 | $ | 29,010 | ||||||||||||
Ratio to average net assets: |
||||||||||||||||||||||||
Gross expenses (c,d) |
1.09 | %(g) | 1.13 | % | 1.16 | % | 1.14 | % | 1.18 | % | 1.30 | % | ||||||||||||
Net expenses (a,c) |
1.01 | %(g) | 1.05 | % | 1.01 | % | 1.16 | % | 1.17 | % | 1.17 | % | ||||||||||||
Net investment income net of reimbursement (recapture) and securities lending expense offset (c,f) |
0.67 | %(g) | 0.47 | % | 1.01 | % | 0.80 | % | 0.68 | % | 0.38 | % | ||||||||||||
Portfolio turnover rate |
92 | %(h) | 142 | % | 208 | % | 279 | % | 256 | % | 168 | % | ||||||||||||
Portfolio turnover is calculated for the Fund as a whole.
|
(a) |
The ratio of expenses to average net assets includes interest expense which was 0.00%, 0.00%, 0.00%, 0.00%, 0.00% and 0.00%, respectively. |
|
(b) |
Per share amounts are calculated using the average shares method. |
|
(c) |
Does not reflect the expenses of the underlying funds in which the Fund invests. |
|
(d) |
Represents the ratio of expenses to average net assets absent securities lending expense offset, fee waivers and/or expense reimbursements by the Adviser. |
|
(e) |
Due to timing of shareholder transactions, and allocations of expenses among share classes, the per unit amounts presented may not coincide with the aggregate presentation on the Statements of Operations. |
|
(f) |
Recognition of net investment income by the Fund is affected by the timing of the declaration of dividends by the underlying investment companies in which the Fund invests. The ratio does not include net investment income of the investment companies in which the Fund invests. |
|
(g) |
Annualized. |
|
(h) |
Not annualized. |
See accompanying notes to financial statements.
73
Horizon Active Risk Assist® Fund |
The table below sets forth financial data for one share of beneficial interest outstanding throughout each period/year.
Investor Class |
||||||||||||||||||||||||
For the |
For the |
For the |
For the |
For the |
For the |
|||||||||||||||||||
(Unaudited) |
||||||||||||||||||||||||
Net Asset Value, Beginning of Period/Year |
$ | 26.13 | $ | 21.74 | $ | 21.38 | $ | 21.69 | $ | 22.80 | $ | 19.31 | ||||||||||||
Income From Investment Operations: |
||||||||||||||||||||||||
Net investment income (c,f) |
0.09 | 0.08 | 0.16 | (h) | 0.12 | 0.13 | 0.12 | |||||||||||||||||
Net gain (loss) from investments (both realized and unrealized) |
(2.28 | ) | 4.39 | 0.42 | (h) | 0.33 | (0.21 | ) | 3.54 | |||||||||||||||
Total from investment operations |
(2.19 | ) | 4.47 | 0.58 | 0.45 | (0.08 | ) | 3.66 | ||||||||||||||||
Less Distributions: |
||||||||||||||||||||||||
From net investment income |
(0.17 | ) | (0.08 | ) | (0.22 | ) | (0.12 | ) | (0.12 | ) | (0.17 | ) | ||||||||||||
From net realized gains |
(1.90 | ) | — | — | (0.64 | ) | (0.91 | ) | — | |||||||||||||||
Total Distributions |
(2.07 | ) | (0.08 | ) | (0.22 | ) | (0.76 | ) | (1.03 | ) | (0.17 | ) | ||||||||||||
Net Asset Value, End of Period/Year |
$ | 21.87 | $ | 26.13 | $ | 21.74 | $ | 21.38 | $ | 21.69 | $ | 22.80 | ||||||||||||
Total Return |
(9.44 | )%(j) | 20.64 | % | 2.71 | % | 2.52 | % | (0.31 | )% | 19.05 | % | ||||||||||||
Ratios/Supplemental Data |
||||||||||||||||||||||||
Net assets, end of period/year (in 000’s) |
$ | 1,209,400 | $ | 1,156,627 | $ | 764,775 | $ | 738,854 | $ | 682,077 | $ | 418,227 | ||||||||||||
Ratio to average net assets: |
||||||||||||||||||||||||
Gross expenses (d,e) |
1.19 | %(i) | 1.22 | % | 1.25 | % | 1.20 | % | 1.28 | %(g) | 1.49 | % | ||||||||||||
Net expenses (a,d) |
1.14 | %(i) | 1.16 | % | 1.20 | % | 1.24 | % | 1.27 | %(g) | 1.35 | %(b) | ||||||||||||
Net investment income net of reimbursement (recapture) and securities lending expense offset (d,f) |
0.72 | %(i) | 0.34 | % | 0.81 | % | 0.60 | % | 0.58 | % | 0.58 | % | ||||||||||||
Portfolio turnover rate |
179 | %(j) | 108 | % | 462 | % | 368 | % | 275 | % | 143 | % | ||||||||||||
Portfolio turnover is calculated for the Fund as a whole.
|
(a) |
The ratio of expenses to average net assets includes interest expense which was 0.00%, 0.00%, 0.00%, 0.00%, 0.00%, and 0.00%, respectively. |
|
(b) |
Effective July 1, 2017, Shareholder Servicing Fees for Investor Class shares decreased from 0.25% to 0.10% of average daily net assets. |
|
(c) |
Per share amounts are calculated using the average shares method. |
|
(d) |
Does not reflect the expenses of the underlying funds in which the Fund invests. |
|
(e) |
Represents the ratio of expenses to average net assets absent securities lending expense offset, fee waivers and/or expense reimbursements by the Adviser. |
|
(f) |
Recognition of net investment income by the Fund is affected by the timing of the declaration of dividends by the underlying investment companies in which the Fund invests. The ratio does not include net investment income of the investment companies in which the Fund invests. |
|
(g) |
Effective March 30, 2018, the Operating Expense Limit for the Investor Class decreased from 1.27% to 1.17%. This excludes 0.10% of Shareholder Servicing Fees (See Note 3). |
|
(h) |
Due to timing of shareholder transactions, and allocations of expenses among share classes, the per unit amounts presented may not coincide with the aggregate presentation on the Statement of Operations. |
|
(i) |
Annualized. |
|
(j) |
Not annualized. |
See accompanying notes to financial statements.
74
Horizon Active Risk Assist® Fund |
The table below sets forth financial data for one share of beneficial interest outstanding throughout each period/year.
Advisor Class |
||||||||||||||||||||||||
For the |
For the |
For the |
For the |
For the |
For the |
|||||||||||||||||||
(Unaudited) |
||||||||||||||||||||||||
Net Asset Value, Beginning of Period/Year |
$ | 26.08 | $ | 21.73 | $ | 21.36 | $ | 21.66 | $ | 22.78 | $ | 19.30 | ||||||||||||
Income From Investment Operations: |
||||||||||||||||||||||||
Net investment income (loss) (b,e) |
0.08 | 0.05 | (0.04 | )(g) | 0.10 | 0.11 | 0.11 | |||||||||||||||||
Net gain (loss) from investments (both realized and unrealized) |
(2.28 | ) | 4.37 | 0.57 | (g) | 0.32 | (0.23 | ) | 3.54 | |||||||||||||||
Total from investment operations |
(2.20 | ) | 4.42 | 0.53 | 0.42 | (0.12 | ) | 3.65 | ||||||||||||||||
Less Distributions: |
||||||||||||||||||||||||
From net investment income |
(0.15 | ) | (0.07 | ) | (0.16 | ) | (0.08 | ) | (0.09 | ) | (0.17 | ) | ||||||||||||
From net realized gains |
(1.90 | ) | — | — | (0.64 | ) | (0.91 | ) | — | |||||||||||||||
Total Distributions |
(2.05 | ) | (0.07 | ) | (0.16 | ) | (0.72 | ) | (1.00 | ) | (0.17 | ) | ||||||||||||
Net Asset Value, End of Period/Year |
$ | 21.83 | $ | 26.08 | $ | 21.73 | $ | 21.36 | $ | 21.66 | $ | 22.78 | ||||||||||||
Total Return |
(9.49 | )%(i) | 20.41 | % | 2.50 | % | 2.37 | % | (0.46 | )% | 19.03 | % | ||||||||||||
Ratios/Supplemental Data |
||||||||||||||||||||||||
Net assets, end of period/year (in 000’s) |
$ | 7,164 | $ | 8,312 | $ | 6,399 | $ | 177 | $ | 388 | $ | 347 | ||||||||||||
Ratio to average net assets: |
||||||||||||||||||||||||
Gross expenses (c,d) |
1.34 | %(h) | 1.37 | % | 1.43 | % | 1.38 | % | 1.43 | %(f) | 1.56 | % | ||||||||||||
Net expenses (a,c) |
1.29 | %(h) | 1.31 | % | 1.37 | % | 1.42 | % | 1.42 | %(f) | 1.42 | % | ||||||||||||
Net investment income (loss) net of reimbursement (recapture) and securities lending expense offset (c,e) |
0.64 | %(h) | 0.21 | % | (0.18 | )% | 0.49 | % | 0.48 | % | 0.53 | % | ||||||||||||
Portfolio turnover rate |
179 | %(i) | 108 | % | 462 | % | 368 | % | 275 | % | 143 | % | ||||||||||||
Portfolio turnover is calculated for the Fund as a whole.
|
(a) |
The ratio of expenses to average net assets includes interest expense which was 0.00%, 0.00%, 0.00%, 0.00%, 0.00%, and 0.00%, respectively. |
|
(b) |
Per share amounts are calculated using the average shares method. |
|
(c) |
Does not reflect the expenses of the underlying funds in which the Fund invests. |
|
(d) |
Represents the ratio of expenses to average net assets absent securities lending expense offset, fee waivers and/or expense reimbursements by the Adviser. |
|
(e) |
Recognition of net investment income (loss) by the Fund is affected by the timing of the declaration of dividends by the underlying investment companies in which the Fund invests. The ratio does not include net investment income of the investment companies in which the Fund invests. |
|
(f) |
Effective March 30, 2018, the Operating Expense Limit for the Advisor Class decreased from 1.42% to 1.17%. This excludes 0.25% of Distribution Fees (12b-1) (See Note 3). |
|
(g) |
Due to timing of shareholder transactions, and allocations of expenses among share classes, the per unit amounts presented may not coincide with the aggregate presentation on the Statement of Operations. |
|
(h) |
Annualized. |
|
(i) |
Not annualized. |
See accompanying notes to financial statements.
75
Horizon Active Risk Assist® Fund |
The table below sets forth financial data for one share of beneficial interest outstanding throughout each period/year.
Institutional Class |
||||||||||||||||||||||||
For the |
For the |
For the |
For the |
For the |
For the |
|||||||||||||||||||
(Unaudited) |
||||||||||||||||||||||||
Net Asset Value, Beginning of Period/Year |
$ | 26.19 | $ | 21.79 | $ | 21.43 | $ | 21.72 | $ | 22.84 | $ | 19.33 | ||||||||||||
Income From Investment Operations: |
||||||||||||||||||||||||
Net investment income (loss) (b,e) |
0.10 | 0.13 | 0.23 | (f) | 0.10 | 0.14 | (0.14 | ) | ||||||||||||||||
Net gain (loss) from investments (both realized and unrealized) |
(2.29 | ) | 4.37 | 0.36 | (f) | 0.39 | (0.20 | ) | 3.86 | |||||||||||||||
Total from investment operations |
(2.19 | ) | 4.50 | 0.59 | 0.49 | (0.06 | ) | 3.72 | ||||||||||||||||
Less Distributions: |
||||||||||||||||||||||||
From net investment income |
(0.19 | ) | (0.10 | ) | (0.23 | ) | (0.14 | ) | (0.15 | ) | (0.21 | ) | ||||||||||||
From net realized gains |
(1.90 | ) | — | — | (0.64 | ) | (0.91 | ) | — | |||||||||||||||
Total Distributions |
(2.09 | ) | (0.10 | ) | (0.23 | ) | (0.78 | ) | (1.06 | ) | (0.21 | ) | ||||||||||||
Net Asset Value, End of Period/Year |
$ | 21.91 | $ | 26.19 | $ | 21.79 | $ | 21.43 | $ | 21.72 | $ | 22.84 | ||||||||||||
Total Return |
(9.42 | )%(h) | 20.75 | % | 2.78 | % | 2.70 | % | (0.21 | )% | 19.31 | % | ||||||||||||
Ratios/Supplemental Data |
||||||||||||||||||||||||
Net assets, end of period/year (in 000’s) |
$ | 32,599 | $ | 34,320 | $ | 40,562 | $ | 62,964 | $ | 22,714 | $ | 6,633 | ||||||||||||
Ratio to average net assets: |
||||||||||||||||||||||||
Gross expenses (c,d) |
1.09 | %(g) | 1.12 | % | 1.15 | % | 1.13 | % | 1.19 | % | 1.35 | % | ||||||||||||
Net expenses (a,c) |
1.04 | %(g) | 1.06 | % | 1.09 | % | 1.08 | % | 1.14 | % | 1.17 | % | ||||||||||||
Net investment income (loss) net of reimbursement (recapture) and securities lending expense offset (c,e) |
0.84 | %(g) | 0.54 | % | 1.14 | % | 0.47 | % | 0.61 | % | (0.62 | )% | ||||||||||||
Portfolio turnover rate |
179 | %(h) | 108 | % | 462 | % | 368 | % | 275 | % | 143 | % | ||||||||||||
Portfolio turnover is calculated for the Fund as a whole.
|
(a) |
The ratio of expenses to average net assets includes interest expense which was 0.00%, 0.00%, 0.00%, 0.00%, 0.00% and 0.00%, respectively. |
|
(b) |
Per share amounts are calculated using the average shares method. |
|
(c) |
Does not reflect the expenses of the underlying funds in which the Fund invests. |
|
(d) |
Represents the ratio of expenses to average net assets absent securities lending expense offset, fee waivers and/or expense reimbursements by the Adviser. |
|
(e) |
Recognition of net investment income (loss) by the Fund is affected by the timing of the declaration of dividends by the underlying investment companies in which the Fund invests. The ratio does not include net investment income of the investment companies in which the Fund invests. |
|
(f) |
Due to timing of shareholder transactions, and allocations of expenses among share classes, the per unit amounts presented may not coincide with the aggregate presentation on the Statement of Operations. |
|
(g) |
Annualized. |
|
(h) |
Not annualized. |
See accompanying notes to financial statements.
76
Horizon Active Income Fund |
The table below sets forth financial data for one share of beneficial interest outstanding throughout each period/year.
Investor Class |
||||||||||||||||||||||||
For the |
For the |
For the |
For the |
For the |
For the |
|||||||||||||||||||
(Unaudited) |
||||||||||||||||||||||||
Net Asset Value, Beginning of Period/Year |
$ | 9.72 | $ | 9.90 | $ | 9.44 | $ | 9.13 | $ | 9.73 | $ | 9.56 | ||||||||||||
Income From Investment Operations: |
||||||||||||||||||||||||
Net investment income (c,f) |
0.07 | 0.19 | 0.18 | 0.29 | 0.30 | 0.25 | ||||||||||||||||||
Net gain (loss) from investments (both realized and unrealized) |
(1.11 | ) | (0.18 | ) | 0.50 | 0.31 | (0.64 | ) | 0.17 | |||||||||||||||
Total from investment operations |
(1.04 | ) | 0.01 | 0.68 | 0.60 | (0.34 | ) | 0.42 | ||||||||||||||||
Less Distributions: |
||||||||||||||||||||||||
From net investment income |
(0.11 | ) | (0.19 | ) | (0.22 | ) | (0.29 | ) | (0.26 | ) | (0.25 | ) | ||||||||||||
Total Distributions |
(0.11 | ) | (0.19 | ) | (0.22 | ) | (0.29 | ) | (0.26 | ) | (0.25 | ) | ||||||||||||
Net Asset Value, End of Period/Year |
$ | 8.57 | $ | 9.72 | $ | 9.90 | $ | 9.44 | $ | 9.13 | $ | 9.73 | ||||||||||||
Total Return |
(10.76 | )%(i) | 0.11 | % | 7.29 | % | 6.78 | % | (3.58 | )% | 4.39 | % | ||||||||||||
Ratios/Supplemental Data |
||||||||||||||||||||||||
Net assets, end of period/year (in 000’s) |
$ | 418,158 | $ | 432,982 | $ | 430,958 | $ | 272,400 | $ | 275,992 | $ | 200,521 | ||||||||||||
Ratio to average net assets: |
||||||||||||||||||||||||
Gross expenses (d,e) |
0.99 | %(h) | 1.03 | % | 1.05 | % | 1.03 | % | 1.09 | %(g) | 1.21 | % | ||||||||||||
Net expenses (a,d) |
0.85 | %(h) | 0.95 | % | 0.90 | % | 0.88 | % | 0.98 | %(g) | 1.18 | %(b) | ||||||||||||
Net investment income net of reimbursement (recapture) and securities lending expense offset (d,f) |
1.51 | %(h) | 1.98 | % | 1.87 | % | 3.13 | % | 3.16 | % | 2.54 | % | ||||||||||||
Portfolio turnover rate |
95 | %(i) | 93 | % | 225 | % | 167 | % | 155 | % | 175 | % | ||||||||||||
Portfolio turnover is calculated for the Fund as a whole.
|
(a) |
The ratio of expenses to average net assets includes interest and dividend expense which was 0.00%, 0.00%, 0.01%, 0.00%, 0.00%, and 0.00%, respectively. |
|
(b) |
Effective July 1, 2017, Shareholder Servicing Fees for Investor Class shares decreased from 0.25% to 0.10% of average daily net assets. |
|
(c) |
Per share amounts are calculated using the average shares method. |
|
(d) |
Does not reflect the expenses of the underlying funds in which the Fund invests. |
|
(e) |
Represents the ratio of expenses to average net assets absent securities lending expense offset, fee waivers and/or expense reimbursements by the Adviser. |
|
(f) |
Recognition of net investment income by the Fund is affected by the timing of the declaration of dividends by the underlying investment companies in which the Fund invests. The ratio does not include net investment income of the investment companies in which the Fund invests. |
|
(g) |
Effective March 30, 2018, the Operating Expense Limit for the Investor Class decreased from 1.09% to 0.99%. This excludes 0.10% of Shareholder Servicing Fees (See Note 3). |
|
(h) |
Annualized. |
|
(i) |
Not annualized. |
See accompanying notes to financial statements.
77
Horizon Active Income Fund |
The table below sets forth financial data for one share of beneficial interest outstanding throughout each period/year.
Advisor Class |
||||||||||||||||||||||||
For the |
For the |
For the |
For the |
For the |
For the |
|||||||||||||||||||
(Unaudited) |
||||||||||||||||||||||||
Net Asset Value, Beginning of Period/Year |
$ | 9.77 | $ | 9.95 | $ | 9.47 | $ | 9.16 | $ | 9.76 | $ | 9.60 | ||||||||||||
Income From Investment Operations: |
||||||||||||||||||||||||
Net investment income (b,e) |
0.06 | 0.18 | 0.18 | 0.26 | 0.29 | 0.13 | ||||||||||||||||||
Net gain (loss) from investments (both realized and unrealized) |
(1.10 | ) | (0.18 | ) | 0.47 | 0.32 | (0.63 | ) | 0.28 | |||||||||||||||
Total from investment operations |
(1.04 | ) | (0.00 | ) | 0.65 | 0.58 | (0.34 | ) | 0.41 | |||||||||||||||
Less Distributions: |
||||||||||||||||||||||||
From net investment income |
(0.10 | ) | (0.18 | ) | (0.17 | ) | (0.27 | ) | (0.26 | ) | (0.25 | ) | ||||||||||||
Total Distributions |
(0.10 | ) | (0.18 | ) | (0.17 | ) | (0.27 | ) | (0.26 | ) | (0.25 | ) | ||||||||||||
Net Asset Value, End of Period/Year |
$ | 8.63 | $ | 9.77 | $ | 9.95 | $ | 9.47 | $ | 9.16 | $ | 9.76 | ||||||||||||
Total Return |
(10.71 | )%(h) | (0.05 | )% | 6.96 | % | 6.53 | % | (3.58 | )% | 4.31 | % | ||||||||||||
Ratios/Supplemental Data |
||||||||||||||||||||||||
Net assets, end of period/year (in 000’s) |
$ | 3,789 | $ | 4,391 | $ | 3,896 | $ | 2,328 | $ | 1,587 | $ | 661 | ||||||||||||
Ratio to average net assets: |
||||||||||||||||||||||||
Gross expenses (c,d) |
1.14 | %(g) | 1.18 | % | 1.17 | % | 1.20 | % | 1.24 | %(f) | 1.32 | % | ||||||||||||
Net expenses (a,c) |
1.00 | %(g) | 1.10 | % | 1.06 | % | 1.05 | % | 1.04 | %(f) | 1.24 | % | ||||||||||||
Net investment income net of reimbursement (recapture) and securities lending expense offset (c,e) |
1.37 | %(g) | 1.82 | % | 1.90 | % | 2.79 | % | 3.07 | % | 1.37 | % | ||||||||||||
Portfolio turnover rate |
95 | %(h) | 93 | % | 225 | % | 167 | % | 155 | % | 175 | % | ||||||||||||
Portfolio turnover is calculated for the Fund as a whole.
|
(a) |
The ratio of expenses to average net assets includes interest expense which was 0.00%, 0.00%, 0.00%, 0.00%, 0.00% and 0.00%, respectively. |
|
(b) |
Per share amounts are calculated using the average shares method. |
|
(c) |
Does not reflect the expenses of the underlying funds in which the Fund invests. |
|
(d) |
Represents the ratio of expenses to average net assets absent securities lending expense offset, fee waivers and/or expense reimbursements by the Adviser. |
|
(e) |
Recognition of net investment income by the Fund is affected by the timing of the declaration of dividends by the underlying investment companies in which the Fund invests. The ratio does not include net investment income of the investment companies in which the Fund invests. |
|
(f) |
Effective March 30, 2018, the Operating Expense Limit for the Advisor Class decreased from 1.24% to 1.09%. This excludes 0.25% of Distribution Fees (12b-1) (See Note 3). |
|
(g) |
Annualized. |
|
(h) |
Not annualized. |
See accompanying notes to financial statements.
78
Horizon Active Income Fund |
The table below sets forth financial data for one share of beneficial interest outstanding throughout each period/year.
Institutional Class |
||||||||||||||||||||||||
For the |
For the |
For the |
For the |
For the |
For the |
|||||||||||||||||||
(Unaudited) |
||||||||||||||||||||||||
Net Asset Value, Beginning of Period/Year |
$ | 9.68 | $ | 9.86 | $ | 9.43 | $ | 9.13 | $ | 9.72 | $ | 9.57 | ||||||||||||
Income From Investment Operations: |
||||||||||||||||||||||||
Net investment income (b,e) |
0.07 | 0.17 | 0.49 | (f) | 0.29 | 0.31 | 0.25 | |||||||||||||||||
Net gain (loss) from investments (both realized and unrealized) |
(1.09 | ) | (0.15 | ) | 0.17 | (f) | 0.31 | (0.63 | ) | 0.17 | ||||||||||||||
Total from investment operations |
(1.02 | ) | 0.02 | 0.66 | 0.60 | (0.32 | ) | 0.42 | ||||||||||||||||
Less Distributions: |
||||||||||||||||||||||||
From net investment income |
(0.12 | ) | (0.20 | ) | (0.23 | ) | (0.30 | ) | (0.27 | ) | (0.27 | ) | ||||||||||||
Total Distributions |
(0.12 | ) | (0.20 | ) | (0.23 | ) | (0.30 | ) | (0.27 | ) | (0.27 | ) | ||||||||||||
Net Asset Value, End of Period/Year |
$ | 8.54 | $ | 9.68 | $ | 9.86 | $ | 9.43 | $ | 9.13 | $ | 9.72 | ||||||||||||
Total Return |
(10.62 | )%(h) | 0.20 | % | 7.07 | % | 6.83 | % | (3.33 | )% | 4.41 | % | ||||||||||||
Ratios/Supplemental Data |
||||||||||||||||||||||||
Net assets, end of period/year (in 000’s) |
$ | 1,729 | $ | 1,840 | $ | 184 | $ | 8,040 | $ | 7,488 | $ | 8,084 | ||||||||||||
Ratio to average net assets: |
||||||||||||||||||||||||
Gross expenses (c,d) |
0.89 | %(g) | 0.94 | % | 0.93 | % | 0.95 | % | 0.99 | % | 1.03 | % | ||||||||||||
Net expenses (a,c) |
0.75 | %(g) | 0.85 | % | 0.82 | % | 0.80 | % | 0.86 | % | 0.99 | % | ||||||||||||
Net investment income net of reimbursement (recapture) and securities lending expense offset (c,e) |
1.62 | %(g) | 1.74 | % | 5.13 | % | 3.15 | % | 3.28 | % | 2.53 | % | ||||||||||||
Portfolio turnover rate |
95 | %(h) | 93 | % | 225 | % | 167 | % | 155 | % | 175 | % | ||||||||||||
Portfolio turnover is calculated for the Fund as a whole.
|
(a) |
The ratio of expenses to average net assets includes interest expense which was 0.00%, 0.00%, 0.00%, 0.00%, 0.00% and 0.00%, respectively. |
|
(b) |
Per share amounts are calculated using the average shares method. |
|
(c) |
Does not reflect the expenses of the underlying funds in which the Fund invests. |
|
(d) |
Represents the ratio of expenses to average net assets absent securities lending expense offset, fee waivers and/or expense reimbursements by the Adviser. |
|
(e) |
Recognition of net investment income by the Fund is affected by the timing of the declaration of dividends by the underlying investment companies in which the Fund invests. The ratio does not include net investment income of the investment companies in which the Fund invests. |
|
(f) |
Due to timing of shareholder transactions, and allocations of expenses among share classes, the per unit amounts presented may not coincide with the aggregate presentation on the Statement of Operations. |
|
(g) |
Annualized. |
|
(h) |
Not annualized. |
See accompanying notes to financial statements.
79
Horizon Active Dividend Fund |
The table below sets forth financial data for one share of beneficial interest outstanding throughout each period/year.
Investor Class |
||||||||||||||||||||||||
For the |
For the |
For the |
For the |
For the |
For the |
|||||||||||||||||||
(Unaudited) |
||||||||||||||||||||||||
Net Asset Value, Beginning of Period/Year |
$ | 63.02 | $ | 55.01 | $ | 58.58 | $ | 60.03 | $ | 59.15 | $ | 50.00 | ||||||||||||
Income From Investment Operations: |
||||||||||||||||||||||||
Net investment income (c) |
0.59 | 1.03 | 1.19 | 1.47 | 1.18 | (e) | 0.66 | |||||||||||||||||
Net gain (loss) from investments (both realized and unrealized) |
1.15 | 8.02 | (3.25 | ) | 0.27 | (h) | 1.61 | (e) | 9.01 | |||||||||||||||
Total from investment operations |
1.74 | 9.05 | (2.06 | ) | 1.74 | 2.79 | 9.67 | |||||||||||||||||
Less Distributions: |
||||||||||||||||||||||||
From net investment income |
(0.87 | ) | (1.04 | ) | (1.29 | ) | (1.14 | ) | (1.13 | ) | (0.52 | ) | ||||||||||||
From net realized gains |
(1.49 | ) | — | (0.22 | ) | (2.05 | ) | (0.78 | ) | — | ||||||||||||||
Total Distributions |
(2.36 | ) | (1.04 | ) | (1.51 | ) | (3.19 | ) | (1.91 | ) | (0.52 | ) | ||||||||||||
Net Asset Value, End of Period/Year |
$ | 62.40 | $ | 63.02 | $ | 55.01 | $ | 58.58 | $ | 60.03 | $ | 59.15 | ||||||||||||
Total Return |
2.70 | %(g) | 16.58 | % | (3.41 | )% | 3.67 | % | 4.72 | % | 19.45 | %(g) | ||||||||||||
Ratios/Supplemental Data |
||||||||||||||||||||||||
Net assets, end of period/year (in 000’s) |
$ | 102,764 | $ | 123,269 | $ | 104,774 | $ | 156,452 | $ | 39,909 | $ | 24,509 | ||||||||||||
Ratio to average net assets: |
||||||||||||||||||||||||
Gross expenses (d) |
1.04 | %(f) | 1.06 | % | 1.11 | % | 1.09 | % | 1.32 | % | 2.33 | %(f) | ||||||||||||
Net expenses (i) |
1.04 | %(f) | 1.08 | % | 1.09 | % | 1.09 | % | 1.09 | % | 1.09 | %(b,f) | ||||||||||||
Net investment income net of reimbursement (recapture) and securities lending expense offset |
1.88 | %(f) | 1.67 | % | 2.28 | % | 2.59 | % | 1.93 | % | 1.24 | %(f) | ||||||||||||
Portfolio turnover rate |
58 | %(g) | 222 | % | 376 | % | 369 | % | 320 | % | 184 | %(g) | ||||||||||||
Portfolio turnover is calculated for the Fund as a whole.
|
(a) |
Since December 28, 2016 (Commencement of Operations). |
|
(b) |
Effective July 1, 2017, Shareholder Servicing Fees for Investor Class shares decreased from 0.25% to 0.10% of average daily net assets. |
|
(c) |
Per share amounts are calculated using the average shares method. |
|
(d) |
Represents the ratio of expenses to average net assets absent securities lending expense offset, fee waivers and/or expense reimbursements by the Adviser. |
|
(e) |
Due to the timing of shareholder transactions, and allocations of expenses among share classes, the per unit amounts presented may not coincide with the aggregate presentation on the Statements of Operations. |
|
(f) |
Annualized. |
|
(g) |
Not annualized. |
|
(h) |
Net realized and unrealized gain (loss) per share in this caption is a balancing amount necessary to reconcile the change in the net asset value per share for the period, and may not reconcile with the aggregate gain (loss) on the Statements of Operations due to share transactions for the period. |
|
(i) |
The ratio of expenses to average net assets includes interest expense which was 0.00%, 0.00%, 0.00%, 0.00%, 0.00% and 0.00%, respectively. |
See accompanying notes to financial statements.
80
Horizon Active Dividend Fund |
The table below sets forth financial data for one share of beneficial interest outstanding throughout each period/year.
Advisor Class |
||||||||||||||||||||||||
For the |
For the |
For the |
For the |
For the |
For the |
|||||||||||||||||||
(Unaudited) |
||||||||||||||||||||||||
Net Asset Value, Beginning of Period/Year |
$ | 63.04 | $ | 54.99 | $ | 58.56 | $ | 60.00 | $ | 59.13 | $ | 54.31 | ||||||||||||
Income From Investment Operations: |
||||||||||||||||||||||||
Net investment income (b) |
0.51 | 0.95 | 1.13 | 1.37 | 1.04 | (d) | 0.25 | |||||||||||||||||
Net gain (loss) from investments (both realized and unrealized) |
1.17 | 8.04 | (3.28 | ) | 0.29 | (g) | 1.66 | (d) | 4.78 | |||||||||||||||
Total from investment operations |
1.68 | 8.99 | (2.15 | ) | 1.66 | 2.70 | 5.03 | |||||||||||||||||
Less Distributions: |
||||||||||||||||||||||||
From net investment income |
(0.77 | ) | (0.94 | ) | (1.21 | ) | (1.05 | ) | (1.05 | ) | (0.21 | ) | ||||||||||||
From net realized gains |
(1.49 | ) | — | (0.21 | ) | (2.05 | ) | (0.78 | ) | — | ||||||||||||||
Total Distributions |
(2.26 | ) | (0.94 | ) | (1.42 | ) | (3.10 | ) | (1.83 | ) | (0.21 | ) | ||||||||||||
Net Asset Value, End of Period/Year |
$ | 62.46 | $ | 63.04 | $ | 54.99 | $ | 58.56 | $ | 60.00 | $ | 59.13 | ||||||||||||
Total Return |
2.60 | %(f) | 16.45 | % | (3.55 | )% | 3.50 | % | 4.57 | % | 9.28 | %(f) | ||||||||||||
Ratios/Supplemental Data |
||||||||||||||||||||||||
Net assets, end of period/year (in 000’s) |
$ | 5,588 | $ | 10,941 | $ | 8,781 | $ | 27,452 | $ | 10,892 | $ | 3,353 | ||||||||||||
Ratio to average net assets: |
||||||||||||||||||||||||
Gross expenses (c) |
1.19 | %(e) | 1.21 | % | 1.25 | % | 1.24 | % | 1.48 | % | 2.12 | %(e) | ||||||||||||
Net expenses (h) |
1.24 | %(e) | 1.24 | % | 1.24 | % | 1.24 | % | 1.24 | % | 1.24 | %(e) | ||||||||||||
Net investment income net of reimbursement (recapture) and securities lending expense offset |
1.61 | %(e) | 1.52 | % | 2.17 | % | 2.42 | % | 1.71 | % | 1.01 | %(e) | ||||||||||||
Portfolio turnover rate |
58 | %(f) | 222 | % | 376 | % | 369 | % | 320 | % | 184 | %(f) | ||||||||||||
Portfolio turnover is calculated for the Fund as a whole.
|
(a) |
Since June 20, 2017 (Commencement of Operations). |
|
(b) |
Per share amounts are calculated using the average shares method. |
|
(c) |
Represents the ratio of expenses to average net assets absent securities lending expense offset, fee waivers and/or expense reimbursements by the Adviser. |
|
(d) |
Due to the timing of shareholder transactions, and allocations of expenses among share classes, the per unit amounts presented may not coincide with the aggregate presentation on the Statements of Operations. |
|
(e) |
Annualized. |
|
(f) |
Not annualized. |
|
(g) |
Net realized and unrealized gain (loss) per share in this caption is a balancing amount necessary to reconcile the change in the net asset value per share for the period, and may not reconcile with the aggregate gain (loss) on the Statements of Operations due to share transactions for the period. |
|
(h) |
The ratio of expenses to average net assets includes interest expense which was 0.00%, 0.00%, 0.00%, 0.00%, 0.00% and 0.00%, respectively. |
See accompanying notes to financial statements.
81
Horizon Defined Risk Fund |
The table below sets forth financial data for one share of beneficial interest outstanding throughout each period/year.
Investor Class |
||||||||||||||||||||
For the |
For the |
For the |
For the |
For the |
||||||||||||||||
(Unaudited) |
||||||||||||||||||||
Net Asset Value, Beginning of Period/Year |
$ | 63.49 | $ | 56.98 | $ | 54.09 | $ | 51.00 | $ | 50.00 | ||||||||||
Income From Investment Operations: |
||||||||||||||||||||
Net investment income (b) |
0.10 | 0.22 | 0.37 | 0.51 | 0.44 | |||||||||||||||
Net gain (loss) from investments (both realized and unrealized) |
(3.80 | ) | 6.62 | 2.82 | 2.86 | 0.56 | ||||||||||||||
Total from investment operations |
(3.70 | ) | 6.84 | 3.19 | 3.37 | 1.00 | ||||||||||||||
Less Distributions: |
||||||||||||||||||||
From net investment income |
(0.18 | ) | (0.33 | ) | (0.30 | ) | (0.17 | ) | — | |||||||||||
From net realized gains |
— | — | — | (0.11 | ) | — | ||||||||||||||
Total Distributions |
(0.18 | ) | (0.33 | ) | (0.30 | ) | (0.28 | ) | — | |||||||||||
Net Asset Value, End of Period/Year |
$ | 59.61 | $ | 63.49 | $ | 56.98 | $ | 54.09 | $ | 51.00 | ||||||||||
Total Return |
(6.11 | )%(e) | 12.06 | % | 5.93 | % | 6.69 | % | 2.00 | %(e) | ||||||||||
Ratios/Supplemental Data |
||||||||||||||||||||
Net assets, end of period/year (in 000’s) |
$ | 281,977 | $ | 247,061 | $ | 210,993 | $ | 163,322 | $ | 5,915 | ||||||||||
Ratio to average net assets: |
||||||||||||||||||||
Gross expenses (c) |
1.07 | %(d) | 1.11 | % | 1.12 | % | 1.20 | % | 2.28 | %(d) | ||||||||||
Net expenses (f) |
1.08 | %(d) | 1.05 | % | 1.04 | % | 1.04 | % | 1.04 | %(d) | ||||||||||
Net investment income net of reimbursement and securities lending expense offset |
0.33 | %(d) | 0.35 | % | 0.70 | % | 0.99 | % | 0.94 | %(d) | ||||||||||
Portfolio turnover rate |
13 | %(e) | 27 | % | 28 | % | 10 | % | 89 | %(e) | ||||||||||
Portfolio turnover is calculated for the Fund as a whole.
|
(a) |
Since December 28, 2017 (Commencement of Operations). |
|
(b) |
Per share amounts are calculated using the average shares method. |
|
(c) |
Represents the ratio of expenses to average net assets absent securities lending expense offset, fee waivers and/or expense reimbursements by the Adviser. |
|
(d) |
Annualized. |
|
(e) |
Not annualized. |
|
(f) |
The ratio of expenses to average net assets includes interest expense which was 0.04%, 0.01%, 0.00%, 0.00% and 0.00%, respectively. |
See accompanying notes to financial statements.
82
Horizon Defined Risk Fund |
The table below sets forth financial data for one share of beneficial interest outstanding throughout each period/year.
Advisor Class |
||||||||||||||||||||
For the |
For the |
For the |
For the |
For the |
||||||||||||||||
(Unaudited) |
||||||||||||||||||||
Net Asset Value, Beginning of Period/Year |
$ | 63.45 | $ | 56.93 | $ | 54.06 | $ | 50.98 | $ | 50.58 | ||||||||||
Income From Investment Operations: |
||||||||||||||||||||
Net investment income (b) |
0.04 | 0.13 | 0.29 | 0.42 | 0.31 | (d) | ||||||||||||||
Net gain (loss) from investments (both realized and unrealized) |
(3.80 | ) | 6.62 | 2.82 | 2.87 | 0.09 | (d) | |||||||||||||
Total from investment operations |
(3.76 | ) | 6.75 | 3.11 | 3.29 | 0.40 | ||||||||||||||
Less Distributions: |
||||||||||||||||||||
From net investment income |
(0.08 | ) | (0.23 | ) | (0.24 | ) | (0.10 | ) | — | |||||||||||
From net realized gains |
— | — | — | (0.11 | ) | — | ||||||||||||||
Total Distributions |
(0.08 | ) | (0.23 | ) | (0.24 | ) | (0.21 | ) | — | |||||||||||
Net Asset Value, End of Period/Year |
$ | 59.61 | $ | 63.45 | $ | 56.93 | $ | 54.06 | $ | 50.98 | ||||||||||
Total Return |
(6.21 | )%(f) | 11.90 | % | 5.78 | % | 6.51 | % | 0.77 | %(f) | ||||||||||
Ratios/Supplemental Data |
||||||||||||||||||||
Net assets, end of period/year (in 000’s) |
$ | 9,475 | $ | 19,816 | $ | 24,804 | $ | 22,807 | $ | 9,173 | ||||||||||
Ratio to average net assets: |
||||||||||||||||||||
Gross expenses (c) |
1.23 | %(e) | 1.26 | % | 1.28 | % | 1.37 | % | 2.10 | %(e) | ||||||||||
Net expenses (g) |
1.24 | %(e) | 1.20 | % | 1.19 | % | 1.19 | % | 1.19 | %(e) | ||||||||||
Net investment income net of reimbursement and securities lending expense offset |
0.13 | %(e) | 0.21 | % | 0.56 | % | 0.80 | % | 0.75 | %(e) | ||||||||||
Portfolio turnover rate |
13 | %(f) | 27 | % | 28 | % | 10 | % | 89 | %(f) | ||||||||||
Portfolio turnover is calculated for the Fund as a whole.
|
(a) |
Since February 2, 2018 (Commencement of Operations). |
|
(b) |
Per share amounts are calculated using the average shares method. |
|
(c) |
Represents the ratio of expenses to average net assets absent securities lending expense offset, fee waivers and/or expense reimbursements by the Adviser. |
|
(d) |
Due to the timing of shareholder transactions, and allocations of expenses among share classes, the per unit amounts presented may not coincide with the aggregate presentation on the Statements of Operations. |
|
(e) |
Annualized. |
|
(f) |
Not annualized. |
|
(g) |
The ratio of expenses to average net assets includes interest expense which was 0.05%, 0.01%, 0.00%, 0.00% and 0.00%, respectively. |
See accompanying notes to financial statements.
83
Horizon U.S. Defensive Equity Fund |
The table below sets forth financial data for one share of beneficial interest outstanding throughout each period/year.
Investor Class |
||||||||||||||||
For the |
For the |
For the |
For the |
|||||||||||||
(Unaudited) |
||||||||||||||||
Net Asset Value, Beginning of Period/Year |
$ | 33.53 | $ | 27.19 | $ | 26.22 | $ | 25.00 | ||||||||
Income From Investment Operations: |
||||||||||||||||
Net investment income (b) |
0.08 | 0.15 | 0.12 | 0.12 | ||||||||||||
Net gain (loss) from investments (both realized and unrealized) |
(0.74 | ) | 6.27 | 0.91 | 1.10 | |||||||||||
Total from investment operations |
(0.66 | ) | 6.42 | 1.03 | 1.22 | |||||||||||
Less Distributions: |
||||||||||||||||
From net investment income |
(0.18 | ) | (0.08 | ) | (0.06 | ) | — | |||||||||
From net realized gains |
(6.94 | ) | — | — | — | |||||||||||
Total Distributions |
(7.12 | ) | (0.08 | ) | (0.06 | ) | — | |||||||||
Net Asset Value, End of Period/Year |
$ | 25.75 | $ | 33.53 | $ | 27.19 | $ | 26.22 | ||||||||
Total Return |
(3.82 | )%(e) | 23.70 | % | 3.96 | % | 4.88 | %(e) | ||||||||
Ratios/Supplemental Data |
||||||||||||||||
Net assets, end of period/year (in 000’s) |
$ | 111,673 | $ | 128,449 | $ | 205,886 | $ | 85,776 | ||||||||
Ratio to average net assets: |
||||||||||||||||
Gross expenses (c) |
1.11 | %(d) | 1.17 | % | 1.14 | % | 1.93 | %(d) | ||||||||
Net expenses |
1.09 | %(d) | 1.09 | % | 1.09 | % | 1.09 | %(d) | ||||||||
Net investment income net of reimbursement and securities lending expense offset |
0.61 | %(d) | 0.50 | % | 0.49 | % | 1.10 | %(d) | ||||||||
Portfolio turnover rate |
73 | %(e) | 218 | % | 325 | % | 0.11 | %(e) | ||||||||
Portfolio turnover is calculated for the Fund as a whole.
|
(a) |
Since June 26, 2019 (Commencement of Operations). |
|
(b) |
Per share amounts are calculated using the average shares method. |
|
(c) |
Represents the ratio of expenses to average net assets absent securities lending expense offset, fee waivers and/or expense reimbursements by the Adviser. |
|
(d) |
Annualized. |
|
(e) |
Not annualized. |
See accompanying notes to financial statements.
84
Horizon U.S. Defensive Equity Fund |
The table below sets forth financial data for one share of beneficial interest outstanding throughout each period/year.
Advisor Class |
||||||||||||
For the |
For the |
For the |
||||||||||
(Unaudited) |
||||||||||||
Net Asset Value, Beginning of Period/Year |
$ | 33.46 | $ | 27.16 | $ | 26.23 | ||||||
Income From Investment Operations: |
||||||||||||
Net investment income (b) |
0.05 | 0.10 | 0.04 | |||||||||
Net gain (loss) from investments (both realized and unrealized) |
(0.74 | ) | 6.27 | 0.89 | ||||||||
Total from investment operations |
(0.69 | ) | 6.37 | 0.93 | ||||||||
Less Distributions: |
||||||||||||
From net investment income |
(0.13 | ) | (0.07 | ) | — | |||||||
From net realized gains |
(6.94 | ) | — | — | ||||||||
Total Distributions |
(7.07 | ) | (0.07 | ) | — | |||||||
Net Asset Value, End of Period/Year |
$ | 25.70 | $ | 33.46 | $ | 27.16 | ||||||
Total Return |
(3.92 | )%(e) | 23.53 | % | 3.55 | %(e) | ||||||
Ratios/Supplemental Data |
||||||||||||
Net assets, end of period/year (in 000’s) |
$ | 259 | $ | 544 | $ | 730 | ||||||
Ratio to average net assets: |
||||||||||||
Gross expenses (c) |
1.26 | %(d) | 1.32 | % | 1.30 | %(d) | ||||||
Net expenses |
1.24 | %(d) | 1.24 | % | 1.24 | %(d) | ||||||
Net investment income net of reimbursement and securities lending expense offset |
0.40 | %(d) | 0.34 | % | 0.17 | %(d) | ||||||
Portfolio turnover rate |
73 | %(e) | 218 | % | 325 | % | ||||||
Portfolio turnover is calculated for the Fund as a whole.
|
(a) |
Since January 31, 2020 (Commencement of Operations). |
|
(b) |
Per share amounts are calculated using the average shares method. |
|
(c) |
Represents the ratio of expenses to average net assets absent securities lending expense offset, fee waivers and/or expense reimbursements by the Adviser. |
|
(d) |
Annualized. |
|
(e) |
Not annualized. |
See accompanying notes to financial statements.
85
Horizon ESG Defensive Core Fund |
The table below sets forth financial data for one share of beneficial interest outstanding throughout each period/year.
Investor Class |
||||||||||||
For the |
For the |
For the |
||||||||||
(Unaudited) |
||||||||||||
Net Asset Value, Beginning of Period/Year |
$ | 36.09 | $ | 28.78 | $ | 25.00 | ||||||
Income From Investment Operations: |
||||||||||||
Net investment income (b) |
0.03 | 0.11 | 0.19 | (f) | ||||||||
Net gain (loss) from investments (both realized and unrealized) |
(3.06 | ) | 8.01 | 3.59 | (f) | |||||||
Total from investment operations |
(3.03 | ) | 8.12 | 3.78 | ||||||||
Less Distributions: |
||||||||||||
From net investment income |
(0.08 | ) | (0.10 | ) | — | |||||||
From net realized gains |
(0.84 | ) | (0.71 | ) | — | |||||||
Total Distributions |
(0.92 | ) | (0.81 | ) | — | |||||||
Net Asset Value, End of Period/Year |
$ | 32.14 | $ | 36.09 | $ | 28.78 | ||||||
Total Return |
(8.72 | )%(e) | 28.91 | % | 15.12 | %(e) | ||||||
Ratios/Supplemental Data |
||||||||||||
Net assets, end of period/year (in 000’s) |
$ | 125,663 | $ | 120,315 | $ | 3,985 | ||||||
Ratio to average net assets: |
||||||||||||
Gross expenses (c) |
1.01 | %(d) | 1.09 | % | 6.24 | %(d) | ||||||
Net expenses |
1.04 | %(d) | 1.04 | % | 1.04 | %(d) | ||||||
Net investment income net of reimbursement and securities lending expense offset |
0.20 | %(d) | 0.32 | % | 0.73 | %(d) | ||||||
Portfolio turnover rate |
76 | %(e) | 29 | % | 81 | %(e) | ||||||
Portfolio turnover is calculated for the Fund as a whole.
|
(a) |
Since December 26, 2019 (Commencement of Operations). |
|
(b) |
Per share amounts are calculated using the average shares method. |
|
(c) |
Represents the ratio of expenses to average net assets absent securities lending expense offset, fee waivers and/or expense reimbursements by the Adviser. |
|
(d) |
Annualized. |
|
(e) |
Not annualized. |
|
(f) |
Due to the timing of shareholder transactions, and allocations of expenses among share classes, the per unit amounts presented may not coincide with the aggregate presentation on the Statements of Operations. |
See accompanying notes to financial statements.
86
Horizon ESG Defensive Core Fund |
The table below sets forth financial data for one share of beneficial interest outstanding throughout each period/year.
Advisor Class |
||||||||||||
For the |
For the |
For the |
||||||||||
(Unaudited) |
||||||||||||
Net Asset Value, Beginning of Period/Year |
$ | 35.95 | $ | 28.69 | $ | 25.04 | ||||||
Income From Investment Operations: |
||||||||||||
Net investment income (b) |
0.01 | 0.07 | 0.13 | (f) | ||||||||
Net gain (loss) from investments (both realized and unrealized) |
(3.06 | ) | 7.97 | 3.52 | (f) | |||||||
Total from investment operations |
(3.05 | ) | 8.04 | 3.65 | ||||||||
Less Distributions: |
||||||||||||
From net investment income |
(0.05 | ) | (0.07 | ) | — | |||||||
From net realized gains |
(0.84 | ) | (0.71 | ) | — | |||||||
Total Distributions |
(0.89 | ) | (0.78 | ) | — | |||||||
Net Asset Value, End of Period/Year |
$ | 32.01 | $ | 35.95 | $ | 28.69 | ||||||
Total Return |
(8.80 | )%(e) | 28.69 | % | 14.58 | %(e) | ||||||
Ratios/Supplemental Data |
||||||||||||
Net assets, end of period/year (in 000’s) |
$ | 28,946 | $ | 35,205 | $ | 4,283 | ||||||
Ratio to average net assets: |
||||||||||||
Gross expenses (c) |
1.16 | %(d) | 1.28 | % | 4.56 | %(d) | ||||||
Net expenses |
1.19 | %(d) | 1.19 | % | 1.19 | %(d) | ||||||
Net investment income net of reimbursement and securities lending expense offset |
0.04 | %(d) | 0.19 | % | 0.52 | %(d) | ||||||
Portfolio turnover rate |
76 | %(e) | 29 | % | 81 | %(e) | ||||||
Portfolio turnover is calculated for the Fund as a whole.
|
(a) |
Since January 8, 2020 (Commencement of Operations). |
|
(b) |
Per share amounts are calculated using the average shares method. |
|
(c) |
Represents the ratio of expenses to average net assets absent securities lending expense offset, fee waivers and/or expense reimbursements by the Adviser. |
|
(d) |
Annualized. |
|
(e) |
Not annualized. |
|
(f) |
Due to the timing of shareholder transactions, and allocations of expenses among share classes, the per unit amounts presented may not coincide with the aggregate presentation on the Statements of Operations. |
See accompanying notes to financial statements.
87
Horizon Funds
Notes to Financial Statements (Unaudited)
May 31, 2022
|
1. |
ORGANIZATION |
The Horizon Active Asset Allocation Fund, Horizon Active Risk Assist® Fund, Horizon Active Income Fund, Horizon Active Dividend Fund, Horizon Defined Risk Fund, Horizon U.S. Defensive Equity Fund (formerly known as the Horizon Defensive Multi-Factor Fund) and Horizon ESG Defensive Core Fund (each a “Fund” and together the “Funds”) are each diversified series of shares of beneficial interest of Horizon Funds (the “Trust”), a Delaware business trust organized on May 21, 2015 and registered under the Investment Company Act of 1940, as amended (the “1940 Act”) as an open-end management investment company. The investment objective of the Horizon Active Asset Allocation Fund is capital appreciation. The Fund presently offers Investor Class shares, Advisor Class shares and Institutional Class shares, which commenced operations on January 31, 2012, September 4, 2015 and September 9, 2016, respectively. The investment objective of the Horizon Active Risk® Assist Fund is to capture the majority of the returns associated with equity market investments, while mitigating downside risk through use of a risk overlay strategy. The Fund presently offers Investor Class shares, Advisor Class shares and Institutional Class shares, which commenced operations on August 29, 2014, September 4, 2015 and September 9, 2016, respectively. The investment objective of the Horizon Active Income Fund is income. The Fund presently offers Investor Class shares, Advisor Class shares and Institutional Class shares, which commenced operations on September 30, 2013, February 8, 2016 and September 9, 2016, respectively. The investment objective of the Horizon Active Dividend Fund is capital appreciation and current income. The Fund presently offers Investor Class shares and Advisor Class shares, which commenced operations on December 28, 2016 and June 20, 2017, respectively. The investment objective of the Horizon Defined Risk Fund is capital appreciation and capital preservation. The Fund presently offers Investor Class shares and Advisor Class shares, which commenced operations on December 28, 2017 and February 2, 2018, respectively. The investment objective of the Horizon U.S. Defensive Equity Fund is to capture the majority of the returns associated with domestic equity market investments, while mitigating downside risk through use of a risk overlay strategy. The Fund presently offers Investor Class shares and Advisor Class shares which commenced operations on June 26, 2019 and January 31, 2020, respectively. The investment objective of the Horizon ESG Defensive Core Fund is to seek long-term growth of capital, current income and growth of income, while mitigating downside risk through use of a risk overlay strategy (the “Risk Assist® strategy”). The Fund presently offers Investor Class shares and Advisor Class shares, which commenced operations on December 26, 2019 and January 8, 2020, respectively.
Each Fund follows the investment company accounting and reporting guidance of the Financial Accounting Standards Board (“FASB”) Accounting Standards Codification Topic 946 “Financial Services – Investment Companies”.
|
2. |
SUMMARY OF SIGNIFICANT ACCOUNTING POLICIES |
The following is a summary of significant accounting policies followed by the Funds in the preparation of their financial statements. These policies are in conformity with accounting principles generally accepted in the United States of America (“GAAP”). The preparation of financial statements requires management to make estimates and assumptions that affect the reported amounts of assets and liabilities and disclosure of contingent assets and liabilities at the date of the financial statements and the reported amounts of income and expenses for the period. Actual results could differ from those estimates.
The Funds value their investments and financial instruments at fair value as follows. In determining a Fund’s net asset value (“NAV”) per share, equity securities, including common stocks, preferred stocks, and exchange traded funds, for which market quotations are readily available are valued at current market value using the last reported sales price. NASDAQ traded securities are valued using the NASDAQ official closing price (“NOCP”). If the NOCP is not available, such securities shall be valued at the mean between the current bid and ask prices on the day of valuation, or if there has been no sale on such day, at the mean between the current bid and ask prices on the primary exchange. When market quotations received are from an active market, the securities will be classified within Level 1 of the fair value hierarchy. If market quotations are not readily available, then securities are valued at fair value as determined by
88
Horizon Funds |
the Board of Trustees of the Trust (“the Board”) or its delegate. Short-term debt instruments with a remaining maturity of more than 60 days, intermediate and long-term bonds, convertible bonds, and other debt securities are generally valued on the basis of dealer supplied quotations or by a pricing system selected by the Adviser and approved by the Board. Where such prices are not available, valuations will be obtained from brokers who are market makers for such securities. However, in circumstances where the Adviser deems it appropriate to do so, the mean of the bid and asked prices for over-the-counter securities or the last available sale price for exchange-traded debt securities may be used. Where no last sale price for exchange traded debt securities is available, the mean of the bid and asked prices may be used. Short-term debt securities with a remaining maturity of 60 days or less are amortized to maturity, provided such valuations represent fair value. Investments in registered open-end investment companies (including money market funds), other than exchange-traded funds, are valued at their reported NAVs. Purchased and written options are valued primarily at the 4:15 ET composite mean of the bid and the ask.
Other securities and assets for which market quotations are not readily available or for which valuation cannot be provided, as described above, are valued as determined in good faith in accordance with procedures approved by the Board.
The Funds utilize various methods to measure the fair value of all of their investments on a recurring basis. GAAP establishes a hierarchy that prioritizes inputs to valuation methods. The three levels of input are:
Level 1 – Unadjusted quoted prices in active markets for identical assets and liabilities that the Funds have the ability to access.
Level 2 – Observable inputs other than quoted prices included in Level 1 that are observable for the asset or liability, either directly or indirectly. Generally, these inputs may include quoted prices for the identical instrument in an inactive market, prices for similar instruments, interest rates, prepayment speeds, credit risk, yield curves, default rates and similar data. For an option position, these inputs may include, among other things, the implied price volatility of the underlying investment, the current market value of the underlying investment, the time remaining until expiration of the option, the relationship of the strike price to the market price of the underlying investment, and general market conditions.
Level 3 – Unobservable inputs for the asset or liability, to the extent relevant observable inputs are not available, representing the Funds’ own assumptions about the assumptions a market participant would use in valuing the asset or liability, and would be based on the best information available.
The availability of observable inputs can vary from security to security and is affected by a wide variety of factors, including, for example, the type of security, whether the security is new and not yet established in the marketplace, the liquidity of markets, and other characteristics particular to the security. To the extent that valuation is based on models or inputs that are less observable or unobservable in the market, the determination of fair value requires more judgment. Accordingly, the degree of judgment exercised in determining fair value is greatest for instruments categorized in Level 3.
The inputs used to measure fair value may fall into different levels of the fair value hierarchy. In such cases, for disclosure purposes, the level in the fair value hierarchy within which the fair value measurement falls in its entirety, is determined based on the lowest level input that is significant to the fair value measurement in its entirety.
89
Horizon Funds |
The inputs or methodology used for valuing securities are not necessarily an indication of the risk associated with investing in those securities. The following tables summarize the inputs used as of May 31, 2022, for the Funds’ investments measured at value:
Horizon Active Asset Allocation Fund |
||||||||||||||||
Assets * |
Level 1 |
Level 2 |
Level 3 |
Total |
||||||||||||
Investment Companies |
$ | 739,253,452 | $ | — | $ | — | $ | 739,253,452 | ||||||||
Short-Term Investments |
24,759,239 | — | — | 24,759,239 | ||||||||||||
Investments Purchased With Proceeds From Securities Lending |
240,825,029 | — | — | 240,825,029 | ||||||||||||
Total |
$ | 1,004,837,720 | $ | — | $ | — | $ | 1,004,837,720 | ||||||||
Horizon Active Risk Assist® Fund |
||||||||||||||||
Assets * |
Level 1 |
Level 2 |
Level 3 |
Total |
||||||||||||
Investment Companies |
$ | 1,196,823,660 | $ | — | $ | — | $ | 1,196,823,660 | ||||||||
Common Stocks |
29,127,634 | — | — | 29,127,634 | ||||||||||||
Purchased Call Options |
— | 2,745,000 | — | 2,745,000 | ||||||||||||
Purchased Put Options |
— | 475,000 | — | 475,000 | ||||||||||||
Short-Term Investments |
47,669,459 | — | — | 47,669,459 | ||||||||||||
Investments Purchased With Proceeds From Securities Lending |
188,066,349 | — | — | 188,066,349 | ||||||||||||
Total |
$ | 1,461,687,102 | $ | 3,220,000 | $ | — | $ | 1,464,907,102 | ||||||||
Liabilities * |
Level 1 |
Level 2 |
Level 3 |
Total |
||||||||||||
Written Call Options |
$ | — | $ | 1,545,000 | $ | — | $ | 1,545,000 | ||||||||
Written Put Options |
— | 200,000 | $ | 200,000 | ||||||||||||
Total |
$ | — | $ | 1,745,000 | $ | — | $ | 1,745,000 | ||||||||
Horizon Active Income Fund |
||||||||||||||||
Assets * |
Level 1 |
Level 2 |
Level 3 |
Total |
||||||||||||
Investment Companies |
$ | 420,034,342 | $ | — | $ | — | $ | 420,034,342 | ||||||||
Short-Term Investments |
3,604,780 | — | — | 3,604,780 | ||||||||||||
Investments Purchased With Proceeds From Securities Lending |
79,785,316 | — | — | 79,785,316 | ||||||||||||
Total |
$ | 503,424,438 | $ | — | $ | — | $ | 503,424,438 | ||||||||
90
Horizon Funds |
Horizon Active Dividend Fund |
||||||||||||||||
Assets * |
Level 1 |
Level 2 |
Level 3 |
Total |
||||||||||||
Common Stocks |
$ | 105,850,170 | $ | — | $ | — | $ | 105,850,170 | ||||||||
Preferred Stocks |
205,753 | — | — | 205,753 | ||||||||||||
Short-Term Investments |
2,024,306 | — | — | 2,024,306 | ||||||||||||
Investments Purchased With Proceeds From Securities Lending |
2,751,168 | — | — | 2,751,168 | ||||||||||||
Total |
$ | 110,831,397 | $ | — | $ | — | $ | 110,831,397 | ||||||||
Horizon Defined Risk Fund |
||||||||||||||||
Assets * |
Level 1 |
Level 2 |
Level 3 |
Total |
||||||||||||
Common Stocks |
$ | 271,669,359 | $ | — | $ | — | $ | 271,669,359 | ||||||||
Purchased Put Options |
— | 13,606,450 | — | 13,606,450 | ||||||||||||
Short-Term Investments |
10,996,965 | — | — | 10,996,965 | ||||||||||||
Investments Purchased With Proceeds From Securities Lending |
144,958 | — | — | 144,958 | ||||||||||||
Total |
$ | 282,811,282 | $ | 13,606,450 | $ | — | $ | 296,417,732 | ||||||||
Liabilities * |
Level 1 |
Level 2 |
Level 3 |
Total |
||||||||||||
Written Call Options |
$ | — | $ | 2,042,400 | $ | — | $ | 2,042,400 | ||||||||
Written Put Options |
— | 3,732,400 | — | 3,732,400 | ||||||||||||
Total |
$ | — | $ | 5,774,800 | $ | — | $ | 5,774,800 | ||||||||
Horizon U.S. Defensive Equity Fund |
||||||||||||||||
Assets * |
Level 1 |
Level 2 |
Level 3 |
Total |
||||||||||||
Common Stocks |
$ | 108,983,544 | $ | — | $ | — | $ | 108,983,544 | ||||||||
Short-Term Investments |
2,764,258 | — | — | 2,764,258 | ||||||||||||
Total |
$ | 111,747,802 | $ | — | $ | — | $ | 111,747,802 | ||||||||
Horizon ESG Defensive Core Fund |
||||||||||||||||
Assets * |
Level 1 |
Level 2 |
Level 3 |
Total |
||||||||||||
Investment Companies |
$ | 45,589,380 | $ | 45,589,380 | ||||||||||||
Common Stocks |
105,337,860 | $ | — | $ | — | 105,337,860 | ||||||||||
Short-Term Investments |
3,330,007 | — | — | 3,330,007 | ||||||||||||
Total |
$ | 154,257,247 | $ | — | $ | — | $ | 154,257,247 | ||||||||
|
* |
Refer to the Portfolios of Investments for security classifications. |
91
Horizon Funds |
Exchange Traded Funds – The Funds may invest in exchange traded funds (“ETFs”). ETFs are a type of registered investment company that is typically purchased and redeemed at NAV in large blocks of shares called “Creation Units”, and bought and sold in secondary markets on a securities exchange, where its shares trade like common stock. An index-based ETF represents a fixed portfolio of securities designed to track the performance and dividend yield of a particular domestic or foreign market index. Alternatively, ETFs may be actively managed in accordance with a particular investment strategy. The risks of owning an ETF generally reflect the risks of owning the underlying securities they hold, although the lack of liquidity on an ETF could result in it being more volatile.
Option Transactions – Options are derivative financial instruments that give the buyer, in exchange for a premium payment, the right, but not the obligation, to either purchase from (call option) or sell to (put option) the writer a specified underlying instrument at a specified price on or before a specified date. The Funds enter into option contracts to meet the requirements of their trading activities. The risk in writing a call option is that the Funds may incur a loss if the market price of the security increases and the option is exercised. The risk in writing a put option is that the Funds may incur a loss if the market price of the security decreases and the option is exercised. The risk in buying an option is that the Fund pays a premium whether or not the option is exercised. The Funds also have the additional risk of not being able to enter into a closing transaction if a liquid secondary market does not exist.
When a Fund writes a call or put option, an amount equal to the premium received is included in the statement of assets and liabilities as a liability. The amount of the liability is subsequently marked-to-market to reflect the current fair value of the option. If an option expires on its stipulated expiration date or if the Fund enters into a closing purchase transaction, a gain or loss is realized. If a written call or put option is exercised, a gain or loss is realized for the sale of the underlying security and the proceeds from the sale are increased by the premium originally received. As the writer of an option, the Fund has no control over whether the option will be exercised and, as a result, retains the market risk of an unfavorable change in price of the security underlying the written option.
A Fund may purchase put and call options. The Funds engage in options transactions on individual securities, ETFs, or indices to hedge against market declines or generate returns from falling asset prices. If such a decline occurs, the put options will permit the Fund to sell the securities underlying such options at the exercise price, or to close out the options at a profit. The premium paid for a put or call option plus any transaction costs will reduce the benefit, if any, realized by the Fund upon exercise of the option, and, unless the price of the underlying security rises or declines sufficiently, the option may expire worthless to the Fund. In addition, in the event that the price of the security in connection with which an option was purchased moves in a direction favorable to the Fund, the benefits realized by the Fund as a result of such a favorable movement will be reduced by the amount of the premium paid for the option and related transaction costs. Written and purchased options are non-income producing securities. With purchased options, there is minimal counterparty risk to the Fund since these options are exchange traded and the exchange’s clearinghouse, as counterparty to all exchange traded options, guarantees against a possible default.
The average quarterly value outstanding of purchased and written options during the period ended May 31, 2022, were as follows:
|
Horizon Active |
Horizon |
||||||
Purchased Options |
$ | 1,711,250 | $ | 12,240,138 | ||||
Written Options |
$ | 932,500 | $ | 4,984,075 | ||||
92
Horizon Funds |
The following is a summary of the location of derivative investments on the Funds’ Statements of Assets and Liabilities as of May 31, 2022:
Location on the Statements of Assets and Liabilities |
|||
Fund |
Derivatives Investment Type |
Asset Derivatives |
Liability Derivatives |
Horizon Active Risk Assist® Fund |
Equity Risk Contracts |
Investments in Unaffiliated Securities, at Value |
Options Written, at Value |
Horizon Defined Risk Fund |
Equity Risk Contracts |
Investments in Unaffiliated Securities, at Value |
Options Written, at Value |
Horizon Active Risk Assist® Fund |
||||
Derivatives Investment Value |
||||
Purchased Options |
$ | 3,220,000 | ||
Written Options |
$ | 1,745,000 | ||
Horizon Defined Risk Fund |
||||
Derivatives Investment Value |
||||
Purchased Options |
$ | 13,606,450 | ||
Written Options |
$ | 5,774,800 | ||
The following is a summary of the location of derivative investments on the Funds’ Statements of Operations for the period ended May 31, 2022:
Derivative Investment Type |
Location of Gain (Loss) on Derivatives in the Statements of Operations |
Equity Risk contracts |
Net realized gain (loss) from purchased options |
Net realized gain (loss) from written options |
|
Net change in unrealized appreciation (depreciation) on purchased options |
|
Net change in unrealized appreciation (depreciation) on written options |
Horizon Active Asset Allocation Fund |
||||
Realized gain on derivatives recognized in the Statements of Operations |
||||
Derivative Investment Type |
|
|||
Purchased Options |
$ | (730,042 | ) | |
Written Options |
366,481 | |||
| $ | (363,561 | ) | ||
93
Horizon Funds |
Horizon Active Risk Assist® Fund |
||||
Realized gain/(loss) on derivatives recognized in the Statements of Operations |
||||
Derivative Investment Type |
|
|||
Purchased Options |
$ | (7,951,728 | ) | |
Written Options |
2,095,529 | |||
| $ | (5,856,199 | ) | ||
Changes in unrealized appreciation/(depreciation) on derivatives recognized in the Statements of Operations |
||||
Purchased Options |
$ | 4,097,319 | ||
Written Options |
(294,387 | ) | ||
| $ | (6,349,074 | ) | ||
Horizon Active Dividend Fund |
||||
Realized gain/(loss) on derivatives recognized in the Statements of Operations |
||||
Derivative Investment Type |
|
|||
Purchased Options |
$ | (728,536 | ) | |
Written Options |
291,904 | |||
| $ | (436,632 | ) | ||
Horizon Defined Risk Fund |
||||
Realized loss on derivatives recognized in the Statements of Operations |
||||
Derivative Investment Type |
|
|||
Purchased Options |
$ | (4,574,753 | ) | |
Written Options |
8,360,907 | |||
| $ | (3,786,154 | ) | ||
Changes in unrealized appreciation/(depreciation) on derivatives recognized in the Statements of Operations |
||||
Purchased Options |
$ | 4,811,936 | ||
Written Options |
1,303,057 | |||
| $ | 6,114,993 | |||
94
Horizon Funds |
Offsetting of Financial Assets and Derivative Liabilities
The following table presents the Funds’ liability derivatives available for offset under a master netting arrangement net of collateral pledged for the Funds as of May 31, 2022.
Horizon Active Risk Assist® Fund |
||||||||||||||||||||||||
Liabilities: |
Gross Amounts Not Offset |
|||||||||||||||||||||||
Description |
Gross Amounts |
Gross Amounts |
Net Amounts |
Financial |
Collateral |
Net Amount |
||||||||||||||||||
Written Options |
$ | 1,745,000 | (1) | $ | — | $ | 1,745,000 | $ | — | $ | (1,745,000 | )(2) | $ | — | ||||||||||
Total |
$ | 1,745,000 | $ | — | $ | 1,745,000 | $ | — | $ | (1,745,000 | ) | $ | — | |||||||||||
Horizon Defined Risk Fund |
||||||||||||||||||||||||
Liabilities: |
Gross Amounts Not Offset |
|||||||||||||||||||||||
Description |
Gross Amounts |
Gross Amounts |
Net Amounts |
Financial |
Collateral |
Net Amount |
||||||||||||||||||
Written Options |
$ | 5,774,800 | (1) | $ | — | $ | 5,774,800 | $ | — | $ | (5,774,800 | )(2) | $ | — | ||||||||||
Total |
$ | 5,774,800 | $ | — | $ | 5,774,800 | $ | — | $ | (5,774,800 | ) | $ | — | |||||||||||
|
(1) |
Written options at value as presented in the Portfolios of Investments. |
|
(2) |
The amount is limited to the derivative liability balance and, accordingly, does not include excess collateral pledged. |
Due to the absence of a master netting agreement relating to the Funds’ participation in securities lending, no additional disclosures have been made on behalf of the Funds. Please reference Note 5 for collateral related to securities on loan.
Security Transactions and Investment Income – Investment security transactions are accounted for on a trade date basis. Cost is determined and gains and losses are based upon the specific identification method for both financial statement and federal income tax purposes. Dividend income and expense is recorded on the ex-dividend date and interest income is recorded on the accrual basis. Long-term capital gain distributions from investment companies if any, are recorded separately from dividend income. Purchase discounts and premiums on securities are accreted and amortized over the life of the respective securities using the effective interest method.
Investment in Other Investment Companies – To the extent that a Fund invests in other investment companies, shareholders may obtain a copy of the underlying investment companies’ financial statements on the EDGAR Database on the SEC’s internet site at http://www.sec.gov. Copies of information on the SEC’s internet site may also be obtained, upon payment of a duplicating fee, by electronic request at the following e-mail address: [email protected].
95
Horizon Funds |
Expenses – Expenses of the Trust that are directly identifiable to a specific Fund are charged to that Fund. Expenses, which are not readily identifiable to a specific Fund, are allocated in such a manner as deemed equitable, taking into consideration the nature and type of expense and the relative sizes of the Funds in the Trust. Income, other non-class-specific expenses, and realized and unrealized gains and losses on investments are allocated to each class of shares based on its relative net assets.
Federal Income Taxes – It is each Fund’s policy to comply with all sections of the Internal Revenue Code applicable to regulated investment companies and to distribute all of its taxable income and gains to its shareholders and therefore, no provision for federal income tax has been made. Each Fund is treated as a separate taxpayer for federal income tax purposes.
The Funds recognize the tax benefits of uncertain tax positions only where the position is “more likely than not” to be sustained assuming examination by tax authorities. Management has analyzed the Funds’ tax positions, and has concluded that no liability for unrecognized tax benefits should be recorded related to uncertain tax positions taken on returns filed for open tax years or expected to be taken on the Funds’ 2021 tax returns. The Funds identified their major tax jurisdictions as U.S. Federal, North Carolina State and Delaware State; however, the Funds are not aware of any tax positions for which it is reasonably possible that the total amounts of unrecognized tax benefits will change materially in the next twelve months.
The Funds recognize interest and penalties, if any, related to unrecognized tax benefits as income tax expense in the Statement of Operations.
Distributions to Shareholders – Distributions from investment income, if any, are declared and paid at least annually for the Horizon Active Asset Allocation Fund, Horizon Active Risk Assist® Fund, Horizon Defined Risk, Horizon U.S. Defensive Equity Fund, and Horizon ESG Defensive Core Fund and quarterly for the Horizon Active Income Fund and Horizon Active Dividend Fund and are recorded on the ex-dividend date. The Funds will declare and pay net realized capital gains, if any, annually. The character of income and gains to be distributed is determined in accordance with income tax regulations, which may differ from GAAP.
Shareholder Services Plan – The Board has adopted a shareholder serving plan (the “Plan”) for Investor Class Shares of the Horizon Active Asset Allocation Fund, Horizon Active Risk Assist® Fund, and the Horizon Active Income Fund. The Plan allows the Funds to use part of their assets for shareholder servicing expenses. The Shareholder Servicing Expenses for the Investor Class shares of the Horizon Active Asset Allocation Fund, Horizon Active Risk Assist® Fund, and Horizon Active Income Fund are currently 0.10% of average daily net assets. For these services, the Funds pay a fee up to 0.10% of average net assets attributable to Investor Class shares of the Funds on an annualized basis. Payments under the Plan are made for the provision of support services to shareholders, including administrative or other shareholder support services such as responding to customer inquiries or assisting the Funds in establishing or maintaining shareholder accounts and records. The entities providing shareholder services may provide such services directly, or may arrange for such services to be provided by another entity that has a servicing relationship with one or more shareholders. However, payments under the Plan are an operating expense of each Fund that is not subject to the expense limitation provided by the Adviser. Payments under the Plan may vary and are determined by the respective Fund in its sole discretion, in amounts up to 0.10% of the Fund’s average daily net assets attributable to Investor Class shares of the Fund on an annualized basis.
Rule 12b-1 – The Trust, with respect to all Funds, has adopted a Distribution Plan for Advisor Class shares of each Fund, and also for Investor Class shares of the Horizon Active Dividend Fund, Horizon Defined Risk Fund, the Horizon U.S. Defensive Equity Fund and the Horizon ESG Defensive Core Fund pursuant to Rule 12b-1 under the 1940 Act (the “12b-1 Plan”). However, payments under the 12b-1 Plan are an operating expense of each Fund that is not subject to the expense limitation provided by the Adviser. The 12b-1 Plan provides for the payment of a distribution fee to Quasar Distributors, LLC (the “Distributor”) at an annualized rate of up to 0.25% of the average
96
Horizon Funds |
daily net assets attributable to the applicable classes. During the period ended May 31, 2022 the distribution fees accrued for the Investor Class shares of the Horizon Active Dividend Fund, Horizon Defined Risk Fund, Horizon U.S. Defensive Equity Fund, Horizon ESG Defensive Core Fund and for the Advisor Class shares of all Funds were 0.10% and 0.25% of average daily net assets, respectively. During the period ended May 31, 2022, the Horizon Active Asset Allocation Fund, Horizon Active Risk Assist® Fund, Horizon Active Income Fund, Horizon Active Dividend Fund, Horizon Defined Risk Fund, Horizon U.S. Defensive Equity Fund and Horizon ESG Defensive Core Fund Advisor Class shares incurred $5,009, $10,141, $5,221, $13,164, $25,163, $635, and $47,188, respectively, pursuant to the plan. During the period ended May 31, 2022, the Horizon Active Dividend Fund, Horizon Defined Risk Fund, Horizon U.S. Defensive Equity Fund and Horizon ESG Defensive Core Fund Investor Class shares incurred $61,472, $139,457, $63,829 and $64,420, respectively, pursuant to the plan. Investor Class shares of the Horizon Active Asset Allocation Fund, Horizon Active Risk Assist® Fund and Horizon Active Income Fund and Institutional Class shares of all Funds do not pay any 12b-1 distribution fees.
Indemnification – The Trust indemnifies its officers and trustees for certain liabilities that may arise from the performance of their duties to the Trust. Additionally, in the normal course of business, the Funds enter into contracts that contain a variety of representations and warranties and which provide general indemnities. A Fund’s maximum exposure under these arrangements is unknown, as this would involve future claims that may be made against the Fund that have not yet occurred. However, based on experience, the Trust expects the risk of loss due to these warranties and indemnities to be remote.
General Risk – The global outbreak of COVID-19 (commonly referred to as “coronavirus”) has disrupted economic markets and the prolonged economic impact is uncertain. The ultimate economic fallout from the pandemic, and the long-term impact on economies, markets, industries and individual issuers, are not known. The operational and financial performance of the issuers of securities in which the Funds invest depends on future developments, including the duration and spread of the outbreak, and such uncertainty may in turn adversely affect the value and liquidity of the Funds’ investments, impair the Funds’ ability to satisfy redemption requests, and negatively impact the Funds’ performance.
|
3. |
ADVISORY FEE AND OTHER RELATED PARTY TRANSACTIONS |
Pursuant to an Investment Advisory Agreement with each Fund (the “Advisory Agreements”), investment advisory services are provided to the Funds by Horizon Investments, LLC (the “Adviser”). Under the terms of the Advisory Agreements, the Adviser receives monthly fees calculated at an annual rate of 0.99% of the average daily net assets of the Horizon Active Asset Allocation Fund, 0.99% of the average daily net assets of the Horizon Active Risk Assist® Fund, 0.77% of the average daily net assets of the Horizon Active Income Fund, 0.75% of the average daily net assets of the Horizon Active Dividend Fund, 0.80% of the average daily net assets of the Horizon Defined Risk Fund, 0.80% of the average daily net assets of the Horizon U.S. Defensive Equity Fund and 0.75% of the average daily net assets up to $150,000,000 and 0.70% thereafter of the Horizon ESG Defensive Core Fund.
Pursuant to the Expense Limitation Agreement (the “Waiver Agreement”), the Adviser has agreed, until December 31, 2023 for the Horizon Active Asset Allocation Fund, Horizon Active Risk Assist® Fund, Horizon Active Income Fund, Horizon Active Dividend Fund and Horizon Defined Risk Fund, and June 26, 2023 for the Horizon U.S. Defensive Equity Fund and Horizon ESG Defensive Core Fund, to waive a portion of the Fund’s advisory fee and has agreed to reimburse the Fund for other expenses to the extent that the aggregate expenses of every character, including but not limited to investment advisory fees of the Adviser (but excluding front-end or contingent sales loads; brokerage fees and commissions; acquired fund fees and expenses; borrowing costs, such as interest and dividend expense on securities sold short; payments by the Fund, if any, under the Trust’s Rule 12b-1 Distribution Plan; payments by the
97
Horizon Funds |
Fund, if any, under the Trust’s Shareholder Services Plan; expenses paid with securities lending expense offset credits; taxes; and extraordinary expenses, such as litigation) incurred by a class of shares of the Fund in any fiscal year do not exceed the percentage of average daily net assets in the below table.
Fund |
Investor |
Advisor |
Institutional |
|||||||||
Horizon Active Asset Allocation Fund |
1.17 | % | 1.17 | % | 1.17 | % | ||||||
Horizon Active Risk Assist® Fund |
1.17 | % | 1.17 | % | 1.17 | % | ||||||
Horizon Active Income Fund |
0.99 | % | 0.99 | % | 0.99 | % | ||||||
Horizon Active Dividend Fund |
0.99 | % | 0.99 | % | 0.99 | % | ||||||
Horizon Defined Risk Fund |
0.94 | % | 0.94 | % | 0.94 | % | ||||||
Horizon U.S. Defensive Equity Fund |
0.99 | % | 0.99 | % | 0.99 | % | ||||||
Horizon ESG Defensive Core Fund |
0.94 | % | 0.94 | % | 0.94 | % | ||||||
Any fees waived or expenses reimbursed by the Adviser are subject to possible recoupment by the Adviser within 36 months after such fees have been waived or expenses reimbursed, if such recoupment can be achieved without exceeding the lower of the expense limit in place at the time of the waiver or reimbursement and the expense limit in place at the time of recoupment.
The table below contains the amounts of fee waivers and expense reimbursements subject to recapture by the Adviser through November 30 of the period indicated. During the period ended May 31, 2022, the Adviser recouped from Horizon Active Asset Allocation Fund, Horizon Active Risk Assist® Fund, Horizon Active Income Fund, Horizon Active Dividend Fund, Horizon Defined Risk Fund, Horizon U.S. Defensive Equity Fund, and the Horizon ESG Defensive Core Fund $0, $0, $0, $2,884, $64,512, $15,472, and $40,435 respectively.
Fund |
2022 |
2023 |
2024 |
2025 |
Total |
|||||||||||||||
Horizon Active Asset Allocation Fund |
$ | — | $ | — | $ | — | $ | — | $ | — | ||||||||||
Horizon Active Risk Assist® Fund |
— | — | — | — | — | |||||||||||||||
Horizon Active Income Fund |
— | — | — | — | — | |||||||||||||||
Horizon Active Dividend Fund |
— | 1,461 | 1,062 | — | 2,523 | |||||||||||||||
Horizon Defined Risk Fund |
61,671 | 159,403 | 141,014 | 45,649 | 407,737 | |||||||||||||||
Horizon U.S. Defensive Equity Fund |
34,327 | 69,162 | 129,170 | 25,131 | 257,790 | |||||||||||||||
Horizon ESG Defensive Core Fund |
— | 60,339 | 64,630 | 10,930 | 135,899 | |||||||||||||||
Trustees – The Trust pays each Trustee of the Trust who is not an interested person an annual retainer of $60,000 for each fiscal year plus $10,000 for attendance at an in-person board meeting or $1,000 for attendance of a special meeting. In every instance, the cost of the fees are to be allocated among the participating Funds in accordance with a formula that takes into account the overall asset size of each affected Fund. The Trust also reimburses the Trustees for travel and other expenses incurred in attending meetings of the Board. Officers of the Trust and Trustees who are interested persons of the Trust do not receive any direct compensation from the Trust.
Chief Compliance Officer Compensation – The Board of Trustees renewed the approval of a compensation policy with respect to the Trust’s Chief Compliance Officer pursuant to which the Horizon Funds and the Adviser each pay 50% of the Chief Compliance Officer’s salary, with the portion paid by the Horizon Funds allocated among the Funds in accordance with their relative net assets.
98
Horizon Funds |
|
4. |
INVESTMENT TRANSACTIONS |
The cost of purchases and proceeds from the sale of securities, other than short-term securities, for the period ended May 31, 2022, were as follows:
Fund |
Purchases |
Sales |
||||||
Horizon Active Asset Allocation Fund |
$ | 747,924,125 | $ | 681,026,798 | ||||
Horizon Active Risk Assist® Fund |
2,300,984,678 | 2,146,597,954 | ||||||
Horizon Active Income Fund |
449,643,369 | 413,118,401 | ||||||
Horizon Active Dividend Fund |
74,799,230 | 102,072,967 | ||||||
Horizon Defined Risk Fund |
76,161,083 | 37,866,852 | ||||||
Horizon U.S. Defensive Equity Fund |
91,830,371 | 104,975,879 | ||||||
Horizon ESG Defensive Core Fund |
140,583,495 | 125,525,162 | ||||||
|
5. |
SECURITIES LENDING |
The Funds may lend domestic securities in their portfolios to approved brokers, dealers and financial institutions (but not individuals) under terms of participation in a securities lending program effective December 20, 2017, which is administered by U.S. Bank N.A. (the “Custodian”). The net income to which the Funds are entitled may be used to offset against costs and other charges incurred by the Funds with the Custodian or its affiliates or, as directed in writing by the Funds, other service providers. Investment Advisory Fees, Shareholder Servicing Fees - Investor Class, Distribution Fees (12b-1) - Advisor Class and Distribution Fees (12b-1) - Investor Class as noted in the Statements of Operations are not eligible to be offset by securities lending income. The securities lending agreement requires that loans are collateralized in an amount equal to at least 102% at the outset of the loan and at least 100%, at all times thereafter, of the value of any loaned securities. The Funds receive compensation in the form of fees and earn interest on the cash collateral. The amount of fees depends on a number of factors including the type of security and length of the loan. Amounts earned from security lending is disclosed in each Fund’s Statement of Operations as a securities lending credit. The Funds continue to receive interest payments or dividends on the securities loaned during the borrowing year. Gain or loss on the fair value of securities loaned that may occur during the term of the loan will be for the account of the Funds. The Funds have the right under the terms of the securities lending agreement to recall the securities from the borrower on demand. During the period ended May 31, 2022, the Funds had loaned securities and received cash collateral for the loans. The cash collateral is invested by the Custodian in accordance with approved investment guidelines. Those guidelines allow the cash collateral to be invested in readily marketable, high quality, short-term obligations issued or guaranteed by the United States Government; however, such investments are subject to risk of payment delays, declines in the value of collateral provided, default on the part of the issuer or counterparty, or otherwise may not generate sufficient interest to support the costs associated with securities lending. The Funds could also experience delays in recovering their securities and possible loss of income or value if the borrower fails to return the borrowed securities, although the Funds are indemnified from this risk by contract with the securities lending agent.
99
Horizon Funds |
As of the period ended May 31, 2022, the value of the securities on loan and payable for collateral due to broker were as follows:
Value of Securities on Loan and Collateral Received
Fund |
Values of |
Fund Collateral |
||||||
Horizon Active Asset Allocation Fund |
$ | 233,782,680 | $ | 240,825,029 | ||||
Horizon Active Risk Assist® Fund |
183,407,331 | 188,066,349 | ||||||
Horizon Active Income Fund |
77,576,609 | 79,785,316 | ||||||
Horizon Active Dividend Fund |
2,679,961 | 2,751,168 | ||||||
Horizon Defined Risk Fund |
138,913 | 144,958 | ||||||
Horizon U.S. Defensive Equity Fund |
— | — | ||||||
Horizon ESG Defensive Core Fund |
— | — | ||||||
|
* |
The cash collateral received was invested in the First American Government Obligations Fund, Class X, with an overnight and continuous maturity, as shown on the Portfolios of Investments. These amounts were not included in the offsetting disclosures in Note 2 (Offsetting of Financial Assets and Derivative Liabilities). |
|
6. |
LINE OF CREDIT ARRANGEMENT |
Throughout the period ended May 31, 2022, and renewed effective February 24, 2022, the Funds are party to an unsecured line of credit arrangement with the Custodian. The Loan Agreement has an expiration date of February 23, 2023, under which borrowing is limited to the lesser of 15% of the market value of a Fund, 33.33% of the market value of specific marketable securities of a Fund acceptable to the Custodian, or $75,000,000 for all the Funds subject to the line of credit. The Funds may utilize the line of credit for temporary or emergency purposes, primarily for financing redemption payments. The applicable Funds have authorized the Custodian to charge any of the Funds subject to the line of credit for any missed payments by the Funds. The Funds will be charged the prime rate, which was 4.00% as of May 31, 2022, if they borrow. For the period ended May 31, 2022, the Horizon Active Asset Allocation Fund, Horizon Active Risk Assist® Fund, Horizon Active Dividend Fund, Horizon Defined Risk Fund, Horizon ESG Defensive Core Fund Horizon U.S. Defensive Equity Fund had average borrowings of $65,929, $69,951, $459,305, $229,450, $273,848, and $234,286 and the weighted average interest rate on the line of credit borrowings was 3.25%, 3.25%, 3.25%, 3.25%, 3.25% and 3.25%, respectively. The Horizon Active Income Fund did not borrow on the line of credit during the period. On December 29, 2021, the Horizon Active Asset Allocation Fund had borrowings of $2,201,000, on December 28, 2021, the Horizon Active Risk Assist® Fund had borrowings of $7,288,000, on May 6, 2022, the Horizon Active Dividend Fund had borrowings of $11,822,000, on May 10, 2022, the Horizon Defined Risk Fund had borrowings of $29,534,000, on May 6, 2022, the Horizon ESG Defensive Core Fund had borrowings of $12,177,000, and on May 6, 2022, the Horizon U.S. Defensive Equity Fund had borrowings of $9,780,000, which represent the largest borrowing amounts, respectively, during the period ended May 31, 2022.
100
Horizon Funds |
|
7. |
DISTRIBUTIONS TO SHAREHOLDERS AND TAX COMPONENTS OF CAPITAL |
The tax character of fund distributions paid for the years ended November 30, 2021 and November 30, 2020 was as follows:
For the year or period ended November 30, 2021 |
||||||||||||||||
Fund |
Ordinary |
Long-Term |
Return of |
Total |
||||||||||||
Horizon Active Asset Allocation Fund |
$ | 11,524,013 | $ | 22,927,633 | $ | — | $ | 34,451,646 | ||||||||
Horizon Active Risk Assist® Fund |
3,105,159 | — | — | 3,105,159 | ||||||||||||
Horizon Active Income Fund |
8,171,885 | — | — | 8,171,885 | ||||||||||||
Horizon Active Dividend Fund |
2,122,545 | — | — | 2,122,545 | ||||||||||||
Horizon Defined Risk Fund |
1,324,806 | — | — | 1,324,806 | ||||||||||||
Horizon U.S. Defensive Equity Fund |
632,877 | — | — | 632,877 | ||||||||||||
Horizon ESG Defensive Core Fund |
244,508 | 1,917 | — | 246,425 | ||||||||||||
For the year or period ended November 30, 2020 |
||||||||||||||||
Fund |
Ordinary |
Long-Term |
Return of |
Total |
||||||||||||
Horizon Active Asset Allocation Fund |
$ | 3,747,366 | $ | — | $ | — | $ | 3,747,366 | ||||||||
Horizon Active Risk Assist® Fund |
8,258,860 | — | — | 8,258,860 | ||||||||||||
Horizon Active Income Fund |
6,637,845 | — | — | 6,637,845 | ||||||||||||
Horizon Active Dividend Fund |
4,329,453 | — | — | 4,329,454 | ||||||||||||
Horizon Defined Risk Fund |
1,013,067 | — | — | 1,013,067 | ||||||||||||
Horizon U.S. Defensive Equity Fund |
218,854 | 1,921 | — | 220,775 | ||||||||||||
On December 27, 2021, the Funds paid the following per share income distributions:
Fund |
Investor |
Advisor |
Institutional |
|||||||||
Horizon Active Asset Allocation Fund |
$ | 0.10294122 | $ | 0.08866054 | $ | 0.11760711 | ||||||
Horizon Active Risk Assist® Fund |
0.17086103 | 0.15055734 | 0.19427870 | |||||||||
Horizon Active Income Fund |
0.06935763 | 0.06294350 | 0.07412811 | |||||||||
Horizon Active Dividend Fund |
0.38731034 | 0.35401965 | — | |||||||||
Horizon Defined Risk Fund |
0.18484434 | 0.07716831 | — | |||||||||
Horizon U.S. Defensive Equity Fund |
0.17815432 | 0.12821188 | — | |||||||||
Horizon ESG Defensive Core Fund |
0.08134614 | 0.05098116 | — | |||||||||
101
Horizon Funds |
On December 27, 2021, the Funds paid the following capital gains distributions from each class:
Fund |
Short-Term* |
Long-Term |
||||||
Horizon Active Asset Allocation Fund |
$ | 1.71684 | $ | 0.37406 | ||||
Horizon Active Risk Assist® Fund |
1.86317 | 0.03215 | ||||||
Horizon Active Income Fund |
— | — | ||||||
Horizon Active Dividend Fund |
0.86828 | 0.62369 | ||||||
Horizon Defined Risk Fund |
— | — | ||||||
Horizon U.S. Defensive Equity Fund |
6.94071 | — | ||||||
Horizon ESG Defensive Core Fund |
0.72745 | 0.11286 | ||||||
|
* |
Short-Term Capital Gains distributions are considered income distributions for tax purposes. |
The cost basis of investments, purchased options and options written for federal income tax purposes at November 30, 2021, were as follows:
Fund |
Cost of |
Gross Tax |
Gross Tax |
Net Tax |
||||||||||||
Horizon Active Asset Allocation Fund |
$ | 847,122,356 | $ | 62,501,742 | $ | (8,604,444 | ) | $ | 53,897,298 | |||||||
Horizon Active Risk Assist® Fund |
1,266,015,721 | 116,301,663 | (12,753,218 | ) | 103,548,445 | |||||||||||
Horizon Active Income Fund |
545,091,971 | 3,618,598 | (5,093,662 | ) | (1,475,064 | ) | ||||||||||
Horizon Active Dividend Fund |
148,140,225 | 6,817,788 | (5,265,012 | ) | 1,552,776 | |||||||||||
Horizon Defined Risk Fund |
213,531,260 | 71,820,705 | (4,864,449 | ) | 66,956,256 | |||||||||||
Horizon U.S. Defensive Equity Fund |
128,716,585 | 14,105,094 | (2,735,201 | ) | 11,369,893 | |||||||||||
Horizon ESG Defensive Core Fund |
161,830,722 | 17,702,791 | (7,457,898 | ) | 10,244,893 | |||||||||||
102
Horizon Funds |
As of November 30, 2021, the components of accumulated earnings/(deficit) on a tax basis were as follows:
Fund |
Undistributed |
Undistributed |
Capital |
Other |
Post October |
Unrealized |
Total |
|||||||||||||||||||||
Horizon Active Asset Allocation Fund |
$ | 80,044,605 | $ | 17,314,998 | $ | — | $ | (3 | ) | $ | — | $ | 53,897,298 | $ | 151,256,898 | |||||||||||||
Horizon Active Risk Assist® Fund |
87,085,296 | 1,488,687 | — | 1 | — | 103,548,445 | 192,122,429 | |||||||||||||||||||||
Horizon Active Income Fund |
2,002,187 | — | — | (5,893,600 | ) | — | (1,475,064 | ) | (5,366,477 | ) | ||||||||||||||||||
Horizon Active Dividend Fund |
2,360,630 | 1,327,796 | — | — | — | 1,552,776 | 5,241,192 | |||||||||||||||||||||
Horizon Defined Risk Fund |
664,370 | — | — | (22,679,068 | ) | — | 66,956,256 | 44,941,558 | ||||||||||||||||||||
Horizon U.S. Defensive Equity Fund |
27,134,794 | — | — | 1 | — | 11,369,893 | 38,504,688 | |||||||||||||||||||||
Horizon ESG Defensive Core Fund |
3,431,345 | 494,960 | — | — | — | 10,244,893 | 14,171,198 | |||||||||||||||||||||
The difference between book and tax basis unrealized appreciation/depreciation is attributable to mark to market and/or the tax deferral of losses on various investments.
At November 30, 2021, the Funds had capital loss carry forwards for federal income tax purposes available to offset future capital gains as follows:
Non-Expiring |
||||||||||||
Fund |
Short-Term |
Long-Term |
Total |
|||||||||
Horizon Active Asset Allocation Fund |
$ | — | $ | — | $ | — | ||||||
Horizon Active Risk Assist® Fund |
— | — | — | |||||||||
Horizon Active Income Fund |
4,915,665 | 977,935 | 5,893,600 | |||||||||
Horizon Active Dividend Fund |
— | — | — | |||||||||
Horizon Defined Risk Fund |
21,331,664 | 1,151,254 | 22,482,918 | |||||||||
Horizon U.S. Defensive Equity Fund |
— | — | — | |||||||||
Horizon ESG Defensive Core Fund |
— | — | — | |||||||||
The Horizon Active Dividend Fund, Horizon Active Income Fund, Horizon Active Risk Assist®, Horizon U.S. Defensive Equity Fund, and Horizon Defined Risk Fund utilized capital loss carry forwards of $21,341,761, $4,806,596, $42,769,033, $3,133,467, and $10,403,244 respectively during the fiscal year.
103
Horizon Funds |
Additionally, GAAP requires that certain components of net assets relating to permanent differences be reclassified between financial and tax reporting. These reclassifications have no effect on net assets or net asset value per share. These reclassifications were due to the use of equalization. Each Fund may use earnings and profits distributed to shareholders on redemption of shares as part of the dividends paid deduction. For the year ended November 30, 2021, the following table shows the reclassifications made:
Fund |
Distributable |
Paid In |
||||||
Horizon Active Asset Allocation Fund |
$ | (8,014,608 | ) | $ | 8,014,608 | |||
Horizon Active Risk Assist® Fund |
(6,965,412 | ) | 6,965,412 | |||||
Horizon Active Income Fund |
24.483 | (24,483 | ) | |||||
Horizon Active Dividend Fund |
(116,939 | ) | 116,939 | |||||
Horizon Defined Risk Fund |
— | — | ||||||
Horizon U.S. Defensive Equity Fund |
(11,068,223 | ) | 11,068,232 | |||||
Horizon ESG Defensive Core Fund |
(177,107 | ) | 177,107 | |||||
|
8. |
BENEFICIAL OWNERSHIP |
The beneficial ownership, either directly or indirectly, of more than 25% of voting securities of a fund creates a presumption of control of that fund, under Section 2(a)(9) of the 1940 Act. As of May 31, 2022, the Funds had omnibus shareholder accounts (comprised of a group of individual shareholders), which amounted to more than 25% of the total shares outstanding of the respective Fund. There was one individual shareholder of record who owned more than 5% of the outstanding shares of beneficial interest of the Horizon ESG Defensive Core Fund Investor Class. This shareholder did not own more than 5% of the outstanding shares of beneficial interest of the Fund. No other individual shareholders of record owned more than 5% of the outstanding shares of beneficial interest of a Fund or Class of shares of a Fund. Shareholders with a controlling interest could affect the outcome of proxy voting or direction of management of a Fund.
|
9. |
SUBSEQUENT EVENTS |
Subsequent events after the date of the Statements of Assets and Liabilities have been evaluated through the date the financial statements were issued. Management has concluded that there is no impact requiring adjustment to or disclosure in the financial statements.
104
Horizon Funds
Disclosure of Fund Expenses (Unaudited)
May 31, 2022
As a shareholder of the Funds you incur ongoing costs, including management fees, sales charges, and other Fund operating expenses. This example is intended to help you understand your ongoing costs (in dollars) of investing in the Funds and to compare these costs with the ongoing costs of investing in other mutual funds. Please note, the expenses shown in the tables are meant to highlight ongoing costs only and do not reflect any transactional costs.
This example is based on an investment of $1,000 invested for the period of time as indicated in the table below.
Actual Expenses: The column labeled “Actual” of the table provides information about actual account values and actual expenses. You may use the information in this line, together with the amount you invested, to estimate the expenses that you paid over the period. Simply divide your account value by $1,000 (for example, an $8,600 account value divided by $1,000 = 8.6), then multiply the result by the number in the first line under the heading entitled “Expenses Paid During Period” to estimate the expenses you paid on your account during the period.
Hypothetical Examples for Comparison Purposes: The column labeled “Hypothetical” of the table below provides information about hypothetical account values and hypothetical expenses based on the Funds’ actual expense ratios and an assumed rate of return of 5% per year before expenses, which is not the Funds’ actual return. The hypothetical account values and expenses may not be used to estimate the actual ending account balance or expenses you paid for the period. You may use this information to compare the ongoing costs of investing in the Funds and other funds. To do so, compare this 5% hypothetical example with the 5% hypothetical examples that appear in the shareholder reports of the other funds.
Please note that the expenses shown in the table are meant to highlight your ongoing costs only and do not reflect any transactional costs which may be applicable to your account. Therefore, the second line of the table is useful in comparing ongoing costs only, and will not help you determine the relative total costs of owning different funds. In addition, if these transactional costs were included, your costs would have been higher.
Actual |
Hypothetical |
|||||
|
Fund’s |
Beginning |
Ending |
Expenses |
Ending |
Expenses |
Horizon Active Asset Allocation - Investor Class |
1.20% |
$ 1,000.00 |
$ 920.08 |
$ 5.74 |
$ 1,018.95 |
$ 6.04 |
Horizon Active Asset Allocation - Advisor Class |
1.35% |
$ 1,000.00 |
$ 919.51 |
$ 6.46 |
$ 1,018.20 |
$ 6.79 |
Horizon Active Asset Allocation - Institutional Class |
1.09% |
$ 1,000.00 |
$ 920.62 |
$ 5.22 |
$ 1,019.50 |
$ 5.49 |
Horizon Active Risk Assist® - Investor Class |
1.19% |
$ 1,000.00 |
$ 906.01 |
$ 5.65 |
$ 1,019.00 |
$ 5.99 |
Horizon Active Risk Assist® - Advisor Class |
1.34% |
$ 1,000.00 |
$ 905.49 |
$ 6.37 |
$ 1,018.25 |
$ 6.74 |
Horizon Active Risk Assist® - Institutional Class |
1.09% |
$ 1,000.00 |
$ 906.25 |
$ 5.18 |
$ 1,019.50 |
$ 5.49 |
Horizon Active Income - Investor Class |
0.99% |
$ 1,000.00 |
$ 892.41 |
$ 4.67 |
$ 1,020.00 |
$ 4.99 |
Horizon Active Income - Advisor Class |
1.14% |
$ 1,000.00 |
$ 892.86 |
$ 5.38 |
$ 1,019.25 |
$ 5.74 |
Horizon Active Income - Institutional Class |
0.89% |
$ 1,000.00 |
$ 893.79 |
$ 4.20 |
$ 1,020.49 |
$ 4.48 |
Horizon Active Dividend - Investor Class |
1.04% |
$ 1,000.00 |
$ 1,027.04 |
$ 5.26 |
$ 1,019.75 |
$ 5.24 |
Horizon Active Dividend - Advisor Class |
1.24% |
$ 1,000.00 |
$ 1,026.04 |
$ 6.26 |
$ 1,018.75 |
$ 6.24 |
Horizon Defined Risk - Investor Class |
1.08% |
$ 1,000.00 |
$ 938.88 |
$ 5.22 |
$ 1,019.50 |
$ 5.44 |
Horizon Defined Risk - Advisor Class |
1.24% |
$ 1,000.00 |
$ 937.93 |
$ 5.99 |
$ 1,018.75 |
$ 6.24 |
Horizon U.S. Defensive Equity - Investor Class |
1.09% |
$ 1,000.00 |
$ 961.77 |
$ 5.33 |
$ 1,019.50 |
$ 5.49 |
Horizon U.S. Defensive Equity - Advisor Class |
1.24% |
$ 1,000.00 |
$ 960.75 |
$ 6.06 |
$ 1,018.75 |
$ 6.24 |
Horizon ESG Defensive Core - Investor Class |
1.05% |
$ 1,000.00 |
$ 912.81 |
$ 5.01 |
$ 1,019.70 |
$ 5.29 |
Horizon ESG Defensive Core - Advisor Class |
1.20% |
$ 1,000.00 |
$ 911.99 |
$ 5.72 |
$ 1,018.95 |
$ 6.04 |
|
1 |
The expense ratio excludes securities lending offset. |
|
2 |
Expenses Paid During the Period are equal to the Funds’ annualized expense ratio, multiplied by the average account value over the period, multiplied by 182 days, and divided by 365 (to reflect the number of days in the period). |
105
Horizon Funds
Statement Regarding Liquidity Risk Management Program (Unaudited)
May 31, 2022
The Funds have adopted and implemented a written liquidity risk management program (the “Program”) and related procedures to manage its liquidity in accordance with Rule 22e-4 under the Investment Company Act of 1940, as amended (the “Liquidity Rule”). The Liquidity Rule requires that each Fund establish a liquidity risk management program in order to effectively manage the Fund’s liquidity and shareholder redemptions. The Liquidity Rule is designed to mitigate the risk that a Fund could not meet redemption requests without significantly diluting the interests of its remaining investors.
The Liquidity Rule requires the Funds to assess, manage and review their liquidity risk at least annually, considering applicable factors such as investment strategy and liquidity during normal and foreseeable stressed conditions, including whether the strategy is appropriate for an open-end fund and whether the fund has a relatively concentrated portfolio or large positions in particular issuers. Each Fund must also assess its use of borrowings and derivatives, short-term and long-term cash flow projections in normal and stressed conditions, holdings of cash and cash equivalents, and borrowing arrangements and other funding sources.
In accordance with the Program, each of the Fund’s portfolio investments is classified into one of four liquidity categories described below based on a determination of a reasonable expectation for how long it would take to convert the investment to cash (or sell or dispose of the investment) without significantly changing its market value.
|
● |
Highly liquid investments – cash or convertible to cash within three business days or less |
|
● |
Moderately liquid investments – convertible to cash in three to seven calendar days |
|
● |
Less liquid investments – can be sold or disposed of, but not settled, within seven calendar days |
|
● |
Illiquid investments – cannot be sold or disposed of within seven calendar days |
Liquidity classification determinations take into account a variety of factors, including various market, trading and investment- specific considerations, as well as market depth, and generally utilize analysis from a third-party liquidity metrics service.
The Liquidity Rule places a 15% limit on a Fund’s illiquid investments. Specifically, the Liquidity Rule prohibits acquisition of illiquid investments if doing so would result in the Fund holding more than 15% of its net assets in illiquid investments and requires certain reporting anytime a Fund’s holdings of illiquid investments exceed 15% of net assets. The Program includes provisions reasonably designed to comply with the 15% limit on illiquid investments. During the review period, no Fund exceeded the 15% limit on illiquid investments.
The Liquidity Rule also requires funds that do not primarily hold assets that are highly liquid investments to determine and maintain a minimum percentage of the fund’s net assets to be invested in highly liquid investments (highly liquid investment minimum or “HLIM”). The Program includes provisions for determining, periodically reviewing and complying with the HLIM requirement as applicable. During the review period, each Fund primarily held highly liquid investments and therefore was exempt from the requirement to adopt an HLIM and to comply with the related requirements under the Liquidity Rule.
Pursuant to the Liquidity Rule’s requirements, the Program has been reviewed and approved by the Funds’ Board of Trustees. At a recent meeting of the Fund’s Board of Trustees, the Board received a written report prepared by the Program’s Administrator that addressed the operation of the Program, assesses its adequacy and effectiveness and describes any material changes made to the Program.
The report included that, during the reporting period, the were no changes made to the Program, there were no material liquidity events that impacted any Fund, and each Fund held sufficient highly liquid assets to meet Fund redemptions.
The report concluded that the Program is reasonably designed to assess and manage each Fund’s liquidity risk, taking into account the Fund’s particular risks and circumstances, and includes policies and procedures reasonably designed to implement each required component of the Liquidity Rule.
The report also concluded that the Program, including the HLIM where applicable, was implemented and operated effectively to achieve the goal of assessing and managing each Fund’s liquidity risk.
106
Horizon Funds
Additional Information (Unaudited)
May 31, 2022
Interested Trustees and Officers |
||||
Name, Address* |
Position/ |
Principal Occupation During |
Number of |
Other Directorships |
John Drahzal** Year of Birth: 1966 |
Interested Trustee Indefinite Term of Office |
CEO and President of Horizon Investments, LLC (CEO November 2021 - present and President December 2020 - present); President of Horizon Investments, LLC (December 2020-November 2021); Various Positions at Horizon Investments (2017-2020). |
7 |
None |
Matthew Chambers Year of Birth: 1976 |
Vice President, Chief Compliance Officer and Secretary; One Year Term of Office |
General Counsel and Chief Compliance Officer of Horizon Investments, LLC, December 2014-present; Attorney, Kilpatrick Townsend & Stockton, 2008-2014 |
Not Applicable |
Not Applicable |
Steve Terry Year of Birth: 1980 |
Treasurer; One Year Term of Office |
Head of Finance and Business Systems of Horizon Investments, LLC, August 2016-present; Co-Founder, Catamaran Investment Partners, 2015-August 2016; Principal Intersection Partners, 2011-2015. |
Not Applicable |
Not Applicable |
|
* |
The address for each Trustee and officer is 6210 Ardrey Kell Road, Suite 300, Charlotte, North Carolina 28277. |
|
** |
Mr. Drahzal is considered an “interested person” of the Trust, as defined in the 1940 Act, because of his current position with the Adviser. |
The Statement of Additional Information includes additional information about the Funds’ Trustees and is available free of charge upon request by calling the Funds toll free at (866) 371-2399.
107
Horizon Funds
ADDITIONAL INFORMATION (Unaudited) (Continued)
May 31, 2022
Independent Trustees |
||||
Name, Address* |
Position/ |
Principal Occupation During |
Number of |
Other Directorships |
John W. Davidson Year of Birth: 1946 |
Trustee; Indefinite Term of Office |
Creator, author and founder of John Davidson’s Economic Comments (2009-2018). |
7 |
Trustee, AdvisorOne Funds |
Todd W. Gaylord Year of Birth: 1975 |
Trustee; Indefinite Term of Office |
Consultant (financial Services) since 2012; Owner, McCauley Street Partners, Inc. (real estate brokerage firm) (2009-2014); Vice President, Corporate Bond, Syndicated Loan, and Credit Default Swap Trader, Wachovia Securities (2005-2008). |
7 |
None |
Thomas W. Okel Year of Birth: 1962 |
Trustee; Indefinite Term of Office |
Executive Director (2011-2019), Catawba Lands Conservancy; Global Head of Syndicated Capital Markets (1998-2010), Bank of America Merrill Lynch. |
7 |
Trustee, Barings Funds Trust (8 portfolios); Trustee, Barings Global Short Duration High Yield Fund (1 portfolio). Trustee, Barings BDC, Inc. Trustee, Barings Private Investment Corporation. Trustee barings Captial Investment Corporation. |
|
* |
The address for each Trustee and officer is 6210 Ardrey Kell Road, Suite 300, Charlotte, North Carolina 28277. |
108
THIS PAGE INTENTIONALLY LEFT BLANK
Investment Adviser
Horizon Investments, LLC
6210 Ardrey Kell Road, Suite 300
Charlotte, NC 28277
Distributor
Quasar Distributors, LLC
111 E. Kilbourn Ave, Suite 2200
Milwaukee, WI 53202
Custodian
U.S. Bank N.A.
Custody Operations
1555 N. RiverCenter Drive, Suite 302
Milwaukee, WI 53212
Transfer Agent, Fund Accountant and Fund Administrator
U.S. Bancorp Fund Services, LLC, doing business as U.S. Bank Global Fund Services
615 East Michigan Street
Milwaukee, WI 53202
Independent Registered Public Accounting Firm
Cohen & Company, Ltd.
342 North Water Street, Suite 830
Milwaukee, WI 53202
Legal Counsel
Kilpatrick Townsend & Stockton LLP
1001 West Fourth Street
Winston-Salem, NC 27101
How to Obtain Proxy Voting Information
Information regarding how the Funds vote proxies relating to portfolio securities for the 12 month period ended June 30th as well as a description of the policies and procedures that the Funds used to determine how to vote proxies is available without charge, upon request, by calling l-855-754-7932 or by referring to the Securities and Exchange Commission’s (“SEC”) website at http://www.sec.gov.
How to Obtain 1st and 3rd Fiscal Quarter Portfolio Holdings
The Funds file their complete schedules of portfolio holdings with the SEC for their first and third fiscal quarters on Part F of Form N-PORT. Once filed, the Funds’ Part F of Form N-PORT is available without charge, upon request on the SEC’s website (http://www.sec.gov) and is available by calling 1-855-754-7932.
| (b) | Not applicable for this Registrant |
Item 2. Code of Ethics.
Not applicable for semi-annual reports.
Item 3. Audit Committee Financial Expert.
Not applicable for semi-annual reports.
Item 4. Principal Accountant Fees and Services.
Not applicable for semi-annual reports.
Item 5. Audit Committee of Listed Registrants.
Not applicable to registrants who are not listed issuers (as defined in Rule 10A-3 under the Securities Exchange Act of 1934).
Item 6. Investments.
| (a) | Schedule of Investments is included as part of the report to shareholders filed under Item 1 of this Form. |
| (b) | Not Applicable. |
Item 7. Disclosure of Proxy Voting Policies and Procedures for Closed-End Management Investment Companies.
Not applicable to open-end investment companies.
Item 8. Portfolio Managers of Closed-End Management Investment Companies.
Not applicable to open-end investment companies.
Item 9. Purchases of Equity Securities by Closed-End Management Investment Company and Affiliated Purchasers.
Not applicable to open-end investment companies.
Item 10. Submission of Matters to a Vote of Security Holders.
The registrant has not adopted any procedure by which shareholders may recommend nominees to the registrant’s board of directors.
Item 11. Controls and Procedures.
| (a) | The registrant's principal executive officer and principal financial officer have concluded, based on an evaluation of the registrant's disclosure controls and procedures (as defined in Rule 30a-3(c) under the Investment Company Act of 1940, as amended) as of a date within 90 days prior to the filing date of this Form N-CSR, that the disclosure controls and procedures are effectively designed to ensure that information required to be disclosed by the registrant in this Form N-CSR is recorded, processed, summarized and reported by the filing date, including ensuring that information required to be disclosed in this Form N-CSR is accumulated and communicated to the registrant's management, including the registrant's principal executive officer and principal financial officer, as appropriate, to allow timely decisions regarding required disclosure. |
| (b) | There were no significant changes in the registrant's internal control over financial reporting (as defined in Rule 30a-3(d) under the Investment Company Act of 1940, as amended) that occurred during the period covered by this report that have materially affected, or are reasonably likely to materially affect, the registrant's internal control over financial reporting. |
Item 12. Disclosure of Securities Lending Activities for Closed-End Management Investment Companies.
Not applicable to open-end investment companies.
Item 13. Exhibits.
(3) Any written solicitation to purchase securities under Rule 23c-1 under the Act sent or given during the period covered by the report by or on behalf of the registrant to 10 or more persons. Not applicable to open-end investment companies.
(4) Change in the registrant’s independent public accountant. There was no change in the registrant’s independent public accountant for the period covered by this report.
| (b) | Certifications pursuant to Section 906 of the Sarbanes-Oxley Act of 2002. Furnished herewith. |
SIGNATURES
Pursuant to the requirements of the Securities Exchange Act of 1934 and the Investment Company Act of 1940, the registrant has duly caused this report to be signed on its behalf by the undersigned, thereunto duly authorized.
| (Registrant) | Horizon Funds | |
| By (Signature and Title)* | /s/ John Drahzal | |
| John Drahzal, President and Principal Executive Officer | ||
| Date: | 8/8/2022 |
Pursuant to the requirements of the Securities Exchange Act of 1934 and the Investment Company Act of 1940, this report has been signed below by the following persons on behalf of the registrant and in the capacities and on the dates indicated.
| By (Signature and Title)* | /s/ John Drahzal | |
| John Drahzal, President and Principal Executive Officer | ||
| Date: | 8/8/2022 | |
| By (Signature and Title)* | /s/ Stephen Terry | |
| Stephen Terry, Treasurer and Principal Financial Officer | ||
| Date: | 8/8/2022 |
* Print the name and title of each signing officer under his or her signature.
EX.99.CERT
CERTIFICATIONS
I, John Drahzal, certify that:
| 1. | I have reviewed this report on Form N-CSR of Horizon Funds; |
| 2. | Based on my knowledge, this report does not contain any untrue statement of a material fact or omit to state a material fact necessary to make the statements made, in light of the circumstances under which such statements were made, not misleading with respect to the period covered by this report; |
| 3. | Based on my knowledge, the financial statements, and other financial information included in this report, fairly present in all material respects the financial condition, results of operations, changes in net assets, and cash flows (if the financial statements are required to include a statement of cash flows) of the registrant as of, and for, the periods presented in this report; |
| 4. | The registrant’s other certifying officer(s) and I are responsible for establishing and maintaining disclosure controls and procedures (as defined in Rule 30a-3(c) under the Investment Company Act of 1940) and internal control over financial reporting (as defined in Rule 30a-3(d) under the Investment Company Act of 1940) for the registrant and have: |
| (a) | Designed such disclosure controls and procedures, or caused such disclosure controls and procedures to be designed under our supervision, to ensure that material information relating to the registrant, including its consolidated subsidiaries, is made known to us by others within those entities, particularly during the period in which this report is being prepared; |
| (b) | Designed such internal control over financial reporting, or caused such internal control over financial reporting to be designed under our supervision, to provide reasonable assurance regarding the reliability of financial reporting and the preparation of financial statements for external purposes in accordance with generally accepted accounting principles; |
| (c) | Evaluated the effectiveness of the registrant's disclosure controls and procedures and presented in this report our conclusions about the effectiveness of the disclosure controls and procedures, as of a date within 90 days prior to the filing date of this report based on such evaluation; and |
| (d) | Disclosed in this report any change in the registrant’s internal control over financial reporting that occurred during the period covered by this report that has materially affected, or is reasonably likely to materially affect, the registrant’s internal control over financial reporting; and |
| 5. | The registrant’s other certifying officer(s) and I have disclosed to the registrant’s auditors and the audit committee of the registrant’s board of directors (or persons performing the equivalent functions): |
| (a) | All significant deficiencies and material weaknesses in the design or operation of internal control over financial reporting which are reasonably likely to adversely affect the registrant’s ability to record, process, summarize, and report financial information; and |
| (b) | Any fraud, whether or not material, that involves management or other employees who have a significant role in the registrant’s internal control over financial reporting. |
| Date: | 8/8/2022 | /s/ John Drahzal | ||
| John Drahzal | ||||
| President and Principal Executive Officer |
EX.99.CERT
CERTIFICATIONS
I, Stephen Terry, certify that:
| 1. | I have reviewed this report on Form N-CSR of Horizon Funds; |
| 2. | Based on my knowledge, this report does not contain any untrue statement of a material fact or omit to state a material fact necessary to make the statements made, in light of the circumstances under which such statements were made, not misleading with respect to the period covered by this report; |
| 3. | Based on my knowledge, the financial statements, and other financial information included in this report, fairly present in all material respects the financial condition, results of operations, changes in net assets, and cash flows (if the financial statements are required to include a statement of cash flows) of the registrant as of, and for, the periods presented in this report; |
| 4. | The registrant’s other certifying officer(s) and I are responsible for establishing and maintaining disclosure controls and procedures (as defined in Rule 30a-3(c) under the Investment Company Act of 1940) and internal control over financial reporting (as defined in Rule 30a-3(d) under the Investment Company Act of 1940) for the registrant and have: |
| (a) | Designed such disclosure controls and procedures, or caused such disclosure controls and procedures to be designed under our supervision, to ensure that material information relating to the registrant, including its consolidated subsidiaries, is made known to us by others within those entities, particularly during the period in which this report is being prepared; |
| (b) | Designed such internal control over financial reporting, or caused such internal control over financial reporting to be designed under our supervision, to provide reasonable assurance regarding the reliability of financial reporting and the preparation of financial statements for external purposes in accordance with generally accepted accounting principles; |
| (c) | Evaluated the effectiveness of the registrant’s disclosure controls and procedures and presented in this report our conclusions about the effectiveness of the disclosure controls and procedures, as of a date within 90 days prior to the filing date of this report based on such evaluation; and |
| (d) | Disclosed in this report any change in the registrant’s internal control over financial reporting that occurred during the period covered by this report that has materially affected, or is reasonably likely to materially affect, the registrant’s internal control over financial reporting; and |
| 5. | The registrant’s other certifying officer(s) and I have disclosed to the registrant’s auditors and the audit committee of the registrant’s board of directors (or persons performing the equivalent functions): |
| (a) | All significant deficiencies and material weaknesses in the design or operation of internal control over financial reporting which are reasonably likely to adversely affect the registrant’s ability to record, process, summarize, and report financial information; and |
| (b) | Any fraud, whether or not material, that involves management or other employees who have a significant role in the registrant’s internal control over financial reporting. |
| Date: | 8/8/2022 | /s/ Stephen Terry | ||
| Stephen Terry | ||||
| Treasurer and Principal Financial Officer |
EX.99.906CERT
Certification Pursuant to Section 906 of the Sarbanes-Oxley Act
Pursuant to Section 906 of the Sarbanes-Oxley Act of 2002, each of the undersigned officers of the Horizon Funds, does hereby certify, to such officer’s knowledge, that the report on Form N-CSR of the Horizon Funds for the period ended May 31, 2022 fully complies with the requirements of Section 13(a) or 15(d) of the Securities Exchange Act of 1934, as applicable, and that the information contained in the Form N-CSR fairly presents, in all material respects, the financial condition and results of operations of the Horizon Funds for the stated period.
| /s/ John Drahzal | /s/ Stephen Terry | ||
| John Drahzal | Stephen Terry | ||
| President and Principal Executive Officer, Horizon Funds |
Treasurer and Principal Financial Officer, Horizon Funds |
| Dated: | 8/8/2022 | Dated: | 8/8/2022 |
This statement accompanies this report on Form N-CSR pursuant to Section 906 of the Sarbanes-Oxley Act of 2002 and shall not be deemed as filed by Horizon Funds for purposes of Section 18 of the Securities Exchange Act of 1934.
Serious News for Serious Traders! Try StreetInsider.com Premium Free!
You May Also Be Interested In
- ROSEN, A LEADING AND TOP RANKED LAW FIRM, Encourages Lifecore Biomedical Inc. f/k/a Landec Corporation Investors to Inquire About Securities Class Action Investigation – LFCR, LNDC
- Perk Labs Announces Closing of Non-Brokered Private Placements
- Banco Itaú Chile Files Material Event Notice announcing Extraordinary General Shareholders’ Meeting Agreements
Create E-mail Alert Related Categories
SEC FilingsSign up for StreetInsider Free!
Receive full access to all new and archived articles, unlimited portfolio tracking, e-mail alerts, custom newswires and RSS feeds - and more!
