

Form N-CSRS EATON VANCE MUTUAL FUNDS For: Aug 31
 Tweet
Tweet Share
Share
UNITED STATES
SECURITIES AND EXCHANGE COMMISSION
Washington, D.C. 20549
Form N-CSR
CERTIFIED SHAREHOLDER REPORT OF REGISTERED
MANAGEMENT INVESTMENT COMPANIES
Investment Company Act File Number: 811-04015
Eaton Vance Mutual Funds Trust
(Exact Name of Registrant as Specified in Charter)
Two International Place, Boston, Massachusetts 02110
(Address of Principal Executive Offices)
Deidre E. Walsh
Two International Place, Boston, Massachusetts 02110
(Name and Address of Agent for Services)
(617) 482-8260
(Registrant’s Telephone Number)
February 28
Date of Fiscal Year End
August 31, 2021
Date of Reporting Period
Item 1. Reports to Stockholders

Parametric
Dividend Income Fund
Semiannual Report
August 31, 2021

Commodity Futures Trading Commission Registration. The Commodity Futures Trading Commission (“CFTC”) has adopted regulations that subject registered investment companies and advisers to regulation by the CFTC if a fund invests more than a prescribed level of its assets in certain CFTC-regulated instruments (including futures, certain options and swap agreements) or markets itself as providing investment exposure to such instruments. The investment adviser has claimed an exclusion from the definition of “commodity pool operator” under the Commodity Exchange Act with respect to its management of the Fund. Accordingly, neither the Fund nor the adviser with respect to the operation of the Fund is subject to CFTC regulation. Because of its management of other strategies, the Fund’s adviser and Parametric Portfolio Associates LLC (Parametric), sub-adviser to the Fund, are registered with the CFTC as commodity pool operators. The adviser and Parametric are also registered as commodity trading advisors.
Fund shares are not insured by the FDIC and are not deposits or other obligations of, or guaranteed by, any depository institution. Shares are subject to investment risks, including possible loss of principal invested.
This report must be preceded or accompanied by a current summary prospectus or prospectus. Before investing, investors should consider carefully the investment objective, risks, and charges and expenses of a mutual fund. This and other important information is contained in the summary prospectus and prospectus, which can be obtained from a financial intermediary. Prospective investors should read the prospectus carefully before investing. For further information, please call 1-800-260-0761.
Semiannual Report August 31, 2021
Parametric
Dividend Income Fund
| 2 | ||||
| 2 | ||||
| 3 | ||||
| 4 | ||||
| 5 | ||||
| 19 | ||||
| 20 | ||||
| 21 | ||||
| 23 |
Parametric
Dividend Income Fund
August 31, 2021
Portfolio Managers Thomas C. Seto and Jennifer Sireklove, CFA, each of Parametric Portfolio Associates LLC
| % Average Annual Total Returns | Class Inception Date |
Performance Inception Date |
Six Months | One Year | Five Years | Since Inception |
||||||||||||||||||
| Investor Class at NAV |
03/26/2014 | 03/26/2014 | 13.56 | % | 34.91 | % | 10.49 | % | 10.29 | % | ||||||||||||||
| Institutional Class at NAV |
03/26/2014 | 03/26/2014 | 13.75 | 35.27 | 10.78 | 10.57 | ||||||||||||||||||
|
| ||||||||||||||||||||||||
| Russell 1000® Value Index |
— | — | 14.52 | % | 36.44 | % | 11.67 | % | 10.18 | % | ||||||||||||||
| % Total Annual Operating Expense Ratios3 | Investor Class |
Institutional Class |
||||||||||||||||||||||
| Gross |
0.99 | % | 0.74 | % | ||||||||||||||||||||
| Net |
0.65 | 0.40 | ||||||||||||||||||||||
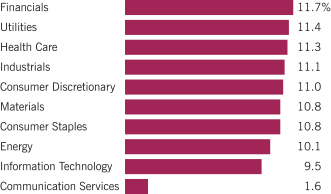
Sector Allocation (% of net assets)4
Top 10 Holdings (% of net assets)4
| Blackstone, Inc. |
0.7 | % | ||
| Nucor Corp. |
0.7 | |||
| West Pharmaceutical Services, Inc. |
0.7 | |||
| Robert Half International, Inc. |
0.7 | |||
| Garmin, Ltd. |
0.6 | |||
| Agilent Technologies, Inc. |
0.6 | |||
| Pfizer, Inc. |
0.6 | |||
| Service Corp. International |
0.6 | |||
| Moelis & Co., Class A |
0.6 | |||
| Principal Financial Group, Inc. |
0.6 | |||
| Total |
6.4 | % | ||
See Endnotes and Additional Disclosures in this report.
Past performance is no guarantee of future results. Returns are historical and are calculated by determining the percentage change in net asset value (NAV) or offering price (as applicable) with all distributions reinvested. Investment return and principal value will fluctuate so that shares, when redeemed, may be worth more or less than their original cost. Performance for periods less than or equal to one year is cumulative. Performance is for the stated time period only; due to market volatility, current Fund performance may be lower or higher than the quoted return. For performance as of the most recent month-end, please refer to eatonvance.com.
| 2 |
Parametric
Dividend Income Fund
August 31, 2021
Endnotes and Additional Disclosures
| 1 | Russell 1000® Value Index is an unmanaged index of U.S. large-cap value stocks. Unless otherwise stated, index returns do not reflect the effect of any applicable sales charges, commissions, expenses, taxes or leverage, as applicable. It is not possible to invest directly in an index. |
| 2 | Returns are historical and are calculated by determining the percentage change in NAV with all distributions reinvested. Unless otherwise stated, performance does not reflect the deduction of taxes on Fund distributions or redemptions of Fund shares. Performance since inception for an index, if presented, is the performance since the Fund’s or oldest share class’ inception, as applicable. |
| 3 | Source: Fund prospectus. Net expense ratios reflect a contractual expense reimbursement that continues through 6/30/22. Without the reimbursement, performance would have been lower. The expense ratios for the current reporting period can be found in the Financial Highlights section of this report. |
| 4 | Excludes cash and cash equivalents. |
Fund profile subject to change due to active management.
| 3 |
Parametric
Dividend Income Fund
August 31, 2021
Example: As a Fund shareholder, you incur two types of costs: (1) transaction costs, including sales charges (loads) on purchases and redemption fees (if applicable); and (2) ongoing costs, including management fees; distribution and/or service fees; and other Fund expenses. This Example is intended to help you understand your ongoing costs (in dollars) of Fund investing and to compare these costs with the ongoing costs of investing in other mutual funds. The Example is based on an investment of $1,000 invested at the beginning of the period and held for the entire period (March 1, 2021 – August 31, 2021).
Actual Expenses: The first section of the table below provides information about actual account values and actual expenses. You may use the information in this section, together with the amount you invested, to estimate the expenses that you paid over the period. Simply divide your account value by $1,000 (for example, an $8,600 account value divided by $1,000 = 8.6), then multiply the result by the number in the first section under the heading entitled “Expenses Paid During Period” to estimate the expenses you paid on your account during this period.
Hypothetical Example for Comparison Purposes: The second section of the table below provides information about hypothetical account values and hypothetical expenses based on the actual Fund expense ratio and an assumed rate of return of 5% per year (before expenses), which is not the actual Fund return. The hypothetical account values and expenses may not be used to estimate the actual ending account balance or expenses you paid for the period. You may use this information to compare the ongoing costs of investing in your Fund and other funds. To do so, compare this 5% hypothetical example with the 5% hypothetical examples that appear in the shareholder reports of the other funds.
Please note that the expenses shown in the table are meant to highlight your ongoing costs only and do not reflect any transactional costs, such as sales charges (loads) or redemption fees (if applicable). Therefore, the second section of the table is useful in comparing ongoing costs only, and will not help you determine the relative total costs of owning different funds. In addition, if these transactional costs were included, your costs would be higher.
| Beginning Account Value (3/1/21) |
Ending Account Value (8/31/21) |
Expenses Paid During Period* (3/1/21 – 8/31/21) |
Annualized Expense Ratio |
|||||||||||||
| Actual |
| |||||||||||||||
| Investor Class |
$ | 1,000.00 | $ | 1,135.60 | $ | 3.50 | ** | 0.65 | % | |||||||
| Institutional Class |
$ | 1,000.00 | $ | 1,137.50 | $ | 2.16 | ** | 0.40 | % | |||||||
| Hypothetical |
| |||||||||||||||
| (5% return per year before expenses) |
| |||||||||||||||
| Investor Class |
$ | 1,000.00 | $ | 1,021.90 | $ | 3.31 | ** | 0.65 | % | |||||||
| Institutional Class |
$ | 1,000.00 | $ | 1,023.20 | $ | 2.04 | ** | 0.40 | % | |||||||
| * | Expenses are equal to the Fund’s annualized expense ratio for the indicated Class, multiplied by the average account value over the period, multiplied by 184/365 (to reflect the one-half year period). The Example assumes that the $1,000 was invested at the net asset value per share determined at the close of business on February 28, 2021. |
| ** | Absent an allocation of certain expenses to affiliates, expenses would be higher. |
| 4 |
Parametric
Dividend Income Fund
August 31, 2021
Portfolio of Investments (Unaudited)
| Common Stocks — 99.3% | ||||||||
| Security | Shares | Value | ||||||
| Aerospace & Defense — 2.2% | ||||||||
| General Dynamics Corp. |
1,051 | $ | 210,526 | |||||
| L3Harris Technologies, Inc. |
891 | 207,612 | ||||||
| Lockheed Martin Corp. |
521 | 187,456 | ||||||
| Raytheon Technologies Corp. |
2,324 | 196,982 | ||||||
| $ | 802,576 | |||||||
| Air Freight & Logistics — 1.1% | ||||||||
| C.H. Robinson Worldwide, Inc. |
2,138 | $ | 192,548 | |||||
| Expeditors International of Washington, Inc. |
1,545 | 192,569 | ||||||
| $ | 385,117 | |||||||
| Auto Components — 1.1% | ||||||||
| Gentex Corp. |
6,080 | $ | 187,264 | |||||
| LCI Industries |
1,530 | 216,740 | ||||||
| $ | 404,004 | |||||||
| Banks — 2.8% | ||||||||
| Bank of Hawaii Corp. |
2,431 | $ | 203,742 | |||||
| Commerce Bancshares, Inc. |
200 | 14,144 | ||||||
| Cullen/Frost Bankers, Inc. |
1,907 | 217,817 | ||||||
| F.N.B. Corp. |
16,742 | 195,547 | ||||||
| Prosperity Bancshares, Inc. |
2,849 | 199,088 | ||||||
| Umpqua Holdings Corp. |
10,415 | 202,780 | ||||||
| $ | 1,033,118 | |||||||
| Beverages — 1.7% | ||||||||
| Coca-Cola Co. (The) |
3,551 | $ | 199,957 | |||||
| Keurig Dr Pepper, Inc. |
5,864 | 209,169 | ||||||
| PepsiCo, Inc. |
1,320 | 206,434 | ||||||
| $ | 615,560 | |||||||
| Biotechnology — 1.7% | ||||||||
| AbbVie, Inc. |
1,709 | $ | 206,413 | |||||
| Amgen, Inc. |
815 | 183,807 | ||||||
| Gilead Sciences, Inc. |
2,919 | 212,445 | ||||||
| $ | 602,665 | |||||||
| Building Products — 1.1% | ||||||||
| A.O. Smith Corp. |
2,734 | $ | 198,816 | |||||
| Johnson Controls International PLC |
2,870 | 214,676 | ||||||
| $ | 413,492 | |||||||
| Security | Shares | Value | ||||||
| Capital Markets — 4.2% | ||||||||
| BlackRock, Inc. |
222 | $ | 209,410 | |||||
| Blackstone, Inc. |
2,019 | 253,849 | ||||||
| CME Group, Inc. |
928 | 187,196 | ||||||
| Houlihan Lokey, Inc. |
2,414 | 217,743 | ||||||
| Janus Henderson Group PLC |
5,184 | 224,778 | ||||||
| Moelis & Co., Class A |
3,676 | 227,728 | ||||||
| T. Rowe Price Group, Inc. |
974 | 218,050 | ||||||
| $ | 1,538,754 | |||||||
| Chemicals — 5.9% | ||||||||
| Air Products and Chemicals, Inc. |
696 | $ | 187,579 | |||||
| Celanese Corp. |
1,336 | 211,890 | ||||||
| Corteva, Inc. |
4,574 | 201,119 | ||||||
| Dow, Inc. |
3,260 | 205,054 | ||||||
| DuPont de Nemours, Inc. |
2,613 | 193,414 | ||||||
| Eastman Chemical Co. |
1,779 | 201,312 | ||||||
| FMC Corp. |
1,888 | 176,773 | ||||||
| Huntsman Corp. |
7,533 | 199,097 | ||||||
| International Flavors & Fragrances, Inc. |
1,331 | 201,646 | ||||||
| LyondellBasell Industries NV, Class A |
1,976 | 198,292 | ||||||
| RPM International, Inc. |
2,195 | 180,627 | ||||||
| $ | 2,156,803 | |||||||
| Communications Equipment — 1.2% | ||||||||
| Cisco Systems, Inc. |
3,672 | $ | 216,722 | |||||
| Juniper Networks, Inc. |
7,343 | 212,800 | ||||||
| $ | 429,522 | |||||||
| Containers & Packaging — 2.2% | ||||||||
| AptarGroup, Inc. |
1,415 | $ | 190,742 | |||||
| International Paper Co. |
3,207 | 192,709 | ||||||
| Packaging Corp. of America |
1,469 | 222,847 | ||||||
| Sonoco Products Co. |
2,933 | 191,525 | ||||||
| $ | 797,823 | |||||||
| Distributors — 0.5% | ||||||||
| Genuine Parts Co. |
1,509 | $ | 184,385 | |||||
| $ | 184,385 | |||||||
| Diversified Consumer Services — 1.2% | ||||||||
| H&R Block, Inc. |
8,378 | $ | 214,895 | |||||
| Service Corp. International |
3,655 | 229,388 | ||||||
| $ | 444,283 | |||||||
| 5 | See Notes to Financial Statements. |
Parametric
Dividend Income Fund
August 31, 2021
Portfolio of Investments (Unaudited) — continued
| Security | Shares | Value | ||||||
| Diversified Telecommunication Services — 1.1% | ||||||||
| AT&T, Inc. |
6,897 | $ | 189,116 | |||||
| Verizon Communications, Inc. |
3,509 | 192,995 | ||||||
| $ | 382,111 | |||||||
| Electric Utilities — 7.4% | ||||||||
| ALLETE, Inc. |
2,829 | $ | 190,731 | |||||
| Alliant Energy Corp. |
3,518 | 213,859 | ||||||
| American Electric Power Co., Inc. |
2,331 | 208,788 | ||||||
| Avangrid, Inc.(1) |
3,867 | 211,332 | ||||||
| Duke Energy Corp. |
1,988 | 208,064 | ||||||
| Evergy, Inc. |
3,228 | 220,957 | ||||||
| Hawaiian Electric Industries, Inc. |
4,858 | 211,809 | ||||||
| IDACORP, Inc. |
2,012 | 211,964 | ||||||
| OGE Energy Corp. |
5,865 | 207,680 | ||||||
| Pinnacle West Capital Corp. |
2,374 | 182,561 | ||||||
| Portland General Electric Co. |
4,373 | 224,553 | ||||||
| PPL Corp. |
7,087 | 208,003 | ||||||
| Southern Co. (The) |
3,306 | 217,303 | ||||||
| $ | 2,717,604 | |||||||
| Electrical Equipment — 1.8% | ||||||||
| Eaton Corp. PLC |
1,306 | $ | 219,878 | |||||
| Emerson Electric Co. |
2,109 | 222,500 | ||||||
| Hubbell, Inc. |
1,056 | 217,652 | ||||||
| $ | 660,030 | |||||||
| Electronic Equipment, Instruments & Components — 0.5% | ||||||||
| National Instruments Corp. |
4,706 | $ | 196,805 | |||||
| $ | 196,805 | |||||||
| Energy Equipment & Services — 1.5% | ||||||||
| Baker Hughes Co. |
9,273 | $ | 211,239 | |||||
| Helmerich & Payne, Inc. |
6,195 | 166,769 | ||||||
| Schlumberger NV |
6,278 | 176,035 | ||||||
| $ | 554,043 | |||||||
| Food & Staples Retailing — 1.2% | ||||||||
| Costco Wholesale Corp. |
494 | $ | 225,012 | |||||
| Walmart, Inc. |
1,394 | 206,451 | ||||||
| $ | 431,463 | |||||||
| Food Products — 3.6% | ||||||||
| Archer-Daniels-Midland Co. |
3,340 | $ | 200,400 | |||||
| General Mills, Inc. |
3,291 | 190,253 | ||||||
| Security | Shares | Value | ||||||
| Food Products (continued) | ||||||||
| Hormel Foods Corp.(1) |
4,195 | $ | 191,040 | |||||
| Ingredion, Inc. |
2,079 | 182,661 | ||||||
| Kellogg Co. |
3,126 | 197,375 | ||||||
| Kraft Heinz Co. (The) |
4,825 | 173,652 | ||||||
| Mondelez International, Inc., Class A |
3,124 | 193,907 | ||||||
| $ | 1,329,288 | |||||||
| Gas Utilities — 1.1% | ||||||||
| Atmos Energy Corp. |
2,089 | $ | 203,698 | |||||
| Spire, Inc. |
2,800 | 186,760 | ||||||
| $ | 390,458 | |||||||
| Health Care Equipment & Supplies — 2.8% | ||||||||
| Abbott Laboratories |
1,677 | $ | 211,922 | |||||
| Baxter International, Inc. |
2,439 | 185,901 | ||||||
| Becton, Dickinson and Co. |
776 | 195,319 | ||||||
| Medtronic PLC |
1,506 | 201,021 | ||||||
| West Pharmaceutical Services, Inc. |
535 | 241,617 | ||||||
| $ | 1,035,780 | |||||||
| Health Care Providers & Services — 2.8% | ||||||||
| Cardinal Health, Inc. |
3,499 | $ | 183,663 | |||||
| Chemed Corp. |
409 | 194,970 | ||||||
| Patterson Cos., Inc. |
6,627 | 203,051 | ||||||
| Quest Diagnostics, Inc. |
1,482 | 226,494 | ||||||
| UnitedHealth Group, Inc. |
485 | 201,891 | ||||||
| $ | 1,010,069 | |||||||
| Health Care Technology — 0.5% | ||||||||
| Cerner Corp. |
2,466 | $ | 188,279 | |||||
| $ | 188,279 | |||||||
| Hotels, Restaurants & Leisure — 0.5% | ||||||||
| McDonald’s Corp. |
838 | $ | 198,991 | |||||
| $ | 198,991 | |||||||
| Household Durables — 2.8% | ||||||||
| Garmin, Ltd. |
1,350 | $ | 235,481 | |||||
| Leggett & Platt, Inc. |
3,852 | 186,398 | ||||||
| MDC Holdings, Inc. |
4,182 | 218,510 | ||||||
| Newell Brands, Inc. |
7,566 | 192,252 | ||||||
| Whirlpool Corp. |
899 | 199,155 | ||||||
| $ | 1,031,796 | |||||||
| 6 | See Notes to Financial Statements. |
Parametric
Dividend Income Fund
August 31, 2021
Portfolio of Investments (Unaudited) — continued
| Security | Shares | Value | ||||||
| Household Products — 2.7% | ||||||||
| Church & Dwight Co., Inc. |
2,303 | $ | 192,669 | |||||
| Clorox Co. (The) |
1,076 | 180,822 | ||||||
| Colgate-Palmolive Co. |
2,379 | 185,443 | ||||||
| Kimberly-Clark Corp. |
1,479 | 203,821 | ||||||
| Procter & Gamble Co. (The) |
1,460 | 207,889 | ||||||
| $ | 970,644 | |||||||
| Industrial Conglomerates — 0.5% | ||||||||
| 3M Co. |
992 | $ | 193,182 | |||||
| $ | 193,182 | |||||||
| Insurance — 4.7% | ||||||||
| Aflac, Inc. |
3,712 | $ | 210,396 | |||||
| Cincinnati Financial Corp. |
1,690 | 208,546 | ||||||
| Fidelity National Financial, Inc. |
4,572 | 223,251 | ||||||
| Hanover Insurance Group, Inc. (The) |
1,452 | 205,182 | ||||||
| Old Republic International Corp. |
8,105 | 210,730 | ||||||
| Principal Financial Group, Inc. |
3,391 | 226,553 | ||||||
| Prudential Financial, Inc. |
2,058 | 217,901 | ||||||
| Travelers Cos., Inc. (The) |
1,311 | 209,380 | ||||||
| $ | 1,711,939 | |||||||
| IT Services — 5.0% | ||||||||
| Accenture PLC, Class A |
637 | $ | 214,389 | |||||
| Amdocs, Ltd. |
2,526 | 194,578 | ||||||
| Automatic Data Processing, Inc. |
978 | 204,441 | ||||||
| Cognizant Technology Solutions Corp., Class A |
2,895 | 220,917 | ||||||
| International Business Machines Corp. |
1,419 | 199,142 | ||||||
| Jack Henry & Associates, Inc. |
1,154 | 203,543 | ||||||
| MAXIMUS, Inc. |
2,328 | 202,746 | ||||||
| Paychex, Inc. |
1,743 | 199,521 | ||||||
| Western Union Co. (The) |
8,591 | 185,909 | ||||||
| $ | 1,825,186 | |||||||
| Leisure Products — 1.0% | ||||||||
| Hasbro, Inc. |
2,047 | $ | 201,241 | |||||
| Polaris, Inc. |
1,482 | 177,484 | ||||||
| $ | 378,725 | |||||||
| Life Sciences Tools & Services — 1.2% | ||||||||
| Agilent Technologies, Inc. |
1,335 | $ | 234,253 | |||||
| Bio-Techne Corp. |
431 | 215,129 | ||||||
| $ | 449,382 | |||||||
| Security | Shares | Value | ||||||
| Machinery — 1.6% | ||||||||
| Cummins, Inc. |
836 | $ | 197,279 | |||||
| Graco, Inc. |
2,474 | 194,011 | ||||||
| Snap-on, Inc. |
873 | 196,382 | ||||||
| $ | 587,672 | |||||||
| Media — 0.5% | ||||||||
| Omnicom Group, Inc. |
2,558 | $ | 187,297 | |||||
| $ | 187,297 | |||||||
| Metals & Mining — 2.7% | ||||||||
| Newmont Corp. |
3,097 | $ | 179,595 | |||||
| Nucor Corp. |
2,085 | 245,112 | ||||||
| Reliance Steel & Aluminum Co. |
1,294 | 194,152 | ||||||
| Royal Gold, Inc. |
1,671 | 186,032 | ||||||
| Southern Copper Corp. |
3,118 | 195,156 | ||||||
| $ | 1,000,047 | |||||||
| Multi-Utilities — 2.8% | ||||||||
| Ameren Corp. |
2,435 | $ | 213,598 | |||||
| Consolidated Edison, Inc. |
2,706 | 204,168 | ||||||
| Dominion Energy, Inc. |
2,683 | 208,845 | ||||||
| Public Service Enterprise Group, Inc. |
3,201 | 204,672 | ||||||
| WEC Energy Group, Inc. |
2,169 | 204,927 | ||||||
| $ | 1,036,210 | |||||||
| Multiline Retail — 0.6% | ||||||||
| Target Corp. |
806 | $ | 199,066 | |||||
| $ | 199,066 | |||||||
| Oil, Gas & Consumable Fuels — 8.6% | ||||||||
| Antero Midstream Corp. |
19,071 | $ | 183,272 | |||||
| Cabot Oil & Gas Corp. |
11,527 | 183,164 | ||||||
| Chevron Corp. |
1,928 | 186,573 | ||||||
| ConocoPhillips |
3,382 | 187,803 | ||||||
| Diamondback Energy, Inc. |
2,268 | 174,954 | ||||||
| EOG Resources, Inc. |
2,548 | 172,041 | ||||||
| Exxon Mobil Corp. |
3,305 | 180,189 | ||||||
| Hess Corp. |
2,395 | 164,656 | ||||||
| HollyFrontier Corp. |
6,406 | 207,106 | ||||||
| Kinder Morgan, Inc. |
10,552 | 171,681 | ||||||
| Marathon Petroleum Corp. |
3,497 | 207,267 | ||||||
| ONEOK, Inc. |
3,463 | 181,877 | ||||||
| Phillips 66 |
2,382 | 169,336 | ||||||
| Pioneer Natural Resources Co. |
1,300 | 194,571 | ||||||
| 7 | See Notes to Financial Statements. |
Parametric
Dividend Income Fund
August 31, 2021
Portfolio of Investments (Unaudited) — continued
| Security | Shares | Value | ||||||
| Oil, Gas & Consumable Fuels (continued) | ||||||||
| Texas Pacific Land Corp. |
134 | $ | 182,205 | |||||
| Valero Energy Corp. |
2,855 | 189,315 | ||||||
| Williams Cos., Inc. (The) |
7,641 | 188,656 | ||||||
| $ | 3,124,666 | |||||||
| Personal Products — 0.5% | ||||||||
| Nu Skin Enterprises, Inc., Class A |
3,505 | $ | 177,423 | |||||
| $ | 177,423 | |||||||
| Pharmaceuticals — 2.3% | ||||||||
| Bristol-Myers Squibb Co. |
2,947 | $ | 197,036 | |||||
| Johnson & Johnson |
1,153 | 199,619 | ||||||
| Merck & Co., Inc. |
2,562 | 195,455 | ||||||
| Pfizer, Inc. |
5,010 | 230,811 | ||||||
| $ | 822,921 | |||||||
| Professional Services — 0.7% | ||||||||
| Robert Half International, Inc. |
2,281 | $ | 235,855 | |||||
| $ | 235,855 | |||||||
| Road & Rail — 0.6% | ||||||||
| Landstar System, Inc. |
1,263 | $ | 212,222 | |||||
| $ | 212,222 | |||||||
| Semiconductors & Semiconductor Equipment — 1.6% | ||||||||
| Broadcom, Inc. |
424 | $ | 210,817 | |||||
| Intel Corp. |
3,566 | 192,778 | ||||||
| Texas Instruments, Inc. |
1,027 | 196,065 | ||||||
| $ | 599,660 | |||||||
| Software — 1.2% | ||||||||
| Dolby Laboratories, Inc., Class A |
2,074 | $ | 205,554 | |||||
| Microsoft Corp. |
713 | 215,241 | ||||||
| $ | 420,795 | |||||||
| Specialty Retail — 2.1% | ||||||||
| Advance Auto Parts, Inc. |
953 | $ | 193,316 | |||||
| Best Buy Co., Inc. |
1,818 | 211,815 | ||||||
| Buckle, Inc. (The) |
4,393 | 170,141 | ||||||
| Home Depot, Inc. (The) |
628 | 204,841 | ||||||
| $ | 780,113 | |||||||
| Security | Shares | Value | ||||||
| Textiles, Apparel & Luxury Goods — 1.1% | ||||||||
| Hanesbrands, Inc. |
11,345 | $ | 211,924 | |||||
| VF Corp. |
2,372 | 181,387 | ||||||
| $ | 393,311 | |||||||
| Tobacco — 1.2% | ||||||||
| Altria Group, Inc. |
4,265 | $ | 214,231 | |||||
| Philip Morris International, Inc. |
2,000 | 206,000 | ||||||
| $ | 420,231 | |||||||
| Trading Companies & Distributors — 1.6% | ||||||||
| Fastenal Co. |
3,711 | $ | 207,259 | |||||
| MSC Industrial Direct Co., Inc., Class A |
2,199 | 185,178 | ||||||
| Watsco, Inc. |
675 | 187,934 | ||||||
| $ | 580,371 | |||||||
| Total Common Stocks |
|
$ | 36,241,737 | |||||
| Short-Term Investments — 0.7% |
| |||||||
| Description | Units | Value | ||||||
| Eaton Vance Cash Reserves Fund, LLC, 0.07%(2) |
279,988 | $ | 279,988 | |||||
| Total Short-Term Investments |
|
$ | 279,988 | |||||
| Total Investments — 100.0% |
|
$ | 36,521,725 | |||||
| Other Assets, Less Liabilities — (0.0)%(3) |
|
$ | (17,758 | ) | ||||
| Net Assets — 100.0% |
|
$ | 36,503,967 | |||||
The percentage shown for each investment category in the Portfolio of Investments is based on net assets.
| (1) | All or a portion of this security was on loan at August 31, 2021. The aggregate market value of securities on loan at August 31, 2021 was $296,910. |
| (2) | Affiliated investment company, available to Eaton Vance portfolios and funds, which invests in high quality, U.S. dollar denominated money market instruments. The rate shown is the annualized seven-day yield as of August 31, 2021. |
| (3) | Amount is less than (0.05%). |
| 8 | See Notes to Financial Statements. |
Parametric
Dividend Income Fund
August 31, 2021
Statement of Assets and Liabilities (Unaudited)
| Assets | August 31, 2021 | |||
| Unaffiliated investments, at value including $296,910 of securities on loan (identified cost, $26,976,190) |
$ | 36,241,737 | ||
| Affiliated investment, at value (identified cost, $279,988) |
279,988 | |||
| Dividends receivable |
86,233 | |||
| Dividends receivable from affiliated investment |
13 | |||
| Receivable for Fund shares sold |
100,131 | |||
| Securities lending income receivable |
63 | |||
| Receivable from affiliates |
4,949 | |||
| Total assets |
$ | 36,713,114 | ||
| Liabilities | ||||
| Payable for investments purchased |
$ | 151,564 | ||
| Payable for Fund shares redeemed |
7,104 | |||
| Payable to affiliates: |
||||
| Investment adviser and administration fee |
9,200 | |||
| Distribution and service fees |
788 | |||
| Accrued expenses |
40,491 | |||
| Total liabilities |
$ | 209,147 | ||
| Net Assets |
$ | 36,503,967 | ||
| Sources of Net Assets | ||||
| Paid-in capital |
$ | 31,580,481 | ||
| Distributable earnings |
4,923,486 | |||
| Total |
$ | 36,503,967 | ||
| Investor Class Shares |
| |||
| Net Assets |
$ | 3,725,259 | ||
| Shares Outstanding |
235,052 | |||
| Net Asset Value, Offering Price and Redemption Price Per Share |
| |||
| (net assets ÷ shares of beneficial interest outstanding) |
$ | 15.85 | ||
| Institutional Class Shares |
| |||
| Net Assets |
$ | 32,778,708 | ||
| Shares Outstanding |
2,064,771 | |||
| Net Asset Value, Offering Price and Redemption Price Per Share |
| |||
| (net assets ÷ shares of beneficial interest outstanding) |
$ | 15.88 | ||
| 9 | See Notes to Financial Statements. |
Parametric
Dividend Income Fund
August 31, 2021
Statement of Operations (Unaudited)
| Investment Income | Six Months Ended August 31, 2021 |
|||
| Dividends |
$ | 554,279 | ||
| Dividends from affiliated investment |
91 | |||
| Securities lending income, net |
339 | |||
| Total investment income |
$ | 554,709 | ||
| Expenses | ||||
| Investment adviser and administration fee |
$ | 56,089 | ||
| Distribution and service fees |
||||
| Investor Class |
4,501 | |||
| Trustees’ fees and expenses |
1,094 | |||
| Custodian fee |
11,576 | |||
| Transfer and dividend disbursing agent fees |
6,996 | |||
| Legal and accounting services |
17,479 | |||
| Printing and postage |
2,839 | |||
| Registration fees |
18,919 | |||
| Miscellaneous |
4,600 | |||
| Total expenses |
$ | 124,093 | ||
| Deduct — |
| |||
| Allocation of expenses to affiliates |
$ | 44,802 | ||
| Total expense reductions |
$ | 44,802 | ||
| Net expenses |
$ | 79,291 | ||
| Net investment income |
$ | 475,418 | ||
| Realized and Unrealized Gain (Loss) |
| |||
| Net realized gain (loss) — |
| |||
| Investment transactions |
$ | 2,928,240 | ||
| Investment transactions — affiliated investment |
(6 | ) | ||
| Net realized gain |
$ | 2,928,234 | ||
| Change in unrealized appreciation (depreciation) — |
| |||
| Investments |
$ | 1,217,385 | ||
| Net change in unrealized appreciation (depreciation) |
$ | 1,217,385 | ||
| Net realized and unrealized gain |
$ | 4,145,619 | ||
| Net increase in net assets from operations |
$ | 4,621,037 | ||
| 10 | See Notes to Financial Statements. |
Parametric
Dividend Income Fund
August 31, 2021
Statements of Changes in Net Assets
| Increase (Decrease) in Net Assets | Six Months Ended August 31, 2021 |
Year Ended February 28, 2021 |
||||||
| From operations — |
| |||||||
| Net investment income |
$ | 475,418 | $ | 982,906 | ||||
| Net realized gain (loss) |
2,928,234 | (4,230,048 | ) | |||||
| Net change in unrealized appreciation (depreciation) |
1,217,385 | 7,366,836 | ||||||
| Net increase in net assets from operations |
$ | 4,621,037 | $ | 4,119,694 | ||||
| Distributions to shareholders — |
| |||||||
| Investor Class |
$ | (42,943 | ) | $ | (89,412 | ) | ||
| Institutional Class |
(444,654 | ) | (942,405 | ) | ||||
| Total distributions to shareholders |
$ | (487,597 | ) | $ | (1,031,817 | ) | ||
| Transactions in shares of beneficial interest — |
| |||||||
| Proceeds from sale of shares |
| |||||||
| Investor Class |
$ | 262,614 | $ | 331,328 | ||||
| Institutional Class |
2,993,561 | 6,159,035 | ||||||
| Net asset value of shares issued to shareholders in payment of distributions declared |
| |||||||
| Investor Class |
42,943 | 89,412 | ||||||
| Institutional Class |
150,608 | 389,500 | ||||||
| Cost of shares redeemed |
| |||||||
| Investor Class |
(103,049 | ) | (1,311,299 | ) | ||||
| Institutional Class |
(5,210,878 | ) | (21,219,993 | ) | ||||
| Net decrease in net assets from Fund share transactions |
$ | (1,864,201 | ) | $ | (15,562,017 | ) | ||
| Net increase (decrease) in net assets |
$ | 2,269,239 | $ | (12,474,140 | ) | |||
| Net Assets | ||||||||
| At beginning of period |
$ | 34,234,728 | $ | 46,708,868 | ||||
| At end of period |
$ | 36,503,967 | $ | 34,234,728 | ||||
| 11 | See Notes to Financial Statements. |
Parametric
Dividend Income Fund
August 31, 2021
Financial Highlights
| Investor Class | ||||||||||||||||||||||||
| Six Months Ended August 31, 2021 (Unaudited) |
Year Ended February 28, 2021 |
Year Ended February 29, 2020 |
Year Ended February 28, | |||||||||||||||||||||
| 2019 | 2018 | 2017 | ||||||||||||||||||||||
| Net asset value — Beginning of period |
$ | 14.130 | $ | 11.950 | $ | 12.870 | $ | 12.910 | $ | 12.170 | $ | 10.080 | ||||||||||||
| Income (Loss) From Operations | ||||||||||||||||||||||||
| Net investment income(1) |
$ | 0.182 | $ | 0.349 | $ | 0.362 | $ | 0.366 | $ | 0.328 | $ | 0.275 | ||||||||||||
| Net realized and unrealized gain (loss) |
1.726 | 2.194 | (0.950 | ) | 0.216 | 0.854 | 2.114 | |||||||||||||||||
| Total income (loss) from operations |
$ | 1.908 | $ | 2.543 | $ | (0.588 | ) | $ | 0.582 | $ | 1.182 | $ | 2.389 | |||||||||||
| Less Distributions | ||||||||||||||||||||||||
| From net investment income |
$ | (0.188 | ) | $ | (0.363 | ) | $ | (0.325 | ) | $ | (0.306 | ) | $ | (0.305 | ) | $ | (0.249 | ) | ||||||
| From net realized gain |
— | — | (0.007 | ) | (0.316 | ) | (0.137 | ) | (0.050 | ) | ||||||||||||||
| Total distributions |
$ | (0.188 | ) | $ | (0.363 | ) | $ | (0.332 | ) | $ | (0.622 | ) | $ | (0.442 | ) | $ | (0.299 | ) | ||||||
| Net asset value — End of period |
$ | 15.850 | $ | 14.130 | $ | 11.950 | $ | 12.870 | $ | 12.910 | $ | 12.170 | ||||||||||||
| Total Return(2)(3) |
13.56 | %(4) | 22.15 | % | (4.76 | )% | 4.81 | % | 9.87 | % | 23.97 | % | ||||||||||||
| Ratios/Supplemental Data | ||||||||||||||||||||||||
| Net assets, end of period (000’s omitted) |
$ | 3,725 | $ | 3,140 | $ | 3,612 | $ | 6,597 | $ | 5,633 | $ | 2,450 | ||||||||||||
| Ratios (as a percentage of average daily net assets): |
||||||||||||||||||||||||
| Expenses(3) |
0.65 | %(5) | 0.65 | % | 0.65 | % | 0.65 | % | 0.65 | % | 0.68 | % | ||||||||||||
| Net investment income |
2.32 | %(5) | 2.92 | % | 2.78 | % | 2.82 | % | 2.61 | % | 2.34 | % | ||||||||||||
| Portfolio Turnover |
33 | %(4) | 61 | % | 51 | % | 77 | % | 30 | % | 26 | % | ||||||||||||
| (1) | Computed using average shares outstanding. |
| (2) | Returns are historical and are calculated by determining the percentage change in net asset value with all distributions reinvested. |
| (3) | The investment adviser and administrator and the sub-adviser reimbursed certain operating expenses (equal to 0.24%, 0.34%, 0.17%, 0.26%, 0.62% and 1.60% of average daily net assets for the six months ended August 31, 2021 and the years ended February 28, 2021, February 29, 2020 and February 28, 2019, 2018 and 2017, respectively). Absent this reimbursement, total return would be lower. |
| (4) | Not annualized. |
| (5) | Annualized. |
| 12 | See Notes to Financial Statements. |
Parametric
Dividend Income Fund
August 31, 2021
Financial Highlights — continued
| Institutional Class | ||||||||||||||||||||||||
| Six Months Ended August 31, 2021 (Unaudited) |
Year Ended February 28, 2021 |
Year Ended February 29, 2020 |
Year Ended February 28, | |||||||||||||||||||||
| 2019 | 2018 | 2017 | ||||||||||||||||||||||
| Net asset value — Beginning of period |
$ | 14.150 | $ | 11.970 | $ | 12.890 | $ | 12.930 | $ | 12.190 | $ | 10.090 | ||||||||||||
| Income (Loss) From Operations | ||||||||||||||||||||||||
| Net investment income(1) |
$ | 0.201 | $ | 0.380 | $ | 0.394 | $ | 0.399 | $ | 0.358 | $ | 0.310 | ||||||||||||
| Net realized and unrealized gain (loss) |
1.735 | 2.195 | (0.947 | ) | 0.215 | 0.851 | 2.108 | |||||||||||||||||
| Total income (loss) from operations |
$ | 1.936 | $ | 2.575 | $ | (0.553 | ) | $ | 0.614 | $ | 1.209 | $ | 2.418 | |||||||||||
| Less Distributions | ||||||||||||||||||||||||
| From net investment income |
$ | (0.206 | ) | $ | (0.395 | ) | $ | (0.360 | ) | $ | (0.338 | ) | $ | (0.332 | ) | $ | (0.268 | ) | ||||||
| From net realized gain |
— | — | (0.007 | ) | (0.316 | ) | (0.137 | ) | (0.050 | ) | ||||||||||||||
| Total distributions |
$ | (0.206 | ) | $ | (0.395 | ) | $ | (0.367 | ) | $ | (0.654 | ) | $ | (0.469 | ) | $ | (0.318 | ) | ||||||
| Net asset value — End of period |
$ | 15.880 | $ | 14.150 | $ | 11.970 | $ | 12.890 | $ | 12.930 | $ | 12.190 | ||||||||||||
| Total Return(2)(3) |
13.75 | %(4) | 22.47 | % | (4.50 | )% | 5.06 | % | 10.09 | % | 24.26 | % | ||||||||||||
| Ratios/Supplemental Data | ||||||||||||||||||||||||
| Net assets, end of period (000’s omitted) |
$ | 32,779 | $ | 31,094 | $ | 43,096 | $ | 51,344 | $ | 21,110 | $ | 15,070 | ||||||||||||
| Ratios (as a percentage of average daily net assets): |
||||||||||||||||||||||||
| Expenses(3) |
0.40 | %(5) | 0.40 | % | 0.40 | % | 0.40 | % | 0.40 | % | 0.51 | % | ||||||||||||
| Net investment income |
2.56 | %(5) | 3.19 | % | 3.01 | % | 3.07 | % | 2.84 | % | 2.71 | % | ||||||||||||
| Portfolio Turnover |
33 | %(4) | 61 | % | 51 | % | 77 | % | 30 | % | 26 | % | ||||||||||||
| (1) | Computed using average shares outstanding. |
| (2) | Returns are historical and are calculated by determining the percentage change in net asset value with all distributions reinvested. |
| (3) | The investment adviser and administrator and the sub-adviser reimbursed certain operating expenses (equal to 0.24%, 0.34%, 0.17%, 0.26%, 0.62% and 1.89% of average daily net assets for the six months ended August 31, 2021 and the years ended February 28, 2021, February 29, 2020 and February 28, 2019, 2018 and 2017, respectively). Absent this reimbursement, total return would be lower. |
| (4) | Not annualized. |
| (5) | Annualized. |
| 13 | See Notes to Financial Statements. |
Parametric
Dividend Income Fund
August 31, 2021
Notes to Financial Statements (Unaudited)
1 Significant Accounting Policies
Parametric Dividend Income Fund (the Fund) is a diversified series of Eaton Vance Mutual Funds Trust (the Trust). The Trust is a Massachusetts business trust registered under the Investment Company Act of 1940, as amended (the 1940 Act), as an open-end management investment company. The Fund’s investment objective is total return and current income. The Fund offers Investor Class and Institutional Class shares, which are offered at net asset value and are not subject to a sales charge. Each class represents a pro-rata interest in the Fund, but votes separately on class-specific matters and (as noted below) is subject to different expenses. Realized and unrealized gains and losses and net investment income and losses, other than class-specific expenses, are allocated daily to each class of shares based on the relative net assets of each class to the total net assets of the Fund. Each class of shares differs in its distribution plan and certain other class-specific expenses.
The following is a summary of significant accounting policies of the Fund. The policies are in conformity with accounting principles generally accepted in the United States of America (U.S. GAAP). The Fund is an investment company and follows accounting and reporting guidance in the Financial Accounting Standards Board (FASB) Accounting Standards Codification Topic 946.
A Investment Valuation — The following methodologies are used to determine the market value or fair value of investments.
Equity Securities. Equity securities listed on a U.S. securities exchange generally are valued at the last sale or closing price on the day of valuation or, if no sales took place on such date, at the mean between the closing bid and ask prices on the exchange where such securities are principally traded. Equity securities listed on the NASDAQ Global or Global Select Market generally are valued at the NASDAQ official closing price. Unlisted or listed securities for which closing sales prices or closing quotations are not available are valued at the mean between the latest available bid and ask prices.
Affiliated Fund. The Fund may invest in Eaton Vance Cash Reserves Fund, LLC (Cash Reserves Fund), an affiliated investment company managed by Eaton Vance Management (EVM). While Cash Reserves Fund is not a registered money market mutual fund, it conducts all of its investment activities in accordance with the requirements of Rule 2a-7 under the 1940 Act. Investments in Cash Reserves Fund are valued at the closing net asset value per unit on the valuation day. Cash Reserves Fund generally values its investment securities based on available market quotations provided by a third party pricing service.
Fair Valuation. Investments for which valuations or market quotations are not readily available or are deemed unreliable are valued at fair value using methods determined in good faith by or at the direction of the Trustees of the Fund in a manner that most fairly reflects the security’s “fair value”, which is the amount that the Fund might reasonably expect to receive for the security upon its current sale in the ordinary course. Each such determination is based on a consideration of relevant factors, which are likely to vary from one pricing context to another. These factors may include, but are not limited to, the type of security, the existence of any contractual restrictions on the security’s disposition, the price and extent of public trading in similar securities of the issuer or of comparable companies or entities, quotations or relevant information obtained from broker/dealers or other market participants, information obtained from the issuer, analysts, and/or the appropriate stock exchange (for exchange-traded securities), an analysis of the company’s or entity’s financial statements, and an evaluation of the forces that influence the issuer and the market(s) in which the security is purchased and sold.
B Investment Transactions — Investment transactions for financial statement purposes are accounted for on a trade date basis. Realized gains and losses on investments sold are determined on the basis of identified cost.
C Income — Dividend income is recorded on the ex-dividend date for dividends received in cash and/or securities.
D Federal Taxes — The Fund’s policy is to comply with the provisions of the Internal Revenue Code applicable to regulated investment companies and to distribute to shareholders each year substantially all of its net investment income, and all or substantially all of its net realized capital gains. Accordingly, no provision for federal income or excise tax is necessary.
As of August 31, 2021, the Fund had no uncertain tax positions that would require financial statement recognition, de-recognition, or disclosure. The Fund files a U.S. federal income tax return annually after its fiscal year-end, which is subject to examination by the Internal Revenue Service for a period of three years from the date of filing.
E Expenses — The majority of expenses of the Trust are directly identifiable to an individual fund. Expenses which are not readily identifiable to a specific fund are allocated taking into consideration, among other things, the nature and type of expense and the relative size of the funds.
F Use of Estimates — The preparation of the financial statements in conformity with U.S. GAAP requires management to make estimates and assumptions that affect the reported amounts of assets and liabilities at the date of the financial statements and the reported amounts of income and expense during the reporting period. Actual results could differ from those estimates.
G Indemnifications — Under the Trust’s organizational documents, its officers and Trustees may be indemnified against certain liabilities and expenses arising out of the performance of their duties to the Fund. Under Massachusetts law, if certain conditions prevail, shareholders of a Massachusetts business trust (such as the Trust) could be deemed to have personal liability for the obligations of the Trust. However, the Trust’s Declaration of Trust contains an express disclaimer of liability on the part of Fund shareholders and the By-laws provide that the Trust shall assume, upon request by the shareholder, the defense on behalf of any Fund shareholders. Moreover, the By-laws also provide for indemnification out of Fund property of any shareholder held personally liable solely by reason of being or having been a shareholder for all loss or expense arising from such liability. Additionally, in the normal course of business, the Fund enters into agreements with service providers that may contain indemnification clauses. The Fund’s maximum exposure under these arrangements is unknown as this would involve future claims that may be made against the Fund that have not yet occurred.
| 14 |
Parametric
Dividend Income Fund
August 31, 2021
Notes to Financial Statements (Unaudited) — continued
H Interim Financial Statements — The interim financial statements relating to August 31, 2021 and for the six months then ended have not been audited by an independent registered public accounting firm, but in the opinion of the Fund’s management, reflect all adjustments, consisting only of normal recurring adjustments, necessary for the fair presentation of the financial statements.
2 Distributions to Shareholders and Income Tax Information
It is the present policy of the Fund to make quarterly distributions of all or substantially all of its net investment income and to distribute annually all or substantially all of its net realized capital gains. Distributions to shareholders are recorded on the ex-dividend date. Distributions are declared separately for each class of shares. Shareholders may reinvest income and capital gain distributions in additional shares of the same class of the Fund at the net asset value as of the ex-dividend date or, at the election of the shareholder, receive distributions in cash. Distributions to shareholders are determined in accordance with income tax regulations, which may differ from U.S. GAAP. As required by U.S. GAAP, only distributions in excess of tax basis earnings and profits are reported in the financial statements as a return of capital. Permanent differences between book and tax accounting relating to distributions are reclassified to paid-in capital. For tax purposes, distributions from short-term capital gains are considered to be from ordinary income.
At February 28, 2021, the Fund, for federal income tax purposes, had deferred capital losses of $4,917,732 which would reduce its taxable income arising from future net realized gains on investment transactions, if any, to the extent permitted by the Internal Revenue Code, and thus would reduce the amount of distributions to shareholders, which would otherwise be necessary to relieve the Fund of any liability for federal income or excise tax. The deferred capital losses are treated as arising on the first day of the Fund’s next taxable year and retain the same short-term or long-term character as when originally deferred. Of the deferred capital losses at February 28, 2021, $2,339,271 are short-term and $2,578,461 are long-term.
The cost and unrealized appreciation (depreciation) of investments of the Fund at August 31, 2021, as determined on a federal income tax basis, were as follows:
| Aggregate cost |
$ | 29,745,734 | ||
| Gross unrealized appreciation |
$ | 7,097,423 | ||
| Gross unrealized depreciation |
(321,432 | ) | ||
| Net unrealized appreciation |
$ | 6,775,991 | ||
3 Investment Adviser and Administration Fee and Other Transactions with Affiliates
The investment adviser and administration fee is earned by EVM as compensation for investment advisory and administrative services rendered to the Fund. On March 1, 2021, Morgan Stanley acquired Eaton Vance Corp. (the “Transaction”) and EVM became an indirect, wholly-owned subsidiary of Morgan Stanley. In connection with the Transaction, the Fund entered into a new investment advisory and administrative agreement (the “New Agreement”) with EVM, which took effect on March 1, 2021. The Fund’s prior fee reduction agreement was incorporated into the New Agreement. Pursuant to the New Agreement (and the Fund’s investment advisory and administrative agreement and related fee reduction agreement with EVM in effect prior to March 1, 2021), the investment adviser and administration fee is computed at an annual rate as a percentage of the Fund’s average daily net assets as follows and is payable monthly:
| Average Daily Net Assets | Annual Fee Rate |
|||
| Up to $1 billion |
0.3000 | % | ||
| $1 billion but less than $2.5 billion |
0.2875 | % | ||
| $2.5 billion but less than $5 billion |
0.2750 | % | ||
| $5 billion and over |
0.2675 | % | ||
For the six months ended August 31, 2021, the investment adviser and administration fee amounted to $56,089 or 0.30% (annualized) of the Fund’s average daily net assets. Pursuant to an investment sub-advisory agreement, EVM has delegated the investment management of the Fund to Parametric Portfolio Associates LLC (Parametric), an affiliate of EVM and, effective March 1, 2021, an indirect, wholly-owned subsidiary of Morgan Stanley. In connection with the Transaction, EVM entered into a new investment sub-advisory agreement with Parametric, which took effect on March 1, 2021. EVM pays Parametric a portion of its investment adviser and administration fee for sub-advisory services provided to the Fund. The Fund may invest its cash in Cash Reserves Fund. EVM does not currently receive a fee for advisory services provided to Cash Reserves Fund.
| 15 |
Parametric
Dividend Income Fund
August 31, 2021
Notes to Financial Statements (Unaudited) — continued
EVM and Parametric have agreed to reimburse the Fund’s expenses to the extent that total annual operating expenses (relating to ordinary operating expenses only) exceed 0.65% and 0.40% of the Fund’s average daily net assets for Investor Class and Institutional Class, respectively. This agreement may be changed or terminated after June 30, 2022. Pursuant to this agreement, EVM and Parametric were allocated $44,802 in total of the Fund’s operating expenses for the six months ended August 31, 2021.
EVM provides sub-transfer agency and related services to the Fund pursuant to a Sub-Transfer Agency Support Services Agreement. For the six months ended August 31, 2021, EVM earned $468 from the Fund pursuant to such agreement, which is included in transfer and dividend disbursing agent fees on the Statement of Operations. Eaton Vance Distributors, Inc. (EVD), an affiliate of EVM and the Fund’s principal underwriter, received distribution and service fees from Investor Class shares (see Note 4).
Trustees and officers of the Fund who are members of EVM’s organization receive remuneration for their services to the Fund out of the investment adviser and administration fee. Trustees of the Fund who are not affiliated with EVM may elect to defer receipt of all or a percentage of their annual fees in accordance with the terms of the Trustees Deferred Compensation Plan. For the six months ended August 31, 2021, no significant amounts have been deferred. Certain officers and Trustees of the Fund are officers of EVM.
4 Distribution Plan
The Fund has in effect a distribution plan for Investor Class shares (Investor Class Plan) pursuant to Rule 12b-1 under the 1940 Act. Pursuant to the Investor Class Plan, the Fund pays EVD a distribution and service fee of 0.25% per annum of its average daily net assets attributable to Investor Class shares for distribution services and facilities provided to the Fund by EVD, as well as for personal services and/or the maintenance of shareholder accounts. Distribution and service fees paid or accrued to EVD for the six months ended August 31, 2021 amounted to $4,501 for Investor Class shares.
Distribution and service fees are subject to the limitations contained in the Financial Industry Regulatory Authority Rule 2341(d).
5 Purchases and Sales of Investments
Purchases and sales of investments, other than short-term obligations, aggregated $11,829,373 and $13,714,948, respectively, for the six months ended August 31, 2021.
6 Shares of Beneficial Interest
The Fund’s Declaration of Trust permits the Trustees to issue an unlimited number of full and fractional shares of beneficial interest (without par value). Such shares may be issued in a number of different series (such as the Fund) and classes. Transactions in Fund shares were as follows:
| Investor Class | Six Months Ended August 31, 2021 (Unaudited) |
Year Ended February 28, 2021 |
||||||
| Sales |
16,661 | 28,196 | ||||||
| Issued to shareholders electing to receive payments of distributions in Fund shares |
2,816 | 8,133 | ||||||
| Redemptions |
(6,672 | ) | (116,367 | ) | ||||
| Net increase (decrease) |
12,805 | (80,038 | ) | |||||
| Institutional Class | Six Months Ended August 31, 2021 (Unaudited) |
Year Ended February 28, 2021 |
||||||
| Sales |
194,074 | 485,332 | ||||||
| Issued to shareholders electing to receive payments of distributions in Fund shares |
9,864 | 36,010 | ||||||
| Redemptions |
(336,234 | ) | (1,923,246 | ) | ||||
| Net decrease |
(132,296 | ) | (1,401,904 | ) | ||||
| 16 |
Parametric
Dividend Income Fund
August 31, 2021
Notes to Financial Statements (Unaudited) — continued
7 Line of Credit
The Fund participates with other portfolios and funds managed by EVM and its affiliates in an $800 million unsecured line of credit agreement with a group of banks, which is in effect through October 26, 2021. Borrowings are made by the Fund solely for temporary purposes related to redemptions and other short-term cash needs. Interest is charged to the Fund based on its borrowings at an amount above either the Eurodollar rate or Federal Funds rate. In addition, a fee computed at an annual rate of 0.15% on the daily unused portion of the line of credit is allocated among the participating portfolios and funds at the end of each quarter. In connection with the renewal of the agreement in October 2020, an upfront fee and arrangement fee totaling $950,000 was incurred that was allocated to the participating portfolios and funds. Because the line of credit is not available exclusively to the Fund, it may be unable to borrow some or all of its requested amounts at any particular time. The Fund did not have any significant borrowings or allocated fees during the six months ended August 31, 2021.
8 Securities Lending Agreement
The Fund has established a securities lending agreement with State Street Bank and Trust Company (SSBT) as securities lending agent in which the Fund lends portfolio securities to qualified borrowers in exchange for collateral consisting of either cash or securities issued or guaranteed by the U.S. government or its agencies or instrumentalities in an amount at least equal to the market value of the securities on loan. The market value of securities loaned is determined daily and any additional required collateral is delivered to the Fund on the next business day. Cash collateral is invested in the State Street Navigator Securities Lending Government Money Market Portfolio, a money market fund registered under the 1940 Act. The Fund earns interest on the amount invested but it must pay (and at times receive from) the broker a loan rebate fee computed as a varying percentage of the collateral received. For security loans secured by non-cash collateral, the Fund earns a negotiated lending fee from the borrower. A portion of the income earned by the Fund from its investment of cash collateral, net of rebate fees, and lending fees received is allocated to SSBT for its services as lending agent and the portion allocated to the Fund is presented as securities lending income, net on the Statement of Operations. Non-cash collateral is held by the lending agent on behalf of the Fund and cannot be sold or re-pledged by the Fund; accordingly, such collateral is not reflected in the Statement of Assets and Liabilities.
The Fund is subject to possible delay in the recovery of loaned securities. Pursuant to the securities lending agreement, SSBT has provided indemnification to the Fund in the event of default by a borrower with respect to a loan. The Fund bears the risk of loss with respect to the investment of cash collateral.
At August 31, 2021, the value of the securities loaned (all common stocks) and the value of the collateral received, which exceeded the value of the securities loaned, amounted to $296,910 and $305,644, respectively. Collateral received was comprised of U.S. government and/or agencies securities. The securities lending transactions have no contractual maturity date and each of the Fund and borrower has the option to terminate a loan at any time.
9 Investments in Affiliated Funds
At August 31, 2021, the value of the Fund’s investment in affiliated funds was $279,988, which represents 0.7% of the Fund’s net assets. Transactions in affiliated funds by the Fund for the six months ended August 31, 2021 were as follows:
| Name of affiliated fund | Value, of period |
Purchases | Sales proceeds |
Net realized gain (loss) |
Change in unrealized appreciation (depreciation) |
Value, end of period |
Dividend income |
Units, end of period |
||||||||||||||||||||||||
| Short-Term Investments |
||||||||||||||||||||||||||||||||
| Eaton Vance Cash Reserves Fund, LLC |
$ | 157,374 | $ | 3,475,289 | $ | (3,352,669 | ) | $ | (6 | ) | $ | — | $ | 279,988 | $ | 91 | 279,988 | |||||||||||||||
10 Fair Value Measurements
Under generally accepted accounting principles for fair value measurements, a three-tier hierarchy to prioritize the assumptions, referred to as inputs, is used in valuation techniques to measure fair value. The three-tier hierarchy of inputs is summarized in the three broad levels listed below.
| • | Level 1 – quoted prices in active markets for identical investments |
| • | Level 2 – other significant observable inputs (including quoted prices for similar investments, interest rates, prepayment speeds, credit risk, etc.) |
| • | Level 3 – significant unobservable inputs (including a fund’s own assumptions in determining the fair value of investments) |
In cases where the inputs used to measure fair value fall in different levels of the fair value hierarchy, the level disclosed is determined based on the lowest level input that is significant to the fair value measurement in its entirety. The inputs or methodology used for valuing securities are not necessarily an indication of the risk associated with investing in those securities.
| 17 |
Parametric
Dividend Income Fund
August 31, 2021
Notes to Financial Statements (Unaudited) — continued
At August 31, 2021, the hierarchy of inputs used in valuing the Fund’s investments, which are carried at value, were as follows:
| Asset Description | Level 1 | Level 2 | Level 3 | Total | ||||||||||||
| Common Stocks |
$ | 36,241,737 | * | $ | — | $ | — | $ | 36,241,737 | |||||||
| Short-Term Investments |
— | 279,988 | — | 279,988 | ||||||||||||
| Total Investments |
$ | 36,241,737 | $ | 279,988 | $ | — | $ | 36,521,725 | ||||||||
| * | The level classification by major category of investments is the same as the category presentation in the Portfolio of Investments. |
11 Risks and Uncertainties
Pandemic Risk
An outbreak of respiratory disease caused by a novel coronavirus was first detected in China in late 2019 and subsequently spread internationally. This coronavirus has resulted in closing borders, enhanced health screenings, changes to healthcare service preparation and delivery, quarantines, cancellations, disruptions to supply chains and customer activity, as well as general concern and uncertainty. Health crises caused by outbreaks, such as the coronavirus outbreak, may exacerbate other pre-existing political, social and economic risks and disrupt normal market conditions and operations. The impact of this outbreak has negatively affected the worldwide economy, the economies of individual countries, individual companies, and the market in general, and may continue to do so in significant and unforeseen ways, as may other epidemics and pandemics that may arise in the future. Any such impact could adversely affect the Fund’s performance, or the performance of the securities in which the Fund invests.
| 18 |
Parametric
Dividend Income Fund
August 31, 2021
Liquidity Risk Management Program
The Fund has implemented a written liquidity risk management program (Program) and related procedures to manage its liquidity in accordance with Rule 22e-4 under the Investment Company Act of 1940, as amended (Liquidity Rule). The Liquidity Rule defines “liquidity risk” as the risk that a fund could not meet requests to redeem shares issued by the fund without significant dilution of the remaining investors’ interests in the fund. The Fund’s Board of Trustees/Directors has designated the investment adviser to serve as the administrator of the Program and the related procedures. The administrator has established a Liquidity Risk Management Oversight Committee (Committee) to perform the functions necessary to administer the Program. As part of the Program, the administrator is responsible for identifying illiquid investments and categorizing the relative liquidity of the Fund’s investments in accordance with the Liquidity Rule. Under the Program, the administrator assesses, manages, and periodically reviews the Fund’s liquidity risk, and is responsible for making certain reports to the Fund’s Board of Trustees/Directors and the Securities and Exchange Commission (SEC) regarding the liquidity of the Fund’s
investments, and to notify the Board of Trustees/Directors and the SEC of certain liquidity events specified in the Liquidity Rule. The liquidity of the Fund’s portfolio investments is determined based on a number of factors including, but not limited to, relevant market, trading and investment-specific considerations under the Program.
At a meeting of the Fund’s Board of Trustees/Directors on June 8, 2021, the Committee provided a written report to the Fund’s Board of Trustees/Directors pertaining to the operation, adequacy, and effectiveness of implementation of the Program, as well as the operation of the highly liquid investment minimum (if applicable) for the period January 1, 2020 through December 31, 2020 (Review Period). The Program operated effectively during the Review Period, supporting the administrator’s ability to assess, manage and monitor Fund liquidity risk, including during periods of market volatility and net redemptions. During the Review Period, the Fund met redemption requests on a timely basis.
There can be no assurance that the Program will achieve its objectives in the future. Please refer to the Fund’s prospectus for more information regarding the Fund’s exposure to liquidity risk and other principal risks to which an investment in the Fund may be subject.
| 19 |
Parametric
Dividend Income Fund
August 31, 2021
Officers
Eric A. Stein
President
Deidre E. Walsh
Vice President and Chief Legal Officer
James F. Kirchner
Treasurer
Kimberly M. Roessiger
Secretary
Richard F. Froio
Chief Compliance Officer
Trustees
George J. Gorman
Chairperson
Thomas E. Faust Jr.*
Mark R. Fetting
Cynthia E. Frost
Valerie A. Mosley
William H. Park
Helen Frame Peters
Keith Quinton
Marcus L. Smith
Susan J. Sutherland
Scott E. Wennerholm
| * | Interested Trustee |
| 20 |
Eaton Vance Funds
| Privacy Notice | April 2021 |
| FACTS | WHAT DOES EATON VANCE DO WITH YOUR PERSONAL INFORMATION? | |
| Why? | Financial companies choose how they share your personal information. Federal law gives consumers the right to limit some but not all sharing. Federal law also requires us to tell you how we collect, share, and protect your personal information. Please read this notice carefully to understand what we do. | |
| What? | The types of personal information we collect and share depend on the product or service you have with us. This information can include:
∎ Social Security number and income ∎ investment experience and risk tolerance ∎ checking account number and wire transfer instructions | |
| How? | All financial companies need to share customers’ personal information to run their everyday business. In the section below, we list the reasons financial companies can share their customers’ personal information; the reasons Eaton Vance chooses to share; and whether you can limit this sharing. | |
| Reasons we can share your personal information |
Does Eaton Vance share? | Can you limit this sharing? | ||
| For our everyday business purposes — such as to process your transactions, maintain your account(s), respond to court orders and legal investigations, or report to credit bureaus | Yes | No | ||
| For our marketing purposes — to offer our products and services to you | Yes | No | ||
| For joint marketing with other financial companies | No | We don’t share | ||
| For our investment management affiliates’ everyday business purposes — information about your transactions, experiences, and creditworthiness | Yes | Yes | ||
| For our affiliates’ everyday business purposes — information about your transactions and experiences | Yes | No | ||
| For our affiliates’ everyday business purposes — information about your creditworthiness | No | We don’t share | ||
| For our investment management affiliates to market to you | Yes | Yes | ||
| For our affiliates to market to you | No | We don’t share | ||
| For nonaffiliates to market to you | No | We don’t share |
| To limit our sharing | Call toll-free 1-800-262-1122 or email: [email protected]
Please note:
If you are a new customer, we can begin sharing your information 30 days from the date we sent this notice. When you are no longer our customer, we continue to share your information as described in this notice. However, you can contact us at any time to limit our sharing. | |
| Questions? | Call toll-free 1-800-262-1122 or email: [email protected] | |
| 21 |
Eaton Vance Funds
| Privacy Notice — continued | April 2021 |
| Page 2 |
| Who we are | ||
| Who is providing this notice? | Eaton Vance Management, Eaton Vance Distributors, Inc., Eaton Vance Trust Company, Eaton Vance Management (International) Limited, Eaton Vance Advisers International Ltd., Eaton Vance Global Advisors Limited, Eaton Vance Management’s Real Estate Investment Group, Boston Management and Research, Calvert Research and Management, Eaton Vance and Calvert Fund Families and our investment advisory affiliates (“Eaton Vance”) (see Investment Management Affiliates definition below) | |
| What we do | ||
| How does Eaton Vance protect my personal information? | To protect your personal information from unauthorized access and use, we use security measures that comply with federal law. These measures include computer safeguards and secured files and buildings. We have policies governing the proper handling of customer information by personnel and requiring third parties that provide support to adhere to appropriate security standards with respect to such information. | |
| How does Eaton Vance collect my personal information? | We collect your personal information, for example, when you
∎ open an account or make deposits or withdrawals from your account ∎ buy securities from us or make a wire transfer ∎ give us your contact information
We also collect your personal information from others, such as credit bureaus, affiliates, or other companies. | |
| Why can’t I limit all sharing? | Federal law gives you the right to limit only
∎ sharing for affiliates’ everyday business purposes — information about your creditworthiness ∎ affiliates from using your information to market to you ∎ sharing for nonaffiliates to market to you
State laws and individual companies may give you additional rights to limit sharing. See below for more on your rights under state law. | |
| Definitions | ||
| Investment Management Affiliates | Eaton Vance Investment Management Affiliates include registered investment advisers, registered broker-dealers, and registered and unregistered funds. Investment Management Affiliates does not include entities associated with Morgan Stanley Wealth Management, such as Morgan Stanley Smith Barney LLC and Morgan Stanley & Co. | |
| Affiliates | Companies related by common ownership or control. They can be financial and nonfinancial companies.
∎ Our affiliates include companies with a Morgan Stanley name and financial companies such as Morgan Stanley Smith Barney LLC and Morgan Stanley & Co. | |
| Nonaffiliates | Companies not related by common ownership or control. They can be financial and nonfinancial companies.
∎ Eaton Vance does not share with nonaffiliates so they can market to you. | |
| Joint marketing | A formal agreement between nonaffiliated financial companies that together market financial products or services to you.
∎ Eaton Vance doesn’t jointly market. | |
| Other important information | ||
| Vermont: Except as permitted by law, we will not share personal information we collect about Vermont residents with Nonaffiliates unless you provide us with your written consent to share such information.
California: Except as permitted by law, we will not share personal information we collect about California residents with Nonaffiliates and we will limit sharing such personal information with our Affiliates to comply with California privacy laws that apply to us. | ||
| 22 |
Eaton Vance Funds
Delivery of Shareholder Documents. The Securities and Exchange Commission (SEC) permits funds to deliver only one copy of shareholder documents, including prospectuses, proxy statements and shareholder reports, to fund investors with multiple accounts at the same residential or post office box address. This practice is often called “householding” and it helps eliminate duplicate mailings to shareholders. Eaton Vance, or your financial intermediary, may household the mailing of your documents indefinitely unless you instruct Eaton Vance, or your financial intermediary, otherwise. If you would prefer that your Eaton Vance documents not be householded, please contact Eaton Vance at 1-800-260-0761, or contact your financial intermediary. Your instructions that householding not apply to delivery of your Eaton Vance documents will typically be effective within 30 days of receipt by Eaton Vance or your financial intermediary.
Portfolio Holdings. Each Eaton Vance Fund and its underlying Portfolio(s) (if applicable) files a schedule of portfolio holdings on Part F to Form N-PORT with the SEC. Certain information filed on Form N-PORT may be viewed on the Eaton Vance website at www.eatonvance.com, by calling Eaton Vance at 1-800-260-0761 or in the EDGAR database on the SEC’s website at www.sec.gov.
Proxy Voting. From time to time, funds are required to vote proxies related to the securities held by the funds. The Eaton Vance Funds or their underlying Portfolios (if applicable) vote proxies according to a set of policies and procedures approved by the Funds’ and Portfolios’ Boards. You may obtain a description of these policies and procedures and information on how the Funds or Portfolios voted proxies relating to portfolio securities during the most recent 12-month period ended June 30, without charge, upon request, by calling 1-800-260-0761 and by accessing the SEC’s website at www.sec.gov.
| 23 |
This Page Intentionally Left Blank
Investment Adviser and Administrator
Eaton Vance Management
Two International Place
Boston, MA 02110
Investment Sub-Adviser
Parametric Portfolio Associates LLC
800 Fifth Avenue, Suite 2800
Seattle, WA 98104
Principal Underwriter*
Eaton Vance Distributors, Inc.
Two International Place
Boston, MA 02110
(617) 482-8260
Custodian
State Street Bank and Trust Company
State Street Financial Center, One Lincoln Street
Boston, MA 02111
Transfer Agent
BNY Mellon Investment Servicing (US) Inc.
Attn: Eaton Vance Funds
P.O. Box 9653
Providence, RI 02940-9653
(800) 260-0761
Fund Offices
Two International Place
Boston, MA 02110
| * | FINRA BrokerCheck. Investors may check the background of their Investment Professional by contacting the Financial Industry Regulatory Authority (FINRA). FINRA BrokerCheck is a free tool to help investors check the professional background of current and former FINRA-registered securities firms and brokers. FINRA BrokerCheck is available by calling 1-800-289-9999 and at www.FINRA.org. The FINRA BrokerCheck brochure describing this program is available to investors at www.FINRA.org. |

16105 8.31.21
Item 2. Code of Ethics
Not required in this filing.
Item 3. Audit Committee Financial Expert
Not required in this filing.
Item 4. Principal Accountant Fees and Services
Not required in this filing.
Item 5. Audit Committee of Listed Registrants
Not applicable.
Item 6. Schedule of Investments
Please see schedule of investments contained in the Report to Stockholders included under Item 1 of this Form N-CSR.
Item 7. Disclosure of Proxy Voting Policies and Procedures for Closed-End Management Investment Companies
Not applicable.
Item 8. Portfolio Managers of Closed-End Management Investment Companies
Not applicable.
Item 9. Purchases of Equity Securities by Closed-End Management Investment Company and Affiliated Purchasers
Not applicable.
Item 10. Submission of Matters to a Vote of Security Holders
No material changes.
Item 11. Controls and Procedures
(a) It is the conclusion of the registrant’s principal executive officer and principal financial officer that the effectiveness of the registrant’s current disclosure controls and procedures (such disclosure controls and procedures having been evaluated within 90 days of the date of this filing) provide reasonable assurance that the information required to be disclosed by the registrant has been recorded, processed, summarized and reported within the time period specified in the Commission’s rules and forms and that the information required to be disclosed by the registrant has been accumulated and communicated to the registrant’s principal executive officer and principal financial officer in order to allow timely decisions regarding required disclosure.
(b) There have been no changes in the registrant’s internal controls over financial reporting during the period covered by this report that has materially affected, or is reasonably likely to materially affect, the registrant’s internal control over financial reporting.
Item 12. Disclosure of Securities Lending Activities for Closed-End Management Investment Companies
Not applicable.
Item 13. Exhibits
| (a)(1) | Registrant’s Code of Ethics – Not applicable (please see Item 2). | |
| (a)(2)(i) | Treasurer’s Section 302 certification. | |
| (a)(2)(ii) | President’s Section 302 certification. | |
| (b) | Combined Section 906 certification. | |
Signatures
Pursuant to the requirements of the Securities Exchange Act of 1934 and the Investment Company Act of 1940, the registrant has duly caused this report to be signed on its behalf by the undersigned, thereunto duly authorized.
Eaton Vance Mutual Funds Trust
| By: | /s/ Eric A. Stein | |
| Eric A. Stein | ||
| President |
Date:
Pursuant to the requirements of the Securities Exchange Act of 1934 and the Investment Company Act of 1940, this report has been signed below by the following persons on behalf of the registrant and in the capacities and on the dates indicated.
| By: |
/s/ James F. Kirchner | |
| James F. Kirchner | ||
| Treasurer |
Date: October 25, 2021
| By: | /s/ Eric A. Stein | |
| Eric A. Stein | ||
| President |
Date: October 25, 2021
EATON VANCE MUTUAL FUNDS TRUST
FORM N-CSR
Exhibit 13(a)(2)(i)
CERTIFICATION
I, James F. Kirchner, certify that:
1. I have reviewed this report on Form N-CSR of Eaton Vance Mutual Funds Trust;
2. Based on my knowledge, this report does not contain any untrue statement of a material fact or omit to state a material fact necessary to make the statements made, in light of the circumstances under which such statements were made, not misleading with respect to the period covered by this report;
3. Based on my knowledge, the financial statements, and other financial information included in this report, fairly present in all material respects the financial condition, results of operations, changes in net assets, and cash flows (if the financial statements are required to include a statement of cash flows) of the registrant as of, and for, the periods presented in this report;
4. The registrant’s other certifying officer(s) and I are responsible for establishing and maintaining disclosure controls and procedures (as defined in Rule 30a-3(c) under the Investment Company Act of 1940) and internal control over financial reporting (as defined in Rule 30a-3(d) under the Investment Company Act of 1940) for the registrant and have:
(a) Designed such disclosure controls and procedures, or caused such disclosure controls and procedures to be designed under our supervision, to ensure that material information relating to the registrant, including its consolidated subsidiaries, is made known to us by others within those entities, particularly during the period in which this report is being prepared;
(b) Designed such internal control over financial reporting, or caused such internal control over financial reporting to be designed under our supervision, to provide reasonable assurance regarding the reliability of financial reporting and the preparation of financial statements for external purposes in accordance with generally accepted accounting principles;
(c) Evaluated the effectiveness of the registrant’s disclosure controls and procedures and presented in this report our conclusions about the effectiveness of the disclosure controls and procedures, as of a date within 90 days prior to the filing date of this report based on such evaluation; and
(d) Disclosed in this report any change in the registrant’s internal control over financial reporting that occurred during the period covered by this report that has materially affected, or is reasonably likely to materially affect, the registrant’s internal control over financial reporting; and
5. The registrant’s other certifying officer(s) and I have disclosed to the registrant’s auditors and the audit committee of the registrant’s board of directors (or persons performing the equivalent functions):
(a) All significant deficiencies and material weaknesses in the design or operation of internal control over financial reporting which are reasonably likely to adversely affect the registrant’s ability to record, process, summarize, and report financial information; and
(b) Any fraud, whether or not material, that involves management or other employees who have a significant role in the registrant’s internal control over financial reporting.
| Date: October 25, 2021 | /s/ James F. Kirchner | |||||
| James F. Kirchner | ||||||
| Treasurer |
EATON VANCE MUTUAL FUNDS TRUST
FORM N-CSR
Exhibit 13(a)(2)(ii)
CERTIFICATION
I, Eric A. Stein, certify that:
1. I have reviewed this report on Form N-CSR of Eaton Vance Mutual Funds Trust;
2. Based on my knowledge, this report does not contain any untrue statement of a material fact or omit to state a material fact necessary to make the statements made, in light of the circumstances under which such statements were made, not misleading with respect to the period covered by this report;
3. Based on my knowledge, the financial statements, and other financial information included in this report, fairly present in all material respects the financial condition, results of operations, changes in net assets, and cash flows (if the financial statements are required to include a statement of cash flows) of the registrant as of, and for, the periods presented in this report;
4. The registrant’s other certifying officer(s) and I are responsible for establishing and maintaining disclosure controls and procedures (as defined in Rule 30a-3(c) under the Investment Company Act of 1940) and internal control over financial reporting (as defined in Rule 30a-3(d) under the Investment Company Act of 1940) for the registrant and have:
(a) Designed such disclosure controls and procedures, or caused such disclosure controls and procedures to be designed under our supervision, to ensure that material information relating to the registrant, including its consolidated subsidiaries, is made known to us by others within those entities, particularly during the period in which this report is being prepared;
(b) Designed such internal control over financial reporting, or caused such internal control over financial reporting to be designed under our supervision, to provide reasonable assurance regarding the reliability of financial reporting and the preparation of financial statements for external purposes in accordance with generally accepted accounting principles;
(c) Evaluated the effectiveness of the registrant’s disclosure controls and procedures and presented in this report our conclusions about the effectiveness of the disclosure controls and procedures, as of a date within 90 days prior to the filing date of this report based on such evaluation; and
(d) Disclosed in this report any change in the registrant’s internal control over financial reporting that occurred during the period covered by this report that has materially affected, or is reasonably likely to materially affect, the registrant’s internal control over financial reporting; and
5. The registrant’s other certifying officer(s) and I have disclosed to the registrant’s auditors and the audit committee of the registrant’s board of directors (or persons performing the equivalent functions):
(a) All significant deficiencies and material weaknesses in the design or operation of internal control over financial reporting which are reasonably likely to adversely affect the registrant’s ability to record, process, summarize, and report financial information; and
(b) Any fraud, whether or not material, that involves management or other employees who have a significant role in the registrant’s internal control over financial reporting.
| Date: October 25, 2021 | /s/ Eric A. Stein | |||||
| Eric A. Stein | ||||||
| President | ||||||
Form N-CSR Item 13(b) Exhibit
CERTIFICATION PURSUANT TO
18 U.S.C. SECTION 1350,
AS ADOPTED PURSUANT TO
SECTION 906 OF THE SARBANES-OXLEY ACT OF 2002
The undersigned hereby certify in their capacity as Treasurer and President, respectively, of Eaton Vance Mutual Funds Trust (the “Trust”) that:
| (a) | The Semiannual Report of the Trust on Form N-CSR for the period ended August 31, 2021 (the “Report”) fully complies with the requirements of Section 13(a) or 15(d) of the Securities Exchange Act of 1934, as amended; and |
| (b) | The information contained in the Report fairly presents, in all material respects, the financial condition and the results of operations of the Trust for such period. |
A signed original of this written statement required by section 906 has been provided to the Trust and will be retained by the Trust and furnished to the Securities and Exchange Commission or its staff upon request.
Eaton Vance Mutual Funds Trust
| Date: October 25, 2021 | ||
| /s/ James F. Kirchner | ||
| James F. Kirchner | ||
| Treasurer | ||
| Date: October 25, 2021 | ||
| /s/ Eric A. Stein | ||
| Eric A. Stein | ||
| President | ||
Serious News for Serious Traders! Try StreetInsider.com Premium Free!
You May Also Be Interested In
- AirBoss Announces Details for AGSM and Q1 2024 Results Timing
- Relay Resources Welcomes New Chief Revenue Officer to Leadership Team
- Sun Summit Announces Closing of $2,500,000 Private Placement
Create E-mail Alert Related Categories
SEC FilingsSign up for StreetInsider Free!
Receive full access to all new and archived articles, unlimited portfolio tracking, e-mail alerts, custom newswires and RSS feeds - and more!
