

Form N-CSR WASHINGTON MUTUAL INVEST For: Apr 30
 Tweet
Tweet Share
Share
UNITED STATES
SECURITIES AND EXCHANGE COMMISSION
Washington, D.C. 20549
FORM N-CSR
Certified Shareholder Report of
Registered Management Investment Companies
Investment Company Act File Number: 811-00604
Washington Mutual Investors Fund
(Exact Name of Registrant as Specified in Charter)
6455 Irvine Center Drive
Irvine, California 92618
(Address of Principal Executive Offices)
Registrant's telephone number, including area code: (949) 975-5000
Date of fiscal year end: April 30
Date of reporting period: April 30, 2022
Brian C. Janssen
Washington Mutual Investors Fund
6455 Irvine Center Drive
Irvine, California 92618
(Name and Address of Agent for Service)
ITEM 1 – Reports to Stockholders
|
Washington Mutual
Annual report |
 |

We seek to generate
income and find
opportunities to grow
principal through
investment in high-
quality common stocks
Washington Mutual Investors Fund seeks to produce income and to provide an opportunity for growth of principal consistent with sound common stock investing.
This fund is one of more than 40 offered by Capital Group, home of American Funds, one of the nation’s largest mutual fund families. For over 90 years, Capital Group has invested with a long-term focus based on thorough research and attention to risk.
Fund results shown in this report, unless otherwise indicated, are for Class F-2 shares. Class A share results are shown at net asset value unless otherwise indicated. If a sales charge (maximum 5.75%) had been deducted from Class A shares, the results would have been lower. Results are for past periods and are not predictive of results for future periods. Current and future results may be lower or higher than those shown. Prices and returns will vary, so investors may lose money. Investing for short periods makes losses more likely. For current information and month-end results, visit capitalgroup.com.
Here are the average annual total returns on a $1,000 investment for periods ended March 31, 2022 (the most recent calendar quarter-end):
| 1 year | 5 years | 10 years | ||||||||||
| Class F-2 shares | 16.29 | % | 13.98 | % | 13.39 | % | ||||||
| Class A shares (reflecting 5.75% maximum sales charge) | 9.41 | 12.43 | 12.51 | |||||||||
For other share class results, visit capitalgroup.com and americanfundsretirement.com.
The total annual fund operating expense ratios are 0.37% for Class F-2 shares and 0.56% for Class A shares as of the prospectus dated July 1, 2022 (unaudited).
Investment results assume all distributions are reinvested and reflect applicable fees and expenses. When applicable, investment results reflect fee waivers and/or expense reimbursements, without which results would have been lower. Visit capitalgroup.com for more information.
The fund’s 30-day yield as of April 30, 2022, was 1.50% for Class F-2 shares and 1.23% for Class A shares, calculated in accordance with the U.S. Securities and Exchange Commission formula. The Class A share result reflects the 5.75% maximum sales charge.
Refer to the fund prospectus and the Risk Factors section of this report for more information on risks associated with investing in the fund.
Investments are not FDIC-insured, nor are they deposits of or guaranteed by a bank or any other entity, so they may lose value.
Contents
| 1 | Letter to investors |
| 4 | The value of a long-term perspective |
| 6 | Investment portfolio |
| 11 | Financial statements |
| 34 | Board of trustees and other officers |
Fellow investors
For the 12 months ended April 30, 2022, Class F-2 shares of Washington Mutual Investors Fund had a total return of 5.18%, which compares to the 0.21% gain of the S&P 500 Index, the fund’s unmanaged benchmark.
Over the past fiscal year, the fund paid four regular dividends totaling 96.54 cents a share, which included a special dividend of three cents a share. The fund also paid a capital gains distribution of $2.80 per share.
We’re pleased with the fund’s lifetime average annual total return (since Class A inception on July 31, 1952) of 12.06%. By contrast, the S&P 500 — a market capitalization-weighted index based on the results of approximately 500 widely held common stocks — had a 10.96% average annual total return over that same period of time.
The economy and markets
In 2021, the U.S. stock market — as measured by the S&P 500 — reached an all-time high 70 times. This was second only to 1995 for the number of all-time market highs in a single year. In fact, a new index record was posted in each and every month of the year.
A major factor that encouraged investors to seek out higher returning assets like stocks was the posture of the Federal Reserve (Fed). The U.S. central bank kept interest rates low throughout the pandemic, pumping billions of dollars into markets each month. This helped the economy quickly get back on its feet after the initial stage of the COVID-19 pandemic. Due in part to this stimulus, the U.S. labor market saw the fastest wage level increase since 1983, and the U.S. economy experienced its largest 12-month increase in inflation
Results at a glance
For periods ended April 30, 2022, with all distributions reinvested
| Cumulative total returns |
Average annual total returns | ||||||||||||||||||||
| 1 year | 3 years | 5 years | 10 years | Lifetime (since Class A inception on 7/31/52) |
|||||||||||||||||
| Washington Mutual Investors Fund (Class F-2 shares)* | 5.18 | % | 12.16 | % | 12.38 | % | 12.62 | % | 12.06 | % | |||||||||||
| Washington Mutual Investors Fund (Class A shares) | 4.98 | 11.94 | 12.17 | 12.41 | 11.86 | ||||||||||||||||
| S&P 500 Index† | 0.21 | 13.85 | 13.66 | 13.67 | 10.96 | ||||||||||||||||
| * | Class F-2 shares were first offered on August 1, 2008. Class F-2 share results prior to the date of first sale are hypothetical based on the results of the original share class of the fund without a sales charge, adjusted for typical estimated expenses. Please see capitalgroup.com for more information on specific expense adjustments and the actual dates of first sale. |
| † | Source: S&P Dow Jones Indices LLC. S&P 500 Index is a market capitalization-weighted index based on the results of approximately 500 widely held common stocks. The index is unmanaged, and its results include reinvested dividends and/or distributions but do not reflect the effect of sales charges, commissions, account fees, expenses or U.S. federal income taxes. Investors cannot invest directly in an index. |
| Washington Mutual Investors Fund | 1 |
since June 1982. As a result, the Fed, mindful of its twin goals of encouraging employment and discouraging inflation, made a dramatic policy shift on December 15 with its announcement that it would end its monthly bond-buying program in March 2022.
The prospect of this reduction of investment in the financial system was one of the reasons the equity markets in early 2022 did not look like 2021. After the release of a “hawkish” Fed statement on January 5, the S&P 500 suffered its largest monthly pullback since the beginning of the pandemic in March 2020.
Russia’s invasion of Ukraine at the end of February added fuel to the inflation fire. Wartime sanctions on Russia’s economy put additional upward pressure on commodities for which Russia or Ukraine was a major global supplier, including natural gas, nickel, iron ore, wheat, corn, aluminum, cotton, zinc, soybeans and palladium.
The persistence of high inflation throughout 2022 — up 8.5% through March, the highest level since 1981 — braced markets for the Fed to finally normalize interest rates after more than a decade of near-zero policy rates.
As a result, equity and fixed income markets continued to struggle through April. Eight of the 11 equity sectors turned in negative results for 2022. The bright spot was energy, up 36.8% through 2022. Value stocks held up better than growth stocks during this period — in fact, the first quarter of 2022 represented value’s strongest returns relative to growth since 2000–2002.
A look at the portfolio
Sectors: At the end of the period, the fund’s results from sector positioning outpaced those of the benchmark S&P 500 Index. An overweight position in energy and an underweight position in communication services contributed to results, while the overweight position in financial services detracted.
Stocks: Eight of the fund’s top 10 holdings had a positive return for the 12-month period. Broadcom (up 24.99% during the fund’s fiscal year) edged out Microsoft (up 10.05%) to take its place as the fund’s largest holding by market value. Broadcom’s results were driven by continued strength in its semiconductor solutions and infrastructure software businesses. The acquisitions of CA and Symantec’s enterprise security business also contributed to results. Microsoft experienced strong results in 2021, driven in part by strong revenue growth from its cloud-computing platform, Azure. However, through April 2022, the company experienced a selloff along with the broader technology sector, which hampered its returns for the fund.
The fund’s third largest holding, UnitedHealth Group (up 29.26%) posted strong revenue growth in 2021, with its Optum businesses contributing to over half of the company’s 2021 earnings from operations. Pfizer (up 31.52%), another health care stock and the fund’s fifth largest holding, posted the strongest returns of the top 10 holdings, boosted by sales of its COVID-19 vaccine, which contributed more than half of the company’s total revenue in the fourth quarter of 2021. CVS (up 28.67%) posted strong 2021 results, as revenues got a boost from demand for COVID-19
| 2 | Washington Mutual Investors Fund |
vaccines and tests. Rounding out the top four health care positions, Johnson & Johnson (up 13.73%) raised its dividend for the 60th consecutive year in April, to 6.6%, or $1.13 per share.
The fund’s number four holding, Comcast (down 27.81%), was the biggest detractor of the top 10 holdings. Comcast’s decline was driven in part by slow growth in new customers for its broadband internet and Peacock streaming services.
Looking ahead
Washington Mutual Investors Fund strives to produce income and capital appreciation with low volatility over time. By investing in high-quality large-cap stocks, the fund aims to reduce the impact of declining markets, while still participating meaningfully when markets rise.
Even in a changing market, the fund’s fundamental, bottom-up investment process in which portfolio managers and analysts seek attractive investments seeks to help investors pursue their long-term financial objectives. We would like to take this opportunity to welcome our new shareholders to the fund and to thank current investors for the trust and confidence they’ve placed in Washington Mutual Investors Fund.
We look forward to reporting back to you again in six months.
Cordially,

Alan N. Berro
Co-President

Eric H. Stern
Co-President
June 8, 2022
For current information about the fund, visit capitalgroup.com.
| Washington Mutual Investors Fund | 3 |
The value of a long-term perspective
Fund results shown are for Class F-2 shares and Class A shares. Class A share results reflect deduction of the maximum sales charge of 5.75% on the $10,000 investment¹; thus, the net amount invested was $9,425.² Results are for past periods and are not predictive of results for future periods. Current and future results may be lower or higher than those shown. Prices and returns will vary, so investors may lose money. Investing for short periods makes losses more likely. For current information and month-end results, visit capitalgroup.com.
Class F-2 shares were first offered on August 1, 2008. Class F-2 share results prior to the date of first sale are hypothetical based on the results of the original share class of the fund without a sales charge, adjusted for typical estimated expenses. Please see capitalgroup.com for more information on specific expense adjustments and the actual dates of first sale.
The results shown are before taxes on fund distributions and sale of fund shares.
| 1 | As outlined in the prospectus, the sales charge is reduced for accounts (and aggregated investments) of $25,000 or more and is eliminated for purchases of $1 million or more. There is no sales charge on dividends or capital gain distributions that are reinvested in additional shares. |
| 2 | The maximum initial sales charge was 8.50% prior to July 1, 1988. |
| 3 | Assumes a $10,000 investment made in the fund on April 30, 1972. |
| 4 | Source: S&P Dow Jones Indices LLC. The market index is unmanaged and, therefore, has no expenses. Investors cannot invest directly in an index. |

| 4 | Washington Mutual Investors Fund |
How a hypothetical $10,000 investment has grown
This chart shows how a hypothetical $10,000 investment in Class F-2 and Class A shares of Washington Mutual Investors Fund grew from April 30, 1972, to April 30, 2022. As you can see, the investment grew to $2,685,324 or, $2,307,694 respectively, with all distributions reinvested.

| Washington Mutual Investors Fund | 5 |
Investment portfolio April 30, 2022
| Sector diversification | Percent of net assets |
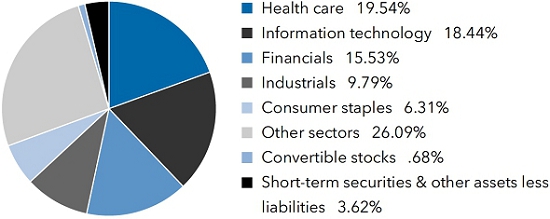
| Largest equity holdings | Percent of net assets | |||
| Broadcom | 5.99 | % | ||
| Microsoft | 5.49 | |||
| UnitedHealth Group | 4.18 | |||
| Comcast | 2.82 | |||
| Pfizer | 2.30 | |||
| Marsh & McLennan | 2.20 | |||
| CME Group | 2.07 | |||
| CVS Health | 1.98 | |||
| Johnson & Johnson | 1.84 | |||
| Home Depot | 1.76 | |||
| Common stocks 95.70% | Shares | Value (000) |
||||||
| Energy 6.02% | ||||||||
| Baker Hughes Co., Class A | 49,975,779 | $ | 1,550,249 | |||||
| Canadian Natural Resources, Ltd. | 6,731,554 | 416,481 | ||||||
| Chevron Corp. | 12,324,188 | 1,930,830 | ||||||
| ConocoPhillips | 9,980,065 | 953,296 | ||||||
| Coterra Energy, Inc. | 10,450,272 | 300,863 | ||||||
| Enbridge, Inc.1 | 7,259,624 | 316,810 | ||||||
| EOG Resources, Inc. | 10,109,580 | 1,180,395 | ||||||
| Exxon Mobil Corp. | 7,258,512 | 618,788 | ||||||
| Pioneer Natural Resources Company | 6,345,218 | 1,475,073 | ||||||
| TC Energy Corp. | 8,736,116 | 462,141 | ||||||
| Valero Energy Corp. | 1,520,968 | 169,557 | ||||||
| 9,374,483 | ||||||||
| Materials 3.24% | ||||||||
| Air Products and Chemicals, Inc. | 1,032,325 | 241,636 | ||||||
| Celanese Corp. | 545,384 | 80,139 | ||||||
| Corteva, Inc. | 2,983,433 | 172,114 | ||||||
| Dow, Inc. | 17,728,397 | 1,178,938 | ||||||
| Huntsman Corp. | 6,977,889 | 236,341 | ||||||
| Linde PLC | 1,781,104 | 555,633 | ||||||
| LyondellBasell Industries NV | 10,020,756 | 1,062,501 | ||||||
| Nucor Corp. | 4,054,883 | 627,615 | ||||||
| Rio Tinto PLC (ADR)1 | 10,258,064 | 729,554 | ||||||
| Sherwin-Williams Company | 578,735 | 159,129 | ||||||
| 5,043,600 | ||||||||
| Industrials 9.79% | ||||||||
| ABB, Ltd. (ADR) | 13,361,846 | 399,118 | ||||||
| Air Lease Corp., Class A | 2,536,657 | 102,177 | ||||||
| BAE Systems PLC (ADR) | 2,356,747 | 87,412 | ||||||
| Boeing Company2 | 571,261 | 85,026 | ||||||
| Carrier Global Corp. | 1,038,021 | 39,725 | ||||||
| Caterpillar, Inc. | 6,401,330 | 1,347,736 | ||||||
| CSX Corp. | 52,943,893 | 1,818,093 | ||||||
| Cummins, Inc. | 414,473 | 78,414 | ||||||
| HEICO Corp. | 924,170 | 130,520 | ||||||
| Honeywell International, Inc. | 4,601,839 | 890,502 | ||||||
| Johnson Controls International PLC | 1,792,989 | 107,346 | ||||||
| L3Harris Technologies, Inc. | 7,148,770 | 1,660,373 | ||||||
| Lockheed Martin Corp. | 5,195,123 | 2,244,917 | ||||||
| Norfolk Southern Corp. | 4,140,948 | 1,067,868 | ||||||
| Northrop Grumman Corp. | 4,103,056 | 1,802,883 | ||||||
| PACCAR, Inc. | 5,405,366 | 448,916 | ||||||
| Raytheon Technologies Corp. | 10,353,060 | 982,609 | ||||||
| RELX PLC (ADR)1 | 4,029,351 | 118,664 | ||||||
| Republic Services, Inc. | 2,192,184 | 294,345 | ||||||
| Rockwell Automation | 582,733 | 147,239 | ||||||
| 6 | Washington Mutual Investors Fund |
| Common stocks (continued) | Shares | Value (000) |
||||||
| Industrials (continued) | ||||||||
| Trinity Industries, Inc. | 1,810,016 | $ | 50,210 | |||||
| Union Pacific Corp. | 573,234 | 134,303 | ||||||
| United Parcel Service, Inc., Class B | 4,231,623 | 761,607 | ||||||
| Waste Connections, Inc. | 3,312,797 | 457,067 | ||||||
| 15,257,070 | ||||||||
| Consumer discretionary 6.00% | ||||||||
| Amazon.com, Inc.2 | 80,100 | 199,099 | ||||||
| Chipotle Mexican Grill, Inc.2 | 146,347 | 213,024 | ||||||
| Darden Restaurants, Inc.3 | 7,674,474 | 1,010,958 | ||||||
| Dollar General Corp. | 2,370,042 | 562,956 | ||||||
| Domino’s Pizza, Inc. | 94,657 | 31,994 | ||||||
| General Motors Company2 | 34,252,515 | 1,298,513 | ||||||
| Home Depot, Inc. | 9,138,246 | 2,745,129 | ||||||
| Marriott International, Inc., Class A2 | 809,175 | 143,645 | ||||||
| McDonald’s Corp. | 1,029,349 | 256,473 | ||||||
| NIKE, Inc., Class B | 1,059,116 | 132,072 | ||||||
| Polaris, Inc. | 860,850 | 81,729 | ||||||
| Royal Caribbean Cruises, Ltd.2 | 3,097,661 | 240,781 | ||||||
| Target Corp. | 602,257 | 137,706 | ||||||
| TJX Companies, Inc. | 6,338,706 | 388,436 | ||||||
| VF Corp. | 11,187,952 | 581,774 | ||||||
| Wynn Resorts, Ltd.2,3 | 6,500,000 | 458,120 | ||||||
| YUM! Brands, Inc. | 7,378,534 | 863,362 | ||||||
| 9,345,771 | ||||||||
| Consumer staples 6.31% | ||||||||
| Archer Daniels Midland Company | 21,193,024 | 1,898,047 | ||||||
| Church & Dwight Co., Inc. | 4,350,259 | 424,411 | ||||||
| Conagra Brands, Inc. | 12,533,884 | 437,809 | ||||||
| Costco Wholesale Corp. | 672,236 | 357,441 | ||||||
| Danone (ADR)1 | 10,937,332 | 131,904 | ||||||
| General Mills, Inc. | 5,465,407 | 386,568 | ||||||
| Hormel Foods Corp. | 9,500,000 | 497,705 | ||||||
| Keurig Dr Pepper, Inc. | 29,757,510 | 1,112,931 | ||||||
| Kimberly-Clark Corp. | 909,232 | 126,229 | ||||||
| Kraft Heinz Company | 17,323,377 | 738,496 | ||||||
| Mondelez International, Inc. | 9,214,835 | 594,173 | ||||||
| Nestlé SA (ADR) | 12,706,672 | 1,634,586 | ||||||
| Procter & Gamble Company | 3,061,488 | 491,522 | ||||||
| Reckitt Benckiser Group PLC (ADR)1 | 34,891,573 | 544,308 | ||||||
| Unilever PLC (ADR)1 | 5,240,310 | 242,417 | ||||||
| Walgreens Boots Alliance, Inc. | 4,992,567 | 211,685 | ||||||
| 9,830,232 | ||||||||
| Health care 19.54% | ||||||||
| Abbott Laboratories | 10,432,477 | 1,184,086 | ||||||
| AbbVie, Inc. | 10,016,290 | 1,471,193 | ||||||
| Anthem, Inc. | 2,457,688 | 1,233,587 | ||||||
| AstraZeneca PLC (ADR) | 23,417,181 | 1,554,901 | ||||||
| Baxter International, Inc. | 1,769,326 | 125,728 | ||||||
| Bristol-Myers Squibb Company | 5,896,452 | 443,826 | ||||||
| Cigna Corp. | 4,118,762 | 1,016,428 | ||||||
| CVS Health Corp. | 32,147,321 | 3,090,322 | ||||||
| Danaher Corp. | 3,098,837 | 778,211 | ||||||
| Edwards Lifesciences Corp.2 | 1,321,256 | 139,762 | ||||||
| Eli Lilly and Company | 6,044,929 | 1,765,905 | ||||||
| Gilead Sciences, Inc. | 15,772,188 | 935,922 | ||||||
| GlaxoSmithKline PLC (ADR)1 | 9,760,050 | 441,935 | ||||||
| Humana, Inc. | 3,248,891 | 1,444,327 | ||||||
| Johnson & Johnson | 15,861,014 | 2,862,279 | ||||||
| Molina Healthcare, Inc.2 | 504,249 | 158,057 | ||||||
| Novartis AG (ADR) | 437,683 | 38,529 | ||||||
| Novo Nordisk A/S, Class B (ADR) | 2,156,940 | 245,891 | ||||||
| Pfizer, Inc. | 72,919,722 | 3,578,171 | ||||||
| Regeneron Pharmaceuticals, Inc.2 | 414,446 | 273,166 | ||||||
| ResMed, Inc. | 410,452 | 82,078 | ||||||
| Roche Holding AG (ADR) | 2,805,141 | 129,541 | ||||||
| Washington Mutual Investors Fund | 7 |
| Common stocks (continued) | Shares | Value (000) |
||||||
| Health care (continued) | ||||||||
| Thermo Fisher Scientific, Inc. | 809,621 | $ | 447,656 | |||||
| UnitedHealth Group, Inc. | 12,796,356 | 6,507,587 | ||||||
| Zimmer Biomet Holdings, Inc. | 2,840,135 | 342,946 | ||||||
| Zoetis, Inc., Class A | 811,250 | 143,794 | ||||||
| 30,435,828 | ||||||||
| Financials 15.53% | ||||||||
| Aon PLC, Class A | 1,198,399 | 345,127 | ||||||
| Apollo Asset Management, Inc. | 7,119,491 | 354,266 | ||||||
| Bank of America Corp. | 26,088,342 | 930,832 | ||||||
| Bank of Nova Scotia1 | 5,986,608 | 379,072 | ||||||
| BlackRock, Inc. | 3,016,212 | 1,884,167 | ||||||
| Capital One Financial Corp. | 7,276,958 | 906,855 | ||||||
| Carlyle Group, Inc. | 9,191,515 | 333,560 | ||||||
| Chubb, Ltd. | 9,769,436 | 2,016,900 | ||||||
| Citigroup, Inc. | 2,995,998 | 144,437 | ||||||
| Citizens Financial Group, Inc. | 17,259,391 | 680,020 | ||||||
| CME Group, Inc., Class A | 14,681,068 | 3,220,145 | ||||||
| Discover Financial Services | 10,254,568 | 1,153,229 | ||||||
| Everest Re Group, Ltd. | 371,202 | 101,973 | ||||||
| Fifth Third Bancorp | 6,325,345 | 237,390 | ||||||
| Intercontinental Exchange, Inc. | 6,957,954 | 805,801 | ||||||
| JPMorgan Chase & Co. | 14,158,825 | 1,689,997 | ||||||
| KeyCorp | 19,837,383 | 383,060 | ||||||
| KKR & Co., Inc. | 4,738,366 | 241,515 | ||||||
| M&T Bank Corp. | 2,683,582 | 447,192 | ||||||
| Marsh & McLennan Companies, Inc. | 21,182,525 | 3,425,214 | ||||||
| Moody’s Corp. | 541,992 | 171,530 | ||||||
| Morgan Stanley | 2,762,586 | 222,637 | ||||||
| Nasdaq, Inc. | 3,155,508 | 496,582 | ||||||
| PNC Financial Services Group, Inc. | 6,736,664 | 1,118,960 | ||||||
| S&P Global, Inc. | 1,915,889 | 721,332 | ||||||
| Toronto-Dominion Bank1 | 9,575,826 | 691,758 | ||||||
| Travelers Companies, Inc. | 2,341,848 | 400,597 | ||||||
| Truist Financial Corp. | 7,805,408 | 377,391 | ||||||
| Wells Fargo & Company | 7,077,045 | 308,771 | ||||||
| 24,190,310 | ||||||||
| Information technology 18.44% | ||||||||
| Analog Devices, Inc. | 356,458 | 55,030 | ||||||
| Apple, Inc. | 11,130,940 | 1,754,793 | ||||||
| Applied Materials, Inc. | 3,895,207 | 429,836 | ||||||
| ASML Holding NV (New York registered) (ADR) | 2,257,437 | 1,272,675 | ||||||
| Automatic Data Processing, Inc. | 3,043,493 | 664,029 | ||||||
| Broadcom, Inc. | 15,751,785 | 8,732,632 | ||||||
| EPAM Systems, Inc.2 | 136,295 | 36,117 | ||||||
| Fidelity National Information Services, Inc. | 10,595,197 | 1,050,514 | ||||||
| Intel Corp. | 51,029,455 | 2,224,374 | ||||||
| KLA Corp. | 1,451,409 | 463,377 | ||||||
| Mastercard, Inc., Class A | 945,331 | 343,514 | ||||||
| Micron Technology, Inc. | 1,235,666 | 84,260 | ||||||
| Microsoft Corp. | 30,812,008 | 8,550,949 | ||||||
| Motorola Solutions, Inc. | 1,394,430 | 297,976 | ||||||
| NetApp, Inc. | 4,569,564 | 334,721 | ||||||
| Paychex, Inc. | 3,546,505 | 449,449 | ||||||
| QUALCOMM, Inc. | 1,352,705 | 188,959 | ||||||
| SAP SE (ADR) | 3,938,522 | 397,003 | ||||||
| TE Connectivity, Ltd. | 3,829,271 | 477,816 | ||||||
| Texas Instruments, Inc. | 1,406,101 | 239,389 | ||||||
| Visa, Inc., Class A1 | 3,193,649 | 680,662 | ||||||
| 28,728,075 | ||||||||
| Communication services 5.91% | ||||||||
| Activision Blizzard, Inc. | 6,241,661 | 471,870 | ||||||
| Alphabet, Inc., Class A2 | 353,074 | 805,782 | ||||||
| Alphabet, Inc., Class C2 | 645,545 | 1,484,321 | ||||||
| AT&T, Inc. | 15,978,653 | 301,357 | ||||||
| Comcast Corp., Class A | 110,271,329 | 4,384,388 | ||||||
| 8 | Washington Mutual Investors Fund |
| Common stocks (continued) | Shares | Value (000) |
||||||
| Communication services (continued) | ||||||||
| Electronic Arts, Inc. | 604,344 | $ | 71,343 | |||||
| Meta Platforms, Inc., Class A2 | 3,126,539 | 626,777 | ||||||
| Verizon Communications, Inc. | 22,779,723 | 1,054,701 | ||||||
| 9,200,539 | ||||||||
| Utilities 2.87% | ||||||||
| CMS Energy Corp. | 5,549,272 | 381,179 | ||||||
| Constellation Energy Corp. | 13,414,825 | 794,292 | ||||||
| Dominion Energy, Inc. | 1,993,138 | 162,720 | ||||||
| Edison International | 2,533,350 | 174,269 | ||||||
| Entergy Corp. | 5,586,229 | 663,923 | ||||||
| Evergy, Inc. | 4,293,467 | 291,312 | ||||||
| Exelon Corp. | 10,244,475 | 479,236 | ||||||
| NextEra Energy, Inc. | 1,967,526 | 139,734 | ||||||
| Public Service Enterprise Group, Inc. | 3,741,530 | 260,635 | ||||||
| Sempra Energy | 6,192,170 | 999,169 | ||||||
| Xcel Energy, Inc. | 1,732,477 | 126,921 | ||||||
| 4,473,390 | ||||||||
| Real estate 2.05% | ||||||||
| Alexandria Real Estate Equities, Inc. REIT | 2,999,672 | 546,420 | ||||||
| American Tower Corp. REIT | 554,901 | 133,742 | ||||||
| Boston Properties, Inc. REIT | 1,817,294 | 213,714 | ||||||
| Digital Realty Trust, Inc. REIT | 6,320,313 | 923,524 | ||||||
| Extra Space Storage, Inc. REIT | 921,438 | 175,073 | ||||||
| Mid-America Apartment Communities, Inc. REIT | 2,183,957 | 429,541 | ||||||
| Regency Centers Corp. REIT3 | 11,112,256 | 764,857 | ||||||
| 3,186,871 | ||||||||
| Total common stocks (cost: $89,060,435,000) | 149,066,169 | |||||||
| Convertible stocks 0.68% | ||||||||
| Health care 0.19% | ||||||||
| Becton, Dickinson and Company, Series B, convertible preferred shares, 6.00% 2023 | 2,963,696 | 151,475 | ||||||
| Danaher Corp., Series B, cumulative convertible preferred shares, 5.00% 20231 | 107,417 | 148,192 | ||||||
| 299,667 | ||||||||
| Financials 0.05% | ||||||||
| KKR & Co., Inc., Series C, convertible preferred shares, 6.00% 2023 | 1,185,540 | 77,724 | ||||||
| Information technology 0.38% | ||||||||
| Broadcom, Inc., Series A, cumulative convertible preferred shares, 8.00% 2022 | 341,442 | 595,646 | ||||||
| Utilities 0.06% | ||||||||
| American Electric Power Company, Inc., convertible preferred units, 6.125% 20231 | 770,698 | 43,159 | ||||||
| NextEra Energy, Inc., convertible preferred units, 5.279% 20231 | 1,131,217 | 53,065 | ||||||
| 96,224 | ||||||||
| Total convertible stocks (cost: $788,777,000) | 1,069,261 | |||||||
| Short-term securities 3.88% | ||||||||
| Money market investments 3.32% | ||||||||
| Capital Group Central Cash Fund 0.32%3,4 | 51,674,016 | 5,167,401 | ||||||
| Money market investments purchased with collateral from securities on loan 0.56% | ||||||||
| Capital Group Central Cash Fund 0.32%3,4,5 | 2,616,948 | 261,695 | ||||||
| Goldman Sachs Financial Square Government Fund, Institutional Shares 0.32%4,5 | 164,800,000 | 164,800 | ||||||
| BlackRock Liquidity Funds – FedFund, Institutional Shares 0.31%4,5 | 138,800,000 | 138,800 | ||||||
| Washington Mutual Investors Fund | 9 |
| Short-term securities (continued) | Shares | Value (000) |
||||||
| Money market investments purchased with collateral from securities on loan (continued) | ||||||||
| Invesco Short-Term Investments Trust – Government & Agency Portfolio, Institutional Class 0.35%4,5 | 109,335,985 | $ | 109,336 | |||||
| Morgan Stanley Institutional Liquidity Funds – Government Portfolio, Institutional Class 0.30%4,5 | 86,700,000 | 86,700 | ||||||
| State Street Institutional U.S. Government Money Market Fund, Premier Class 0.29%4,5 | 86,700,000 | 86,700 | ||||||
| RBC Funds Trust – U.S. Government Money Market Fund, RBC Institutional Class 1 0.21%4,5 | 15,600,000 | 15,600 | ||||||
| Fidelity Investments Money Market Government Portfolio, Class I 0.15%4,5 | 8,600,000 | 8,600 | ||||||
| 872,231 | ||||||||
| Total short-term securities (cost: $6,039,488,000) | 6,039,632 | |||||||
| Total investment securities 100.26% (cost: $95,888,700,000) | 156,175,062 | |||||||
| Other assets less liabilities (0.26)% | (410,829 | ) | ||||||
| Net assets 100.00% | $ | 155,764,233 | ||||||
Investments in affiliates3
| Value of affiliates at 5/1/2021 (000) |
Additions (000) |
Reductions (000) |
Net realized gain (loss) (000) |
Net unrealized (depreciation) appreciation (000) |
Value of affiliates at 4/30/2022 (000) |
Dividend income (000) |
||||||||||||||||||||||
| Common stocks 1.43% | ||||||||||||||||||||||||||||
| Consumer discretionary 0.94% | ||||||||||||||||||||||||||||
| Darden Restaurants, Inc. | $ | 889,293 | $ | 229,040 | $ | 1,626 | $ | 937 | $ | (106,686 | ) | $ | 1,010,958 | $ | 31,315 | |||||||||||||
| Wynn Resorts, Ltd.2 | 827,301 | 160,934 | 226,368 | 3,132 | (306,879 | ) | 458,120 | — | ||||||||||||||||||||
| 1,469,078 | ||||||||||||||||||||||||||||
| Real estate 0.49% | ||||||||||||||||||||||||||||
| Regency Centers Corp. REIT | 397,371 | 343,151 | 1,256 | 289 | 25,302 | 764,857 | 22,175 | |||||||||||||||||||||
| Total common stocks | 2,233,935 | |||||||||||||||||||||||||||
| Short-term securities 3.49% | ||||||||||||||||||||||||||||
| Money market investments 3.32% | ||||||||||||||||||||||||||||
| Capital Group Central Cash Fund 0.32%4 | 3,739,005 | 14,429,350 | 13,000,420 | (385 | ) | (149 | ) | 5,167,401 | 5,362 | |||||||||||||||||||
| Money market investments purchased with collateral from securities on loan 0.17% | ||||||||||||||||||||||||||||
| Capital Group Central Cash Fund 0.32%4,5 | 115,517 | 146,1786 | 261,695 | — | 7 | |||||||||||||||||||||||
| Total short-term securities | 5,429,096 | |||||||||||||||||||||||||||
| Total 4.92% | $ | 3,973 | $ | (388,412 | ) | $ | 7,663,031 | $ | 58,852 | |||||||||||||||||||
| 1 | All or a portion of this security was on loan. The total value of all such securities was $1,013,730,000, which represented .65% of the net assets of the fund. Refer to Note 5 for more information on securities lending. |
| 2 | Security did not produce income during the last 12 months. |
| 3 | Affiliate of the fund or part of the same “group of investment companies” as the fund, as defined under the Investment Company Act of 1940, as amended. |
| 4 | Rate represents the seven-day yield at 4/30/2022. |
| 5 | Security purchased with cash collateral from securities on loan. Refer to Note 5 for more information on securities lending. |
| 6 | Represents net activity. Refer to Note 5 for more information on securities lending. |
| 7 | Dividend income is included with securities lending income in the fund’s statement of operations and is not shown in this table. |
Key to abbreviation
ADR = American Depositary Receipts
See notes to financial statements.
| 10 | Washington Mutual Investors Fund |
Financial statements
| Statement of assets and liabilities at April 30, 2022 |
(dollars in thousands) |
| Assets: | ||||||||
| Investment securities, at value (includes $1,013,730 of investment securities on loan): | ||||||||
| Unaffiliated issuers (cost: $88,402,168) | $ | 148,512,031 | ||||||
| Affiliated issuers (cost: $7,486,532) | 7,663,031 | $ | 156,175,062 | |||||
| Cash | 5,258 | |||||||
| Receivables for: | ||||||||
| Sales of investments | 436,658 | |||||||
| Sales of fund’s shares | 129,450 | |||||||
| Dividends | 220,508 | |||||||
| Securities lending income | 412 | 787,028 | ||||||
| 156,967,348 | ||||||||
| Liabilities: | ||||||||
| Collateral for securities on loan | 872,231 | |||||||
| Payables for: | ||||||||
| Purchases of investments | 147,396 | |||||||
| Repurchases of fund’s shares | 101,242 | |||||||
| Investment advisory services | 30,206 | |||||||
| Services provided by related parties | 25,041 | |||||||
| Board members’ deferred compensation | 16,491 | |||||||
| Other | 10,508 | 330,884 | ||||||
| Net assets at April 30, 2022 | $ | 155,764,233 | ||||||
| Net assets consist of: | ||||||||
| Capital paid in on shares of beneficial interest | $ | 91,086,684 | ||||||
| Total distributable earnings | 64,677,549 | |||||||
| Net assets at April 30, 2022 | $ | 155,764,233 |
(dollars and shares in thousands, except per-share amounts)
Shares of beneficial interest issued and outstanding (no stated par value)
—
unlimited shares authorized (2,807,649 total shares outstanding)
| Net assets | Shares outstanding |
Net asset value per share |
||||||||||
| Class A | $ | 72,921,962 | 1,313,473 | $ | 55.52 | |||||||
| Class C | 1,451,797 | 26,582 | 54.62 | |||||||||
| Class T | 13 | — | * | 55.51 | ||||||||
| Class F-1 | 2,215,661 | 40,093 | 55.26 | |||||||||
| Class F-2 | 28,561,025 | 515,021 | 55.46 | |||||||||
| Class F-3 | 7,841,616 | 141,309 | 55.49 | |||||||||
| Class 529-A | 2,952,406 | 53,330 | 55.36 | |||||||||
| Class 529-C | 93,264 | 1,696 | 54.99 | |||||||||
| Class 529-E | 103,100 | 1,876 | 54.96 | |||||||||
| Class 529-T | 18 | — | * | 55.51 | ||||||||
| Class 529-F-1 | 13 | — | * | 55.17 | ||||||||
| Class 529-F-2 | 302,847 | 5,455 | 55.52 | |||||||||
| Class 529-F-3 | 14 | — | * | 55.51 | ||||||||
| Class R-1 | 68,266 | 1,246 | 54.79 | |||||||||
| Class R-2 | 700,903 | 12,859 | 54.51 | |||||||||
| Class R-2E | 95,399 | 1,729 | 55.19 | |||||||||
| Class R-3 | 1,663,350 | 30,282 | 54.93 | |||||||||
| Class R-4 | 2,737,641 | 49,637 | 55.15 | |||||||||
| Class R-5E | 485,335 | 8,759 | 55.41 | |||||||||
| Class R-5 | 814,593 | 14,679 | 55.49 | |||||||||
| Class R-6 | 32,755,010 | 589,623 | 55.55 | |||||||||
| * | Amount less than one thousand. |
See notes to financial statements.
| Washington Mutual Investors Fund | 11 |
Financial statements (continued)
| Statement of operations | |
| for the year ended April 30, 2022 | (dollars in thousands) |
| Investment income: | ||||||||
| Income: | ||||||||
| Dividends (net of non-U.S. taxes of $22,980; also includes $58,852 from affiliates) | $ | 3,461,181 | ||||||
| Securities lending income (net of fees) | 4,398 | |||||||
| Interest | 85 | $ | 3,465,664 | |||||
| Fees and expenses*: | ||||||||
| Investment advisory services | 361,004 | |||||||
| Distribution services | 241,134 | |||||||
| Transfer agent services | 89,650 | |||||||
| Administrative services | 48,289 | |||||||
| 529 plan services | 2,048 | |||||||
| Reports to shareholders | 3,670 | |||||||
| Registration statement and prospectus | 2,148 | |||||||
| Board members’ compensation | 2,252 | |||||||
| Auditing and legal | 333 | |||||||
| Custodian | 4,016 | |||||||
| Other | 321 | 754,865 | ||||||
| Net investment income | 2,710,799 | |||||||
| Net realized gain and unrealized depreciation: | ||||||||
| Net realized gain (loss) on: | ||||||||
| Investments: | ||||||||
| Unaffiliated issuers | 7,229,415 | |||||||
| Affiliated issuers | 3,973 | |||||||
| In-kind redemptions | 164,375 | |||||||
| Currency transactions | (620 | ) | 7,397,143 | |||||
| Net unrealized depreciation on: | ||||||||
| Investments: | ||||||||
| Unaffiliated issuers | (1,818,256 | ) | ||||||
| Affiliated issuers | (388,412 | ) | ||||||
| Currency translations | (152 | ) | (2,206,820 | ) | ||||
| Net realized gain and unrealized depreciation | 5,190,323 | |||||||
| Net increase in net assets resulting from operations | $ | 7,901,122 |
| * | Additional information related to class-specific fees and expenses is included in the notes to financial statements. |
| Statements of changes in net assets | |
| (dollars in thousands) |
| Year ended April 30, | ||||||||
| 2022 | 2021 | |||||||
| Operations: | ||||||||
| Net investment income | $ | 2,710,799 | $ | 2,379,075 | ||||
| Net realized gain | 7,397,143 | 7,167,746 | ||||||
| Net unrealized (depreciation) appreciation | (2,206,820 | ) | 33,647,073 | |||||
| Net increase in net assets resulting from operations | 7,901,122 | 43,193,894 | ||||||
| Distributions paid to shareholders | (10,196,964 | ) | (4,246,015 | ) | ||||
| Net capital share transactions | 5,663,065 | 199,383 | ||||||
| Total increase in net assets | 3,367,223 | 39,147,262 | ||||||
| Net assets: | ||||||||
| Beginning of year | 152,397,010 | 113,249,748 | ||||||
| End of year | $ | 155,764,233 | $ | 152,397,010 | ||||
See notes to financial statements.
| 12 | Washington Mutual Investors Fund |
Notes to financial statements
1. Organization
Washington Mutual Investors Fund (the “fund”) is registered under the Investment Company Act of 1940, as amended (the “1940 Act”), as an open-end, diversified management investment company. The fund’s investment objective is to produce income and to provide an opportunity for growth of principal consistent with sound common stock investing.
The fund has 21 share classes consisting of six retail share classes (Classes A, C, T, F-1, F-2 and F-3), seven 529 college savings plan share classes (Classes 529-A, 529-C, 529-E, 529-T, 529-F-1, 529-F-2 and 529-F-3) and eight retirement plan share classes (Classes R-1, R-2, R-2E, R-3, R-4, R-5E, R-5 and R-6). The 529 college savings plan share classes can be used to save for college education. The retirement plan share classes are generally offered only through eligible employer-sponsored retirement plans. The fund’s share classes are described further in the following table:
| Share class | Initial sales charge | Contingent deferred sales charge upon redemption |
Conversion feature | |||
| Classes A and 529-A | Up to 5.75% for Class A; up to 3.50% for Class 529-A | None (except 1.00% for certain redemptions within 18 months of purchase without an initial sales charge) | None | |||
| Classes C and 529-C | None | 1.00% for redemptions within one year of purchase | Class C converts to Class A after eight years and Class 529-C converts to Class 529-A after five years | |||
| Class 529-E | None | None | None | |||
| Classes T and 529-T* | Up to 2.50% | None | None | |||
| Classes F-1, F-2, F-3, 529-F-1, 529-F-2 and 529-F-3 | None | None | None | |||
| Classes R-1, R-2, R-2E, R-3, R-4, R-5E, R-5 and R-6 | None | None | None |
| * | Class T and 529-T shares are not available for purchase. |
Holders of all share classes have equal pro rata rights to the assets, dividends and liquidation proceeds of the fund. Each share class has identical voting rights, except for the exclusive right to vote on matters affecting only its class. Share classes have different fees and expenses (“class-specific fees and expenses”), primarily due to different arrangements for distribution, transfer agent and administrative services. Differences in class-specific fees and expenses will result in differences in net investment income and, therefore, the payment of different per-share dividends by each share class.
2. Significant accounting policies
The fund is an investment company that applies the accounting and reporting guidance issued in Topic 946 by the U.S. Financial Accounting Standards Board. The fund’s financial statements have been prepared to comply with U.S. generally accepted accounting principles (“U.S. GAAP”). These principles require the fund’s investment adviser to make estimates and assumptions that affect reported amounts and disclosures. Actual results could differ from those estimates. Subsequent events, if any, have been evaluated through the date of issuance in the preparation of the financial statements. The fund follows the significant accounting policies described in this section, as well as the valuation policies described in the next section on valuation.
Security transactions and related investment income — Security transactions are recorded by the fund as of the date the trades are executed with brokers. Realized gains and losses from security transactions are determined based on the specific identified cost of the securities. In the event a security is purchased with a delayed payment date, the fund will segregate liquid assets sufficient to meet its payment obligations. Dividend income is recognized on the ex-dividend date and interest income is recognized on an accrual basis. Market discounts, premiums and original issue discounts on fixed-income securities are amortized daily over the expected life of the security.
Class allocations — Income, fees and expenses (other than class-specific fees and expenses), realized gains and losses and unrealized appreciation and depreciation are allocated daily among the various share classes based on their relative net assets. Class-specific fees and expenses, such as distribution, transfer agent and administrative services, are charged directly to the respective share class.
Distributions paid to shareholders — Income dividends and capital gain distributions are recorded on the ex-dividend date.
| Washington Mutual Investors Fund | 13 |
In-kind redemptions — The fund normally redeems shares in cash; however, under certain conditions and circumstances, payment of the redemption price wholly or partly with portfolio securities or other fund assets may be permitted. A redemption of shares in-kind is based upon the closing value of the shares being redeemed as of the trade date. Realized gains or losses resulting from redemptions of shares in-kind are reflected separately in the fund’s statement of operations.
3. Valuation
Capital Research and Management Company (“CRMC”), the fund’s investment adviser, values the fund’s investments at fair value as defined by U.S. GAAP. The net asset value per share is calculated once daily as of the close of regular trading on the New York Stock Exchange, normally 4 p.m. New York time, each day the New York Stock Exchange is open.
Methods and inputs — The fund’s investment adviser uses the following methods and inputs to establish the fair value of the fund’s assets and liabilities. Use of particular methods and inputs may vary over time based on availability and relevance as market and economic conditions evolve.
Equity securities are generally valued at the official closing price of, or the last reported sale price on, the exchange or market on which such securities are traded, as of the close of business on the day the securities are being valued or, lacking any sales, at the last available bid price. Prices for each security are taken from the principal exchange or market on which the security trades.
Fixed income securities, including short-term securities, are generally valued at prices obtained from one or more pricing vendors. Vendors value such securities based on one or more of the following inputs: benchmark yields, transactions, bids, offers, quotations from dealers and trading systems, new issues, spreads, interest rate volatilities, and other relationships observed in the markets among comparable securities; and proprietary pricing models such as yield measures calculated using factors such as cash flows, financial or collateral performance and other reference data. When the fund’s investment adviser deems it appropriate to do so (such as when vendor prices are unavailable or deemed to be not representative), fixed-income securities will be valued in good faith at the mean quoted bid and ask prices that are reasonably and timely available (or bid prices, if ask prices are not available) or at prices for securities of comparable maturity, quality and type.
Securities with both fixed-income and equity characteristics, or equity securities traded principally among fixed-income dealers, are generally valued in the manner described for either equity or fixed-income securities, depending on which method is deemed most appropriate by the fund’s investment adviser. The Capital Group Central Cash Fund (“CCF”), a fund within the Capital Group Central Fund Series (“Central Funds”), is valued based upon a floating net asset value, which fluctuates with changes in the value of CCF’s portfolio securities. The underlying securities are valued based on the policies and procedures in CCF’s statement of additional information.
Securities and other assets for which representative market quotations are not readily available or are considered unreliable by the fund’s investment adviser are fair valued as determined in good faith under fair valuation guidelines adopted by authority of the fund’s board of trustees as further described. The investment adviser follows fair valuation guidelines, consistent with U.S. Securities and Exchange Commission rules and guidance, to consider relevant principles and factors when making fair value determinations. The investment adviser considers relevant indications of value that are reasonably and timely available to it in determining the fair value to be assigned to a particular security, such as the type and cost of the security; contractual or legal restrictions on resale of the security; relevant financial or business developments of the issuer; actively traded similar or related securities; conversion or exchange rights on the security; related corporate actions; significant events occurring after the close of trading in the security; and changes in overall market conditions. In addition, the closing prices of equity securities that trade in markets outside U.S. time zones may be adjusted to reflect significant events that occur after the close of local trading but before the net asset value of each share class of the fund is determined. Fair valuations and valuations of investments that are not actively trading involve judgment and may differ materially from valuations that would have been used had greater market activity occurred.
Processes and structure — The fund’s board of trustees has delegated authority to the fund’s investment adviser to make fair value determinations, subject to board oversight. The investment adviser has established a Joint Fair Valuation Committee (the “Fair Valuation Committee”) to administer, implement and oversee the fair valuation process, and to make fair value decisions. The Fair Valuation Committee regularly reviews its own fair value decisions, as well as decisions made under its standing instructions to the investment adviser’s valuation teams. The Fair Valuation Committee reviews changes in fair value measurements from period to period and may, as deemed appropriate, update the fair valuation guidelines to better reflect the results of back testing and address new or evolving issues. The Fair Valuation Committee reports any changes to the fair valuation guidelines to the board of trustees. The fund’s board and audit committee also regularly review reports that describe fair value determinations and methods.
| 14 | Washington Mutual Investors Fund |
The fund’s investment adviser has also established a Fixed-Income Pricing Review Group to administer and oversee the fixed-income valuation process, including the use of fixed-income pricing vendors. This group regularly reviews pricing vendor information and market data. Pricing decisions, processes and controls over security valuation are also subject to additional internal reviews facilitated by the investment adviser’s global risk management group.
Classifications — The fund’s investment adviser classifies the fund’s assets and liabilities into three levels based on the inputs used to value the assets or liabilities. Level 1 values are based on quoted prices in active markets for identical securities. Level 2 values are based on significant observable market inputs, such as quoted prices for similar securities and quoted prices in inactive markets. Certain securities trading outside the U.S. may transfer between Level 1 and Level 2 due to valuation adjustments resulting from significant market movements following the close of local trading. Level 3 values are based on significant unobservable inputs that reflect the investment adviser’s determination of assumptions that market participants might reasonably use in valuing the securities. The valuation levels are not necessarily an indication of the risk or liquidity associated with the underlying investment. For example, U.S. government securities are reflected as Level 2 because the inputs used to determine fair value may not always be quoted prices in an active market. At April 30, 2022, all of the fund’s investments were classified as Level 1.
4. Risk factors
Investing in the fund may involve certain risks including, but not limited to, those described below.
Market conditions — The prices of, and the income generated by, the common stocks and other securities held by the fund may decline –sometimes rapidly or unpredictably – due to various factors, including events or conditions affecting the general economy or particular industries; overall market changes; local, regional or global political, social or economic instability; governmental, governmental agency or central bank responses to economic conditions; and currency exchange rate, interest rate and commodity price fluctuations.
Economies and financial markets throughout the world are highly interconnected. Economic, financial or political events, trading and tariff arrangements, wars, terrorism, cybersecurity events, natural disasters, public health emergencies (such as the spread of infectious disease) and other circumstances in one country or region, including actions taken by governmental or quasi-governmental authorities in response to any of the foregoing, could have impacts on global economies or markets. As a result, whether or not the fund invests in securities of issuers located in or with significant exposure to the countries affected, the value and liquidity of the fund’s investments may be negatively affected by developments in other countries and regions.
Issuer risks — The prices of, and the income generated by, securities held by the fund may decline in response to various factors directly related to the issuers of such securities, including reduced demand for an issuer’s goods or services, poor management performance, major litigation, investigations or other controversies related to the issuer, changes in government regulations affecting the issuer or its competitive environment and strategic initiatives such as mergers, acquisitions or dispositions and the market response to any such initiatives.
Investing in income-oriented stocks — The value of the fund’s securities and income provided by the fund may be reduced by changes in the dividend policies of, and the capital resources available for dividend payments at, the companies in which the fund invests.
Investing in growth-oriented stocks — Growth-oriented common stocks and other equity-type securities (such as preferred stocks, convertible preferred stocks and convertible bonds) may involve larger price swings and greater potential for loss than other types of investments.
Management — The investment adviser to the fund actively manages the fund’s investments. Consequently, the fund is subject to the risk that the methods and analyses, including models, tools and data, employed by the investment adviser in this process may be flawed or incorrect and may not produce the desired results. This could cause the fund to lose value or its investment results to lag relevant benchmarks or other funds with similar objectives.
5. Certain investment techniques
Securities lending — The fund has entered into securities lending transactions in which the fund earns income by lending investment securities to brokers, dealers or other institutions. Each transaction involves three parties: the fund, acting as the lender of the securities, a borrower, and a lending agent that acts as an intermediary.
| Washington Mutual Investors Fund | 15 |
Securities lending transactions are entered into by the fund under a securities lending agent agreement with the lending agent. The lending agent facilitates the exchange of securities between the fund and approved borrowers, ensures that securities loans are properly coordinated and documented, marks-to-market the value of collateral daily, secures additional collateral from a borrower if it falls below preset terms, and may reinvest cash collateral on behalf of the fund according to agreed parameters. The lending agent provides indemnification to the fund against losses resulting from a borrower default. Although risk is mitigated by the collateral and indemnification, the fund could experience a delay in recovering its securities and a potential loss of income or value if a borrower fails to return securities, collateral investments decline in value or the lending agent fails to perform.
The borrower is required to post highly liquid assets, such as cash or U.S. government securities, as collateral for the loan in an amount at least equal to the value of the securities loaned. Investments made with cash collateral are recognized as assets in the fund’s investment portfolio. The same amount is recorded as a liability in the fund’s statement of assets and liabilities. While securities are on loan, the fund will continue to receive the equivalent of the interest, dividends or other distributions paid by the issuer, as well as a portion of the interest on the investment of the collateral. Additionally, although the fund does not have the right to vote on securities while they are on loan, the fund has a right to consent on corporate actions and a right to recall loaned securities to vote. A borrower is obligated to return loaned securities at the conclusion of a loan or, during the pendency of a loan, on demand from the fund.
As of April 30, 2022, the total value of securities on loan was $1,013,730,000, and the total value of collateral received was $1,036,723,000. Collateral received includes cash of $872,231,000 and U.S. government securities of $164,492,000. Investment securities purchased from cash collateral are disclosed in the fund’s investment portfolio as short-term securities. Securities received as collateral are not recognized as fund assets. The contractual maturity of cash collateral received under the securities lending agreement is classified as overnight and continuous.
Collateral — The fund receives highly liquid assets, such as cash or U.S. government securities, as collateral in exchange for lending investment securities. The purpose of the collateral is to cover potential losses that could occur in the event the borrower cannot meet its contractual obligation. The lending agent may reinvest cash collateral from securities lending transactions according to agreed parameters. Cash collateral reinvested by the lending agent, if any, is disclosed in the fund’s investment portfolio.
6. Taxation and distributions
Federal income taxation — The fund complies with the requirements under Subchapter M of the Internal Revenue Code applicable to regulated investment companies and intends to distribute substantially all of its net taxable income and net capital gains each year. The fund is not subject to income taxes to the extent such distributions are made. Therefore, no federal income tax provision is required.
As of and during the year ended April 30, 2022, the fund did not have a liability for any unrecognized tax benefits. The fund recognizes interest and penalties, if any, related to unrecognized tax benefits as income tax expense in the statement of operations. During the period, the fund did not incur any significant interest or penalties.
The fund’s tax returns are generally not subject to examination by federal, state and, if applicable, non-U.S. tax authorities after the expiration of each jurisdiction’s statute of limitations, which is typically three years after the date of filing but can be extended in certain jurisdictions.
Non-U.S. taxation — Dividend and interest income are recorded net of non-U.S. taxes paid. The fund may file withholding tax reclaims in certain jurisdictions to recover a portion of amounts previously withheld. As a result of rulings from European courts, the fund filed for additional reclaims related to prior years. These reclaims are recorded when the amount is known and there are no significant uncertainties on collectability. Gains realized by the fund on the sale of securities in certain countries, if any, may be subject to non-U.S. taxes. If applicable, the fund records an estimated deferred tax liability based on unrealized gains to provide for potential non-U.S. taxes payable upon the sale of these securities.
Distributions — Distributions determined on a tax basis may differ from net investment income and net realized gains for financial reporting purposes. These differences are due primarily to different treatment for items such as currency gains and losses; short-term capital gains and losses; capital losses related to sales of certain securities within 30 days of purchase; cost of investments sold and income on certain investments. The fiscal year in which amounts are distributed may differ from the year in which the net investment income and net realized gains are recorded by the fund for financial reporting purposes. The fund may also designate a portion of the amount paid to redeeming shareholders as a distribution for tax purposes.
During the year ended April 30, 2022, the fund reclassified $418,073,000 from total distributable earnings to capital paid in on shares of beneficial interest to align financial reporting with tax reporting.
| 16 | Washington Mutual Investors Fund |
As of April 30, 2022, the tax basis components of distributable earnings, unrealized appreciation (depreciation) and cost of investments were as follows (dollars in thousands):
| Undistributed ordinary income | $ | 436,121 | ||
| Undistributed long-term capital gains | 4,252,554 | |||
| Post-October capital loss deferral1 | (182,882 | ) | ||
| Gross unrealized appreciation on investments | 61,796,147 | |||
| Gross unrealized depreciation on investments | (1,607,757 | ) | ||
| Net unrealized appreciation on investments | 60,188,390 | |||
| Cost of investments | 95,986,672 |
1This deferral is considered incurred in the subsequent year.
Distributions paid were characterized for tax purposes as follows (dollars in thousands):
| Year ended April 30, 2022 | Year ended April 30, 2021 | |||||||||||||||||||||||
| Share class | Ordinary income |
Long-term capital gains |
Total distributions paid |
Ordinary income |
Long-term capital gains |
Total distributions paid |
||||||||||||||||||
| Class A | $ | 1,096,440 | $ | 3,581,873 | $ | 4,678,313 | $ | 1,105,484 | $ | 836,764 | $ | 1,942,248 | ||||||||||||
| Class C | 11,297 | 75,228 | 86,525 | 15,739 | 18,668 | 34,407 | ||||||||||||||||||
| Class T | — | 2 | 1 | 1 | — | 2 | — | 2 | — | 2 | ||||||||||||||
| Class F-1 | 33,447 | 117,855 | 151,302 | 43,944 | 35,031 | 78,975 | ||||||||||||||||||
| Class F-2 | 483,776 | 1,391,576 | 1,875,352 | 440,362 | 308,322 | 748,684 | ||||||||||||||||||
| Class F-3 | 136,423 | 362,698 | 499,121 | 110,289 | 72,122 | 182,411 | ||||||||||||||||||
| Class 529-A | 43,298 | 145,070 | 188,368 | 43,496 | 33,872 | 77,368 | ||||||||||||||||||
| Class 529-C | 693 | 5,161 | 5,854 | 1,405 | 1,403 | 2,808 | ||||||||||||||||||
| Class 529-E | 1,306 | 5,322 | 6,628 | 1,471 | 1,274 | 2,745 | ||||||||||||||||||
| Class 529-T | — | 2 | 1 | 1 | — | 2 | — | 2 | — | 2 | ||||||||||||||
| Class 529-F-1 | — | 2 | 1 | 1 | 2,056 | — | 2 | 2,056 | ||||||||||||||||
| Class 529-F-23 | 4,941 | 13,886 | 18,827 | 2,353 | 3,039 | 5,392 | ||||||||||||||||||
| Class 529-F-33 | — | 2 | 1 | 1 | — | 2 | — | 2 | — | 2 | ||||||||||||||
| Class R-1 | 512 | 3,676 | 4,188 | 764 | 948 | 1,712 | ||||||||||||||||||
| Class R-2 | 5,361 | 37,227 | 42,588 | 7,207 | 9,163 | 16,370 | ||||||||||||||||||
| Class R-2E | 961 | 4,778 | 5,739 | 1,273 | 1,277 | 2,550 | ||||||||||||||||||
| Class R-3 | 20,838 | 91,219 | 112,057 | 25,594 | 23,143 | 48,737 | ||||||||||||||||||
| Class R-4 | 43,977 | 153,535 | 197,512 | 54,854 | 41,750 | 96,604 | ||||||||||||||||||
| Class R-5E | 9,904 | 30,745 | 40,649 | 7,826 | 5,782 | 13,608 | ||||||||||||||||||
| Class R-5 | 16,206 | 47,495 | 63,701 | 20,804 | 13,592 | 34,396 | ||||||||||||||||||
| Class R-6 | 601,215 | 1,619,021 | 2,220,236 | 577,830 | 377,114 | 954,944 | ||||||||||||||||||
| Total | $ | 2,510,595 | $ | 7,686,369 | $ | 10,196,964 | $ | 2,462,751 | $ | 1,783,264 | $ | 4,246,015 | ||||||||||||
| 2 | Amount less than one thousand. |
| 3 | Class 529-F-2 and 529-F-3 shares began investment operations on October 30, 2020. |
7. Fees and transactions with related parties
CRMC, the fund’s investment adviser, is the parent company of American Funds Distributors®, Inc. (“AFD”), the principal underwriter of the fund’s shares, and American Funds Service Company® (“AFS”), the fund’s transfer agent. CRMC, AFD and AFS are considered related parties to the fund.
Investment advisory services — The fund has an investment advisory and service agreement with CRMC that provides for monthly fees accrued daily. These fees are based on a series of decreasing annual rates beginning with 0.342% on the first $3 billion of daily net assets and decreasing to 0.2095% on such assets in excess of $144 billion. For the year ended April 30, 2022, the investment advisory services fees were $361,004,000, which were equivalent to an annualized rate of 0.224% of average daily net assets.
| Washington Mutual Investors Fund | 17 |
Class-specific fees and expenses — Expenses that are specific to individual share classes are accrued directly to the respective share class. The principal class-specific fees and expenses are further described below:
Distribution services — The fund has plans of distribution for all share classes, except Class F-2, F-3, 529-F-2, 529-F-3, R-5E, R-5 and R-6 shares. Under the plans, the board of trustees approves certain categories of expenses that are used to finance activities primarily intended to sell fund shares and service existing accounts. The plans provide for payments, based on an annualized percentage of average daily net assets, ranging from 0.25% to 1.00% as noted in this section. In some cases, the board of trustees has limited the amounts that may be paid to less than the maximum allowed by the plans. All share classes with a plan may use up to 0.25% of average daily net assets to pay service fees, or to compensate AFD for paying service fees, to firms that have entered into agreements with AFD to provide certain shareholder services. The remaining amounts available to be paid under each plan are paid to dealers to compensate them for their sales activities.
| Share class | Currently approved limits | Plan limits | ||||||
| Class A | 0.25 | % | 0.25 | % | ||||
| Class 529-A | 0.25 | 0.50 | ||||||
| Classes C, 529-C and R-1 | 1.00 | 1.00 | ||||||
| Class R-2 | 0.75 | 1.00 | ||||||
| Class R-2E | 0.60 | 0.85 | ||||||
| Classes 529-E and R-3 | 0.50 | 0.75 | ||||||
| Classes T, F-1, 529-T, 529-F-1 and R-4 | 0.25 | 0.50 | ||||||
For Class A and 529-A shares, distribution-related expenses include the reimbursement of dealer and wholesaler commissions paid by AFD for certain shares sold without a sales charge. These share classes reimburse AFD for amounts billed within the prior 15 months but only to the extent that the overall annual expense limits are not exceeded. As of April 30, 2022, there were no unreimbursed expenses subject to reimbursement for Class A or 529-A shares.
Transfer agent services — The fund has a shareholder services agreement with AFS under which the fund compensates AFS for providing transfer agent services to each of the fund’s share classes. These services include recordkeeping, shareholder communications and transaction processing. In addition, the fund reimburses AFS for amounts paid to third parties for performing transfer agent services on behalf of fund shareholders.
Administrative services — The fund has an administrative services agreement with CRMC under which the fund compensates CRMC for providing administrative services to all share classes. Administrative services are provided by CRMC and its affiliates to help assist third parties providing non-distribution services to fund shareholders. These services include providing in-depth information on the fund and market developments that impact fund investments. Administrative services also include, but are not limited to, coordinating, monitoring and overseeing third parties that provide services to fund shareholders. The agreement provides the fund the ability to charge an administrative services fee at the annual rate of 0.05% of the average daily net assets attributable to each share class of the fund. Currently the fund pays CRMC an administrative services fee at the annual rate of 0.03% of the average daily net assets attributable to each share class of the fund for CRMC’s provision of administrative services.
529 plan services — Each 529 share class is subject to service fees to compensate the Virginia College Savings Plan (“Virginia529”) for its oversight and administration of the CollegeAmerica 529 college savings plan. The fees are based on the combined net assets invested in Class 529 and ABLE shares of the American Funds. Class ABLE shares are offered on other American Funds by Virginia529 through ABLEAmerica®, a tax-advantaged savings program for individuals with disabilities. Virginia529 is not considered a related party to the fund.
Prior to January 1, 2022, the quarterly fees were based on a series of decreasing annual rates beginning with 0.09% on the first $20 billion of the combined net assets invested in the American Funds and decreasing to 0.03% on such assets in excess of $100 billion. Effective January 1, 2022, the quarterly fees were amended to a series of decreasing annual rates beginning with 0.09% on the first $20 billion of the combined net assets invested in the American Funds and decreasing to 0.03% on such assets in excess of $75 billion. The fees for any given calendar quarter are accrued and calculated on the basis of the average net assets of Class 529 and ABLE shares of the American Funds for the last month of the prior calendar quarter. For the year ended April 30, 2022, the 529 plan services fees were $2,048,000, which were equivalent to 0.058% of the average daily net assets of each 529 share class.
| 18 | Washington Mutual Investors Fund |
For the year ended April 30, 2022, class-specific expenses under the agreements were as follows (dollars in thousands):
| Share class | Distribution services |
Transfer agent services |
Administrative services |
529 plan services |
|||||||||||
| Class A | $187,207 | $42,419 | $22,525 | Not applicable | |||||||||||
| Class C | 15,375 | 857 | 462 | Not applicable | |||||||||||
| Class T | — | — | * | — | * | Not applicable | |||||||||
| Class F-1 | 5,957 | 2,798 | 715 | Not applicable | |||||||||||
| Class F-2 | Not applicable | 31,457 | 8,736 | Not applicable | |||||||||||
| Class F-3 | Not applicable | 71 | 2,317 | Not applicable | |||||||||||
| Class 529-A | 6,984 | 1,524 | 908 | $1,752 | |||||||||||
| Class 529-C | 1,037 | 54 | 31 | 61 | |||||||||||
| Class 529-E | 544 | 29 | 33 | 63 | |||||||||||
| Class 529-T | — | — | * | — | * | — | * | ||||||||
| Class 529-F-1 | — | — | * | — | * | — | * | ||||||||
| Class 529-F-2 | Not applicable | 126 | 89 | 172 | |||||||||||
| Class 529-F-3 | Not applicable | — | * | — | * | — | * | ||||||||
| Class R-1 | 744 | 66 | 22 | Not applicable | |||||||||||
| Class R-2 | 5,646 | 2,576 | 226 | Not applicable | |||||||||||
| Class R-2E | 593 | 199 | 30 | Not applicable | |||||||||||
| Class R-3 | 9,220 | 2,730 | 553 | Not applicable | |||||||||||
| Class R-4 | 7,827 | 3,055 | 940 | Not applicable | |||||||||||
| Class R-5E | Not applicable | 897 | 177 | Not applicable | |||||||||||
| Class R-5 | Not applicable | 475 | 285 | Not applicable | |||||||||||
| Class R-6 | Not applicable | 317 | 10,240 | Not applicable | |||||||||||
| Total class-specific expenses | $241,134 | $89,650 | $48,289 | $2,048 | |||||||||||
| * | Amount less than one thousand. |
Board members’ deferred compensation — Board members who are unaffiliated with CRMC may elect to defer the cash payment of part or all of their compensation. These deferred amounts, which remain as liabilities of the fund, are treated as if invested in shares of the fund or other American Funds. These amounts represent general, unsecured liabilities of the fund and vary according to the total returns of the selected funds. Board members’ compensation of $2,252,000 in the fund’s statement of operations reflects $1,345,000 in current fees (either paid in cash or deferred) and a net increase of $907,000 in the value of the deferred amounts.
Affiliated officers and trustees — Officers and certain trustees of the fund are or may be considered to be affiliated with CRMC, AFD and AFS. No affiliated officers or trustees received any compensation directly from the fund.
Investment in CCF — The fund holds shares of CCF, an institutional prime money market fund managed by CRMC. CCF invests in high-quality, short-term money market instruments. CCF is used as the primary investment vehicle for the fund’s short-term instruments. CCF shares are only available for purchase by CRMC, its affiliates, and other funds managed by CRMC or its affiliates, and are not available to the public. CRMC does not receive an investment advisory services fee from CCF.
Security transactions with related funds — The fund purchased securities from, and sold securities to, other funds managed by CRMC (or funds managed by certain affiliates of CRMC) under procedures adopted by the fund’s board of trustees. The funds involved in such transactions are considered related by virtue of having a common investment adviser (or affiliated investment advisers), common trustees and/or common officers. Each transaction was executed at the current market price of the security and no brokerage commissions or fees were paid in accordance with Rule 17a-7 of the 1940 Act. During the year ended April 30, 2022, the fund engaged in such purchase and sale transactions with related funds in the amounts of $1,172,288,000 and $704,090,000, respectively, which generated $118,522,000 of net realized gains from such sales.
Interfund lending — Pursuant to an exemptive order issued by the SEC, the fund, along with other CRMC-managed funds (or funds managed by certain affiliates of CRMC), may participate in an interfund lending program. The program provides an alternate credit facility that permits the funds to lend or borrow cash for temporary purposes directly to or from one another, subject to the conditions of the exemptive order. The fund did not lend or borrow cash through the interfund lending program at any time during the year ended April 30, 2022.
| Washington Mutual Investors Fund | 19 |
8. Indemnifications
The fund’s organizational documents provide board members and officers with indemnification against certain liabilities or expenses in connection with the performance of their duties to the fund. In the normal course of business, the fund may also enter into contracts that provide general indemnifications. The fund’s maximum exposure under these arrangements is unknown since it is dependent on future claims that may be made against the fund. The risk of material loss from such claims is considered remote. Insurance policies are also available to the fund’s board members and officers.
9. Capital share transactions
Capital share transactions in the fund were as follows (dollars and shares in thousands):
| Sales1 | Reinvestments of distributions |
Repurchases1 | Net increase (decrease) |
|||||||||||||||||||||||||||||
| Share class | Amount | Shares | Amount | Shares | Amount | Shares | Amount | Shares | ||||||||||||||||||||||||
| Year ended April 30, 2022 | ||||||||||||||||||||||||||||||||
| Class A | $ | 5,208,694 | 90,202 | $ | 4,583,063 | 80,509 | $ | (7,251,128 | ) | (125,628 | ) | $ | 2,540,629 | 45,083 | ||||||||||||||||||
| Class C | 246,179 | 4,329 | 85,938 | 1,534 | (368,185 | ) | (6,476 | ) | (36,068 | ) | (613 | ) | ||||||||||||||||||||
| Class T | — | — | — | — | — | — | — | — | ||||||||||||||||||||||||
| Class F-1 | 200,410 | 3,481 | 149,802 | 2,646 | (525,526 | ) | (9,198 | ) | (175,314 | ) | (3,071 | ) | ||||||||||||||||||||
| Class F-2 | 7,400,525 | 128,345 | 1,838,953 | 32,337 | (7,061,099 | ) | (122,662 | ) | 2,178,379 | 38,020 | ||||||||||||||||||||||
| Class F-3 | 2,040,711 | 35,292 | 494,372 | 8,685 | (1,526,627 | ) | (26,407 | ) | 1,008,456 | 17,570 | ||||||||||||||||||||||
| Class 529-A | 334,545 | 5,794 | 188,310 | 3,317 | (411,873 | ) | (7,145 | ) | 110,982 | 1,966 | ||||||||||||||||||||||
| Class 529-C | 20,704 | 362 | 5,849 | 104 | (41,887 | ) | (729 | ) | (15,334 | ) | (263 | ) | ||||||||||||||||||||
| Class 529-E | 9,509 | 165 | 6,628 | 118 | (18,049 | ) | (315 | ) | (1,912 | ) | (32 | ) | ||||||||||||||||||||
| Class 529-T | — | — | 1 | — | 2 | — | — | 1 | — | 2 | ||||||||||||||||||||||
| Class 529-F-1 | — | — | 1 | — | 2 | — | — | 1 | — | 2 | ||||||||||||||||||||||
| Class 529-F-2 | 66,471 | 1,150 | 18,818 | 330 | (46,605 | ) | (804 | ) | 38,684 | 676 | ||||||||||||||||||||||
| Class 529-F-3 | — | — | 1 | — | 2 | — | — | 1 | — | 2 | ||||||||||||||||||||||
| Class R-1 | 11,890 | 209 | 4,133 | 74 | (21,327 | ) | (375 | ) | (5,304 | ) | (92 | ) | ||||||||||||||||||||
| Class R-2 | 137,225 | 2,416 | 42,580 | 761 | (208,128 | ) | (3,658 | ) | (28,323 | ) | (481 | ) | ||||||||||||||||||||
| Class R-2E | 23,452 | 409 | 5,739 | 102 | (30,954 | ) | (537 | ) | (1,763 | ) | (26 | ) | ||||||||||||||||||||
| Class R-3 | 283,393 | 4,947 | 111,965 | 1,990 | (616,341 | ) | (10,791 | ) | (220,983 | ) | (3,854 | ) | ||||||||||||||||||||
| Class R-4 | 334,131 | 5,803 | 197,470 | 3,495 | (1,097,098 | ) | (18,993 | ) | (565,497 | ) | (9,695 | ) | ||||||||||||||||||||
| Class R-5E | 230,806 | 3,999 | 40,648 | 716 | (320,588 | ) | (5,486 | ) | (49,134 | ) | (771 | ) | ||||||||||||||||||||
| Class R-5 | 138,618 | 2,403 | 63,434 | 1,116 | (385,166 | ) | (6,692 | ) | (183,114 | ) | (3,173 | ) | ||||||||||||||||||||
| Class R-6 | 3,352,990 | 58,371 | 2,219,321 | 38,959 | (4,503,633 | ) | (77,566 | ) | 1,068,678 | 19,764 | ||||||||||||||||||||||
| Total net increase (decrease) | $ | 20,040,253 | 347,677 | $ | 10,057,026 | 176,793 | $ | (24,434,214 | ) | (423,462 | ) | $ | 5,663,065 | 101,008 | ||||||||||||||||||
See end of table for footnotes.
| 20 | Washington Mutual Investors Fund |
| Sales1 | Reinvestments of distributions |
Repurchases1 | Net (decrease) increase |
|||||||||||||||||||||||||||||
| Share class | Amount | Shares | Amount | Shares | Amount | Shares | Amount | Shares | ||||||||||||||||||||||||
| Year ended April 30, 2021 | ||||||||||||||||||||||||||||||||
| Class A | $ | 4,357,554 | 89,283 | $ | 1,899,189 | 38,881 | $ | (7,373,423 | ) | (153,074 | ) | $ | (1,116,680 | ) | (24,910 | ) | ||||||||||||||||
| Class C | 180,821 | 3,753 | 34,125 | 710 | (620,384 | ) | (13,484 | ) | (405,438 | ) | (9,021 | ) | ||||||||||||||||||||
| Class T | — | — | — | — | — | — | — | — | ||||||||||||||||||||||||
| Class F-1 | 255,318 | 5,315 | 77,088 | 1,588 | (1,185,816 | ) | (24,304 | ) | (853,410 | ) | (17,401 | ) | ||||||||||||||||||||
| Class F-2 | 6,469,983 | 133,459 | 731,673 | 14,982 | (5,130,117 | ) | (105,320 | ) | 2,071,539 | 43,121 | ||||||||||||||||||||||
| Class F-3 | 2,301,362 | 46,641 | 180,357 | 3,685 | (1,255,294 | ) | (25,699 | ) | 1,226,425 | 24,627 | ||||||||||||||||||||||
| Class 529-A | 357,293 | 7,591 | 77,338 | 1,586 | (430,528 | ) | (9,031 | ) | 4,103 | 146 | ||||||||||||||||||||||
| Class 529-C | 18,600 | 389 | 2,807 | 59 | (164,770 | ) | (3,690 | ) | (143,363 | ) | (3,242 | ) | ||||||||||||||||||||
| Class 529-E | 8,627 | 179 | 2,744 | 57 | (21,097 | ) | (449 | ) | (9,726 | ) | (213 | ) | ||||||||||||||||||||
| Class 529-T | — | — | — | 2 | — | 2 | — | — | — | 2 | — | 2 | ||||||||||||||||||||
| Class 529-F-1 | 17,010 | 378 | 2,055 | 46 | (222,479 | ) | (5,021 | ) | (203,414 | ) | (4,597 | ) | ||||||||||||||||||||
| Class 529-F-23 | 230,358 | 5,087 | 5,389 | 107 | (21,265 | ) | (415 | ) | 214,482 | 4,779 | ||||||||||||||||||||||
| Class 529-F-33 | 10 | — | 2 | — | 2 | — | 2 | — | — | 10 | — | 2 | ||||||||||||||||||||
| Class R-1 | 8,626 | 180 | 1,696 | 35 | (23,165 | ) | (483 | ) | (12,843 | ) | (268 | ) | ||||||||||||||||||||
| Class R-2 | 131,590 | 2,748 | 16,362 | 340 | (216,530 | ) | (4,552 | ) | (68,578 | ) | (1,464 | ) | ||||||||||||||||||||
| Class R-2E | 20,396 | 423 | 2,550 | 53 | (44,946 | ) | (936 | ) | (22,000 | ) | (460 | ) | ||||||||||||||||||||
| Class R-3 | 304,592 | 6,309 | 48,687 | 1,007 | (563,277 | ) | (11,801 | ) | (209,998 | ) | (4,485 | ) | ||||||||||||||||||||
| Class R-4 | 349,012 | 7,253 | 96,563 | 1,993 | (911,486 | ) | (18,859 | ) | (465,911 | ) | (9,613 | ) | ||||||||||||||||||||
| Class R-5E | 202,026 | 4,195 | 13,607 | 278 | (93,489 | ) | (1,920 | ) | 122,144 | 2,553 | ||||||||||||||||||||||
| Class R-5 | 126,606 | 2,605 | 34,344 | 706 | (449,792 | ) | (9,219 | ) | (288,842 | ) | (5,908 | ) | ||||||||||||||||||||
| Class R-6 | 5,962,804 | 118,671 | 954,418 | 19,534 | (6,556,339 | ) | (128,148 | ) | 360,883 | 10,057 | ||||||||||||||||||||||
| Total net increase (decrease) | $ | 21,302,588 | 434,459 | $ | 4,180,992 | 85,647 | $ | (25,284,197 | ) | (516,405 | ) | $ | 199,383 | 3,701 | ||||||||||||||||||
| 1 | Includes exchanges between share classes of the fund. |
| 2 | Amount less than one thousand. |
| 3 | Class 529-F-2 and 529-F-3 shares began investment operations on October 30, 2020. |
10. Investment transactions
The fund made purchases and sales of investment securities, excluding short-term securities and U.S. government obligations, if any, of $29,379,891,000 and $32,616,592,000, respectively, during the year ended April 30, 2022.
| Washington Mutual Investors Fund | 21 |
Financial highlights
| Income (loss) from investment operations1 |
Dividends and distributions | |||||||||||||||||||||||||||||||||||||||||||||||||||
| Year ended | Net asset value, beginning of year |
Net investment income |
Net gains (losses) on securities (both realized and unrealized) |
Total from investment operations |
Dividends (from net investment income) |
Distributions (from capital gains) |
Total dividends and distributions |
Net asset value, end of year |
Total return2,3 | Net assets, end of year (in millions) |
Ratio of expenses to average net assets before reimburse- ments4 |
Ratio of expenses to average net assets after reimburse- ments3,4 |
Ratio of net income to average net assets3 |
|||||||||||||||||||||||||||||||||||||||
| Class A: | ||||||||||||||||||||||||||||||||||||||||||||||||||||
| 4/30/2022 | $ | 56.35 | $ | .92 | $ | 1.91 | $ | 2.83 | $ | (.85 | ) | $ | (2.81 | ) | $ | (3.66 | ) | $ | 55.52 | 4.98 | % | $ | 72,922 | .57 | % | .57 | % | 1.59 | % | |||||||||||||||||||||||
| 4/30/2021 | 41.94 | .83 | 15.12 | 15.95 | (.87 | ) | (.67 | ) | (1.54 | ) | 56.35 | 38.63 | 71,469 | .58 | .58 | 1.73 | ||||||||||||||||||||||||||||||||||||
| 4/30/2020 | 46.68 | .88 | (2.36 | ) | (1.48 | ) | (.88 | ) | (2.38 | ) | (3.26 | ) | 41.94 | (3.63 | ) | 54,235 | .58 | .58 | 1.93 | |||||||||||||||||||||||||||||||||
| 4/30/2019 | 45.27 | .88 | 3.86 | 4.74 | (.86 | ) | (2.47 | ) | (3.33 | ) | 46.68 | 11.26 | 59,459 | .57 | .57 | 1.96 | ||||||||||||||||||||||||||||||||||||
| 4/30/2018 | 42.89 | .88 | 4.89 | 5.77 | (.86 | ) | (2.53 | ) | (3.39 | ) | 45.27 | 13.77 | 56,052 | .57 | .57 | 1.97 | ||||||||||||||||||||||||||||||||||||
| Class C: | ||||||||||||||||||||||||||||||||||||||||||||||||||||
| 4/30/2022 | 55.48 | .48 | 1.89 | 2.37 | (.42 | ) | (2.81 | ) | (3.23 | ) | 54.62 | 4.20 | 1,452 | 1.32 | 1.32 | .84 | ||||||||||||||||||||||||||||||||||||
| 4/30/2021 | 41.33 | .47 | 14.87 | 15.34 | (.52 | ) | (.67 | ) | (1.19 | ) | 55.48 | 37.56 | 1,509 | 1.33 | 1.33 | .99 | ||||||||||||||||||||||||||||||||||||
| 4/30/2020 | 46.01 | .54 | (2.31 | ) | (1.77 | ) | (.53 | ) | (2.38 | ) | (2.91 | ) | 41.33 | (4.33 | ) | 1,497 | 1.33 | 1.33 | 1.19 | |||||||||||||||||||||||||||||||||
| 4/30/2019 | 44.66 | .52 | 3.81 | 4.33 | (.51 | ) | (2.47 | ) | (2.98 | ) | 46.01 | 10.40 | 1,742 | 1.35 | 1.35 | 1.18 | ||||||||||||||||||||||||||||||||||||
| 4/30/2018 | 42.36 | .52 | 4.81 | 5.33 | (.50 | ) | (2.53 | ) | (3.03 | ) | 44.66 | 12.85 | 1,606 | 1.37 | 1.37 | 1.18 | ||||||||||||||||||||||||||||||||||||
| Class T: | ||||||||||||||||||||||||||||||||||||||||||||||||||||
| 4/30/2022 | 56.34 | 1.06 | 1.92 | 2.98 | (1.00 | ) | (2.81 | ) | (3.81 | ) | 55.51 | 5.25 | 5 | — | 6 | .32 | 5 | .32 | 5 | 1.84 | 5 | |||||||||||||||||||||||||||||||
| 4/30/2021 | 41.93 | .95 | 15.12 | 16.07 | (.99 | ) | (.67 | ) | (1.66 | ) | 56.34 | 38.96 | 5 | — | 6 | .33 | 5 | .33 | 5 | 1.98 | 5 | |||||||||||||||||||||||||||||||
| 4/30/2020 | 46.68 | 1.00 | (2.38 | ) | (1.38 | ) | (.99 | ) | (2.38 | ) | (3.37 | ) | 41.93 | (3.39 | )5 | — | 6 | .34 | 5 | .34 | 5 | 2.18 | 5 | |||||||||||||||||||||||||||||
| 4/30/2019 | 45.27 | .98 | 3.86 | 4.84 | (.96 | ) | (2.47 | ) | (3.43 | ) | 46.68 | 11.50 | 5 | — | 6 | .36 | 5 | .36 | 5 | 2.17 | 5 | |||||||||||||||||||||||||||||||
| 4/30/2018 | 42.89 | .97 | 4.89 | 5.86 | (.95 | ) | (2.53 | ) | (3.48 | ) | 45.27 | 14.01 | 5 | — | 6 | .36 | 5 | .36 | 5 | 2.17 | 5 | |||||||||||||||||||||||||||||||
| Class F-1: | ||||||||||||||||||||||||||||||||||||||||||||||||||||
| 4/30/2022 | 56.10 | .88 | 1.90 | 2.78 | (.81 | ) | (2.81 | ) | (3.62 | ) | 55.26 | 4.91 | 2,216 | .63 | .63 | 1.52 | ||||||||||||||||||||||||||||||||||||
| 4/30/2021 | 41.76 | .80 | 15.05 | 15.85 | (.84 | ) | (.67 | ) | (1.51 | ) | 56.10 | 38.53 | 2,422 | .64 | .64 | 1.68 | ||||||||||||||||||||||||||||||||||||
| 4/30/2020 | 46.49 | .85 | (2.35 | ) | (1.50 | ) | (.85 | ) | (2.38 | ) | (3.23 | ) | 41.76 | (3.68 | ) | 2,529 | .64 | .64 | 1.88 | |||||||||||||||||||||||||||||||||
| 4/30/2019 | 45.10 | .84 | 3.84 | 4.68 | (.82 | ) | (2.47 | ) | (3.29 | ) | 46.49 | 11.17 | 2,840 | .66 | .66 | 1.88 | ||||||||||||||||||||||||||||||||||||
| 4/30/2018 | 42.74 | .84 | 4.87 | 5.71 | (.82 | ) | (2.53 | ) | (3.35 | ) | 45.10 | 13.66 | 2,771 | .67 | .67 | 1.89 | ||||||||||||||||||||||||||||||||||||
| Class F-2: | ||||||||||||||||||||||||||||||||||||||||||||||||||||
| 4/30/2022 | 56.29 | 1.03 | 1.92 | 2.95 | (.97 | ) | (2.81 | ) | (3.78 | ) | 55.46 | 5.18 | 28,561 | .37 | .37 | 1.78 | ||||||||||||||||||||||||||||||||||||
| 4/30/2021 | 41.89 | .93 | 15.11 | 16.04 | (.97 | ) | (.67 | ) | (1.64 | ) | 56.29 | 38.91 | 26,849 | .37 | .37 | 1.93 | ||||||||||||||||||||||||||||||||||||
| 4/30/2020 | 46.64 | .97 | (2.37 | ) | (1.40 | ) | (.97 | ) | (2.38 | ) | (3.35 | ) | 41.89 | (3.44 | ) | 18,175 | .39 | .39 | 2.13 | |||||||||||||||||||||||||||||||||
| 4/30/2019 | 45.24 | .96 | 3.86 | 4.82 | (.95 | ) | (2.47 | ) | (3.42 | ) | 46.64 | 11.47 | 16,882 | .38 | .38 | 2.14 | ||||||||||||||||||||||||||||||||||||
| 4/30/2018 | 42.86 | .96 | 4.89 | 5.85 | (.94 | ) | (2.53 | ) | (3.47 | ) | 45.24 | 14.00 | 11,874 | .38 | .38 | 2.15 | ||||||||||||||||||||||||||||||||||||
| Class F-3: | ||||||||||||||||||||||||||||||||||||||||||||||||||||
| 4/30/2022 | 56.32 | 1.09 | 1.92 | 3.01 | (1.03 | ) | (2.81 | ) | (3.84 | ) | 55.49 | 5.30 | 7,842 | .26 | .26 | 1.89 | ||||||||||||||||||||||||||||||||||||
| 4/30/2021 | 41.91 | .99 | 15.10 | 16.09 | (1.01 | ) | (.67 | ) | (1.68 | ) | 56.32 | 39.07 | 6,969 | .27 | .27 | 2.03 | ||||||||||||||||||||||||||||||||||||
| 4/30/2020 | 46.66 | 1.02 | (2.37 | ) | (1.35 | ) | (1.02 | ) | (2.38 | ) | (3.40 | ) | 41.91 | (3.33 | ) | 4,154 | .27 | .27 | 2.24 | |||||||||||||||||||||||||||||||||
| 4/30/2019 | 45.26 | 1.00 | 3.86 | 4.86 | (.99 | ) | (2.47 | ) | (3.46 | ) | 46.66 | 11.56 | 3,523 | .30 | .30 | 2.22 | ||||||||||||||||||||||||||||||||||||
| 4/30/2018 | 42.88 | .94 | 4.96 | 5.90 | (.99 | ) | (2.53 | ) | (3.52 | ) | 45.26 | 14.10 | 2,212 | .30 | .30 | 2.10 | ||||||||||||||||||||||||||||||||||||
| Class 529-A: | ||||||||||||||||||||||||||||||||||||||||||||||||||||
| 4/30/2022 | 56.20 | .89 | 1.91 | 2.80 | (.83 | ) | (2.81 | ) | (3.64 | ) | 55.36 | 4.94 | 2,952 | .60 | .60 | 1.55 | ||||||||||||||||||||||||||||||||||||
| 4/30/2021 | 41.83 | .81 | 15.08 | 15.89 | (.85 | ) | (.67 | ) | (1.52 | ) | 56.20 | 38.58 | 2,887 | .62 | .62 | 1.69 | ||||||||||||||||||||||||||||||||||||
| 4/30/2020 | 46.56 | .86 | (2.35 | ) | (1.49 | ) | (.86 | ) | (2.38 | ) | (3.24 | ) | 41.83 | (3.66 | ) | 2,142 | .63 | .63 | 1.89 | |||||||||||||||||||||||||||||||||
| 4/30/2019 | 45.16 | .84 | 3.85 | 4.69 | (.82 | ) | (2.47 | ) | (3.29 | ) | 46.56 | 11.18 | 2,400 | .65 | .65 | 1.88 | ||||||||||||||||||||||||||||||||||||
| 4/30/2018 | 42.80 | .84 | 4.88 | 5.72 | (.83 | ) | (2.53 | ) | (3.36 | ) | 45.16 | 13.67 | 2,270 | .65 | .65 | 1.88 | ||||||||||||||||||||||||||||||||||||
See end of table for footnotes.
| 22 | Washington Mutual Investors Fund |
Financial highlights (continued)
| Income (loss) from investment operations1 |
Dividends and distributions | |||||||||||||||||||||||||||||||||||||||||||||||||||
| Year ended | Net asset value, beginning of year |
Net investment income |
Net gains (losses) on securities (both realized and unrealized) |
Total from investment operations |
Dividends (from net investment income) |
Distributions (from capital gains) |
Total dividends and distributions |
Net asset value, end of year |
Total return2,3 | Net assets, end of year (in millions) |
Ratio of expenses to average net assets before reimburse- ments4 |
Ratio of expenses to average net assets after reimburse- ments3,4 |
Ratio of net income to average net assets3 |
|||||||||||||||||||||||||||||||||||||||
| Class 529-C: | ||||||||||||||||||||||||||||||||||||||||||||||||||||
| 4/30/2022 | $ | 55.84 | $ | .45 | $ | 1.90 | $ | 2.35 | $ | (.39 | ) | $ | (2.81 | ) | $ | (3.20 | ) | $ | 54.99 | 4.14 | % | $ | 93 | 1.36 | % | 1.36 | % | .79 | % | |||||||||||||||||||||||
| 4/30/2021 | 41.56 | .48 | 14.96 | 15.44 | (.49 | ) | (.67 | ) | (1.16 | ) | 55.84 | 37.57 | 109 | 1.35 | 1.35 | 1.02 | ||||||||||||||||||||||||||||||||||||
| 4/30/2020 | 46.25 | .53 | (2.33 | ) | (1.80 | ) | (.51 | ) | (2.38 | ) | (2.89 | ) | 41.56 | (4.38 | ) | 216 | 1.36 | 1.36 | 1.16 | |||||||||||||||||||||||||||||||||
| 4/30/2019 | 44.87 | .51 | 3.83 | 4.34 | (.49 | ) | (2.47 | ) | (2.96 | ) | 46.25 | 10.36 | 273 | 1.39 | 1.39 | 1.15 | ||||||||||||||||||||||||||||||||||||
| 4/30/2018 | 42.48 | .52 | 4.82 | 5.34 | (.42 | ) | (2.53 | ) | (2.95 | ) | 44.87 | 12.83 | 298 | 1.42 | 1.42 | 1.17 | ||||||||||||||||||||||||||||||||||||
| Class 529-E: | ||||||||||||||||||||||||||||||||||||||||||||||||||||
| 4/30/2022 | 55.82 | .75 | 1.89 | 2.64 | (.69 | ) | (2.81 | ) | (3.50 | ) | 54.96 | 4.69 | 103 | .85 | .85 | 1.31 | ||||||||||||||||||||||||||||||||||||
| 4/30/2021 | 41.56 | .70 | 14.98 | 15.68 | (.75 | ) | (.67 | ) | (1.42 | ) | 55.82 | 38.27 | 107 | .85 | .85 | 1.47 | ||||||||||||||||||||||||||||||||||||
| 4/30/2020 | 46.27 | .75 | (2.33 | ) | (1.58 | ) | (.75 | ) | (2.38 | ) | (3.13 | ) | 41.56 | (3.89 | ) | 88 | .86 | .86 | 1.66 | |||||||||||||||||||||||||||||||||
| 4/30/2019 | 44.90 | .74 | 3.82 | 4.56 | (.72 | ) | (2.47 | ) | (3.19 | ) | 46.27 | 10.91 | 105 | .89 | .89 | 1.65 | ||||||||||||||||||||||||||||||||||||
| 4/30/2018 | 42.57 | .73 | 4.85 | 5.58 | (.72 | ) | (2.53 | ) | (3.25 | ) | 44.90 | 13.40 | 103 | .89 | .89 | 1.65 | ||||||||||||||||||||||||||||||||||||
| Class 529-T: | ||||||||||||||||||||||||||||||||||||||||||||||||||||
| 4/30/2022 | 56.34 | 1.03 | 1.91 | 2.94 | (.96 | ) | (2.81 | ) | (3.77 | ) | 55.51 | 5.18 | 5 | — | 6 | .38 | 5 | .38 | 5 | 1.77 | 5 | |||||||||||||||||||||||||||||||
| 4/30/2021 | 41.93 | .93 | 15.11 | 16.04 | (.96 | ) | (.67 | ) | (1.63 | ) | 56.34 | 38.90 | 5 | — | 6 | .38 | 5 | .38 | 5 | 1.92 | 5 | |||||||||||||||||||||||||||||||
| 4/30/2020 | 46.68 | .97 | (2.37 | ) | (1.40 | ) | (.97 | ) | (2.38 | ) | (3.35 | ) | 41.93 | (3.44 | )5 | — | 6 | .38 | 5 | .38 | 5 | 2.14 | 5 | |||||||||||||||||||||||||||||
| 4/30/2019 | 45.27 | .95 | 3.86 | 4.81 | (.93 | ) | (2.47 | ) | (3.40 | ) | 46.68 | 11.44 | 5 | — | 6 | .41 | 5 | .41 | 5 | 2.12 | 5 | |||||||||||||||||||||||||||||||
| 4/30/2018 | 42.89 | .94 | 4.90 | 5.84 | (.93 | ) | (2.53 | ) | (3.46 | ) | 45.27 | 13.95 | 5 | — | 6 | .42 | 5 | .42 | 5 | 2.10 | 5 | |||||||||||||||||||||||||||||||
| Class 529-F-1: | ||||||||||||||||||||||||||||||||||||||||||||||||||||
| 4/30/2022 | 56.01 | .99 | 1.90 | 2.89 | (.92 | ) | (2.81 | ) | (3.73 | ) | 55.17 | 5.13 | 5 | — | 6 | .43 | 5 | .43 | 5 | 1.72 | 5 | |||||||||||||||||||||||||||||||
| 4/30/2021 | 41.70 | .84 | 15.10 | 15.94 | (.96 | ) | (.67 | ) | (1.63 | ) | 56.01 | 38.87 | 5 | — | 6 | .40 | 5 | .40 | 5 | 1.88 | 5 | |||||||||||||||||||||||||||||||
| 4/30/2020 | 46.44 | .96 | (2.35 | ) | (1.39 | ) | (.97 | ) | (2.38 | ) | (3.35 | ) | 41.70 | (3.45 | ) | 192 | .40 | .40 | 2.12 | |||||||||||||||||||||||||||||||||
| 4/30/2019 | 45.06 | .94 | 3.84 | 4.78 | (.93 | ) | (2.47 | ) | (3.40 | ) | 46.44 | 11.42 | 188 | .42 | .42 | 2.11 | ||||||||||||||||||||||||||||||||||||
| 4/30/2018 | 42.71 | .94 | 4.87 | 5.81 | (.93 | ) | (2.53 | ) | (3.46 | ) | 45.06 | 13.93 | 146 | .42 | .42 | 2.10 | ||||||||||||||||||||||||||||||||||||
| Class 529-F-2: | ||||||||||||||||||||||||||||||||||||||||||||||||||||
| 4/30/2022 | 56.34 | 1.04 | 1.92 | 2.96 | (.97 | ) | (2.81 | ) | (3.78 | ) | 55.52 | 5.19 | 303 | .36 | .36 | 1.79 | ||||||||||||||||||||||||||||||||||||
| 4/30/20217,8 | 44.47 | .50 | 12.55 | 13.05 | (.51 | ) | (.67 | ) | (1.18 | ) | 56.34 | 29.66 | 9 | 269 | .38 | 10 | .38 | 10 | 1.95 | 10 | ||||||||||||||||||||||||||||||||
| Class 529-F-3: | ||||||||||||||||||||||||||||||||||||||||||||||||||||
| 4/30/2022 | 56.34 | 1.06 | 1.92 | 2.98 | (1.00 | ) | (2.81 | ) | (3.81 | ) | 55.51 | 5.25 | — | 6 | .32 | .32 | 1.84 | |||||||||||||||||||||||||||||||||||
| 4/30/20217,8 | 44.47 | .51 | 12.55 | 13.06 | (.52 | ) | (.67 | ) | (1.19 | ) | 56.34 | 29.69 | 9 | — | 6 | .43 | 10 | .32 | 10 | 2.01 | 10 | |||||||||||||||||||||||||||||||
| Class R-1: | ||||||||||||||||||||||||||||||||||||||||||||||||||||
| 4/30/2022 | 55.64 | .46 | 1.90 | 2.36 | (.40 | ) | (2.81 | ) | (3.21 | ) | 54.79 | 4.18 | 68 | 1.35 | 1.35 | .80 | ||||||||||||||||||||||||||||||||||||
| 4/30/2021 | 41.45 | .46 | 14.92 | 15.38 | (.52 | ) | (.67 | ) | (1.19 | ) | 55.64 | 37.53 | 75 | 1.35 | 1.35 | .96 | ||||||||||||||||||||||||||||||||||||
| 4/30/2020 | 46.13 | .52 | (2.31 | ) | (1.79 | ) | (.51 | ) | (2.38 | ) | (2.89 | ) | 41.45 | (4.37 | ) | 67 | 1.37 | 1.37 | 1.15 | |||||||||||||||||||||||||||||||||
| 4/30/2019 | 44.76 | .51 | 3.82 | 4.33 | (.49 | ) | (2.47 | ) | (2.96 | ) | 46.13 | 10.37 | 88 | 1.39 | 1.39 | 1.14 | ||||||||||||||||||||||||||||||||||||
| 4/30/2018 | 42.45 | .51 | 4.82 | 5.33 | (.49 | ) | (2.53 | ) | (3.02 | ) | 44.76 | 12.82 | 92 | 1.39 | 1.39 | 1.15 | ||||||||||||||||||||||||||||||||||||
See end of table for footnotes.
| Washington Mutual Investors Fund | 23 |
Financial highlights (continued)
| Income (loss) from investment operations1 |
Dividends and distributions | |||||||||||||||||||||||||||||||||||||||||||||||||||
| Year ended | Net asset value, beginning of year |
Net investment income |
Net gains (losses) on securities (both realized and unrealized) |
Total from investment operations |
Dividends (from net investment income) |
Distributions (from capital gains) |
Total dividends and distributions |
Net asset value, end of year |
Total return2,3 | Net assets, end of year (in millions) |
Ratio of expenses to average net assets before reimburse- ments4 |
Ratio of expenses to average net assets after reimburse- ments3,4 |
Ratio of net income to average net assets3 |
|||||||||||||||||||||||||||||||||||||||
| Class R-2: | ||||||||||||||||||||||||||||||||||||||||||||||||||||
| 4/30/2022 | $ | 55.38 | $ | .45 | $ | 1.89 | $ | 2.34 | $ | (.40 | ) | $ | (2.81 | ) | $ | (3.21 | ) | $ | 54.51 | 4.15 | % | $ | 701 | 1.35 | % | 1.35 | % | .80 | % | |||||||||||||||||||||||
| 4/30/2021 | 41.26 | .45 | 14.85 | 15.30 | (.51 | ) | (.67 | ) | (1.18 | ) | 55.38 | 37.54 | 739 | 1.37 | 1.37 | .94 | ||||||||||||||||||||||||||||||||||||
| 4/30/2020 | 45.94 | .52 | (2.31 | ) | (1.79 | ) | (.51 | ) | (2.38 | ) | (2.89 | ) | 41.26 | (4.37 | ) | 611 | 1.37 | 1.37 | 1.15 | |||||||||||||||||||||||||||||||||
| 4/30/2019 | 44.60 | .51 | 3.80 | 4.31 | (.50 | ) | (2.47 | ) | (2.97 | ) | 45.94 | 10.37 | 712 | 1.39 | 1.39 | 1.14 | ||||||||||||||||||||||||||||||||||||
| 4/30/2018 | 42.31 | .51 | 4.81 | 5.32 | (.50 | ) | (2.53 | ) | (3.03 | ) | 44.60 | 12.82 | 713 | 1.39 | 1.39 | 1.15 | ||||||||||||||||||||||||||||||||||||
| Class R-2E: | ||||||||||||||||||||||||||||||||||||||||||||||||||||
| 4/30/2022 | 56.03 | .63 | 1.90 | 2.53 | (.56 | ) | (2.81 | ) | (3.37 | ) | 55.19 | 4.47 | 95 | 1.06 | 1.06 | 1.09 | ||||||||||||||||||||||||||||||||||||
| 4/30/2021 | 41.72 | .59 | 15.03 | 15.62 | (.64 | ) | (.67 | ) | (1.31 | ) | 56.03 | 37.92 | 98 | 1.08 | 1.08 | 1.24 | ||||||||||||||||||||||||||||||||||||
| 4/30/2020 | 46.43 | .66 | (2.34 | ) | (1.68 | ) | (.65 | ) | (2.38 | ) | (3.03 | ) | 41.72 | (4.09 | ) | 92 | 1.07 | 1.07 | 1.45 | |||||||||||||||||||||||||||||||||
| 4/30/2019 | 45.05 | .64 | 3.85 | 4.49 | (.64 | ) | (2.47 | ) | (3.11 | ) | 46.43 | 10.69 | 94 | 1.09 | 1.09 | 1.43 | ||||||||||||||||||||||||||||||||||||
| 4/30/2018 | 42.71 | .62 | 4.89 | 5.51 | (.64 | ) | (2.53 | ) | (3.17 | ) | 45.05 | 13.19 | 62 | 1.09 | 1.09 | 1.39 | ||||||||||||||||||||||||||||||||||||
| Class R-3: | ||||||||||||||||||||||||||||||||||||||||||||||||||||
| 4/30/2022 | 55.78 | .71 | 1.90 | 2.61 | (.65 | ) | (2.81 | ) | (3.46 | ) | 54.93 | 4.64 | 1,663 | .91 | .91 | 1.24 | ||||||||||||||||||||||||||||||||||||
| 4/30/2021 | 41.54 | .66 | 14.96 | 15.62 | (.71 | ) | (.67 | ) | (1.38 | ) | 55.78 | 38.13 | 1,904 | .92 | .92 | 1.39 | ||||||||||||||||||||||||||||||||||||
| 4/30/2020 | 46.24 | .72 | (2.32 | ) | (1.60 | ) | (.72 | ) | (2.38 | ) | (3.10 | ) | 41.54 | (3.94 | ) | 1,604 | .92 | .92 | 1.60 | |||||||||||||||||||||||||||||||||
| 4/30/2019 | 44.87 | .71 | 3.82 | 4.53 | (.69 | ) | (2.47 | ) | (3.16 | ) | 46.24 | 10.86 | 1,968 | .94 | .94 | 1.59 | ||||||||||||||||||||||||||||||||||||
| 4/30/2018 | 42.54 | .71 | 4.84 | 5.55 | (.69 | ) | (2.53 | ) | (3.22 | ) | 44.87 | 13.34 | 1,965 | .94 | .94 | 1.59 | ||||||||||||||||||||||||||||||||||||
| Class R-4: | ||||||||||||||||||||||||||||||||||||||||||||||||||||
| 4/30/2022 | 55.99 | .89 | 1.90 | 2.79 | (.82 | ) | (2.81 | ) | (3.63 | ) | 55.15 | 4.94 | 2,738 | .61 | .61 | 1.54 | ||||||||||||||||||||||||||||||||||||
| 4/30/2021 | 41.68 | .81 | 15.02 | 15.83 | (.85 | ) | (.67 | ) | (1.52 | ) | 55.99 | 38.57 | 3,322 | .62 | .62 | 1.69 | ||||||||||||||||||||||||||||||||||||
| 4/30/2020 | 46.41 | .86 | (2.35 | ) | (1.49 | ) | (.86 | ) | (2.38 | ) | (3.24 | ) | 41.68 | (3.67 | ) | 2,874 | .62 | .62 | 1.90 | |||||||||||||||||||||||||||||||||
| 4/30/2019 | 45.03 | .85 | 3.83 | 4.68 | (.83 | ) | (2.47 | ) | (3.30 | ) | 46.41 | 11.19 | 3,542 | .64 | .64 | 1.89 | ||||||||||||||||||||||||||||||||||||
| 4/30/2018 | 42.68 | .84 | 4.87 | 5.71 | (.83 | ) | (2.53 | ) | (3.36 | ) | 45.03 | 13.70 | 2,954 | .64 | .64 | 1.89 | ||||||||||||||||||||||||||||||||||||
| Class R-5E: | ||||||||||||||||||||||||||||||||||||||||||||||||||||
| 4/30/2022 | 56.25 | 1.00 | 1.91 | 2.91 | (.94 | ) | (2.81 | ) | (3.75 | ) | 55.41 | 5.14 | 485 | .41 | .41 | 1.74 | ||||||||||||||||||||||||||||||||||||
| 4/30/2021 | 41.86 | .92 | 15.09 | 16.01 | (.95 | ) | (.67 | ) | (1.62 | ) | 56.25 | 38.88 | 536 | .41 | .41 | 1.89 | ||||||||||||||||||||||||||||||||||||
| 4/30/2020 | 46.61 | .95 | (2.35 | ) | (1.40 | ) | (.97 | ) | (2.38 | ) | (3.35 | ) | 41.86 | (3.45 | ) | 292 | .41 | .41 | 2.11 | |||||||||||||||||||||||||||||||||
| 4/30/2019 | 45.23 | .94 | 3.85 | 4.79 | (.94 | ) | (2.47 | ) | (3.41 | ) | 46.61 | 11.41 | 120 | .43 | .43 | 2.11 | ||||||||||||||||||||||||||||||||||||
| 4/30/2018 | 42.86 | .85 | 4.98 | 5.83 | (.93 | ) | (2.53 | ) | (3.46 | ) | 45.23 | 13.93 | 12 | .43 | .43 | 1.88 | ||||||||||||||||||||||||||||||||||||
| Class R-5: | ||||||||||||||||||||||||||||||||||||||||||||||||||||
| 4/30/2022 | 56.32 | 1.06 | 1.92 | 2.98 | (1.00 | ) | (2.81 | ) | (3.81 | ) | 55.49 | 5.25 | 815 | .31 | .31 | 1.84 | ||||||||||||||||||||||||||||||||||||
| 4/30/2021 | 41.91 | .96 | 15.11 | 16.07 | (.99 | ) | (.67 | ) | (1.66 | ) | 56.32 | 39.00 | 1,005 | .32 | .32 | 2.00 | ||||||||||||||||||||||||||||||||||||
| 4/30/2020 | 46.66 | 1.01 | (2.38 | ) | (1.37 | ) | (1.00 | ) | (2.38 | ) | (3.38 | ) | 41.91 | (3.38 | ) | 996 | .32 | .32 | 2.20 | |||||||||||||||||||||||||||||||||
| 4/30/2019 | 45.25 | .99 | 3.85 | 4.84 | (.96 | ) | (2.47 | ) | (3.43 | ) | 46.66 | 11.53 | 1,378 | .34 | .34 | 2.20 | ||||||||||||||||||||||||||||||||||||
| 4/30/2018 | 42.87 | .98 | 4.89 | 5.87 | (.96 | ) | (2.53 | ) | (3.49 | ) | 45.25 | 14.04 | 2,078 | .34 | .34 | 2.20 | ||||||||||||||||||||||||||||||||||||
| Class R-6: | ||||||||||||||||||||||||||||||||||||||||||||||||||||
| 4/30/2022 | 56.38 | 1.09 | 1.92 | 3.01 | (1.03 | ) | (2.81 | ) | (3.84 | ) | 55.55 | 5.30 | 32,755 | .26 | .26 | 1.89 | ||||||||||||||||||||||||||||||||||||
| 4/30/2021 | 41.96 | .99 | 15.12 | 16.11 | (1.02 | ) | (.67 | ) | (1.69 | ) | 56.38 | 39.04 | 32,128 | .27 | .27 | 2.04 | ||||||||||||||||||||||||||||||||||||
| 4/30/2020 | 46.71 | 1.03 | (2.37 | ) | (1.34 | ) | (1.03 | ) | (2.38 | ) | (3.41 | ) | 41.96 | (3.32 | ) | 23,486 | .27 | .27 | 2.25 | |||||||||||||||||||||||||||||||||
| 4/30/2019 | 45.29 | 1.01 | 3.87 | 4.88 | (.99 | ) | (2.47 | ) | (3.46 | ) | 46.71 | 11.60 | 21,782 | .29 | .29 | 2.23 | ||||||||||||||||||||||||||||||||||||
| 4/30/2018 | 42.91 | .99 | 4.90 | 5.89 | (.98 | ) | (2.53 | ) | (3.51 | ) | 45.29 | 14.09 | 16,371 | .29 | .29 | 2.22 | ||||||||||||||||||||||||||||||||||||
| Year ended April 30, | ||||||||||||||||||||
| 2022 | 2021 | 2020 | 2019 | 2018 | ||||||||||||||||
| Portfolio turnover rate for all share classes11 | 19 | % | 24 | % | 30 | % | 25 | % | 25 | % | ||||||||||
See end of table for footnotes.
| 24 | Washington Mutual Investors Fund |
Financial highlights (continued)
| 1 | Based on average shares outstanding. | |
| 2 | Total returns exclude any applicable sales charges, including contingent deferred sales charges. | |
| 3 | This column reflects the impact, if any, of certain reimbursements from CRMC. During one of the years shown, CRMC reimbursed a portion of transfer agent services fees for Class 529-F-3. | |
| 4 | Ratios do not include expenses of any Central Funds. The fund indirectly bears its proportionate share of the expenses of any Central Funds. | |
| 5 | All or a significant portion of assets in this class consisted of seed capital invested by CRMC and/or its affiliates. Fees for distribution services are not charged or accrued on these seed capital assets. If such fees were paid by the fund on seed capital assets, fund expenses would have been higher and net income and total return would have been lower. | |
| 6 | Amount less than $1 million. | |
| 7 | Based on operations for a period that is less than a full year. | |
| 8 | Class 529-F-2 and 529-F-3 shares began investment operations on October 30, 2020. | |
| 9 | Not annualized. | |
| 10 | Annualized. | |
| 11 | Rates do not include the fund’s portfolio activity with respect to any Central Funds. |
See notes to financial statements.
| Washington Mutual Investors Fund | 25 |
Report of Independent Registered Public Accounting Firm
To the Board of Trustees and Shareholders of Washington Mutual Investors Fund
Opinion on the Financial Statements
We have audited the accompanying statement of assets and liabilities, including the investment portfolio, of Washington Mutual Investors Fund (the “Fund”) as of April 30, 2022, the related statement of operations for the year ended April 30, 2022, the statements of changes in net assets for each of the two years in the period ended April 30, 2022, including the related notes, and the financial highlights for each of the periods indicated therein (collectively referred to as the “financial statements”). In our opinion, the financial statements present fairly, in all material respects, the financial position of the Fund as of April 30, 2022, the results of its operations for the year then ended, the changes in its net assets for each of the two years in the period ended April 30, 2022 and the financial highlights for each of the periods indicated therein in conformity with accounting principles generally accepted in the United States of America.
Basis for Opinion
These financial statements are the responsibility of the Fund’s management. Our responsibility is to express an opinion on the Fund’s financial statements based on our audits. We are a public accounting firm registered with the Public Company Accounting Oversight Board (United States) (PCAOB) and are required to be independent with respect to the Fund in accordance with the U.S. federal securities laws and the applicable rules and regulations of the Securities and Exchange Commission and the PCAOB.
We conducted our audits of these financial statements in accordance with the standards of the PCAOB. Those standards require that we plan and perform the audit to obtain reasonable assurance about whether the financial statements are free of material misstatement, whether due to error or fraud.
Our audits included performing procedures to assess the risks of material misstatement of the financial statements, whether due to error or fraud, and performing procedures that respond to those risks. Such procedures included examining, on a test basis, evidence regarding the amounts and disclosures in the financial statements. Our audits also included evaluating the accounting principles used and significant estimates made by management, as well as evaluating the overall presentation of the financial statements. Our procedures included confirmation of securities owned as of April 30, 2022 by correspondence with the custodian, transfer agent and brokers; when replies were not received from brokers, we performed other auditing procedures. We believe that our audits provide a reasonable basis for our opinion.
/s/ PricewaterhouseCoopers LLP
Los Angeles, California
June 9, 2022
We have served as the auditor of one or more investment companies in The Capital Group Companies Investment Company Complex since 1934.
| 26 | Washington Mutual Investors Fund |
| Expense example | unaudited |
As a fund shareholder, you incur two types of costs: (1) transaction costs, such as initial sales charges on purchase payments and contingent deferred sales charges on redemptions (loads), and (2) ongoing costs, including management fees, distribution and service (12b-1) fees, and other expenses. This example is intended to help you understand your ongoing costs (in dollars) of investing in the fund so you can compare these costs with the ongoing costs of investing in other mutual funds. The example is based on an investment of $1,000 invested at the beginning of the period and held for the entire six-month period (November 1, 2021, through April 30, 2022).
Actual expenses:
The first line of each share class in the table on the following page provides information about actual account values and actual expenses. You may use the information in this line, together with the amount you invested, to estimate the expenses that you paid over the period. Simply divide your account value by $1,000 (for example, an $8,600 account value divided by $1,000 = 8.6), then multiply the result by the number in the first line under the heading titled “Expenses paid during period” to estimate the expenses you paid on your account during this period.
Hypothetical example for comparison purposes:
The second line of each share class in the table on the following page provides information about hypothetical account values and hypothetical expenses based on the actual expense ratio for the share class and an assumed rate of return of 5.00% per year before expenses, which is not the actual return of the share class. The hypothetical account values and expenses may not be used to estimate the actual ending account balance or expenses you paid for the period. You may use this information to compare the ongoing costs of investing in the fund and other funds. To do so, compare this 5.00% hypothetical example with the 5.00% hypothetical examples that appear in the shareholder reports of the other funds.
Notes:
Retirement plan participants may be subject to certain fees charged by the plan sponsor, and Class F-1, F-2, F-3, 529-F-1, 529-F-2 and 529-F-3 shareholders may be subject to fees charged by financial intermediaries, typically ranging from 0.75% to 1.50% of assets annually depending on services offered. You can estimate the impact of these fees by adding the amount of the fees to the total estimated expenses you paid on your account during the period as calculated above. In addition, your ending account value would be lower by the amount of these fees.
Note that the expenses shown in the table on the following page are meant to highlight your ongoing costs only and do not reflect any transactional costs, such as sales charges (loads). Therefore, the second line of each share class in the table is useful in comparing ongoing costs only and will not help you determine the relative total costs of owning different funds. In addition, if these transactional costs were included, your costs would have been higher.
| Washington Mutual Investors Fund | 27 |
Expense example (continued)
| Beginning account value 11/1/2021 |
Ending account value 4/30/2022 |
Expenses paid during period* |
Annualized expense ratio |
|||||||||||||
| Class A – actual return | $ | 1,000.00 | $ | 965.44 | $ | 2.73 | .56 | % | ||||||||
| Class A – assumed 5% return | 1,000.00 | 1,022.02 | 2.81 | .56 | ||||||||||||
| Class C – actual return | 1,000.00 | 961.79 | 6.37 | 1.31 | ||||||||||||
| Class C – assumed 5% return | 1,000.00 | 1,018.30 | 6.56 | 1.31 | ||||||||||||
| Class T – actual return | 1,000.00 | 966.54 | 1.51 | .31 | ||||||||||||
| Class T – assumed 5% return | 1,000.00 | 1,023.26 | 1.56 | .31 | ||||||||||||
| Class F-1 – actual return | 1,000.00 | 964.95 | 3.07 | .63 | ||||||||||||
| Class F-1 – assumed 5% return | 1,000.00 | 1,021.67 | 3.16 | .63 | ||||||||||||
| Class F-2 – actual return | 1,000.00 | 966.22 | 1.80 | .37 | ||||||||||||
| Class F-2 – assumed 5% return | 1,000.00 | 1,022.96 | 1.86 | .37 | ||||||||||||
| Class F-3 – actual return | 1,000.00 | 966.86 | 1.27 | .26 | ||||||||||||
| Class F-3 – assumed 5% return | 1,000.00 | 1,023.51 | 1.30 | .26 | ||||||||||||
| Class 529-A – actual return | 1,000.00 | 965.20 | 2.87 | .59 | ||||||||||||
| Class 529-A – assumed 5% return | 1,000.00 | 1,021.87 | 2.96 | .59 | ||||||||||||
| Class 529-C – actual return | 1,000.00 | 961.50 | 6.61 | 1.36 | ||||||||||||
| Class 529-C – assumed 5% return | 1,000.00 | 1,018.05 | 6.80 | 1.36 | ||||||||||||
| Class 529-E – actual return | 1,000.00 | 964.00 | 4.09 | .84 | ||||||||||||
| Class 529-E – assumed 5% return | 1,000.00 | 1,020.63 | 4.21 | .84 | ||||||||||||
| Class 529-T – actual return | 1,000.00 | 966.15 | 1.80 | .37 | ||||||||||||
| Class 529-T – assumed 5% return | 1,000.00 | 1,022.96 | 1.86 | .37 | ||||||||||||
| Class 529-F-1 – actual return | 1,000.00 | 965.92 | 2.10 | .43 | ||||||||||||
| Class 529-F-1 – assumed 5% return | 1,000.00 | 1,022.66 | 2.16 | .43 | ||||||||||||
| Class 529-F-2 – actual return | 1,000.00 | 966.26 | 1.71 | .35 | ||||||||||||
| Class 529-F-2 – assumed 5% return | 1,000.00 | 1,023.06 | 1.76 | .35 | ||||||||||||
| Class 529-F-3 – actual return | 1,000.00 | 966.65 | 1.51 | .31 | ||||||||||||
| Class 529-F-3 – assumed 5% return | 1,000.00 | 1,023.26 | 1.56 | .31 | ||||||||||||
| Class R-1 – actual return | 1,000.00 | 961.62 | 6.52 | 1.34 | ||||||||||||
| Class R-1 – assumed 5% return | 1,000.00 | 1,018.15 | 6.71 | 1.34 | ||||||||||||
| Class R-2 – actual return | 1,000.00 | 961.49 | 6.61 | 1.36 | ||||||||||||
| Class R-2 – assumed 5% return | 1,000.00 | 1,018.05 | 6.80 | 1.36 | ||||||||||||
| Class R-2E – actual return | 1,000.00 | 963.01 | 5.16 | 1.06 | ||||||||||||
| Class R-2E – assumed 5% return | 1,000.00 | 1,019.54 | 5.31 | 1.06 | ||||||||||||
| Class R-3 – actual return | 1,000.00 | 963.69 | 4.43 | .91 | ||||||||||||
| Class R-3 – assumed 5% return | 1,000.00 | 1,020.28 | 4.56 | .91 | ||||||||||||
| Class R-4 – actual return | 1,000.00 | 965.13 | 2.97 | .61 | ||||||||||||
| Class R-4 – assumed 5% return | 1,000.00 | 1,021.77 | 3.06 | .61 | ||||||||||||
| Class R-5E – actual return | 1,000.00 | 966.02 | 2.05 | .42 | ||||||||||||
| Class R-5E – assumed 5% return | 1,000.00 | 1,022.71 | 2.11 | .42 | ||||||||||||
| Class R-5 – actual return | 1,000.00 | 966.58 | 1.51 | .31 | ||||||||||||
| Class R-5 – assumed 5% return | 1,000.00 | 1,023.26 | 1.56 | .31 | ||||||||||||
| Class R-6 – actual return | 1,000.00 | 966.74 | 1.27 | .26 | ||||||||||||
| Class R-6 – assumed 5% return | 1,000.00 | 1,023.51 | 1.30 | .26 | ||||||||||||
| * | The “expenses paid during period” are equal to the “annualized expense ratio,” multiplied by the average account value over the period, multiplied by the number of days in the period, and divided by 365 (to reflect the one-half year period). |
| 28 | Washington Mutual Investors Fund |
| Tax information | unaudited |
We are required to advise you of the federal tax status of certain distributions received by shareholders during the fiscal year. The fund hereby designates the following amounts for the fund’s fiscal year ended April 30, 2022:
| Long-term capital gains | $7,940,022,000 | |
| Qualified dividend income | 100% | |
| Corporate dividends received deduction | 100% | |
| U.S. government income that may be exempt from state taxation | $1,793,000 |
Individual shareholders should refer to their Form 1099 or other tax information, which will be mailed in January 2023, to determine the calendar year amounts to be included on their 2022 tax returns. Shareholders should consult their tax advisors.
| Washington Mutual Investors Fund | 29 |
| Liquidity Risk Management Program | unaudited |
The fund has adopted a liquidity risk management program (the “program”). The fund’s board has designated Capital Research and Management Company (“CRMC”) as the administrator of the program. Personnel of CRMC or its affiliates conduct the day-to-day operation of the program pursuant to policies and procedures administered by the Capital Group Liquidity Risk Management Committee.
Under the program, CRMC manages the fund’s liquidity risk, which is the risk that the fund could not meet shareholder redemption requests without significant dilution of remaining shareholders’ interests in the fund. This risk is managed by monitoring the degree of liquidity of the fund’s investments, limiting the amount of the fund’s illiquid investments, and utilizing various risk management tools and facilities available to the fund for meeting shareholder redemptions, among other means. CRMC’s process of determining the degree of liquidity of the fund’s investments is supported by one or more third-party liquidity assessment vendors.
The fund’s board reviewed a report prepared by CRMC regarding the operation and effectiveness of the program for the period October 1, 2020, through September 30, 2021. No significant liquidity events impacting the fund were noted in the report. In addition, CRMC provided its assessment that the program had been effective in managing the fund’s liquidity risk.
| 30 | Washington Mutual Investors Fund |
This page was intentionally left blank.
| Washington Mutual Investors Fund | 31 |
This page was intentionally left blank.
| 32 | Washington Mutual Investors Fund |
This page was intentionally left blank.
| Washington Mutual Investors Fund | 33 |
Board of trustees and other officers
| Independent trustees1 | ||||||||
| Name and year of birth | Year first elected a trustee of the fund2 |
Principal occupation(s) during past five years | Number of portfolios in fund complex overseen by trustee3 |
Other directorships4 held by trustee | ||||
| Gina F. Adams, 1958 | 2019 | Senior Vice President, Government and Regulatory Affairs, FedEx Corporation (transportation/logistics company) | 1 | None | ||||
| Charles E. Andrews, 1952 | 2013 | Business advisor and corporate board member; former Board Member and Advisor, MorganFranklin Consulting (business consulting and technology solutions); former CEO, MorganFranklin Consulting | 1 | Marriott Vacations Worldwide Corporation; NVR, Inc.; Trustar Bank | ||||
| Nariman Farvardin, 1956 Chair of the Board (Independent and Non-Executive) |
2007 | President, Stevens Institute of Technology | 91 | None | ||||
| Mary Davis Holt, 1950 | 2010 | Principal, Mary Davis Holt Enterprises, LLC (leadership development consulting); former Partner, Flynn Heath Holt Leadership, LLC (leadership consulting); former COO,Time Life Inc. (1993–2003) | 87 | None | ||||
| Donald L. Nickles, 1948 | 2007 | Chairman and CEO, The Nickles Group (consulting and business venture); former United States Senator (Oklahoma) (1981–2005) | 1 | Valero Energy Corporation | ||||
| John Knox Singleton, 1948 | 2001 | Partner, Sunflower Investment Group LLC; former President and CEO, INOVA Health System | 1 | Healthcare Realty Trust, Inc. | ||||
| Margaret Spellings, 1957 | 2015 | President and CEO, Texas 2036; former President, Margaret Spellings & Company (public policy and strategic consulting); former President, The University of North Carolina; former President, George W. Bush Presidential Center | 91 | None | ||||
| Interested trustees5,6 | ||||||||
| Name, year of birth and position with fund | Year first elected a trustee or officer of the fund2 |
Principal occupation(s) during past five years and positions held with affiliated entities or the principal underwriter of the fund |
Number of portfolios in fund complex overseen by trustee3 |
Other directorships4 held by trustee | ||||
| Alan N. Berro, 1960 Co-President and Trustee |
2012 | Partner — Capital World Investors, Capital Research and Management Company; Partner — Capital World Investors, Capital Bank and Trust Company7; Director, The Capital Group Companies, Inc. | 1 | None | ||||
| Eric H. Stern, 1964 Co-President and Trustee |
2014 | Partner — Capital International Investors, Capital Research and Management Company; Partner — Capital International Investors, Capital Bank and Trust Company7 | 1 | None | ||||
The fund’s statement of additional information includes further details about fund trustees and is available without charge upon request by calling American Funds Service Company at (800) 421-4225 or by visiting the Capital Group website at capitalgroup.com. The address for all trustees and officers of the fund is 6455 Irvine Center Drive, Irvine, CA 92618, Attention: Secretary.
| 34 | Washington Mutual Investors Fund |
| Other officers6 | ||||
| Name, year of birth and position with fund |
Year first elected an officer of the fund2 |
Principal occupation(s) during past five years and positions held with affiliated entities or the principal underwriter of the fund | ||
| Michael W. Stockton, 1967 Principal Executive Officer and Executive Vice President |
1995 | Senior Vice President — Fund Business Management Group, Capital Research and Management Company | ||
| Mark L. Casey, 1970 Senior Vice President |
2019 | Partner — Capital International Investors, Capital Research and Management Company | ||
| Brady L. Enright, 1967 Senior Vice President |
2019 | Partner — Capital World Investors, Capital Research and Management Company; Partner — Capital World Investors, Capital Bank and Trust Company7 | ||
| Irfan M. Furniturewala, 1971 Senior Vice President |
2020 | Partner — Capital International Investors, Capital Research and Management Company | ||
| Jeffrey T. Lager, 1968 Senior Vice President |
2013 | Partner — Capital International Investors, Capital Research and Management Company | ||
| Jin Lee, 1969 Senior Vice President |
2019 | Partner — Capital World Investors, Capital Research and Management Company | ||
| Diana Wagner, 1973 Senior Vice President |
2015 | Partner — Capital World Investors, Capital Research and Management Company; Director, The Capital Group Companies, Inc. | ||
| Alan J. Wilson, 1961 Senior Vice President |
2019 | Partner — Capital World Investors, Capital Research and Management Company; Director, Capital Research and Management Company | ||
| Donald H. Rolfe, 1972 Vice President |
2013 | Senior Vice President and Senior Counsel — Fund Business Management Group, Capital Research and Management Company; Secretary, Capital Research and Management Company | ||
| Jennifer L. Butler, 1966 Secretary |
2005 | Assistant Vice President — Fund Business Management Group, Capital Research and Management Company | ||
| Brian C. Janssen, 1972 Treasurer |
2016 | Senior Vice President — Investment Operations, Capital Research and Management Company | ||
| Sandra Chuon, 1972 Assistant Treasurer |
2019 | Vice President — Investment Operations, Capital Research and Management Company | ||
| W. Michael Pattie, 1981 Assistant Treasurer |
2020 | Assistant Vice President — Investment Operations, Capital Research and Management Company |
| 1 | The term independent trustee refers to a trustee who is not an “interested person” of the fund within the meaning of the Investment Company Act of 1940. |
| 2 | Trustees and officers of the fund serve until their resignation, removal or retirement. |
| 3 | Funds managed by Capital Research and Management Company or its affiliates. |
| 4 | This includes all directorships/trusteeships (other than those in the American Funds or other funds managed by Capital Research and Management Company or its affiliates) that are held by each trustee as a trustee or director of a public company or a registered investment company. |
| 5 | The term interested trustee refers to a trustee who is an “interested person” within the meaning of the Investment Company Act of 1940, on the basis of their affiliation with the fund’s investment adviser, Capital Research and Management Company, or affiliated entities (including the fund’s principal underwriter). |
| 6 | All of the trustees and/or officers listed are officers and/or directors/trustees of one or more of the other funds for which Capital Research and Management Company serves as investment adviser. |
| 7 | Company affiliated with Capital Research and Management Company. |
| Washington Mutual Investors Fund | 35 |
Office of the fund
6455 Irvine Center Drive
Irvine, CA 92618-4518
Investment adviser
Capital Research and Management Company
333 South Hope Street
Los Angeles, CA 90071-1406
Transfer agent for shareholder accounts
American Funds Service Company
(Write to the address nearest you.)
P.O. Box 6007
Indianapolis, IN 46206-6007
P.O. Box 2280
Norfolk, VA 23501-2280
Custodian of assets
JPMorgan Chase Bank
270 Park Avenue
New York, NY 10017-2070
Counsel
Dechert LLP
650 Town Center Drive, Suite 700
Costa Mesa, CA 92626-7122
Independent registered public accounting firm
PricewaterhouseCoopers LLP
601 South Figueroa Street
Los Angeles, CA 90017-3874
Principal underwriter
American Funds Distributors, Inc.
333 South Hope Street
Los Angeles, CA 90071-1406
| 36 | Washington Mutual Investors Fund |
Investors should carefully consider investment objectives, risks, charges and expenses. This and other important information is contained in the fund prospectus and summary prospectus, which can be obtained from your financial professional and should be read carefully before investing. You may also call American Funds Service Company (AFS) at (800) 421-4225 or visit the Capital Group website at capitalgroup.com.
“American Funds Proxy Voting Procedures and Principles” — which describes how we vote proxies relating to portfolio securities — is available on our website or upon request by calling AFS. The fund files its proxy voting record with the U.S. Securities and Exchange Commission (SEC) for the 12 months ended June 30 by August 31. The proxy voting record is available free of charge on the SEC website at sec.gov and on our website.
Washington Mutual Investors Fund files a complete list of its portfolio holdings with the SEC for the first and third quarters of each fiscal year on Form NPORT-P. The list of portfolio holdings is available free of charge on the SEC website and on our website.
This report is for the information of shareholders of Washington Mutual Investors Fund, but it also may be used as sales literature when preceded or accompanied by the current prospectus or summary prospectus, which gives details about charges, expenses, investment objectives and operating policies of the fund. If used as sales material after June 30, 2022, this report must be accompanied by an American Funds statistical update for the most recently completed calendar quarter.
The S&P 500 Index (“Index”) is a product of S&P Dow Jones Indices LLC and/or its affiliates and has been licensed for use by Capital Group. Copyright © 2022 S&P Dow Jones Indices LLC, a division of S&P Global, and/or its affiliates. All rights reserved. Redistribution or reproduction in whole or in part are prohibited without written permission of S&P Dow Jones Indices LLC.
American Funds Distributors, Inc., member FINRA.
The Capital Advantage®
Since 1931, Capital Group, home of American Funds, has helped investors pursue long-term investment success. Our consistent approach — in combination with The Capital SystemSM — has resulted in superior outcomes.
| Aligned with investor success | |
| We base our decisions on a long-term perspective, which we believe aligns our goals with the interests of our clients. Our portfolio managers average 27 years of investment industry experience, including 21 years at our company, reflecting a career commitment to our long-term approach.1 | |
| The Capital System | |
| The Capital System combines individual accountability with teamwork. Funds using The Capital System are divided into portions that are managed independently by investment professionals with diverse backgrounds, ages and investment approaches. An extensive global research effort is the backbone of our system. | |
| American Funds’ superior outcomes | |
| Equity funds have beaten their Lipper peer indexes in 90% of 10-year periods and 99% of 20-year periods.2 Fixed income funds have helped investors achieve diversification through attention to correlation between bonds and equities.3 Fund management fees have been among the lowest in the industry.4 |
| 1 | Investment industry experience as of December 31, 2021. | |
| 2 | Based on Class F-2 share results for rolling calendar-year periods starting the first full calendar year after each fund’s inception through December 31, 2021. Periods covered are the shorter of the fund’s lifetime or since the comparable Lipper index inception date (except Capital Income Builder and SMALLCAP World Fund, for which the Lipper average was used). Expenses differ for each share class, so results will vary. | |
| 3 | Based on Class F-2 share results as of December 31, 2021. Thirteen of the 17 fixed income American Funds that have been in existence for the three-year period showed a three-year correlation below 0.3. S&P 500 Index was used as an equity market proxy. Correlation based on monthly total returns. Correlation is a statistical measure of how two securities move in relation to each other. A correlation ranges from –1 to 1. A positive correlation close to 1 implies that as one security moves, either up or down, the other security will move in “lockstep,” in the same direction. A negative correlation close to –1 indicates that the securities have moved in the opposite direction. | |
| 4 | On average, our management fees were in the lowest quintile 63% of the time, based on the 20-year period ended December 31, 2021, versus comparable Lipper categories, excluding funds of funds. |
Class F-2 shares were first offered on August 1, 2008. Class F-2 share results prior to the date of first sale are hypothetical based on the results of the original share class of the fund without a sales charge, adjusted for typical estimated expenses. Results for certain funds with an inception date after August 1, 2008, also include hypothetical returns because those funds’ Class F-2 shares sold after the funds’ date of first offering. Visit capitalgroup.com for more information on specific expense adjustments and the actual dates of first sale.
All Capital Group trademarks mentioned are owned by The Capital Group Companies, Inc., an affiliated company or fund. All other company and product names mentioned are the property of their respective companies.

ITEM 2 – Code of Ethics
The Registrant has adopted a Code of Ethics that applies to its Principal Executive Officer and Principal Financial Officer. The Registrant undertakes to provide to any person without charge, upon request, a copy of the Code of Ethics. Such request can be made by calling 800/421-4225 or to the Secretary of the Registrant, 6455 Irvine Center Drive, Irvine, California 92618.
ITEM 3 – Audit Committee Financial Expert
The Registrant’s board has determined that Charles E. Andrews, a member of the Registrant’s audit committee, is an “audit committee financial expert” and "independent," as such terms are defined in this Item. This designation will not increase the designee’s duties, obligations or liability as compared to his or her duties, obligations and liability as a member of the audit committee and of the board, nor will it reduce the responsibility of the other audit committee members. There may be other individuals who, through education or experience, would qualify as "audit committee financial experts" if the board had designated them as such. Most importantly, the board believes each member of the audit committee contributes significantly to the effective oversight of the Registrant’s financial statements and condition.
ITEM 4 – Principal Accountant Fees and Services
| WMIF | ||
Registrant:
|
||
| a) Audit Fees: | ||
| Audit | 2021 | 109,000 |
| 2022 | 108,000 | |
| b) Audit-Related Fees: | ||
| 2021 | None | |
| 2022 | None | |
| c) Tax Fees: | ||
| 2021 | 9,000 | |
| 2022 | 9,000 | |
| The tax fees consist of professional services relating to the preparation of the Registrant’s tax returns. | ||
| d) All Other Fees: | ||
| 2021 | None | |
| 2022 | None | |
| Adviser and affiliates (includes only fees for non-audit services billed to the adviser and affiliates for engagements that relate directly to the operations and financial reporting of the Registrant and were subject to the pre-approval policies described below): | ||
| a) Audit Fees: | ||
| Not Applicable | ||
| b) Audit-Related Fees: | ||
| 2021 | None | |
| 2022 | None | |
| The audit-related fees consist of assurance and related services relating to the examination of the Registrant’s transfer agent, principal underwriter and investment adviser conducted in accordance with Statement on Standards for Attestation Engagements Number 18 issued by the American Institute of Certified Public Accountants. | ||
| c) Tax Fees: | ||
| 2021 | None | |
| 2022 | None |
| The tax fees consist of consulting services relating to the Registrant’s investments. | ||
| d) All Other Fees: | ||
| 2021 | 2,000 | |
| 2022 | None | |
| The other fees consist of subscription services related to an accounting research tool. | ||
| All audit and permissible non-audit services that the Registrant’s audit committee considers compatible with maintaining the independent registered public accounting firm’s independence are required to be pre-approved by the committee. The pre-approval requirement will extend to all non-audit services provided to the Registrant, the investment adviser, and any entity controlling, controlled by, or under common control with the investment adviser that provides ongoing services to the Registrant, if the engagement relates directly to the operations and financial reporting of the Registrant. The committee will not delegate its responsibility to pre-approve these services to the investment adviser. The committee may delegate to one or more committee members the authority to review and pre-approve audit and permissible non-audit services. Actions taken under any such delegation will be reported to the full committee at its next meeting. The pre-approval requirement is waived with respect to non-audit services if certain conditions are met. The pre-approval requirement was not waived for any of the non-audit services listed above provided to the Registrant, adviser and affiliates. | ||
| Aggregate non-audit fees paid to the Registrant’s auditors, including fees for all services billed to the Registrant, adviser and affiliates that provide ongoing services to the Registrant, were $11,000 for fiscal year 2021 and $9,000 for fiscal year 2022. The non-audit services represented by these amounts were brought to the attention of the committee and considered to be compatible with maintaining the auditors’ independence. |
ITEM 5 – Audit Committee of Listed Registrants
Not applicable to this Registrant, insofar as the Registrant is not a listed issuer as defined in Rule 10A-3 under the Securities Exchange Act of 1934.
ITEM 6 – Schedule of Investments
Not applicable, insofar as the schedule is included as part of the report to shareholders filed under Item 1 of this Form.
ITEM 7 – Disclosure of Proxy Voting Policies and Procedures for Closed-End Management Investment Companies
Not applicable to this Registrant, insofar as the Registrant is not a closed-end management investment company.
ITEM 8 – Portfolio Managers of Closed-End Management Investment Companies
Not applicable to this Registrant, insofar as the Registrant is not a closed-end management investment company.
ITEM 9 – Purchases of Equity Securities by Closed-End Management Investment Company and Affiliated Purchasers
Not applicable to this Registrant, insofar as the Registrant is not a closed-end management investment company.
ITEM 10 – Submission of Matters to a Vote of Security Holders
There have been no material changes to the procedures by which shareholders may recommend nominees to the Registrant’s board of trustees since the Registrant last submitted a proxy statement to its shareholders. The procedures are as follows. The Registrant has a nominating and governance committee comprised solely of persons who are not considered ‘‘interested persons’’ of the Registrant within the meaning of the Investment Company Act of 1940, as amended. The committee periodically reviews such issues as the board’s composition, responsibilities, committees, compensation and other relevant issues, and recommends any appropriate changes to the full board of trustees. While the committee normally is able to identify from its own resources an ample number of qualified candidates, it will consider shareholder suggestions of persons to be considered as nominees to fill future vacancies on the board. Such suggestions must be sent in writing to the nominating and governance committee of the Registrant, c/o the Registrant’s Secretary, and must be accompanied by complete biographical and occupational data on the prospective nominee, along with a written consent of the prospective nominee for consideration of his or her name by the nominating and governance committee.
ITEM 11 – Controls and Procedures
| (a) | The Registrant’s Principal Executive Officer and Principal Financial Officer have concluded, based on their evaluation of the Registrant’s disclosure controls and procedures (as such term is defined in Rule 30a-3 under the Investment Company Act of 1940), that such controls and procedures are adequate and reasonably designed to achieve the purposes described in paragraph (c) of such rule. |
| (b) |
There were no changes in the Registrant’s internal controls over financial reporting (as defined in Rule 30a-3(d) under the Investment Company Act of 1940) that occurred during the Registrant’s semi-annual period covered by this report that has materially affected, or is reasonably likely to materially affect, the Registrant’s internal control over financial reporting.
|
ITEM 12 – Exhibits
| (a)(1) | The Code of Ethics that is the subject of the disclosure required by Item 2 is attached as an exhibit hereto. |
| (a)(2) | The certifications required by Rule 30a-2 of the Investment Company Act of 1940 and Sections 302 and 906 of the Sarbanes-Oxley Act of 2002 are attached as exhibits hereto. |
SIGNATURES
Pursuant to the requirements of the Securities Exchange Act of 1934 and the Investment Company Act of 1940, the Registrant has duly caused this report to be signed on its behalf by the undersigned, thereunto duly authorized.
| WASHINGTON MUTUAL INVESTORS FUND | |
| By __/s/ Michael W. Stockton________________ | |
|
Michael W. Stockton, Executive Vice President and Principal Executive Officer | |
| Date: June 30, 2022 |
Pursuant to the requirements of the Securities Exchange Act of 1934 and the Investment Company Act of 1940, this report has been signed below by the following persons on behalf of the Registrant and in the capacities and on the dates indicated.
| By _ /s/ Michael W. Stockton_____________ |
|
Michael W. Stockton, Executive Vice President and Principal Executive Officer |
| Date: June 30, 2022 |
| By ___/s/ Brian C. Janssen__________________ |
|
Brian C. Janssen, Treasurer and Principal Financial Officer |
| Date: June 30, 2022 |
Code of Ethics
The following Code of Ethics is in effect for the Registrant:
| The Fund has adopted the following standards in accordance with the requirements of Form N-CSR adopted by the Securities and Exchange Commission pursuant to Section 406 of the Sarbanes-Oxley Act of 2002 for the purpose of deterring wrongdoing and promoting: 1) honest and ethical conduct, including handling of actual or apparent conflicts of interest between personal and professional relationships; 2) full, fair, accurate, timely and understandable disclosure in reports and documents that a fund files with or submits to the Commission and in other public communications made by the fund; 3) compliance with applicable governmental laws, rules and regulations; 4) the prompt internal reporting of violations of the Code to an appropriate person or persons identified in the Code; and 5) accountability for adherence to the Code. These provisions shall apply to the principal executive officer or chief executive officer and treasurer (“Covered Officers”) of the Fund. | |||
| (1) | It is the responsibility of Covered Officers to foster, by their words and actions, a corporate culture that encourages honest and ethical conduct, including the ethical resolution of, and appropriate disclosure of conflicts of interest. Covered Officers should work to assure a working environment that is characterized by respect for law and compliance with applicable rules and regulations. | ||
| (2) | Each Covered Officer must act in an honest and ethical manner while conducting the affairs of the Fund, including the ethical handling of actual or apparent conflicts of interest between personal and professional relationships. Duties of Covered Officers include: | ||
| • | Acting with integrity; | ||
| • | Adhering to a high standard of business ethics; and | ||
| • | Not using personal influence or personal relationships to improperly influence investment decisions or financial reporting whereby the Covered Officer would benefit personally to the detriment of the Fund; | ||
| (3) | Each Covered Officer should act to promote full, fair, accurate, timely and understandable disclosure in reports and documents that the Fund files with or submits to, the Securities and Exchange Commission and in other public communications made by the Fund. | ||
| • | Covered Officers should familiarize themselves with disclosure requirements applicable to the Fund and disclosure controls and procedures in place to meet these requirements; and | ||
| • | Covered Officers must not knowingly misrepresent, or cause others to misrepresent facts about the Fund to others, including the Fund’s auditors, independent trustees, governmental regulators and self-regulatory organizations. | ||
| (4) | Any existing or potential violations of this Code of Ethics should be reported to The Capital Group Companies’ Personal Investing Committee. The Personal Investing Committee is authorized to investigate any such violations and report their findings to the Chairman of the Audit Committee of the Fund. The Chairman of the Audit Committee may report violations of the Code of Ethics to the Board or other appropriate entity including the Audit Committee, if he or she believes such a reporting is appropriate. The Personal Investing Committee may also determine the appropriate sanction for any violations of this Code of Ethics, including removal from office, provided that removal from office shall only be carried out with the approval of the Board. | ||
| (5) | Application of this Code of Ethics is the responsibility of the Personal Investing Committee, which shall report periodically to the Chairman of the Audit Committee of the Fund. | ||
| (6) | Material amendments to these provisions must be ratified by a majority vote of the Board. As required by applicable rules, substantive amendments to the Code of Ethics must be filed or appropriately disclosed. | ||
|
Washington Mutual Investors Fund 6455 Irvine Center Drive Irvine, California 92618 (949) 975-5000 |
CERTIFICATION
I, Michael W. Stockton, certify that:
| 1. | I have reviewed this report on Form N-CSR of Washington Mutual Investors Fund; |
| 2. | Based on my knowledge, this report does not contain any untrue statement of a material fact or omit to state a material fact necessary to make the statements made, in light of the circumstances under which such statements were made, not misleading with respect to the period covered by this report; |
| 3. | Based on my knowledge, the financial statements, and other financial information included in this report, fairly present in all material respects the financial condition, results of operations, changes in net assets, and cash flows (if the financial statements are required to include a statement of cash flows) of the registrant as of, and for, the periods presented in this report; |
| 4. | The registrant's other certifying officer(s) and I are responsible for establishing and maintaining disclosure controls and procedures (as defined in rule 30a-3(c) under the Investment Company Act of 1940) and internal controls over financial reporting (as defined in Rule 30a-3(d) under the Investment Company Act of 1940) for the registrant and have: |
| a) Designed such disclosure controls and procedures, or caused such disclosure controls and procedures to be designed under our supervision, to ensure that material information relating to the registrant, including its consolidated subsidiaries, is made known to us by others within those entities, particularly during the period in which this report is being prepared; | |
| b) Designed such internal control over financial reporting, or caused such internal control over financial reporting to be designed under our supervision, to provide reasonable assurance regarding the reliability of financial reporting and the preparation of financial statements for external purposes in accordance with generally accepted accounting principles; | |
| c) Evaluated the effectiveness of the registrant's disclosure controls and procedures and presented in this report our conclusions about the effectiveness of the disclosure controls and procedures, as of a date within 180 days prior to the filing date of this report based on such evaluation; and | |
| d) Disclosed in this report any change in the registrant’s internal control over financial reporting that occurred during the registrant’s semi-annual period covered by this report that has materially affected, or is reasonably likely to materially affect, the registrant’s internal control over financial reporting; and | |
| 5. | The registrant's other certifying officer(s) and I have disclosed to the registrant's auditors and the audit committee of the registrant's Board of Trustees (or persons performing the equivalent functions): |
| a) All significant deficiencies and material weaknesses in the design or operation of internal control over financial reporting which are reasonably likely to adversely affect the registrant’s ability to record, process, summarize, and report financial information; and | |
| b) Any fraud, whether or not material, that involves management or other employees who have a significant role in the registrant's internal control over financial reporting. |
Date: June 30, 2022
_/s/ Michael W. Stockton___________________
Michael W. Stockton, Executive Vice President and
Principal Executive Officer
Washington Mutual Investors Fund
|
Washington Mutual Investors Fund 6455 Irvine Center Drive Irvine, California 92618 (949) 975-5000 |
CERTIFICATION
I, Brian C. Janssen, certify that:
| 1. | I have reviewed this report on Form N-CSR of Washington Mutual Investors Fund; |
| 2. | Based on my knowledge, this report does not contain any untrue statement of a material fact or omit to state a material fact necessary to make the statements made, in light of the circumstances under which such statements were made, not misleading with respect to the period covered by this report; |
| 3. | Based on my knowledge, the financial statements, and other financial information included in this report, fairly present in all material respects the financial condition, results of operations, changes in net assets, and cash flows (if the financial statements are required to include a statement of cash flows) of the registrant as of, and for, the periods presented in this report; |
| 4. | The registrant's other certifying officer(s) and I are responsible for establishing and maintaining disclosure controls and procedures (as defined in rule 30a-3(c) under the Investment Company Act of 1940) and internal controls over financial reporting (as defined in Rule 30a-3(d) under the Investment Company Act of 1940) for the registrant and have: |
| a) Designed such disclosure controls and procedures, or caused such disclosure controls and procedures to be designed under our supervision, to ensure that material information relating to the registrant, including its consolidated subsidiaries, is made known to us by others within those entities, particularly during the period in which this report is being prepared; | |
| b) Designed such internal control over financial reporting, or caused such internal control over financial reporting to be designed under our supervision, to provide reasonable assurance regarding the reliability of financial reporting and the preparation of financial statements for external purposes in accordance with generally accepted accounting principles; | |
| c) Evaluated the effectiveness of the registrant's disclosure controls and procedures and presented in this report our conclusions about the effectiveness of the disclosure controls and procedures, as of a date within 180 days prior to the filing date of this report based on such evaluation; and | |
| d) Disclosed in this report any change in the registrant’s internal control over financial reporting that occurred during the registrant’s semi-annual period covered by this report that has materially affected, or is reasonably likely to materially affect, the registrant’s internal control over financial reporting; and | |
| 5. | The registrant's other certifying officer(s) and I have disclosed to the registrant's auditors and the audit committee of the registrant's Board of Trustees (or persons performing the equivalent functions): |
| a) All significant deficiencies and material weaknesses in the design or operation of internal control over financial reporting which are reasonably likely to adversely affect the registrant’s ability to record, process, summarize, and report financial information; and | |
| b) Any fraud, whether or not material, that involves management or other employees who have a significant role in the registrant's internal control over financial reporting. |
Date: June 30, 2022
___/s/ Brian C. Janssen_______
Brian C. Janssen, Treasurer and
Principal Financial Officer
Washington Mutual Investors Fund
|
|
Washington Mutual Investors Fund 6455 Irvine Center Drive Irvine, California 92618 (949) 975-5000 |
CERTIFICATION PURSUANT TO 18 U.S.C. SECTION 1350,
AS ADOPTED PURSUANT TO
SECTION 906 OF THE SARBANES-OXLEY ACT OF 2002
MICHAEL W. STOCKTON, Executive Vice President and Principal Executive Officer, and BRIAN C. JANSSEN, Treasurer and Principal Financial Officer of Washington Mutual Investors Fund (the "Registrant"), each certify to the best of her or his knowledge that:
| 1) | The Registrant's periodic report on Form N-CSR for the period ended April 30, 2022 (the "Form N-CSR") fully complies with the requirements of Section 13(a) or 15(d) of the Securities Exchange Act of 1934, as amended; and |
| 2) | The information contained in the Form N-CSR fairly presents, in all material respects, the financial condition and results of operations of the Registrant. |
| Principal Executive Officer | Principal Financial Officer |
| WASHINGTON MUTUAL INVESTORS FUND | WASHINGTON MUTUAL INVESTORS FUND |
| _/s/ Michael W. Stockton_____________________ | __/s/ Brian C. Janssen_________________ |
| Michael W. Stockton, Executive Vice President | Brian C. Janssen, Treasurer |
| Date: June 30, 2022 | Date: June 30, 2022 |
A signed original of this written statement required by Section 906 of the Sarbanes-Oxley Act of 2002 has been provided to WASHINGTON MUTUAL INVESTORS FUND and will be retained by WASHINGTON MUTUAL INVESTORS FUND and furnished to the Securities and Exchange Commission (the "Commission") or its staff upon request.
This certification is being furnished to the Commission solely pursuant to 18 U.S.C. Section 1350 and is not being filed as part of the Form N-CSR filed with the Commission.
Serious News for Serious Traders! Try StreetInsider.com Premium Free!
You May Also Be Interested In
- Mr. Cooper Group Inc. (COOP) PT Raised to $90 at Deutsche Bank
- Mr. Cooper Group Inc. (COOP) PT Raised to $94 at Barclays
- Mr. Cooper Group (COOP) Tops Q1 EPS by 68c
Create E-mail Alert Related Categories
SEC FilingsSign up for StreetInsider Free!
Receive full access to all new and archived articles, unlimited portfolio tracking, e-mail alerts, custom newswires and RSS feeds - and more!
