

Form N-CSR Ultimus Managers Trust For: Nov 30
 Tweet
Tweet Share
Share
UNITED STATES
SECURITIES AND EXCHANGE COMMISSION
Washington, D.C. 20549
FORM N-CSR
CERTIFIED SHAREHOLDER REPORT OF REGISTERED
MANAGEMENT INVESTMENT COMPANIES
| Investment Company Act file number | 811-22680 |
| Ultimus Managers Trust |
| (Exact name of registrant as specified in charter) |
| 225 Pictoria Drive, Suite 450 Cincinnati, Ohio | 45246 |
| (Address of principal executive offices) | (Zip code) |
Khimmara Greer
| Ultimus Fund Solutions, LLC 225 Pictoria Drive, Suite 450 | Cincinnati, Ohio 45246 |
| (Name and address of agent for service) | |
| Registrant's telephone number, including area code: | (513) 587-3400 |
| Date of fiscal year end: | November 30 | |
| Date of reporting period: | November 30, 2022 |
Form N-CSR is to be used by management investment companies to file reports with the Commission not later than 10 days after the transmission to stockholders of any report that is required to be transmitted to stockholders under Rule 30e-1 under the Investment Company Act of 1940 (17 CFR 270.30e-1). The Commission may use the information provided on Form N-CSR in its regulatory, disclosure review, inspection, and policymaking roles.
A registrant is required to disclose the information specified by Form N-CSR, and the Commission will make this information public. A registrant is not required to respond to the collection of information contained in Form N-CSR unless the Form displays a currently valid Office of Management and Budget ("OMB") control number. Please direct comments concerning the accuracy of the information collection burden estimate and any suggestions for reducing the burden to the Secretary, Securities and Exchange Commission, 450 Fifth Street, NW, Washington, DC 20549-0609. The OMB has reviewed this collection of information under the clearance requirements of 44 U.S.C. § 3507.
| Item 1. | Reports to Stockholders. |
| (a) |

LYRICAL U.S. VALUE EQUITY FUND
Institutional Class (LYRIX)
Investor Class (LYRBX)
A Class (LYRAX)
C Class (LYRCX)
LYRICAL INTERNATIONAL VALUE EQUITY FUND
Institutional Class (LYRWX)
Investor Class (LYRNX)
A Class (LYRVX)
C Class (LYRZX)
Annual Report
November 30, 2022
| LYRICAL FUNDS | November 30, 2022 |
| LETTER TO SHAREHOLDERS | (Unaudited) |
Dear Fellow Shareholders,
Enclosed is the Annual Report to shareholders of the Lyrical U.S. Value Equity Fund (the “U.S. Fund”) and Lyrical International Value Equity Fund (the “International Fund”) (collectively, the “Funds”). On behalf of the Funds and their investment adviser, Lyrical Asset Management LP, I would like to thank you for your investment.
Lyrical U.S. Value Equity
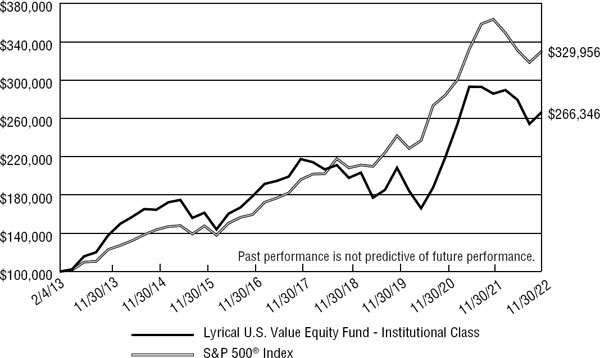
For the twelve months ended November 30, 2022, the U.S. Fund’s Institutional Class produced a total return of -6.81% outperforming the total return for the S&P 500 of -9.21%. One never wants to have a losing year, but we are pleased to have outperformed the S&P 500 by 240 bp.
Since its launch on February 4, 2013 through November 30, 2022, the U.S. Fund’s Institutional Class has produced a cumulative total return of +166.35%, compared to the +229.96% cumulative total return for the S&P 500® (the “S&P 500”). For the twelve months ended November 30, 2022, the three positions that most positively impacted performance were Cigna Corporation (CI), Suncor Energy Inc. (SU), and Centene Corporation (CE) with contributions of 240 basis points (bps) (up 75%), 103 bps (up 41%) and 97 bps (up 22%), respectively; conversely, the three positions that most negatively impacted performance were Lincoln National Corp (LNC), Western Digital Corporation (WDC), and eBay Inc. (EBAY) which detracted 160 bps (down 39%), 151 bps (down 37%) and 138 bps (down 31%), respectively. Please see the following for commentary on these stocks for the period:
Cigna Corporation (CI) up 75%: Cigna Corporation performed well during the period with forward earnings estimates up ~10%, while the stock’s P/E ratio increased from under 9x to over 13x. As the company has shown over the past 15 years, it is resilient in the face of many different economic/political backdrops, including recessions, democratic or republican presidencies, and now inflation.
Suncor Energy Inc. (SU) up 41%: Suncor has benefitted from higher oil prices over the past year, driving forward earnings estimates up by ~70% over the period. Suncor is more like a mining company than an oil drilling company, with long-life, low-decline assets and a stable downstream refining operation. Although Suncor produces and sells a commodity, it has no exploration risk, with 30 years of reserves. Suncor also has a downstream refining business, which earns a profit for converting oil to gasoline and is not dependent on commodity prices.
Centene Corporation (CNC) up 22%: Centene Corporation performed well during the period with forward earnings estimates up ~20%. Like Cigna, Centene has also proved resilient in the face of different economic environments. Centene is the #1 provider of managed care services for government organizations. Its key market is Medicaid, where it saves the state governments about 10-20% on costs, while delivering good health outcomes.
1
Lincoln National Corp (LNC) down 39%: On November 3rd, Lincoln Financial reported 3Q22 earnings results that included a significant reserve charge in its Individual Life Insurance segment. This charge came after Lincoln completed its annual review process, which is done each year in the third quarter and did not include any material charges in the past. The charge was $12 per share, or about 15% of book value. The reserve charge was taken because of a change in assumptions for policyholder behavior (persistency) and not because of interest rates, inflation, or changes in mortality rates. Specifically, over the past few years, Lincoln has experienced more customers remaining policyholders (higher persistency) than in the past.
Western Digital Corporation (WDC) down 37%: Western Digital has suffered from weak memory prices, driving forward EPS estimate down materially over the period. Memory and Storage demand was substantially lower over the period, particularly as PC, Smartphone, and Server OEMs adjusted inventories in response to macro headwinds. These same issues were experienced by many companies in the IT supply chain. The memory industry is highly cyclical, but we view this stock as a “growth-cyclical,” where long-term demand growth should lead to higher profits in each successive cycle.
eBay Inc. (EBAY) down 31%: eBay’s forward earnings estimates declined slightly over the period, but the stock was negatively impacted by a drop in its P/E multiple, which declined from ~16x to 10x forward EPS. eBay is a marketplace business that is both high margin and capital light. Its key competitive advantage comes from its large network of both buyers and sellers. eBay is focused on its most attractive, enthusiast buyers, who represent about 70% of transaction dollars and who shop about 30x per year.
In analyzing the U.S. Fund portfolio’s performance attribution, we find it helpful to examine both the investment success rate and any skew in the distribution of returns. Over the life of the U.S. Fund, 76% of the U.S. Fund’s investments posted gains, and 55% outperformed the S&P 500. Skew has been a positive factor, as the U.S. Fund’s outperformers have outperformed by 186%, while our underperformers have underperformed by 90% over the life of the U.S. Fund. For the twelve-month period ended November 30, 2022, 41% of the U.S. Fund’s investments posted gains, and 54% outperformed the S&P 500. For the twelve-month period, skew has been a positive factor as the U.S. Fund’s outperformers have outperformed by 21%, while its underperformers have underperformed by 20%.
During the life of the U.S. Fund we have sold fifty-one positions, as nine companies announced they were being acquired, twenty-six approached our estimates of fair value, for five we lost conviction in our thesis, for one the company announced or completed acquisitions which increased the complexity and decreased analyzability and for ten the risk/reward became less compelling than other opportunities. For each sale we added a new position from our pipeline of opportunities.
As of November 30, 2022, the valuation of our portfolio is 9.9 times the next twelve months consensus earnings. The S&P 500 has a valuation of 17.8 times earnings on this same basis, a premium of 79.1% over the U.S. Fund.
2
Lyrical International Value Equity
In March 2020, we launched the Lyrical International Value Equity Fund to employ our value strategy in the international space. Our portfolio is constructed to be balanced and diversified across approximately 25-40 positions, giving us exposure to as many different types of companies and situations as possible without sacrificing our strict investment standards.
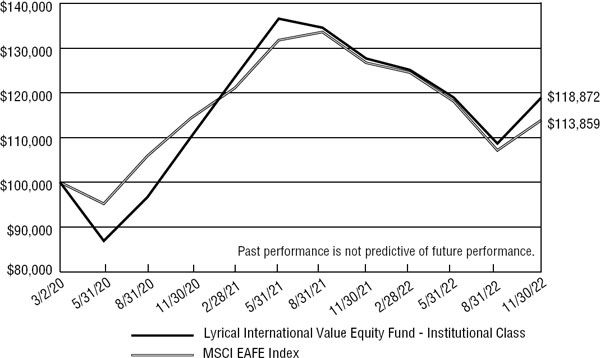
Since its launch on March 2, 2020 through November 30, 2022, the Lyrical International Value Equity Fund – Institutional Class has produced a total return of +18.87%, compared to the +13.86% total return for the MSCI EAFE. For the twelve months ended November 30, 2022, the International Fund’s Institutional Class produced a total return of -6.88% compared to the total return for the MSCI EAFE of -10.14%. For the twelve months ended November 2022, the three positions that most positively impacted performance were Suncor Energy Inc. (SU-CA), Element Fleet Management Corporation (EFN-CA), and Fairfax Financial Holdings Limited (FFH-CA) with contributions of 202 basis points (bps) (up 41%), 139 bps (up 50%) and 132 bps (up 31%), respectively; conversely, the three positions that most negatively impacted performance were AUTO1 Group SE (AG1-DE), Sony Group Corporation (6758-JP), and EXOR N.V. (EXO-NL) which detracted 197 bps (down 63%), 197 bps (down 33%) and 153 bps (down 31%), respectively. Our commentary on these stocks for the period follows:
Suncor Energy Inc. (SU-CA), up 41%: Suncor has benefitted from higher oil prices over the past year, driving forward earnings estimates up by ~70% over the period. Suncor is more like a mining company than an oil drilling company, with long-life, low-decline assets and a stable downstream refining operation. Although Suncor produces and sells a commodity, it has no exploration risk, with 30 years of reserves. Suncor also has a downstream refining business, which earns a profit for converting oil to gasoline and is not dependent on commodity prices.
Element Fleet Management Corporation (EFN-CA) up 50%: Element benefitted from forward earnings estimates increasing about 35% over the period. Element is the North American leader in outsourced commercial fleet management with about 2x the size of the nearest competitor. Element’s advantage is its breadth of network. In addition to its scale advantages, Element has a significant opportunity to benefit from continued outsourcing, away from self-managed fleets.
Fairfax Financial Holdings Limited (FFH-CA) up 31%: Fairfax performed well over the period as both its book value per share and its price-to-book multiple increased. The company is benefitting from both firm insurance prices and from increasing interest rates, which benefit its investment income. Fairfax is a diversified property/casualty insurance business, both in the insurance it writes and the investments it makes. The company has generated an underwriting profit in nine of the past ten years.
AUTO1 Group SE (AG1-DE) down 63%: Auto1 operates the largest used car sales platform in Europe, acting as the leading intermediary between two fragmented groups: the 28 million Europeans that sell their cars each year and the 200,000 auto dealerships that purchase them. With a 33% market share (40-50% in key markets like France and Germany), Auto1 is the scale player that can offer unparalleled price and convenience
3
to consumers and dealers. Four years ago, Auto1 decided to begin selling vehicles it acquires from consumers directly to other consumers. While the core merchant auction business is highly profitable and growing, this nascent direct-to-consumer business is losing money as it has scaled from 3,000 units to about 80,000 units in 2022. We believe Auto1’s stock has been caught up in the broad sell-off of growth businesses, despite continuing to report strong fundamental results. Excluding direct-to-consumer startup losses, the stock trades for 9x 2022 earnings from the merchant business, excluding a sizeable net cash position.
Sony Group Corporation (6758-JP) down 33%: Sony is a global leader in entertainment, with a top three position in: video games, music, and film production. This is an IP-driven content company which controls one of the widest entertainment libraries in the world, including the second largest collection of music rights and timeless assets like Spider-Man and Jeopardy. Sony reported earnings for the fiscal year ending March 2022 that were in-line with guidance. The company guided operating profit for the coming fiscal year to be slightly below consensus, but this miss was entirely driven by acquisition-related costs for the recent deal to acquire Bungie. This acquisition further cements Sony’s position as a leader in first-party game production. Sony continues to see momentum in its business, for example guiding gaming revenue to grow about 32% in the current year and for music revenues to increase 23%, on top of a 19% increase last year. We believe the recent drop in Sony shares is due to concerns over Microsoft’s acquisition of Activision Blizzard and a general sell-off in the technology sector. Regarding the Activision Blizzard deal, we see risks to Sony as overblown. Sony is Activision’s largest customer, and we expect that key games will remain available on the PlayStation network. Furthermore, we continue to believe that Sony’s best-in-class, exclusive gaming content makes PlayStation competitive versus the Xbox offering.
Entain PLC (ENT-LON) down 24%: Entain’s stock price declined mostly because of decrease in its valuation multiple. Entain is an online gaming operator with 99% of its business in regulated markets. As a result of these heavy regulations and associated costs, these markets tend to be dominated by a few key companies. This should continue to benefit Entain as markets consolidate. Online gaming still represents a minority of the gaming market, and Entain should be able to grow its online business by double-digits, organically. Entain has a fully-capable technology platform that allows it to adapt and design marketing/promotion campaigns at a lower cost than peers.
In analyzing the International Fund portfolio’s performance attribution, we find it helpful to examine both the investment success rate and any skew in the distribution of returns. Over the life of the International Fund, 53% of the International Fund’s investments posted gains, and 53% outperformed the MSCI EAFE. Skew has been a positive factor, as the International Fund’s outperformers have outperformed by 42%, while our underperformers have underperformed by 32% over the life of the International Fund. For the twelve-month period ended November 30, 2022, 31% of the International Fund’s investments posted gains, and 41% outperformed the MSCI EAFE. For the twelve-month period, skew has been a positive factor as the International Fund’s outperformers have outperformed by 22%, while our underperformers have underperformed by 15%.
4
During the life of the International Fund we have sold 18 positions, as two companies announced they were being acquired, five approached our estimates of fair value, for seven we lost conviction in our thesis, and for four the risk/reward became less compelling than other opportunities. For each sale we added a new position from our pipeline of opportunities.
As of November 30, 2022, the valuation of our portfolio is 9.9x the next twelve months consensus earnings. The MSCI EAFE has a valuation of 12.4x earnings on this same basis, a premium of 25% over the International Fund.
Lyrical Asset Management’s Investment Philosophy and Portfolio Construction
For new investors since our previous Letter to the Shareholders we’d like to briefly outline our investment philosophy and portfolio construction approach.
We believe our strategy and approach to investing differentiate us from other investment managers, even those that share a value approach to investing. We are deep value investors and by this we mean that we look to invest in companies trading significantly below intrinsic value. This separates us from other value managers who focus generally on relative value or core value approaches and whose portfolio characteristics have higher Price/Earnings, Price/Book and Price/Cash Flow multiples. We assess valuation based on current price relative to long-term normalized earnings, which contrasts us to those that rely on Price/Book or dividend yield. We only invest in what we consider to be quality businesses that we believe should earn good returns on invested capital, and avoid volatile businesses and companies with excessive leverage. Other value investors may consider owning any business regardless of quality if they believe the price is low enough. Lastly, we only invest in businesses we can understand and avoid those that are excessively complex or require specialized technical knowledge, even though they may appear cheap from a high-level perspective.
We construct our portfolios purely bottom up and without regard to what is or is not contained in a benchmark. We are concerned with concentration risk and have strict limits on how much capital can be invested in any one position or any one industry. Both funds are constructed to be balanced and diversified across approximately 33 positions, giving us exposure to many different types of companies and situations without sacrificing our strict investment standards.
Thank you for your continued trust and interest in Lyrical Asset Management.
Sincerely,
Andrew Wellington
Portfolio Manager
5
Past performance is not predictive of future performance. Investment results and principal value will fluctuate so that shares, when redeemed, may be worth more or less than their original cost. Current performance may be higher or lower than the performance data quoted. Performance data current to the most recent month end are available by calling 1-888-884-8099.
An investor should consider the investment objectives, risks, charges and expenses of the Funds carefully before investing. The Funds’ prospectus contains this and other important information. To obtain a copy of the Funds’ prospectus please visit the Funds’ website at www.lyricalvaluefunds.com or call 1-888-884-8099 and a copy will be sent to you free of charge. Please read the prospectus carefully before you invest. The Funds are distributed by Ultimus Fund Distributors, LLC.
The Letter to Shareholders seeks to describe some of the Adviser’s current opinions and views of the financial markets. Although the Adviser believes it has a reasonable basis for any opinions or views expressed, actual results may differ, sometimes significantly so, from those expected or expressed. The securities held by the Funds that are discussed in the Letter to Shareholders were held during the period covered by this Report. They do not comprise the entire investment portfolios of the Funds, may be sold at any time, and may no longer be held by the Funds. For a complete list of securities held by the Funds as of November 30, 2022, please see the Schedules of Investments section of this Report. The opinions of the Fund’s adviser with respect to those securities may change at any time.
Statements in the Letter to Shareholders that reflect projections or expectations for future financial or economic performance of the Funds and the market in general and statements of the Funds’ plans and objectives for future operations are forward-looking statements. No assurance can be given that actual results or events will not differ materially from those projected, estimated, assumed, or anticipated in any such forward- looking statements. Important factors that could result in such differences, in addition to factors noted with such forward-looking statements include, without limitation, general economic conditions, such as inflation, recession, and interest rates. Past performance is not a guarantee of future results.
6
| LYRICAL
U.S. VALUE EQUITY FUND PERFORMANCE INFORMATION (Unaudited) |
Comparison
of the Change in Value of a $100,000 Investment in
Lyrical U.S. Value Equity Fund - Institutional Class(a) versus
the S&P 500® Index
Average Annual Total Returns
(for the periods ended November 30, 2022)
| Since | ||||||||||||
| 1 Year | 5 Years | Inception(c) | ||||||||||
| Lyrical U.S. Value Equity Fund - Institutional Class (b) | -6.81 | % | 4.14 | % | 10.49 | % | ||||||
| Lyrical U.S. Value Equity Fund - Investor Class (b) | -7.03 | % | 3.84 | % | 6.61 | % | ||||||
| Lyrical U.S. Value Equity Fund - A Class (b) | N/A | N/A | 3.80 | % | ||||||||
| Lyrical U.S. Value Equity Fund - A Class - without load (b) | N/A | N/A | 10.12 | % | ||||||||
| Lyrical U.S. Value Equity Fund - C Class (b) | N/A | N/A | 8.79 | % | ||||||||
| Lyrical U.S. Value Equity Fund - C Class - without load (b) | N/A | N/A | 9.79 | % | ||||||||
| S&P 500® Index (d) | -9.21 | % | 10.98 | % | 12.93 | %(e) | ||||||
| (a) | The line graph above represents performance of the Institutional Class only, which will vary from the performance of the Investor Class, A Class, and C Class based on the differences in fees paid by shareholders in the different classes. |
| (b) | The Fund’s total returns do not reflect the deduction of taxes a shareholder would pay on Fund distributions or the redemption of Fund shares. |
| (c) | Commencement of operations for Institutional Class shares was February 4, 2013. Commencement of operations for Investor Class shares was February 24, 2014. Commencement of operations for A Class shares and C Class shares was July 5, 2022. |
| (d) | The S&P 500® Index is a market capitalization weighted index of 500 large companies that is widely used as a barometer of U.S. stock market performance. The index is unmanaged and shown for illustration purposes only. An investor cannot invest in an index and its returns are not indicative of the performance of any specific investment. |
| (e) | Represents the period from February 4, 2013 (date of commencement of operations of Institutional Class shares) through November 30, 2022. |
7
| LYRICAL
INTERNATIONAL VALUE EQUITY FUND PERFORMANCE INFORMATION (Unaudited) |
Comparison
of the Change in Value of a $100,000 Investment in
Lyrical International Value Equity Fund - Institutional Class(a) versus
the MSCI EAFE Index
Average Annual Total Returns
(for the periods ended November 30, 2022)
| Since | ||||||||
| 1 Year | Inception(c) | |||||||
| Lyrical International Value Equity Fund - Institutional Class (b) | -6.88 | % | 6.49 | % | ||||
| Lyrical International Value Equity Fund - Investor Class (b) | -7.15 | % | 6.23 | % | ||||
| Lyrical International Value Equity Fund - A Class (b) | N/A | 7.41 | % | |||||
| Lyrical International Value Equity Fund - A Class - without load (b) | N/A | 13.97 | % | |||||
| Lyrical International Value Equity Fund - C Class (b) | N/A | 12.67 | % | |||||
| Lyrical International Value Equity Fund - C Class - without load (b) | N/A | 13.67 | % | |||||
| MSCI EAFE Index (d) | -10.14 | % | 4.84 | %(e) | ||||
| (a) | The line graph above represents performance of the Institutional Class only, which will vary from the performance of the Investor Class, A Class, and C Class based on the differences in fees paid by shareholders in the different classes. |
| (b) | The Fund’s total returns do not reflect the deduction of taxes a shareholder would pay on Fund distributions or the redemption of Fund shares. |
| (c) | Commencement of operations for Institutional Class shares and Investor Class shares was March 2, 2020. Commencement of operations for A Class shares and C Class shares was July 5, 2022. |
| (d) | The MSCI EAFE (Europe, Australasia, and Far East) Index is a free float-adjusted weighted capitalization index that is designed to measure the equity market performance of developed markets, excluding the U.S. and Canada. As of November 30, 2022, the MSCI EAFE Index consisted of the following 21 developed market country indices: Australia, Austria, Belgium, Denmark, Finland, France, Germany, Hong Kong, Ireland, Israel, Italy, Japan, the Netherlands, New Zealand, Norway, Portugal, Singapore, Spain, Sweden, Switzerland and the United Kingdom. The index is unmanaged and shown for illustration purposes only. An investor cannot invest in an index and its returns are not indicative of the performance of any specific investment. |
| (e) | Represents the period from March 2, 2020 (date of commencement of operations of Institutional and Investor Class shares) through November 30, 2022. |
8
| LYRICAL
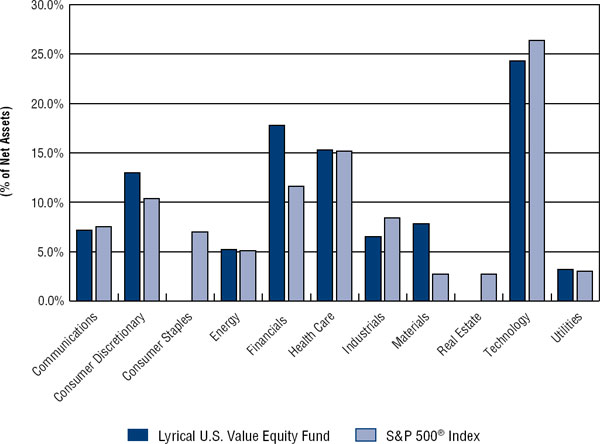
U.S. VALUE EQUITY FUND PORTFOLIO INFORMATION November 30, 2022 (Unaudited) |
Lyrical U.S. Value Equity Fund vs. S&P 500® Index
Sector Diversification
Top Ten Equity Holdings
| % of | ||
| Security Description | Net Assets | |
| United Rentals, Inc. | 6.5% | |
| Cigna Corporation | 5.4% | |
| Ameriprise Financial, Inc. | 5.4% | |
| Suncor Energy, Inc. | 5.3% | |
| Broadcom, Inc. | 5.1% | |
| Centene Corporation | 5.1% | |
| HCA Healthcare, Inc. | 4.9% | |
| Global Payments, Inc. | 4.1% | |
| Uber Technologies, Inc. | 4.1% | |
| Gen Digital, Inc. | 3.9% |
9
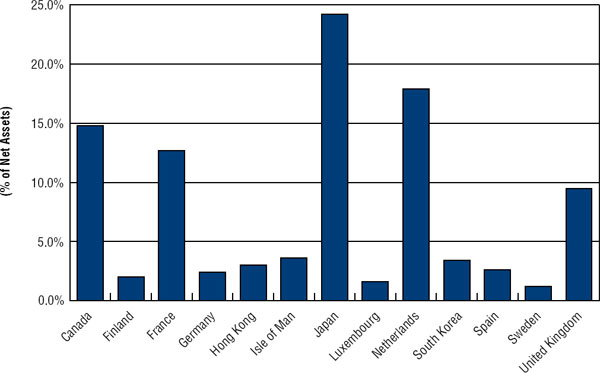
| LYRICAL INTERNATIONAL VALUE EQUITY FUND |
| PORTFOLIO INFORMATION |
| November 30, 2022 (Unaudited) |
Lyrical International Value Equity Fund
Country Diversification
Top Ten Equity Holdings
| % of | ||
| Security Description | Net Assets | |
| Bollore S.A. | 5.2% | |
| Ashtead Group plc | 4.8% | |
| Hitachi Ltd. | 4.7% | |
| CNH Industrial N.V. | 4.6% | |
| Exor N.V. | 4.5% | |
| AerCap Holdings N.V. | 4.5% | |
| Element Fleet Management Corporation | 4.4% | |
| Fairfax Financial Holdings Ltd. | 4.3% | |
| Euronext N.V. | 4.3% | |
| Suncor Energy, Inc. | 4.0% |
10
| LYRICAL U.S. VALUE EQUITY FUND |
| SCHEDULE OF INVESTMENTS |
| November 30, 2022 |
| COMMON STOCKS — 100.3% | Shares | Value | ||||||
| Communications — 7.2% | ||||||||
| Cable & Satellite — 3.1% | ||||||||
| Liberty Global plc - Series C (a) | 998,216 | $ | 20,643,107 | |||||
| Internet Media & Services — 4.1% | ||||||||
| Uber Technologies, Inc. (a) | 923,615 | 26,914,141 | ||||||
| Consumer Discretionary — 13.0% | ||||||||
| Apparel & Textile Products — 0.8% | ||||||||
| Hanesbrands, Inc. | 748,792 | 5,031,882 | ||||||
| Automotive — 3.6% | ||||||||
| Adient plc (a) | 174,140 | 6,781,011 | ||||||
| Lear Corporation | 120,828 | 17,428,231 | ||||||
| 24,209,242 | ||||||||
| E-Commerce Discretionary — 3.8% | ||||||||
| eBay, Inc. | 559,061 | 25,403,732 | ||||||
| Home & Office Products — 2.9% | ||||||||
| Whirlpool Corporation | 130,392 | 19,106,340 | ||||||
| Retail - Discretionary — 1.9% | ||||||||
| Lithia Motors, Inc. | 53,248 | 12,742,779 | ||||||
| Energy — 5.2% | ||||||||
| Oil & Gas Producers — 5.2% | ||||||||
| Suncor Energy, Inc. | 1,059,680 | 34,831,681 | ||||||
| Financials — 17.8% | ||||||||
| Asset Management — 7.7% | ||||||||
| Affiliated Managers Group, Inc. | 99,237 | 15,919,599 | ||||||
| Ameriprise Financial, Inc. | 106,987 | 35,514,335 | ||||||
| 51,433,934 | ||||||||
| Insurance — 4.8% | ||||||||
| Assurant, Inc. | 122,752 | 15,739,261 | ||||||
| Lincoln National Corporation | 406,740 | 15,838,456 | ||||||
| 31,577,717 | ||||||||
| Specialty Finance — 5.3% | ||||||||
| AerCap Holdings N.V. (a) | 344,573 | 21,156,782 | ||||||
| Air Lease Corporation | 250,018 | 9,655,695 | ||||||
| Bread Financial Holdings, Inc. | 108,917 | 4,468,865 | ||||||
| 35,281,342 | ||||||||
11
| LYRICAL U.S. VALUE EQUITY FUND |
| SCHEDULE OF INVESTMENTS (Continued) |
| COMMON STOCKS — 100.3% (Continued) | Shares | Value | ||||||
| Health Care — 15.3% | ||||||||
| Health Care Facilities & Services — 15.3% | ||||||||
| Centene Corporation (a) | 385,733 | $ | 33,578,058 | |||||
| Cigna Corporation | 108,668 | 35,739,818 | ||||||
| HCA Healthcare, Inc. | 134,022 | 32,194,765 | ||||||
| 101,512,641 | ||||||||
| Industrials — 6.5% | ||||||||
| Industrial Support Services — 6.5% | ||||||||
| United Rentals, Inc. (a) | 121,762 | 42,985,639 | ||||||
| Materials — 7.8% | ||||||||
| Chemicals — 5.2% | ||||||||
| Celanese Corporation | 203,519 | 21,837,589 | ||||||
| Univar Solutions, Inc. (a) | 382,814 | 12,682,628 | ||||||
| 34,520,217 | ||||||||
| Containers & Packaging — 2.6% | ||||||||
| Berry Global Group, Inc. | 292,687 | 17,151,458 | ||||||
| Technology — 24.3% | ||||||||
| Semiconductors — 5.1% | ||||||||
| Broadcom, Inc. | 61,056 | 33,643,688 | ||||||
| Software — 3.9% | ||||||||
| Gen Digital, Inc. | 1,131,413 | 25,977,242 | ||||||
| Technology Hardware — 11.2% | ||||||||
| Arrow Electronics, Inc. (a) | 163,049 | 17,729,948 | ||||||
| CommScope Holding Company, Inc. (a) | 394,179 | 3,500,310 | ||||||
| Flex Ltd. (a) | 1,064,329 | 23,393,951 | ||||||
| TD SYNNEX Corporation | 118,006 | 12,072,014 | ||||||
| Western Digital Corporation (a) | 476,129 | 17,497,741 | ||||||
| 74,193,964 | ||||||||
| Technology Services — 4.1% | ||||||||
| Global Payments, Inc. | 260,465 | 27,031,058 | ||||||
| Utilities — 3.2% | ||||||||
| Electric Utilities — 3.2% | ||||||||
| NRG Energy, Inc. | 494,243 | 20,980,615 | ||||||
| Total Common Stocks (Cost $573,586,543) | $ | 665,172,419 | ||||||
12
| LYRICAL U.S. VALUE EQUITY FUND |
| SCHEDULE OF INVESTMENTS (Continued) |
| MONEY MARKET FUNDS — 0.9% | Shares | Value | ||||||
| Invesco Short-Term Investments Trust - Institutional Class, 3.76% (b) (Cost $5,917,996) | 5,917,996 | $ | 5,917,996 | |||||
| Investments at Value — 101.2% (Cost $579,504,539) | $ | 671,090,415 | ||||||
| Liabilities in Excess of Other Assets — (1.2%) | (8,010,184 | ) | ||||||
| Net Assets — 100.0% | $ | 663,080,231 | ||||||
N.V. - Naamloze Vennootschap
plc - Public Limited Company
| (a) | Non-income producing security. |
| (b) | The rate shown is the 7-day effective yield as of November 30, 2022. |
See accompanying notes to financial statements.
13
| LYRICAL INTERNATIONAL VALUE EQUITY FUND |
| SCHEDULE OF INVESTMENTS |
| November 30, 2022 |
| COMMON STOCKS — 98.9% | Shares | Value | ||||||
| Canada — 14.8% | ||||||||
| Element Fleet Management Corporation | 6,877 | $ | 97,442 | |||||
| Fairfax Financial Holdings Ltd. | 167 | 95,816 | ||||||
| Linamar Corporation | 996 | 48,891 | ||||||
| Suncor Energy, Inc. | 2,676 | 87,960 | ||||||
| 330,109 | ||||||||
| Finland — 2.0% | ||||||||
| Konecranes OYJ | 1,533 | 45,262 | ||||||
| France — 12.7% | ||||||||
| Bollore S.A. | 20,632 | 116,215 | ||||||
| Elis S.A. | 2,744 | 35,986 | ||||||
| Rexel S.A. | 3,857 | 70,965 | ||||||
| SPIE S.A. | 2,407 | 59,601 | ||||||
| 282,767 | ||||||||
| Germany — 2.4% | ||||||||
| Auto1 Group SE (a) | 3,214 | 28,116 | ||||||
| Software AG | 967 | 24,828 | ||||||
| 52,944 | ||||||||
| Hong Kong — 3.0% | ||||||||
| CK Hutchison Holdings Ltd. | 11,507 | 66,895 | ||||||
| Isle of Man — 3.6% | ||||||||
| Entain plc | 4,698 | 80,451 | ||||||
| Japan — 24.2% | ||||||||
| Air Water, Inc. | 3,157 | 37,356 | ||||||
| Hitachi Ltd. | 1,962 | 104,931 | ||||||
| ITOCHU Corporation | 2,755 | 86,530 | ||||||
| Kinden Corporation | 2,310 | 24,817 | ||||||
| Kyudenko Corporation | 836 | 20,115 | ||||||
| Nintendo Company Ltd. - ADR | 7,795 | 83,640 | ||||||
| SK Kaken Company Ltd. | 83 | 23,200 | ||||||
| Sony Group Corporation | 920 | 76,216 | ||||||
| Suzuki Motor Corporation | 2,238 | 80,737 | ||||||
| 537,542 | ||||||||
| Luxembourg — 1.6% | ||||||||
| Ardagh Metal Packaging S.A. | 7,799 | 34,861 | ||||||
| Netherlands — 17.9% | ||||||||
| AerCap Holdings N.V. (a) | 1,623 | 99,652 | ||||||
14
| LYRICAL INTERNATIONAL VALUE EQUITY FUND |
| SCHEDULE OF INVESTMENTS (Continued) |
| COMMON STOCKS — 98.9% (Continued) | Shares | Value | ||||||
| Netherlands — 17.9% (Continued) | ||||||||
| CNH Industrial N.V. | 6,369 | $ | 102,775 | |||||
| Euronext N.V. | 1,242 | 95,128 | ||||||
| Exor N.V. (a) | 1,276 | 100,290 | ||||||
| 397,845 | ||||||||
| South Korea — 3.4% | ||||||||
| Samsung Electronics Co. Ltd. | 65 | 75,595 | ||||||
| Spain — 2.6% | ||||||||
| Grupo Catalana Occidente S.A. | 1,797 | 56,911 | ||||||
| Sweden — 1.2% | ||||||||
| Intrum AB | 1,939 | 26,578 | ||||||
| United Kingdom — 9.5% | ||||||||
| Ashtead Group plc | 1,734 | 105,864 | ||||||
| Babcock International Group plc (a) | 7,886 | 27,256 | ||||||
| Liberty Global plc - Series C (a) | 3,825 | 79,101 | ||||||
| 212,221 | ||||||||
| Total Common Stocks (Cost $2,143,299) | $ | 2,199,981 | ||||||
| MONEY MARKET FUNDS — 0.7% | Shares | Value | ||||||
| Invesco Short-Term Investments Trust - Institutional Class, 3.76% (b) (Cost $15,869) | 15,869 | $ | 15,869 | |||||
| Investments at Value — 99.6% (Cost $2,159,168) | $ | 2,215,850 | ||||||
| Other Assets in Excess of Liabilities — 0.4% | 8,720 | |||||||
| Net Assets — 100.0% | $ | 2,224,570 | ||||||
AB - Aktiebolag
ADR - American Depositary Receipt
AG - Aktiengesellschaft
N.V. - Naamloze Vennootschap
OYJ - Julkinen Osakeyhtio
plc - Public Limited Company
S.A. - Societe Anonyme
SE - Societe Europaea
| (a) | Non-income producing security. |
| (b) | The rate shown is the 7-day effective yield as of November 30, 2022. |
See accompanying notes to financial statements.
15
| LYRICAL INTERNATIONAL VALUE EQUITY FUND |
| SCHEDULE OF INVESTMENTS (Continued) |
| % of | ||||
| Common Stocks by Sector/Industry | Net Assets | |||
| Communications — 10.1% | ||||
| Cable & Satellite | 3.6 | % | ||
| Entertainment Content | 5.2 | % | ||
| Internet Media & Services | 1.3 | % | ||
| Consumer Discretionary — 9.4% | ||||
| Automotive | 5.8 | % | ||
| Leisure Facilities & Services | 3.6 | % | ||
| Consumer Staples — 6.9% | ||||
| Retail - Consumer Staples | 3.0 | % | ||
| Wholesale - Consumer Staples | 3.9 | % | ||
| Energy — 4.0% | ||||
| Oil & Gas Producers | 4.0 | % | ||
| Financials — 21.3% | ||||
| Asset Management | 4.5 | % | ||
| Institutional Financial Services | 4.3 | % | ||
| Insurance | 6.8 | % | ||
| Specialty Finance | 5.7 | % | ||
| Industrials — 31.2% | ||||
| Commercial Support Services | 1.6 | % | ||
| Diversified Industrials | 4.7 | % | ||
| Engineering & Construction | 4.7 | % | ||
| Industrial Support Services | 12.3 | % | ||
| Machinery | 6.7 | % | ||
| Transportation & Logistics | 1.2 | % | ||
| Materials — 4.3% | ||||
| Chemicals | 2.7 | % | ||
| Containers & Packaging | 1.6 | % | ||
| Technology — 11.7% | ||||
| Software | 1.1 | % | ||
| Technology Hardware | 10.6 | % | ||
| 98.9 | % | |||
See accompanying notes to financial statements.
16
| LYRICAL FUNDS |
| STATEMENTS OF ASSETS AND LIABILITIES |
| November 30, 2022 |
| Lyrical | Lyrical | |||||||
| U.S. Value | International | |||||||
| Equity Fund | Value Equity Fund | |||||||
| ASSETS | ||||||||
| Investments in securities: | ||||||||
| At cost | $ | 579,504,539 | $ | 2,159,168 | ||||
| At value (Note 2) | $ | 671,090,415 | $ | 2,215,850 | ||||
| Receivable for capital shares sold | 1,574,537 | — | ||||||
| Receivable for securities sold | 4,909,735 | — | ||||||
| Receivable from Adviser (Note 4) | — | 24,995 | ||||||
| Dividends receivable | 816,076 | 3,066 | ||||||
| Tax reclaims receivable | — | 131 | ||||||
| Other assets | 34,686 | 4,898 | ||||||
| Total assets | 678,425,449 | 2,248,940 | ||||||
| LIABILITIES | ||||||||
| Distributions Payable | 10,762,150 | — | ||||||
| Payable for capital shares redeemed | 4,040,441 | 169 | ||||||
| Payable to Adviser (Note 4) | 439,401 | — | ||||||
| Payable to administrator (Note 4) | 74,105 | 12,017 | ||||||
| Accrued distribution fees (Note 4) | 7,486 | 26 | ||||||
| Other accrued expenses | 21,635 | 12,158 | ||||||
| Total liabilities | 15,345,218 | 24,370 | ||||||
| NET ASSETS | $ | 663,080,231 | $ | 2,224,570 | ||||
| NET ASSETS CONSIST OF: | ||||||||
| Paid-in capital | $ | 602,555,646 | $ | 2,197,828 | ||||
| Distributable earnings | 60,524,585 | 26,742 | ||||||
| NET ASSETS | $ | 663,080,231 | $ | 2,224,570 | ||||
| NET ASSET VALUE PER SHARE: | ||||||||
| INSTITUTIONAL CLASS | ||||||||
| Net assets applicable to Institutional Class | $ | 655,277,117 | $ | 1,266,089 | ||||
| Institutional Class shares of beneficial interest outstanding (unlimited number of shares authorized, no par value) | 34,196,349 | 113,128 | ||||||
| Net asset value, offering price and redemption price per share (Note 2) | $ | 19.16 | $ | 11.19 | ||||
| INVESTOR CLASS | ||||||||
| Net assets applicable to Investor Class | $ | 7,758,266 | $ | 947,099 | ||||
| Investor Class shares of beneficial interest outstanding (unlimited number of shares authorized, no par value) | 408,481 | 85,064 | ||||||
| Net asset value, offering price and redemption price per share (Note 2) | $ | 18.99 | $ | 11.13 | ||||
See accompanying notes to financial statements.
17
| LYRICAL FUNDS |
| STATEMENTS OF ASSETS AND LIABILITIES |
| November 30, 2022 (Continued) |
| Lyrical | Lyrical | |||||||
| U.S. Value | International | |||||||
| Equity Fund | Value Equity Fund | |||||||
| NET ASSET VALUE PER SHARE: | ||||||||
| A Class | ||||||||
| Net assets applicable to A Class | $ | 13,939 | $ | 5,700 | ||||
| A Class shares of beneficial interest outstanding (unlimited number of shares authorized, no par value) | 728 | 510 | ||||||
| Net asset value and redemption price per share (Note 2) | $ | 19.14 | (a) | $ | 11.18 | |||
| Maximum sales charge | 5.75 | % | 5.75 | % | ||||
| Maximum offering price per share (Note 2) | $ | 20.31 | $ | 11.86 | ||||
| C Class | ||||||||
| Net assets applicable to C Class | $ | 30,909 | $ | 5,682 | ||||
| C Class shares of beneficial interest outstanding (unlimited number of shares authorized, no par value) | 1,620 | 510 | ||||||
| Net asset value, offering price and redemption price per share (Note 2) | $ | 19.08 | $ | 11.15 | (a) | |||
| Redemption price per share with CDSC fee (Note 2)(b) | $ | 18.89 | $ | 11.04 | ||||
| (a) | Net Assets divided by Shares do not calculate to the stated Net asset value because Net Assets and Shares are shown rounded. |
| (b) | A contingent deferred sales charge (“CDSC”) of 1.00% is charged on Class C shares redeemed within one year of purchase. Redemption price per share is equal to net asset value less any redemption fee or CDSC. |
See accompanying notes to financial statements.
18
| LYRICAL FUNDS |
| STATEMENTS OF OPERATIONS |
| Year Ended November 30, 2022 |
| Lyrical | Lyrical | |||||||
| U.S. Value | International | |||||||
| Equity Fund | Value Equity Fund | |||||||
| INVESTMENT INCOME | ||||||||
| Dividend income | $ | 9,518,740 | $ | 49,994 | ||||
| Foreign witholding taxes on dividends | (230,816 | ) | (6,177 | ) | ||||
| Total investment income | 9,287,924 | 43,817 | ||||||
| EXPENSES | ||||||||
| Investment advisory fees (Note 4) | 5,865,140 | 18,676 | ||||||
| Administration fees (Note 4) | 532,237 | 29,250 | ||||||
| Transfer agent fees (Note 2 and 4) | 187,414 | 34,000 | ||||||
| Fund accounting fees (Note 4) | 101,138 | 46,470 | ||||||
| Registration and filing fees (Note 2) | 71,266 | 15,005 | ||||||
| Compliance fees (Note 4) | 70,953 | 12,000 | ||||||
| Custody and bank service fees | 53,541 | 22,785 | ||||||
| Legal fees | 36,215 | 29,060 | ||||||
| Trustees’ fees and expenses (Note 4) | 18,873 | 18,889 | ||||||
| Audit and tax services fees | 16,610 | 16,911 | ||||||
| Postage and supplies | 28,317 | 3,992 | ||||||
| Printing of shareholder reports | 19,458 | 10,815 | ||||||
| Networking fees | 30,166 | 96 | ||||||
| Distribution fees (Note 2 and 4) | 20,318 | 2,397 | ||||||
| Insurance expense | 8,982 | 3,277 | ||||||
| Other expenses | 16,729 | 23,217 | ||||||
| Total expenses | 7,077,357 | 286,840 | ||||||
| Less fees reduced and/or expenses reimbursed by Adviser (Note 4) | (225,900 | ) | (262,691 | ) | ||||
| Net expenses | 6,851,457 | 24,149 | ||||||
| NET INVESTMENT INCOME | 2,436,467 | 19,668 | ||||||
| REALIZED AND UNREALIZED GAINS (LOSSES) ON INVESTMENTS AND FOREIGN CURRENCIES | ||||||||
| Net realized gains (losses) from investment transactions | 35,705,756 | (25,807 | ) | |||||
| Net realized losses from foreign currency transactions (Note 2) | (19,887 | ) | (2,524 | ) | ||||
| Net change in unrealized appreciation (depreciation) on investments | (89,054,197 | ) | (150,999 | ) | ||||
| Net change in unrealized appreciation (depreciation) on foreign currency translation | — | 168 | ||||||
| NET REALIZED AND UNREALIZED LOSSES ON INVESTMENTS AND FOREIGN CURRENCIES | (53,368,328 | ) | (179,162 | ) | ||||
| NET DECREASE IN NET ASSETS RESULTING FROM OPERATIONS | $ | (50,931,861 | ) | $ | (159,494 | ) | ||
See accompanying notes to financial statements.
19
| LYRICAL U.S. VALUE EQUITY FUND |
| STATEMENTS OF CHANGES IN NET ASSETS |
| Year/Period | Year | |||||||
| Ended | Ended | |||||||
| November 30, | November 30, | |||||||
| 2022(a) | 2021 | |||||||
| FROM OPERATIONS | ||||||||
| Net investment income | $ | 2,436,467 | $ | 763,379 | ||||
| Net realized gains from investment transactions | 35,705,756 | 28,426,263 | ||||||
| Net realized losses from foreign currency transactions | (19,887 | ) | (3,011 | ) | ||||
| Net change in unrealized appreciation (depreciation) on investments | (89,054,197 | ) | 85,027,927 | |||||
| Net increase (decrease) in net assets resulting from operations | (50,931,861 | ) | 114,214,558 | |||||
| FROM DISTRIBUTIONS TO SHAREHOLDERS (Note 2) | ||||||||
| Institutional Class | (32,015,143 | ) | (2,695,258 | ) | ||||
| Investor Class | (365,422 | ) | (28,364 | ) | ||||
| A Class | (649 | ) | — | |||||
| C Class | (1,456 | ) | — | |||||
| Decrease in net assets from distributions to shareholders | (32,382,670 | ) | (2,723,622 | ) | ||||
| CAPITAL SHARE TRANSACTIONS | ||||||||
| Institutional Class | ||||||||
| Proceeds from shares sold | 228,168,460 | 330,798,300 | ||||||
| Net asset value of shares issued in reinvestment of distributions to shareholders | 20,933,647 | 1,740,431 | ||||||
| Payments for shares redeemed | (207,336,929 | ) | (73,789,282 | ) | ||||
| Net increase in Institutional Class net assets from capital share transactions | 41,765,178 | 258,749,449 | ||||||
| Investor Class | ||||||||
| Proceeds from shares sold | 3,176,497 | 3,033,624 | ||||||
| Net asset value of shares issued in reinvestment of distributions to shareholders | 294,749 | 22,698 | ||||||
| Payments for shares redeemed | (3,002,926 | ) | (1,214,593 | ) | ||||
| Net increase in Investor Class net assets from capital share transactions | 468,320 | 1,841,729 | ||||||
| A Class | ||||||||
| Proceeds from shares sold | 12,505 | — | ||||||
| Net asset value of shares issued in reinvestment of distributions to shareholders | 649 | — | ||||||
| Net increase in A Class net assets from capital share transactions | 13,154 | — | ||||||
| C Class | ||||||||
| Proceeds from shares sold | 29,900 | — | ||||||
| Net asset value of shares issued in reinvestment of distributions to shareholders | 1,168 | — | ||||||
| Net increase in C Class net assets from capital share transactions | 31,068 | — | ||||||
| TOTAL INCREASE (DECREASE) IN NET ASSETS | (41,036,811 | ) | 372,082,114 | |||||
20
| LYRICAL U.S. VALUE EQUITY FUND |
| STATEMENTS OF CHANGES IN NET ASSETS (Continued) |
| Year/Period | Year | |||||||
| Ended | Ended | |||||||
| November 30, | November 30, | |||||||
| 2022(a) | 2021 | |||||||
| NET ASSETS | ||||||||
| Beginning of year | $ | 704,117,042 | $ | 332,034,928 | ||||
| End of year | $ | 663,080,231 | $ | 704,117,042 | ||||
| CAPITAL SHARE ACTIVITY | ||||||||
| Institutional Class | ||||||||
| Shares sold | 11,152,241 | 16,150,730 | ||||||
| Shares issued in reinvestment of distributions to shareholders | 1,087,720 | 99,170 | ||||||
| Shares redeemed | (10,280,853 | ) | (3,621,576 | ) | ||||
| Net increase in shares outstanding | 1,959,108 | 12,628,324 | ||||||
| Shares outstanding at beginning of year | 32,237,241 | 19,608,917 | ||||||
| Shares outstanding at end of year | 34,196,349 | 32,237,241 | ||||||
| Investor Class | ||||||||
| Shares sold | 156,531 | 146,784 | ||||||
| Shares issued in reinvestment of distributions to shareholders | 15,521 | 1,299 | ||||||
| Shares redeemed | (149,533 | ) | (58,799 | ) | ||||
| Net increase in shares outstanding | 22,519 | 89,284 | ||||||
| Shares outstanding at beginning of year | 385,962 | 296,678 | ||||||
| Shares outstanding at end of year | 408,481 | 385,962 | ||||||
| A Class | ||||||||
| Shares sold | 694 | — | ||||||
| Shares issued in reinvestment of distributions to shareholders | 34 | — | ||||||
| Net increase in shares outstanding | 728 | — | ||||||
| Shares outstanding at beginning of period | — | — | ||||||
| Shares outstanding at end of period | 728 | — | ||||||
| C Class | ||||||||
| Shares sold | 1,559 | — | ||||||
| Shares issued in reinvestment of distributions to shareholders | 61 | — | ||||||
| Net increase in shares outstanding | 1,620 | — | ||||||
| Shares outstanding at beginning of period | — | — | ||||||
| Shares outstanding at end of period | 1,620 | — | ||||||
| (a) | For A Class shares and C Class shares, represents the period from commencement of operations (July 5, 2022) through November 30, 2022. |
See accompanying notes to financial statements.
21
| LYRICAL INTERNATIONAL VALUE EQUITY FUND |
| STATEMENTS OF CHANGES IN NET ASSETS |
| Year/Period | Year | |||||||
| Ended | Ended | |||||||
| November 30, | November 30, | |||||||
| 2022(a) | 2021 | |||||||
| FROM OPERATIONS | ||||||||
| Net investment income | $ | 19,668 | $ | 5,768 | ||||
| Net realized gains (losses) from investment transactions | (25,807 | ) | 158,722 | |||||
| Net realized losses from foreign currency transactions | (2,524 | ) | (2,691 | ) | ||||
| Net change in unrealized appreciation (depreciation) on investments | (150,999 | ) | 25,382 | |||||
| Net change in unrealized appreciation (depreciation) on foreign currency translation | 168 | (90 | ) | |||||
| Net increase (decrease) in net assets resulting from operations | (159,494 | ) | 187,091 | |||||
| FROM DISTRIBUTIONS TO SHAREHOLDERS (Note 2) | ||||||||
| Institutional Class | (1,356 | ) | (75,876 | ) | ||||
| Investor Class | (1,020 | ) | (63,370 | ) | ||||
| A Class | (6 | ) | — | |||||
| C Class | (6 | ) | — | |||||
| Decrease in net assets from distributions to shareholders | (2,388 | ) | (139,246 | ) | ||||
| CAPITAL SHARE TRANSACTIONS | ||||||||
| Institutional Class | ||||||||
| Proceeds from shares sold | 238,165 | 659,808 | ||||||
| Net asset value of shares issued in reinvestment of distributions to shareholders | 1,356 | 75,876 | ||||||
| Payments for shares redeemed | (243,923 | ) | (8,813 | ) | ||||
| Net increase (decrease) in Institutional Class net assets from captial share transactions | (4,402 | ) | 726,871 | |||||
| Investor Class | ||||||||
| Proceeds from shares sold | 71,533 | 712,602 | ||||||
| Net asset value of shares issued in reinvestment of distributions to shareholders | 1,020 | 63,370 | ||||||
| Payments for shares redeemed | (173,241 | ) | (345,518 | ) | ||||
| Net increase (decrease) in Investor Class net assets from capital share transactions | (100,688 | ) | 430,454 | |||||
| A Class | ||||||||
| Proceeds from shares sold | 5,000 | — | ||||||
| Net asset value of shares issued in reinvestment of distributions to shareholders | 6 | — | ||||||
| Net increase in A Class net assets from capital share transactions | 5,006 | — | ||||||
| C Class | ||||||||
| Proceeds from shares sold | 5,000 | — | ||||||
| Net asset value of shares issued in reinvestment of distributions to shareholders | 6 | — | ||||||
| Net increase in C Class net assets from capital share transactions | 5,006 | — | ||||||
| TOTAL INCREASE (DECREASE) IN NET ASSETS | (256,960 | ) | 1,205,170 | |||||
22
| LYRICAL INTERNATIONAL VALUE EQUITY FUND |
| STATEMENTS OF CHANGES IN NET ASSETS (Continued) |
| Year/Period | Year | |||||||
| Ended | Ended | |||||||
| November 30, | November 30, | |||||||
| 2022(a) | 2021 | |||||||
| NET ASSETS | ||||||||
| Beginning of year | $ | 2,481,530 | $ | 1,276,360 | ||||
| End of year | $ | 2,224,570 | $ | 2,481,530 | ||||
| CAPITAL SHARE ACTIVITY | ||||||||
| Institutional Class | ||||||||
| Shares sold | 19,901 | 51,299 | ||||||
| Shares issued in reinvestment of distributions to shareholders | 121 | 6,317 | ||||||
| Shares redeemed | (19,456 | ) | (732 | ) | ||||
| Net increase in shares outstanding | 566 | 56,884 | ||||||
| Shares outstanding at beginning of year | 112,562 | 55,678 | ||||||
| Shares outstanding at end of year | 113,128 | 112,562 | ||||||
| Investor Class | ||||||||
| Shares sold | 6,518 | 54,243 | ||||||
| Shares issued in reinvestment of distributions to shareholders | 92 | 5,287 | ||||||
| Shares redeemed | (15,454 | ) | (25,897 | ) | ||||
| Net increase (decrease) in shares outstanding | (8,844 | ) | 33,633 | |||||
| Shares outstanding at beginning of year | 93,908 | 60,275 | ||||||
| Shares outstanding at end of year | 85,064 | 93,908 | ||||||
| A Class | ||||||||
| Shares sold | 509 | — | ||||||
| Shares issued in reinvestment of distributions to shareholders | 1 | — | ||||||
| Net increase (decrease) in shares outstanding | 510 | — | ||||||
| Shares outstanding at beginning of period | — | — | ||||||
| Shares outstanding at end of period | 510 | — | ||||||
| C Class | ||||||||
| Shares sold | 509 | — | ||||||
| Shares issued in reinvestment of distributions to shareholders | 1 | — | ||||||
| Net increase (decrease) in shares outstanding | 510 | — | ||||||
| Shares outstanding at beginning of period | — | — | ||||||
| Shares outstanding at end of period | 510 | — | ||||||
| (a) | For A Class shares and C Class shares, represents the period from commencement of operations (July 5, 2022) through November 30, 2022. |
See accompanying notes to financial statements.
23
| LYRICAL U.S. VALUE EQUITY FUND |
| INSTITUTIONAL CLASS |
| FINANCIAL HIGHLIGHTS |
Per Share Data for a Share Outstanding Throughout Each Year:
| Year | Year | Year | Year | Year | ||||||||||||||||
| Ended | Ended | Ended | Ended | Ended | ||||||||||||||||
| Nov. 30, | Nov. 30, | Nov. 30, | Nov. 30, | Nov. 30, | ||||||||||||||||
| 2022 | 2021 | 2020 | 2019 | 2018 | ||||||||||||||||
| Net asset value at beginning of year | $ | 21.59 | $ | 16.68 | $ | 15.91 | $ | 15.55 | $ | 18.62 | ||||||||||
| Income (loss) from investment operations: | ||||||||||||||||||||
| Net investment income (a) | 0.07 | 0.03 | 0.10 | 0.05 | 0.03 | |||||||||||||||
| Net realized and unrealized gains (losses) on investments and foreign currencies | (1.54 | ) | 5.02 | 0.72 | (b) | 0.76 | (1.70 | ) | ||||||||||||
| Total from investment operations | (1.47 | ) | 5.05 | 0.82 | 0.81 | (1.67 | ) | |||||||||||||
| Less distributions from: | ||||||||||||||||||||
| Net investment income | (0.03 | ) | (0.14 | ) | (0.05 | ) | (0.05 | ) | (0.01 | ) | ||||||||||
| Net realized gains | (0.93 | ) | — | — | (0.40 | ) | (1.39 | ) | ||||||||||||
| Total distributions | (0.96 | ) | (0.14 | ) | (0.05 | ) | (0.45 | ) | (1.40 | ) | ||||||||||
| Net asset value at end of year | $ | 19.16 | $ | 21.59 | $ | 16.68 | $ | 15.91 | $ | 15.55 | ||||||||||
| Total return (c) | (6.81 | %) | 30.44 | % | 5.16 | % | 5.03 | % | (9.02 | %) | ||||||||||
| Net assets at end of year (000’s) | $ | 655,277 | $ | 695,847 | $ | 327,121 | $ | 617,686 | $ | 907,366 | ||||||||||
| Ratios/supplementary data: | ||||||||||||||||||||
| Ratio of total expenses to average net assets | 1.02 | % | 1.01 | % | 1.25 | % | 1.41 | % | 1.37 | % | ||||||||||
| Ratio of net expenses to average net assets | 0.99 | % (d) | 0.99 | % (d) | 1.22 | % (d) | 1.41 | % | 1.37 | % | ||||||||||
| Ratio of net investment income to average net assets | 0.36 | % (d) | 0.13 | % (d) | 0.73 | % (d) | 0.36 | % | 0.17 | % | ||||||||||
| Portfolio turnover rate (e) | 24 | % | 14 | % | 30 | % | 33 | % | 39 | % | ||||||||||
| (a) | Per share net investment income has been determined on the basis of average number of shares outstanding during the period. |
| (b) | Represents a balancing figure derived from other amounts in the financial highlights table that captures all other changes affecting net asset value per share. This per share amount does not correlate to the aggregate of the net realized and unrealized losses on the Statements of Operations for the same year. |
| (c) | Total return is a measure of the change in value of an investment in the Fund over the periods covered. The returns shown do not reflect the deduction of taxes a shareholder would pay on Fund distributions, if any, or the redemption of Fund shares. The total return would have been lower if the Adviser had not reduced fees (Note 4). |
| (d) | Ratio was determined after fee reductions and/or expense reimbursements (Note 4). |
| (e) | Portfolio turnover is calculated on the basis on the Fund as a whole without distinguishing among the classes of shares. |
See accompanying notes to financial statements.
24
| LYRICAL U.S. VALUE EQUITY FUND |
| INVESTOR CLASS |
| FINANCIAL HIGHLIGHTS |
Per Share Data for a Share Outstanding Throughout Each Year:
| Year | Year | Year | Year | Year | ||||||||||||||||
| Ended | Ended | Ended | Ended | Ended | ||||||||||||||||
| Nov. 30, | Nov. 30, | Nov. 30, | Nov. 30, | Nov. 30, | ||||||||||||||||
| 2022 | 2021 | 2020 | 2019 | 2018 | ||||||||||||||||
| Net asset value at beginning of year | $ | 21.43 | $ | 16.56 | $ | 15.78 | $ | 15.43 | $ | 18.54 | ||||||||||
| Income (loss) from investment operations: | ||||||||||||||||||||
| Net investment income (loss) (a) | 0.02 | (0.02 | ) | 0.07 | 0.02 | (0.03 | ) | |||||||||||||
| Net realized and unrealized gains (losses) on investments and foreign currencies | (1.53 | ) | 4.98 | 0.71 | (b) | 0.73 | (1.69 | ) | ||||||||||||
| Total from investment operations | (1.51 | ) | 4.96 | 0.78 | 0.75 | (1.72 | ) | |||||||||||||
| Less distributions from: | ||||||||||||||||||||
| Net investment income | — | (0.09 | ) | — | — | — | ||||||||||||||
| Net realized gains | (0.93 | ) | — | — | (0.40 | ) | (1.39 | ) | ||||||||||||
| Total distributions | (0.93 | ) | (0.09 | ) | — | (0.40 | ) | (1.39 | ) | |||||||||||
| Net asset value at end of year | $ | 18.99 | $ | 21.43 | $ | 16.56 | $ | 15.78 | $ | 15.43 | ||||||||||
| Total return (c) | (7.03 | %) | 30.10 | % | 4.94 | % | 4.89 | % | (9.30 | %) | ||||||||||
| Net assets at end of year (000’s) | $ | 7,758 | $ | 8,270 | $ | 4,914 | $ | 6,682 | $ | 19,811 | ||||||||||
| Ratios/supplementary data: | ||||||||||||||||||||
| Ratio of total expenses to average net assets | 1.74 | % | 1.79 | % | 2.02 | % | 2.03 | % | 1.72 | % | ||||||||||
| Ratio of net expenses to average net assets (d) | 1.24 | % | 1.24 | % | 1.44 | % | 1.70 | % | 1.70 | % | ||||||||||
| Ratio of net investment income (loss) to average net assets (d) | 0.10 | % | (0.12 | %) | 0.53 | % | 0.10 | % | (0.18 | %) | ||||||||||
| Portfolio turnover rate (e) | 24 | % | 14 | % | 30 | % | 33 | % | 39 | % | ||||||||||
| (a) | Per share net investment income (loss) has been determined on the basis of average number of shares outstanding during the period. |
| (b) | Represents a balancing figure derived from other amounts in the financial highlights table that captures all other changes affecting net asset value per share. This per share amount does not correlate to the aggregate of the net realized and unrealized losses on the Statements of Operations for the same year. |
| (c) | Total return is a measure of the change in value of an investment in the Fund over the periods covered. The returns shown do not reflect the deduction of taxes a shareholder would pay on Fund distributions, if any, or the redemption of Fund shares. The total returns would be lower if the Adviser had not reduced fees (Note 4). |
| (d) | Ratio was determined after fee reductions and/or expense reimbursements (Note 4). |
| (e) | Portfolio turnover is calculated on the basis on the Fund as a whole without distinguishing among the classes of shares. |
See accompanying notes to financial statements.
25
| LYRICAL U.S. VALUE EQUITY FUND |
| A CLASS |
| FINANCIAL HIGHLIGHTS |
Per Share Data for a Share Outstanding Throughout The Period:
| Period | ||||
| Ended | ||||
| Nov. 30, | ||||
| 2022 (a) | ||||
| Net asset value at beginning of period | $ | 18.23 | ||
| Income from investment operations: | ||||
| Net investment income (b) | 0.03 | |||
| Net realized and unrealized gains on investments and foreign currencies | 1.81 | (c) | ||
| Total from investment operations | 1.84 | |||
| Less distributions from: | ||||
| Net realized gains | (0.93 | ) | ||
| Net asset value at end of period | $ | 19.14 | ||
| Total return (d) | 10.12 | % (e) | ||
| Net assets at end of period (000’s) | $ | 14 | ||
| Ratios/supplementary data: | ||||
| Ratio of total expenses to average net assets | 176.77 | % (f) | ||
| Ratio of net expenses to average net assets (g) | 1.24 | % (f) | ||
| Ratio of net investment income to average net assets (g) | 0.36 | % (f) | ||
| Portfolio turnover rate (h) | 24 | % | ||
| (a) | Represents the period from the commencement of operations (July 5, 2022) through November 30, 2022. |
| (b) | Per share net investment income (loss) has been determined on the basis of average number of shares outstanding during the period. |
| (c) | Represents a balancing figure derived from other amounts in the financial highlights table that captures all other changes affecting net asset value per share. This per share amount does not correlate to the aggregate of the net realized and unrealized losses on the Statements of Operations for the same year. |
| (d) | Total return is a measure of the change in value of an investment in the Fund over the period covered. The return shown does not reflect the deduction of taxes a shareholder would pay on Fund distributions, if any, or the redemption of Fund shares. The total returns would be lower if the Adviser had not reduced fees (Note 4). Calculation does not reflect sales load. |
| (e) | Not annualized. |
| (f) | Annualized. |
| (g) | Ratio was determined after fee reductions and/or expense reimbursements (Note 4). |
| (h) | Portfolio turnover is calculated on the basis on the Fund as a whole without distinguishing among the classes of shares. |
See accompanying notes to financial statements.
26
| LYRICAL U.S. VALUE EQUITY FUND |
| C CLASS |
| FINANCIAL HIGHLIGHTS |
Per Share Data for a Share Outstanding Throughout The Period:
| Period | ||||
| Ended | ||||
| Nov. 30, | ||||
| 2022 (a) | ||||
| Net asset value at beginning of period | $ | 18.23 | ||
| Income from investment operations: | ||||
| Net investment loss (b) | (0.03 | ) | ||
| Net realized and unrealized gains on investments and foreign currencies | 1.81 | (c) | ||
| Total from investment operations | 1.78 | |||
| Less distributions from: | ||||
| Net realized gains | (0.93 | ) | ||
| Net asset value at end of period | $ | 19.08 | ||
| Total return (d) | 9.79 | % (e) | ||
| Net assets at end of period (000’s) | $ | 31 | ||
| Ratios/supplementary data: | ||||
| Ratio of total expenses to average net assets | 196.90 | % (f) | ||
| Ratio of net expenses to average net assets (g) | 1.99 | % (f) | ||
| Ratio of net investment loss to average net assets (g) | (0.36 | %) (f) | ||
| Portfolio turnover rate (h) | 24 | % | ||
| (a) | Represents the period from the commencement of operations (July 5, 2022) through November 30, 2022. |
| (b) | Per share net investment income (loss) has been determined on the basis of average number of shares outstanding during the period. |
| (c) | Represents a balancing figure derived from other amounts in the financial highlights table that captures all other changes affecting net asset value per share. This per share amount does not correlate to the aggregate of the net realized and unrealized losses on the Statements of Operations for the same year. |
| (d) | Total return is a measure of the change in value of an investment in the Fund over the period covered. The return shown does not reflect the deduction of taxes a shareholder would pay on Fund distributions, if any, or the redemption of Fund shares. The total returns would be lower if the Adviser had not reduced fees (Note 4). Calculation does not reflect CDSC. |
| (e) | Not annualized. |
| (f) | Annualized. |
| (g) | Ratio was determined after fee reductions and/or expense reimbursements (Note 4). |
| (h) | Portfolio turnover is calculated on the basis on the Fund as a whole without distinguishing among the classes of shares. |
See accompanying notes to financial statements.
27
| LYRICAL INTERNATIONAL VALUE EQUITY FUND |
| INSTITUTIONAL CLASS |
| FINANCIAL HIGHLIGHTS |
Per Share Data for a Share Outstanding Throughout Each Period:
| Year | Year | Period | ||||||||||
| Ended | Ended | Ended | ||||||||||
| Nov. 30, | Nov. 30, | Nov. 30, | ||||||||||
| 2022 | 2021 | 2020 (a) | ||||||||||
| Net asset value at beginning of period | $ | 12.03 | $ | 11.02 | $ | 10.00 | ||||||
| Income from investment operations: | ||||||||||||
| Net investment income (b) | 0.11 | 0.05 | 0.05 | |||||||||
| Net realized and unrealized gains (losses) on investments and foreign currencies | (0.94 | ) | 1.69 | 0.97 | ||||||||
| Total from investment operations | (0.83 | ) | 1.74 | 1.02 | ||||||||
| Less distributions from: | ||||||||||||
| Net investment income | — | (0.05 | ) | — | ||||||||
| Net realized gains | (0.01 | ) | (0.68 | ) | — | |||||||
| Total distributions | (0.01 | ) | (0.73 | ) | — | |||||||
| Net asset value at end of period | $ | 11.19 | $ | 12.03 | $ | 11.02 | ||||||
| Total return (c) | (6.88 | %) | 15.84 | % | 10.20 | % (d) | ||||||
| Net assets at end of period (000’s) | $ | 1,266 | $ | 1,355 | $ | 613 | ||||||
| Ratios/supplementary data: | ||||||||||||
| Ratio of total expenses to average net assets | 12.32 | % | 11.34 | % | 21.16 | % (e) | ||||||
| Ratio of net expenses to average net assets (f) | 0.99 | % | 0.99 | % | 1.03 | % (e) | ||||||
| Ratio of net investment income to average net assets (f) | 1.00 | % | 0.36 | % | 0.72 | % (e) | ||||||
| Portfolio turnover rate (g) | 33 | % | 34 | % | 25 | % (d) | ||||||
| (a) | Represents the period from the commencement of operations (March 2, 2020) through November 30, 2020. |
| (b) | Per share net investment income has been determined on the basis of average number of shares outstanding during the period. |
| (c) | Total return is a measure of the change in value of an investment in the Fund over the periods covered. The returns shown do not reflect the deduction of taxes a shareholder would pay on Fund distributions, if any, or the redemption of Fund shares. The total returns would have been lower if the Adviser had not reduced fees and reimbursed expenses (Note 4). |
| (d) | Not annualized. |
| (e) | Annualized. |
| (f) | Ratio was determined after fee reductions and/or expense reimbursements (Note 4). |
| (g) | Portfolio turnover is calculated on the basis on the Fund as a whole without distinguishing among the classes of shares. |
See accompanying notes to financial statements.
28
| LYRICAL INTERNATIONAL VALUE EQUITY FUND |
| INVESTOR CLASS |
| FINANCIAL HIGHLIGHTS |
Per Share Data for a Share Outstanding Throughout Each Period:
| Year | Year | Period | ||||||||||
| Ended | Ended | Ended | ||||||||||
| Nov. 30, | Nov. 30, | Nov. 30, | ||||||||||
| 2022 | 2021 | 2020 (a) | ||||||||||
| Net asset value at beginning of period | $ | 12.00 | $ | 11.00 | $ | 10.00 | ||||||
| Income from investment operations: | ||||||||||||
| Net investment income (b) | 0.08 | 0.02 | 0.04 | |||||||||
| Net realized and unrealized gains (losses) on investments and foreign currencies | (0.94 | ) | 1.69 | 0.96 | ||||||||
| Total from investment operations | (0.86 | ) | 1.71 | 1.00 | ||||||||
| Less distributions from: | ||||||||||||
| Net investment income | — | (0.03 | ) | — | ||||||||
| Net realized gains | (0.01 | ) | (0.68 | ) | — | |||||||
| Total distributions | (0.01 | ) | (0.71 | ) | — | |||||||
| Net asset value at end of period | $ | 11.13 | $ | 12.00 | $ | 11.00 | ||||||
| Total return (c) | (7.15 | %) | 15.60 | % | 10.00 | % (d) | ||||||
| Net assets at end of period (000’s) | $ | 947 | $ | 1,127 | $ | 663 | ||||||
| Ratios/supplementary data: | ||||||||||||
| Ratio of total expenses to average net assets | 12.90 | % | 11.70 | % | 21.14 | % (e) | ||||||
| Ratio of net expenses to average net assets (f) | 1.24 | % | 1.24 | % | 1.27 | % (e) | ||||||
| Ratio of net investment income to average net assets (f) | 0.76 | % | 0.16 | % | 0.52 | % (e) | ||||||
| Portfolio turnover rate (g) | 33 | % | 34 | % | 25 | % (d) | ||||||
| (a) | Represents the period from the commencement of operations (March 2, 2020) through November 30, 2020. |
| (b) | Per share net investment income has been determined on the basis of average number of shares outstanding during the period. |
| (c) | Total return is a measure of the change in value of an investment in the Fund over the periods covered. The returns shown do not reflect the deduction of taxes a shareholder would pay on Fund distributions, if any, or the redemption of Fund shares. The total returns would have been lower if the Adviser had not reduced fees and reimbursed expenses (Note 4). |
| (d) | Not annualized. |
| (e) | Annualized. |
| (f) | Ratio was determined after fee reductions and/or expense reimbursements (Note 4). |
| (g) | Portfolio turnover is calculated on the basis on the Fund as a whole without distinguishing among the classes of shares. |
See accompanying notes to financial statements.
29
| LYRICAL INTERNATIONAL VALUE EQUITY FUND |
| A CLASS |
| FINANCIAL HIGHLIGHTS |
Per Share Data for a Share Outstanding Throughout The Period:
| Period | ||||
| Ended | ||||
| Nov. 30, | ||||
| 2022 (a) | ||||
| Net asset value at beginning of period | $ | 9.82 | ||
| Income from investment operations: | ||||
| Net investment income (b) | 0.01 | |||
| Net realized and unrealized gains on investments and foreign currencies | 1.36 | (c) | ||
| Total from investment operations | 1.37 | |||
| Less distributions from: | ||||
| Net realized gains | (0.01 | ) | ||
| Net asset value at end of period | $ | 11.18 | ||
| Total return (d) | 13.97 | % (e) | ||
| Net assets at end of period (000’s) | $ | 6 | ||
| Ratios/supplementary data: | ||||
| Ratio of total expenses to average net assets | 264.21 | % (f) | ||
| Ratio of net expenses to average net assets (g) | 1.24 | % (f) | ||
| Ratio of net investment income to average net assets (g) | 0.14 | % (f) | ||
| Portfolio turnover rate (h) | 33 | % | ||
| (a) | Represents the period from the commencement of operations (July 5, 2022) through November 30, 2022. |
| (b) | Per share net investment income has been determined on the basis of average number of shares outstanding during the period. |
| (c) | Represents a balancing figure derived from other amounts in the financial highlights table that captures all other changes affecting net asset value per share. This per share amount does not correlate to the aggregate of the net realized and unrealized losses on the Statements of Operations for the same year. |
| (d) | Total return is a measure of the change in value of an investment in the Fund over the period covered. The return shown does not reflect the deduction of taxes a shareholder would pay on Fund distributions, if any, or the redemption of Fund shares. The total returns would be lower if the Adviser had not reduced fees and reimbursed expenses (Note 4). Calculation does not reflect sales load. |
| (e) | Not annualized. |
| (f) | Annualized. |
| (g) | Ratio was determined after fee reductions and/or expense reimbursements (Note 4). |
| (h) | Portfolio turnover is calculated on the basis on the Fund as a whole without distinguishing among the classes of shares. |
See accompanying notes to financial statements.
30
| LYRICAL INTERNATIONAL VALUE EQUITY FUND |
| C CLASS |
| FINANCIAL HIGHLIGHTS |
Per Share Data for a Share Outstanding Throughout The Period:
| Period | ||||
| Ended | ||||
| Nov. 30, | ||||
| 2022 (a) | ||||
| Net asset value at beginning of period | $ | 9.82 | ||
| Income from investment operations: | ||||
| Net investment loss (b) | (0.03 | ) | ||
| Net realized and unrealized gains on investments and foreign currencies | 1.37 | (c) | ||
| Total from investment operations | 1.34 | |||
| Less distributions from: | ||||
| Net realized gains | (0.01 | ) | ||
| Net asset value at end of period | $ | 11.15 | ||
| Total return (d) | 13.67 | % (e) | ||
| Net assets at end of period (000’s) | $ | 6 | ||
| Ratios/supplementary data: | ||||
| Ratio of total expenses to average net assets | 265.34 | % (f) | ||
| Ratio of net expenses to average net assets (g) | 1.99 | % (f) | ||
| Ratio of net investment loss to average net assets (g) | (0.60 | %) (f) | ||
| Portfolio turnover rate (h) | 33 | % | ||
| (a) | Represents the period from the commencement of operations (July 5, 2022) through Novemeber 30, 2022. |
| (b) | Per share net investment loss has been determined on the basis of average number of shares outstanding during the period. |
| (c) | Represents a balancing figure derived from other amounts in the financial highlights table that captures all other changes affecting net asset value per share. This per share amount does not correlate to the aggregate of the net realized and unrealized losses on the Statements of Operations for the same year. |
| (d) | Total return is a measure of the change in value of an investment in the Fund over the period covered. The return shown does not reflect the deduction of taxes a shareholder would pay on Fund distributions, if any, or the redemption of Fund shares. The total returns would be lower if the Adviser had not reduced fees and reimbursed expenses (Note 4). Calculation does not reflect CDSC. |
| (e) | Not annualized. |
| (f) | Annualized. |
| (g) | Ratio was determined after fee reductions and/or expense reimbursements (Note 4). |
| (h) | Portfolio turnover is calculated on the basis on the Fund as a whole without distinguishing among the classes of shares. |
See accompanying notes to financial statements.
31
| LYRICAL FUNDS |
| NOTES TO FINANCIAL STATEMENTS |
| November 30, 2022 |
1. Organization
Lyrical U.S. Value Equity Fund and Lyrical International Value Equity Fund (individually, a “Fund” and collectively, the “Funds”) are each a diversified series of Ultimus Managers Trust (the “Trust”), an open-end investment company established as an Ohio business trust under a Declaration of Trust dated February 28, 2012. Other series of the Trust are not incorporated in this report. Lyrical U.S. Value Equity Fund commenced operations on February 4, 2013. Lyrical International Value Equity Fund commenced operations on March 2, 2020.
The investment objective of each Fund is to seek to achieve long-term capital growth.
Each Fund currently offers four classes of shares: Institutional Class shares (sold without any sales loads and distribution and/or shareholder service fees and requiring a $100,000 initial investment), Investor Class shares (sold without any sales loads, but subject to a distribution and/or shareholder service fee of up to 0.25% of the average daily net assets attributable to Investor Class shares, and requiring a $2,500 initial investment), A Class shares (sold subject to an initial maximum front end sales load of 5.75% and a distribution and/or shareholder service fee of up to 0.25% of the average daily net assets attributable to A Class shares, and requiring a $1,000 initial investment and for purchases of $1,000,000 or more, a front end sales load is not charged, but a 1.00% contingent deferred sales charge (“CDSC”) may be charged if redeemed during the first 18 months), and C Class shares (sold subject to a CDSC fee of 1.00% if the shares are redeemed within 12 months after the original purchase of the shares and a distribution and/or shareholder servicing fee of up to 1.00% of the average daily net assets attributable to C Class shares, and requiring a $1,000 initial investment) (each a “Class”). Each share class represents an ownership interest in the same investment portfolio.
2. Significant Accounting Policies
The following is a summary of the Funds’ significant accounting policies. The policies are in conformity with accounting principles generally accepted in the United States of America (“GAAP”). The Funds follow accounting and reporting guidance under Financial Accounting Standards Board Accounting Standards Codification Topic 946, “Financial Services – Investment Companies.”
Securities valuation – Each Fund values its portfolio securities at market value as of the close of regular trading on the New York Stock Exchange (the “NYSE”) (normally 4:00 p.m. Eastern time) on each business day the NYSE is open for business. The Funds value their listed securities on the basis of the security’s last sale price on the security’s primary exchange, if available, otherwise at the exchange’s most recently quoted mean price. NASDAQ-listed securities are valued at the NASDAQ Official Closing Price. When using a quoted price and when the market is considered active, the security will be classified as Level 1 within the fair value hierarchy (see below). In the event that market quotations
32
| LYRICAL FUNDS |
| NOTES TO FINANCIAL STATEMENTS (Continued) |
are not readily available or are considered unreliable due to market or other events, the Funds value their securities and other assets at fair value in accordance with procedures adopted by the Board of Trustees (the “Board”). Under these procedures, the securities will be classified as Level 2 or 3 within the fair value hierarchy, depending on the inputs used. Unavailable or unreliable market quotes may be due to the following factors: a substantial bid-ask spread; infrequent sales resulting in stale prices; insufficient trading volume; small trade sizes; a temporary lapse in any reliable pricing source; and actions of the securities or futures markets, such as the suspension or limitation of trading. As a result, the prices of securities used to calculate each Fund’s net asset value (“NAV”) may differ from quoted or published prices for the same securities.
GAAP establishes a single authoritative definition of fair value, sets out a framework for measuring fair value, and requires additional disclosures about fair value measurements.
Various inputs are used in determining the value of each Fund’s investments. These inputs are summarized in the three broad levels listed below:
| ● | Level 1 – quoted prices in active markets for identical securities |
| ● | Level 2 – other significant observable inputs |
| ● | Level 3 – significant unobservable inputs |
The inputs or methods used for valuing securities are not necessarily an indication of the risks associated with investing in those securities. The inputs used to measure fair value may fall into different levels of the fair value hierarchy. In such cases, for disclosure purposes, the level in the fair value hierarchy within which the fair value measurement falls in its entirety is determined based on the lowest level input that is significant to the fair value measurement.
Lyrical International Value Equity Fund’s foreign equity securities actively traded in foreign markets may be classified as Level 2 despite the availability of closing prices because such securities are typically fair valued by an independent pricing service. The Board has authorized the Fund to retain an independent pricing service to determine the fair value of its foreign securities because the value of such securities may be materially affected by events occurring before the Fund’s pricing time but after the close of the primary markets or exchanges on which such foreign securities are traded. These intervening events might be country-specific (e.g., natural disaster, economic or political developments, interest rate change); issuer specific (e.g., earnings report or merger announcement); or U.S. market-specific (such as a significant movement in the U.S. market that is deemed to affect the value of foreign securities). The pricing service uses an automated system that incorporates a model based on multiple parameters, including a security’s local closing price, relevant general and sector indices, currency fluctuations, trading in depositary receipts and futures, if applicable, and/or research valuations by its staff, in determining what it believes is the fair value of the securities.
33
| LYRICAL FUNDS |
| NOTES TO FINANCIAL STATEMENTS (Continued) |
The following is a summary of each Fund’s investments by the inputs used to value the investments as of November 30, 2022:
| Lyrical U.S. Value Equity Fund | Level 1 | Level 2 | Level 3 | Total | ||||||||||||
| Common Stocks | $ | 665,172,419 | $ | — | $ | — | $ | 665,172,419 | ||||||||
| Money Market Funds | 5,917,996 | — | — | 5,917,996 | ||||||||||||
| Total | $ | 671,090,415 | $ | — | $ | — | $ | 671,090,415 | ||||||||
| Lyrical International Value Equity Fund | Level 1 | Level 2 | Level 3 | Total | ||||||||||||
| Common Stocks | $ | 702,959 | $ | 1,497,022 | * | $ | — | $ | 2,199,981 | |||||||
| Money Market Funds | 15,869 | — | — | 15,869 | ||||||||||||
| Total | $ | 718,828 | $ | 1,497,022 | $ | — | $ | 2,215,850 | ||||||||
| * | With respect to foreign equity securities that are principally traded on a market outside the United States, the Board has approved the utilization of an independent fair value pricing service to evaluate the effect of market fluctuations on these securities after the close of trading in that foreign market. To the extent that securities are valued using this service, they will be classified as Level 2 securities. |
Refer to each Fund’s Schedule of Investments for a listing of securities by sector and industry type or geographical region. The Funds did not hold any derivative instruments or any assets or liabilities that were measured at fair value on a recurring basis using significant unobservable inputs (Level 3) as of or during the year ended November 30, 2022.
Share valuation – The NAV per share of each class of each Fund is calculated daily by dividing the total value of the assets attributable to that class, less liabilities attributable to that class, by the number of shares outstanding of that class. The offering price and redemption price per share of each class of each Fund is equal to the NAV per share of such class.
Investment income – Dividend income is recorded on the ex-dividend date. Interest income is accrued as earned. Non-cash dividends included in dividend income, if any, are recorded at the fair value of the security received. Withholding taxes on foreign dividends have been recorded in accordance with the Funds’ understanding of the applicable country’s rules and tax rates.
Investment transactions – Investment transactions are accounted for on the trade date. Realized gains and losses on investments sold are determined on a specific identification basis.
Foreign currency translation – Securities and other assets and liabilities denominated in or expected to settle in foreign currencies, if any, are translated into U.S. dollars based on exchange rates on the following basis:
| A. | The fair values of investment securities and other assets and liabilities are translated as of the close of the NYSE each day. |
34
| LYRICAL FUNDS |
| NOTES TO FINANCIAL STATEMENTS (Continued) |
| B. | Purchases and sales of investment securities and income and expenses are translated at the rate of exchange prevailing as of 4:00 p.m. Eastern time on the respective date of such transactions. |
| C. | The Funds do not isolate that portion of the results of operations caused by changes in foreign exchange rates on investments from those caused by changes in market prices of securities held. Such fluctuations are included with the net realized and unrealized gains or losses on investments. |
Reported net realized foreign exchange gains or losses arise from 1) purchases and sales of foreign currencies, 2) currency gains or losses realized between trade and settlement dates on securities transactions, and 3) the difference between the amounts of dividends and foreign withholding taxes recorded on each Fund’s books and the U.S. dollar equivalent of the amounts actually received or paid. Reported net unrealized foreign exchange gains and losses arise from changes in the value of assets and liabilities other than investments in securities that result from changes in exchange rates.
Allocation between classes – Investment income earned, realized capital gains and losses, and unrealized appreciation and depreciation are allocated daily to each class of a Fund based upon its proportionate share of total net assets of that Fund. Class-specific expenses are charged directly to the class incurring the expense. Common expenses which are not attributable to a specific class are allocated daily to each class of shares of a Fund based upon its proportionate share of total net assets of that Fund. Distribution fees, registration and filing fees and transfer agent fees are class specific expenses. For the period ending November 30, 2022 class specific expenses were as follows:
| Lyrical U.S. Value Equity Fund | ||||||||||||||||||||
| Expenses | Institutional | Investor | A Class (a) | C Class (a) | Total | |||||||||||||||
| Distribution fees | $ | — | $ | 20,283 | $ | 8 | $ | 27 | $ | 20,318 | ||||||||||
| Registration and filing fees | 47,767 | 22,775 | 362 | 362 | 71,266 | |||||||||||||||
| Transfer agent fees | 159,099 | 18,315 | 5,000 | 5,000 | 187,414 | |||||||||||||||
| Lyrical International Value Equity Fund | ||||||||||||||||||||
| Expenses | ||||||||||||||||||||
| Distribution fees | $ | — | $ | 2,371 | $ | 5 | $ | 21 | $ | 2,397 | ||||||||||
| Registration and filing fees | 7,609 | 6,746 | 325 | 325 | 15,005 | |||||||||||||||
| Transfer agent fees | 12,000 | 12,000 | 5,000 | 5,000 | 34,000 | |||||||||||||||
| (a) | Represents for the period from the commencement of operation (July 5, 2022) through November 30, 2022. |
35
| LYRICAL FUNDS |
| NOTES TO FINANCIAL STATEMENTS (Continued) |
Common expenses – Common expenses of the Trust are allocated among the Funds and the other series of the Trust based on the relative net assets of each series, the number of series in the Trust, or the nature of the services performed and the relative applicability to each series.
Distributions to shareholders – Each Fund distributes to shareholders any net investment income dividends and net realized capital gains distributions at least once each year. The amount of such dividends and distributions are determined in accordance with federal income tax regulations, which may differ from GAAP. Dividends and distributions to shareholders are recorded on the ex-dividend date. The Funds may utilize earnings and profits distributed to shareholders on redemption of shares as part of the dividends paid deduction for income tax purposes. The tax character of distributions paid to shareholders by the Funds during the years ended November 30, 2022 and 2021 was as follows:
| Year | Ordinary | Long-Term | Total | |||||||||||
| Ended | Income | Capital Gains | Distributions | |||||||||||
| Lyrical U.S. Value Equity Fund | 11/30/2022 | $ | 4,003,098 | $ | 28,379,572 | $ | 32,382,670 | |||||||
| 11/30/2021 | $ | 2,723,622 | $ | — | $ | 2,723,622 | ||||||||
| Lyrical International Value Equity Fund | 11/30/2022 | $ | 2,388 | $ | — | $ | 2,388 | |||||||
| 11/30/2021 | $ | 59,272 | $ | 79,974 | $ | 139,246 | ||||||||
Estimates – The preparation of financial statements in conformity with GAAP requires management to make estimates and assumptions that affect the reported amounts of assets and liabilities and disclosure of contingent assets and liabilities as of the date of the financial statements and the reported amounts of increase (decrease) in net assets from operations during the reporting period. Actual results could differ from those estimates.
Federal income tax – Each Fund has qualified and intends to continue to qualify as a regulated investment company under the Internal Revenue Code of 1986, as amended (the “Code”). Qualification generally will relieve the Funds of liability for federal income taxes to the extent 100% of their net investment income and net realized capital gains are distributed in accordance with the Code.
In order to avoid imposition of the excise tax applicable to regulated investment companies, it is also each Fund’s intention to declare as dividends in each calendar year at least 98% of its net investment income (earned during the calendar year) and 98.2% of its net realized capital gains (earned during the twelve months ended October 31) plus undistributed amounts from prior years.
36
| LYRICAL FUNDS |
| NOTES TO FINANCIAL STATEMENTS (Continued) |
The following information is computed on a tax basis for each item as of November 30, 2022:
| Lyrical | Lyrical | |||||||
| U.S. Value | International Value | |||||||
| Equity Fund | Equity Fund | |||||||
| Tax cost of investments | $ | 602,624,485 | $ | 2,230,919 | ||||
| Gross unrealized appreciation | $ | 158,674,884 | $ | 286,934 | ||||
| Gross unrealized depreciation | (90,208,954 | ) | (302,003 | ) | ||||
| Net unrealized appreciation (depreciation) | 68,465,930 | (15,069 | ) | |||||
| Net unrealized appreciation on foreign currency translation | — | 98 | ||||||
| Undistributed ordinary income | 2,233,078 | 63,095 | ||||||
| Accumulated capital and other losses | (10,174,423 | ) | (21,382 | ) | ||||
| Distributable earnings | $ | 60,524,585 | $ | 26,742 | ||||
The difference between the federal income tax cost of portfolio investments and the financial statement cost of investments for each Fund is due to certain timing differences in the recognition of capital gains or losses under income tax regulations and GAAP. These “book/tax” differences are temporary in nature and are primarily due to the tax deferral of losses on wash sales and holdings classified as passive foreign investment companies.
During the year ended November 30, 2022, the Lyrical U.S. Equity Value Fund utilized $12,928,697 of capital loss carryforwards for federal income tax purposes.
As of November 30, 2022, the Funds had the following capital loss carryforwards for federal income tax purposes, which may be carried forward indefinitely:
| Lyrical U.S. Equity | Lyrical International | |||||||
| Value Fund | Equity Value Fund | |||||||
| No expiration - short-term | $ | — | $ | 21,382 | ||||
| No expiration - long-term | $ | — | $ | — | ||||
These capital loss carryforwards are available to offset net realized capital gains in future years, thereby reducing taxable gain distributions.
Post-October losses, incurred after October 31, 2022 and within the current taxable year are deemed to arise on the first day of a Fund’s next taxable year. For the year ended November 30, 2022, the Lyrical U.S. Equity Value Fund deferred $10,174,423 of post-October losses to December 1, 2022 for federal income tax purposes.
The Funds recognize the tax benefits or expenses of uncertain tax positions only when the position is “more likely than not” of being sustained assuming examination by tax authorities. Management has reviewed each Fund’s tax positions for all open tax years
37
| LYRICAL FUNDS |
| NOTES TO FINANCIAL STATEMENTS (Continued) |
(generally, three years) and has concluded that no provision for unrecognized tax benefits or expenses is required in these financial statements. The Funds identify their major tax jurisdiction as U.S. Federal.
3. Investment Transactions
During the year ended November 30, 2022, cost of purchases and proceeds from sales of investment securities, other than short-term investments, amounted to $194,565,988 and $164,219,629, respectively, for Lyrical U.S. Value Equity Fund and $709,384 and $792,916, respectively, for Lyrical International Value Equity Fund.
4. Transactions with Related Parties
INVESTMENT ADVISORY AGREEMENT
The Funds’ investments are managed by Lyrical Asset Management L.P. (the “Adviser”) pursuant to the terms of an Investment Advisory Agreement. The Funds pay the Adviser an investment advisory fee, computed and accrued daily and paid monthly, at the annual rate of 0.85% of average daily net assets. During the year ended November 30, 2022, the Adviser earned $5,865,140 and $18,676 of fees under the Investment Advisory Agreement for Lyrical U.S. Value Equity Fund and Lyrical International Value Equity Fund, respectively.
Pursuant to an Expense Limitation Agreement (“ELA”) between each Fund and the Adviser, the Adviser has contractually agreed, until April 1, 2024, to reduce investment advisory fees and reimburse other operating expenses to limit total annual operating expenses of each Fund (exclusive of brokerage costs; taxes; interest; borrowing costs such as interest and dividend expenses on securities sold short; costs to organize the Fund; acquired fund fees and expenses; extraordinary expenses such as litigation and merger or reorganization costs; and other expenses not incurred in the ordinary course of the Fund’s business) to an amount not exceeding the following percentages of average daily net assets attributable to each respective class:
| Institutional Class | Investor Class | A Class | C Class |
| 0.99% | 1.24% | 1.24% | 1.99% |
Accordingly, during the year ended November 30, 2022, the Adviser reduced fees and reimbursed other operating expenses of $225,900 for Lyrical U.S. Value Equity Fund and $262,691 for Lyrical International Value Equity Fund.
Under the terms of the ELA, investment advisory fee reductions and expense reimbursements by the Adviser are subject to repayment by the Funds for a period of three years after such fees and expenses were incurred, provided that the repayments do not cause total annual fund operating expenses to exceed the lesser of (i) the expense limitation then in effect, if any, and (ii) the expense limitation in effect at the time the
38
| LYRICAL FUNDS |
| NOTES TO FINANCIAL STATEMENTS (Continued) |
expenses to be repaid were incurred. As of November 30, 2022, the Adviser may seek repayment of advisory fee reductions and expense reimbursements no later than the dates below:
| November 30, | November 30, | November 30, | ||||||||||||||
| 2023 | 2024 | 2025 | Total | |||||||||||||
| Lyrical U.S. Value Equity Fund | $ | 136,716 | $ | 189,462 | $ | 225,900 | $ | 552,078 | ||||||||
| Lyrical International Value Equity Fund | $ | 148,703 | $ | 229,164 | $ | 262,691 | $ | 640,558 | ||||||||
OTHER SERVICE PROVIDERS
Ultimus Fund Solutions, LLC (“Ultimus”) provides administration, fund accounting, compliance and transfer agency services to the Funds. The Funds pay Ultimus fees in accordance with the agreements for such services. In addition, the Funds pay out-of-pocket expenses including, but not limited to, postage, supplies, and certain costs related to the pricing of the Funds’ portfolio securities.
Under the terms of a Distribution Agreement with the Trust, Ultimus Fund Distributors, LLC (the “Distributor”) serves as the principal underwriter to the Funds. The Distributor is a wholly-owned subsidiary of Ultimus. The Distributor is compensated partially by the Adviser and partially by the Investor Class, A Class and C Class shares of each Fund for acting as principal underwriter.
A Trustee and certain officers of the Trust are also officers of Ultimus.
DISTRIBUTION PLAN
The Funds have adopted a plan of distribution (the “Plan”), pursuant to Rule 12b-1 under the Investment Company Act of 1940, as amended (the “1940 Act”), which permits Investor Class, A Class and C Class shares of each Fund to directly incur or reimburse the Funds’ principal underwriter for certain expenses related to the distribution of its shares. The annual limitation for payment of expenses pursuant to the Plan is 0.25% of each Fund’s average daily net assets allocable to Investor Class shares and A Class shares, and 1.00% of each Fund’s average daily net assets allocable to C Class shares. The Funds have not adopted a plan of distribution with respect to the Institutional Class shares.
TRUSTEE COMPENSATION
Effective October 17, 2022, each member of the Board (a “Trustee”) who is not an “interested person” (as defined by the 1940 Act, as amended) of the Trust (“Independent Trustee”) receives a $1,300 annual retainer from the Fund, paid quarterly, except for the Board Chairperson who receives a $1,700 annual retainer from the Fund, paid quarterly and the Audit Committee Chairperson who receives a $1,500 annual retainer from the Fund, paid quarterly. Each Independent Trustee also receives from the Fund a fee of $550
39
| LYRICAL FUNDS |
| NOTES TO FINANCIAL STATEMENTS (Continued) |
for each Board meeting attended plus reimbursement for travel and other meeting-related expenses. Prior to October 17, 2022, no annual retainer was designated specifically for the Audit Committee Chairperson.
PRINCIPAL HOLDERS OF FUND SHARES
As of November 30, 2022, the following shareholders owned of record 25% or more of the outstanding shares of Lyrical International Value Equity Fund:
| NAME OF RECORD OWNERS | % Ownership |
| Lyrical U.S. Value Equity Fund - A Class | |
| Pershing, LLC (for the benefit of its customers) | 60% |
| Lyrical Asset Management L.P. | 40% |
| Lyrical U.S. Value Equity Fund - C Class | |
| Wells Fargo Clearing Services (for the benefit of its customers) | 82% |
| Lyrical International Value Equity Fund - Institutional Class | |
| Lyrical Asset Management L.P. | 47% |
| Charles Schwab & Company (for the benefit of its customers) | 46% |
| Lyrical International Value Equity Fund - Investor Class | |
| Lyrical Asset Management L.P. | 62% |
| Pershing, LLC (for the benefit of its customers) | 35% |
| Lyrical International Value Equity Fund - A Class | |
| Lyrical Asset Management L.P. | 100% |
| Lyrical International Value Equity Fund - C Class | |
| Lyrical Asset Management L.P. | 100% |
A beneficial owner of 25% or more of a Fund’s outstanding shares may be considered a controlling person of the Fund. That shareholder’s vote could have a more significant effect on matters presented at a shareholders’ meeting.
5. Borrowing Costs
From time to time, the Funds may have an overdrawn cash balance at the custodian due to redemptions or market movements. When this occurs, the Funds will incur borrowing costs charged by the custodian. Lyrical U.S. Value Equity Fund and Lyrical International Value Equity Fund did not incur any borrowing costs during the year ended November 30, 2022.
6. Sector Risk
If a Fund has significant investments in the securities of issuers within a particular sector, any development affecting that sector will have a greater impact on the value of the net assets of the Fund than would be the case if the Fund did not have significant investments in that sector. In addition, this may increase the risk of loss in the Fund and increase
40
| LYRICAL FUNDS |
| NOTES TO FINANCIAL STATEMENTS (Continued) |
the volatility of the Fund’s NAV per share. For instance, economic or market factors, regulatory changes or other developments may negatively impact all companies in a particular sector, and therefore the value of the Fund’s portfolio will be adversely affected. As of November 30, 2022, Lyrical International Value Equity Fund had 31.2% of the value of its net assets invested in stocks within the Industrials sector.
7. Contingencies and Commitments
The Funds indemnify the Trust’s officers and Trustees for certain liabilities that might arise from their performance of their duties to the Funds. Additionally, in the normal course of business the Funds enter into contracts that contain a variety of representations and warranties and which provide general indemnifications. The Funds’ maximum exposure under these arrangements is unknown, as this would involve future claims that may be made against the Funds that have not yet occurred. However, based on experience, the Funds expect the risk of loss to be remote.
8. Subsequent Events
The Funds are required to recognize in the financial statements the effects of all subsequent events that provide additional evidence about conditions that existed as of the date of the Statement of Assets and Liabilities. For non-recognized subsequent events that must be disclosed to keep the financial statements from being misleading, the Funds are required to disclose the nature of the event as well as an estimate of its financial effect, or a statement that such an estimate cannot be made. Management has evaluated subsequent events through the issuance of these financial statements and has noted no such except for the following:
On December 28, 2022, Lyrical U.S. Value Equity Fund - Institutional Class paid an ordinary income dividend of $0.0763, Investor Class $0.0268, A Class $0.0659 and C Class $0.0470, per share to shareholders of record on December 29, 2022, respectively.
On December 28, 2022 Lyrical International Value Equity Fund - Institutional Class paid an ordinary dividend of $0.3282, Investor Class $0.3010, A Class $0.3157 and C Class $0.2788, per share to shareholders of record on December 29, 2022, respectively.
41
| LYRICAL FUNDS |
| REPORT OF INDEPENDENT REGISTERED |
| PUBLIC ACCOUNTING FIRM |
To the Board of Trustees of Ultimus Managers Trust
and the Shareholders of Lyrical U.S. Value Equity Fund and
Lyrical International Value Equity Fund
Opinion on the Financial Statements
We have audited the accompanying statements of assets and liabilities of Lyrical U.S. Value Equity Fund and Lyrical International Value Equity Fund, each a series of shares of beneficial interest in Ultimus Managers Trust (the “Funds”), including the schedules of investments, as of November 30, 2022, and the related statements of operations for the year then ended, the statements of changes in net assets for each of the years in the two-year period then ended, the financial highlights as noted in the table below, and the related notes (collectively referred to as the “financial statements”). In our opinion, the financial statements present fairly, in all material respects, the financial position of the Funds as of November 30, 2022, and the results of their operations for the year then ended, the changes in their net assets for each of the years in the two-year period then ended and their financial highlights as noted in the table below, in conformity with accounting principles generally accepted in the United States of America.
| Fund | Financial Highlights Presented |
| Lyrical U.S. Value Equity Fund | The financial highlights for each of the years in the five-year period ended November 30, 2022 |
| Lyrical International Value Equity Fund | The financial highlights for each of the years in the two-year period ended November 30, 2022 and for the period from March 2, 2020 (commencement of operations) through November 30, 2020 |
Basis for Opinion
These financial statements are the responsibility of the Funds’ management. Our responsibility is to express an opinion on the Funds’ financial statements based on our audits. We are a public accounting firm registered with the Public Company Accounting Oversight Board (United States) (“PCAOB”) and are required to be independent with respect to the Funds in accordance with the U.S. federal securities law and the applicable rules and regulations of the Securities and Exchange Commission and the PCAOB.
We conducted our audits in accordance with the standards of the PCAOB. Those standards require that we plan and perform the audits to obtain reasonable assurance about whether the financial statements are free of material misstatement, whether due to error or fraud. The Funds are not required to have, nor were we engaged to perform, an audit of their internal control over financial reporting. As part of our audits we are required to obtain an understanding of internal control over financial reporting but not for the purpose of expressing an opinion on the effectiveness of the Funds’ internal control over financial reporting. Accordingly, we express no such opinion.
42
| LYRICAL FUNDS |
| REPORT OF INDEPENDENT REGISTERED |
| PUBLIC ACCOUNTING FIRM (Continued) |
Our audits included performing procedures to assess the risk of material misstatement of the financial statements, whether due to error or fraud, and performing procedures that respond to those risks. Such procedures included examining, on a test basis, evidence regarding the amounts and disclosures in the financial statements. Our procedures included confirmation of securities owned as of November 30, 2022 by correspondence with the custodian, brokers, or by other appropriate auditing procedures where replies from brokers were not received. Our audits also included evaluating the accounting principles used and significant estimates made by management, as well as evaluating the overall presentation of the financial statements. We believe that our audits provide a reasonable basis for our opinion.

BBD, LLP
We have served as the auditor of one or more of the Funds in the Ultimus Managers Trust since 2013.
Philadelphia, Pennsylvania
January 26, 2023
43
| LYRICAL FUNDS |
| ABOUT YOUR FUND’S EXPENSES (Unaudited) |
We believe it is important for you to understand the impact of costs on your investment. As a shareholder of the Funds, you incur ongoing costs, including management fees, class-specific expenses (such as distribution fees) and other operating expenses. The following examples are intended to help you understand your ongoing costs (in dollars) of investing in the Funds and to compare these costs with the ongoing costs of investing in other mutual funds.
A mutual fund’s ongoing costs are expressed as a percentage of its average net assets. This figure is known as the expense ratio. The expenses in the table below are based on an investment of $1,000 made at the beginning of the most recent period (June 1, 2022) and held until the end of the period (November 30, 2022). For A Class shares and C Class shares, this reflects the commencement of operations (July 5, 2022) and held until the end of the period (November 30, 2022)
The table below illustrates each Fund’s ongoing costs in two ways:
Actual fund return – This section helps you to estimate the actual expenses that you paid over the period. The “Ending Account Value” shown is derived from each Fund’s actual return, and the fourth column shows the dollar amount of operating expenses that would have been paid by an investor who started with $1,000 in the Funds. You may use the information here, together with the amount you invested, to estimate the expenses that you paid over the period.
To do so, simply divide your account value by $1,000 (for example, an $8,600 account value divided by $1,000 = 8.6), then multiply the result by the number given for the Funds under the heading “Expenses Paid During Period.”
Hypothetical 5% return – This section is intended to help you compare each Fund’s ongoing costs with those of other mutual funds. It assumes that the Funds had an annual return of 5% before expenses during the period shown, but that the expense ratio is unchanged. In this case, because the return used is not each Fund’s actual return, the results do not apply to your investment. The example is useful in making comparisons because the U.S. Securities and Exchange Commission (the “SEC”) requires all mutual funds to calculate expenses based on a 5% return. You can assess each Fund’s ongoing costs by comparing this hypothetical example with the hypothetical examples that appear in shareholder reports of other funds.
Note that expenses shown in the table are meant to highlight and help you compare ongoing costs only. The Funds do not charge transaction fees, such as purchase or redemption fees, nor do they carry a “sales load.”
The calculations assume no shares were bought or sold during the period. Your actual costs may have been higher or lower, depending on the amount of your investment and the timing of any purchases or redemptions.
44
| LYRICAL FUNDS |
| ABOUT YOUR FUND’S EXPENSES (Unaudited) (Continued) |
More information about each Fund’s expenses can be found in this report. For additional information on operating expenses and other shareholder costs, please refer to each Fund’s prospectus.
| Beginning | Ending | Net | Expenses | |||||
| Account Value | Account Value | Expense | Paid During | |||||
| June 1, 2022 (a) | November 30, 2022 | Ratio(b) | Period(c) | |||||
| Lyrical U.S. Value Equity Fund | ||||||||
| Institutional Class | ||||||||
| Based on Actual Fund Return | $1,000.00 | $ 953.20 | 0.99% | $4.85 | ||||
| Based on Hypothetical 5%Return (before expenses) | $1,000.00 | $ 1,020.10 | 0.99% | $5.01 | ||||
| Investor Class | ||||||||
| Based on Actual Fund Return | $1,000.00 | $ 952.40 | 1.24% | $6.07 | ||||
| Based on Hypothetical 5%Return (before expenses) | $1,000.00 | $ 1,018.85 | 1.24% | $6.28 | ||||
| A Class | ||||||||
| Based on Actual Fund Return | $1,000.00 | $ 1,101.20 | 1.24% | $5.28 | ||||
| Based on Hypothetical 5%Return (before expenses) | $1,000.00 | $ 1,015.25 | 1.24% | $5.07 | ||||
| C Class | ||||||||
| Based on Actual Fund Return | $1,000.00 | $ 1,097.90 | 1.99% | $8.46 | ||||
| Based on Hypothetical 5%Return (before expenses) | $1,000.00 | $ 1,012.20 | 1.99% | $8.12 |
| (a) | For A Class shares and C Class shares, this reflects the period beginning from the commencement of operations (July 5, 2022). |
| (b) | Annualized, based on each Fund’s most recent one-half year expenses. |
| (c) | For Institutional Class shares and Investor Class shares, expenses are equal to each Fund’s annualized net expense ratio multiplied by the average account value over the period, multiplied by 183/365 (to reflect the one-half year period). For A Class shares and C Class shares, expenses are equal to each Fund’s annualized net expense ratio multiplied by the average account value over the period, multiplied by 148/365 to reflect the period from the commencement of operations (July 5, 2022) through November 30, 2022. |
45
| LYRICAL FUNDS |
| ABOUT YOUR FUND’S EXPENSES (Unaudited) (Continued) |
| Beginning | Ending | Net | Expenses | |||||
| Account Value | Account Value | Expense | Paid During | |||||
| June 1, 2022 (a) | November 30, 2022 | Ratio(b) | Period(c) | |||||
| Lyrical International Value Equity Fund | ||||||||
| Institutional Class | ||||||||
| Based on Actual Fund Return | $1,000.00 | $ 999.30 | 0.99% | $4.96 | ||||
| Based on Hypothetical 5%Return (before expenses) | $1,000.00 | $ 1,020.10 | 0.99% | $5.01 | ||||
| Investor Class | ||||||||
| Based on Actual Fund Return | $1,000.00 | $ 997.50 | 1.24% | $6.21 | ||||
| Based on Hypothetical 5%Return (before expenses) | $1,000.00 | $ 1,018.85 | 1.24% | $6.28 | ||||
| A Class | ||||||||
| Based on Actual Fund Return | $1,000.00 | $ 1,139.70 | 1.24% | $5.38 | ||||
| Based on Hypothetical 5%Return (before expenses) | $1,000.00 | $ 1,015.25 | 1.24% | $5.07 | ||||
| C Class | ||||||||
| Based on Actual Fund Return | $1,000.00 | $ 1,136.70 | 1.99% | $8.62 | ||||
| Based on Hypothetical 5%Return (before expenses) | $1,000.00 | $ 1,012.20 | 1.99% | $8.12 |
| (a) | For A Class shares and C Class shares, this reflects the period beginning from the commencement of operations (July 5, 2022). |
| (b) | Annualized, based on each Fund’s most recent one-half year expenses. |
| (c) | For Institutional Class shares and Investor Class shares, expenses are equal to each Fund’s annualized net expense ratio multiplied by the average account value over the period, multiplied by 183/365 (to reflect the one-half year period). For A Class shares and C Class shares, expenses are equal to each Fund’s annualized net expense ratio multiplied by the average account value over the period, multiplied by 148/365 to reflect the period from the commencement of operations (July 5, 2022) through November 30, 2022. |
46
| LYRICAL FUNDS |
| OTHER INFORMATION (Unaudited) |
A description of the policies and procedures that the Funds use to vote proxies relating to portfolio securities is available without charge upon request by calling toll-free 1-888-884-8099, or on the SEC’s website at www.sec.gov. Information regarding how the Funds voted proxies relating to portfolio securities during the most recent 12-month period ended June 30 is available without charge upon request by calling toll-free 1-888-884-8099, or on the SEC’s website at www.sec.gov.
The Trust files a complete listing of portfolio holdings for the Funds with the SEC as of the end of the first and third quarters of each fiscal year as an exhibit to its reports on Form N-PORT. These filings are available upon request by calling 1-888-884-8099. Furthermore, you may obtain a copy of the filings on the SEC’s website at www.sec.gov and the Funds’ website at www.lyricalvaluefunds.com.
| FEDERAL TAX INFORMATION (Unaudited) |
For the fiscal year ended November 30, 2022, Lyrical U.S. Value Equity Fund designated $28,379,572 as long-term capital gain distributions.
Qualified Dividend Income – Lyrical U.S. Value Equity Fund and Lyrical International Value Equity Fund designates 100% and 31.57%, respectively, of their ordinary income dividends, or up to the maximum amount of such dividends allowable pursuant to the Internal Revenue Code, as qualified dividend income eligible for the reduced tax rate of 15%.
Dividends Received Deduction – Corporate shareholders are generally entitled to take the dividends received deduction on the portion of the Fund’s dividend distribution that qualifies under tax law. For the fiscal year ended November 30, 2022, the percentage of ordinary income dividends qualified for the corporate dividends receivable deduction for Lyrical U.S Value Equity Fund and Lyrical International Value Equity Fund was 100% and 0.00%, respectively.
Lyrical International Value Equity Fund intends to pass through to shareholders the income tax credit for taxes paid to foreign countries. The Fund’s foreign source income per share was $0.2500 and the foreign tax expenses per share was $0.0281. The pass-through of the foreign tax credit will only affect those persons who are shareholders on the dividend date of record. These shareholders will receive more detailed information with there 2022 Form 1099-DIV.
47
| LYRICAL FUNDS |
| BOARD OF TRUSTEES AND EXECUTIVE OFFICERS |
| (Unaudited) |
The Board has overall responsibility for management of the Trust’s affairs. The Trustees serve during the lifetime of the Trust and until its termination, or until death, resignation, retirement, or removal. The Trustees, in turn, elect the officers of the Funds to actively supervise their day-to-day operations. The officers have been elected for an annual term. The following are the Trustees and executive officers of the Funds:
| Name
and Year of Birth |
Length
of Time Served |
Position(s)
held with Trust |
Principal Occupation(s) During Past 5 Years |
Number
of Funds in the Trust Overseen By Trustee |
Directorship(s) of Public Companies Held By Trustee During Past 5 Years |
| Interested Trustees: | |||||
| David
R. Carson*^ Year of Birth: 1958 |
2021 to
2021 to
2013 to |
Trustee
(2021 to present) Vice President President and Principal Executive Officer |
Senior Vice President and Director of Client Strategies of Ultimus Fund Solutions, LLC (2013 to present); and President of Unified Series Trust (2017 to 2020) | 33 | Interested Trustee of 31 series of the Unified Series Trust (a registered management company) (2020 to present) |
| Independent Trustees: | |||||
| Janine
L. Cohen^ Year of Birth: 1952 |
Since 2016 | Chairperson (2019 to present) Trustee (2016 to present) | Retired since 2013; previously Chief Financial Officer from 2004 to 2013 and Chief Compliance Officer from 2008 to 2013 at AER Advisors, Inc. | 33 | n/a |
| David
M. Deptula^ Year of Birth: 1958 |
Since 2012 | Trustee (2012 to present) | Vice President of Legal and Special Projects at Dayton Freight Lines, Inc. since 2016 | 33 | n/a |
48
| LYRICAL FUNDS |
| BOARD OF TRUSTEES AND EXECUTIVE OFFICERS |
| (Unaudited) (Continued) |
| Name
and Year of Birth |
Length
of Time Served |
Position(s)
held with Trust |
Principal Occupation(s) During Past 5 Years |
Number
of Funds in the Trust Overseen By Trustee |
Directorship(s) of Public Companies Held By Trustee During Past 5 Years |
| Independent Trustees (Continued): | |||||
| Robert
E. Morrison^ Year of Birth: 1957 |
Since 2019 | Trustee (2019 to present; and previously 2012 to 2012) | Managing Director at Midwest Trust and FCI Advisors (2022 to present); Senior Vice President and National Practice Lead for Investment, Huntington National Bank/Huntington Private Bank (2014 to 2022); CEO, CIO, President of 5 Star Investment Management Company (2006 to 2014) | 33 | n/a |
| Clifford
N. Schireson^ Year of Birth: 1953 |
Since 2019 | Trustee (2019 to present) | Retired; Founder of Schireson Consulting, LLC (2017 to 2022); Director of Institutional Services for Brandes Investment Partners, LP (2004 to 2017) | 33 | Trustee of the San Diego City Employees’ Retirement System (2019 to present) |
| Jacqueline
A. Williams^ Year of Birth: 1954 |
Since 2019 | Trustee (2019 to present) | Managing Member of Custom Strategy Consulting, LLC (2017 to present); Managing Director of Global Investment Research (2005 to 2017), Cambridge Associates, LLC | 33 | n/a |
| ^ | Address is 225 Pictoria Drive, Suite 450, Cincinnati, Ohio 45246 |
| * | Mr. Carson is considered an “interested person” of the Trust within the meaning of Section (2)(a)(19) of the Investment Company Act of 1940, as amended, because of his relationship with the Trust’s Administrator, Transfer Agent, and Distributor. Mr. Carson was President of the Trust from October 2013 to January 2021 and Vice President of the Trust from April 2013 to October 2013. |
49
| LYRICAL FUNDS |
| BOARD OF TRUSTEES AND EXECUTIVE OFFICERS |
| (Unaudited) (Continued) |
| Name
and Year of Birth |
Length of Time Served |
Position(s) held with Trust |
Principal Occupation(s) During Past 5 Years |
| Todd
E. Heim^ Year of Birth: 1967 |
2021
to present 2014 to 2021 |
President Vice President | Vice President , Relationship Management (2018 to present) and Assistant Vice President, Client Implementation Manager with Ultimus Fund Solutions, LLC (2014 to 2018); Naval Flight Officer in United States Navy (1989 to 2017) |
| Jennifer
L. Leamer^ Year of Birth: 1976 |
2014
to present April 2014 to October 2014 |
Treasurer Assistant Treasurer | Senior Vice President of Fund Accounting (2020 to present) and Mutual Fund Controller of Ultimus Fund Solutions, LLC (2014 to 2020) |
| Daniel
D. Bauer^ Year of Birth: 1977 |
2016
to present |
Assistant Treasurer | Vice President of Fund Accounting (2022 to present), Assistant Vice President of Fund Accounting (2020 to 2022), and Assistant Mutual Fund Controller (2015 to 2020) of Ultimus Fund Solutions, LLC |
| Angela
A. Simmons^ Year of Birth: 1975 |
January 2022 to present |
Assistant Treasurer | Vice President of Financial Administration (2022 to present) and Assistant Vice President, Financial Administration (2015 to 2022) of Ultimus Fund Solutions, LLC |
| Khimmara
Greer^ Year of Birth: 1983 |
October 2021 to present |
Secretary | Vice President and Senior Legal Counsel of Ultimus Fund Solutions, LLC (2021 to present); Vice President, Asset Servicing – Regulatory Administration of The Bank of New York Mellon (2019 to 2021); Vice President and Counsel of State Street Bank and Trust Company (2015 to 2019) |
| David
K. James^ Year of Birth: 1970 |
October 2021 to present July 2021 to October 2022 |
Assistant Secretary Secretary | Executive Vice President and Chief Legal and Risk Officer of Ultimus Fund Solutions, LLC (2018 to present); Managing Director and Managing Counsel of State Street Bank and Trust Company (2009 to 2018) |
| Natalie
S. Anderson^ Year of Birth:1975 |
2016
to present |
Assistant Secretary | Legal Administration Manager (2016 to present) and Paralegal (2015 to 2016) of Ultimus Fund Solutions, LLC |
| Gweneth
K. Gosselink^ Year of Birth: 1955 |
2020
to present |
Chief Compliance Officer | Assistant Vice President, Compliance Officer at Ultimus Fund Solutions, LLC (2019 to present); CCO Consultant at GKG Consulting, LLC (2019 to 2021); Chief Operating Officer & CCO at Miles Capital, Inc. (2013 to 2019) |
50
| LYRICAL FUNDS |
| BOARD OF TRUSTEES AND EXECUTIVE OFFICERS |
| (Unaudited) (Continued) |
| Name
and Year of Birth |
Length of Time Served |
Position(s) held with Trust |
Principal Occupation(s) During Past 5 Years |
| Executive Officers (Continued): | |||
| Martin
Dean^ Year of Birth: 1963 |
2020
to present 2019 to 2020 2016 to 2017 |
Assistant
Chief Compliance Officer Interim Chief Compliance Officer Assistant Chief Compliance Officer |
Senior Vice President, Head of Fund Compliance (2020 to present) and Vice President & Director of Fund Compliance of Ultimus Fund Solutions, LLC (2016 to 2020) |
| ^ | Address is 225 Pictoria Drive, Suite 450, Cincinnati, Ohio 45246 |
Additional information about members of the Board and executive officers is available in the Funds’ Statement of Additional Information (“SAI”). To obtain a free copy of the SAI, please call toll free 1-888-884-8099.
51
| LYRICAL FUNDS |
| DISCLOSURE REGARDING APPROVAL OF INVESTMENT |
| ADVISORY AGREEMENT (Unaudited) |
The Board of Trustees (the “Board”), including the Independent Trustees voting separately, has reviewed and approved the Funds’ Investment Advisory Agreement with Lyrical Asset Management LP (the “Adviser” or “Lyrical”) for an additional one-year term (the “Agreement”). The Board approved the Agreement at a meeting held on July 18 – 19, 2022, at which all of the Trustees were present.
In deciding whether to approve the continuation of the Advisory Agreement, the Board recalled its review of the materials related to the Funds and Lyrical throughout the preceding twelve months with respect to the Funds and its numerous discussions with Trust Management and Lyrical about the operations and performance of the Funds during that period. The Board further considered those materials and discussions and other numerous factors, including the following:
The nature, extent, and quality of the services provided by the Adviser. In this regard, the Board reviewed the services being provided by the Adviser to the Funds including, without limitation, its providing a continuous investment program for the Funds, adhering to each Fund’s investment restrictions, complying with the Trust’s policies and procedures and voting proxies on behalf of the Funds. The Board considered the qualifications and experience of the Adviser’s portfolio managers who are responsible for the day-to-day management of each Fund’s portfolio, as well as the qualifications of other individuals at the Adviser who provide services to the Funds. The Board concluded that the quality, extent, and nature of the services provided by the Adviser to each of the Funds were satisfactory.
The investment performance of the Funds. In this regard, the Board compared the performance of each of the Funds with the performance of its respective benchmark index, custom peer group, and Morningstar category. The Board concluded that the investment performance of each of the Funds has been satisfactory.
The costs of the services provided and profits realized by the Adviser and its affiliates from their relationship with the Funds. In this regard, the Board considered the management fee for each of the Funds and each Fund’s expense ratio, each as compared to its respective peer group and to the fees charged by the Adviser to other similar clients. The Board considered the revenue earned by the Adviser from each Fund, the Adviser’s financial condition, the asset level of the Funds and the current and anticipated profitability of each of the Funds to the Adviser, if any. The Board considered the Adviser’s past fee reductions and expense reimbursements for each of the Funds and the indirect benefits that the Adviser received from its management of the Funds. The Board concluded that the advisory fee to be paid to the Adviser by each of the Funds is reasonable in light of the nature and quality of services provided by the Adviser.
The extent to which economics of scale would be realized as each of the Funds grow and whether advisory fee levels reflect these economies of scale for the benefit of the Funds’ investors. In this regard, the Board considered that each of the Funds’ fee arrangements
52
| LYRICAL FUNDS |
| DISCLOSURE REGARDING APPROVAL OF INVESTMENT |
| ADVISORY AGREEMENT (Unaudited) (Continued) |
with the Adviser involve both the advisory fee and the Funds’ expense limitation agreement (the “ELA”). The Board determined that while the advisory fee rate remained the same as asset levels increased, the shareholders of the Funds have experienced benefits from the Funds’ ELA and will continue to experience benefits from the Funds’ ELA. The Board concluded that the advisory fee for each of the Funds was reasonable in light of the information that was provided to the Trustees by the Adviser with respect to economies of scale.
After further discussion of the factors noted above, and in reliance on the information provided by the Adviser and Trust management, and taking into account the totality of all factors discussed and information presented at the meeting and previous meetings, the Board indicated its agreement to approve the continuance of the Agreement of each of the Funds. It was noted that in the Trustees’ deliberations regarding the approval of the continuance of the Agreement, the Trustees did not identify any particular information or factor that was all-important or controlling, and that each individual Trustee may have attributed different weights to the various factors listed above. After full consideration of the above factors as well as other factors, the Board unanimously concluded that approval of the continuance of the Agreement was in the best interests of the Funds and its shareholders.
53
| LYRICAL FUNDS |
| LIQUIDITY RISK MANAGEMENT PROGRAM |
| (Unaudited) |
The Fund has adopted and implemented a written liquidity risk management program (the “Program”) as required by Rule 22e-4 (the “Liquidity Rule”) under the Investment Company Act of 1940, as amended. The Program is reasonably designed to assess and manage the Fund’s liquidity risk, taking into consideration, among other factors, the Fund’s investment strategy and the liquidity of its portfolio investments during normal and reasonably foreseeable stressed conditions; its short- and long-term cash flow projections; and its cash holdings and access to other funding sources. The Fund’s Board of Trustees (the “Board”) approved the appointment of the Liquidity Administrator Committee, comprising of the Fund’s Adviser and certain Trust officers, to be responsible for the Program’s administration and oversight and for reporting to the Board on at least an annual basis regarding the Program’s operation and effectiveness. The annual written report assessing the Program (the “Report”) was presented to the Board at the October 17 – 18, 2022 Board meeting and covered the period from June 1, 2021 to May 31, 2022 (the “Review Period”).
During the Review Period, the Fund did not experience unusual stress or disruption to its operations related to purchase and redemption activity. Also, during the Review Period, the Fund held adequate levels of cash and highly liquid investments to meet shareholder redemption activities in accordance with applicable requirements. The Report concluded that the Program is reasonably designed to prevent violation of the Liquidity Rule and the Program has been effectively implemented.
54
This page intentionally left blank.
LYRICAL-AR-22
Q3 All-Season Sector Rotation Fund
Institutional Class (QAISX)
Q3 All-Season Tactical Fund
Institutional Class (QAITX)
C Class (QACTX)
Annual Report
November 30, 2022
| Q3 ALL-SEASON FUNDS | |
| LETTER TO SHAREHOLDERS (Unaudited) | November 30, 2022 |
Dear Shareholders:
This Annual Report for the Q3 All-Season Funds covers the period from November 30, 2021 – November 30, 2022. The All-Season Funds are a series of Funds advised by Q3 Asset Management, which are actively managed using systematic, quantitative approaches to asset allocation in order to adjust to ever-evolving market environments.
Q3 All-Season Sector Rotation Fund (QAISX)
For the year ended November 30, 2022, the Sector Rotation Fund had losses of 5.1% in the Institutional class shares, versus a loss of 11.1% for the Dow Jones Moderate Portfolio Index during the same timeframe. The Fund’s investment objective is to seek long-term growth of capital on an annual basis consistent with a moderately aggressive tolerance for risk.
The Fund began the period fully invested in equities with a slight tilt in favor of growth-based sectors such as Technology and Consumer Discretionary. In January, however, the Fund shifted to a 50% bond position as equity markets began their downward slide.
This portion in bonds remained for the entire period. However, the actual bonds the Fund invested in rotated from longer-term maturities early in the year to money market equivalents as the fixed income markets also began to swoon in line with equities. This portion of the Fund is largely responsible for the relative outperformance over the 12-month period.
On the equity side, the Fund quickly moved out of most growth sectors and into defensive areas of the market early in the year. These defensive sectors were subsequently held for nearly all of 2022. Holdings in Energy, Natural Resources and Industrials – especially in the early months of the year – provided much-needed gains for the Fund. Commodity-based sectors started the year on a tear but retreated somewhat as growth sectors had a short-lived rally. The Fund was not drawn into these fleeting moves and continued to favor value over growth.
In a decidedly difficult year for both bond and equity investors, the Sector Fund performed admirably. A partial shift out of equities coupled with a rotation away from growth-based sectors, resulted in a reduction of volatility and improved returns when compared to the benchmark.
The Advisor is continually monitoring the trading system for the Sector Rotation Fund and has investigated several aspects of its algorithms in an attempt to improve performance. While no major changes in the Fund’s management are contemplated, certain smaller improvements may be implemented if the Advisor feels they can add value to the overall system.
1
Q3 All-Season Tactical Fund (QAITX, QACTX)
The Tactical Fund had a loss of 34.8% during the period for the C Class shares and a loss of 34.0% for the Institutional Class shares versus a loss of 11.1% for the Dow Jones Moderate Portfolio Index . The Fund’s investment objective seeks a positive rate of return over a calendar year regardless of market conditions. Equity investments are based on the price movements of one, or more, major equity indexes. As such indexes begin to exhibit increased volatility, positions in government bonds may be taken. Such positions may be long or inverse depending on the conditions of the Treasury bond markets.
The Fund began the period with a partial investment in the NASDAQ 100 Index (QQQ). However, during the first few months of 2022, downside pressure increased in the market
– particularly in the technology-heavy NASDAQ Index. Accordingly, the Fund began to further divest from the QQQ position and into government bonds. By late February, the Fund was completely out of equities as the bear market was just starting to develop.
Throughout the year as equity indexes continued to decline the Fund remained largely out of equities. Generally, in this type of environment Treasury bonds are thought of as a “safe haven.” Not so in 2022. In fact, long-term Treasuries declined by as much as 20% at one point during the year. The Fund primarily was invested on the long side of this market taking advantage of historical trends which had persisted for decades. These positions led to most of the losses for the period, as opposed to equity investments.
At times, the Fund did take inverse positions in the Treasury market, but the volatility and whipsaw nature of that market led to continued losses. Equity indexes continued to slide nearly all year, and the Fund was able to avoid the losses due to the trend-based indicators employed by the trading system used to manage the Fund.
As designed, one of the primary objectives of the Fund is to avoid equities when the risk/ reward ratio looks to be unfavorable. From this standpoint the Fund was successful – as equity indexes had one of the worst years on record. However, the historic decoupling of the bond market from equities for the period presented a unique challenge for the Fund, and ultimately led to the majority of the losses.
The algorithm for generated bond signals for the Fund was reviewed during the year and slight modifications were made which improved relative performance. Generally, the changes made to the signal required the overall trend of the bond market to be in the same direction as the signal, otherwise a lesser position would be taken in an attempt to reduce downside risk.
The All-Season Funds are created to work together in a portfolio to seek return and manage risk for an investor through changing market conditions. Both Funds are systematic and quantitative in nature and, as such, human emotion is largely removed from investment decisions. Challenging market environments often lead investors to make decisions that are based on emotions. The All-Season Funds seek to avoid this common investment pitfall by having the Funds rely on rules-based trading algorithms which have been developed using historical market data in an attempt to replicate any possible market environment moving forward.
2
If you have any questions about the Funds, please visit us at our website www.Q3AllSeasonFunds.com or email [email protected]
Very truly yours,
| Brad Giaimo | Bruce Greig, CFA | Adam Quiring |
| Portfolio Manager | Portfolio Manager | Portfolio Manager |
Q3 Asset Management
Past performance is not predictive of future performance. Investment results and principal value will fluctuate so that shares, when redeemed, may be worth more or less than their original cost. Current performance may be higher or lower than the performance data quoted. Performance data current to the most recent month-end are available by calling 1.248.566.1122.
An investor should consider the investment objectives, risks, charges and expenses of the Fund carefully before investing. The Funds’ prospectus contains this and other important information. To obtain a copy the Funds’ prospectus please visit the Funds’ website at www.Q3AllSeasonFunds.com or call 1.888-348-1255 and a copy will be sent to you free of charge. Please read the prospectus carefully before you invest. The Funds are distributed by Ultimus Fund Distributors, LLC.
The Letter to Shareholders seeks to describe some of the Adviser’s current opinions and views of the financial markets. Although the Adviser believes it has a reasonable basis for any opinions or views expressed, actual results may differ, sometimes significantly so, from those expected or expressed. The securities held by the Funds that are discussed in the Letter to Shareholders were held during the period covered by this Report. They may not comprise the entire investment portfolio of the Funds, may be sold at any time, and may no longer be held by the Funds. For a complete list of securities held by the Funds as of November 30, 2022, please see the Schedule of Investments sections of the annual report. The opinions of the Fund’s adviser with respect to those securities may change at any time.
Statements in the Letter to Shareholders that reflect projections or expectations for future financial or economic performance of the Fund and the market in general and statements of the Fund’s plans and objectives for future operations are forward-looking statements. No assurance can be given that actual results or events will not differ materially from those projected, estimated, assumed, or anticipated in any such forward-looking statements. Important factors that could result in such differences, in addition to factors noted with such forward-looking statements, include, without limitation, general economic conditions, such as inflation, recession, and interest rates. Past performance is not a guarantee of future results.
3
Q3 ALL-SEASON SECTOR ROTATION FUND
PERFORMANCE INFORMATION
November 30, 2022 (Unaudited)
Comparison of the Change in Value of a $100,000 Investment in Q3 All-Season
Sector Rotation Fund – Institutional Class versus the Dow Jones Moderate
Portfolio Index, the Morningstar Moderately Aggressive Target Risk Index and
the Morningstar Moderate Target Risk Index
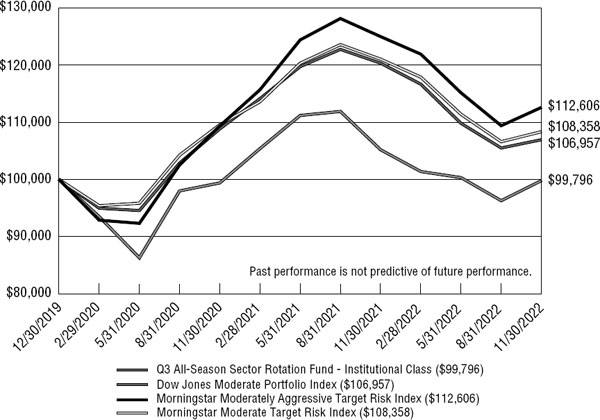
Average Annual Total Returns
For the Periods Ended November 30, 2022
| Since | ||||
| 1 Year | Inception (b) | |||
| Q3 All-Season Sector Rotation - Institutional Class(a) | -5.14% | -0.07% | ||
| Dow Jones Moderate Portfolio Index * | -11.12% | 2.33% | ||
| Morningstar Moderately Aggressive Target Risk Index | -9.91% | 4.15% | ||
| Morningstar Moderate Target Risk Index | -10.48% | 2.79% |
| (a) | The Fund’s total returns do not reflect the deduction of taxes a shareholder would pay on Fund distributions or the redemption of Fund shares. |
| (b) | The commencement of operations for Institutional Class was December 30, 2019. |
| * | Effective April 21, 2022, the Dow Jones Moderate Portfolio Index (the “Index”) became the primary benchmark for the Fund. The Index measures a total portfolio of stocks, bonds, and cash, allocated to represent an investor’s desired risk profile. The Index risk level is 60% of the Dow Jones Global Stock CMAC Index’s downside risk. |
4
Q3 ALL-SEASON SECTOR ROTATION FUND
PERFORMANCE INFORMATION
November 30, 2022 (Unaudited) (Continued)
Q3 All-Season Sector Rotation Fund (the “Fund”) is not sponsored, endorsed, sold or promoted by Morningstar, Inc. or any of its affiliates (all such entities, collectively, “Morningstar Entities”). The Morningstar Entities make no representation or warranty, express or implied, to the owners of the Fund or any member of the public regarding the advisability of investing in equity securities generally or in the Fund in particular or the ability of the Funds to track general equity market performance. THE MORNINGSTAR ENTITIES DO NOT GUARANTEE THE ACCURACY AND/OR THE COMPLETENESS OF THE FUNDS OR ANY DATA INCLUDED THEREIN AND MORNINGSTAR ENTITIES SHALL HAVE NO LIABILITY FOR ANY ERRORS, OMISSIONS, OR INTERRUPTIONS THEREIN.
5
Q3 ALL-SEASON TACTICAL FUND
PERFORMANCE INFORMATION
November 30, 2022 (Unaudited)
Comparison of the Change in Value of a $100,000 Investment in Q3 All-Season
Tactical Fund – Institutional Class(a) versus the Dow Jones Moderate Portfolio
Index, the Morningstar Moderate Target Risk Index and the Morningstar
Moderately Aggressive Target Risk Index
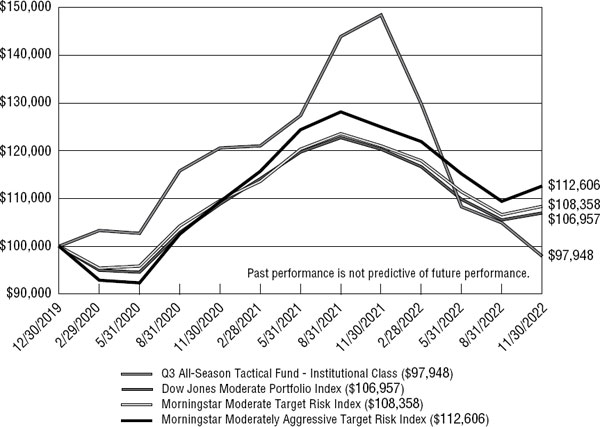
Average Annual Total Returns
For the Periods Ended November 30, 2022
| Since | ||||
| 1 Year | Inception (c) | |||
| Q3 All-Season Tactical - Institutional Class(b) | -34.03% | -0.71% | ||
| Q3 All-Season Tactical - C Share Class(b) | -34.82% | -14.11% | ||
| Dow Jones Moderate Portfolio Index * | -11.12% | 2.33% | ||
| Morningstar Moderate Target Risk Index | -10.48% | 2.79% | ||
| Morningstar Moderately Aggressive Target Risk Index | -9.91% | 4.15% |
| (a) | The line graph above represents performance of the Institutional Class only, which will vary from the performance of C Class based on difference in fees paid by shareholders in the different classes. |
| (b) | The Fund’s total returns do not reflect the deduction of taxes a shareholder would pay on Fund distributions or the redemption of Fund shares. |
| (c) | The commencement of operations for Institutional Class was December 30, 2019. The commencement of operations for C Share Class was March 18, 2021. |
| * | Effective April 21, 2022, the Dow Jones Moderate Portfolio Index (the “Index”) became the primary benchmark for the Fund. The Index measures a total portfolio of stocks, bonds, and cash, allocated to represent an investor’s desired risk profile. The Index risk level is 60% of the Dow Jones Global Stock CMAC Index’s downside risk. |
6
Q3 ALL-SEASON TACTICAL FUND
PERFORMANCE INFORMATION
November 30, 2022 (Unaudited) (Continued)
Q3 All-Season Tactical Fund (the “Fund”) is not sponsored, endorsed, sold or promoted by Morningstar, Inc. or any of its affiliates (all such entities, collectively, “Morningstar Entities”). The Morningstar Entities make no representation or warranty, express or implied, to the owners of the Fund or any member of the public regarding the advisability of investing in equity securities generally or in the Fund in particular or the ability of the Funds to track general equity market performance. THE MORNINGSTAR ENTITIES DO NOT GUARANTEE THE ACCURACY AND/OR THE COMPLETENESS OF THE FUNDS OR ANY DATA INCLUDED THEREIN AND MORNINGSTAR ENTITIES SHALL HAVE NO LIABILITY FOR ANY ERRORS, OMISSIONS, OR INTERRUPTIONS THEREIN.
7
Q3 ALL-SEASON FUNDS
PORTFOLIO INFORMATION
November 30, 2022 (Unaudited)
| Q3 ALL-SEASON SECTOR ROTATION FUND |
| Sector Diversification (% of Net Assets) |
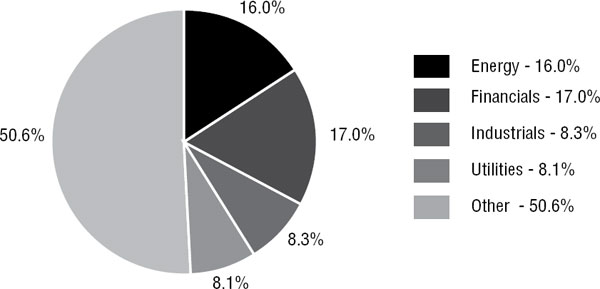
Q3 ALL-SEASON TACTICAL FUND
Sector Diversification (% of Net Assets)
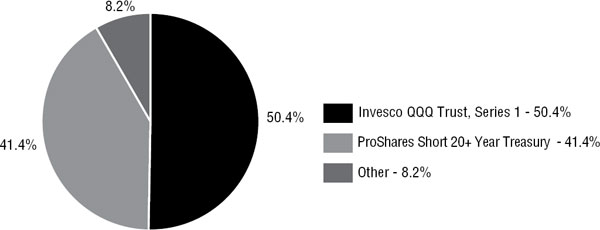
8
| Q3 ALL-SEASON SECTOR ROTATION FUND |
| SCHEDULE OF INVESTMENTS |
| November 30, 2022 |
| EXCHANGE-TRADED FUNDS — 49.4% | Shares | Value | ||||||
| Fidelity MSCI Energy Index ETF | 11,000 | $ | 275,110 | |||||
| Fidelity MSCI Utilities Index ETF | 6,000 | 277,680 | ||||||
| iShares U.S. Broker-Dealers & Securities Exchanges ETF | 2,760 | 284,501 | ||||||
| SPDR S&P Aerospace & Defense ETF | 2,600 | 286,832 | ||||||
| SPDR S&P Insurance ETF | 7,000 | 298,410 | ||||||
| VanEck Oil Services ETF | 900 | 273,735 | ||||||
| Total Exchange-Traded Funds (Cost $1,526,611) | $ | 1,696,268 | ||||||
| MONEY MARKET FUNDS — 50.5% | Shares | Value | ||||||
| First American Government Obligations Fund - Class X, 3.57% (a) (Cost $1,731,190) | 1,731,190 | $ | 1,731,190 | |||||
| Investments at Value — 99.9% (Cost $3,257,801) | $ | 3,427,458 | ||||||
| Other Assets in Excess of Liabilities — 0.1% | 3,727 | |||||||
| Net Assets — 100.0% | $ | 3,431,185 | ||||||
| (a) | The rate shown is the 7-day effective yield as of November 30, 2022. |
See accompanying notes to financial statements.
9
| Q3 ALL-SEASON TACTICAL FUND |
| SCHEDULE OF INVESTMENTS |
| November 30, 2022 |
| EXCHANGE-TRADED FUNDS — 91.8% | Shares | Value | ||||||
| Invesco QQQ Trust, Series 1 | 92,000 | $ | 26,989,120 | |||||
| ProShares Short 20+ Year Treasury (a) | 1,000,000 | 22,170,000 | ||||||
| Total Exchange-Traded Funds (Cost $49,287,586) | $ | 49,159,120 | ||||||
| MONEY MARKET FUNDS — 90.9% | Shares | Value | ||||||
| First American Government Obligations Fund - Class X, 3.57% (b) (Cost $48,713,624) | 48,713,624 | $ | 48,713,624 | |||||
| Investments at Value — 182.7% (Cost $98,001,210) | $ | 97,872,744 | ||||||
| Liabilities in Excess of Other Assets — (82.7%) | (44,311,290 | ) | ||||||
| Net Assets — 100.0% | $ | 53,561,454 | ||||||
| (a) | Non-income producing security. |
| (b) | The rate shown is the 7-day effective yield as of November 30, 2022. |
See accompanying notes to financial statements.
10
| Q3 ALL-SEASON FUNDS |
| STATEMENTS OF ASSETS AND LIABILITIES |
| November 30, 2022 |
| Q3 All-Season | Q3 All-Season | |||||||
| Sector Rotation | Tactical | |||||||
| Fund | Fund | |||||||
| ASSETS | ||||||||
| Investments in securities: | ||||||||
| At cost | $ | 3,257,801 | $ | 98,001,210 | ||||
| At value (Note 2) | $ | 3,427,458 | $ | 97,872,744 | ||||
| Receivable for capital shares sold | 30 | 47,313 | ||||||
| Receivable for investment securities sold | — | 9,550,916 | ||||||
| Receivable from Adviser (Note 4) | 9,830 | — | ||||||
| Dividend receivable | 4,779 | 42,657 | ||||||
| Other assets | 3,391 | 12,306 | ||||||
| Total assets | 3,445,488 | 107,525,936 | ||||||
| LIABILITIES | ||||||||
| Payable for capital shares redeemed | — | 139,426 | ||||||
| Payable for investment securities purchased | — | 53,751,530 | ||||||
| Payable to Adviser (Note 4) | — | 48,020 | ||||||
| Payable to administrator (Note 4) | 7,528 | 12,121 | ||||||
| Accrued distribution fees (Note 4) | — | 4,592 | ||||||
| Other accrued expenses | 6,775 | 8,793 | ||||||
| Total liabilities | 14,303 | 53,964,482 | ||||||
| NET ASSETS | $ | 3,431,185 | $ | 53,561,454 | ||||
| NET ASSETS CONSIST OF: | ||||||||
| Paid-in capital | $ | 4,008,218 | $ | 86,713,201 | ||||
| Accumulated deficit | (577,033 | ) | (33,151,747 | ) | ||||
| NET ASSETS | $ | 3,431,185 | $ | 53,561,454 | ||||
11
| Q3 ALL-SEASON FUNDS |
| STATEMENTS OF ASSETS AND LIABILITIES |
| November 30, 2022 (Continued) |
| Q3 All-Season | Q3 All-Season | |||||||
| Sector Rotation | Tactical | |||||||
| Fund | Fund | |||||||
| NET ASSET VALUE PER SHARE: | ||||||||
| INSTITUTIONAL CLASS | ||||||||
| Net assets applicable to Institutional Class | $ | 3,431,185 | $ | 50,871,338 | ||||
| Institutional Class shares of beneficial interest outstanding (unlimited number of shares authorized, no par value) | 365,076 | 6,020,097 | ||||||
| Net asset value, offering price and redemption price per share (Note 2) | $ | 9.40 | $ | 8.45 | ||||
| C CLASS | ||||||||
| Net assets applicable to C Class | N/A | $ | 2,690,116 | |||||
| C Class shares of beneficial interest outstanding (unlimited number of shares authorized, no par value) | N/A | 326,175 | ||||||
| Net asset value, offering price and redemption price per share (Note 2) | N/A | $ | 8.25 | |||||
See accompanying notes to financial statements.
12
| Q3 ALL-SEASON FUNDS |
| STATEMENTS OF OPERATIONS |
| Year Ended November 30, 2022 |
| Q3 All-Season | Q3 All-Season | |||||||
| Sector Rotation | Tactical | |||||||
| Fund | Fund | |||||||
| INVESTMENT INCOME | ||||||||
| Dividend income | $ | 75,447 | $ | 793,461 | ||||
| EXPENSES | ||||||||
| Management fees (Note 4) | 47,759 | 1,017,203 | ||||||
| Administration fees (Note 4) | 29,750 | 97,514 | ||||||
| Fund accounting fees (Note 4) | 34,693 | 48,363 | ||||||
| Transfer agent fees (Note 4) | 26,936 | 44,936 | ||||||
| Legal fees | 27,529 | 30,924 | ||||||
| Registration and filing fees | 5,891 | 4,623 | ||||||
| Registration fees - Institutional Class | 6,121 | 20,688 | ||||||
| Registration fees - Investor Class | 3,328 | 6,561 | ||||||
| Registration fees - C Class | — | 9,234 | ||||||
| Trustees’ fees and expenses (Note 4) | 18,889 | 18,889 | ||||||
| Distribution fees - C Class (Note 4) | — | 31,924 | ||||||
| Distribution fees - Investor Class (Note 4) | 660 | 1,604 | ||||||
| Audit and tax services fees | 15,911 | 15,911 | ||||||
| Compliance fees (Note 4) | 12,111 | 13,679 | ||||||
| Postage and supplies | 4,806 | 17,646 | ||||||
| Custody and bank service fees | 8,093 | 13,397 | ||||||
| Shareholder reporting expenses | 8,359 | 10,126 | ||||||
| Insurance | 3,307 | 4,168 | ||||||
| Other expenses | 8,907 | 18,156 | ||||||
| Total expenses | 263,050 | 1,425,546 | ||||||
| Management fees reduced/waived and/or expense reimbursements by the Adviser (Note 4) | (169,738 | ) | (2,542 | ) | ||||
| Net expenses | 93,312 | 1,423,004 | ||||||
| NET INVESTMENT LOSS | (17,865 | ) | (629,543 | ) | ||||
| REALIZED AND UNREALIZED GAINS (LOSSES) ON INVESTMENTS | ||||||||
| Net realized losses from investment transactions | (718,014 | ) | (30,854,182 | ) | ||||
| Net change in unrealized appreciation (depreciation) on investments | 383,941 | (16,296,905 | ) | |||||
| NET REALIZED AND UNREALIZED LOSSES ON INVESTMENTS | (334,073 | ) | (47,151,087 | ) | ||||
| NET DECREASE IN NET ASSETS RESULTING FROM OPERATIONS | $ | (351,938 | ) | $ | (47,780,630 | ) | ||
See accompanying notes to financial statements.
13
| Q3 ALL-SEASON SECTOR ROTATION FUND |
| STATEMENTS OF CHANGES IN NET ASSETS |
| Year Ended | Year Ended | |||||||
| November 30, | November 30, | |||||||
| 2022 | 2021 | |||||||
| FROM OPERATIONS | ||||||||
| Net investment loss | $ | (17,865 | ) | $ | (74,942 | ) | ||
| Net realized gains (losses) from investment transactions | (718,014 | ) | 968,032 | |||||
| Net change in unrealized appreciation (depreciation) on investments | 383,941 | (677,221 | ) | |||||
| Net increase (decrease) in net assets resulting from operations | (351,938 | ) | 215,869 | |||||
| FROM DISTRIBUTIONS TO SHAREHOLDERS (Note 2) | ||||||||
| Investor Class | (25,197 | ) | — | |||||
| Institutional Class | (364,646 | ) | — | |||||
| Decrease in net assets from distributions to shareholders | (389,843 | ) | — | |||||
| CAPITAL SHARE TRANSACTIONS | ||||||||
| Investor Class | ||||||||
| Proceeds from shares sold | 29,989 | 641,884 | ||||||
| Net asset value of shares issued in reinvestment of distributions to shareholders | 25,197 | — | ||||||
| Payments for shares redeemed | (267,450 | ) | (330,355 | ) | ||||
| Shares exchanged for Institutional Class (Note 1) | (120,399 | ) | — | |||||
| Net increase (decrease) in Investor Class net assets from capital share transactions | (332,663 | ) | 311,529 | |||||
| Institutional Class | ||||||||
| Proceeds from shares sold | 576,162 | 3,049,795 | ||||||
| Shares exchanged from Investor Class (Note 1) | 120,399 | — | ||||||
| Net asset value of shares issued in reinvestment of distributions to shareholders | 364,646 | — | ||||||
| Payments for shares redeemed | (2,992,283 | ) | (1,723,552 | ) | ||||
| Net increase (decrease) in Institutional Class net assets from capital share transactions | (1,931,076 | ) | 1,326,243 | |||||
| TOTAL INCREASE (DECREASE) IN NET ASSETS | (3,005,520 | ) | 1,853,641 | |||||
| NET ASSETS | ||||||||
| Beginning of year | 6,436,705 | 4,583,064 | ||||||
| End of year | $ | 3,431,185 | $ | 6,436,705 | ||||
See accompanying notes to financial statements.
14
| Q3 ALL-SEASON SECTOR ROTATION FUND |
| STATEMENTS OF CHANGES IN NET ASSETS (Continued) |
| Year Ended | Year Ended | |||||||
| November 30, | November 30, | |||||||
| 2022 | 2021 | |||||||
| CAPITAL SHARE ACTIVITY | ||||||||
| Investor Class | ||||||||
| Shares sold | 2,842 | 58,604 | ||||||
| Shares reinvested | 2,434 | — | ||||||
| Shares redeemed | (29,212 | ) | (30,783 | ) | ||||
| Shares exchanged for Institutional Class (Note 1) | (13,163 | ) | — | |||||
| Net increase (decrease) in shares outstanding | (37,099 | ) | 27,821 | |||||
| Shares outstanding at beginning of year | 37,099 | 9,278 | ||||||
| Shares outstanding at end of year | — | 37,099 | ||||||
| Institutional Class | ||||||||
| Shares sold | 59,129 | 280,934 | ||||||
| Shares issued in connection with exchange of Investor Class shares (Note 1) | 13,078 | — | ||||||
| Shares reinvested | 35,062 | — | ||||||
| Shares redeemed | (317,006 | ) | (157,821 | ) | ||||
| Net increase (decrease) in shares outstanding | (209,737 | ) | 123,113 | |||||
| Shares outstanding at beginning of year | 574,813 | 451,700 | ||||||
| Shares outstanding at end of year | 365,076 | 574,813 | ||||||
See accompanying notes to financial statements.
15
| Q3 ALL-SEASON TACTICAL FUND |
| STATEMENTS OF CHANGES IN NET ASSETS |
| Year Ended | Year Ended | |||||||
| November 30, | November 30, | |||||||
| 2022 | 2021 (a) | |||||||
| FROM OPERATIONS | ||||||||
| Net investment loss | $ | (629,543 | ) | $ | (831,293 | ) | ||
| Net realized gains (losses) from investment transactions | (30,854,182 | ) | 11,808,355 | |||||
| Net change in unrealized appreciation (depreciation) on investments | (16,296,905 | ) | 12,013,498 | |||||
| Net increase (decrease) in net assets resulting from operations | (47,780,630 | ) | 22,990,560 | |||||
| FROM DISTRIBUTIONS TO SHAREHOLDERS (Note 2) | ||||||||
| Investor Class | (81,800 | ) | (13,014 | ) | ||||
| Institutional Class | (10,837,041 | ) | (5,413,223 | ) | ||||
| C Class | (250,466 | ) | — | |||||
| Decrease in net assets from distributions to shareholders | (11,169,307 | ) | (5,426,237 | ) | ||||
| CAPITAL SHARE TRANSACTIONS | ||||||||
| Investor Class | ||||||||
| Proceeds from shares sold | 109,163 | 1,943,772 | ||||||
| Net asset value of shares issued in reinvestment of distributions to shareholders | 81,347 | 12,922 | ||||||
| Payments for shares redeemed | (592,521 | ) | (1,145,625 | ) | ||||
| Shares exchanged for Institutional Class (Note 1) | (280,169 | ) | — | |||||
| Net increase (decrease) in Investor Class net assets from capital share transactions | (682,180 | ) | 811,069 | |||||
| Institutional Class | ||||||||
| Proceeds from shares sold | 83,567,837 | 105,917,317 | ||||||
| Shares exchanged from Investor Class (Note 1) | 280,169 | — | ||||||
| Net asset value of shares issued in reinvestment of distributions to shareholders | 10,595,038 | 5,260,413 | ||||||
| Payments for shares redeemed | (135,500,819 | ) | (51,538,011 | ) | ||||
| Net increase (decrease) in Institutional Class net assets from capital share transactions | (41,057,775 | ) | 59,639,719 | |||||
| C Class | ||||||||
| Proceeds from shares sold | 1,603,514 | 3,274,546 | ||||||
| Net asset value of shares issued in reinvestment of distributions to shareholders | 149,400 | — | ||||||
| Payments for shares redeemed | (648,356 | ) | (201,356 | ) | ||||
| Net increase in C Class net assets from capital share transactions | 1,104,558 | 3,073,190 | ||||||
| TOTAL INCREASE (DECREASE) IN NET ASSETS | (99,585,334 | ) | 81,088,301 | |||||
| NET ASSETS | ||||||||
| Beginning of year | 153,146,788 | 72,058,487 | ||||||
| End of year | $ | 53,561,454 | $ | 153,146,788 | ||||
| (a) | Except for C Class information, which represents the period from the commencement of C Class operations (March 18, 2021) through November 30, 2021. |
See accompanying notes to financial statements.
16
| Q3 ALL-SEASON TACTICAL FUND |
| STATEMENTS OF CHANGES IN NET ASSETS (Continued) |
| Year Ended | Year Ended | |||||||
| November 30, | November 30, | |||||||
| 2022 | 2021 (a) | |||||||
| CAPITAL SHARE ACTIVITY | ||||||||
| Investor Class | ||||||||
| Shares sold | 9,427 | 152,382 | ||||||
| Shares reinvested | 6,466 | 1,109 | ||||||
| Shares redeemed | (63,402 | ) | (89,142 | ) | ||||
| Shares exchanged for Institutional Class (Note 1) | (31,382 | ) | — | |||||
| Net increase (decrease) in shares outstanding | (78,891 | ) | 64,349 | |||||
| Shares outstanding at beginning of year | 78,891 | 14,542 | ||||||
| Shares outstanding at end of year | — | 78,891 | ||||||
| Institutional Class | ||||||||
| Shares sold | 7,986,972 | 8,437,224 | ||||||
| Shares issued in connection with exchange of Investor Class shares (Note 1) | 30,727 | — | ||||||
| Shares reinvested | 829,682 | 448,841 | ||||||
| Shares redeemed | (13,613,101 | ) | (4,059,270 | ) | ||||
| Net increase (decrease) in shares outstanding | (4,765,720 | ) | 4,826,795 | |||||
| Shares outstanding at beginning of year | 10,785,817 | 5,959,022 | ||||||
| Shares outstanding at end of year | 6,020,097 | 10,785,817 | ||||||
| C Class | ||||||||
| Shares sold | 141,191 | 254,362 | ||||||
| Shares reinvested | 11,848 | — | ||||||
| Shares redeemed | (65,679 | ) | (15,547 | ) | ||||
| Net increase in shares outstanding | 87,360 | 238,815 | ||||||
| Shares outstanding at beginning of period | 238,815 | — | ||||||
| Shares outstanding at end of period | 326,175 | 238,815 | ||||||
| (a) | Except for C Class information, which represents the period from the commencement of C Class operations (March 18, 2021) through November 30, 2021. |
See accompanying notes to financial statements.
17
| Q3 ALL-SEASON SECTOR ROTATION FUND |
| INSTITUTIONAL CLASS |
| FINANCIAL HIGHLIGHTS |
Per Share Data for a Share Outstanding Throughout Each Period:
| Year Ended | Year Ended | Period Ended | ||||||||||
| November 30, | November 30, | November 30, | ||||||||||
| 2022 | 2021 | 2020 (a) | ||||||||||
| Net asset value at beginning of period | $ | 10.52 | $ | 9.94 | $ | 10.00 | ||||||
| Income (loss) from investment operations: | ||||||||||||
| Net investment loss (b)(c) | (0.03 | ) | (0.13 | ) | (0.11 | ) | ||||||
| Net realized and unrealized gains (losses) on investments | (0.45 | ) | 0.71 | 0.05 | (d) | |||||||
| Total from investment operations | (0.48 | ) | 0.58 | (0.06 | ) | |||||||
| Less distributions from: | ||||||||||||
| Net realized gains | (0.64 | ) | — | — | ||||||||
| Net asset value at end of period | $ | 9.40 | $ | 10.52 | $ | 9.94 | ||||||
| Total return (e) | (5.14 | %) | 5.83 | % | (0.60 | %) (f) | ||||||
| Net assets at end of period (000’s) | $ | 3,431 | $ | 6,048 | $ | 4,491 | ||||||
| Ratios/supplementary data: | ||||||||||||
| Ratio of total expenses to average net assets (g) | 5.46 | % | 4.20 | % | 6.10 | % (h) | ||||||
| Ratio of net expenses to average net assets (g)(i) | 1.94 | % | 1.94 | % | 1.94 | % (h) | ||||||
| Ratio of net investment loss to average net assets (c)(g)(i) | (0.34 | %) | (1.19 | %) | (1.31 | %) (h) | ||||||
| Portfolio turnover rate | 517 | % | 441 | % | 523 | % (f) | ||||||
| (a) | Represents the period from the commencement of operations (December 30, 2019) through November 30, 2020. |
| (b) | Per share net investment loss has been determined on the basis of average number of shares outstanding during the period. |
| (c) | Recognition of net investment loss by the Fund is affected by the timing of the declaration of dividends by the underlying companies in which the Fund invests. |
| (d) | Represents a balancing figure derived from other amounts in the financial highlights table that captures all other changes affecting net asset value per share. This per share amount does not correlate to the aggregate of the net realized and unrealized losses on the Statement of Operations for the same period. |
| (e) | Total return is a measure of the change in value of an investment in the Fund over the periods covered. The returns shown do not reflect the deduction of taxes a shareholder would pay on Fund distributions, if any, or the redemption of Fund shares. The total returns would be lower if the Adviser had not reduced advisory fees and/or reimbursed expenses (Note 4). |
| (f) | Not annualized. |
| (g) | The ratios of expenses and net investment loss to average net assets do not reflect the Fund’s proportionate share of expenses of the underlying investment companies in which the Fund invests. |
| (h) | Annualized. |
| (i) | Ratio was determined after fee reductions and/or expense reimbursements (Note 4). |
See accompanying notes to financial statements.
18
| Q3 ALL-SEASON TACTICAL FUND |
| INSTITUTIONAL CLASS |
| FINANCIAL HIGHLIGHTS |
Per Share Data for a Share Outstanding Throughout Each Period:
| Year Ended | Year Ended | Period Ended | ||||||||||
| November 30, | November 30, | November 30, | ||||||||||
| 2022 | 2021 | 2020 (a) | ||||||||||
| Net asset value at beginning of period | $ | 13.80 | $ | 12.06 | $ | 10.00 | ||||||
| Income (loss) from investment operations: | ||||||||||||
| Net investment loss (b)(c) | (0.06 | ) | (0.09 | ) | (0.11 | ) | ||||||
| Net realized and unrealized gains (losses) on investments | (4.30 | ) | 2.72 | 2.17 | ||||||||
| Total from investment operations | (4.36 | ) | 2.63 | 2.06 | ||||||||
| Less distributions from: | ||||||||||||
| Net realized gains | (0.99 | ) | (0.89 | ) | — | |||||||
| Net asset value at end of period | $ | 8.45 | $ | 13.80 | $ | 12.06 | ||||||
| Total return (d) | (34.03 | %) | 23.10 | % (e) | 20.60 | % (f) | ||||||
| Net assets at end of period (000’s) | $ | 50,871 | $ | 148,813 | $ | 71,884 | ||||||
| Ratios/supplementary data: | ||||||||||||
| Ratio of total expenses to average net assets (g) | 1.36 | % | 1.32 | % | 1.55 | % (h) | ||||||
| Ratio of net investment loss to average net assets (c)(g) | (0.59 | %) | (0.73 | %) | (1.10 | %) (h) | ||||||
| Portfolio turnover rate (i) | 3770 | % | 1639 | % | 3078 | % (f) | ||||||
| (a) | Represents the period from the commencement of operations (December 30, 2019) through November 30, 2020. |
| (b) | Per share net investment loss has been determined on the basis of average number of shares outstanding during the period. |
| (c) | Recognition of net investment loss by the Fund is affected by the timing of the declaration of dividends by the underlying companies in which the Fund invests. |
| (d) | Total return is a measure of the change in value of an investment in the Fund over the periods covered. The returns shown do not reflect the deduction of taxes a shareholder would pay on Fund distributions, if any, or the redemption of Fund shares. |
| (e) | During the year ended November 30, 2021, the Fund received a payment from the Advisor of $336,826 for losses realized on the disposal of the investments purchased in violation of investment restrictions, which otherwise would have reduced the total return by 0.27%. |
| (f) | Not annualized. |
| (g) | The ratios of expenses and net investment loss to average net assets do not reflect the Fund’s proportionate share of expenses of the underlying investment companies in which the Fund invests. |
| (h) | Annualized. |
| (i) | Given market conditions since inception, the Fund rotated assets into, and out of, positions on a periodic basis due to its tactical trading mandate, and the Fund’s portfolio was therefore traded frequently. |
See accompanying notes to financial statements.
19
| Q3 ALL-SEASON TACTICAL FUND |
| C SHARE CLASS |
| FINANCIAL HIGHLIGHTS |
Per Share Data for a Share Outstanding Throughout Each Period:
| Year Ended | Period Ended | |||||||
| November 30, | November 30, | |||||||
| 2022 | 2021 (a) | |||||||
| Net asset value at beginning of period | $ | 13.65 | $ | 11.53 | ||||
| Income (loss) from investment operations: | ||||||||
| Net investment loss (b)(c) | (0.17 | ) | (0.22 | ) | ||||
| Net realized and unrealized gains (losses) on investments | (4.24 | ) | 2.34 | |||||
| Total from investment operations | (4.41 | ) | 2.12 | |||||
| Less distributions from: | ||||||||
| Net realized gains | (0.99 | ) | — | |||||
| Net asset value at end of period | $ | 8.25 | $ | 13.65 | ||||
| Total return (d) | (34.82 | %) | 18.39 | % (e)(f) | ||||
| Net assets at end of period (000’s) | $ | 2,690 | $ | 3,260 | ||||
| Ratios/supplementary data: | ||||||||
| Ratio of total expenses to average net assets (g) | 2.65 | % | 2.72 | % (h) | ||||
| Ratio of net investment loss to average net assets (c)(g) | (1.73 | %) | (2.42 | %) (h) | ||||
| Portfolio turnover rate (i) | 3770 | % | 1639 | % (j) | ||||
| (a) | Represents the period from the commencement of operations (March 18, 2021) through November 30, 2021. |
| (b) | Per share net investment loss has been determined on the basis of average number of shares outstanding during the period. |
| (c) | Recognition of net investment loss by the Fund is affected by the timing of the declaration of dividends by the underlying companies in which the Fund invests. |
| (d) | Total return is a measure of the change in value of an investment in the Fund over the period covered. The returns shown do not reflect the deduction of taxes a shareholder would pay on Fund distributions, if any, or the redemption of Fund shares. |
| (e) | During the year ended November 30, 2021, the Fund received a payment from the Advisor of $336,826 for losses realized on the disposal of the investments purchased in violation of investment restrictions, which otherwise would have reduced the total return by 0.26%. |
| (f) | Not annualized. |
| (g) | The ratios of expenses and net investment loss to average net assets do not reflect the Fund’s proportionate share of expenses of the underlying investment companies in which the Fund invests. |
| (h) | Annualized. |
| (i) | Given market conditions since inception, the Fund rotated assets into, and out of, positions on a periodic basis due to its tactical trading mandate, and the Fund’s portfolio was traded frequently. |
| (j) | Represents the year ended November 30, 2021. |
See accompanying notes to financial statements.
20
| Q3 ALL-SEASON FUNDS |
| NOTES TO FINANCIAL STATEMENTS |
| November 30, 2022 |
1. Organization
Q3 All-Season Sector Rotation Fund (formerly, Q3 All-Weather Sector Rotation Fund) and Q3 All-Season Tactical Fund (formerly, Q3 All-Weather Tactical Fund) (individually, a “Fund” and collectively, the “Funds”) are each a diversified series of Ultimus Managers Trust (the “Trust”), an open-end investment company established as an Ohio business trust under a Declaration of Trust dated February 28, 2012. Other series of the Trust are not incorporated in this report. The Funds commenced operations on December 30, 2019.
Q3 All-Season Sector Rotation Fund seeks to achieve long-term growth of capital.
Q3 All-Season Tactical Fund seeks a positive rate of return over a calendar year regardless of market conditions.
The Q3 All-Season Sector Rotation Fund currently offers one class of shares: Institutional Class shares (sold without any sales loads, but subject to an administrative services plan fee of up to 0.25% and requiring a $100,000 initial investment). Prior to August 30, 2022, Q3 All-Season Sector Rotation Fund offered two classes of shares: Investor Class shares (sold without any sales loads, but subject to a distribution and/or shareholder service fee of up to 0.25% of the average daily net assets attributable to Investor Class shares and requiring a $1,250 minimum initial investment) and Institutional Class shares (sold without any sales loads, but subject to an administrative services plan fee of up to 0.25% and requiring a $500,000 initial investment). On August 30, 2022, all existing Investor Class shares were converted into Institutional Class shares at the Institutional Class net asset value (“NAV”) per share as of August 29, 2022, which was $9.21. After August 30, 2022, Investor Class shares were no longer offered.
The Q3 All-Season Tactical Fund currently offers two classes of shares: Institutional Class shares (sold without any sales loads, but subject to an administrative services plan fee of up to 0.25% and requiring a $100,000 initial investment) and C Class shares (sold without any sales loads, but subject to a distribution and/or shareholder service fee of up to 1.00% of the average daily net assets attributable to C Class shares and requiring a $1,000 minimum initial investment). Each share class represents an ownership interest in the same investment portfolio. Prior to August 30, 2022, Q3 All-Season Tactical Fund offered three classes of shares: Investor Class shares (sold without any sales loads, but subject to a distribution and/or shareholder service fee of up to 0.25% of the average daily net assets attributable to Investor Class shares and requiring a $1,250 minimum initial investment), Institutional Class shares (sold without any sales loads, but subject to an administrative services plan fee of up to 0.25% and requiring a $500,000 initial investment) and C Class shares (sold without any sales loads, but subject to a distribution and/or shareholder service fee of up to 1.00% of the average daily net assets attributable to C Class shares and requiring a $1,000 minimum initial investment). On August 30,
21
| Q3 ALL-SEASON FUNDS |
| NOTES TO FINANCIAL STATEMENTS (Continued) |
2022, all existing Investor Class shares were converted into Institutional Class shares at the Institutional Class NAV per share as of August 29, 2022, which was $9.12. After August 30, 2022, Investor Class shares were no longer offered.
2. Significant Accounting Policies
The following is a summary of the Funds’ significant accounting policies. The policies are in conformity with accounting principles generally accepted in the United States of America (“GAAP”). The Funds follow accounting and reporting guidance under Financial Accounting Standards Board Accounting Standards Codification Topic 946, “Financial Services – Investment Companies.”
Securities valuation – Each Fund values its portfolio securities at market value as of the close of regular trading on the New York Stock Exchange (the “NYSE”) (normally 4:00 p.m. Eastern time) on each business day the NYSE is open for business. Exchange-traded funds (“ETFs”) are valued at the security’s last sale price on the primary exchange, if available, otherwise at the exchange’s most recently quoted mean price. Investments representing shares of other open-end investment companies, except ETFs but including money market funds, are valued at their net asset value (“NAV”) as reported by such companies. When using a quoted price and when the market is considered active, these securities will be classified as Level 1 within the fair value hierarchy (see below). In the event that market quotations are not readily available or are considered unreliable due to market or other events, the Funds value their securities and other assets at fair value pursuant to procedures adopted by the Board of Trustees of the Trust (the “Board”). Under these procedures, the securities will be classified as Level 2 or 3 within the fair value hierarchy, depending on the inputs used. Unavailable or unreliable market quotes may be due to the following factors: a substantial bid-ask spread; infrequent sales resulting in stale prices; insufficient trading volume; small trade sizes; a temporary lapse in any reliable pricing source; and actions of the securities or futures markets, such as the suspension or limitation of trading. As a result, the prices of securities used to calculate each Fund’s NAV may differ from quoted or published prices for the same securities.
GAAP establishes a single authoritative definition of fair value, sets out a framework for measuring fair value, and requires additional disclosures about fair value measurements.
Various inputs are used in determining the value of each Fund’s investments. These inputs are summarized in the three broad levels listed below:
| ● | Level 1 – quoted prices in active markets for identical securities |
| ● | Level 2 – other significant observable inputs |
| ● | Level 3 – significant unobservable inputs |
The inputs or methods used for valuing securities are not necessarily an indication of the risks associated with investing in those securities. The inputs used to measure fair value may fall into different levels of the fair value hierarchy. In such cases, for disclosure
22
| Q3 ALL-SEASON FUNDS |
| NOTES TO FINANCIAL STATEMENTS (Continued) |
purposes, the level in the fair value hierarchy within which the fair value measurement falls in its entirety is determined based on the lowest level input that is significant to the fair value measurement.
The following is a summary of each Fund’s investments and the inputs used to value the investments as of November 30, 2022:
| Q3 All-Season Sector Rotation Fund | Level 1 | Level 2 | Level 3 | Total | ||||||||||||
| Exchange-Traded Funds | $ | 1,696,268 | $ | — | $ | — | $ | 1,696,268 | ||||||||
| Money Market Funds | 1,731,190 | — | — | 1,731,190 | ||||||||||||
| Total | $ | 3,427,458 | $ | — | $ | — | $ | 3,427,458 | ||||||||
| Q3 All-Season Tactical Fund | Level 1 | Level 2 | Level 3 | Total | ||||||||||||
| Exchange-Traded Funds | $ | 49,159,120 | $ | — | $ | — | $ | 49,159,120 | ||||||||
| Money Market Funds | 48,713,624 | — | — | 48,713,624 | ||||||||||||
| Total | $ | 97,872,744 | $ | — | $ | — | $ | 97,872,744 | ||||||||
The Funds did not hold any derivative instruments or any assets or liabilities that were measured at fair value on a recurring basis using significant unobservable inputs (Level 3) as of or during the year ended November 30, 2022.
Share valuation – The NAV per share of each class of each Fund is calculated daily by dividing the total value of the assets attributable to that class, less liabilities attributable to that class, by the number of shares outstanding of that class. The offering price and redemption price per share of each class of each Fund is equal to the NAV per share of such class.
Investment income – Dividend income is recorded on the ex-dividend date. Non-cash dividends included in dividend income, if any, are recorded at the fair value of the security received.
Investment transactions – Investment transactions are accounted for on the trade date. Realized gains and losses on investments sold are determined on a specific identification basis.
Allocation between classes – Investment income earned, realized capital gains and losses, and unrealized appreciation and depreciation are allocated daily to each Class of a Fund based upon its proportionate share of total net assets of that Fund. Class-specific expenses are charged directly to the class incurring the expense. Common expenses which are not attributable to a specific class are allocated daily to each class of shares of a Fund based upon its proportionate share of total net assets of that Fund.
23
| Q3 ALL-SEASON FUNDS |
| NOTES TO FINANCIAL STATEMENTS (Continued) |
Common expenses – Common expenses of the Trust are allocated among the Funds and the other series of the Trust based on the relative net assets of each series, the number of series in the Trust, or the nature of the services performed and the relative applicability to each series.
Distributions to shareholders – Dividends arising from net investment income, if any, are declared and paid quarterly to shareholders of each Fund. Net realized capital gains, if any, are distributed at least once each year. The amount of such dividends and distributions are determined in accordance with federal income tax regulations, which may differ from GAAP. Dividends and distributions to shareholders are recorded on the ex-dividend date. The tax character of distributions paid to shareholders by the Funds during the years ended November 30, 2022 and 2021 was as follows:
| Year | Ordinary | Long-Term | Total | |||||||||||
| Ended | Income | Capital Gains | Distributions | |||||||||||
| Q3 All-Season Sector Rotation Fund | 11/30/2022 | $ | 353,795 | $ | 36,048 | $ | 389,843 | |||||||
| 11/30/2021 | $ | — | $ | — | $ | — | ||||||||
| Q3 All-Season Tactical Fund | 11/30/2022 | $ | 11,169,307 | $ | — | $ | 11,169,307 | |||||||
| 11/30/2021 | $ | 5,426,237 | $ | — | $ | 5,426,237 | ||||||||
Estimates – The preparation of financial statements in conformity with GAAP requires management to make estimates and assumptions that affect the reported amounts of assets and liabilities and disclosure of contingent assets and liabilities as of the date of the financial statements and the reported amounts of increase (decrease) in net assets from operations during the reporting period. Actual results could differ from those estimates.
Federal income tax – Each Fund has qualified and intends to continue to qualify as a regulated investment company under the Internal Revenue Code of 1986, as amended (the “Code”). Qualification generally will relieve the Funds of liability for federal income taxes to the extent 100% of their net investment income and net realized capital gains are distributed in accordance with the Code.
In order to avoid imposition of the excise tax applicable to regulated investment companies, it is also each Fund’s intention to declare as dividends in each calendar year at least 98% of its net investment income (earned during the calendar year) and 98.2% of its net realized capital gains (earned during the twelve months ended October 31) plus undistributed amounts from prior years.
24
| Q3 ALL-SEASON FUNDS |
| NOTES TO FINANCIAL STATEMENTS (Continued) |
The following information is computed on a tax basis for each item as of November 30, 2022:
| Q3 All-Season | ||||||||
| Sector | Q3 All-Season | |||||||
| Rotation Fund | Tactical Fund | |||||||
| Tax cost of portfolio investments | $ | 3,260,765 | $ | 103,241,655 | ||||
| Gross unrealized appreciation | $ | 166,693 | $ | — | ||||
| Gross unrealized depreciation | — | (5,368,911 | ) | |||||
| Net unrealized appreciation (depreciation) | 166,693 | (5,368,911 | ) | |||||
| Accumulated capital and other losses | (743,726 | ) | (27,782,836 | ) | ||||
| Accumulated deficit | $ | (577,033 | ) | $ | (33,151,747 | ) | ||
The difference between the federal income tax cost of portfolio investments and the financial statement cost of portfolio investments for the Funds is due to certain timing differences in the recognition of capital gains or losses under income tax regulations and GAAP. These “book/tax” differences are temporary in nature and are primarily due to the tax deferral of losses on wash sales.
Qualified late year ordinary losses incurred after December 31, 2021 and within the taxable year are deemed to arise on the first day of the Fund’s next taxable year. For the year ended November 30, 2022, Q3 All-Season Sector Rotation Fund and Q3 All-Season Tactical Fund deferred late year ordinary losses to December 1, 2022 for federal income tax purposes in the amounts of $17,865 and $572,879, respectively.
As of November 30, 2022, Q3 All-Season Sector Rotation Fund and Q3 All-Season Tactical Fund had short-term capital loss carryforwards (“CLCFs”) for income tax purposes in the amount of $725,861 and $27,209,957, respectively. These CLCFs, which do not expire, may be utilized in future years to offset net realized capital gains, if any, prior to distributing such gains to shareholders.
For the year ended November 30, 2022, Q3All-Season Sector Rotation Fund and Q3 All-Season Tactical Fund reclassified $47 and $55,642, respectively, of accumulated deficit against paid-in capital on the Statements of Assets and Liabilities. Such reclassifications, the result of permanent differences between the financial statement and income tax reporting requirements, had no effect on each Fund’s net assets or NAV per share.
The Funds recognize the tax benefits or expenses of uncertain tax positions only when the position is “more likely than not” of being sustained assuming examination by tax authorities. Management has reviewed each Fund’s tax positions for all open tax years (generally, three years) and has concluded that no provision for unrecognized tax benefits or expenses is required in these financial statements. The Funds identify their major tax jurisdiction as U.S. Federal.
25
| Q3 ALL-SEASON FUNDS |
| NOTES TO FINANCIAL STATEMENTS (Continued) |
3. Investment Transactions
For the year ended November 30, 2022, cost of purchases and proceeds from sales of investment securities, other than short-term investments, amounted to $20,158,087 and $24,477,891, respectively, for Q3 All-Season Sector Rotation Fund and $2,496,662,594 and $2,527,628,346, respectively, for Q3 All-Season Tactical Fund.
4. Transactions with Related Parties
INVESTMENT MANAGEMENT AGREEMENT
The Funds’ investments are managed by Q3 Asset Management Corporation (the “Adviser”) pursuant to the terms of an Investment Management Agreement. Each Fund pay the Adviser an investment management fee, computed and accrued daily and paid monthly, at the annual rate of 1.00% of average daily net assets. During the year ended November 30, 2022, the Adviser earned $47,759 and $1,017,203 of fees under the Investment Management Agreement for Q3 All-Season Sector Rotation Fund and Q3 All-Season Tactical Fund, respectively.
Pursuant to an Expense Limitation Agreement (“ELA”) between each Fund and the Adviser, the Adviser has contractually agreed, until March 31, 2023, to reduce investment management fees and reimburse other expenses to the extent necessary to limit total annual fund operating expenses of each Fund (exclusive of brokerage costs; taxes; interest; borrowing costs such as interest and dividend expenses on securities sold short; costs to organize the Fund; acquired fund fees and expenses; extraordinary expenses such as litigation and merger or reorganization costs; and other expenses not incurred in the ordinary course of the Fund’s business) to an amount not exceeding the following percentages of average daily net assets attributable to each respective class, if applicable:
| Institutional Class | C Class |
| 1.94% | 2.94% |
Accordingly, during the year ended November 30, 2022, the Adviser did not collect any of its management fees and reimbursed other operating expenses of $121,979 for Q3 All-Season Sector Rotation Fund of which $3,328 related to the Investor Class and is therefore no longer recoverable. In addition, the Adviser reimbursed other operating expenses of $2,542 related to the Investor Class for Q3 All-Season Tactical Fund and therefore is no longer recoverable.
Under the terms of the ELA, investment management fee reductions and expense reimbursements by the Adviser are subject to repayment by the Funds for a period of thirty-six months after the date on which such fees and expenses were incurred or waived, provided that the repayments do not cause total annual fund operating expenses (exclusive of such reductions and reimbursements) to exceed (i) the expense limitation
26
| Q3 ALL-SEASON FUNDS |
| NOTES TO FINANCIAL STATEMENTS (Continued) |
then in effect, if any, and (ii) the expense limitation in effect at the time the expenses to be repaid were incurred. As of November 30, 2022, the Adviser may seek repayment of expense reimbursements no later than the dates below:
| Q3 All-Season | ||||
| Sector Rotation Fund | ||||
| November 30, 2023 | $ | 129,682 | ||
| November 30, 2024 | 139,638 | |||
| November 30, 2025 | 166,410 | |||
| Total | $ | 435,730 | ||
OTHER SERVICE PROVIDERS
Ultimus Fund Solutions, LLC (“Ultimus”) provides administration, fund accounting, compliance and transfer agency services to the Funds. The Funds pay Ultimus fees in accordance with the agreements for such services. In addition, the Funds pay out-of-pocket expenses including, but not limited to, postage, supplies, and certain costs related to the pricing of the Funds’ portfolio securities.
Under the terms of a Distribution Agreement with the Trust, Ultimus Fund Distributors, LLC (the “Distributor”) serves as the principal underwriter to the Funds. The Distributor is a wholly-owned subsidiary of Ultimus. The Distributor is compensated partially by the Adviser and partially by the C Class shares of Q3 All-Season Tactical Fund for acting as principal underwriter. Prior to August 30, 2022, the Distributor was also compensated partially by the Investor Class shares of the Funds.
A Trustee and certain officers of the Trust are also officers of Ultimus.
DISTRIBUTION PLAN
The Q3 All-Season Tactical Fund has adopted a plan of distribution (the “Plan”), pursuant to Rule 12b-1 under the Investment Company Act of 1940, as amended (the “1940 Act”), which permits C Class shares of the Q3 All-Season Tactical Fund to directly incur or reimburse the Funds’ principal underwriter for certain expenses related to the distribution of its shares. The annual limitation for payment of expenses pursuant to the Plan 1.00% of the Q3 All-Season Tactical Fund’s average daily net assets allocable to C Class shares. The Funds have not adopted a plan of distribution with respect to the Institutional Class shares. During the year ended November 30, 2022, the C Class shares of Q3 All-Season Tactical Fund incurred $31,924 of distribution fees under the Plan.
The Plan was terminated for Investor Class shares of the Funds as of August 30, 2022. Prior to August 30, 2022, the Funds’ Plan permitted Investor Class shares of each Fund to directly incur or reimburse the Funds’ principal underwriter for certain expenses related to the distribution of its shares. The annual limitation for payment of expenses pursuant to the Plan was 0.25% of each Fund’s average daily net assets allocable to Investor Class
27
| Q3 ALL-SEASON FUNDS |
| NOTES TO FINANCIAL STATEMENTS (Continued) |
shares. During the year ended November 30, 2022, the Investor Class shares of Q3 All-Season Sector Rotation Fund and Q3 All-Season Tactical Fund incurred $660 and $1,604, respectively of distribution fees under the Plan.
ADMINISTRATIVE SERVICES PLAN
The Trust has adopted an Administrative Services Plan (the “Administrative Service Plan”) for the Institutional Shares of the Funds. The Administrative Service Plan allows the Funds to use the net assets of the Institutional Shares to pay financial intermediaries that provide services relating to Institutional Shares. The Administrative Service Plan permits payments for the provision of certain administrative, recordkeeping and other non-distribution related services to Institutional Share shareholders. The Administrative Service Plan permits the Funds to make service fee payments at an annual rate of up to 0.25% of each Fund’s average daily net assets attributable to its Institutional Shares. During the year ended November 30, 2022, no fees were incurred by the Funds under the Administrative Service Plan.
TRUSTEE COMPENSATION
Effective October 17, 2022, each member of the Board (a “Trustee”) who is not an “interested person” (as defined by the 1940 Act, as amended) of the Trust (“Independent Trustee”) receives a $1,300 annual retainer from each Fund, paid quarterly, except for the Board Chairperson who receives a $1,700 annual retainer from each Fund, paid quarterly and the Audit Committee Chairperson who receives a $1,500 annual retainer from each Fund, paid quarterly. Each Independent Trustee also receives from each Fund a fee of $550 for each Board meeting attended plus reimbursement for travel and other meeting-related expenses. Prior to October 17, 2022, no annual retainer was designated specifically for the Audit Committee Chairperson and the Audit Committee Chairperson received a $1,300 annual retainer from each Fund.
PRINCIPAL HOLDERS OF FUND SHARES
As of November 30, 2022, the following shareholders owned of record 25% or more of the outstanding shares of the Funds:
| NAME OF RECORD OWNER | % Ownership | |
| Q3 | All-Season Sector Rotation Fund - Institutional Class | |
| E*TRADE Savings Bank (for the benefit of its customers) | 34% | |
| Q3 | All-Season Tactical Fund - Institutional Class | |
| E*TRADE Savings Bank (for the benefit of its customers) | 53% | |
| TD Ameritrade, Inc. (for the benefit of its customers) | 30% | |
| Q3 | All-Season Tactical Fund - C Class | |
| Pershing LLC (for the benefit of its customers) | 90% | |
28
| Q3 ALL-SEASON FUNDS |
| NOTES TO FINANCIAL STATEMENTS (Continued) |
A beneficial owner of 25% or more of a Fund’s outstanding shares may be considered a controlling person of the Fund. That shareholder’s vote could have a more significant effect on matters presented at a shareholders’ meeting.
5. Borrowing Costs
From time to time, the Funds may have an overdrawn cash balance at the custodian due to redemptions or market movements. When this occurs, the Funds will incur borrowing costs charged by the custodian. Accordingly, during the year ended November 30, 2022, Q3 All-Season Sector Fund and Q3 All-Season Tactical Fund did not incur any borrowing cost by the custodian.
6. Investments in Other Investment Companies
Each Fund may invest a significant portion of its assets in shares of one or more investment companies, including ETFs, open-end mutual funds and money market mutual funds. Each Fund will incur additional indirect expenses (acquired fund fees and expenses) to the extent it invests in shares of other investment companies. As of November 30, 2022, Q3 All-Season Sector Rotation Fund had 49.4% of the value of its net assets invested in ETFs. As of November 30, 2022, Q3 All-Season Tactical Fund had 50.4% of the value of its net assets invested in Invesco QQQ Trust, Series 1 (“QQQ”), an ETF that tracks the Nasdaq 100 Index and 41.4% of the value of its net assets invested in ProShares Short 20+ Year Treasury (“TBF”), an ETF that corresponds to the inverse (-1x) of the daily performance of the ICE U.S. Treasury 20+ Year Bond Index. The financial statements of QQQ and TBF can be found at www.sec.gov.
In order to maintain sufficient liquidity to implement investment strategies, or for temporary defensive purposes, a Fund may at times invest a significant portion of its assets in shares of a money market fund. As of November 30, 2022, Q3 All-Season Sector Rotation Fund and Q3 All-Season Tactical Fund had 50.5% and 90.9% of the value of their net assets invested in shares of First American Government Obligations Fund - Class X (“FGXXX”), a money market fund registered under the 1940 Act, respectively. An investment in a money market fund is not insured or guaranteed by the Federal Deposit Insurance Corporation or any other government agency, entity or person. While investor losses in money market funds have been rare, they are possible. A Fund incurs additional indirect expenses due to acquired fund fees and expenses to the extent it invests in shares of money market funds. The financial statements for FGXXX can be found at www.sec.gov.
7. Contingencies and Commitments
The Funds indemnify the Trust’s officers and Trustees for certain liabilities that might arise from their performance of their duties to the Funds. Additionally, in the normal course of business the Funds enter into contracts that contain a variety of representations and warranties and which provide general indemnifications. The Funds’ maximum exposure
29
| Q3 ALL-SEASON FUNDS |
| NOTES TO FINANCIAL STATEMENTS (Continued) |
under these arrangements is unknown, as this would involve future claims that may be made against the Funds that have not yet occurred. However, based on experience, the Funds expect the risk of loss to be remote.
10. Subsequent Events
The Funds are required to recognize in the financial statements the effects of all subsequent events that provide additional evidence about conditions that existed as of the date of the Statements of Assets and Liabilities. For non-recognized subsequent events that must be disclosed to keep the financial statements from being misleading, the Funds are required to disclose the nature of the event as well as an estimate of its financial effect, or a statement that such an estimate cannot be made. Management has evaluated subsequent events through the issuance of these financial statements and has noted no such events.
30
| Q3 ALL-SEASON FUNDS |
| REPORT OF INDEPENDENT REGISTERED |
| PUBLIC ACCOUNTING FIRM |
To the Board of Trustees of Ultimus Managers Trust
and the Shareholders of Q3 All-Season Sector Rotation Fund and
Q3 All-Season Tactical Fund
Opinion on the Financial Statements
We have audited the accompanying statements of assets and liabilities of Q3 All-Season Sector Rotation Fund (formerly Q3 All-Weather Sector Rotation Fund) and Q3 All-Season Tactical Fund (formerly Q3 All-Weather Tactical Fund), each a series of shares of beneficial interest in Ultimus Managers Trust (the “Funds”), including the schedules of investments, as of November 30, 2022, and the related statements of operations for the year then ended, and the statements of changes in net assets and the financial highlights as noted in the table below, and the related notes (collectively referred to as the “financial statements”). In our opinion, the financial statements present fairly, in all material respects, the financial position of the Funds as of November 30, 2022, and the results of their operations for the year then ended, and the changes in their net assets and their financial highlights as noted in the table below, in conformity with accounting principles generally accepted in the United States of America.
| Fund | Statements
of Changes in Net Assets and Financial Highlights Presented |
| Q3 All-Season Sector Rotation Fund | The
statements of changes in net assets for each of the years in the two-year period ended November 30, 2022. The financial highlights for each of the years in the two-year period ended November 30, 2022 and for the period from December 30, 2019 (commencement of operations) through November 30, 2020 |
| Q3 All-Season Tactical Fund | For
Institutional Class: The statements of changes in net assets for each of the years in the two-year period ended November 30, 2022
and the financial highlights for each of the years in the two-year period ended November 30, 2022 and for the period from December
30, 2019 (commencement of operations) through November 30, 2020 For Class C: The statements of changes in net assets and the financial highlights for the year ended November 30, 2022 and for the period from March 18, 2021 (commencement of operations) through November 30, 2021 |
31
| Q3 ALL-SEASON FUNDS |
| REPORT OF INDEPENDENT REGISTERED |
| PUBLIC ACCOUNTING FIRM (Continued) |
Basis for Opinion
These financial statements are the responsibility of the Funds’ management. Our responsibility is to express an opinion on the Funds’ financial statements based on our audits. We are a public accounting firm registered with the Public Company Accounting Oversight Board (United States) (“PCAOB”) and are required to be independent with respect to the Funds in accordance with the U.S. federal securities law and the applicable rules and regulations of the Securities and Exchange Commission and the PCAOB.
We conducted our audits in accordance with the standards of the PCAOB. Those standards require that we plan and perform the audits to obtain reasonable assurance about whether the financial statements are free of material misstatement, whether due to error or fraud. The Funds are not required to have, nor were we engaged to perform, an audit of their internal control over financial reporting. As part of our audits we are required to obtain an understanding of internal control over financial reporting but not for the purpose of expressing an opinion on the effectiveness of the Funds’ internal control over financial reporting. Accordingly, we express no such opinion.
Our audits included performing procedures to assess the risk of material misstatement of the financial statements, whether due to error or fraud, and performing procedures that respond to those risks. Such procedures included examining, on a test basis, evidence regarding the amounts and disclosures in the financial statements. Our procedures included confirmation of securities owned as of November 30, 2022 by correspondence with the custodian and broker. Our audits also included evaluating the accounting principles used and significant estimates made by management, as well as evaluating the overall presentation of the financial statements. We believe that our audits provide a reasonable basis for our opinion.

BBD, LLP
We have served as the auditor of one or more of the Funds in the Ultimus Managers Trust since 2013.
Philadelphia, Pennsylvania
January 26, 2023
32
| Q3 ALL-SEASON FUNDS |
| ABOUT YOUR FUNDS’ EXPENSES (Unaudited) |
We believe it is important for you to understand the impact of costs on your investment. As a shareholder of the Funds, you incur ongoing costs, including management fees, class-specific expenses (such as distribution fees) and other operating expenses. The following examples are intended to help you understand your ongoing costs (in dollars) of investing in the Funds and to compare these costs with the ongoing costs of investing in other mutual funds.
A mutual fund’s ongoing costs are expressed as a percentage of its average net assets. This figure is known as the expense ratio. The expenses in the table below are based on an investment of $1,000 made at the beginning of the most recent period (June 1, 2022) and held until the end of the period (November 30, 2022).
The table below illustrates each Fund’s ongoing costs in two ways:
Actual fund return – This section helps you to estimate the actual expenses that you paid over the period. The “Ending Account Value” shown is derived from each Fund’s actual return, and the fourth column shows the dollar amount of operating expenses that would have been paid by an investor who started with $1,000 in the Funds. You may use the information here, together with the amount you invested, to estimate the expenses that you paid over the period.
To do so, simply divide your account value by $1,000 (for example, an $8,600 account value divided by $1,000 = 8.6), then multiply the result by the number given for the Funds under the heading “Expenses Paid During Period.”
Hypothetical 5% return – This section is intended to help you compare each Fund’s ongoing costs with those of other mutual funds. It assumes that the Funds had an annual return of 5% before expenses during the period shown, but that the expense ratio is unchanged. In this case, because the return used is not each Fund’s actual return, the results do not apply to your investment. The example is useful in making comparisons because the U.S. Securities and Exchange Commission (the “SEC”) requires all mutual funds to calculate expenses based on a 5% return. You can assess each Fund’s ongoing costs by comparing this hypothetical example with the hypothetical examples that appear in shareholder reports of other funds.
Note that expenses shown in the table are meant to highlight and help you compare ongoing costs only. The Funds do not charge transaction fees, such as purchase or redemption fees, nor do they carry a “sales load.”
The calculations assume no shares were bought or sold during the period. Your actual costs may have been higher or lower, depending on the amount of your investment and the timing of any purchases or redemptions.
33
| Q3 ALL-SEASON FUNDS |
| ABOUT YOUR FUNDS’ EXPENSES (Unaudited) (Continued) |
More information about each Fund’s expenses can be found in this report. For additional information on operating expenses and other shareholder costs, please refer to each Fund’s prospectus.
| Ending | ||||||||
| Beginning | Account Value | Net | Expenses | |||||
| Account Value | November 30, | Expense | Paid During | |||||
| June 1, 2022 | 2022 | Ratio (a) | Period (b) | |||||
| Q3 All-Season Sector Rotation Fund | ||||||||
| Institutional Class | ||||||||
| Based on Actual Fund Return | $1,000.00 | $994.70 | 1.94% | $9.70 | ||||
| Based on Hypothetical 5% Return (before expenses) | $1,000.00 | $1,015.34 | 1.94% | $9.80 | ||||
| Q3 All-Season Tactical Fund | ||||||||
| Institutional Class | ||||||||
| Based on Actual Fund Return | $1,000.00 | $904.70 | 1.44% | $6.88 | ||||
| Based on Hypothetical 5% Return (before expenses) | $1,000.00 | $1,017.85 | 1.44% | $7.28 | ||||
| C Class | ||||||||
| Based on Actual Fund Return | $1,000.00 | $898.70 | 2.72% | $12.95 | ||||
| Based on Hypothetical 5% Return (before expenses) | $1,000.00 | $1,011.43 | 2.72% | $13.72 |
| (a) | Annualized, based on each Class’s most recent one-half year expenses. |
| (b) | Expenses are equal to each Class’s annualized net expense ratio multiplied by the average account value over the period, multiplied by 183/365 (to reflect the one-half year period), for Actual and Hypothectical Return information, respectively. |
34
| Q3 ALL-SEASON FUNDS |
| OTHER INFORMATION (Unaudited) |
A description of the policies and procedures that the Funds use to vote proxies relating to portfolio securities is available without charge upon request by calling toll-free 1-855-784-2399, or on the SEC’s website at www.sec.gov. Information regarding how the Funds voted proxies relating to portfolio securities during the most recent 12-month period ended June 30 is available without charge upon request by calling toll-free 1-855-784-2399, or on the SEC’s website at www.sec.gov.
The Trust files a complete listing of portfolio holdings for the Funds with the SEC as of the end of the first and third quarters of each fiscal year as an exhibit to its reports on Form N-PORT. These filings are available upon request by calling 1-855-784-2399. Furthermore, you may obtain a copy of the filings on the SEC’s website at www.sec.gov and on the Funds’ website at www.Q3AllSeasonfunds.com.
| Q3 ALL-SEASON FUNDS |
| FEDERAL TAX INFORMATION (Unaudited) |
For the year ended November 30, 2022, Q3 All-Season Sector Rotation Fund designated $36,048 as long-term capital gain distributions.
Qualified Dividend Income - The Funds have designated the following of their ordinary income dividends, or up to the maximum amount of such dividends allowable pursuant to the Internal Revenue Code, as qualified dividend income eligible for the reduced tax rate:
| Q3 | All-Season Sector Rotation Fund | 10.72% |
| Q3 | All- Season Tactical Fund | 3.20% |
Dividends Received Deduction - For corporate shareholders, the following percentages of ordinary dividends paid during the year ended November 30, 2022 qualify for the corporate dividends received deduction:
| Q3 | All-Season Sector Rotation Fund | 8.71% |
| Q3 | All- Season Tactical Fund | 3.44% |
35
| Q3 ALL-SEASON SECTOR ROTATION FUND AND Q3 ALL-SEASON |
| TACTICAL FUND DISCLOSURE REGARDING APPROVAL OF |
| INVESTMENT ADVISORY AGREEMENT (Unaudited) |
The Board of Trustees (the “Board”), including the Independent Trustees voting separately, has reviewed and approved the Funds’ Investment Advisory Agreement with Q3 Asset Management Corporation (the “Adviser” or “Q3AM”) for an additional one-year term (the “Advisory Agreement”). The Board approved the Advisory Agreement at a meeting held on October 17 – 18, 2022, at which all of the Trustees were present.
In deciding on whether to approve the continuation of the Q3 Advisory Agreement for the Funds, the Board recalled its review of the materials related to the Funds and Q3AM at the meeting and throughout the preceding twelve months and its numerous discussions with Trust Management and Q3AM about the operations and performance of the Funds during that period. The Board further considered those materials and discussions and other numerous factors, including the following:
The nature, extent, and quality of the services provided by the Adviser. In this regard, the Board reviewed the services being provided by the Adviser to the Funds including, without limitation, its providing a continuous investment program for the Funds, adhering to each of the Funds’ investment restrictions, complying with the Trust’s policies and procedures and voting proxies on behalf of the Funds. The Board considered the qualifications and experience of the Adviser’s portfolio managers who are responsible for the day-to day management of each of the Funds’ portfolio, as well as the qualifications of other individuals at the Adviser who provide services to the Funds. The Board concluded that the quality, extent, and nature of the services provided by the Adviser to each of the Funds were satisfactory.
The investment performance of the Funds. In this regard, the Board compared the performance of each of the Funds with the performance of its respective benchmark index, custom peer group, and Morningstar category. The Board also considered the Adviser’s explanation of the performance of each of the Funds. The Board concluded that the investment performance of each of the Funds has been satisfactory.
The costs of the services provided and profits realized by the Adviser and its affiliates from its relationship with the Funds. In this regard, the Board considered the management fee for each of the Funds and each of the Funds’ expense ratio, each as compared to its respective peer group and the fees charged by the Adviser to other similar clients. The Board considered the revenue earned from each of the Funds, the Adviser’s financial condition, the assets in each of the Funds and the current and anticipated profitability of the Funds to the Adviser, if any. The Board also considered the Adviser’s past fee reductions and expense reimbursements for the Funds and the indirect benefits that the Adviser received from its management of the Funds. The Board concluded that the advisory fee to be paid to the Adviser by each of the Funds is reasonable in light of the nature and quality of services provided by the Adviser.
36
| Q3 ALL-SEASON SECTOR ROTATION FUND AND Q3 ALL-SEASON |
| TACTICAL FUND DISCLOSURE REGARDING APPROVAL OF |
| INVESTMENT ADVISORY AGREEMENT (Unaudited) (Continued) |
The extent to which economies of scale would be realized as the Funds grows and whether advisory fee levels reflect these economies of scale for the benefit of the Funds’ investors. In this regard, the Board considered that each of the Funds’ fee arrangements with the Adviser involve both the advisory fee and the Funds’ expense limitation agreement (the “ELA”). The Board determined that while the advisory fee rate remained the same as asset levels increased, the shareholders of the Funds have experienced benefits from the Funds’ ELA and will continue to experience benefits from the Funds’ ELA. The Board concluded that the advisory fee for each of the Funds was reasonable in light of the information that was provided to the Trustees by the Adviser with respect to economies of scale.
After further discussion of the factors noted above, as well as other factors, and in reliance on the information provided by the Adviser and Trust management, and taking into account the totality of all factors discussed and information presented at the meeting and previous meetings, the Board indicated its agreement to approve the continuance of the Advisory Agreement and the ELA for each of the Funds. It was noted that in the Trustees’ deliberations regarding the approval of the continuance of the Advisory Agreement, the Trustees did not identify any particular information or factor that was all-important or controlling, and that each individual Trustee may have attributed different weights to various factors listed above. After full consideration of the above factors as well as other factors, the Board unanimously concluded that approval of the continuance of the Advisory Agreement was in the best interests of the Funds and its shareholders.
37
| Q3 ALL-SEASON FUNDS |
| BOARD OF TRUSTEES AND EXECUTIVE OFFICERS |
| (Unaudited) |
The Board has overall responsibility for management of the Trust’s affairs. The Trustees serve during the lifetime of the Trust and until its termination, or until death, resignation, retirement, or removal. The Trustees, in turn, elect the officers of the Funds to actively supervise their day-to-day operations. The officers have been elected for an annual term. Each Trustee’s and officer’s address is 225 Pictoria Drive, Suite 450, Cincinnati, Ohio 45246. The following are the Trustees and executive officers of the Funds:
| Name
and Year of Birth |
Length of Time Served |
Position(s)
Held with Trust |
Principal Occupation(s) During Past 5 Years |
Number of Funds in Trust Overseen by Trustee |
Directorships of Public Companies Held by Trustee During Past 5 Years |
| Interested Trustees: | |||||
| David
R. Carson* Year of Birth: 1958 |
Trustee Since 2021
Officer Since 2013 |
Trustee
(2021 to present) Vice President (2021 to present; and previously April 2013 to October 2013) President and Principal Executive Officer of each of its series (2013 to 2021) |
Senior Vice President and Director of Client Strategies of Ultimus Fund Solutions, LLC (2013 to present); President of Unified Series Trust (2017 to present). | 33 | Interested Trustee of 31 series of the Unified Series Trust (a registered management company) (2020 to present). |
| Independent Trustees: | |||||
| Janine
L. Cohen Year of Birth: 1952 |
Since 2016 | Chairperson
(2019 to present) Trustee (2016 to present) |
Retired since 2013; previously Chief Financial Officer from 2004 to 2013 and Chief Compliance Officer from 2008 to 2013 at AER Advisors, Inc. | 33 | none |
38
| Q3 ALL-SEASON FUNDS |
| BOARD OF TRUSTEES AND EXECUTIVE OFFICERS |
| (Unaudited) (Continued) |
| Name
and Year of Birth |
Length of Time Served |
Position(s)
Held with Trust |
Principal Occupation(s) During Past 5 Years |
Number of Funds in Trust Overseen by Trustee |
Directorships of Public Companies Held by Trustee During Past 5 Years |
| Independent Trustees (Continued): | |||||
| David
M. Deptula Year of Birth: 1958 |
Since 2012 | Trustee | Vice President of Legal and Special Projects at Dayton Freight Lines, Inc. since February 2016. | 33 | none |
| Jacqueline
A. Williams Year of Birth: 1954 |
Since 2019 | Trustee | Managing Member of Custom Strategy Consulting, LLC (2017 to present); Managing Director of Global Investment Research (2005 to 2017), Cambridge Associates, LLC. | 33 | none |
| Clifford
N. Schireson Year of Birth: 1953 |
Since 2019 | Trustee | Retired; Founder of Schireson Consulting, LLC (2017 to 2022); Director of Institutional Services for Brandes Investment Partners, LP (2004-2017). | 33 | Trustee of the San Diego City Employees’ Retirement System (2019 to present). |
| Robert
E. Morrison Year of Birth: 1957 |
Since 2019 | Trustee | Managing Director, Midwest Trust and FCI Advisors (2022 to present); Senior Vice President and National Practice Lead for Investment, Huntington National Bank/Huntington Private Bank (2014 to 2022); CEO, CIO, President of 5 Star Investment Management Company (2006 to 2014). | 33 | none |
| * | Mr. Carson is considered an “interested person” of the Trust within the meaning of Section 2(a)(19) of the 1940 Act because of his relationship with the Trust’s administrator, transfer agent, and distributor. Mr. Carson was President of the Trust from October 2013 to January 2021 and Vice President of the Trust from April 2013 to October 2013. |
39
| Q3 ALL-SEASON FUNDS |
| BOARD OF TRUSTEES AND EXECUTIVE OFFICERS |
| (Unaudited) (Continued) |
| Name
and Year of Birth |
Length of Time Served |
Position(s) Held with Trust |
Principal Occupation(s) During Past 5 Years |
| Executive Officers: | |||
| Todd
E. Heim Year of Birth: 1967 |
Since 2014 | President (2021 to present)
Vice President (2014 to 2021) |
Vice President, Relationship Management (2018 to present) and Assistant Vice President, Client Implementation Manager of Ultimus Fund Solutions, LLC (2014 to 2018); Naval Flight Officer in United States Navy (1989 to 2017). |
| Jennifer
L. Leamer Year of Birth: 1976 |
Since 2014 | Treasurer (2014 to present)
Assistant Treasurer (April 2014 to October 2014) |
Senior Vice President, Fund Accounting of Ultimus Fund Solutions, LLC (2014 to present). |
| Daniel
D. Bauer Year of Birth: 1977 |
Since 2016 | Assistant Treasurer (2016 to present) | Vice President, Fund Accounting (2022 to present) and Assistant Vice President, Fund Accounting of Ultimus Fund Solutions, LLC (2015 to 2022). |
| Angela
A. Simmons Year of Birth: 1975 |
Since 2022 | Assistant Treasurer (2022 to present) | Vice President, Financial Administration (2022 to present) and Assistant Vice President, Financial Administration (2015 to 2022) of Ultimus Fund Solutions, LLC. |
| Khimmara
Greer Year of Birth: 1983 |
Since 2021 | Secretary (2021 to present) | Vice President and Senior Legal Counsel of Ultimus Fund Solutions, LLC (2021 to present); Vice President, Asset Servicing – Regulatory Administration of The Bank of New York Mellon (2019 to 2021); Vice President and Counsel of State Street Bank and Trust Company (2015 to 2019). |
| David
K. James Year of Birth: 1970 |
Since 2021 | Assistant Secretary (2021 to present)
Secretary (July 2021 to October 2021) |
Executive Vice President and Chief Legal and Risk Officer of Ultimus Fund Solutions, LLC (2018 to present); Managing Director and Managing Counsel of State Street Bank and Trust Company (2009 to 2018). |
40
| Q3 ALL-SEASON FUNDS |
| BOARD OF TRUSTEES AND EXECUTIVE OFFICERS |
| (Unaudited) (Continued) |
| Name
and Year of Birth |
Length of Time Served |
Position(s) Held with Trust |
Principal Occupation(s) During Past 5 Years |
| Executive Officers (Continued): | |||
| Natalie
S. Anderson Year of Birth: 1975 |
Since 2016 | Assistant Secretary (2016 to present) | Legal Administration Manager (July 2016 to present) and Paralegal (January 2015 to June 2016) of Ultimus Fund Solutions, LLC. |
| Gweneth
Gosselink Year of Birth: 1955 |
Since 2020 | Chief Compliance Officer (2020 to present) | Assistant Vice President, Senior Compliance Officer of Ultimus Fund Solutions, LLC (December 2019 to present); CCO Consultant at GKG Consulting, LLC (December 2019 to present); Chief Operating Officer & CCO at Miles Capital, Inc. (June 2013 to December 2019). |
| Martin
Dean Year of Birth: 1963 |
Since 2016 | Assistant Chief Compliance Officer (2020 to present)
Interim Chief Compliance Officer (October 2019 to January 2020)
Assistant Chief Compliance Officer (2016 to 2017) |
Senior Vice President, Head of Fund Compliance (February 2020 to present); Vice President & Director of Fund Compliance of Ultimus Fund Solutions, LLC (January 2016 to January 2020). |
Additional information about members of the Board and executive officers is available in the Funds’ Statement of Additional Information (“SAI”). To obtain a free copy of the SAI, please call toll free 1-855-784-2399.
41
| Q3 ALL-SEASON FUNDS |
| LIQUIDITY RISK MANAGEMENT PROGRAM (Unaudited) |
The Funds have adopted and implemented a written liquidity risk management program (the “Program”) as required by Rule 22e-4 (the “Liquidity Rule”) under the Investment Company Act of 1940, as amended. The Program is reasonably designed to assess and manage the Funds’ liquidity risk, taking into consideration, among other factors, each Fund’s investment strategy and the liquidity of their portfolio investments during normal and reasonably foreseeable stressed conditions; their short- and long-term cash flow projections; and their cash holdings and access to other funding sources. The Funds’ Board of Trustees (the “Board”) approved the appointment of the Liquidity Administrator Committee, comprising of the Funds’ Adviser and certain Trust officers, to be responsible for the Program’s administration and oversight and for reporting to the Board on at least an annual basis regarding the Program’s operation and effectiveness. The annual written report assessing the Program (the “Report”) was presented to the Board at the October 17 – 18, 2022 Board meeting and covered the period from June 1, 2021 to May 31, 2022 (the “Review Period”).
During the Review Period, the Funds did not experience unusual stress or disruption to its operations related to purchase and redemption activity. Also, during the Review Period, the Funds held adequate levels of cash and highly liquid investments to meet shareholder redemption activities in accordance with applicable requirements. The Report concluded that the Program is reasonably designed to prevent violation of the Liquidity Rule and the Program has been effectively implemented.
42
This page intentionally left blank.
This page intentionally left blank.
This page intentionally left blank.
Q3-AR-22
U.S. VALUE ETF
(USVT)
Annual Report
November 30, 2022
| U.S. VALUE ETF | November 30, 2022 |
| LETTER TO SHAREHOLDERS | (Unaudited) |
Dear Fellow Shareholders,
Enclosed is the Annual Report to shareholders of U.S. Value ETF (“USVT”). We would like to thank you for your investment.
U.S Value ETF
U.S. Value ETF (the “Fund”) is designed for those seeking value exposure through a passive management process. USVT aims to track the investment results (before fees and expenses) of the Lyrical U.S. Value Index (the “Index”). The Index, developed by Lyrical Asset Management LP, seeks to represent the potential benefits of deep value investing by using proprietary investment screens to identify the cheapest quintile of 200 stocks from a universe of potential investment candidates of the top 1,000 US stocks by market capitalization, based on one year forward median analyst projected price to earnings ratio.
In contrast to the most broadly cited “value” indices, we believe the Index (and, thereby, the Fund) benefits from a process that is both straightforward and clearly value focused. Those other indices suffer from several frailties, including a melding of value factors with anti-growth factors (as if value and growth work in opposition) and including most of the securities in their respective universes.
Since its launch on September 13, 2021 through November 30, 2022, USVT has produced a cumulative total return of +11.63%, compared to the Index return of +12.45%, and to the +4.42% cumulative total return for S&P 500® Value Index (the “S&P 500 Value”). For the twelve months ended November 30, 2022, USVT has produced a total return of +10.79% compared to the total return for the S&P 500 Value of +5.59%. Over this same period, 55% of USVT’s investments have posted gains and 47% outperformed the S&P 500® Value Index
As of November 30, 2022, the valuation of our portfolio is 8.0 times the next twelve months consensus earnings. The S&P 500® Value has a valuation of 15.6 times earnings on this same basis, a premium of 94.33% over the Fund.
We consider this an opportune time to invest in USVT. We believe we are less than three years into a value upcycle, and historically those upcycles have lasted six to ten years.
Thank you for your continued trust and interest in USVT.
Sincerely,
Lyrical Asset Management LP
1
Past performance is not predictive of future performance. Investment results and principal value will fluctuate so that shares, when redeemed, may be worth more or less than their original cost. Current performance may be higher or lower than the performance data quoted. Performance data current to the most recent month end are available by calling 1-888-884-8099.
An investor should consider the investment objectives, risks, charges and expenses of the fund carefully before investing. The fund’s prospectus contains this and other important information. To obtain a copy of the fund’s prospectus please visit the fund’s website at www.usvalueetf.com or call 1-888-884-8099 and a copy will be sent to you free of charge. Please read the prospectus carefully before you invest. The fund is distributed by Ultimus Fund Distributors, LLC.
The Letter to Shareholders seeks to describe some of the Adviser’s current opinions and views of the financial markets. Although the Adviser believes it has a reasonable basis for any opinions or views expressed, actual results may differ, sometimes significantly so, from those expected or expressed. The securities held by the fund that are discussed in the Letter to Shareholders were held during the period covered by this Report. They do not comprise the entire investment portfolios of the fund, may be sold at any time, and may no longer be held by the Funds. For a complete list of securities held by the fund as of November 30, 2022, please see the Schedule of Investments section of this Report. The opinions of the Fund’s adviser with respect to those securities may change at any time.
Statements in the Letter to Shareholders that reflect projections or expectations for future financial or economic performance of the Funds and the market in general and statements of the Funds’ plans and objectives for future operations are forward-looking statements. No assurance can be given that actual results or events will not differ materially from those projected, estimated, assumed, or anticipated in any such forward- looking statements. Important factors that could result in such differences, in addition to factors noted with such forward-looking statements include, without limitation, general economic conditions, such as inflation, recession, and interest rates. Past performance is not a guarantee of future results.
2
U.S. VALUE ETF
PERFORMANCE INFORMATION (Unaudited)
Comparison of the Change in Value of a $10,000 Investment in
U.S. Value ETF versus the
S&P 500® Value Index
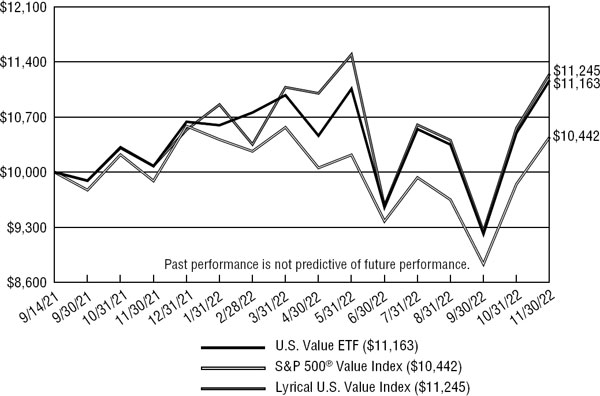
Total Returns*
(for the periods ended November 30, 2022)
| Since | ||||
| 1 Year | Inception (b) | |||
| U.S. Value ETF (a) | 10.79% | 9.49% | ||
| U.S. Value ETF - At Market Value (a) | 10.58% | 9.39% | ||
| S&P 500® Value Index (c) | 5.59% | 3.62% | ||
| Lyrical U.S. Value Index (d) | 11.57% | 10.15% |
| * | Annualized |
| (a) | The Fund’s total returns do not reflect the deduction of taxes a shareholder would pay on Fund distributions or the redemption of Fund shares. |
| (b) | Commencement of operations was September 14, 2021. |
| (c) | The S&P 500® Value Index measure value stocks using three factors: the ratios of book value, earnings, and sales to price. Constituents are drawn from the S&P 500® Index. The Index is unmanaged and shown for illustration purposes only. An investor cannot invest in an index and its returns are not indicative of the performance of any specific investment. |
| (d) | The Lyrical U.S. Value Index creation process begins with the assessment of the top 1,000 U.S. stocks by market capitalization and then uses an investment screen to cull the universe to 200. Generally, the approach emphasizes analyst projections for one-year-forward price-to-earnings ratios. On each quarterly rebalance, each stock in the cheapest quintile is equally weighted in the ETF. |
3
U.S. VALUE ETF
PORTFOLIO INFORMATION
November 30, 2022 (Unaudited)
U.S. Value ETF vs. S&P 500® Index Sector Diversification
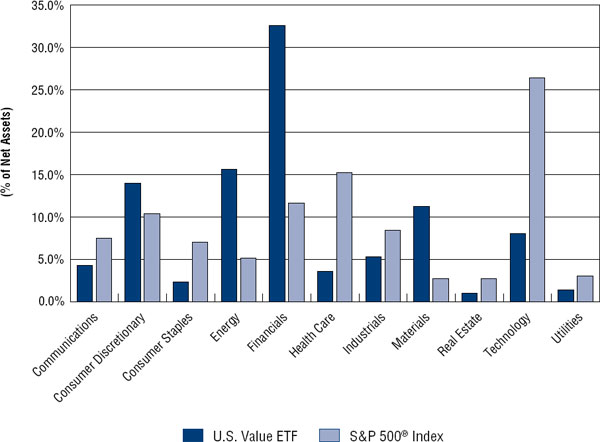
Top Ten Equity Holdings
| % of | ||
| Security Description | Net Assets | |
| Amkor Technology, Inc. | 0.7% | |
| Apollo Global Management, Inc. | 0.6% | |
| Universal Health Services, Inc. - Class B | 0.6% | |
| Affiliated Managers Group, Inc. | 0.6% | |
| RenaissanceRe Holdings Ltd. | 0.6% | |
| Capri Holdings Ltd. | 0.6% | |
| Light & Wonder, Inc. | 0.6% | |
| United States Steel Corporation | 0.6% | |
| Invesco Ltd. | 0.6% | |
| CNH Industrial N.V. | 0.6% |
4
| U.S. VALUE ETF |
| SCHEDULE OF INVESTMENTS |
| November 30, 2022 |
| COMMON STOCKS — 99.3% | Shares | Value | ||||||
| Communications — 4.3% | ||||||||
| Cable & Satellite — 1.7% | ||||||||
| Charter Communications, Inc. - Class A (a) | 218 | $ | 85,301 | |||||
| Comcast Corporation - Class A | 2,349 | 86,067 | ||||||
| DISH Network Corporation - Class A (a) | 5,284 | 84,808 | ||||||
| 256,176 | ||||||||
| Entertainment Content — 0.3% | ||||||||
| AppLovin Corporation (a) | 3,874 | 55,824 | ||||||
| Publishing & Broadcasting — 0.9% | ||||||||
| Nexstar Media Group, Inc. - Class A | 404 | 76,583 | ||||||
| TEGNA, Inc. | 3,429 | 67,688 | ||||||
| 144,271 | ||||||||
| Telecommunications — 1.4% | ||||||||
| AT&T, Inc. | 4,695 | 90,520 | ||||||
| Lumen Technologies, Inc. | 10,385 | 56,806 | ||||||
| Verizon Communications, Inc. | 1,951 | 76,050 | ||||||
| 223,376 | ||||||||
| Consumer Discretionary — 14.0% | ||||||||
| Apparel & Textile Products — 1.7% | ||||||||
| Capri Holdings Ltd. (a) | 1,693 | 97,093 | ||||||
| Crocs, Inc. (a) | 910 | 91,910 | ||||||
| Tapestry, Inc. | 2,284 | 86,267 | ||||||
| 275,270 | ||||||||
| Automotive — 2.2% | ||||||||
| BorgWarner, Inc. | 2,122 | 90,206 | ||||||
| Ford Motor Company | 6,035 | 83,887 | ||||||
| General Motors Company | 2,168 | 87,934 | ||||||
| Harley-Davidson, Inc. | 1,974 | 93,035 | ||||||
| 355,062 | ||||||||
| E-Commerce Discretionary — 0.5% | ||||||||
| eBay, Inc. | 1,871 | 85,018 | ||||||
| Home & Office Products — 1.4% | ||||||||
| Newell Brands, Inc. | 4,851 | 62,917 | ||||||
| Tempur Sealy International, Inc. | 2,755 | 87,527 | ||||||
| Whirlpool Corporation | 495 | 72,532 | ||||||
| 222,976 | ||||||||
5
| U.S. VALUE ETF |
| SCHEDULE OF INVESTMENTS (Continued) |
| COMMON STOCKS — 99.3% (Continued) | Shares | Value | ||||||
| Consumer Discretionary — 14.0% (Continued) | ||||||||
| Home Construction — 3.0% | ||||||||
| D.R. Horton, Inc. | 1,006 | $ | 86,516 | |||||
| Fortune Brands Home & Security, Inc. | 1,240 | 81,022 | ||||||
| Lennar Corporation - Class A | 933 | 81,945 | ||||||
| Mohawk Industries, Inc. (a) | 735 | 74,478 | ||||||
| PulteGroup, Inc. | 1,829 | 81,903 | ||||||
| Toll Brothers, Inc. | 1,657 | 79,387 | ||||||
| 485,251 | ||||||||
| Leisure Facilities & Services — 0.6% | ||||||||
| Light & Wonder, Inc. (a) | 1,498 | 97,025 | ||||||
| Leisure Products — 0.5% | ||||||||
| Brunswick Corporation | 1,012 | 75,090 | ||||||
| Retail - Discretionary — 4.1% | ||||||||
| AutoNation, Inc. (a) | 678 | 84,011 | ||||||
| Avis Budget Group, Inc. (a) | 391 | 87,428 | ||||||
| Builders FirstSource, Inc. (a) | 1,140 | 72,880 | ||||||
| Hertz Global Holdings, Inc. (a) | 4,212 | 72,446 | ||||||
| Lithia Motors, Inc. | 323 | 77,297 | ||||||
| Macy’s, Inc. | 3,945 | 92,708 | ||||||
| Penske Automotive Group, Inc. | 690 | 87,251 | ||||||
| Williams-Sonoma, Inc. | 581 | 67,919 | ||||||
| 641,940 | ||||||||
| Consumer Staples — 2.3% | ||||||||
| Food — 0.5% | ||||||||
| Tyson Foods, Inc. - Class A | 1,085 | 71,914 | ||||||
| Retail - Consumer Staples — 0.8% | ||||||||
| Albertsons Companies, Inc. - Class A | 2,481 | 51,977 | ||||||
| Walgreens Boots Alliance, Inc. | 2,111 | 87,606 | ||||||
| 139,583 | ||||||||
| Tobacco & Cannabis — 0.5% | ||||||||
| Altria Group, Inc. | 1,548 | 72,106 | ||||||
| Wholesale - Consumer Staples — 0.5% | ||||||||
| Bunge Ltd. | 786 | 82,404 | ||||||
| Energy — 15.6% | ||||||||
| Oil & Gas Producers — 15.6% | ||||||||
| Antero Resources Corporation (a) | 1,987 | 72,625 | ||||||
| APA Corporation | 1,697 | 79,504 | ||||||
6
| U.S. VALUE ETF |
| SCHEDULE OF INVESTMENTS (Continued) |
| COMMON STOCKS — 99.3% (Continued) | Shares | Value | ||||||
| Energy — 15.6% (Continued) | ||||||||
| Oil & Gas Producers — 15.6% (Continued) | ||||||||
| Chesapeake Energy Corporation | 697 | $ | 72,140 | |||||
| Chevron Corporation | 430 | 78,823 | ||||||
| Chord Energy Corporation | 474 | 72,299 | ||||||
| Civitas Resources, Inc. | 1,035 | 69,718 | ||||||
| Comstock Resources, Inc. | 3,747 | 68,757 | ||||||
| ConocoPhillips | 579 | 71,512 | ||||||
| Coterra Energy, Inc. | 2,332 | 65,086 | ||||||
| DCP Midstream, L.P. | 1,858 | 73,094 | ||||||
| Devon Energy Corporation | 983 | 67,355 | ||||||
| Diamondback Energy, Inc. | 489 | 72,382 | ||||||
| Energy Transfer, L.P. | 6,065 | 76,055 | ||||||
| EOG Resources, Inc. | 557 | 79,055 | ||||||
| EQT Corporation | 1,602 | 67,941 | ||||||
| Exxon Mobil Corporation | 697 | 77,604 | ||||||
| HF Sinclair Corporation | 1,224 | 76,304 | ||||||
| Marathon Oil Corporation | 2,507 | 76,789 | ||||||
| Marathon Petroleum Corporation | 651 | 79,298 | ||||||
| Matador Resources Company | 1,119 | 74,257 | ||||||
| MPLX, L.P. | 2,242 | 76,206 | ||||||
| Murphy Oil Corporation | 1,588 | 74,954 | ||||||
| Occidental Petroleum Corporation | 1,044 | 72,548 | ||||||
| Ovintiv, Inc. | 1,337 | 74,551 | ||||||
| PBF Energy, Inc. - Class A | 1,671 | 66,456 | ||||||
| PDC Energy, Inc. | 1,007 | 74,840 | ||||||
| Phillips 66 Partners, L.P. | 733 | 79,487 | ||||||
| Pioneer Natural Resources Company | 280 | 66,077 | ||||||
| Plains All American Pipeline, L.P. | 6,273 | 77,911 | ||||||
| Range Resources Corporation | 2,470 | 71,309 | ||||||
| SM Energy Company | 1,576 | 67,941 | ||||||
| Southwestern Energy Company (a) | 10,224 | 70,750 | ||||||
| Valero Energy Corporation | 588 | 78,569 | ||||||
| Western Midstream Partners, L.P. | 2,661 | 74,455 | ||||||
| 2,496,652 | ||||||||
| Financials — 32.6% | ||||||||
| Asset Management — 4.0% | ||||||||
| Affiliated Managers Group, Inc. | 609 | 97,696 | ||||||
| Apollo Global Management, Inc. | 1,463 | 101,518 | ||||||
| Carlyle Group, Inc. (The) | 2,669 | 83,193 | ||||||
| Franklin Resources, Inc. | 3,199 | 85,765 | ||||||
| Invesco Ltd. | 4,895 | 93,543 | ||||||
7
| U.S. VALUE ETF |
| SCHEDULE OF INVESTMENTS (Continued) |
| COMMON STOCKS — 99.3% (Continued) | Shares | Value | ||||||
| Financials — 32.6% (Continued) | ||||||||
| Asset Management — 4.0% (Continued) | ||||||||
| Owl Rock Capital Corporation | 6,564 | $ | 84,741 | |||||
| Stifel Financial Corporation | 1,307 | 83,975 | ||||||
| 630,431 | ||||||||
| Banking — 13.0% | ||||||||
| Bank of America Corporation | 2,240 | 84,783 | ||||||
| Bank OZK | 1,664 | 76,794 | ||||||
| Cadence Bank | 2,578 | 74,350 | ||||||
| Citigroup, Inc. | 1,653 | 80,022 | ||||||
| Citizens Financial Group, Inc. | 1,966 | 83,319 | ||||||
| Comerica, Inc. | 981 | 70,377 | ||||||
| Credicorp Ltd. | 544 | 83,531 | ||||||
| East West Bancorp, Inc. | 995 | 69,859 | ||||||
| Fifth Third Bancorp | 2,069 | 75,229 | ||||||
| FNB Corporation | 5,547 | 78,213 | ||||||
| Hancock Whitney Corporation | 1,439 | 78,915 | ||||||
| Huntington Bancshares, Inc. | 5,116 | 79,196 | ||||||
| JPMorgan Chase & Company | 649 | 89,678 | ||||||
| KeyCorp | 4,252 | 79,980 | ||||||
| New York Community Bancorp, Inc. | 8,252 | 77,156 | ||||||
| Old National Bancorp | 3,876 | 74,070 | ||||||
| Popular, Inc. | 974 | 71,121 | ||||||
| Regions Financial Corporation | 3,403 | 78,984 | ||||||
| Signature Bank | 462 | 64,449 | ||||||
| Synovus Financial Corporation | 1,736 | 73,138 | ||||||
| Truist Financial Corporation | 1,612 | 75,458 | ||||||
| US Bancorp | 1,717 | 77,935 | ||||||
| Valley National Bancorp | 6,131 | 77,618 | ||||||
| Webster Financial Corporation | 1,481 | 80,478 | ||||||
| Wells Fargo & Company | 1,675 | 80,316 | ||||||
| Western Alliance Bancorp | 1,090 | 74,709 | ||||||
| Zions Bancorporation N.A. | 1,405 | 72,807 | ||||||
| 2,082,485 | ||||||||
| Institutional Financial Services — 2.2% | ||||||||
| Bank of New York Mellon Corporation (The) | 1,812 | 83,171 | ||||||
| Goldman Sachs Group, Inc. (The) | 231 | 89,201 | ||||||
| Jefferies Financial Group, Inc. | 2,252 | 85,553 | ||||||
| State Street Corporation | 1,119 | 89,151 | ||||||
| 347,076 | ||||||||
8
| U.S. VALUE ETF |
| SCHEDULE OF INVESTMENTS (Continued) |
| COMMON STOCKS — 99.3% (Continued) | Shares | Value | ||||||
| Financials — 32.6% (Continued) | ||||||||
| Insurance — 6.9% | ||||||||
| American International Group, Inc. | 1,394 | $ | 87,975 | |||||
| Axis Capital Holdings Ltd. | 1,394 | 80,239 | ||||||
| Corebridge Financial, Inc. | 3,496 | 77,751 | ||||||
| Equitable Holdings, Inc. | 2,523 | 80,080 | ||||||
| Everest Re Group Ltd. | 260 | 87,864 | ||||||
| Hartford Financial Services Group, Inc. (The) | 1,068 | 81,563 | ||||||
| Lincoln National Corporation | 1,473 | 57,359 | ||||||
| MetLife, Inc. | 1,089 | 83,526 | ||||||
| Old Republic International Corporation | 3,080 | 75,460 | ||||||
| Prudential Financial, Inc. | 747 | 80,698 | ||||||
| Reinsurance Group of America, Inc. | 520 | 75,088 | ||||||
| RenaissanceRe Holdings Ltd. | 514 | 97,101 | ||||||
| Unum Group | 1,663 | 70,145 | ||||||
| Voya Financial, Inc. | 1,093 | 72,116 | ||||||
| 1,106,965 | ||||||||
| Specialty Finance — 6.5% | ||||||||
| AerCap Holdings N.V. (a) | 1,446 | 88,783 | ||||||
| AGNC Investment Corporation | 8,836 | 88,271 | ||||||
| Ally Financial, Inc. | 2,357 | 63,663 | ||||||
| Annaly Capital Management, Inc. | 4,179 | 90,559 | ||||||
| Blackstone Mortgage Trust, Inc. - Class A | 3,093 | 78,160 | ||||||
| Capital One Financial Corporation | 727 | 75,055 | ||||||
| Credit Acceptance Corporation (a) | 158 | 74,886 | ||||||
| Discover Financial Services | 755 | 81,812 | ||||||
| Fidelity National Financial, Inc. | 1,828 | 73,778 | ||||||
| First American Financial Corporation | 1,512 | 82,631 | ||||||
| MGIC Investment Corporation | 5,572 | 76,504 | ||||||
| Starwood Property Trust, Inc. | 3,682 | 78,832 | ||||||
| Synchrony Financial | 2,194 | 82,451 | ||||||
| 1,035,385 | ||||||||
| Health Care — 3.6% | ||||||||
| Biotech & Pharma — 2.6% | ||||||||
| Jazz Pharmaceuticals plc (a) | 527 | 82,692 | ||||||
| Moderna, Inc. (a) | 528 | 92,880 | ||||||
| Organon & Company | 2,956 | 76,915 | ||||||
| Pfizer, Inc. | 1,652 | 82,815 | ||||||
| Viatris, Inc. | 7,361 | 81,192 | ||||||
| 416,494 | ||||||||
9
| U.S. VALUE ETF |
| SCHEDULE OF INVESTMENTS (Continued) |
| COMMON STOCKS — 99.3% (Continued) | Shares | Value | ||||||
| Health Care — 3.6% (Continued) | ||||||||
| Health Care Facilities & Services — 1.0% | ||||||||
| Tenet Healthcare Corporation (a) | 1,313 | $ | 60,634 | |||||
| Universal Health Services, Inc. - Class B | 755 | 98,792 | ||||||
| 159,426 | ||||||||
| Industrials — 5.3% | ||||||||
| Industrial Support Services — 1.6% | ||||||||
| AMERCO | 1,438 | 91,025 | ||||||
| United Rentals, Inc. (a) | 251 | 88,611 | ||||||
| WESCO International, Inc. (a) | 567 | 73,098 | ||||||
| 252,734 | ||||||||
| Machinery — 1.1% | ||||||||
| AGCO Corporation | 636 | 84,410 | ||||||
| CNH Industrial N.V. | 5,812 | 93,224 | ||||||
| 177,634 | ||||||||
| Transportation & Logistics — 2.6% | ||||||||
| Alaska Air Group, Inc. (a) | 1,696 | 80,458 | ||||||
| Delta Air Lines, Inc. (a) | 2,337 | 82,660 | ||||||
| Ryder System, Inc. | 902 | 84,328 | ||||||
| United Airlines Holdings, Inc. (a) | 2,005 | 88,560 | ||||||
| XPO Logistics, Inc. (a) | 2,156 | 83,265 | ||||||
| 419,271 | ||||||||
| Materials — 11.2% | ||||||||
| Chemicals — 4.4% | ||||||||
| Celanese Corporation | 762 | 81,763 | ||||||
| CF Industries Holdings, Inc. | 663 | 71,730 | ||||||
| Dow, Inc. | 1,547 | 78,851 | ||||||
| Eastman Chemical Company | 961 | 83,242 | ||||||
| Huntsman Corporation | 2,732 | 75,895 | ||||||
| LyondellBasell Industries N.V. - Class A | 888 | 75,489 | ||||||
| Mosaic Company (The) | 1,366 | 70,076 | ||||||
| Olin Corporation | 1,479 | 84,272 | ||||||
| Westlake Corporation | 785 | 84,504 | ||||||
| 705,822 | ||||||||
| Construction Materials — 0.5% | ||||||||
| Owens Corning | 830 | 73,737 | ||||||
| Containers & Packaging — 2.1% | ||||||||
| Berry Global Group, Inc. | 1,506 | 88,252 | ||||||
| Graphic Packaging Holding Company | 3,428 | 78,775 | ||||||
| International Paper Company | 2,167 | 80,439 | ||||||
| WestRock Company | 2,214 | 83,955 | ||||||
| 331,421 | ||||||||
10
| U.S. VALUE ETF |
| SCHEDULE OF INVESTMENTS (Continued) |
| COMMON STOCKS — 99.3% (Continued) | Shares | Value | ||||||
| Materials — 11.2% (Continued) | ||||||||
| Forestry, Paper & Wood Products — 0.5% | ||||||||
| UFP Industries, Inc. | 975 | $ | 79,814 | |||||
| Metals & Mining — 1.0% | ||||||||
| Alcoa Corporation | 1,738 | 87,126 | ||||||
| Cleveland-Cliffs, Inc. (a) | 4,633 | 71,719 | ||||||
| 158,845 | ||||||||
| Steel — 2.7% | ||||||||
| Commercial Metals Company | 1,689 | 83,133 | ||||||
| Nucor Corporation | 573 | 85,921 | ||||||
| Reliance Steel & Aluminum Company | 379 | 80,079 | ||||||
| Steel Dynamics, Inc. | 876 | 91,043 | ||||||
| United States Steel Corporation | 3,576 | 94,013 | ||||||
| 434,189 | ||||||||
| Real Estate — 1.0% | ||||||||
| Real Estate Services — 0.5% | ||||||||
| Jones Lang LaSalle, Inc. (a) | 441 | 74,163 | ||||||
| Reit — 0.5% | ||||||||
| Medical Properties Trust, Inc. | 6,428 | 84,335 | ||||||
| Technology — 8.0% | ||||||||
| Semiconductors — 2.8% | ||||||||
| Amkor Technology, Inc. | 3,985 | 111,660 | ||||||
| Qorvo, Inc. (a) | 867 | 86,050 | ||||||
| QUALCOMM, Inc. | 629 | 79,562 | ||||||
| Skyworks Solutions, Inc. | 847 | 80,990 | ||||||
| Synaptics, Inc. (a) | 775 | 82,127 | ||||||
| 440,389 | ||||||||
| Software — 0.5% | ||||||||
| Concentrix Corporation | 588 | 71,959 | ||||||
| Technology Hardware — 3.8% | ||||||||
| Arrow Electronics, Inc. (a) | 742 | 80,685 | ||||||
| Dell Technologies, Inc. - Class C | 2,030 | 90,924 | ||||||
| Flex Ltd. (a) | 4,125 | 90,668 | ||||||
| Hewlett Packard Enterprise Company | 5,536 | 92,893 | ||||||
| HP, Inc. | 2,730 | 82,009 | ||||||
| Jabil, Inc. | 1,199 | 86,556 | ||||||
| TD SYNNEX Corporation | 833 | 85,216 | ||||||
| 608,951 | ||||||||
11
| U.S. VALUE ETF |
| SCHEDULE OF INVESTMENTS (Continued) |
| COMMON STOCKS — 99.3% (Continued) | Shares | Value | ||||||
| Technology — 8.0% (Continued) | ||||||||
| Technology Services — 0.9% | ||||||||
| DXC Technology Company (a) | 2,586 | $ | 76,726 | |||||
| Western Union Company (The) | 5,060 | 74,180 | ||||||
| 150,906 | ||||||||
| Utilities — 1.4% | ||||||||
| Electric Utilities — 0.9% | ||||||||
| NRG Energy, Inc. | 1,725 | 73,226 | ||||||
| Vistra Corporation | 3,277 | 79,729 | ||||||
| 152,955 | ||||||||
| Gas & Water Utilities — 0.5% | ||||||||
| National Fuel Gas Company | 1,107 | 73,317 | ||||||
| Investments at Value — 99.3% (Cost $14,735,318) | $ | 15,848,642 | ||||||
| Other Assets in Excess of Liabilities — 0.7% | 108,753 | |||||||
| Net Assets — 100.0% | $ | 15,957,395 | ||||||
N.V.- Naamloze Vennootschap
plc - Public Limited Company
| (a) | Non-income producing security. |
See accompanying notes to financial statements.
12
| U.S. VALUE ETF |
| STATEMENT OF ASSETS AND LIABILITIES |
| November 30, 2022 |
| ASSETS | ||||
| Investments in securities: | ||||
| At cost | $ | 14,735,318 | ||
| At value (Note 2) | $ | 15,848,642 | ||
| Cash | 81,175 | |||
| Receivable from Adviser (Note 4) | 6,887 | |||
| Dividends receivable | 35,136 | |||
| Other assets | 1,855 | |||
| Total assets | 15,973,695 | |||
| LIABILITIES | ||||
| Payable to administrator (Note 4) | 5,167 | |||
| Other accrued expenses and liabilities | 11,133 | |||
| Total liabilities | 16,300 | |||
| NET ASSETS | $ | 15,957,395 | ||
| NET ASSETS CONSIST OF: | ||||
| Paid-in capital | $ | 14,808,905 | ||
| Distributable earnings | 1,148,490 | |||
| NET ASSETS | $ | 15,957,395 | ||
| Shares of beneficial interest outstanding (unlimited number of shares authorized, no par value) | 575,000 | |||
| Net asset value, offering price and redemption price per share (Note 2) | $ | 27.75 |
See accompanying notes to financial statements.
13
| U.S. VALUE ETF |
| STATEMENT OF OPERATIONS |
| Year Ended November 30, 2022 |
| INVESTMENT INCOME | ||||
| Dividend income | $ | 200,890 | ||
| Foreign withholding taxes on dividends | (2,297 | ) | ||
| Total investment income | 198,593 | |||
| EXPENSES | ||||
| Administration fees (Note 4) | 50,103 | |||
| Investment advisory fees (Note 4) | 29,506 | |||
| Custody fees | 27,273 | |||
| Legal fees | 21,745 | |||
| Trustees’ fees and expenses (Note 4) | 18,857 | |||
| Audit and tax services fees | 15,301 | |||
| Printing of shareholder reports | 13,341 | |||
| Compliance fees (Note 4) | 12,000 | |||
| Transfer agent fees | 10,719 | |||
| Registration and filing fees | 8,375 | |||
| Other expenses | 22,511 | |||
| Total expenses | 229,731 | |||
| Less fees reduced and expenses reimbursed by Adviser (Note 4) | (197,434 | ) | ||
| Net expenses | 32,297 | |||
| NET INVESTMENT INCOME | 166,296 | |||
| REALIZED AND UNREALIZED GAINS (LOSSES) ON INVESTMENTS AND FOREIGN CURRENCIES | ||||
| Net realized gains (losses) from: | ||||
| Investments | (127,161 | ) | ||
| Foreign currency transactions | 17 | |||
| Net change in unrealized appreciation (depreciation) on investments | 1,181,070 | |||
| NET REALIZED AND UNREALIZED GAINS ON INVESTMENTS | 1,053,926 | |||
| NET INCREASE IN NET ASSETS RESULTING FROM OPERATIONS | $ | 1,220,222 |
See accompanying notes to financial statements.
14
| U.S. VALUE ETF |
| STATEMENTS OF CHANGES IN NET ASSETS |
| Year Ended | Period Ended | |||||||
| November 30, | November 30, | |||||||
| 2022 | 2021(a) | |||||||
| FROM OPERATIONS | ||||||||
| Net investment income | $ | 166,296 | $ | 10,592 | ||||
| Net realized gains (losses) from: | ||||||||
| Investments | (127,161 | ) | 4,107 | |||||
| Foreign currency transactions | 17 | — | ||||||
| Net change in unrealized appreciation (depreciation) on investments | 1,181,070 | (67,746 | ) | |||||
| Net increase (decrease) in net assets resulting from operations | 1,220,222 | (53,047 | ) | |||||
| FROM DISTRIBUTIONS TO SHAREHOLDERS (NOTE 2) | (18,687 | ) | — | |||||
| FROM CAPITAL SHARE TRANSACTIONS | ||||||||
| Proceeds from shares issued | 11,607,421 | 3,201,486 | ||||||
| TOTAL INCREASE IN NET ASSETS | 12,808,956 | 3,148,439 | ||||||
| NET ASSETS | ||||||||
| Beginning of period | 3,148,439 | — | ||||||
| End of period | $ | 15,957,395 | $ | 3,148,439 | ||||
| SHARE TRANSACTIONS | ||||||||
| Shares issued | 450,000 | 125,000 | ||||||
| Net increase in shares outstanding | 450,000 | 125,000 | ||||||
| Shares outstanding at beginning of period | 125,000 | — | ||||||
| Shares outstanding at end of period | 575,000 | 125,000 | ||||||
| (a) | Represents the period from the commencement of operations (September 14, 2021) through November 30, 2021. |
See accompanying notes to financial statements.
15
| U.S. VALUE ETF |
| FINANCIAL HIGHLIGHTS |
Per Share Data for a Share Outstanding Throughout each Period:
| Year Ended | Period Ended | |||||||
| Nov. 30, | Nov. 30, | |||||||
| 2022 | 2021 (a) | |||||||
| Net asset value at beginning of period | $ | 25.19 | $ | 25.00 | ||||
| Income from investment operations: | ||||||||
| Net investment income (b) | 0.65 | 0.13 | ||||||
| Net realized and unrealized gains on investments | 2.06 | 0.06 | (c) | |||||
| Total from investment operations | 2.71 | 0.19 | ||||||
| Less distributions to shareholders from: | ||||||||
| Net investment income | (0.15 | ) | — | |||||
| Net asset value at end of period | $ | 27.75 | $ | 25.19 | ||||
| Market price at end of period | $ | 27.73 | $ | 25.21 | ||||
| Total return (d) | 10.79 | % | 0.76 | % (e) | ||||
| Total return at market (f) | 10.58 | % | 0.84 | % (e) | ||||
| Net assets at end of period (000’s) | $ | 15,957 | $ | 3,148 | ||||
| Ratios/supplementary data: | ||||||||
| Ratio of total expenses to average net assets | 3.47 | % | 10.04 | % (g) | ||||
| Ratio of net expenses to average net assets (h) | 0.49 | % | 0.49 | % (g) | ||||
| Ratio of net investment income to average net assets (h) | 2.51 | % | 2.31 | % (g) | ||||
| Portfolio turnover rate (i) | 77 | % | 23 | % (e) | ||||
| (a) | Represents the period from the commencement of operations (September 14, 2021) through November 30, 2021. |
| (b) | Per share net investment income has been determined on the basis of average number of shares outstanding during the period. |
| (c) | Represents a balancing figure derived from other amounts in the financial highlights table that captures all other changes affecting net asset value per share. This per share amount does not correlate to the aggregate of the net realized and unrealized losses on the Statement of Operations for the same period. |
| (d) | Net asset value total return is calculated assuming an initial investment made at the net asset value at the beginning of the period, reinvestment of all dividends and distributions at net asset value during the period, if any, and redemption on the last day of the period at net asset value. This percentage is not an indication of the performance of a shareholder’s investment in the Fund based on market value due to differences between the market price of the shares and the net asset value per share of the Fund. |
| (e) | Not annualized. |
| (f) | Market value total return is calculated assuming an initial investment made at the market value at the beginning of the period, reinvestment of all dividends and distributions at net asset value during the period, if any, and redemption on the last day of the period at market value. Market value is determined by the composite closing price. Composite closing security price is defined as the last reported sale price from any primary listing market (e.g., NYSE Arca) or participating regional exchanges or markets. The composite closing price is the last reported sale price from any of the eligible sources, regardless of volume and not an average price and may have occurred on a date prior to the close of the reporting period. Market value may be greater or less than net asset value, depending on the Fund’s closing price on the listing market. |
| (g) | Annualized. |
| (h) | Ratio was determined after fee reductions and expense reimbursements (Note 4). |
| (i) | Portfolio turnover rate excludes securities received or delivered from in-kind processing of creations or redemptions. |
See accompanying notes to financial statements.
16
| U.S. VALUE ETF |
| NOTES TO FINANCIAL STATEMENTS |
| November 30, 2022 |
1. Organization
U.S. Value ETF (the “Fund”) is a diversified series of Ultimus Managers Trust (the “Trust”), an open-end investment company established as an Ohio business trust under a Declaration of Trust dated February 28, 2012. Other series of the Trust are not incorporated in this report.
The Fund is an exchange-traded fund (“ETF”). The investment objective of the Fund is to seek to track the investment results (before fees and expenses) of the Lyrical U.S. Value Index.
Shares of the Fund are listed and traded on the NYSE Arca, Inc. Market prices for the Shares may be different from their net asset value (“NAV”.) The Fund issues and redeems Shares on a continuous basis at NAV only in large blocks of Shares, of at least 25,000 Shares, (“Creation Units”). Creation Units are issued and redeemed principally in-kind for securities included in a specified universe. Once created, Shares generally trade in the secondary market at market prices that change throughout the day in amounts that differ from a Creation Unit.
2. Significant Accounting Policies
The following is a summary of the Fund’s significant accounting policies. The policies are in conformity with accounting principles generally accepted in the United States of America (“GAAP”). The Fund follows accounting and reporting guidance under Financial Accounting Standards Board Accounting Standards Codification Topic 946, “Financial Services – Investment Companies.”
Securities valuation – The Fund values its portfolio securities at market value as of the close of regular trading on the New York Stock Exchange (the “NYSE”) (normally 4:00 p.m. Eastern time) on each business day the NYSE is open for business. The Fund values its listed securities on the basis of the security’s last sale price on the security’s primary exchange, if available, otherwise at the exchange’s most recently quoted mean price. NASDAQ-listed securities are valued at the NASDAQ Official Closing Price. When using a quoted price and when the market is considered active, the security will be classified as Level 1 within the fair value hierarchy (see below). In the event that market quotations are not readily available or are considered unreliable due to market or other events, the Fund values its securities and other assets at fair value in accordance with procedures adopted by the Board of Trustees (the “Board”). Under these procedures, the securities will be classified as Level 2 or 3 within the fair value hierarchy, depending on the inputs used. Unavailable or unreliable market quotes may be due to the following factors: a substantial bid-ask spread; infrequent sales resulting in stale prices; insufficient trading volume; small trade sizes; a temporary lapse in any reliable pricing source; and actions
17
| U.S. VALUE ETF |
| NOTES TO FINANCIAL STATEMENTS (Continued) |
of the securities or futures markets, such as the suspension or limitation of trading. As a result, the prices of securities used to calculate the Fund’s NAV may differ from quoted or published prices for the same securities.
GAAP establishes a single authoritative definition of fair value, sets out a framework for measuring fair value, and requires additional disclosures about fair value measurements.
Various inputs are used in determining the value of the Fund’s investments. These inputs are summarized in the three broad levels listed below:
| ● | Level 1 – quoted prices in active markets for identical securities |
| ● | Level 2 – other significant observable inputs |
| ● | Level 3 – significant unobservable inputs |
The inputs or methods used for valuing securities are not necessarily an indication of the risks associated with investing in those securities. The inputs used to measure fair value may fall into different levels of the fair value hierarchy. In such cases, for disclosure purposes, the level in the fair value hierarchy within which the fair value measurement falls in its entirety is determined based on the lowest level input that is significant to the fair value measurement.
The following is a summary of the Fund’s investments by the inputs used to value the investments as of November 30, 2022:
| Level 1 | Level 2 | Level 3 | Total | |||||||||||||
| Common Stocks | $ | 15,848,642 | $ | — | $ | — | $ | 15,848,642 | ||||||||
| Total | $ | 15,848,642 | $ | — | $ | — | $ | 15,848,642 | ||||||||
Refer to the Fund’s Schedule of Investments for a listing of securities by sector and industry type. The Fund did not hold any derivative instruments or any assets or liabilities that were measured at fair value on a recurring basis using significant unobservable inputs (Level 3) as of or during the year ended November 30, 2022.
Share valuation – The NAV per share of the Fund is calculated daily by dividing the total value of the assets, less the liabilities, by the number of shares outstanding. The offering price and redemption price per share is equal to the NAV per share.
Investment income – Dividend income is recorded on the ex-dividend date. Interest income, if any, is accrued as earned. Non-cash dividends included in dividend income, if any, are recorded at the fair value of the security received. Withholding taxes on foreign dividends, if any, have been recorded in accordance with the Fund’s understanding of the applicable country’s rules and tax rates.
18
| U.S. VALUE ETF |
| NOTES TO FINANCIAL STATEMENTS (Continued) |
Investment transactions – Investment transactions are accounted for on the trade date. Realized gains and losses on investments sold are determined on a specific identification basis.
Common expenses – Common expenses of the Trust are allocated among the Fund and the other series of the Trust based on the relative net assets of each series, the number of series in the Trust, or the nature of the services performed and the relative applicability to each series.
Distributions to shareholders – The Fund distributes to shareholders any net investment income dividends and net realized capital gains distributions at least once each year. The amount of such dividends and distributions are determined in accordance with federal income tax regulations, which may differ from GAAP. Dividends and distributions to shareholders are recorded on the ex-dividend date. The tax character of distributions paid to shareholders during the year ended November 30, 2022 was ordinary income of $18,659 and net long-term capital gains of $28. There were no distributions paid to shareholders during the period ended November 30, 2021.
Estimates – The preparation of financial statements in conformity with GAAP requires management to make estimates and assumptions that affect the reported amounts of assets and liabilities and disclosure of contingent assets and liabilities as of the date of the financial statements and the reported amounts of increase (decrease) in net assets from operations during the reporting period. Actual results could differ from those estimates.
Federal income tax – The Fund has qualified and intends to continue to qualify as a regulated investment company under the Internal Revenue Code of 1986, as amended (the “Code”). Qualification generally will relieve the Fund of liability for federal income taxes to the extent 100% of its net investment income and net realized capital gains are distributed in accordance with the Code.
In order to avoid imposition of the excise tax applicable to regulated investment companies, it is also the Fund’s intention to declare as dividends in each calendar year at least 98% of its net investment income (earned during the calendar year) and 98.2% of its net realized capital gains (earned during the twelve months ended October 31) plus undistributed amounts from prior years.
The following information was computed on a tax basis for each item as of November 30, 2022, the Fund’s most recent fiscal year end:
| Tax cost of portfolio investments | $ | 14,723,736 | ||
| Gross unrealized appreciation | $ | 1,605,410 | ||
| Gross unrealized depreciation | (480,504 | ) | ||
| Net unrealized appreciation | 1,124,906 | |||
| Undistributed ordinary income | 132,643 | |||
| Accumulated capital and other losses | (109,059 | ) | ||
| Distributable earnings | $ | 1,148,490 | ||
19
| U.S. VALUE ETF |
| NOTES TO FINANCIAL STATEMENTS (Continued) |
The difference between the federal income tax cost of investments and the financial statement cost of investments for the Fund is due to certain timing differences in the recognition of capital gains or losses under income tax regulations and GAAP. These “book/tax” differences are temporary in nature and are primarily due to the tax deferral losses on wash sales, holdings classified as passive foreign investment companies, publicly traded partnerships and real estate investment trusts.
For the year ended November 30, 2022, the Fund reclassified $2 of distributable earnings against paid-in capital on the Statement of Assets and Liabilities. Such reclassification, the result of permanent differences between the financial statements and income tax requirements, had no effect on the Fund’s net assets or NAV per share.
As of November 30, 2022, the Fund had the following capital loss carryforwards for federal income tax purposes, which may be carried forward indefinitely of $68,385 short-term and $40,674 long-term. These capital loss carryforwards are available to offset net realized capital gains in future years, thereby reducing taxable gain distributions.
The Fund recognizes the tax benefits or expenses of uncertain tax positions only when the position is “more likely than not” of being sustained assuming examination by tax authorities. Management has reviewed the Fund’s tax positions for all open tax years and has concluded that no provision for unrecognized tax benefits or expenses is required in these financial statements. The Fund identifies its major tax jurisdiction as U.S. Federal.
3. Investment Transactions
During the year ended November 30, 2022, cost of purchases and proceeds from sales of investment securities, excluding in-kind transactions and short-term investments, amounted to $6,102,078 and $5,389,650. Purchases and sales of in-kind transactions for the year ended November 30, 2022 amounted to $10,981,172 and $0. There were no realized gains from in-kind transactions during the year ended November 30, 2022.
4. Transactions with Related Parties
INVESTMENT ADVISORY AGREEMENT
The Fund’s investments are managed by Lyrical Asset Management L.P. (the “Adviser”) pursuant to the terms of an Investment Advisory Agreement. The Fund pays the Adviser an investment advisory fee, computed and accrued daily and paid monthly, at the annual rate of 0.45% of average daily net assets. During the year ended November 30, 2022, the Adviser earned $29,506 of fees under the Investment Advisory Agreement.
Pursuant to an Expense Limitation Agreement (“ELA”) between the Fund and the Adviser, the Adviser has contractually agreed, until July 30, 2023, to reduce investment advisory fees and reimburse other operating expenses to limit total annual operating expenses of the Fund (exclusive of brokerage costs; taxes; interest; borrowing costs such as interest and dividend expenses on securities sold short; costs to organize the Fund; acquired fund
20
| U.S. VALUE ETF |
| NOTES TO FINANCIAL STATEMENTS (Continued) |
fees and expenses; extraordinary expenses such as litigation and merger or reorganization costs; and other expenses not incurred in the ordinary course of the Fund’s business) to an amount not exceeding 0.49% of the average daily net assets of the Fund’s shares.
Accordingly, during the year ended November 30, 2022, the Adviser did not collect any of its investment advisory fees from the Fund and reimbursed other operating expenses of $167,928.
Under the terms of the ELA, investment advisory fee reductions and expense reimbursements by the Adviser are subject to repayment by the Funds for a period of three years after such fees and expenses were incurred, provided that the repayments do not cause total annual fund operating expenses to exceed the lesser of (i) the expense limitation then in effect, if any, and (ii) the expense limitation in effect at the time the expenses to be repaid were incurred. As of November 30, 2022, the Adviser may seek repayment of advisory fee reductions and expense reimbursements no later than the dates below:
| November 30, 2024 | November 30, 2025 | Total |
| $43,752 | $197,434 | $241,186 |
OTHER SERVICE PROVIDERS
Ultimus Fund Solutions, LLC (“Ultimus”) provides administration, fund accounting and compliance services to the Fund. The Fund pays Ultimus fees in accordance with the agreements for such services. In addition, the Fund pays out-of-pocket expenses including, but not limited to, postage, supplies, and certain costs related to the pricing of the Fund’s portfolio securities.
Under the terms of a Distribution Agreement with the Trust, Northern Lights Distributors, LLC (the “Distributor”) serves as the principal underwriter to the Fund. The Distributor is a wholly-owned subsidiary of Ultimus. The Distributor is compensated by the Adviser for acting as principal underwriter.
A Trustee and certain officers of the Trust are also officers of Ultimus.
TRUSTEE COMPENSATION
Effective October 17, 2022, each member of the Board (a “Trustee”) who is not an “interested person” (as defined by the 1940 Act, as amended) of the Trust (“Independent Trustee”) receives a $1,300 annual retainer from the Fund, paid quarterly, except for the Board Chairperson who receives a $1,700 annual retainer from the Fund, paid quarterly and the Audit Committee Chairperson who receives a $1,500 annual retainer from the Fund, paid quarterly. Each Independent Trustee also receives from the Fund a fee of $550 for each Board meeting attended plus reimbursement for travel and other meeting-related expenses. Prior to October 17, 2022, no annual retainer was designated specifically for the Audit Committee Chairperson.
21
| U.S. VALUE ETF |
| NOTES TO FINANCIAL STATEMENTS (Continued) |
5. Capital Share Transactions
Shares are not individually redeemable and may be redeemed by the Fund at NAV only in large blocks known as “Creation Units” of 25,000 shares. Only Authorized Participants (“APs”) or transactions done through an Authorized Participant (“AP”) are permitted to purchase or redeem Creation Units from the Fund. An AP is either (i) a broker-dealer or other participant in the clearing process through the Continuous Net Settlement System of the National Securities Clearing Corporation or (ii) a Depository Trust Company participant and, in each case, must have executed a Participant Agreement with the Distributor. Such transactions are generally permitted on an in-kind basis, with a balancing cash component to equate the transaction to the NAV per share of the Fund on the transaction date. Cash may be substituted equivalent to the value of certain securities generally when they are not available in sufficient quantity for delivery, not eligible for trading by the AP or as a result of other market circumstances. The Fund charges APs standard creation and redemption transaction fees (“Transaction Fees”) to offset transfer and other transaction costs associated with the issuance and redemption of Creation Units. The standard creation and redemption transaction fees are set forth in the table below. The standard creation transaction fee is charged to the AP on the day such AP creates a Creation Unit, and is the same regardless of the number of Creation Units purchased by the AP on the applicable business day. Similarly, the standard redemption transaction fee is charged to the AP on the day such AP redeems a Creation Unit, and is the same regardless of the number of Creation Units redeemed by the AP on the applicable business day. Creations and redemptions for cash (when cash creations and redemptions (in whole or in part) are available or specified) are also subject to an additional charge (up to the maximum amounts shown in the table below). This charge is intended to compensate for brokerage, tax, foreign exchange, execution, price movement and other costs and expenses related to cash transactions (which may, in certain instances, be based on a good faith estimate of transaction costs). For the year ended November 30, 2022, the Fund received $2,400 in transaction fees.
The Transaction Fees for the Fund are listed in the table below:
| Fee for In-Kind and Cash Purchases | Maximum
Additional Variable Change for Cash Purchases* |
| $800 | 2.00%* |
| * | As a percentage of the amount invested. |
6. Investment Risks
ETF Risk
The NAV of the Fund can fluctuate up or down, and a shareholder could lose money investing in the Fund if the prices of the securities owned by the Fund decline. In addition, the Fund may be subject to the following risks: (1) the market price of the Fund’s shares
22
| U.S. VALUE ETF |
| NOTES TO FINANCIAL STATEMENTS (Continued) |
may trade above or below its NAV; (2) an active trading market for the Fund’s shares may not develop or be maintained; or (3) trading of the Fund’s shares may be halted if the listing exchange’s officials deem such action appropriate, the shares are delisted from the exchange, or the activation of market-wide “circuit breakers” (which are tied to large decreases in stock prices) halts stock trading generally.
Sector Risk
If the Fund has significant investments in the securities of issuers within a particular sector, any development affecting that sector will have a greater impact on the value of the net assets of the Fund than would be the case if the Fund did not have significant investments in that sector. In addition, this may increase the risk of loss in the Fund and increase the volatility of the Fund’s NAV per share. For instance, economic or market factors, regulatory changes or other developments may negatively impact all companies in a particular sector, and therefore the value of the Fund’s portfolio will be adversely affected. As of November 30, 2022, the Fund had 32.6% of the value of its net assets invested in stocks within the Financials sector.
7. Contingencies and Commitments
The Fund indemnifies the Trust’s officers and Trustees for certain liabilities that might arise from their performance of their duties to the Fund. Additionally, in the normal course of business the Fund enters into contracts that contain a variety of representations and warranties and which provide general indemnifications. The Fund’s maximum exposure under these arrangements is unknown, as this would involve future claims that may be made against the Fund that have not yet occurred. However, based on experience, the Fund expects the risk of loss to be remote.
8. Subsequent Events
The Fund is required to recognize in the financial statements the effects of all subsequent events that provide additional evidence about conditions that existed as of the date of the Statement of Assets and Liabilities. For non-recognized subsequent events that must be disclosed to keep the financial statements from being misleading, the Fund is required to disclose the nature of the event as well as an estimate of its financial effect, or a statement that such an estimate cannot be made. Management has evaluated subsequent events through the issuance of these financial statements and has noted no such events.
23
| U.S. VALUE ETF |
| REPORT OF INDEPENDENT REGISTERED |
| PUBLIC ACCOUNTING FIRM |
To
the Board of Trustees of Ultimus Managers Trust
and the Shareholders of U.S. Value ETF
Opinion on the Financial Statements
We have audited the accompanying statement of assets and liabilities of U.S. Value ETF, a series of shares of beneficial interest in Ultimus Managers Trust (the “Fund”), including the schedule of investments, as of November 30, 2022, and the related statement of operations for the year then ended, and the statement of changes in net assets and the financial highlights for the year then ended and for the period from September 14, 2021 (commencement of operations) through November 30, 2021, and the related notes (collectively referred to as the “financial statements”). In our opinion, the financial statements present fairly, in all material respects, the financial position of the Fund as of November 30, 2022, and the results of its operations for the year then ended, and the changes in its net assets and its financial highlights for the period from September 14, 2021 through November 30, 2021, in conformity with accounting principles generally accepted in the United States of America.
Basis for Opinion
These financial statements are the responsibility of the Fund’s management. Our responsibility is to express an opinion on the Fund’s financial statements based on our audits. We are a public accounting firm registered with the Public Company Accounting Oversight Board (United States) (“PCAOB”) and are required to be independent with respect to the Fund in accordance with the U.S. federal securities law and the applicable rules and regulations of the Securities and Exchange Commission and the PCAOB.
We conducted our audits in accordance with the standards of the PCAOB. Those standards require that we plan and perform the audits to obtain reasonable assurance about whether the financial statements are free of material misstatement, whether due to error or fraud. The Fund is not required to have, nor were we engaged to perform, an audit of its internal control over financial reporting. As part of our audits we are required to obtain an understanding of internal control over financial reporting but not for the purpose of expressing an opinion on the effectiveness of the Fund’s internal control over financial reporting. Accordingly, we express no such opinion.
24
| U.S. VALUE ETF |
| REPORT OF INDEPENDENT REGISTERED |
| PUBLIC ACCOUNTING FIRM (Continued) |
Our audits included performing procedures to assess the risk of material misstatement of the financial statements, whether due to error or fraud, and performing procedures that respond to those risks. Such procedures included examining, on a test basis, evidence regarding the amounts and disclosures in the financial statements. Our procedures included confirmation of securities owned as of November 30, 2022 by correspondence with the custodian. Our audits also included evaluating the accounting principles used and significant estimates made by management, as well as evaluating the overall presentation of the financial statements. We believe that our audits provide a reasonable basis for our opinion.

BBD, LLP
We have served as the auditor of one or more of the Funds in the Ultimus Managers Trust since 2013.
Philadelphia, Pennsylvania
January 26, 2023
25
| U.S. VALUE ETF |
| ABOUT YOUR FUND’S EXPENSES (Unaudited) |
We believe it is important for you to understand the impact of costs on your investment. As a shareholder of the Fund, you may incur two types of costs: (1) transactions costs, including commissions on trading, as applicable; and (2) ongoing costs, including investment advisory fees and other operating expenses. The following examples are intended to help you understand your ongoing costs (in dollars) of investing in the Fund and to compare these costs with the ongoing costs of investing in other mutual funds.
A mutual fund’s ongoing costs are expressed as a percentage of its average net assets. This figure is known as the expense ratio. The expenses in the table below are based on an investment of $1,000 made at the beginning of the most recent period (June 1, 2022) and held until the end of the period (November 30, 2022).
The table below illustrates the Fund’s ongoing costs in two ways:
Actual fund return – This section helps you to estimate the actual expenses that you paid over the period. The “Ending Account Value” shown is derived from the Fund’s actual return, and the fourth column shows the dollar amount of operating expenses that would have been paid by an investor who started with $1,000 in the Fund. You may use the information here, together with the amount you invested, to estimate the expenses that you paid over the period.
To do so, simply divide your account value by $1,000 (for example, an $8,600 account value divided by $1,000 = 8.6), then multiply the result by the number given for the Fund under the heading “Expenses Paid During Period.”
Hypothetical 5% return – This section is intended to help you compare the Fund’s ongoing costs with those of other mutual funds. It assumes that the Fund had an annual return of 5% before expenses during the period shown, but that the expense ratio is unchanged. In this case, because the return used is not the Fund’s actual return, the results do not apply to your investment. The example is useful in making comparisons because the U.S. Securities and Exchange Commission (the “SEC”) requires all mutual funds to calculate expenses based on a 5% return. You can assess the Fund’s ongoing costs by comparing this hypothetical example with the hypothetical examples that appear in shareholder reports of other funds.
Note that expenses shown in the table are meant to highlight and help you compare ongoing costs only and do not reflect any transactional costs. Further, the expenses do not include any brokerage commissions on investors’ purchases or redemptions of Fund shares as described in the Fund’s prospectus.
The calculations assume no shares were bought or sold during the period. Your actual costs may have been higher or lower, depending on the amount of your investment and the timing of any purchases or redemptions.
26
| U.S. VALUE ETF |
| ABOUT YOUR FUND’S EXPENSES (Unaudited) (Continued) |
More information about the Fund’s expenses can be found in this report. For additional information on operating expenses and other shareholder costs, please refer to the Fund’s prospectus.
| Beginning | Ending | Net | Expenses | |
| Account Value | Account Value | Expense | Paid During | |
| June 1, 2022 | November 30, 2022 | Ratio(a) | Period(b) | |
| Based on Actual Fund Return. | $1,000.00 | $1,009.50 | 0.49% | $2.47 |
| Based on Hypothetical 5% Return (before expenses) | $1,000.00 | $1,022.61 | 0.49% | $2.48 |
| (a) | Annualized, based on Fund’s most recent one-half year expenses. |
| (b) | Expenses are equal to the Fund’s annualized net expense ratio multiplied by the average account value over the period, multiplied by 183/365 (to reflect the one-half year period). |
27
| U.S. VALUE ETF |
| OTHER INFORMATION (Unaudited) |
A description of the policies and procedures that the Fund uses to vote proxies relating to portfolio securities is available without charge upon request by calling toll-free 1-833-825-8383, or on the SEC’s website at www.sec.gov. Information regarding how the Fund voted proxies relating to portfolio securities during the most recent period ended June 30 will be available without charge upon request by calling toll-free 1-833-825-8383, or on the SEC’s website at www.sec.gov.
The Trust files a complete listing of portfolio holdings for the Fund with the SEC as of the end of the first and third quarters of each fiscal year as an exhibit to its reports on Form N-PORT. These filings are available upon request by calling 1-833-825-8383. Furthermore, you may obtain a copy of the filings on the SEC’s website at www.sec.gov and on the Fund’s website at www.usvalueetf.com.
| FEDERAL TAX INFORMATION (Unaudited) |
For the fiscal year ended November 30, 2022, the Fund designated $28 as long-term captial gain distributions.
Qualified Dividend Income – The Fund designates 46.33% of their ordinary income dividends, or up to the maximum amount of such dividends allowable pursuant to the Internal Revenue Code, as qualified dividend income eligible for the reduced tax rate of 15%.
Dividends Received Deduction – Corporate shareholders are generally entitled to take the dividends received deduction on the portion of the Fund’s dividend distribution that qualifies under tax law. For the fiscal year ended November 30, 2022, the percentage of ordinary income dividends qualified for the corporate dividends receivable deduction for the Fund was 32.49%.
28
| U.S. VALUE ETF |
| BOARD OF TRUSTEES AND EXECUTIVE OFFICERS (Unaudited) |
The Board has overall responsibility for management of the Trust’s affairs. The Trustees serve during the lifetime of the Trust and until its termination, or until death, resignation, retirement, or removal. The Trustees, in turn, elect the officers of the Fund to actively supervise their day-to-day operations. The officers have been elected for an annual term. The following are the Trustees and executive officers of the Fund:
| Name
and Year of Birth |
Length
of Time Served |
Position(s)
Held with Trust |
Principal Occupation(s) During Past 5 Years |
Number
of Funds in the Trust Overseen by Trustee |
Directorships of Public Companies Held by Trustee During Past 5 Years |
| Interested Trustees: | |||||
| David
R. Carson*^ Year of Birth: 1958 |
2021
to present 2021 to present and April 2013 to October 2013 2013 to 2021 |
Trustee
(2021 to present) Vice President President and Principal Executive Officer |
Senior Vice President and Director of Client Strategies of Ultimus Fund Solutions, LLC (2013 to present); and President of Unified Series Trust (2017 to 2020) | 33 | Interested Trustee of 31 series of the Unified Series Trust (a registered management company) (2020 to present) |
| Independent Trustees: | |||||
| Janine
L. Cohen^ Year of Birth: 1952 |
Since 2016 | Chairperson
(2019 to present) Trustee (2016 to present) |
Retired since 2013; previously Chief Financial Officer from 2004 to 2013 and Chief Compliance Officer from 2008 to 2013 at AER Advisors, Inc. | 33 | n/a |
29
| U.S. VALUE ETF |
| BOARD OF TRUSTEES AND EXECUTIVE OFFICERS (Unaudited) (Continued) |
| Name
and Year of Birth |
Length
of Time Served |
Position(s)
Held with Trust |
Principal Occupation(s) During Past 5 Years |
Number
of Funds in the Trust Overseen by Trustee |
Directorships of Public Companies Held by Trustee During Past 5 Years |
| Independent Trustees (Continued): | |||||
| David
M. Deptula^ Year of Birth: 1958 |
Since 2012 | Trustee (2012 to present) | Vice President of Legal and Special Projects at Dayton Freight Lines, Inc. since 2016 | 33 | n/a |
| Robert
E. Morrison^ Year of Birth: 1957 |
Since 2019 | Trustee (2019 to present; and previously 2012 to 2012) | Managing Director at Midwest Trust and FCI Advisors (2022 to present); Senior Vice President and National Practice Lead for Investment, Huntington National Bank/Huntington Private Bank (2014 to 2022); CEO, CIO, President of 5 Star Investment Management Company (2006 to 2014) | 33 | n/a |
| Clifford
N. Schireson^ Year of Birth: 1953 |
Since 2019 | Trustee (2019 to present) | Retired; Founder of Schireson Consulting, LLC (2017 to 2022); Director of Institutional Services for Brandes Investment Partners, LP (2004 to 2017) | 33 | Trustee of the San Diego City Employees’ Retirement System (2019 to present) |
| Jacqueline
A. Williams^ Year of Birth: 1954 |
Since 2019 | Trustee (2019 to present) | Managing Member of Custom Strategy Consulting, LLC (2017 to present); Managing Director of Global Investment Research (2005 to 2017), Cambridge Associates, LLC | 33 | n/a |
| * | Mr. Carson is considered an “interested person” of the Trust within the meaning of Section (2)(a)(19) of the Investment Company Act of 1940, as amended, because of his relationship with the Trust’s Administrator, Transfer Agent, and Distributor. Mr. Carson was President of the Trust from October 2013 to January 2021 and Vice President of the Trust from April 2013 to October 2013. |
30
| U.S. VALUE ETF |
| BOARD OF TRUSTEES AND EXECUTIVE OFFICERS (Unaudited) (Continued) |
| Name
and Year of Birth |
Length of Time Served |
Position(s) Held with Trust |
Principal Occupation(s) During Past 5 Years |
| Executive Officers: | |||
| Todd
E. Heim^ Year of Birth: 1967 |
2021
to present 2014 to 2021 |
President Vice President |
Vice President , Relationship Management (2018 to present) and Assistant Vice President, Client Implementation Manager with Ultimus Fund Solutions, LLC (2014 to 2018); Naval Flight Officer in United States Navy (1989 to 2017) |
| Jennifer
L. Leamer^ Year of Birth: 1976 |
2014
to present April 2014 to October 2014 |
Treasurer Assistant Treasurer |
Senior Vice President of Fund Accounting (2020 to present) and Mutual Fund Controller of Ultimus Fund Solutions, LLC (2014 to 2020) |
| Daniel
D. Bauer^ Year of Birth: 1977 |
2016
to present |
Assistant Treasurer | Vice President of Fund Accounting (2022 to present), Assistant Vice President of Fund Accounting (2020 to 2022), and Assistant Mutual Fund Controller (2015 to 2020) of Ultimus Fund Solutions, LLC |
| Angela
A. Simmons^ Year of Birth: 1975 |
January 2022 to present |
Assistant Treasurer | Vice President of Financial Administration (2022 to present) and Assistant Vice President, Financial Administration (2015 to 2022) of Ultimus Fund Solutions, LLC |
| Khimmara
Greer^ Year of Birth: 1983 |
October 2021 to present |
Secretary | Vice President and Senior Legal Counsel of Ultimus Fund Solutions, LLC (2021 to present); Vice President, Asset Servicing – Regulatory Administration of The Bank of New York Mellon (2019 to 2021); Vice President and Counsel of State Street Bank and Trust Company (2015 to 2019) |
| David
K. James^ Year of Birth: 1970 |
October 2021 to present July 2021 to October 2022 |
Assistant
Secretary Secretary |
Executive Vice President and Chief Legal and Risk Officer of Ultimus Fund Solutions, LLC (2018 to present); Managing Director and Managing Counsel of State Street Bank and Trust Company (2009 to 2018) |
| Natalie
S. Anderson^ Year of Birth: 1975 |
2016
to present |
Assistant Secretary | Legal Administration Manager (2016 to present) and Paralegal (2015 to 2016) of Ultimus Fund Solutions, LLC |
31
| U.S. VALUE ETF |
| BOARD OF TRUSTEES AND EXECUTIVE OFFICERS (Unaudited) (Continued) |
| Name
and Year of Birth |
Length of Time Served |
Position(s) Held with Trust |
Principal Occupation(s) During Past 5 Years |
| Executive Officers (Continued): | |||
| Gweneth
K. Gosselink^ Year of Birth: 1955 |
2020
to present |
Chief
Compliance Officer |
Assistant Vice President, Compliance Officer at Ultimus Fund Solutions, LLC (2019 to present); CCO Consultant at GKG Consulting, LLC (2019 to 2021); Chief Operating Officer & CCO at Miles Capital, Inc. (2013 to 2019) |
| Martin
Dean^ Year of Birth: 1963 |
2020
to present 2019 to 2020 2016 to 2017 |
Assistant
Chief Compliance Officer Interim Chief Compliance Officer Assistant Chief Compliance Officer |
Senior Vice President, Head of Fund Compliance (2020 to present) and Vice President & Director of Fund Compliance of Ultimus Fund Solutions, LLC (2016 to 2020) |
| ^ | Address is 225 Pictoria Drive, Suite 450, Cincinnati, Ohio 45246 |
Additional information about members of the Board and executive officers is available in the Funds’ Statement of Additional Information (“SAI”). To obtain a free copy of the SAI, please call toll free 1-833-825-8383.
32
| U.S. VALUE ETF |
| LIQUIDITY RISK MANAGEMENT PROGRAM (Unaudited) |
The Fund has adopted and implemented a written liquidity risk management program (the “Program”) as required by Rule 22e-4 (the “Liquidity Rule”) under the Investment Company Act of 1940, as amended. The Program is reasonably designed to assess and manage the Fund’s liquidity risk, taking into consideration, among other factors, the Fund’s investment strategy and the liquidity of its portfolio investments during normal and reasonably foreseeable stressed conditions; its short- and long-term cash flow projections; and its cash holdings and access to other funding sources. The Fund’s Board of Trustees (the “Board”) approved the appointment of the Liquidity Administrator Committee, comprising of the Fund’s Adviser and certain Trust officers, to be responsible for the Program’s administration and oversight and for reporting to the Board on at least an annual basis regarding the Program’s operation and effectiveness. The annual written report assessing the Program (the “Report”) was presented to the Board at the October 17 – 18, 2022 Board meeting and covered the period from June 1, 2021 to May 31, 2022 (the “Review Period”).
During the Review Period, the Fund did not experience unusual stress or disruption to its operations related to purchase and redemption activity. Also, during the Review Period, the Fund held adequate levels of cash and highly liquid investments to meet shareholder redemption activities in accordance with applicable requirements. The Report concluded that the Program is reasonably designed to prevent violation of the Liquidity Rule and the Program has been effectively implemented.
33
This page intentionally left blank.
This page intentionally left blank.
This page intentionally left blank.
| (b) | Not applicable. |
| Item 2. | Code of Ethics. |
As of the end of the period covered by this report, the registrant has adopted a code of ethics that applies to the registrant’s principal executive officer, principal financial officer, principal accounting officer or controller, or persons performing similar functions, regardless of whether these individuals are employed by the registrant or a third party. Pursuant to Item 13(a)(1), a copy of registrant’s code of ethics is filed as an exhibit to this Form N-CSR. During the period covered by this report, the code of ethics has not been amended, and the registrant has not granted any waivers, including implicit waivers, from the provisions of the code of ethics.
| Item 3. | Audit Committee Financial Expert. |
The registrant’s board of trustees has determined that the registrant has at least one audit committee financial expert serving on its audit committee. The name of the audit committee financial expert is Janine L. Cohen. Ms. Cohen is “independent” for purposes of this Item.
| Item 4. | Principal Accountant Fees and Services. |
| (a) | Audit Fees. The aggregate fees billed for professional services rendered by the principal accountant for the audit of the registrant’s annual financial statements or for services that are normally provided by the accountant in connection with statutory and regulatory filings or engagements were $65,000 and $63,400 with respect to the registrant’s fiscal years ended November 30, 2022 and November 30, 2021, respectively. |
| (b) | Audit-Related Fees. No fees were billed in the last fiscal year for assurance and related services by the principal accountant that are reasonably related to the performance of the audit of the registrant’s financial statements and are not reported under paragraph (a) of this Item. |
| (c) | Tax Fees. The aggregate fees billed for professional services rendered by the principal accountant for tax compliance, tax advice, and tax planning were $15,400 and $18,000 with respect to the registrant’s fiscal years ended November 30, 2022 and November 30, 2021, respectively. The services comprising these fees relate to tax preparation of the registrant’s federal income and excise tax returns. |
| (d) | All Other Fees. No fees were billed in the last fiscal year for products and services provided by the principal accountant, other than the services reported in paragraphs (a) through (c) of this Item. |
(e)(1) The audit committee has not adopted pre-approval policies and procedures described in paragraph (c)(7) of Rule 2-01 of Regulation S-X.
| (e)(2) | None of the services described in paragraph (b) through (d) of this Item were approved by the audit committee pursuant to paragraph (c)(7)(i)(C) of Rule 2-01 of Regulation S-X. |
| (f) | Less than 50% of hours expended on the principal accountant’s engagement to audit the registrant’s financial statements for the most recent fiscal year were attributed to work performed by persons other than the principal accountant’s full-time, permanent employees. |
(g) During the fiscal years ended November 30, 2022 and 2021, aggregate non-audit fees of $15,400 and $18,000, respectively, were billed by the registrant’s principal accountant for services rendered to the registrant. No non-audit fees were billed in the last fiscal year by the registrant’s principal accountant for services rendered to the registrant’s investment adviser (not including any sub-adviser whose role is primarily portfolio management and is subcontracted with or overseen by another investment adviser), and any entity controlling, controlled by, or under common control with the adviser that provides ongoing services to the registrant.
| (h) | The principal accountant has not provided any non-audit services to the registrant’s investment adviser (not including any sub-adviser whose role is primarily portfolio management and is subcontracted with or overseen by another investment adviser), and any entity controlling, controlled by, or under common control with the investment adviser that provides ongoing services to the registrant. |
| (i) | Not applicable |
| (j) | Not applicable |
| Item 5. | Audit Committee of Listed Registrants. |
Not applicable
| Item 6. | Schedule of Investments. |
(a) Not applicable [schedule filed with Item 1]
(b) Not applicable
| Item 7. | Disclosure of Proxy Voting Policies and Procedures for Closed-End Management Investment Companies. |
Not applicable
| Item 8. | Portfolio Managers of Closed-End Management Investment Companies. |
Not applicable
| Item 9. | Purchases of Equity Securities by Closed-End Management Investment Company and Affiliated Purchasers. |
Not applicable
| Item 10. | Submission of Matters to a Vote of Security Holders. |
There has been no material changes to the manner in which shareholders may recommend nominees to the Registrant’s Board of Trustees or the Nominations & Governance Committee (the “Committee”). The Registrant does not have formal procedures by which shareholders may recommend nominees to the Registrant’s Board of Trustees. While the Registrant does not have formal procedure, the Committee shall to the extent required under applicable law, when identifying potential candidates for the position of Independent Trustee, consider any such candidate recommended by a shareholder.
Item 11. Controls and Procedures.
(a) Based on their evaluation of the registrant’s disclosure controls and procedures (as defined in Rule 30a-3(c) under the Investment Company Act of 1940) as of a date within 90 days of the filing date of this report, the registrant’s principal executive officer and principal financial officer have concluded that such disclosure controls and procedures are reasonably designed and are operating effectively to ensure that material information relating to the registrant, including its consolidated subsidiaries, is made known to them by others within those entities, particularly during the period in which this report is being prepared, and that the information required in filings on Form N-CSR is recorded, processed, summarized, and reported on a timely basis.
(b) There were no changes in the registrant’s internal control over financial reporting (as defined in Rule 30a-3(d) under the Investment Company Act of 1940) that occurred during the period covered by this report that have materially affected, or are reasonably likely to materially affect, the registrant’s internal control over financial reporting.
Item 12. Disclosure of Securities Lending Activities for Closed-End Management Investment Companies.
Not applicable
| Item 13. | Exhibits. |
File the exhibits listed below as part of this Form. Letter or number the exhibits in the sequence indicated.
(a)(1) Any code of ethics, or amendment thereto, that is the subject of the disclosure required by Item 2, to the extent that the registrant intends to satisfy the Item 2 requirements through filing of an exhibit: Attached hereto
(a)(2) A separate certification for each principal executive officer and principal financial officer of the registrant as required by Rule 30a-2(a) under the Act (17 CFR 270.30a-2(a)): Attached hereto
(a)(3) Any written solicitation to purchase securities under Rule 23c-1 under the Act (17 CFR 270.23c-1) sent or given during the period covered by the report by or on behalf of the registrant to 10 or more persons: Not applicable
(a)(4) Change in the registrant’s independent public accountants: Not applicable
(b) Certifications required by Rule 30a-2(b) under the Act (17 CFR 270.30a-2(b)): Attached hereto
Exhibit 99.CODE ETH Code of Ethics
Exhibit 99.CERT Certifications required by Rule 30a-2(a) under the Act
Exhibit 99.906CERT Certifications required by Rule 30a-2(b) under the Act
SIGNATURES
Pursuant to the requirements of the Securities Exchange Act of 1934 and the Investment Company Act of 1940, the registrant has duly caused this report to be signed on its behalf by the undersigned, thereunto duly authorized.
| (Registrant) | Ultimus Managers Trust | ||
| By (Signature and Title)* | /s/ Todd E. Heim | ||
| Todd E. Heim, President | |||
| Date | February 3, 2023 | ||
| Pursuant to the requirements of the Securities Exchange Act of 1934 and the Investment Company Act of 1940, this report has been signed below by the following persons on behalf of the registrant and in the capacities and on the dates indicated. | |||
| By (Signature and Title)* | /s/ Todd E. Heim | ||
| Todd E. Heim, Principal Executive Officer | |||
| Date | February 3, 2023 | ||
| By (Signature and Title)* | /s/ Jennifer L. Leamer | ||
| Jennifer L. Leamer, Treasurer and Principal Financial Officer | |||
| Date | February 3, 2023 | ||
* Print the name and title of each signing officer under his or her signature.
ATTACHMENTS / EXHIBITS
Serious News for Serious Traders! Try StreetInsider.com Premium Free!
You May Also Be Interested In
- LINCOLN ALERT: Bragar Eagel & Squire, P.C. Announces that a Class Action Lawsuit Has Been Filed Against Lincoln National Corporation and Encourages Investors to Contact the Firm
- ADSK INVESTOR ALERT: ROSEN, TOP RANKED INVESTOR COUNSEL, Encourages Autodesk, Inc. Investors to Secure Counsel Before Important Deadline in Securities Class Action First Filed by the Firm – ADSK
- ROSEN, A TOP RANKED LAW FIRM, Encourages CI&T Inc Investors to Inquire About Securities Class Action Investigation – CINT
Create E-mail Alert Related Categories
SEC FilingsSign up for StreetInsider Free!
Receive full access to all new and archived articles, unlimited portfolio tracking, e-mail alerts, custom newswires and RSS feeds - and more!
