UNITED STATES
SECURITIES AND EXCHANGE COMMISSION
Washington, D.C. 20549
FORM N-CSR
CERTIFIED
SHAREHOLDER REPORT OF REGISTERED
MANAGEMENT INVESTMENT COMPANIES
Investment Company Act file number: 811-08257
STATE STREET INSTITUTIONAL FUNDS
(Exact name of registrant as specified in charter)
One Iron
Street
Boston, Massachusetts 02210
(Address of principal executive offices)(Zip code)
|
|
|
| (Name and Address of Agent for Service) |
|
Copy to: |
|
|
| Sean O’Malley, Esq.
Senior Vice President and General Counsel
c/o SSGA Funds Management, Inc.
One Iron Street Boston,
Massachusetts 02210 |
|
Timothy W. Diggins, Esq.
Ropes & Gray LLP
Prudential Tower 800
Boylston Street Boston, Massachusetts 02199-3600 |
Registrant’s telephone number, including area code:
800-242-0134
Date of fiscal year end:
September 30
Date of reporting period: September 30, 2022
Item 1. Shareholder Report.
(a) The Report to Shareholders is attached herewith.
Annual Report
September 30, 2022
| State Street Institutional Funds
|
| State Street
Institutional U.S. Equity Fund |
| State Street
Institutional Premier Growth Equity Fund |
| State Street
Institutional Small-Cap Equity Fund |
State Street Institutional Funds
Annual Report
September 30, 2022
| |
Page
|
|
1
|
| Management's
Discussion of Fund Performance, Understanding Your Fund's Expenses, Performance Summary and Schedule of Investments |
|
|
2
|
|
10
|
|
17
|
| Financial
Statements |
|
|
28
|
|
34
|
|
35
|
|
36
|
|
38
|
|
46
|
|
47
|
The information contained
in this report is intended for the general information of shareholders of the Trust. This report is not authorized for distribution to prospective investors unless preceded or accompanied by a current Trust prospectus which contains important
information concerning the Trust. You may find the fund’s prospectus and other information about the fund online at
www.ssga.com or you also may get this information at no cost by calling 1-800-242-0134
or by sending an e-mail request to
[email protected]. Please read the prospectus carefully before you invest.
[This page
intentionally left blank]
State Street Institutional
Funds
Notes to Performance — September 30, 2022
(Unaudited)
Total return performance shown in this report for the State
Street Institutional Funds (the “Trust”) and each of its series portfolios (each, a “Fund” and collectively, the “Funds”) takes into account changes in share price and assumes reinvestment of dividends and capital
gains distributions, if any. Total returns shown are net of Fund expenses.
The performance data quoted represents past performance;
past performance does not guarantee future results. Investment return and principal value will fluctuate, so your shares, when redeemed, may be worth more or less than their original cost. Current performance may be higher or lower than the
performance data quoted. Periods of less than one year are not annualized. Please call toll-free (800) 242-0134 or visit the Funds’ website at www.ssga.com for the most recent month-end performance
data.
An investment in a Fund is not a deposit of any
bank and is not insured or guaranteed by the Federal Deposit Insurance Corporation (“FDIC”) or any other government agency. An investment in a Fund is subject to risk, including possible loss of principal invested.
The S&P 500® Index of stocks (“S&P 500 Index”) is an unmanaged market capitalization-weighted index of stocks of 500 large U.S. companies, which is widely used as a
measure of large-cap U.S. stock market performance.
The Russell 1000® Growth Index is an unmanaged index that measures the performance of the large-cap growth segment of the U.S. equity universe. It includes those Russell 1000 companies with
higher price-to-book ratios and higher forecasted growth values. Russell Investment Group owns the Russell Index data, including all applicable trademarks and copyrights.
The Russell 2000® Index is an unmanaged index that measures the performance of the small-cap segment of the U.S. equity universe. The Russell 2000® Index is a subset of the Russell 3000® Index representing approximately 10% of the total market
capitalization of that index. It includes approximately 2000 of the smallest securities based on a combination of their market cap and current index membership. Russell Investment Group owns the Russell Index data, including all applicable
trademarks and copyrights.
The results shown for the
foregoing indices assume the reinvestment of net dividends or interest and do not reflect fees, expenses, or taxes. As such, index returns do not reflect the actual cost of investing in the instruments that comprise an index.
State Street Global Advisors Funds Distributors, LLC, member of FINRA
& SIPC is the principal underwriter and distributor of the State Street Institutional Funds and an indirect wholly-owned subsidiary of State Street Corporation. References to State Street may include State Street Corporation and its affiliates.
The Funds pay State Street Bank and Trust Company for its services as custodian and Fund Accounting agent, and pay SSGA Funds Management, Inc. ("SSGA FM" or the "Adviser") for investment advisory and administrative services.
State Street Institutional U.S.
Equity Fund
Management Discussion of Fund Performance
— September 30, 2022 (Unaudited)
The State Street Institutional U.S. Equity Fund (the
“Fund”) seeks to provide long-term growth of capital. The Fund’s benchmark is the S&P 500 Index (the “Index”).
For the 12-month period ended September 30, 2022 (the
“Reporting Period”), the total return for the Fund’s Investment Class was -16.99% and for the Fund’s Service Class was -17.16%, and the Index was -15.47%. The Fund and Index returns reflect the reinvestment of dividends and
other income. The Fund’s performance reflects the expenses of managing the Fund, including brokerage and advisory expenses. The Index is unmanaged and Index returns do not reflect fees and expenses of any kind, which would have a negative
impact on returns.
Primary drivers of Fund
performance during the Reporting Period relative to the Index included the negative impact of sector positioning, underperformance in the information technology (IT) sector, and outperformance in the healthcare sector. In a volatile market, the Fund
is slightly ahead of the Index year-to-date in 2022, but lagged at the end of 2021 as a resurgence in COVID-19 disrupted the reopening optimism.
For the Reporting Period, the Fund’s sector
positioning dragged on relative returns with an overweight in communication services, the weakest performing sector in the Index, and underweights in defensive sectors like consumer staples and utilities, which outperformed. The Fund was also
underweight in energy, the top returning sector for the Reporting Period, as high oil prices driven by the economic reopening as well as the Russian invasion of Ukraine drove equities in the sector higher. The negative impact of the underweight
in energy was offset by stock selection in the sector leading to positive relative contribution overall.
In IT, the Fund had negative stock selection most notably
in the software and semiconductor segments, where higher rates and fears of economic contraction impacted sentiment. In addition, semiconductor holdings were impacted by supply chain disruptions and turmoil in China’s economy, which impacted
demand.
The Fund saw strength in healthcare. While we
are underweight in defensive sectors generally due to high valuations, we do gain defensive exposure in healthcare, where we find more compelling quality along with reasonable valuation relative to growth prospects. In the Reporting Period, the Fund
benefitted from positions in pharmaceutical companies like Vertex Pharmaceuticals, which has had strong results in its cystic fibrosis drug and has a long runway of pipeline visibility in our view. Outside of pharma, the Fund also outperformed in
healthcare services, for example with UnitedHealth Group, whose strong market position in managed care has led to resilient results.
The Fund used futures in order to efficiently manage cash
flows during the Reporting Period. The Fund’s use of futures detracted from Fund performance relative to the Index.
On an individual security level, the top positive
contributors to the Fund’s performance on an absolute basis during the Reporting Period were UnitedHealth Group, Vertex Pharmaceuticals and ConocoPhillips. The top negative contributors to the Fund’s performance on an absolute basis
during the Reporting Period were Alphabet, Meta Platforms and Amazon.com.
The views expressed above reflect those of the Fund’s
portfolio manager only through the Reporting Period, and do not necessarily represent the views of the Adviser as a whole. Any such views are subject to change at any time based upon market or other conditions and the Adviser disclaims any
responsibility to update such views. These views may not be relied on as investment advice and, because investment decisions for a fund are based on numerous factors, may not be relied on as an indication of trading intent on behalf of any
fund.
| 2
|
State Street
Institutional U.S. Equity Fund |
State Street Institutional U.S.
Equity Fund
Performance Summary — September 30, 2022
(Unaudited)
Investment Profile
A mutual fund designed for investors who seek long-term
growth of capital. The Fund seeks to achieve its investment objective by investing at least 80% of its net assets under normal circumstances in equity securities of U.S. companies, such as common and preferred stocks.
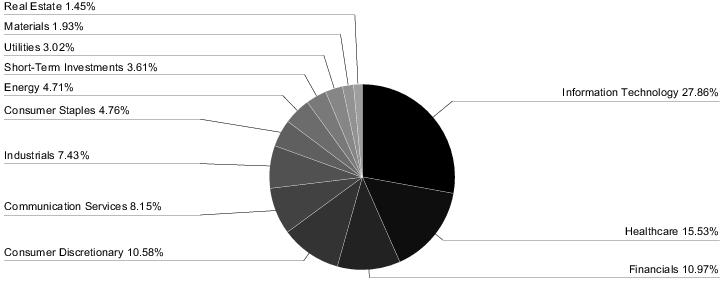
| Sector
Allocation |
| Portfolio
composition as a % of Fair Value of $176,225 (in thousands) as of September 30, 2022 (a)(b) |
| Top
Ten Largest Holdings |
| as
of September 30, 2022 (as a % of Fair Value) (a)(b) |
| Microsoft
Corp. |
6.19%
|
| Apple
Inc. |
5.73%
|
| Amazon.com
Inc. |
4.34%
|
| Alphabet
Inc., Class A |
3.78%
|
| Johnson
& Johnson |
2.56%
|
| ConocoPhillips
|
2.40%
|
| UnitedHealth
Group Inc. |
2.36%
|
| Merck
& Company Inc. |
1.85%
|
| Mastercard
Inc., Class A |
1.80%
|
| NextEra
Energy Inc. |
1.71%
|
|
| (a)
|
Fair
Value basis is inclusive of a short-term investment in the State Street Institutional U.S. Government Money Market Fund - Class G Shares. |
| (b)
|
The
securities information regarding holdings, allocations and other characteristics is presented to illustrate examples of securities that the Fund has bought and the diversity of areas in which the Fund may invest as of a particular date. It may not
be representative of the Fund’s current or future investments and should not be construed as a recommendation to purchase or sell a particular security. |
| State
Street Institutional U.S. Equity Fund |
3
|
State Street Institutional U.S.
Equity Fund
Performance Summary, continued —
September 30, 2022 (Unaudited)
| Average
Annual Total Return for the years ended September 30, 2022 |
| Investment
Class Shares (Inception date: 11/25/97) |
| |
One
Year |
|
Five
Year |
|
Ten
Year |
|
Ending
Value
of a $10,000
Investment |
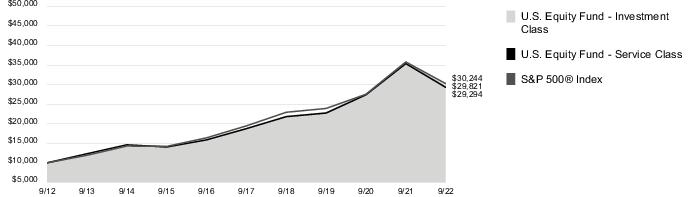
| State
Street Institutional U.S. Equity Fund |
(16.99)%
|
|
9.60%
|
|
11.55%
|
|
$29,821
|
| S&P
500® Index |
(15.47)%
|
|
9.24%
|
|
11.70%
|
|
$30,244
|
| Service
Class Shares (Inception date: 1/3/01) |
| |
One
Year |
|
Five
Year |
|
Ten
Year |
|
Ending
Value
of a $10,000
Investment |
| State
Street Institutional U.S. Equity Fund |
(17.16)%
|
|
9.35%
|
|
11.35%
|
|
$29,294
|
| S&P
500® Index |
(15.47)%
|
|
9.24%
|
|
11.70%
|
|
$30,244
|
Change in
Value of a $10,000 Investment
Yearly periods
ended September 30
| 4
|
State Street
Institutional U.S. Equity Fund |
State Street Institutional U.S.
Equity Fund
Understanding Your Fund’s Expenses
— September 30, 2022 (Unaudited)
As a shareholder of the Fund, you incur ongoing costs. Ongoing costs
include portfolio management fees, distribution and service fees (for Service Class shares) and trustees’ fees. The following example is intended to help you understand your ongoing costs (in dollars) of investing in the Fund and to compare
these costs with the ongoing costs of investing in other mutual funds.
To illustrate these ongoing costs, we have provided an
example and calculated the expenses paid by investors in each share class of the Fund during the period. The information in the following table is based on an investment of $1,000, which is invested at the beginning of the period and held for
the entire six-month period ended September 30, 2022.
Actual Expenses
The first section of the table provides information about
actual account values and actual expenses. You may use the information in this section, together with the amount you invested, to estimate the expenses that you paid over the period. To do so, simply divide your account value by $1,000 (for example,
an $8,600 account value divided by $1,000 = 8.6), then multiply the result by the number given under the heading “Expenses paid during the period” to estimate the expenses you paid on your account during the period.
Hypothetical Example for Comparison Purposes
The second section of the table provides information about
hypothetical account values and hypothetical expenses based on the Fund’s actual expense ratio and an assumed rate of return of 5% per year before expenses, which is not the Fund’s actual return. The hypothetical account values and
expenses may not be used to estimate the actual ending account balance or expenses you paid for the period. You may use this information to compare the ongoing costs of investing in the Fund and other funds. To do so, compare this 5% hypothetical
example with the 5% hypothetical examples that appear in the shareholders reports of other funds.
Please note that the expenses shown in the table are meant
to highlight and help you compare ongoing costs only and do not reflect transaction costs, such as sales charges or redemption fees, if any. Therefore, the second section of the table is useful in comparing ongoing costs only, and will not help you
determine the relative total costs of owning different funds.
| Investment
Class |
|
Actual
Fund Return |
|
Hypothetical
5% Return
(2.5% for
the period) |
Begining
Account Value
April 1, 2022 |
|
$1,000.00
|
|
$1,000.00
|
Ending
Account Value
September 30, 2022 |
|
$
803.00 |
|
$1,023.10
|
| Expenses
Paid During Period* |
|
$
1.81 |
|
$
2.03 |
| *
|
Expenses
are equal to the Fund's annualized expense ratio of 0.40% for Investment Class shares and 0.64% for Service Class shares (for the period April 1, 2022 - September 30, 2022), multiplied by the average account value over the period, multiplied by
183/365 (to reflect the one-half year period). |
| Service
Class |
|
Actual
Fund Return |
|
Hypothetical
5% Return
(2.5% for
the period) |
Begining
Account Value
April 1, 2022 |
|
$1,000.00
|
|
$1,000.00
|
Ending
Account Value
September 30, 2022 |
|
$
801.70 |
|
$1,021.90
|
| Expenses
Paid During Period* |
|
$
2.89 |
|
$
3.24 |
| *
|
Expenses
are equal to the Fund's annualized expense ratio of 0.40% for Investment Class shares and 0.64% for Service Class shares (for the period April 1, 2022 - September 30, 2022), multiplied by the average account value over the period, multiplied by
183/365 (to reflect the one-half year period). |
| State
Street Institutional U.S. Equity Fund |
5
|
State Street Institutional U.S.
Equity Fund
Schedule of Investments — September 30,
2022
| |
Number
of Shares |
Fair
Value |
| Common
Stock - 96.3% † |
| Aerospace
& Defense - 0.6% |
| Raytheon
Technologies Corp. |
13,983
|
$
1,144,648 |
| Apparel
Retail - 1.1% |
| Ross
Stores Inc. |
22,093
|
1,861,777
|
| Application
Software - 2.4% |
| Adobe
Inc. (a) |
2,540
|
699,008
|
| Intuit
Inc. |
982
|
380,348
|
| Salesforce
Inc. (a) |
20,520
|
2,951,597
|
| Splunk
Inc. (a) |
2,113
|
158,898
|
| |
|
4,189,851
|
| Auto
Parts & Equipment - 0.5% |
| Magna
International Inc. |
20,201
|
957,931
|
| Automobile
Manufacturers - 1.1% |
| Ford
Motor Co. |
81,597
|
913,887
|
| Tesla
Inc. (a) |
3,981
|
1,055,960
|
| |
|
1,969,847
|
| Automotive
Retail - 0.9% |
| O'Reilly
Automotive Inc. (a) |
2,285
|
1,607,155
|
| Biotechnology
- 1.8% |
| BioMarin
Pharmaceutical Inc. (a) |
9,432
|
799,550
|
| Seagen
Inc. (a) |
619
|
84,698
|
| Vertex
Pharmaceuticals Inc. (a) |
7,883
|
2,282,444
|
| |
|
3,166,692
|
| Building
Products - 0.8% |
| Allegion
PLC |
4,580
|
410,734
|
| Trane
Technologies PLC |
7,501
|
1,086,220
|
| |
|
1,496,954
|
| Cable
& Satellite - 0.6% |
| Charter
Communications Inc., Class A (a) |
1,116
|
338,539
|
| Comcast
Corp., Class A |
22,079
|
647,577
|
| |
|
986,116
|
| Communications
Equipment - 0.1% |
| Cisco
Systems Inc. |
6,023
|
240,920
|
| Construction
Materials - 0.4% |
| Martin
Marietta Materials Inc. |
1,929
|
621,312
|
| |
Number
of Shares |
Fair
Value |
| Data
Processing & Outsourced Services - 4.8% |
| Fidelity
National Information Services Inc. |
23,559
|
$
1,780,354 |
| Mastercard
Inc., Class A |
11,156
|
3,172,097
|
| PayPal
Holdings Inc. (a) |
9,474
|
815,427
|
| Visa
Inc., Class A |
15,633
|
2,777,202
|
| |
|
8,545,080
|
| Diversified
Banks - 0.8% |
| JPMorgan
Chase & Co. |
13,565
|
1,417,542
|
| Diversified
Support Services - 0.5% |
| Cintas
Corp. |
2,074
|
805,106
|
| Electric
Utilities - 2.1% |
| American
Electric Power Company Inc. |
7,537
|
651,574
|
| NextEra
Energy Inc. |
38,390
|
3,010,160
|
| |
|
3,661,734
|
| Electrical
Components & Equipment - 0.1% |
| Generac
Holdings Inc. (a) |
1,352
|
240,845
|
| Electronic
Components - 1.3% |
| Amphenol
Corp., Class A |
26,597
|
1,780,935
|
| Corning
Inc. |
19,799
|
574,567
|
| |
|
2,355,502
|
| Environmental
& Facilities Services - 0.6% |
| Waste
Management Inc. |
6,639
|
1,063,634
|
| Financial
Exchanges & Data - 2.7% |
| CME
Group Inc. |
6,401
|
1,133,809
|
| MSCI
Inc. |
1,926
|
812,368
|
| S&P
Global Inc. |
9,109
|
2,781,433
|
| |
|
4,727,610
|
| Footwear
- 0.1% |
| NIKE
Inc., Class B |
1,629
|
135,402
|
| Healthcare
Equipment - 3.8% |
| Becton
Dickinson & Co. |
2,743
|
611,223
|
| Boston
Scientific Corp. (a) |
60,948
|
2,360,516
|
| IDEXX
Laboratories Inc. (a) |
2,508
|
817,106
|
| Medtronic
PLC |
16,130
|
1,302,497
|
| Stryker
Corp. |
4,050
|
820,287
|
| Teleflex
Inc. |
3,634
|
732,106
|
| |
|
6,643,735
|
See Notes to Schedules of Investments and Notes to Financial
Statements.
| 6
|
State Street
Institutional U.S. Equity Fund |
State Street Institutional U.S.
Equity Fund
Schedule of Investments, continued —
September 30, 2022
| |
Number
of Shares |
Fair
Value |
| Healthcare
Services - 0.3% |
| Cigna
Corp. |
2,074
|
$
575,473 |
| Home
Improvement Retail - 1.4% |
| Lowe's
Companies Inc. |
10,469
|
1,966,183
|
| The
Home Depot Inc. |
2,058
|
567,884
|
| |
|
2,534,067
|
| Hotels,
Resorts & Cruise Lines - 0.4% |
| Marriott
International Inc., Class A |
4,935
|
691,591
|
| Household
Products - 1.3% |
| Colgate-Palmolive
Co. |
9,373
|
658,453
|
| The
Procter & Gamble Co. |
12,890
|
1,627,363
|
| |
|
2,285,816
|
| Hypermarkets
& Super Centers - 1.2% |
| Costco
Wholesale Corp. |
1,283
|
605,923
|
| Walmart
Inc. |
11,689
|
1,516,063
|
| |
|
2,121,986
|
| Industrial
Conglomerates - 1.4% |
| Honeywell
International Inc. |
15,007
|
2,505,719
|
| Industrial
Gases - 1.1% |
| Air
Products & Chemicals Inc. |
8,405
|
1,956,096
|
| Industrial
Machinery - 1.2% |
| Parker-Hannifin
Corp. |
9,055
|
2,194,117
|
| Insurance
Brokers - 0.3% |
| Marsh
& McLennan Companies Inc. |
3,610
|
538,937
|
| Integrated
Oil & Gas - 0.9% |
| Chevron
Corp. |
10,614
|
1,524,913
|
| Interactive
Home Entertainment - 0.3% |
| Activision
Blizzard Inc. |
7,487
|
556,584
|
| Interactive
Media & Services - 5.6% |
| Alphabet
Inc., Class C (a) |
10,440
|
1,003,806
|
| Alphabet
Inc., Class A (a) |
69,549
|
6,652,362
|
| Meta
Platforms Inc., Class A (a) |
16,946
|
2,299,233
|
| |
|
9,955,401
|
| Internet
& Direct Marketing Retail - 4.3% |
| Amazon.com
Inc. (a)(b) |
67,744
|
7,655,072
|
| |
Number
of Shares |
Fair
Value |
| Investment
Banking & Brokerage - 1.7% |
| The
Charles Schwab Corp. |
40,681
|
$
2,923,743 |
| IT
Consulting & Other Services - 0.4% |
| Accenture
PLC, Class A |
2,487
|
639,905
|
| Life
& Health Insurance - 0.1% |
| Lincoln
National Corp. |
4,703
|
206,509
|
| Life
Sciences Tools & Services - 1.2% |
| IQVIA
Holdings Inc. (a) |
11,580
|
2,097,601
|
| Managed
Healthcare - 2.8% |
| Humana
Inc. |
1,734
|
841,320
|
| UnitedHealth
Group Inc. |
8,253
|
4,168,095
|
| |
|
5,009,415
|
| Movies
& Entertainment - 0.5% |
| The
Walt Disney Co. (a) |
8,853
|
835,103
|
| Multi-Line
Insurance - 0.3% |
| American
International Group Inc. |
10,992
|
521,900
|
| Multi-Sector
Holdings - 1.3% |
| Berkshire
Hathaway Inc., Class B (a) |
8,542
|
2,280,885
|
| Multi-Utilities
- 0.9% |
| Sempra
Energy |
11,090
|
1,662,835
|
| Oil
& Gas Equipment & Services - 0.8% |
| Schlumberger
N.V. |
38,224
|
1,372,242
|
| Oil
& Gas Exploration & Production - 3.1% |
| ConocoPhillips
|
41,265
|
4,223,060
|
| Pioneer
Natural Resources Co. |
5,486
|
1,187,884
|
| |
|
5,410,944
|
| Packaged
Foods & Meats - 0.7% |
| Mondelez
International Inc., Class A |
21,158
|
1,160,093
|
| Personal
Products - 0.4% |
| The
Estee Lauder Companies Inc., Class A |
2,996
|
646,836
|
| Pharmaceuticals
- 5.6% |
| AstraZeneca
PLC ADR |
12,280
|
673,435
|
| Bristol-Myers
Squibb Co. |
17,470
|
1,241,942
|
See Notes to Schedules of Investments and Notes to Financial
Statements.
| State
Street Institutional U.S. Equity Fund |
7
|
State Street Institutional U.S.
Equity Fund
Schedule of Investments, continued —
September 30, 2022
| |
Number
of Shares |
Fair
Value |
| Elanco
Animal Health Inc. (a) |
14,845
|
$
184,227 |
| Johnson
& Johnson |
27,573
|
4,504,325
|
| Merck
& Company Inc. |
37,928
|
3,266,360
|
| |
|
9,870,289
|
| Property
& Casualty Insurance - 1.3% |
| Chubb
Ltd. |
12,178
|
2,214,935
|
| Railroads
- 0.7% |
| Union
Pacific Corp. |
5,938
|
1,156,841
|
| Regional
Banks - 2.5% |
| First
Republic Bank |
19,280
|
2,517,004
|
| SVB
Financial Group (a) |
5,893
|
1,978,752
|
| |
|
4,495,756
|
| Restaurants
- 0.7% |
| McDonald's
Corp. |
5,325
|
1,228,690
|
| Semiconductor
Equipment - 1.2% |
| Applied
Materials Inc. |
26,391
|
2,162,215
|
| Semiconductors
- 4.5% |
| Advanced
Micro Devices Inc. (a) |
39,600
|
2,509,056
|
| NVIDIA
Corp. |
10,698
|
1,298,630
|
| QUALCOMM
Inc. |
26,382
|
2,980,639
|
| Texas
Instruments Inc. |
7,285
|
1,127,572
|
| |
|
7,915,897
|
| Soft
Drinks - 1.2% |
| Monster
Beverage Corp. (a) |
6,567
|
571,066
|
| PepsiCo
Inc. |
9,811
|
1,601,744
|
| |
|
2,172,810
|
| Specialized
REITs - 1.5% |
| American
Tower Corp. |
11,913
|
2,557,721
|
| Specialty
Chemicals - 0.5% |
| DuPont
de Nemours Inc. |
9,088
|
458,035
|
| |
Number
of Shares |
Fair
Value |
| Ecolab
Inc. |
2,512
|
$
362,783 |
| |
|
820,818
|
| Systems
Software - 7.3% |
| Microsoft
Corp. |
46,854
|
10,912,296
|
| Oracle
Corp. |
10,161
|
620,532
|
| ServiceNow
Inc. (a) |
3,747
|
1,414,905
|
| |
|
12,947,733
|
| Technology
Hardware, Storage & Peripherals - 5.7% |
| Apple
Inc. (b) |
73,134
|
10,107,119
|
| Trading
Companies & Distributors - 1.4% |
| United
Rentals Inc. (a) |
8,918
|
2,408,930
|
| Trucking
- 0.0%* |
| Lyft
Inc., Class A (a) |
5,824
|
76,702
|
| Wireless
Telecommunication Services - 1.2% |
| T-Mobile
US Inc. (a) |
15,133
|
2,030,395
|
Total
Common Stock
(Cost $140,872,322) |
|
169,870,027
|
| Short-Term
Investments - 3.6% |
State
Street Institutional U.S. Government Money Market Fund - Class G Shares 2.98% (c)(d)
(Cost $6,354,619) |
6,354,619
|
6,354,619
|
Total
Investments
(Cost $147,226,941) |
|
176,224,646
|
| Other
Assets and Liabilities, net - 0.1% |
|
136,796
|
| NET
ASSETS - 100.0% |
|
$
176,361,442 |
Other Information:
| The
Fund had the following long futures contracts open at September 30, 2022: |
| Description
|
Expiration
Date |
Number
of
Contracts |
Notional
Amount |
Value
|
Unrealized
Appreciation
(Depreciation) |
| S&P
500 E-mini Index Futures |
December
2022 |
23
|
$
4,683,473 |
$
4,141,725 |
$
(541,748) |
See Notes to Schedules of Investments and Notes to Financial
Statements.
| 8
|
State Street
Institutional U.S. Equity Fund |
State Street Institutional U.S.
Equity Fund
Schedule of Investments, continued —
September 30, 2022
During the year ended September 30, 2022, the average notional
value related to long futures contracts was $7,014,328.
Notes to Schedule of Investments
The views expressed in this document reflect our judgment
as of the publication date and are subject to change at any time without notice. The securities cited may not be representative of the Fund’s future investments and should not be construed as a recommendation to purchase or sell a particular
security. See the Fund’s summary prospectus and statutory prospectus for complete descriptions of investment objectives, policies, risks and permissible investments.
| (a)
|
Non-income
producing security. |
| (b)
|
At
September 30, 2022, all or a portion of this security was pledged to cover collateral requirements for futures . |
| (c)
|
Sponsored
by SSGA Funds Management, Inc., the Fund’s investment adviser and administrator, and an affiliate of State Street Bank & Trust Co., the Fund’s sub-administrator, custodian and accounting agent. |
| (d)
|
Coupon
amount represents effective yield. |
| †
|
Percentages
are based on net assets as of September 30, 2022. |
| *
|
Less
than 0.05%. |
| Abbreviations:
|
| ADR -
American Depositary Receipt |
| REIT
- Real Estate Investment Trust |
The following table presents the Fund’s
investments measured at fair value on a recurring basis at September 30, 2022:
| Investments
|
Level
1 |
|
Level
2 |
|
Level
3 |
|
Total
|
| Investments
in Securities |
|
|
|
|
|
|
|
| Common
Stock |
$
169,870,027 |
|
$
— |
|
$
— |
|
$
169,870,027 |
| Short-Term
Investments |
6,354,619
|
|
—
|
|
—
|
|
6,354,619
|
| Total
Investments in Securities |
$
176,224,646 |
|
$
— |
|
$
— |
|
$
176,224,646 |
| Other
Financial Instruments |
|
|
|
|
|
|
|
| Long
Futures Contracts - Unrealized Depreciation |
$
(541,748) |
|
$
— |
|
$
— |
|
$
(541,748) |
| Total
Other Financial Instruments |
$
(541,748) |
|
$
— |
|
$
— |
|
$
(541,748) |
| |
Number
of Shares
Held at
9/30/21 |
Value
at
9/30/21 |
Cost
of
Purchases |
Proceeds
from
Shares
Sold |
Realized
Gain
(Loss) |
Change
in
Unrealized
Appreciation
(Depreciation) |
Number
of
Shares
Held at
9/30/22 |
Value
at
9/30/22 |
Dividend
Income |
| State
Street Institutional U.S. Government Money Market Fund - Class G Shares |
9,885,922
|
$9,885,922
|
$47,178,974
|
$50,710,277
|
$—
|
$—
|
6,354,619
|
$6,354,619
|
$61,826
|
See Notes to Schedules of Investments and Notes to
Financial Statements.
| State
Street Institutional U.S. Equity Fund |
9
|
State Street Institutional
Premier Growth Equity Fund
Management Discussion of Fund
Performance — September 30, 2022 (Unaudited)
The State Street Institutional Premier Growth Equity Fund (the
“Fund”) seeks to provide long-term growth of capital and future income. The Fund’s benchmarks are S&P 500 Index and the Russell 1000 Growth Index (the “Indices”).
For the 12-month period ended September 30, 2022 (the
“Reporting Period”), the total return for the Fund’s Investment Class was -26.33% and for the Fund’s Service Class was -26.51%, and the S&P 500 Index was -15.47% and the Russell 1000 Growth Index was -22.59%. The Fund and
Index returns reflect the reinvestment of dividends and other income. The Fund’s performance reflects the expenses of managing the Fund, including brokerage and advisory expenses. The Index is unmanaged and Index returns do not reflect fees
and expenses of any kind, which would have a negative impact on returns.
Primary drivers of Fund performance during the Reporting
Period relative to the Index included underperformance in consumer discretionary, the negative impact of sector positioning and outperformance in healthcare.
In consumer discretionary, the Fund was hurt by
underperformance, most notably in ecommerce exposed companies such as Alibaba, Chewy, and Amazon, which have been weak in this market environment. Also lagging was low-cost retailer Ross Stores, which delivered disappointing results earlier this
year as inflation impacted its operations as well as its low-end demographic customer. The company has since pivoted to a more value-oriented strategy, and the stock has done significantly better in recent months. Finally, the Fund was impacted by
an underweight to Tesla, which outperformed during the Reporting Period. The Fund had not held Tesla on concerns about valuation and the company’s ability to grow beyond the auto industry, which is highly competitive, but initiated a position
earlier this year as the stock weakened. The shares quickly rebounded, so we remained underweight for the remainder of the Reporting Period.
The Fund’s sector positioning relative to the Russell
1000 Growth Index also dragged on relative returns, with an overweight in communication services, the worst performing sector in the Index, and an underweight in consumer staples, which has been more defensive. The top sector return for the
Reporting Period was in energy, as high oil prices driven by the economic reopening as well as the Russian invasion of Ukraine drove equities in the sector higher. While energy has a small weight in the Russell 1000 Growth Index, the sector’s
very strong performance hurt relative returns for the Fund, which has no exposure to the sector. We’ve historically been underweight in these sectors as we generally find relatively few compelling opportunities that offer quality and
double-digit sustainable earnings growth at a reasonable valuation.
The Fund saw strength in healthcare across a range of
segments. Outperformers included biotechnology companies like Vertex Pharmaceuticals, which has had strong results in its cystic fibrosis drug and has a long runway of pipeline visibility in our view. Outside of biotechnology, the Fund also
outperformed in healthcare services, for example with UnitedHealth Group, whose strong market position in managed care has led to resilient results, and in healthcare equipment with Boston Scientific, which has also had strong results in a volatile
macro environment.
The Fund used futures in order
to efficiently manage cash flows during the Reporting Period. The Fund’s use of futures detracted slightly from Fund performance relative to the Index.
On an individual security level, the top positive
contributors to the Fund’s performance on an absolute basis during the Reporting Period were UnitedHealth Group, Vertex Pharmaceuticals and PepsiCo. The top negative contributors to the Fund’s performance on an absolute basis during the
Reporting Period were Amazon.com, Meta Platforms and PayPal.
The views expressed above reflect those of the Fund’s
portfolio manager only through the Reporting Period, and do not necessarily represent the views of the Adviser as a whole. Any such views are subject to change at any time based upon market or other conditions and the Adviser disclaims any
responsibility to update such views. These views may not be relied on as investment advice and, because investment decisions for a fund are based on numerous factors, may not be relied on as an indication of trading intent on behalf of any
fund.
| 10
|
State Street
Institutional Premier Growth Equity Fund |
State Street Institutional
Premier Growth Equity Fund
Performance Summary —
September 30, 2022 (Unaudited)
Investment Profile
A mutual fund designed for investors who seek long-term
growth of capital and future income. The Fund seeks to achieve its investment objectives by investing at least 80% of its net assets under normal circumstances in equity securities, such as common and preferred stocks. The Fund invests primarily in
a limited number of large and medium-sized companies (meaning companies with market capitalizations of $2 billion or more) that the portfolio manager believes have above-average growth histories and/or growth potential.
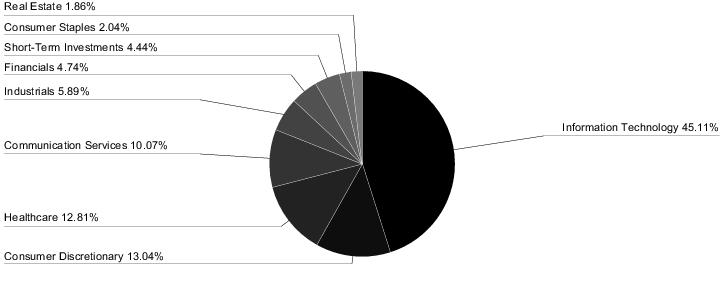
| Sector
Allocation |
| Portfolio
composition as a % of Fair Value of $25,744 (in thousands) as of September 30, 2022 (a)(b) |
| Top
Ten Largest Holdings |
| as
of September 30, 2022 (as a % of Fair Value) (a)(b) |
| Microsoft
Corp. |
11.62%
|
| Apple
Inc. |
10.81%
|
| Amazon.com
Inc. |
7.69%
|
| Alphabet
Inc., Class C |
5.09%
|
| UnitedHealth
Group Inc. |
3.78%
|
| Mastercard
Inc., Class A |
3.30%
|
| Visa
Inc., Class A |
3.30%
|
| QUALCOMM
Inc. |
2.84%
|
| Alphabet
Inc., Class A |
2.32%
|
| Salesforce
Inc. |
2.13%
|
|
| (a)
|
Fair
Value basis is inclusive of a short-term investment in the State Street Institutional U.S. Government Money Market Fund - Class G Shares. |
| (b)
|
The
securities information regarding holdings, allocations and other characteristics is presented to illustrate examples of securities that the Fund has bought and the diversity of areas in which the Fund may invest as of a particular date. It may not
be representative of the Fund’s current or future investments and should not be construed as a recommendation to purchase or sell a particular security. |
| State
Street Institutional Premier Growth Equity Fund |
11
|
State Street Institutional
Premier Growth Equity Fund
Performance Summary, continued
— September 30, 2022 (Unaudited)
| Average
Annual Total Return for the years ended September 30, 2022 |
| Investment
Class Shares (Inception date: 10/29/99) |
| |
One
Year |
|
Five
Year |
|
Ten
Year |
|
Ending
Value
of a $10,000
Investment |
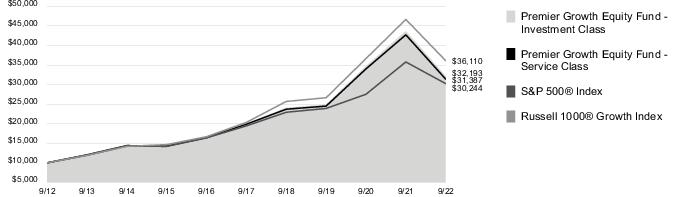
| State
Street Institutional Premier Growth Equity Fund |
(26.33)%
|
|
9.85%
|
|
12.40%
|
|
$32,193
|
| S&P
500® Index |
(15.47)%
|
|
9.24%
|
|
11.70%
|
|
$30,244
|
| Russell
1000® Growth Index |
(22.59)%
|
|
12.17%
|
|
13.70%
|
|
$36,110
|
| Service
Class Shares (Inception date: 1/3/01) |
| |
One
Year |
|
Five
Year |
|
Ten
Year |
|
Ending
Value
of a $10,000
Investment |
| State
Street Institutional Premier Growth Equity Fund |
(26.51)%
|
|
9.58%
|
|
12.12%
|
|
$31,387
|
| S&P
500® Index |
(15.47)%
|
|
9.24%
|
|
11.70%
|
|
$30,244
|
| Russell
1000® Growth Index |
(22.59)%
|
|
12.17%
|
|
13.70%
|
|
$36,110
|
Change in
Value of a $10,000 Investment
Yearly periods
ended September 30
| 12
|
State Street
Institutional Premier Growth Equity Fund |
State Street Institutional
Premier Growth Equity Fund
Understanding Your Fund’s
Expenses — September 30, 2022 (Unaudited)
As a shareholder of the Fund, you incur ongoing costs. Ongoing costs
include portfolio management fees, distribution and service fees (for Service Class shares) and trustees’ fees. The following example is intended to help you understand your ongoing costs (in dollars) of investing in the Fund and to compare
these costs with the ongoing costs of investing in other mutual funds.
To illustrate these ongoing costs, we have provided an
example and calculated the expenses paid by investors in each share class of the Fund during the period. The information in the following table is based on an investment of $1,000, which is invested at the beginning of the period and held for
the entire six-month period ended September 30, 2022.
Actual Expenses
The first section of the table provides information about
actual account values and actual expenses. You may use the information in this section, together with the amount you invested, to estimate the expenses that you paid over the period. To do so, simply divide your account value by $1,000 (for example,
an $8,600 account value divided by $1,000 = 8.6), then multiply the result by the number given under the heading “Expenses paid during the period” to estimate the expenses you paid on your account during the period.
Hypothetical Example for Comparison Purposes
The second section of the table provides information about
hypothetical account values and hypothetical expenses based on the Fund’s actual expense ratio and an assumed rate of return of 5% per year before expenses, which is not the Fund’s actual return. The hypothetical account values and
expenses may not be used to estimate the actual ending account balance or expenses you paid for the period. You may use this information to compare the ongoing costs of investing in the Fund and other funds. To do so, compare this 5% hypothetical
example with the 5% hypothetical examples that appear in the shareholders reports of other funds.
Please note that the expenses shown in the table are meant
to highlight and help you compare ongoing costs only and do not reflect transaction costs, such as sales charges or redemption fees, if any. Therefore, the second section of the table is useful in comparing ongoing costs only, and will not help you
determine the relative total costs of owning different funds.
| Investment
Class |
|
Actual
Fund Return |
|
Hypothetical
5% Return
(2.5% for
the period) |
Begining
Account Value
April 1, 2022 |
|
$1,000.00
|
|
$1,000.00
|
Ending
Account Value
September 30, 2022 |
|
$
745.20 |
|
$1,021.90
|
| Expenses
Paid During Period* |
|
$
2.80 |
|
$
3.24 |
| *
|
Expenses
are equal to the Fund's annualized expense ratio of 0.64% for Investment Class shares and 0.76% for Service Class shares (for the period April 1, 2022 - September 30, 2022), multiplied by the average account value over the period, multiplied by
183/365 (to reflect the one-half year period). |
| Service
Class |
|
Actual
Fund Return |
|
Hypothetical
5% Return
(2.5% for
the period) |
Begining
Account Value
April 1, 2022 |
|
$1,000.00
|
|
$1,000.00
|
Ending
Account Value
September 30, 2022 |
|
$
744.50 |
|
$1,021.30
|
| Expenses
Paid During Period* |
|
$
3.32 |
|
$
3.85 |
| *
|
Expenses
are equal to the Fund's annualized expense ratio of 0.64% for Investment Class shares and 0.76% for Service Class shares (for the period April 1, 2022 - September 30, 2022), multiplied by the average account value over the period, multiplied by
183/365 (to reflect the one-half year period). |
| State
Street Institutional Premier Growth Equity Fund |
13
|
State Street Institutional
Premier Growth Equity Fund
Schedule of Investments —
September 30, 2022
| |
Number
of Shares |
Fair
Value |
| Common
Stock - 95.5% † |
| Apparel
Retail - 1.7% |
| Ross
Stores Inc. |
5,049
|
$
425,479 |
| Application
Software - 3.5% |
| Adobe
Inc. (a) |
1,237
|
340,423
|
| Salesforce
Inc. (a) |
3,805
|
547,311
|
| |
|
887,734
|
| Automobile
Manufacturers - 1.2% |
| Tesla
Inc. (a) |
1,160
|
307,690
|
| Biotechnology
- 3.1% |
| BioMarin
Pharmaceutical Inc. (a) |
4,497
|
381,211
|
| Vertex
Pharmaceuticals Inc. (a) |
1,440
|
416,937
|
| |
|
798,148
|
| Cable
& Satellite - 0.9% |
| Charter
Communications Inc., Class A (a) |
793
|
240,557
|
| Data
Processing & Outsourced Services - 9.1% |
| Fidelity
National Information Services Inc. |
3,779
|
285,579
|
| Mastercard
Inc., Class A |
2,987
|
849,324
|
| PayPal
Holdings Inc. (a) |
4,249
|
365,711
|
| Visa
Inc., Class A |
4,779
|
848,989
|
| |
|
2,349,603
|
| Financial
Exchanges & Data - 1.6% |
| S&P
Global Inc. |
1,320
|
403,062
|
| Healthcare
Equipment - 2.8% |
| Boston
Scientific Corp. (a) |
12,239
|
474,017
|
| IDEXX
Laboratories Inc. (a) |
763
|
248,585
|
| |
|
722,602
|
| Home
Improvement Retail - 1.8% |
| Lowe's
Companies Inc. |
2,421
|
454,688
|
| Industrial
Conglomerates - 1.4% |
| Honeywell
International Inc. |
2,199
|
367,167
|
| Industrial
Machinery - 1.8% |
| Parker-Hannifin
Corp. |
1,944
|
471,051
|
| Interactive
Media & Services - 9.1% |
| Alphabet
Inc., Class C (a) |
13,635
|
1,311,005
|
| |
Number
of Shares |
Fair
Value |
| Alphabet
Inc., Class A (a) |
6,239
|
$
596,760 |
| Meta
Platforms Inc., Class A (a) |
3,282
|
445,302
|
| |
|
2,353,067
|
| Internet
& Direct Marketing Retail - 8.4% |
| Amazon.com
Inc. (a) |
17,520
|
1,979,760
|
| Chewy
Inc., Class A (a) |
6,141
|
188,651
|
| |
|
2,168,411
|
| Investment
Banking & Brokerage - 1.9% |
| The
Charles Schwab Corp. |
6,704
|
481,816
|
| Life
Sciences Tools & Services - 1.9% |
| IQVIA
Holdings Inc. (a) |
2,714
|
491,614
|
| Managed
Healthcare - 3.8% |
| UnitedHealth
Group Inc. |
1,925
|
972,202
|
| Pharmaceuticals
- 1.2% |
| AstraZeneca
PLC ADR |
5,720
|
313,685
|
| Regional
Banks - 1.3% |
| First
Republic Bank |
2,567
|
335,122
|
| Semiconductor
Equipment - 1.8% |
| Applied
Materials Inc. |
5,684
|
465,690
|
| Semiconductors
- 6.3% |
| Advanced
Micro Devices Inc. (a) |
7,326
|
464,175
|
| NVIDIA
Corp. |
3,593
|
436,154
|
| QUALCOMM
Inc. |
6,476
|
731,659
|
| |
|
1,631,988
|
| Soft
Drinks - 2.0% |
| Monster
Beverage Corp. (a) |
6,033
|
524,630
|
| Specialized
REITs - 1.9% |
| American
Tower Corp. |
2,230
|
478,781
|
| Systems
Software - 13.6% |
| Microsoft
Corp. |
12,842
|
2,990,902
|
| ServiceNow
Inc. (a) |
1,336
|
504,487
|
| |
|
3,495,389
|
| Technology
Hardware, Storage & Peripherals - 10.8% |
| Apple
Inc. |
20,141
|
2,783,486
|
See Notes to Schedules of Investments and Notes to Financial
Statements.
| 14
|
State Street
Institutional Premier Growth Equity Fund |
State Street Institutional
Premier Growth Equity Fund
Schedule of Investments,
continued — September 30, 2022
| |
Number
of Shares |
Fair
Value |
| Trading
Companies & Distributors - 2.0% |
| United
Rentals Inc. (a) |
1,949
|
$
526,464 |
| Trucking
- 0.6% |
| Lyft
Inc., Class A (a) |
11,459
|
150,915
|
Total
Common Stock
(Cost $22,848,116) |
|
24,601,041
|
| Short-Term
Investments - 4.5% |
State
Street Institutional U.S. Government Money Market Fund - Class G Shares 2.98% (b)(c)(d)
(Cost $1,142,486) |
1,142,486
|
1,142,486
|
Total
Investments
(Cost $23,990,602) |
|
25,743,527
|
| Other
Assets and Liabilities, net - 0.0%* |
|
11,261
|
| NET
ASSETS - 100.0% |
|
$
25,754,788 |
Other Information:
| The
Fund had the following long futures contracts open at September 30, 2022: |
| Description
|
Expiration
Date |
Number
of
Contracts |
Notional
Amount |
Value
|
Unrealized
Appreciation
(Depreciation) |
| S&P
500 E-mini Index Futures |
December
2022 |
3
|
$
546,719 |
$
540,225 |
$
(6,494) |
During the year ended September 30, 2022, the average notional
value related to long and short futures contracts were $820,064 and $30,435, respectively.
Notes to Schedule of Investments
The views expressed in this document reflect our judgment
as of the publication date and are subject to change at any time without notice. The securities cited may not be representative of the Fund’s future investments and should not be construed as a recommendation to purchase or sell a particular
security. See the Fund’s summary prospectus and statutory prospectus for complete descriptions of investment objectives, policies, risks and permissible investments.
| (a)
|
Non-income
producing security. |
| (b)
|
Sponsored
by SSGA Funds Management, Inc., the Fund’s investment adviser and administrator, and an affiliate of State Street Bank & Trust Co., the Fund’s sub-administrator, custodian and accounting agent. |
| (c)
|
At
September 30, 2022, all or a portion of this security was pledged to cover collateral requirements for futures . |
| (d)
|
Coupon
amount represents effective yield. |
| †
|
Percentages
are based on net assets as of September 30, 2022. |
| *
|
Less
than 0.05%. |
| Abbreviations:
|
| ADR -
American Depositary Receipt |
| REIT
- Real Estate Investment Trust |
See Notes to Schedules of Investments and Notes to Financial
Statements.
| State
Street Institutional Premier Growth Equity Fund |
15
|
State Street Institutional
Premier Growth Equity Fund
Schedule of Investments,
continued — September 30, 2022
The following table presents the Fund’s investments
measured at fair value on a recurring basis at September 30, 2022:
| Investments
|
Level
1 |
|
Level
2 |
|
Level
3 |
|
Total
|
| Investments
in Securities |
|
|
|
|
|
|
|
| Common
Stock |
$
24,601,041 |
|
$
— |
|
$
— |
|
$
24,601,041 |
| Short-Term
Investments |
1,142,486
|
|
—
|
|
—
|
|
1,142,486
|
| Total
Investments in Securities |
$
25,743,527 |
|
$
— |
|
$
— |
|
$
25,743,527 |
| Other
Financial Instruments |
|
|
|
|
|
|
|
| Long
Futures Contracts - Unrealized Depreciation |
$
(6,494) |
|
$
— |
|
$
— |
|
$
(6,494) |
| Total
Other Financial Instruments |
$
(6,494) |
|
$
— |
|
$
— |
|
$
(6,494) |
| |
Number
of Shares
Held at
9/30/21 |
Value
at
9/30/21 |
|
Cost
of
Purchases |
|
Proceeds
from
Shares
Sold |
|
Realized
Gain
(Loss) |
|
Change
in
Unrealized
Appreciation
(Depreciation) |
Number
of
Shares
Held at
9/30/22 |
Value
at
9/30/22 |
|
Dividend
Income |
| State
Street Institutional U.S. Government Money Market Fund - Class G Shares |
1,877,600
|
$1,877,600
|
|
$15,589,973
|
|
$16,325,087
|
|
$
— |
|
$
— |
1,142,486
|
$1,142,486
|
|
$7,808
|
| The
Consumer Discretionary Select Sector SPDR Fund |
12,585
|
2,258,378
|
|
—
|
|
2,253,767
|
|
250,871
|
|
(255,482)
|
—
|
—
|
|
—
|
| The
Technology Select Sector SPDR Fund |
5,819
|
868,893
|
|
—
|
|
858,319
|
|
110,117
|
|
(120,691)
|
—
|
—
|
|
—
|
| TOTAL
|
|
$5,004,871
|
|
$15,589,973
|
|
$19,437,173
|
|
$360,988
|
|
$(376,173)
|
|
$1,142,486
|
|
$7,808
|
See Notes to Schedules of Investments and Notes to Financial
Statements.
| 16
|
State Street
Institutional Premier Growth Equity Fund |
State Street Institutional
Small-Cap Equity Fund
Management Discussion of Fund
Performance — September 30, 2022 (Unaudited)
The State Street Institutional Small-Cap Equity Fund (the
“Fund”) seeks to provide long-term growth of capital. The Fund’s benchmark is the Russell 2000 Index (the “Index”).
For the 12-month period ended September 30, 2022 (the
“Reporting Period”), the total return for the Fund’s Investment Class was -18.14% and for the Fund’s Service Class was -18.28%, and the Index was -23.50%. The Fund and Index returns reflect the reinvestment of dividends
and other income. The Fund’s performance reflects the expenses of managing the Fund, including brokerage and advisory expenses. The Index is unmanaged and Index returns do not reflect fees and expenses of any kind, which would have a negative
impact on returns.
SouthernSun, Kennedy and Palisade
were the primary drivers of Fund performance during the Reporting Period relative to the Index. SouthernSun had an outstanding year, followed by Kennedy and Palisade, who, each had very good years contributing to performance relative to the Index.
Champlain also contributed marginally to performance relative to the Index. Riverbridge, prior to July 15, 2022, was the dedicated growth manager and detracted from performance relative to the Index, largely as a result of selecting technology
names. The overall Fund's lower beta/higher quality profile was a contributor for the year relative to the Index.
The Fund used E-mini Russell 2000® Index futures in order to equitize cash in the liquidity sleeve of the Fund to manage daily flows and to maintain market exposure on the cash during the Reporting Period. The
Fund’s use of E-mini Russell 2000 Index futures are meant to match the Index and not to speculate in either direction.
On an individual security level, the top positive
contributors to the Fund’s performance on an absolute basis during the Reporting Period were MGP Ingredients Inc., Murphy USA Inc. and Dycom Industries Inc. The top negative contributors to the Fund’s performance on an absolute basis
during the Reporting Period were Altra Industrial Motion Corp, Q2 Holdings, Inc. and Thor Industries, Inc.
The views expressed above reflect those of the Fund’s
portfolio manager only through the Reporting Period, and do not necessarily represent the views of the Adviser as a whole. Any such views are subject to change at any time based upon market or other conditions and the Adviser disclaims any
responsibility to update such views. These views may not be relied on as investment advice and, because investment decisions for a fund are based on numerous factors, may not be relied on as an indication of trading intent on behalf of any
fund.
| State
Street Institutional Small-Cap Equity Fund |
17
|
State Street Institutional
Small-Cap Equity Fund
Performance Summary —
September 30, 2022 (Unaudited)
Investment Profile
A mutual fund designed for investors who seek long-term
growth of capital. The Fund seeks to achieve its investment objective by investing at least 80% of its net assets under normal circumstances in equity securities of small-cap companies, such as common and preferred stocks. The Fund uses a multi
sub-adviser investment strategy that combines growth, value and core investment management styles, which allows the Fund the potential to benefit from both value and growth cycles in the marketplace.
| Sector
Allocation |
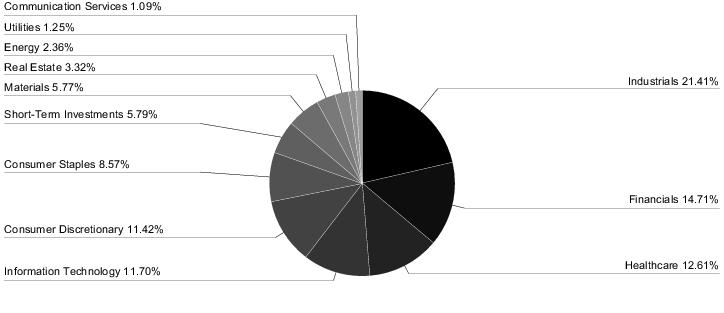
| Portfolio
composition as a % of Fair Value of $948,558 (in thousands) as of September 30, 2022 (a)(b) |
| Top
Ten Largest Holdings |
| as
of September 30, 2022 (as a % of Fair Value) (a)(b) |
| MGP
Ingredients Inc. |
1.62%
|
| Darling
Ingredients Inc. |
1.44%
|
| Ingevity
Corp. |
1.41%
|
| Dycom
Industries Inc. |
1.30%
|
| The
Timken Co. |
1.18%
|
| Stepan
Co. |
1.14%
|
| Murphy
USA Inc. |
1.10%
|
| Ritchie
Bros Auctioneers Inc. |
1.09%
|
| MSA
Safety Inc. |
1.02%
|
| Altra
Industrial Motion Corp. |
1.01%
|
|
| (a)
|
Fair
Value basis is inclusive of a short-term investment in the State Street Institutional U.S. Government Money Market Fund - Class G Shares. |
| (b)
|
The
securities information regarding holdings, allocations and other characteristics is presented to illustrate examples of securities that the Fund has bought and the diversity of areas in which the Fund may invest as of a particular date. It may not
be representative of the Fund’s current or future investments and should not be construed as a recommendation to purchase or sell a particular security. |
| 18
|
State Street
Institutional Small-Cap Equity Fund |
State Street Institutional
Small-Cap Equity Fund
Performance Summary, continued
— September 30, 2022 (Unaudited)
| Average
Annual Total Return for the years ended September 30, 2022 |
| Investment
Class Shares (Inception date: 8/3/98) |
| |
One
Year |
|
Five
Year |
|
Ten
Year |
|
Ending
Value
of a $10,000
Investment |
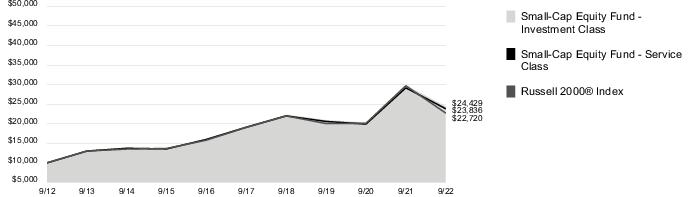
| State
Street Institutional Small-Cap Equity Fund |
(18.14)%
|
|
4.79%
|
|
9.34%
|
|
$24,429
|
| Russell
2000® Index |
(23.50)%
|
|
3.56%
|
|
8.56%
|
|
$22,720
|
| Service
Class Shares (Inception date: 9/30/05) |
| |
One
Year |
|
Five
Year |
|
Ten
Year |
|
Ending
Value
of a $10,000
Investment |
| State
Street Institutional Small-Cap Equity Fund |
(18.28)%
|
|
4.53%
|
|
9.07%
|
|
$23,836
|
| Russell
2000® Index |
(23.50)%
|
|
3.56%
|
|
8.56%
|
|
$22,720
|
Change in
Value of a $10,000 Investment
Yearly periods
ended September 30
| State
Street Institutional Small-Cap Equity Fund |
19
|
State Street Institutional
Small-Cap Equity Fund
Understanding Your Fund’s
Expenses — September 30, 2022 (Unaudited)
As a shareholder of the Fund, you incur ongoing costs. Ongoing costs
include portfolio management fees, distribution and service fees (for Service Class shares) and trustees’ fees. The following example is intended to help you understand your ongoing costs (in dollars) of investing in the Fund and to compare
these costs with the ongoing costs of investing in other mutual funds.
To illustrate these ongoing costs, we have provided an
example and calculated the expenses paid by investors in each share class of the Fund during the period. The information in the following table is based on an investment of $1,000, which is invested at the beginning of the period and held for
the entire six-month period ended September 30, 2022.
Actual Expenses
The first section of the table provides information about
actual account values and actual expenses. You may use the information in this section, together with the amount you invested, to estimate the expenses that you paid over the period. To do so, simply divide your account value by $1,000 (for example,
an $8,600 account value divided by $1,000 = 8.6), then multiply the result by the number given under the heading “Expenses paid during the period” to estimate the expenses you paid on your account during the period.
Hypothetical Example for Comparison Purposes
The second section of the table provides information about
hypothetical account values and hypothetical expenses based on the Fund’s actual expense ratio and an assumed rate of return of 5% per year before expenses, which is not the Fund’s actual return. The hypothetical account values and
expenses may not be used to estimate the actual ending account balance or expenses you paid for the period. You may use this information to compare the ongoing costs of investing in the Fund and other funds. To do so, compare this 5% hypothetical
example with the 5% hypothetical examples that appear in the shareholders reports of other funds.
Please note that the expenses shown in the table are meant
to highlight and help you compare ongoing costs only and do not reflect transaction costs, such as sales charges or redemption fees, if any. Therefore, the second section of the table is useful in comparing ongoing costs only, and will not help you
determine the relative total costs of owning different funds.
| Investment
Class |
|
Actual
Fund Return |
|
Hypothetical
5% Return
(2.5% for
the period) |
Begining
Account Value
April 1, 2022 |
|
$1,000.00
|
|
$1,000.00
|
Ending
Account Value
September 30, 2022 |
|
$
841.80 |
|
$1,021.30
|
| Expenses
Paid During Period* |
|
$
3.46 |
|
$
3.80 |
| *
|
Expenses
are equal to the Fund's annualized expense ratio of 0.75% for Investment Class shares and 1.00% for Service Class shares (for the period April 1, 2022 - September 30, 2022), multiplied by the average account value over the period, multiplied by
183/365 (to reflect the one-half year period). |
| Service
Class |
|
Actual
Fund Return |
|
Hypothetical
5% Return
(2.5% for
the period) |
Begining
Account Value
April 1, 2022 |
|
$1,000.00
|
|
$1,000.00
|
Ending
Account Value
September 30, 2022 |
|
$
841.50 |
|
$1,020.10
|
| Expenses
Paid During Period* |
|
$
4.62 |
|
$
5.06 |
| *
|
Expenses
are equal to the Fund's annualized expense ratio of 0.75% for Investment Class shares and 1.00% for Service Class shares (for the period April 1, 2022 - September 30, 2022), multiplied by the average account value over the period, multiplied by
183/365 (to reflect the one-half year period). |
| 20
|
State Street
Institutional Small-Cap Equity Fund |
State Street Institutional
Small-Cap Equity Fund
Schedule of Investments —
September 30, 2022
| |
Number
of Shares |
Fair
Value |
| Common
Stock - 94.3% † |
| Aerospace
& Defense - 0.2% |
| Woodward
Inc. |
24,941
|
$
2,001,765 |
| Agricultural
& Farm Machinery - 0.9% |
| AGCO
Corp. (a) |
83,934
|
8,071,933
|
| Agricultural
Products - 1.4% |
| Darling
Ingredients Inc. (b) |
206,031
|
13,628,951
|
| Airlines
- 0.0%* |
| Allegiant
Travel Co. (a)(b) |
3,321
|
242,367
|
| Aluminum
- 0.1% |
| Alcoa
Corp. (a) |
22,485
|
756,845
|
| Apparel
Retail - 0.4% |
| American
Eagle Outfitters Inc. |
116,868
|
1,137,125
|
| The
Buckle Inc. |
86,383
|
2,734,886
|
| |
|
3,872,011
|
| Application
Software - 5.0% |
| ACI
Worldwide Inc. (a)(b) |
161,689
|
3,379,300
|
| Altair
Engineering Inc., Class A (a)(b) |
62,380
|
2,758,444
|
| Asana
Inc., Class A (b) |
106,125
|
2,359,159
|
| Blackbaud
Inc. (b) |
129,064
|
5,686,560
|
| Blackline
Inc. (b) |
124,673
|
7,467,913
|
| Envestnet
Inc. (b) |
45,500
|
2,020,200
|
| Freshworks
Inc., Class A Revenue (b) |
327,500
|
4,247,675
|
| New
Relic Inc. (b) |
112,500
|
6,455,250
|
| Q2
Holdings Inc. (b) |
135,000
|
4,347,000
|
| Vertex
Inc., Class A (b) |
137,771
|
1,883,329
|
| Workiva
Inc. (b) |
82,000
|
6,379,600
|
| |
|
46,984,430
|
| Auto
Parts & Equipment - 1.2% |
| Dana
Inc. |
157,512
|
1,800,362
|
| Dorman
Products Inc. (b) |
105,639
|
8,675,075
|
| LCI
Industries |
7,084
|
718,743
|
| Modine
Manufacturing Co. (b) |
29,776
|
385,301
|
| |
|
11,579,481
|
| Automobile
Manufacturers - 0.7% |
| Thor
Industries Inc. |
99,101
|
6,935,088
|
| Automotive
Retail - 1.8% |
| America's
Car-Mart Inc. (b) |
16,003
|
976,503
|
| Group
1 Automotive Inc. |
28,508
|
4,072,938
|
| |
Number
of Shares |
Fair
Value |
| Monro
Inc. |
40,888
|
$
1,776,992 |
| Murphy
USA Inc. |
37,911
|
10,422,113
|
| |
|
17,248,546
|
| Biotechnology
- 1.0% |
| Avid
Bioservices Inc. (b) |
134,850
|
2,578,332
|
| Emergent
BioSolutions Inc. (b) |
69,956
|
1,468,377
|
| Halozyme
Therapeutics Inc. (b) |
43,450
|
1,718,013
|
| Heron
Therapeutics Inc. (b) |
483,737
|
2,041,370
|
| Veracyte
Inc. (b) |
104,000
|
1,726,400
|
| |
|
9,532,492
|
| Brewers
- 0.8% |
| The
Boston Beer Company Inc., Class A (b) |
24,177
|
7,824,886
|
| Building
Products - 1.4% |
| Armstrong
World Industries Inc. |
24,446
|
1,936,857
|
| CSW
Industrials Inc. |
35,000
|
4,193,000
|
| Gibraltar
Industries Inc. (b) |
92,722
|
3,795,111
|
| Hayward
Holdings Inc. (b) |
108,000
|
957,960
|
| Insteel
Industries Inc. |
31,933
|
847,182
|
| UFP
Industries Inc. |
19,717
|
1,422,779
|
| |
|
13,152,889
|
| Commodity
Chemicals - 0.2% |
| Hawkins
Inc. |
43,926
|
1,712,675
|
| Communications
Equipment - 0.1% |
| Cambium
Networks Corp. (b) |
51,439
|
870,348
|
| Lumentum
Holdings Inc. (b) |
5,177
|
354,987
|
| |
|
1,225,335
|
| Computer
& Electronics Retail - 0.1% |
| Rent-A-Center
Inc. |
29,934
|
524,144
|
| Construction
& Engineering - 1.7% |
| Dycom
Industries Inc. (b) |
129,389
|
12,360,531
|
| IES
Holdings Inc. (b) |
28,279
|
781,066
|
| Valmont
Industries Inc. |
9,878
|
2,653,429
|
| |
|
15,795,026
|
| Construction
Machinery & Heavy Trucks - 0.6% |
| Alamo
Group Inc. (a) |
19,434
|
2,376,195
|
| Astec
Industries Inc. |
35,788
|
1,116,228
|
| Wabash
National Corp. |
117,787
|
1,832,766
|
| |
|
5,325,189
|
See Notes to Schedules of Investments and Notes to Financial
Statements.
| State
Street Institutional Small-Cap Equity Fund |
21
|
State Street Institutional
Small-Cap Equity Fund
Schedule of Investments, continued
— September 30, 2022
| |
Number
of Shares |
Fair
Value |
| Construction
Materials - 0.1% |
| Eagle
Materials Inc. |
10,088
|
$
1,081,232 |
| Consumer
Finance - 0.2% |
| PROG
Holdings Inc. (b) |
110,557
|
1,656,144
|
| Data
Processing & Outsourced Services - 0.9% |
| CSG
Systems International Inc. |
78,120
|
4,130,986
|
| Shift4
Payments Inc., Class A (b) |
22,674
|
1,011,487
|
| Verra
Mobility Corp. (b) |
242,328
|
3,724,581
|
| |
|
8,867,054
|
| Distillers
& Vintners - 1.6% |
| MGP
Ingredients Inc. |
144,670
|
15,358,167
|
| Distributors
- 0.7% |
| LKQ
Corp. |
142,145
|
6,702,137
|
| Diversified
Metals & Mining - 0.3% |
| Compass
Minerals International Inc. |
44,903
|
1,730,113
|
| Materion
Corp. |
11,369
|
909,520
|
| |
|
2,639,633
|
| Diversified
REITs - 0.3% |
| Alpine
Income Property Trust Inc. |
72,708
|
1,179,324
|
| American
Assets Trust Inc. |
51,146
|
1,315,475
|
| Essential
Properties Realty Trust Inc. |
33,719
|
655,834
|
| |
|
3,150,633
|
| Diversified
Support Services - 2.0% |
| Healthcare
Services Group Inc. |
140,146
|
1,694,365
|
| IAA
Inc. (b) |
128,217
|
4,083,711
|
| Matthews
International Corp., Class A |
72,505
|
1,624,837
|
| Ritchie
Bros Auctioneers Inc. |
164,951
|
10,306,139
|
| UniFirst
Corp. |
6,761
|
1,137,403
|
| |
|
18,846,455
|
| Education
Services - 0.5% |
| Stride
Inc. (b) |
111,383
|
4,681,427
|
| Electric
Utilities - 1.0% |
| ALLETE
Inc. (a) |
13,193
|
660,310
|
| |
Number
of Shares |
Fair
Value |
| IDACORP
Inc. |
87,914
|
$
8,704,365 |
| |
|
9,364,675
|
| Electrical
Components & Equipment - 0.5% |
| Acuity
Brands Inc. (a) |
6,096
|
959,937
|
| Atkore
Inc. (b) |
14,528
|
1,130,424
|
| Regal
Rexnord Corp. |
15,932
|
2,236,215
|
| |
|
4,326,576
|
| Electronic
Components - 1.4% |
| Belden
Inc. |
130,681
|
7,843,474
|
| Coherent
Corp. (b) |
28,835
|
1,004,900
|
| Littelfuse
Inc. |
23,657
|
4,700,409
|
| |
|
13,548,783
|
| Electronic
Equipment & Instruments - 0.8% |
| National
Instruments Corp. |
93,705
|
3,536,427
|
| Novanta
Inc. (b) |
35,000
|
4,047,750
|
| |
|
7,584,177
|
| Electronic
Manufacturing Services - 0.2% |
| Plexus
Corp. (b) |
20,434
|
1,789,201
|
| Environmental
& Facilities Services - 0.7% |
| Clean
Harbors Inc. (b) |
40,629
|
4,468,377
|
| Montrose
Environmental Group Inc. (b) |
65,000
|
2,187,250
|
| |
|
6,655,627
|
| Food
Distributors - 0.4% |
| Performance
Food Group Co. (b) |
88,090
|
3,783,465
|
| Food
Retail - 0.0%* |
| The
Fresh Market, Inc. (b)(c) |
303,000
|
—
|
| Footwear
- 0.7% |
| Deckers
Outdoor Corp. (b) |
15,035
|
4,700,091
|
| Wolverine
World Wide Inc. |
100,830
|
1,551,774
|
| |
|
6,251,865
|
| General
Merchandise Stores - 0.1% |
| Ollie's
Bargain Outlet Holdings Inc. (b) |
19,981
|
1,031,020
|
| Health
Care REITs - 0.2% |
| Community
Healthcare Trust Inc. |
55,755
|
1,825,976
|
See Notes to Schedules of Investments and Notes to Financial
Statements.
| 22
|
State Street
Institutional Small-Cap Equity Fund |
State Street Institutional
Small-Cap Equity Fund
Schedule of Investments, continued
— September 30, 2022
| |
Number
of Shares |
Fair
Value |
| Healthcare
Distributors - 0.4% |
| AdaptHealth
Corp. (a)(b) |
210,819
|
$
3,959,181 |
| Healthcare
Equipment - 5.7% |
| AtriCure
Inc. (b) |
104,000
|
4,066,400
|
| Axonics
Inc. (b) |
45,500
|
3,205,020
|
| Cardiovascular
Systems Inc. (b) |
113,000
|
1,566,180
|
| CONMED
Corp. |
67,500
|
5,411,475
|
| Globus
Medical Inc., Class A (b) |
107,500
|
6,403,775
|
| Inspire
Medical Systems Inc. (b) |
35,500
|
6,296,635
|
| Integra
LifeSciences Holdings Corp. (b) |
137,500
|
5,824,500
|
| LeMaitre
Vascular Inc. |
21,430
|
1,086,073
|
| Masimo
Corp. (b) |
7,000
|
988,120
|
| Omnicell
Inc. (b) |
49,776
|
4,332,005
|
| Outset
Medical Inc. (b) |
100,000
|
1,593,000
|
| Penumbra
Inc. (b) |
42,000
|
7,963,200
|
| SI-BONE
Inc. (b) |
94,000
|
1,641,240
|
| Tandem
Diabetes Care Inc. (b) |
71,500
|
3,421,275
|
| |
|
53,798,898
|
| Healthcare
Facilities - 1.3% |
| Acadia
Healthcare Company Inc. (a)(b) |
103,506
|
8,092,099
|
| U.S.
Physical Therapy Inc. |
51,269
|
3,897,469
|
| |
|
11,989,568
|
| Healthcare
Services - 0.9% |
| Addus
HomeCare Corp. (a)(b) |
21,698
|
2,066,517
|
| AMN
Healthcare Services Inc. (b) |
13,225
|
1,401,321
|
| Castle
Biosciences Inc. (b) |
82,947
|
2,163,258
|
| Enhabit
Inc. (b) |
75,691
|
1,062,702
|
| Pediatrix
Medical Group Inc. (b) |
110,021
|
1,816,447
|
| |
|
8,510,245
|
| Healthcare
Supplies - 0.7% |
| BioLife
Solutions Inc. (b) |
131,452
|
2,990,533
|
| ICU
Medical Inc. (b) |
7,562
|
1,138,837
|
| Pulmonx
Corp. (b) |
145,000
|
2,415,700
|
| |
|
6,545,070
|
| Healthcare
Technology - 0.2% |
| NextGen
Healthcare Inc. (b) |
100,171
|
1,773,027
|
| |
Number
of Shares |
Fair
Value |
| Home
Building - 0.7% |
| Cavco
Industries Inc. (b) |
8,628
|
$
1,775,297 |
| Green
Brick Partners Inc. (b) |
29,959
|
640,523
|
| Taylor
Morrison Home Corp. (b) |
126,477
|
2,949,444
|
| TopBuild
Corp. (b) |
9,277
|
1,528,664
|
| |
|
6,893,928
|
| Home
Furnishing Retail - 0.1% |
| The
Aaron's Company Inc. (a) |
134,046
|
1,302,927
|
| Hotel
& Resort REITs - 0.5% |
| RLJ
Lodging Trust |
340,016
|
3,440,962
|
| Sunstone
Hotel Investors Inc. |
158,734
|
1,495,274
|
| |
|
4,936,236
|
| Household
Appliances - 0.1% |
| Helen
of Troy Ltd. (b) |
12,730
|
1,227,681
|
| Household
Products - 0.3% |
| Central
Garden & Pet Co., Class A (b) |
83,000
|
2,835,280
|
| Industrial
Machinery - 8.4% |
| Albany
International Corp., Class A (a) |
25,000
|
1,970,750
|
| Altra
Industrial Motion Corp. (a) |
285,370
|
9,594,139
|
| Barnes
Group Inc. |
231,533
|
6,686,673
|
| Chart
Industries Inc. (b) |
7,194
|
1,326,214
|
| Crane
Holdings Co. |
108,118
|
9,464,650
|
| Enerpac
Tool Group Corp. |
535,643
|
9,550,515
|
| ESCO
Technologies Inc. |
62,000
|
4,553,280
|
| Evoqua
Water Technologies Corp. (b) |
214,500
|
7,093,515
|
| John
Bean Technologies Corp. |
87,500
|
7,525,000
|
| Mueller
Industries Inc. |
75,721
|
4,500,856
|
| RBC
Bearings Inc. (b) |
16,500
|
3,428,865
|
| Standex
International Corp. |
31,000
|
2,531,150
|
| The
Timken Co. |
189,504
|
11,188,316
|
| |
|
79,413,923
|
| Industrial
REITs - 0.8% |
| EastGroup
Properties Inc. |
47,615
|
6,872,749
|
| Innovative
Industrial Properties Inc. |
3,595
|
318,158
|
| |
|
7,190,907
|
See Notes to Schedules of Investments and Notes to Financial
Statements.
| State
Street Institutional Small-Cap Equity Fund |
23
|
State Street Institutional
Small-Cap Equity Fund
Schedule of Investments, continued
— September 30, 2022
| |
Number
of Shares |
Fair
Value |
| Insurance
Brokers - 0.5% |
| BRP
Group Inc., Class A (b) |
175,000
|
$
4,611,250 |
| Interactive
Media & Services - 0.2% |
| Ziff
Davis Inc. (b) |
21,211
|
1,452,529
|
| Internet
& Direct Marketing Retail - 0.2% |
| Overstock.com
Inc. (b) |
31,363
|
763,689
|
| Revolve
Group Inc. (b) |
43,450
|
942,431
|
| |
|
1,706,120
|
| Internet
Services & Infrastructure - 0.2% |
| Switch
Inc., Class A |
50,362
|
1,696,696
|
| Investment
Banking & Brokerage - 1.1% |
| Piper
Sandler Cos. |
17,109
|
1,791,997
|
| Raymond
James Financial Inc. |
67,207
|
6,641,396
|
| Stifel
Financial Corp. |
40,275
|
2,090,675
|
| |
|
10,524,068
|
| IT
Consulting & Other Services - 0.3% |
| Perficient
Inc. (b) |
19,352
|
1,258,267
|
| Unisys
Corp. (b) |
256,257
|
1,934,740
|
| |
|
3,193,007
|
| Leisure
Products - 1.6% |
| Malibu
Boats Inc., Class A (b) |
126,787
|
6,084,508
|
| Polaris
Inc. |
96,448
|
9,225,251
|
| |
|
15,309,759
|
| Life
& Health Insurance - 0.4% |
| American
Equity Investment Life Holding Co. |
54,354
|
2,026,860
|
| Trupanion
Inc. (b) |
26,297
|
1,562,831
|
| |
|
3,589,691
|
| Life
Sciences Tools & Services - 2.3% |
| Azenta
Inc. |
52,879
|
2,266,394
|
| Bruker
Corp. |
88,149
|
4,677,186
|
| ICON
PLC (b) |
15,129
|
2,780,408
|
| Repligen
Corp. (b) |
37,200
|
6,960,492
|
| Syneos
Health Inc. (b) |
113,197
|
5,337,238
|
| |
|
22,021,718
|
| Marine
- 0.2% |
| Kirby
Corp. (b) |
26,584
|
1,615,510
|
| |
Number
of Shares |
Fair
Value |
| Metal
& Glass Containers - 0.4% |
| TriMas
Corp. |
162,000
|
$
4,061,340 |
| Multi-Line
Insurance - 0.3% |
| Horace
Mann Educators Corp. |
72,686
|
2,565,089
|
| Multi-Utilities
- 0.1% |
| Avista
Corp. |
35,277
|
1,307,013
|
| Office
REITs - 0.8% |
| Corporate
Office Properties Trust |
44,140
|
1,025,372
|
| Cousins
Properties Inc. |
149,218
|
3,484,240
|
| Easterly
Government Properties Inc. |
171,501
|
2,704,571
|
| |
|
7,214,183
|
| Office
Services & Supplies - 1.0% |
| MSA
Safety Inc. |
88,691
|
9,692,152
|
| Oil
& Gas Drilling - 0.1% |
| Helmerich
& Payne Inc. |
20,858
|
771,120
|
| Oil
& Gas Equipment & Services - 0.4% |
| ChampionX
Corp. |
80,995
|
1,585,072
|
| Oil
States International Inc. (b) |
631,331
|
2,455,878
|
| |
|
4,040,950
|
| Oil
& Gas Exploration & Production - 1.7% |
| Denbury
Inc. (b) |
9,710
|
837,585
|
| Northern
Oil & Gas Inc. |
86,331
|
2,366,333
|
| PDC
Energy Inc. |
129,112
|
7,461,382
|
| SM
Energy Co. |
102,410
|
3,851,640
|
| Southwestern
Energy Co. (b) |
249,373
|
1,526,163
|
| |
|
16,043,103
|
| Oil
& Gas Refining & Marketing - 0.2% |
| HF
Sinclair Corp. |
28,508
|
1,534,871
|
| Packaged
Foods & Meats - 3.1% |
| Calavo
Growers Inc. |
44,683
|
1,418,685
|
| Freshpet
Inc. (b) |
53,500
|
2,679,815
|
| Hostess
Brands Inc. (b) |
239,000
|
5,554,360
|
| J&J
Snack Foods Corp. |
28,000
|
3,625,160
|
| Lancaster
Colony Corp. |
45,000
|
6,762,600
|
| Sovos
Brands Inc. (b) |
57,500
|
818,800
|
| The
Simply Good Foods Co. (b) |
137,000
|
4,382,630
|
See Notes to Schedules of Investments and Notes to Financial
Statements.
| 24
|
State Street
Institutional Small-Cap Equity Fund |
State Street Institutional
Small-Cap Equity Fund
Schedule of Investments, continued
— September 30, 2022
| |
Number
of Shares |
Fair
Value |
| Utz
Brands Inc. |
255,500
|
$
3,858,050 |
| |
|
29,100,100
|
| Paper
Packaging - 0.0%* |
| Ranpak
Holdings Corp. (b) |
90,438
|
309,298
|
| Personal
Products - 0.5% |
| BellRing
Brands Inc. (b) |
67,971
|
1,400,882
|
| elf
Beauty Inc. (b) |
97,000
|
3,649,140
|
| |
|
5,050,022
|
| Pharmaceuticals
- 0.2% |
| ANI
Pharmaceuticals Inc. (b) |
47,561
|
1,528,611
|
| Property
& Casualty Insurance - 2.2% |
| AMERISAFE
Inc. |
43,375
|
2,026,914
|
| Argo
Group International Holdings Ltd. |
175,638
|
3,382,788
|
| James
River Group Holdings Ltd. |
107,500
|
2,452,075
|
| Palomar
Holdings Inc. (b) |
44,000
|
3,683,680
|
| RLI
Corp. |
37,280
|
3,816,726
|
| Selective
Insurance Group Inc. |
71,000
|
5,779,400
|
| |
|
21,141,583
|
| Publishing
- 0.9% |
| John
Wiley & Sons Inc., Class A |
236,476
|
8,882,039
|
| Regional
Banks - 9.2% |
| 1st
Source Corp. |
38,136
|
1,765,697
|
| Bank
OZK |
47,521
|
1,879,931
|
| BankUnited
Inc. |
43,126
|
1,473,615
|
| Banner
Corp. |
15,610
|
922,239
|
| Cadence
Bank |
61,944
|
1,573,997
|
| Community
Bank System Inc. |
46,000
|
2,763,680
|
| Cullen/Frost
Bankers Inc. |
37,388
|
4,943,441
|
| CVB
Financial Corp. |
102,500
|
2,595,300
|
| Enterprise
Financial Services Corp. |
36,569
|
1,610,499
|
| FB
Financial Corp. |
19,712
|
753,196
|
| First
Interstate BancSystem Inc., Class A |
60,312
|
2,433,589
|
| Fulton
Financial Corp. |
210,965
|
3,333,247
|
| German
American Bancorp Inc. |
73,500
|
2,624,685
|
| Heritage
Commerce Corp. |
66,111
|
749,699
|
| Home
BancShares Inc. |
123,692
|
2,784,307
|
| HomeStreet
Inc. |
24,475
|
705,125
|
| |
Number
of Shares |
Fair
Value |
| Independent
Bank Corp. |
124,883
|
$
9,307,530 |
| National
Bank Holdings Corp., Class A |
61,766
|
2,284,724
|
| Origin
Bancorp Inc. |
51,130
|
1,966,971
|
| PacWest
Bancorp |
57,240
|
1,293,624
|
| Peapack-Gladstone
Financial Corp. |
40,311
|
1,356,465
|
| Pinnacle
Financial Partners Inc. |
19,223
|
1,558,985
|
| Prosperity
Bancshares Inc. |
125,016
|
8,336,067
|
| Renasant
Corp. |
147,248
|
4,605,918
|
| Sandy
Spring Bancorp Inc. |
35,353
|
1,246,547
|
| Stock
Yards Bancorp Inc. |
22,500
|
1,530,225
|
| Texas
Capital Bancshares Inc. (b) |
32,380
|
1,911,391
|
| UMB
Financial Corp. |
65,500
|
5,520,995
|
| United
Community Banks Inc. |
42,252
|
1,398,541
|
| Washington
Federal Inc. |
33,599
|
1,007,298
|
| Washington
Trust Bancorp Inc. |
25,000
|
1,162,000
|
| Westamerica
BanCorp |
63,937
|
3,343,266
|
| Western
Alliance Bancorp |
57,874
|
3,804,637
|
| Wintrust
Financial Corp. |
33,248
|
2,711,374
|
| |
|
87,258,805
|
| Research
& Consulting Services - 0.4% |
| Resources
Connection Inc. |
181,149
|
3,273,362
|
| Residential
REITs - 0.2% |
| NexPoint
Residential Trust Inc. |
42,235
|
1,951,679
|
| Restaurants
- 1.5% |
| Bloomin'
Brands Inc. |
78,324
|
1,435,679
|
| Shake
Shack Inc., Class A (b) |
48,500
|
2,181,530
|
| Texas
Roadhouse Inc. |
39,173
|
3,418,236
|
| The
Cheesecake Factory Inc. |
71,237
|
2,085,819
|
| Wingstop
Inc. |
40,500
|
5,079,510
|
| |
|
14,200,774
|
| Retail
REITs - 0.2% |
| Kite
Realty Group Trust |
105,271
|
1,812,767
|
| The
Macerich Co. |
49,009
|
389,131
|
| |
|
2,201,898
|
| Security
& Alarm Services - 0.9% |
| The
Brink's Co. |
170,745
|
8,270,888
|
| Semiconductor
Equipment - 0.4% |
| Ichor
Holdings Ltd. (b) |
38,312
|
927,533
|
See Notes to Schedules of Investments and Notes to Financial
Statements.
| State
Street Institutional Small-Cap Equity Fund |
25
|
State Street Institutional
Small-Cap Equity Fund
Schedule of Investments, continued
— September 30, 2022
| |
Number
of Shares |
Fair
Value |
| Onto
Innovation Inc. (b) |
50,812
|
$
3,254,509 |
| |
|
4,182,042
|
| Semiconductors
- 0.5% |
| Diodes
Inc. (b) |
12,108
|
785,930
|
| MaxLinear
Inc. (b) |
24,733
|
806,791
|
| Semtech
Corp. (b) |
82,813
|
2,435,530
|
| SMART
Global Holdings Inc. (b) |
60,835
|
965,452
|
| |
|
4,993,703
|
| Soft
Drinks - 0.4% |
| Primo
Water Corp. |
274,701
|
3,447,498
|
| Zevia
PBC, Class A (b) |
62,500
|
270,000
|
| |
|
3,717,498
|
| Specialized
Consumer Services - 0.3% |
| European
Wax Center Inc., Class A |
95,500
|
1,761,975
|
| OneSpaWorld
Holdings Ltd. (b) |
159,456
|
1,339,430
|
| |
|
3,101,405
|
| Specialized
REITs - 0.3% |
| National
Storage Affiliates Trust |
34,292
|
1,425,861
|
| PotlatchDeltic
Corp. |
38,015
|
1,560,136
|
| |
|
2,985,997
|
| Specialty
Chemicals - 4.1% |
| Avient
Corp. |
155,918
|
4,724,316
|
| HB
Fuller Co. |
14,289
|
858,769
|
| Ingevity
Corp. (b) |
221,097
|
13,405,111
|
| Innospec
Inc. |
46,500
|
3,983,655
|
| Quaker
Chemical Corp. |
18,924
|
2,732,247
|
| Sensient
Technologies Corp. |
37,500
|
2,600,250
|
| Stepan
Co. |
114,905
|
10,763,151
|
| |
|
39,067,499
|
| Specialty
Stores - 0.6% |
| Leslie's
Inc. (b) |
211,000
|
3,103,810
|
| Sally
Beauty Holdings Inc. (b) |
212,500
|
2,677,500
|
| |
|
5,781,310
|
| Steel
- 0.5% |
| Carpenter
Technology Corp. |
30,546
|
951,202
|
| Commercial
Metals Co. |
97,704
|
3,466,538
|
| |
Number
of Shares |
Fair
Value |
| Ryerson
Holding Corp. |
28,332
|
$
729,266 |
| |
|
5,147,006
|
| Systems
Software - 0.7% |
| Ping
Identity Holding Corp. (b) |
80,815
|
2,268,477
|
| Progress
Software Corp. |
26,973
|
1,147,701
|
| Tenable
Holdings Inc. (b) |
96,825
|
3,369,510
|
| |
|
6,785,688
|
| Technology
Hardware, Storage & Peripherals - 1.1% |
| Corsair
Gaming Inc. (b) |
112,444
|
1,276,239
|
| Pure
Storage Inc., Class A (b) |
322,120
|
8,816,425
|
| |
|
10,092,664
|
| Thrifts
& Mortgage Finance - 0.9% |
| Flagstar
Bancorp Inc. |
18,676
|
623,778
|
| WSFS
Financial Corp. |
162,098
|
7,531,073
|
| |
|
8,154,851
|
| Trading
Companies & Distributors - 2.3% |
| Applied
Industrial Technologies Inc. |
87,814
|
9,025,523
|
| McGrath
RentCorp. |
15,861
|
1,330,103
|
| Transcat
Inc. (b) |
20,000
|
1,513,800
|
| Univar
Solutions Inc. (b) |
414,381
|
9,423,024
|
| |
|
21,292,450
|
| Trucking
- 0.5% |
| Saia
Inc. (b) |
26,720
|
5,076,800
|
| Water
Utilities - 0.1% |
| American
States Water Co. |
14,970
|
1,166,911
|
Total
Common Stock
(Cost $775,944,135) |
|
893,600,223
|
| Short-Term
Investments - 5.8% |
State
Street Institutional U.S. Government Money Market Fund - Class G Shares 2.98% (d)(e)
(Cost $54,958,269) |
54,958,269
|
54,958,269
|
Total
Investments
(Cost $830,902,404) |
|
948,558,492
|
| Liabilities
in Excess of Other Assets, net - (0.1)% |
|
(1,054,515)
|
| NET
ASSETS - 100.0% |
|
$
947,503,977 |
See Notes to Schedules of Investments and Notes to Financial
Statements.
| 26
|
State Street
Institutional Small-Cap Equity Fund |
State Street Institutional
Small-Cap Equity Fund
Schedule of Investments, continued
— September 30, 2022
Other Information:
| The
Fund had the following long futures contracts open at September 30, 2022: |
| Description
|
Expiration
Date |
Number
of
Contracts |
Notional
Amount |
Value
|
Unrealized
Appreciation
(Depreciation) |
| E-mini
Russell 2000 Index Futures |
December
2022 |
214
|
$
18,913,121 |
$
17,866,860 |
$
(1,046,261) |
During the year ended September 30, 2022, the average notional
value related to long futures contracts was $23,288,662.
Notes to Schedule of Investments
The views expressed in this document reflect our judgment
as of the publication date and are subject to change at any time without notice. The securities cited may not be representative of the Fund’s future investments and should not be construed as a recommendation to purchase or sell a particular
security. See the Fund’s summary prospectus and statutory prospectus for complete descriptions of investment objectives, policies, risks and permissible investments.
| (a)
|
At
September 30, 2022, all or a portion of this security was pledged to cover collateral requirements for futures . |
| (b)
|
Non-income
producing security. |
| (c)
|
Security
is fair valued by the Valuation Committee, in accordance with the procedures approved by the Fund's Board of Trustees. Security value is determined based on level 3 inputs. |
| (d)
|
Sponsored
by SSGA Funds Management, Inc., the Fund’s investment adviser and administrator, and an affiliate of State Street Bank & Trust Co., the Fund’s sub-administrator, custodian and accounting agent. |
| (e)
|
Coupon
amount represents effective yield. |
| †
|
Percentages
are based on net assets as of September 30, 2022. |
| *
|
Less
than 0.05%. |
| Abbreviations:
|
| REIT
- Real Estate Investment Trust |
The following table presents the Fund’s
investments measured at fair value on a recurring basis at September 30, 2022:
| Investments
|
Level
1 |
|
Level
2 |
|
Level
3 |
|
Total
|
| Investments
in Securities |
|
|
|
|
|
|
|
| Common
Stock |
$
893,600,223 |
|
$
— |
|
$
— |
|
$
893,600,223 |
| Short-Term
Investments |
54,958,269
|
|
—
|
|
—
|
|
54,958,269
|
| Total
Investments in Securities |
$
948,558,492 |
|
$
— |
|
$
— |
|
$
948,558,492 |
| Other
Financial Instruments |
|
|
|
|
|
|
|
| Long
Futures Contracts - Unrealized Depreciation |
$
(1,046,261) |
|
$
— |
|
$
— |
|
$
(1,046,261) |
| Total
Other Financial Instruments |
$
(1,046,261) |
|
$
— |
|
$
— |
|
$
(1,046,261) |
| |
Number
of Shares
Held at
9/30/21 |
Value
at
9/30/21 |
Cost
of
Purchases |
Proceeds
from
Shares
Sold |
Realized
Gain
(Loss) |
Change
in
Unrealized
Appreciation
(Depreciation) |
Number
of
Shares
Held at
9/30/22 |
Value
at
9/30/22 |
Dividend
Income |
| State
Street Institutional U.S. Government Money Market Fund - Class G Shares |
49,748,651
|
$49,748,651
|
$362,832,769
|
$357,623,151
|
$—
|
$—
|
54,958,269
|
$54,958,269
|
$450,062
|
See Notes to Schedules of Investments and Notes to Financial
Statements.
| State
Street Institutional Small-Cap Equity Fund |
27
|
State Street Institutional U.S.
Equity Fund
Financial Highlights
Selected data based on a share outstanding throughout the
fiscal years indicated
| |
Investment
Class |
| |
9/30/22
|
|
9/30/21
|
|
9/30/20
|
|
9/30/19
|
|
9/30/18
|
| Inception
date |
|
|
11/25/97
|
| Net
asset value, beginning of period |
$
17.26 |
|
$
13.97 |
|
$
12.30 |
|
$
13.74 |
|
$
14.95 |
| Income/(loss)
from investment operations: |
|
|
|
|
|
|
|
|
|
| Net
investment income |
0.11
(a) |
|
0.13
(a) |
|
0.14
(a) |
|
0.15
(a) |
|
0.16
(a) |
| Net
realized and unrealized gains/(losses) on investments |
(1.80)
(a) |
|
3.86
(a) |
|
2.35
(a) |
|
0.05
(a) |
|
1.95
(a) |
| Total
income/(loss) from investment operations |
(1.69)
|
|
3.99
|
|
2.49
|
|
0.20
|
|
2.11
|
| Less
distributions from: |
|
|
|
|
|
|
|
|
|
| Net
investment income |
0.13
|
|
0.14
|
|
0.16
|
|
0.18
|
|
0.21
|
| Net
realized gains |
5.70
|
|
0.56
|
|
0.66
|
|
1.46
|
|
3.11
|
| Total
distributions |
5.83
|
|
0.70
|
|
0.82
|
|
1.64
|
|
3.32
|
| Net
asset value, end of period |
$
9.74 |
|
$
17.26 |
|
$
13.97 |
|
$
12.30 |
|
$
13.74 |
| Total
Return(b) |
(16.99)%
|
|
29.41%
|
|
20.77%
|
|
4.43%
|
|
16.72%
|
| Ratios/Supplemental
Data: |
|
|
|
|
|
|
|
|
|
| Net
assets, end of period (in thousands) |
$176,243
|
|
$572,329
|
|
$461,624
|
|
$419,296
|
|
$522,658
|
| Ratios
to average net assets: |
|
|
|
|
|
|
|
|
|
| Net
expenses |
0.38%
|
|
0.37%
|
|
0.37%
|
|
0.38%
|
|
0.37%
|
| Gross
expenses |
0.38%
|
|
0.37%
|
|
0.37%
|
|
0.38%
|
|
0.37%
|
| Net
investment income |
0.78%
|
|
0.81%
|
|
1.12%
|
|
1.29%
|
|
1.21%
|
| Portfolio
turnover rate |
29%
|
|
35%
|
|
38%
|
|
35%
|
|
48%
|
| Notes
to Financial Highlights |
| (a)
|
Per share
values have been calculated using the average shares method. |
| (b)
|
Total
returns are historical and assume changes in share price and reinvestment of dividends and capital gains distributions. |
The accompanying Notes are an integral part of these
financial statements.
State Street Institutional U.S.
Equity Fund
Financial Highlights, continued
Selected data based on a share outstanding throughout the
fiscal years indicated
| |
Service
Class |
| |
9/30/22
|
|
9/30/21
|
|
9/30/20
|
|
9/30/19
|
|
9/30/18
|
| Inception
date |
|
|
1/3/01
|
| Net
asset value, beginning of period |
$
18.86 |
|
$15.21
|
|
$13.32
|
|
$14.70
|
|
$15.77
|
| Income/(loss)
from investment operations: |
|
|
|
|
|
|
|
|
|
| Net
investment income |
0.09
(a) |
|
0.10
(a) |
|
0.12
(a) |
|
0.14
(a) |
|
0.14
(a) |
| Net
realized and unrealized gains/(losses) on investments |
(2.08)
(a) |
|
4.21
(a) |
|
2.54
(a) |
|
0.09
(a) |
|
2.08
(a) |
| Total
income/(loss) from investment operations |
(1.99)
|
|
4.31
|
|
2.66
|
|
0.23
|
|
2.22
|
| Less
distributions from: |
|
|
|
|
|
|
|
|
|
| Net
investment income |
0.09
|
|
0.10
|
|
0.11
|
|
0.15
|
|
0.18
|
| Net
realized gains |
5.70
|
|
0.56
|
|
0.66
|
|
1.46
|
|
3.11
|
| Total
distributions |
5.79
|
|
0.66
|
|
0.77
|
|
1.61
|
|
3.29
|
| Net
asset value, end of period |
$
11.08 |
|
$18.86
|
|
$15.21
|
|
$13.32
|
|
$14.70
|
| Total
Return(b) |
(17.16)%
|
|
29.10%
|
|
20.52%
|
|
4.23%
|
|
16.35%
|
| Ratios/Supplemental
Data: |
|
|
|
|
|
|
|
|
|
| Net
assets, end of period (in thousands) |
$
118 |
|
$
268 |
|
$
58 |
|
$
48 |
|
$
104 |
| Ratios
to average net assets: |
|
|
|
|
|
|
|
|
|
| Net
expenses |
0.63%
|
|
0.62%
|
|
0.62%
|
|
0.63%
|
|
0.62%
|
| Gross
expenses |
0.63%
|
|
0.62%
|
|
0.62%
|
|
0.63%
|
|
0.62%
|
| Net
investment income (loss) |
0.62%
|
|
0.56%
|
|
0.87%
|
|
1.06%
|
|
0.95%
|
| Portfolio
turnover rate |
29%
|
|
35%
|
|
38%
|
|
35%
|
|
48%
|
| Notes
to Financial Highlights |
| (a)
|
Per share
values have been calculated using the average shares method. |
| (b)
|
Total
returns are historical and assume changes in share price and reinvestment of dividends and capital gains distributions. |
The accompanying Notes are an integral part of these
financial statements.
State Street Institutional
Premier Growth Equity Fund
Financial Highlights
Selected data based on a share outstanding throughout the
fiscal years indicated
| |
Investment
Class |
| |
9/30/22
|
|
9/30/21
|
|
9/30/20
|
|
9/30/19
|
|
9/30/18
|
| Inception
date |
|
|
10/29/99
|
| Net
asset value, beginning of period |
$
11.99 |
|
$
10.72 |
|
$
15.51 |
|
$
17.49 |
|
$
15.69 |
| Income/(loss)
from investment operations: |
|
|
|
|
|
|
|
|
|
| Net
investment income |
(0.00)
(a)(b) |
|
0.02
(a) |
|
0.05
(a) |
|
0.09
(a) |
|
0.11
(a) |
| Net
realized and unrealized gains/(losses) on investments |
(2.67)
(a) |
|
2.55
(a) |
|
3.89
(a) |
|
(0.03)
(a) |
|
2.82
(a) |
| Total
income/(loss) from investment operations |
(2.67)
|
|
2.57
|
|
3.94
|
|
0.06
|
|
2.93
|
| Less
distributions from: |
|
|
|
|
|
|
|
|
|
| Net
investment income |
0.01
|
|
0.01
|
|
0.09
|
|
0.11
|
|
0.13
|
| Net
realized gains |
1.53
|
|
1.29
|
|
8.64
|
|
1.93
|
|
1.00
|
| Total
distributions |
1.54
|
|
1.30
|
|
8.73
|
|
2.04
|
|
1.13
|
| Net
asset value, end of period |
$
7.78 |
|
$
11.99 |
|
$
10.72 |
|
$
15.51 |
|
$
17.49 |
| Total
Return(c) |
(26.33)%
|
|
25.85%
|
|
39.25%
|
|
3.57%
|
|
19.64%
|
| Ratios/Supplemental
Data: |
|
|
|
|
|
|
|
|
|
| Net
assets, end of period (in thousands) |
$15,818
|
|
$85,331
|
|
$73,933
|
|
$192,144
|
|
$365,078
|
| Ratios
to average net assets: |
|
|
|
|
|
|
|
|
|
| Net
expenses |
0.51%
|
|
0.45%
|
|
0.42%
|
|
0.39%
|
|
0.38%
|
| Gross
expenses |
0.51%
|
|
0.45%
|
|
0.42%
|
|
0.39%
|
|
0.38%
|
| Net
investment income (loss) |
(0.01)%
|
|
0.16%
|
|
0.40%
|
|
0.59%
|
|
0.68%
|
| Portfolio
turnover rate |
41%
|
|
27%
|
|
28%
|
|
27%
|
|
21%
|
| Notes
to Financial Highlights |
| (a)
|
Per share
values have been calculated using the average shares method. |
| (b)
|
Rounds to
less than $0.005. |
| (c)
|
Total
returns are historical and assume changes in share price and reinvestment of dividends and capital gains distributions. |
The accompanying Notes are an integral part of these
financial statements.
State Street Institutional
Premier Growth Equity Fund
Financial Highlights,
continued
Selected data based on a share outstanding
throughout the fiscal years indicated
| |
Service
Class |
| |
9/30/22
|
|
9/30/21
|
|
9/30/20
|
|
9/30/19
|
|
9/30/18
|
| Inception
date |
|
|
1/3/01
|
| Net
asset value, beginning of period |
$
11.57 |
|
$10.40
|
|
$15.27
|
|
$17.24
|
|
$
15.48 |
| Income/(loss)
from investment operations: |
|
|
|
|
|
|
|
|
|
| Net
investment income (loss) |
(0.02)
(a) |
|
(0.01)
(a) |
|
0.01
(a) |
|
0.05
(a) |
|
0.07
(a) |
| Net
realized and unrealized gains/(losses) on investments |
(2.56)
(a) |
|
2.47
(a) |
|
3.80
(a) |
|
(0.02)
(a) |
|
2.78
(a) |
| Total
income/(loss) from investment operations |
(2.58)
|
|
2.46
|
|
3.81
|
|
0.03
|
|
2.85
|
| Less
distributions from: |
|
|
|
|
|
|
|
|
|
| Net
investment income |
—
|
|
—
|
|
0.04
|
|
0.07
|
|
0.09
|
| Net
realized gains |
1.53
|
|
1.29
|
|
8.64
|
|
1.93
|
|
1.00
|
| Total
distributions |
1.53
|
|
1.29
|
|
8.68
|
|
2.00
|
|
1.09
|
| Net
asset value, end of period |
$
7.46 |
|
$11.57
|
|
$10.40
|
|
$15.27
|
|
$
17.24 |
| Total
Return(b) |
(26.51)%
|
|
25.58%
|
|
38.83%
|
|
3.32%
|
|
19.37%
|
| Ratios/Supplemental
Data: |
|
|
|
|
|
|
|
|
|
| Net
assets, end of period (in thousands) |
$
9,937 |
|
$9,784
|
|
$8,832
|
|
$9,609
|
|
$17,298
|
| Ratios
to average net assets: |
|
|
|
|
|
|
|
|
|
| Net
expenses |
0.76%
|
|
0.70%
|
|
0.69%
|
|
0.64%
|
|
0.63%
|
| Gross
expenses |
0.76%
|
|
0.70%
|
|
0.69%
|
|
0.64%
|
|
0.63%
|
| Net
investment income (loss) |
(0.21)%
|
|
(0.09)%
|
|
0.08%
|
|
0.34%
|
|
0.43%
|
| Portfolio
turnover rate |
41%
|
|
27%
|
|
28%
|
|
27%
|
|
21%
|
| Notes
to Financial Highlights |
| (a)
|
Per share
values have been calculated using the average shares method. |
| (b)
|
Total
returns are historical and assume changes in share price and reinvestment of dividends and capital gains distributions. |
The accompanying Notes are an integral part of these
financial statements.
State Street Institutional
Small-Cap Equity Fund
Financial Highlights
Selected data based on a share outstanding throughout the
fiscal years indicated
| |
Investment
Class |
| |
9/30/22
|
|
9/30/21
|
|
9/30/20
|
|
9/30/19
|
|
9/30/18
|
| Inception
date |
|
|
8/3/98
|
| Net
asset value, beginning of period |
$
22.15 |
|
$
15.55 |
|
$
17.04 |
|
$
21.94 |
|
$
20.79 |
| Income/(loss)
from investment operations: |
|
|
|
|
|
|
|
|
|
| Net
investment income |
0.05
(a) |
|
0.02
(a) |
|
0.05
(a) |
|
0.06
(a) |
|
0.03
(a) |
| Net
realized and unrealized gains/(losses) on investments |
(3.38)
(a) |
|
7.19
(a) |
|
(0.45)
(a) |
|
(2.06)
(a) |
|
2.95
(a) |
| Total
income/(loss) from investment operations |
(3.33)
|
|
7.21
|
|
(0.40)
|
|
(2.00)
|
|
2.98
|
| Less
distributions from: |
|
|
|
|
|
|
|
|
|
| Net
investment income |
0.03
|
|
0.04
|
|
0.07
|
|
0.04
|
|
0.04
|
| Net
realized gains |
3.30
|
|
0.57
|
|
1.02
|
|
2.86
|
|
1.79
|
| Total
distributions |
3.33
|
|
0.61
|
|
1.09
|
|
2.90
|
|
1.83
|
| Net
asset value, end of period |
$
15.49 |
|
$
22.15 |
|
$
15.55 |
|
$
17.04 |
|
$
21.94 |
| Total
Return(b) |
(18.14)%
|
|
46.98%
|
|
(3.03)%
|
|
(6.21)%
|
|
15.47%
|
| Ratios/Supplemental
Data: |
|
|
|
|
|
|
|
|
|
| Net
assets, end of period (in thousands) |
$945,933
|
|
$1,308,410
|
|
$973,165
|
|
$1,255,899
|
|
$1,528,575
|
| Ratios
to average net assets: |
|
|
|
|
|
|
|
|
|
| Net
expenses |
0.79%
|
|
0.88%
|
|
0.89%
|
|
0.88%
|
|
0.88%
|
| Gross
expenses |
0.88%
|
|
0.88%
|
|
0.89%
|
|
0.88%
|
|
0.88%
|
| Net
investment income |
0.27%
|
|
0.10%
|
|
0.33%
|
|
0.37%
|
|
0.14%
|
| Portfolio
turnover rate |
30%
|
|
42%
|
|
31%
|
|
29%
|
|
38%
|
| Notes
to Financial Highlights |
| (a)
|
Per share
values have been calculated using the average shares method. |
| (b)
|
Total
returns are historical and assume changes in share price and reinvestment of dividends and capital gains distributions. |
The accompanying Notes are an integral part of these
financial statements.
State Street Institutional
Small-Cap Equity Fund
Financial Highlights,
continued
Selected data based on a share outstanding
throughout the fiscal years indicated
| |
Service
Class |
| |
9/30/22
|
|
9/30/21
|
|
9/30/20
|
|
9/30/19
|
|
9/30/18
|
| Inception
date |
|
|
9/30/05
|
| Net
asset value, beginning of period |
$
22.11 |
|
$15.53
|
|
$17.02
|
|
$21.93
|
|
$20.79
|
| Income/(loss)
from investment operations: |
|
|
|
|
|
|
|
|
|
| Net
investment income (loss) |
0.01
(a) |
|
(0.03)
(a) |
|
0.01
(a) |
|
0.02
(a) |
|
(0.02)
(a) |
| Net
realized and unrealized gains/(losses) on investments |
(3.37)
(a) |
|
7.18
(a) |
|
(0.46)
(a) |
|
(2.05)
(a) |
|
2.95
(a) |
| Total
income/(loss) from investment operations |
(3.36)
|
|
7.15
|
|
(0.45)
|
|
(2.03)
|
|
2.93
|
| Less
distributions from: |
|
|
|
|
|
|
|
|
|
| Net
investment income |
—
|
|
—
|
|
0.02
|
|
0.02
|
|
—
|
| Net
realized gains |
3.30
|
|
0.57
|
|
1.02
|
|
2.86
|
|
1.79
|
| Total
distributions |
3.30
|
|
0.57
|
|
1.04
|
|
2.88
|
|
1.79
|
| Net
asset value, end of period |
$
15.45 |
|
$22.11
|
|
$15.53
|
|
$17.02
|
|
$21.93
|
| Total
Return(b) |
(18.28)%
|
|
46.60%
|
|
3.30%
|
|
(6.44)%
|
|
15.14%
|
| Ratios/Supplemental
Data: |
|
|
|
|
|
|
|
|
|
| Net
assets, end of period (in thousands) |
$
1,571 |
|
$2,078
|
|
$1,750
|
|
$1,937
|
|
$2,671
|
| Ratios
to average net assets: |
|
|
|
|
|
|
|
|
|
| Net
expenses |
1.04%
|
|
1.13%
|
|
1.14%
|
|
1.13%
|
|
1.13%
|
| Gross
expenses |
1.13%
|
|
1.13%
|
|
1.14%
|
|
1.13%
|
|
1.13%
|
| Net
investment income (loss) |
0.03%
|
|
(0.14)%
|
|
0.08%
|
|
0.12%
|
|
(0.11)%
|
| Portfolio
turnover rate |
30%
|
|
42%
|
|
31%
|
|
29%
|
|
38%
|
| Notes
to Financial Highlights |
| (a)
|
Per share
values have been calculated using the average shares method. |
| (b)
|
Total
returns are historical and assume changes in share price and reinvestment of dividends and capital gains distributions. |
The accompanying Notes are an integral part of these financial
statements.
State Street Institutional
Funds
Statements of Assets and Liabilities —
September 30, 2022
| |
State
Street
Institutional
U.S. Equity
Fund |
|
State
Street
Institutional
Premier Growth
Equity Fund |
|
State
Street
Institutional
Small-Cap
Equity Fund |
| Assets
|
|
|
|
|
|
| Investments
in securities, at fair value (cost $140,872,322; $22,848,116 and $775,944,135, respectively) |
$
169,870,027 |
|
$
24,601,041 |
|
$
893,600,223 |
| Investments
in affiliated securities, at fair value |
6,354,619
|
|
1,142,486
|
|
54,958,269
|
| Cash
|
5,026
|
|
—
|
|
16,622
|
| Net
cash collateral on deposit with broker for future contracts |
733,985
|
|
31,530
|
|
2,243,315
|
| Receivable
for investments sold |
460,842
|
|
—
|
|
3,114,723
|
| Income
receivables |
166,788
|
|
—
|
|
567,084
|
| Receivable
for fund shares sold |
26,060
|
|
3,111
|
|
4,176
|
| Income
receivable from affiliated investments |
14,954
|
|
1,865
|
|
119,835
|
| Total
assets |
177,632,301
|
|
25,780,033
|
|
954,624,247
|
| Liabilities
|
|
|
|
|
|
| Payable
for investments purchased |
667,686
|
|
—
|
|
4,242,189
|
| Payable
for fund shares redeemed |
344
|
|
3,535
|
|
1,236,314
|
| Payable
for accumulated variation margin on futures contracts |
541,694
|
|
6,487
|
|
1,045,785
|
| Payable
to the Adviser |
61,072
|
|
12,982
|
|
595,532
|
| Accrued
other expenses |
37
|
|
5
|
|
108
|
| Distribution
and service fees |
26
|
|
2,236
|
|
342
|
| Total
liabilities |
1,270,859
|
|
25,245
|
|
7,120,270
|
| |
| Net
Assets |
$
176,361,442 |
|
$
25,754,788 |
|
$
947,503,977 |
| Net
Assets Consist of: |
|
|
|
|
|
| Capital
paid in |
$
122,103,230 |
|
$
(13,651,089) |
|
$
806,132,822 |
| Total
distributable earnings (loss) |
54,258,212
|
|
39,405,877
|
|
141,371,155
|
| Net
Assets |
$
176,361,442 |
|
$
25,754,788 |
|
$
947,503,977 |
| |
| Investment
Class: |
|
|
|
|
|
| Net
Assets |
$
176,243,258 |
|
$
15,818,198 |
|
$
945,933,355 |
| Shares
outstanding ($0.001 par value, unlimited shares authorized) |
18,092,234
|
|
2,033,034
|
|
61,055,711
|
| Net
asset value, offering and redemption price per share |
$
9.74 |
|
$
7.78 |
|
$
15.49 |
| |
| Service
Class: |
|
|
|
|
|
| Net
Assets |
$
118,184 |
|
$
9,936,590 |
|
$
1,570,622 |
| Shares
outstanding ($0.001 par value, unlimited shares authorized) |
10,664
|
|
1,331,241
|
|
101,683
|
| Net
asset value, offering and redemption price per share |
$
11.08 |
|
$
7.46 |
|
$
15.45 |
The accompanying Notes are an integral part of these
financial statements.
| 34
|
Statements of Assets
and Liabilities |
State Street Institutional
Funds
Statements of Operations — For the year ended
September 30, 2022
| |
State
Street
Institutional
U.S. Equity
Fund |
|
State
Street
Institutional
Premier Growth
Equity Fund |
|
State
Street
Institutional
Small-Cap
Equity Fund |
| Investment
Income |
|
|
|
|
|
| Income
|
|
|
|
|
|
| Dividend
|
$
3,871,810 |
|
$
265,747 |
|
$
12,047,016 |
| Income
from affiliated investments |
61,826
|
|
7,808
|
|
450,062
|
| Less:
Foreign taxes withheld |
(8,960)
|
|
—
|
|
(41,325)
|
| Total
income |
3,924,676
|
|
273,555
|
|
12,455,753
|
| Expenses
|
|
|
|
|
|
| Advisory
and administration fees |
1,259,268
|
|
249,559
|
|
10,342,070
|
| Distribution
and service fees |
|
|
|
|
|
| Service
Class |
366
|
|
28,362
|
|
4,811
|
| Trustees'
fees |
22,434
|
|
20,426
|
|
28,251
|
| Other
expenses |
4,193
|
|
130
|
|
3,688
|
| Total
expenses before waivers |
1,286,261
|
|
298,477
|
|
10,378,820
|
| Less:
Expenses waived or borne by the adviser |
—
|
|
—
|
|
(1,131,707)
|
| Net
expenses |
1,286,261
|
|
298,477
|
|
9,247,113
|
| Net
investment income |
$
2,638,415 |
|
$
(24,922) |
|
$
3,208,640 |
| Net
Realized and Unrealized Gain (Loss) on Investments |
|
|
|
|
|
| Realized
gain (loss) on: |
|
|
|
|
|
| Unaffiliated
investments |
$
168,316,155 |
|
$
39,048,421 |
|
$
57,421,184 |
| Affiliated
investments |
—
|
|
360,988
|
|
—
|
| Futures
|
(200,960)
|
|
(30,137)
|
|
(4,418,599)
|
| Increase
(decrease) in unrealized appreciation/depreciation on: |
|
|
|
|
|
| Unaffiliated
investments |
(185,679,844)
|
|
(44,580,370)
|
|
(271,224,611)
|
| Affiliated
investments |
—
|
|
(376,173)
|
|
—
|
| Futures
|
(351,715)
|
|
49,132
|
|
(896,638)
|
| Net
realized and unrealized gain (loss) on investments |
(17,916,364)
|
|
(5,528,139)
|
|
(219,118,664)
|
| Net
Decrease in Net Assets Resulting from Operations |
$
(15,277,949) |
|
$
(5,553,061) |
|
$
(215,910,024) |
The accompanying Notes are an integral part of these
financial statements.
| Statements
of Operations |
35
|
State Street Institutional
Funds
Statements of Changes in Net Assets
| |
State
Street Institutional
U.S. Equity Fund |
|
State
Street Institutional
Premier Growth Equity Fund |
| |
Year
Ended
September 30,
2022 |
|
Year
Ended
September 30,
2021 |
|
Year
Ended
September 30,
2022 |
|
Year
Ended
September 30,
2021 |
| Increase
(Decrease) in Net Assets |
|
|
|
|
|
|
|
| Operations:
|
|
|
|
|
|
|
|
| Net
investment income (loss) |
$
2,638,415 |
|
$
4,433,694 |
|
$
(24,922) |
|
$
122,083 |
| Net
realized gain (loss) on investments and futures |
168,115,195
|
|
62,022,436
|
|
39,379,272
|
|
12,886,766
|
| Net
increase (decrease) in unrealized appreciation/depreciation on investments and futures |
(186,031,559)
|
|
70,234,904
|
|
(44,907,411)
|
|
7,930,345
|
| Net
increase (decrease) from operations |
(15,277,949)
|
|
136,691,034
|
|
(5,553,061)
|
|
20,939,194
|
| Distributions
to shareholders: |
|
|
|
|
|
|
|
| Total
distributions |
|
|
|
|
|
|
|
| Investment
Class |
(205,273,357)
|
|
(23,406,981)
|
|
(10,884,926)
|
|
(8,735,337)
|
| Service
Class |
(44,930)
|
|
(2,531)
|
|
(1,289,070)
|
|
(1,048,868)
|
| Total
distributions |
(205,318,287)
|
|
(23,409,512)
|
|
(12,173,996)
|
|
(9,784,205)
|
| Increase
(decrease) in assets from operations and distributions |
(220,596,236)
|
|
113,281,522
|
|
(17,727,057)
|
|
11,154,989
|
| Share
transactions: |
|
|
|
|
|
|
|
| Proceeds
from sale of shares |
|
|
|
|
|
|
|
| Investment
Class |
15,780,972
|
|
22,603,685
|
|
618,623
|
|
2,801,546
|
| Service
Class |
20,287
|
|
214,086
|
|
7,554,181
|
|
1,531,472
|
| Value
of distributions reinvested |
|
|
|
|
|
|
|
| Investment
Class |
205,036,339
|
|
23,158,592
|
|
10,884,764
|
|
8,735,201
|
| Service
Class |
44,930
|
|
2,531
|
|
1,289,070
|
|
1,048,868
|
| Cost
of shares redeemed |
|
|
|
|
|
|
|
| Investment
Class |
(396,371,663)
|
|
(48,319,146)
|
|
(68,544,625)
|
|
(10,268,082)
|
| Service
Class |
(150,188)
|
|
(26,642)
|
|
(3,435,029)
|
|
(2,653,742)
|
| Net
increase (decrease) from share transactions |
(175,639,323)
|
|
(2,366,894)
|
|
(51,633,016)
|
|
1,195,263
|
| Total
increase (decrease) in net assets |
(396,235,559)
|
|
110,914,628
|
|
(69,360,073)
|
|
12,350,252
|
| Net
Assets |
|
|
|
|
|
|
|
| Beginning
of year |
572,597,001
|
|
461,682,373
|
|
95,114,861
|
|
82,764,609
|
| End
of year |
$
176,361,442 |
|
$
572,597,001 |
|
$
25,754,788 |
|
$
95,114,861 |
| Changes
in Fund Shares |
|
|
|
|
|
|
|
| Investment
Class |
|
|
|
|
|
|
|
| Shares
sold |
1,252,674
|
|
1,450,198
|
|
57,571
|
|
246,456
|
| Issued
for distributions reinvested |
15,246,073
|
|
1,580,791
|
|
955,642
|
|
846,434
|
| Shares
redeemed |
(31,563,308)
|
|
(2,928,886)
|
|
(6,095,192)
|
|
(874,337)
|
| Net
increase (decrease) in fund shares |
(15,064,561)
|
|
102,103
|
|
(5,081,979)
|
|
218,553
|
| Service
Class |
|
|
|
|
|
|
|
| Shares
sold |
1,529
|
|
11,659
|
|
742,057
|
|
139,140
|
| Issued
for distributions reinvested |
2,917
|
|
158
|
|
117,831
|
|
105,097
|
| Shares
redeemed |
(7,965)
|
|
(1,453)
|
|
(374,515)
|
|
(247,671)
|
| Net
increase (decrease) in fund shares |
(3,519)
|
|
10,364
|
|
485,373
|
|
(3,434)
|
The accompanying Notes are an integral part of these financial
statements.
| 36
|
Statements of Changes
in Net Assets |
State
Street Institutional
Small-Cap Equity Fund |
Year
Ended
September 30,
2022 |
|
Year
Ended
September 30,
2021 |
| |
|
|
| |
|
|
| $
3,208,640 |
|
$
1,263,304 |
| 53,002,585
|
|
189,993,131
|
| (272,121,249)
|
|
248,918,692
|
| (215,910,024)
|
|
440,175,127
|
| |
|
|
| |
|
|
| (192,472,199)
|
|
(36,826,282)
|
| (313,806)
|
|
(53,141)
|
| (192,786,005)
|
|
(36,879,423)
|
| (408,696,029)
|
|
403,295,704
|
| |
|
|
| |
|
|
| 46,621,109
|
|
67,272,135
|
| 168,550
|
|
300,585
|
| |
|
|
| 192,441,993
|
|
36,808,062
|
| 313,806
|
|
53,141
|
| |
|
|
| (193,522,296)
|
|
(171,456,650)
|
| (311,306)
|
|
(699,980)
|
| 45,711,856
|
|
(67,722,707)
|
| (362,984,173)
|
|
335,572,997
|
| |
|
|
| 1,310,488,150
|
|
974,915,153
|
| $
947,503,977 |
|
$
1,310,488,150 |
| |
|
|
| |
|
|
| 2,528,748
|
|
3,105,436
|
| 9,884,026
|
|
1,909,132
|
| (10,440,078)
|
|
(8,531,351)
|
| 1,972,696
|
|
(3,516,783)
|
| |
|
|
| 8,905
|
|
13,863
|
| 16,134
|
|
2,755
|
| (17,329)
|
|
(35,326)
|
| 7,710
|
|
(18,708)
|
The accompanying Notes are an integral part of these financial
statements.
| Statements
of Changes in Net Assets |
37
|
State Street Institutional
Funds
Notes to Financial Statements — September 30,
2022
1.
Organization of the Funds
State Street Institutional Funds (the
“Trust”) is registered under the Investment Company Act of 1940, as amended (the “1940 Act”), as an open-end management investment company. The Trust was organized as a Delaware business trust on May 23, 1997, and is
authorized to issue an unlimited number of shares. It is currently comprised of the following three series (each, a “Fund” and collectively, the “Funds”): State Street Institutional U.S. Equity Fund, State Street
Institutional Premier Growth Equity Fund and State Street Institutional Small-Cap Equity Fund. Each Fund presently offers two classes of shares — the Investment Class and the Service Class. The Trust expects that most of the time, each Fund
will have relatively few shareholders (as compared with most mutual funds), but that these shareholders will invest substantial amounts in a Fund (minimum initial investment requirements are described in the current summary prospectus for each Fund
and in the Funds’ statutory prospectus). Each Fund is a diversified investment company within the meaning of the 1940 Act, except for the State Street Institutional Premier Growth Equity Fund, which is a non-diversified investment
company.
Under the Trust’s
organizational documents, its officers and trustees are indemnified against certain liabilities arising out of the performance of their duties to the Trust. Additionally, in the normal course of business, the Trust enters into contracts with service
providers that contain general indemnification clauses. The Trust’s maximum exposure under these arrangements is unknown as this would involve future claims that may be made against the Trust that have not yet occurred.
2.Summary
of Significant Accounting Policies
The following is a summary of significant
accounting policies followed by the Trust in the preparation of its financial statements:
The preparation of financial statements
in accordance with U.S. generally accepted accounting principles (“U.S. GAAP”) requires management to make estimates and assumptions that affect the reported amounts and disclosures in the financial statements. Actual results could
differ from those estimates. Each Fund is an investment company under U.S. GAAP and follows the accounting and reporting guidance applicable to investment companies.
Security Valuation Each Fund’s investments are valued at fair value each day that the New York Stock Exchange (“NYSE”) is open and, for financial reporting purposes, as of the report date should the reporting period end
on a day that the NYSE is not open. Fair value is generally defined as the price a fund would receive to sell an asset or pay to transfer a liability in an orderly transaction between market participants at the measurement date. By its nature, a
fair value price is a good faith estimate of the valuation in a current sale and may not reflect an actual market price. The investments of each Fund are valued pursuant to the policy and procedures developed by the Oversight Committee (the
“Committee”) and approved by the Board of Trustees of the Trust (the “Board”). The Committee provides oversight of the valuation of investments for the Funds. The Board has responsibility for overseeing the determination of
the fair value of investments.
Valuation techniques used to value each
Fund’s investments by major category are as follows:
| •
|
Equity investments
(including preferred stocks and registered investment companies that are exchange-traded funds) traded on a recognized securities exchange for which market quotations are readily available are valued at the last sale price or official closing price,
as applicable, on the primary market or exchange on which they trade. Equity investments traded on a recognized exchange for which there were no sales on that day are valued at the last published sale price or at fair value. |
| •
|
Investments
in registered investment companies (including money market funds) or other unitized pooled investment vehicles that are not traded on an exchange are valued at that day’s published net asset value (“NAV”) per share or unit.
|
| 38
|
Notes to Financial
Statements |
State Street Institutional
Funds
Notes to Financial Statements, continued —
September 30, 2022
| •
|
Exchange-traded futures
contracts are valued at the closing settlement price on the primary market on which they are traded most extensively. Exchange-traded futures contracts traded on a recognized exchange for which there were no sales on that day are valued at the last
reported sale price obtained from independent pricing services or brokers or at fair value. |
In the event prices or quotations are
not readily available or that the application of these valuation methods results in a price for an investment that is deemed to be not representative of the fair value of such investment, fair value will be determined in good faith by the Committee,
in accordance with the valuation policy and procedures approved by the Board.
The Funds value their assets and
liabilities at fair value using a fair value hierarchy consisting of three broad levels that prioritize the inputs to valuation techniques giving the highest priority to readily available unadjusted quoted prices in active markets for identical
assets or liabilities (Level 1 measurements) and the lowest priority to unobservable inputs (Level 3 measurements) when market prices are not readily available or reliable. The categorization of a value determined for an investment within the
hierarchy is based upon the pricing transparency of the investment and is not necessarily an indication of the risk associated with investing in it.
The three levels of the fair value
hierarchy are as follows:
| •
|
Level 1 — Unadjusted
quoted prices in active markets for an identical asset or liability; |
| •
|
Level 2 — Inputs
other than quoted prices included within Level 1 that are observable for the asset or liability either directly or indirectly, including quoted prices for similar assets or liabilities in active markets, quoted prices for identical or similar assets
or liabilities in markets that are not considered to be active, inputs other than quoted prices that are observable for the asset or liability (such as exchange rates, financing terms, interest rates, yield curves, volatilities, prepayment speeds,
loss severities, credit risks and default rates) or other market-corroborated inputs; and |
| •
|
Level 3
— Unobservable inputs for the asset or liability, including the Committee’s assumptions used in determining the fair value of investments. |
The value of each Fund’s investments
according to the fair value hierarchy as of September 30, 2022 is disclosed in each Fund’s Schedule of Investments.
Investment Transactions and Income
Recognition Investment transactions are accounted for on trade date for financial reporting purposes. Realized gains and losses from the sale or disposition of investments and foreign exchange transactions, if any,
are determined using the identified cost method.
Dividend income and capital gain
distributions, if any, are recognized on the ex-dividend date, net of any foreign taxes withheld at source, if any.
Interest income is recorded daily on an
accrual basis. All premiums and discounts are amortized/accreted for financial reporting purposes.
Non-cash dividends received in the form of
stock are recorded as dividend income at fair value.
Distributions received by the Funds may
include a return of capital that is estimated by management. Such amounts are recorded as a reduction of the cost of investments or reclassified to capital gains.
Certain Funds invest in Real Estate
Investment Trusts (“REITs”). REITs determine the tax character of their distributions annually and may characterize a portion of their distributions as a return of capital or capital gain. The Funds’ policy is to record all REIT
distributions initially as dividend income and re-designate a portion of the capital or capital gains distributions at year end based on information provided by the REIT and/or SSGA Funds Management, Inc.'s (the "Adviser" or "SSGA FM") estimates of
such redesignations for which actual information has not yet been reported.
Expenses
Each Fund pays a “unitary fee” to SSGA FM equivalent to the Fund’s advisory and administration fee. This fee includes all operating expenses payable by each Fund, except for fees and expenses associated with the
| Notes
to Financial Statements |
39
|
State Street Institutional
Funds
Notes to Financial Statements, continued —
September 30, 2022
Trust’s independent Trustees, shareholder
servicing and distribution (12b-1) fees, brokerage fees and commissions, and expenses that are not normal operating expenses of the Fund (such as extraordinary expenses, interest and taxes).
Foreign Currency Translation The accounting records of the Funds are maintained in U.S. dollars. Foreign currencies as well as investment securities and other assets and liabilities denominated in a foreign currency are translated to U.S. dollars
using exchange rates at period end. Purchases and sales of securities, income receipts and expense payments denominated in foreign currencies are translated into U.S. dollars at the prevailing exchange rate on the respective dates of the
transactions.
The effects
of exchange rate fluctuations on investments are included with the net realized and unrealized gain (loss) on investment securities. Other foreign currency transactions resulting in realized and unrealized gain (loss) are disclosed separately.
Foreign Taxes The Funds may be subject to foreign taxes (a portion of which may be reclaimable) on income, stock dividends, realized and unrealized capital gains on investments or certain foreign currency transactions. Foreign taxes
are recorded in accordance with SSGA FM’s understanding of the applicable foreign tax regulations and rates that exist in the foreign jurisdictions in which the Funds invest. These foreign taxes, if any, are paid by the Funds and are reflected
in the Statements of Operations, if applicable. Foreign taxes payable or deferred as of September 30, 2022, if any, are disclosed in the Funds’ Statements of Assets and Liabilities.
Distributions Distributions from net investment income, if any, are declared and paid annually for all Funds.
Net realized capital gains, if any, are
distributed annually, unless additional distributions are required for compliance with applicable tax regulations. The amount and character of income and capital gains to be distributed are determined in accordance with applicable tax regulations
which may differ from net investment income and realized gains recognized for U.S. GAAP purposes.
3.Derivative
Financial Instruments
Futures
Contracts Each Fund may enter into futures contracts to meet the Fund’s objectives. A futures contract is a standardized, exchange-traded agreement to buy or sell a financial instrument at a set price on a
future date. Upon entering into a futures contract, the Fund is required to deposit with the broker, cash or securities in an amount equal to the minimum initial margin requirements of the clearing house. Securities deposited, if any, are designated
on the Schedules of Investments and cash deposited, if any, is included in the Net cash collateral on deposit with broker for future contracts on the Statement of Assets and Liabilities. Subsequent payments are made or received by a Fund equal to
the daily change in the contract value, accumulated, exchange rates, and or other transactional fees. The accumulation of those payments are recorded as variation margin receivable or payable with a corresponding offset to unrealized gains or
losses. A Fund recognizes a realized gain or loss when the contract is closed.
Losses may arise if the value of a
futures contract decreases due to unfavorable changes in the market rates or values of the underlying instrument during the term of the contract or if the counterparty does not perform under the contract. The use of futures contracts also involves
the risk that the movements in the price of the futures contracts do not correlate with the movement of the assets underlying such contracts. For the fiscal year ended September 30, 2022, the following Funds entered into futures contracts for
strategies listed below:
| Fund
|
Strategies
|
| State
Street Institutional U.S. Equity Fund |
Equitization
of Cash |
| State
Street Institutional Premier Growth Equity Fund |
Equitization
of Cash |
| State
Street Institutional Small-Cap Equity Fund |
Equitization
of Cash |
| 40
|
Notes to Financial
Statements |
State Street Institutional
Funds
Notes to Financial Statements, continued —
September 30, 2022
The following tables summarize the value
of the Funds’ derivative instruments as of September 30, 2022 and the related location in the accompanying Statements of Assets and Liabilities and Statements of Operations, presented by primary underlying risk exposure:
| Liability
Derivatives |
| |
Interest
Rate
Risk |
Foreign
Exchange
Risk |
Credit
Risk |
Equity
Risk |
Commodity
Risk |
Total
|
| State
Street Institutional U.S. Equity Fund |
|
|
|
|
|
|
| Futures
Contracts |
$
— |
$
— |
$
— |
(541,694)
|
$
— |
$
(541,694) |
| State
Street Institutional Premier Growth Equity Fund |
|
|
|
|
|
|
| Futures
Contracts |
$
— |
$
— |
$
— |
$
(6,487) |
$
— |
$
(6,487) |
| State
Street Institutional Small-Cap Equity Fund |
|
|
|
|
|
|
| Futures
Contracts |
$
— |
$
— |
$
— |
(1,045,785)
|
$
— |
$
(1,045,785) |
| Realized
Gain/Loss |
| |
Interest
Rate
Risk |
Foreign
Exchange
Risk |
Credit
Risk |
Equity
Risk |
Commodity
Risk |
Total
|
| State
Street Institutional U.S. Equity Fund |
|
|
|
|
|
|
| Futures
Contracts |
$
— |
$
— |
$
— |
(200,960)
|
$
— |
$
(200,960) |
| State
Street Institutional Premier Growth Equity Fund |
|
|
|
|
|
|
| Futures
Contracts |
$
— |
$
— |
$
— |
$
(30,137) |
$
— |
$
(30,137) |
| State
Street Institutional Small-Cap Equity Fund |
|
|
|
|
|
|
| Futures
Contracts |
$
— |
$
— |
$
— |
(4,418,599)
|
$
— |
$
(4,418,599) |
| Net
Change in Unrealized Appreciation (Depreciation) |
| |
Interest
Rate
Risk |
Foreign
Exchange
Risk |
Credit
Risk |
Equity
Risk |
Commodity
Risk |
Total
|
| State
Street Institutional U.S. Equity Fund |
|
|
|
|
|
|
| Futures
Contracts |
$
— |
$
— |
$
— |
(351,715)
|
$
— |
$
(351,715) |
| State
Street Institutional Premier Growth Equity Fund |
|
|
|
|
|
|
| Futures
Contracts |
$
— |
$
— |
$
— |
$
49,132 |
$
— |
$
49,132 |
| State
Street Institutional Small-Cap Equity Fund |
|
|
|
|
|
|
| Futures
Contracts |
$
— |
$
— |
$
— |
(896,638)
|
$
— |
$
(896,638) |
| Notes
to Financial Statements |
41
|
State Street Institutional
Funds
Notes to Financial Statements, continued —
September 30, 2022
4.Fees
and Transactions with Affiliates
Advisory Fee SSGA FM, a registered investment adviser, was retained by the Board to act as investment adviser and administrator of each Fund. SSGA FM’s compensation for investment advisory and administrative services
(“Management Fee”) is paid monthly based on the average daily net assets of each Fund. The Management Fee is stated in the following schedule:
| Fund
|
Average
Daily
Net Assets of the Fund |
Management
Fee |
| State
Street Institutional U.S. Equity Fund |
First
$25 million |
0.55%
|
| |
Next
$25 million |
0.45%
|
| |
Over
$50 million |
0.35%
|
| State
Street Institutional Premier Growth Equity Fund |
First
$25 million |
0.55%
|
| |
Next
$25 million |
0.45%
|
| |
Over
$50 million |
0.35%
|
| State
Street Institutional Small-Cap Equity Fund |
First
$250 million |
0.95%
|
| |
Next
$250 million |
0.90%
|
| |
Over
$500 million |
0.85%
|
Each
Fund’s Management Fee is a “unitary” fee that includes all operating expenses payable by the Fund, except for fees and expenses associated with the independent Trustees, shareholder servicing and distribution (12b-1) fees,
brokerage fees and commissions, and expenses that are not normal operating expenses of the Fund (such as extraordinary expenses, interest and taxes).
Effective January 1, 2022, SSGA FM is
contractually obligated until January 31, 2023 (i) to waive up to the full amount of the advisory fee payable by the State Street Institutional Small-Cap Equity Fund, and/or (ii) to reimburse the State Street Institutional Small-Cap Equity Fund for
expenses to the extent that total annual fund operating expenses (exclusive of non-recurring account fees, extraordinary expenses, and certain class specific expenses, such as distribution and shareholder servicing) exceed 0.75% of average daily net
assets on an annual basis. This fee waiver and/or expense reimbursement arrangement may not be terminated prior to January 31, 2023 except with approval of the Board. For the year ended September 30, 2022, fees waived and expenses reimbursed by the
Adviser, pursuant to this agreement, were $1,131,707.
Distribution and Shareholder Servicing
Fees The Funds have adopted a Shareholder Servicing and Distribution Plan (the “Plan”) pursuant to Rule 12b-1 under the 1940 Act with respect to the Service Class shares of each Fund. Each Fund pays
State Street Global Advisors Funds Distributors, LLC (“SSGA FD”), the Funds' principal underwriter, a monthly fee for distribution and/or shareholder services provided, at an annual rate of 0.25% of the average daily net assets of such
Fund attributable to the Service Class shares. Currently, Investment Class shares are not subject to a 12b-1 fee.
Due to Custodian In certain circumstances, the Funds may have cash overdrafts with the custodian due to expense payments, capital transactions, trading of securities, investment operations or derivative transactions. The Due to
Custodian amount, if any, reflects cash overdrawn with State Street as custodian, who is an affiliate of the Funds.
Other Transactions with Affiliates The Funds may invest in affiliated entities, including securities issued by State Street Corporation, affiliated funds, or entities deemed to be affiliates as a result of the Funds owning more than five percent of the
entity’s voting securities or outstanding shares. Amounts relating to these transactions during the fiscal year ended September 30, 2022 are disclosed in the Schedules of Investments.
5.Sub-Advisory
Fees
Pursuant to investment
sub-advisory agreements with SSGA FM, the assets of the State Street Institutional Small-Cap Equity Fund are allocated to and managed by each of the following sub-advisers: (i) Palisade Capital Management, L.L.C.; (ii) Champlain Investment Partners,
LLC; (iii) Riverbridge Partners LLC (prior to July 15, 2022); (iv) Kennedy Capital Management, Inc.; and (v) SouthernSun Asset Management, LLC. SSGA FM is
| 42
|
Notes to Financial
Statements |
State Street Institutional
Funds
Notes to Financial Statements, continued —
September 30, 2022
responsible for allocating the State Street
Institutional Small-Cap Equity Fund’s assets among the sub-advisers in its discretion (“Allocated Assets”), and for managing the State Street Institutional Small-Cap Equity Fund’s cash position, while each subadviser is
responsible for the day-to-day management of their portion of the Allocated Assets, under the general supervision and oversight of SSGA FM and the Board. For their services, SSGA FM pays each sub-adviser an investment sub-advisory fee, which is
calculated as a percentage of the average daily net assets of the respective Allocated Assets that it manages.
6.Trustees'
Fees
The fees and expenses of the
trustees who are not “interested persons” of the Trust, as defined in the 1940 Act (“Independent Trustees”) are paid directly by the Funds. The Independent Trustees are reimbursed for travel and other out-of-pocket expenses
in connection with meeting attendance and industry seminars.
7.Investment
Transactions
Purchases and sales of
investments (excluding in-kind transactions, short term investments and derivative contracts) for the fiscal year ended September 30, 2022 were as follows:
| |
Other
Securities |
| Fund
|
Purchases
|
Sales
|
| State
Street Institutional U.S. Equity Fund |
$
97,719,776 |
$473,097,350
|
| State
Street Institutional Premier Growth Equity Fund |
21,520,876
|
84,184,018
|
| State
Street Institutional Small-Cap Equity Fund |
335,846,896
|
487,368,003
|
8.Income Tax Information
The Funds have qualified and
intend to continue to qualify as regulated investment companies under Subchapter M of the Internal Revenue Code of 1986, as amended. Each Fund will not be subject to federal income taxes to the extent it distributes its taxable income, including any
net realized capital gains, for each fiscal year. Therefore, no provision for federal income tax is required.
The Funds file federal and various state
and local tax returns as required. No income tax returns are currently under examination. Generally, the federal returns are subject to examination by the Internal Revenue Service for a period of three years from date of filing, while the state
returns may remain open for an additional year depending upon jurisdiction. SSGA FM has analyzed the Funds' tax positions taken on tax returns for all open years and does not believe there are any uncertain tax positions that would require
recognition of a tax liability.
Distributions to shareholders are
recorded on ex-dividend date. Income dividends and gain distributions are determined in accordance with income tax rules and regulations, which may differ from generally accepted accounting principles.
Certain capital accounts in the
financial statements have been adjusted for permanent book-tax differences. These adjustments have no impact on NAVs or results of operations. Temporary book-tax differences will reverse in the future. These book-tax differences are primarily due to
differing treatments for character of distributions, futures contracts, return of capital adjustments and wash sale loss deferrals.
The tax character of distributions paid
during the year ended September 30, 2022 was as follows:
| Fund
|
Ordinary
Income |
Long-Term
Capital Gains |
Total
|
| State
Street Institutional U.S. Equity Fund |
$
9,994,445 |
$195,323,842
|
$205,318,287
|
| State
Street Institutional Premier Growth Equity Fund |
424,140
|
11,749,856
|
12,173,996
|
| State
Street Institutional Small-Cap Equity Fund |
60,316,849
|
132,469,156
|
192,786,005
|
| Notes
to Financial Statements |
43
|
State Street Institutional
Funds
Notes to Financial Statements, continued —
September 30, 2022
The tax character of distributions paid
during the year ended September 30, 2021 were as follows:
| Fund
|
Ordinary
Income |
Long-Term
Capital Gains |
Total
|
| State
Street Institutional U.S. Equity Fund |
$6,558,470
|
$16,851,042
|
$23,409,512
|
| State
Street Institutional Premier Growth Equity Fund |
374,542
|
9,409,663
|
9,784,205
|
| State
Street Institutional Small-Cap Equity Fund |
4,283,820
|
32,595,603
|
36,879,423
|
At September 30,
2022, the components of distributable earnings on a tax basis were as follows:
| Fund
|
Undistributed
Ordinary
Income |
Tax
Exempt
Income |
Capital
Loss
Carryforwards |
Undistributed
long term
gain |
Net
Unrealized
Gains
(Losses) |
Qualified
Late-Year
Losses |
Total
|
| State
Street Institutional U.S. Equity Fund |
$1,408,209
|
$—
|
$—
|
$25,173,434
|
$
27,676,569 |
$
— |
$
54,258,212 |
| State
Street Institutional Premier Growth Equity Fund |
—
|
—
|
—
|
39,215,083
|
1,322,559
|
(1,131,765)
|
39,405,877
|
| State
Street Institutional Small-Cap Equity Fund |
298,548
|
—
|
—
|
38,769,713
|
102,302,894
|
—
|
141,371,155
|
As of September
30, 2022, gross unrealized appreciation and gross unrealized depreciation of investments and other financial instruments based on cost for federal income tax purposes were as follows:
| Fund
|
Tax
Cost |
Gross
Unrealized
Appreciation |
Gross
Unrealized
Depreciation |
Net
Unrealized
Appreciation
(Depreciation) |
| State
Street Institutional U.S. Equity Fund |
$148,006,329
|
$
41,315,450 |
$13,638,881
|
$
27,676,569 |
| State
Street Institutional Premier Growth Equity Fund |
24,414,474
|
5,308,143
|
3,985,584
|
1,322,559
|
| State
Street Institutional Small-Cap Equity Fund |
845,209,337
|
192,169,785
|
89,866,891
|
102,302,894
|
9.Line of Credit
The Funds and other affiliated funds
(each, a “Participant” and collectively, the “Participants”) have access to $200 million of a $1.275 billion ($1.1 billion prior to October 6, 2022) revolving credit facility provided by a syndication of banks under
which the Participants may borrow to fund shareholder redemptions. This agreement expires in October 2023 unless extended or renewed.
The Participants are charged an annual
commitment fee which is calculated based on the unused portion of the shared credit line. Commitment fees are allocated among each of the Participants based on relative net assets. Commitment fees are ordinary fund operating expenses. A Participant
incurs and pays the interest expense related to its borrowing. Interest is calculated at a rate per annum equal to the sum of 1.00% plus the greater of the New York Fed Bank Rate and the one-month SOFR Rate.
Prior to October 7, 2021, the Funds had
access to $200 million of a $500 million revolving credit facility and interest was calculated at a rate per annum equal to the sum of 1.25% plus the New York Fed Bank Rate.
The Funds had no outstanding loans as of
September 30, 2022.
| 44
|
Notes to Financial
Statements |
State Street Institutional
Funds
Notes to Financial Statements, continued —
September 30, 2022
10.Risks
Concentration Risk As a result of a Fund's ability to invest a large percentage of its assets in obligations of issuers within the same country, state, region, currency or economic sector, an adverse economic, business or political
development may affect the value of a Fund's investments more than if a Fund was more broadly diversified.
Market Risk A Fund’s investments are subject to changes in general economic conditions, and general market fluctuations and the risks inherent in investment in securities markets. Investment markets can be volatile and prices
of investments can change substantially due to various factors including, but not limited to, economic growth or recession, changes in interest rates, changes in the actual or perceived creditworthiness of issuers, and general market liquidity. A
Fund is subject to the risk that geopolitical events will disrupt securities markets and adversely affect global economies and markets. Local, regional or global events such as war, acts of terrorism, the spread of infectious illness or other public
health issues, or other events could have a significant impact on a Fund and its investments.
An outbreak of a respiratory disease
caused by a novel coronavirus (known as COVID-19) first detected in China in December 2019 has spread globally. In an organized attempt to contain and mitigate the effects of the spread of COVID-19, governments and businesses world-wide took and
continue to take aggressive measures, including closing borders, restricting international and domestic travel, and the imposition of prolonged quarantines of large populations. COVID-19 has resulted in and may continue to result in the disruption
of and delays in the delivery of healthcare services and processes, the cancellation of organized events and educational institutions, the disruption of production and supply chains, a decline in consumer demand for certain goods and services, and
general concern and uncertainty, all of which have contributed to increased volatility in global markets. The effects of COVID-19 will likely affect certain sectors and industries more dramatically than others, which may adversely affect the value
of a Fund’s investments in those sectors or industries. COVID-19, and other epidemics and pandemics that may arise in the future, could adversely affect the economies of many nations, the global economy, individual companies and capital
markets in ways that cannot be foreseen at the present time. In addition, the impact of infectious diseases in developing or emerging market countries may be greater due to limited health care resources. Political, economic and social stresses
caused by COVID-19 also may exacerbate other pre-existing political, social and economic risks in certain countries. The duration of COVID-19 and its effects cannot be determined at this time, but the effects could be present for an extended period
of time.
11.Subsequent Events
Management has evaluated the impact of
all subsequent events on the Funds through the date on which the financial statements were available to be issued and has determined that there were no subsequent events requiring adjustment or disclosure in the financial statements.
| Notes
to Financial Statements |
45
|
State Street Institutional
Funds
Report of Independent Registered Public Accounting
Firm
To the Shareholders and Board of Trustees of State Street
Institutional Funds:
Opinion on the Financial
Statements
We have audited the accompanying
statements of assets and liabilities of State Street Institutional Funds (the “Trust”) (comprising State Street Institutional U.S. Equity Fund, State Street Institutional Premier Growth Equity Fund and State Street Institutional
Small-Cap Equity Fund (collectively referred to as the “Funds”)), including the schedules of investments, as of September 30, 2022, and the related statements of operations for the year then ended, the statements of changes in net assets
for each of the two years in the period then ended, the financial highlights for each of the five years in the period then ended and the related notes (collectively referred to as the “financial statements”). In our opinion, the
financial statements present fairly, in all material respects, the financial position of each of the Funds comprising State Street Institutional Funds at September 30, 2022, the results of their operations for the year then ended, the changes in net
assets for each of the two years in the period then ended and their financial highlights for each of the five years in the period then ended, in conformity with U.S. generally accepted accounting principles.
Basis for Opinion
These financial statements are the responsibility of the
Trust’s management. Our responsibility is to express an opinion on the Funds’ financial statements based on our audits. We are a public accounting firm registered with the Public Company Accounting Oversight Board (United States)
(“PCAOB”) and are required to be independent with respect to the Trust in accordance with the U.S. federal securities laws and the applicable rules and regulations of the Securities and Exchange Commission and the PCAOB.
We conducted our audits in accordance with the standards of
the PCAOB. Those standards require that we plan and perform the audit to obtain reasonable assurance about whether the financial statements are free of material misstatement, whether due to error or fraud. The Trust is not required to have, nor were
we engaged to perform, an audit of the Trust’s internal control over financial reporting. As part of our audits we are required to obtain an understanding of internal control over financial reporting, but not for the purpose of expressing an
opinion on the effectiveness of the Trust’s internal control over financial reporting. Accordingly, we express no such opinion.
Our audits included performing procedures to assess the
risks of material misstatement of the financial statements, whether due to error or fraud, and performing procedures that respond to those risks. Such procedures included examining, on a test basis, evidence regarding the amounts and disclosures in
the financial statements. Our procedures included confirmation of securities owned as of September 30, 2022, by correspondence with the custodian, brokers and others; when replies were not received from brokers and others, we performed other
auditing procedures. Our audits also included evaluating the accounting principles used and significant estimates made by management, as well as evaluating the overall presentation of the financial statements. We believe that our audits provide a
reasonable basis for our opinion.
We have served as
the auditor of one or more State Street Global Advisors investment companies since 2000.
Boston, Massachusetts
November 23, 2022
| 46
|
Report of Independent
Registered Public Accounting Firm |
State Street Institutional
Funds
Other Information — September 30, 2022
(Unaudited)
Tax Information
For federal income tax purposes, the following information is
furnished with respect to the distributions of the Trust for its fiscal year ended September 30, 2022.
Dividends Received Deduction
Each Fund reports the maximum amount allowable of its net
taxable income as eligible for the corporate dividends received deduction.
Qualified Business Income Deduction
Each Fund reports the maximum amount allowable of qualified
REIT dividends eligible for the qualified business income deduction under Section 199A.
Qualified Dividend Income
A portion of dividends distributed by the Funds during the
fiscal year ended September 30, 2022 is considered qualified dividend income and are eligible for reduced tax rates. Each Fund reports the maximum amount allowable of its net taxable income as qualified dividend income as provided in the Jobs and
Growth Tax Relief Reconciliation Act of 2003.
Long Term
Capital Gains Distributions
Long term capital gain
dividends were paid from the Funds during the year ended September 30, 2022:
| |
Amount
|
| State
Street Institutional U.S. Equity Fund |
$195,323,842
|
| State
Street Institutional Premier Growth Equity Fund |
11,749,856
|
| State
Street Institutional Small-Cap Equity Fund |
132,469,156
|
Proxy Voting Policies and Procedures
and Record
The Funds have adopted the proxy voting
policies of the Adviser. A description of the Funds' proxy voting policies and procedures that are used by the Funds' Adviser to vote proxies relating to Funds' portfolio of securities are available (i) without charge, upon request, by calling
1-800-242-0134 (toll free) and (ii) on the SEC’s website at www.sec.gov. Information regarding how the Funds voted for the prior 12-months period ended June 30 is available by August 31 of each year by
calling the same number and on the SEC's website, at www.sec.gov, and on the Funds' website at www.ssga.com.
Quarterly Portfolio Schedule
Following the Funds' first and third fiscal quarter-ends,
complete Schedules of Investments are filed with the SEC as an exhibit on Form N-PORT, which can be found on the SEC’s website at www.sec.gov and on the Funds' website at
www.ssga.com. The Funds' Schedules of Investments are available upon request, without charge, by calling 1-800-242-0134 (toll free).
State Street Institutional
Funds
Other Information, continued — September 30,
2022 (Unaudited)
TRUSTEE CONSIDERATIONS IN APPROVING CONTINUATION OF INVESTMENT
ADVISORY AND SUB-ADVISORY AGREEMENTS 1
Overview of the
Contract Review Process
Under the Investment
Company Act of 1940, as amended (the “1940 Act”), an investment advisory agreement between a mutual fund and its investment adviser may continue in effect from year to year only if its continuance is approved at least annually by the
fund’s board of trustees or its shareholders, and by a vote of a majority of those trustees who are not “interested persons” of the fund (the “Independent Trustees”) cast in person at a meeting called for the purpose of
considering such approval.
Consistent with these
requirements, the Board of Trustees (the “Board”) of the State Street Institutional Funds (the “Trust”) met in person on April 6, 2022 and May 11-12, 2022, including in executive sessions attended by the Independent Trustees,
to consider a proposal to approve, with respect to each portfolio series of the Trust (each, a “Fund” and collectively, the “Funds”), the continuation of the investment advisory agreement (the “Advisory
Agreement”) with SSGA Funds Management, Inc. (“SSGA FM” or the “Adviser”), and the sub-advisory agreements (each, a “Sub-Advisory Agreement” and, together with the Advisory Agreement, the
“Agreements”) by and among SSGA FM, the Trust on behalf of the State Street Institutional Small-Cap Equity Fund (the “Institutional Small-Cap Equity Fund”), and each of Champlain Investment Partners, LLC, Kennedy Capital
Management, Inc., Palisade Capital Management, LLC and SouthernSun Asset Management, LLC (collectively, the “Sub-Advisers”). Prior to voting on the proposal, the Independent Trustees, as well as the Trustee who is an “interested
person” of the Adviser, reviewed information furnished by the Adviser and Sub-Advisers and others reasonably necessary to permit the Board to evaluate the proposal fully. The Independent Trustees were separately represented by counsel
who are independent of the Adviser and Sub-Advisers (“Independent Counsel”) in connection with their consideration of approval of the Agreements. Following the April 6, 2022 meeting, the Independent Trustees submitted questions and
requests for additional information to management, and considered management’s responses thereto prior to and at the May 11-12, 2022 meeting. The Independent Trustees considered, among other things, the following:
Information about
Performance, Expenses and Fees
| •
|
A report prepared by an
independent third-party provider of investment company data, which includes for each Fund: |
| ○
|
Comparisons of the
Fund’s performance over the past one-, three-, five- and ten-year periods ended December 31, 2021, to the performance of an appropriate benchmark constructed by Broadridge Financial Solutions, Inc. (“Broadridge”) for the Fund (the
“Lipper Index”) and/or a universe of other mutual funds with similar investment objectives and policies (the “Performance Group” and/or the “Performance Universe”); |
______________________________________________
1The Independent Trustees have identified numerous relevant issues, factors and concerns ("issues, factors and concerns") that they consider each
year in connection with the proposed continuation of the advisory and sub-advisory agreements, the administration agreement, the distribution plans, the distribution agreement and various related-party service agreements (the "annual review
process"). The statement of issues, factors and concerns and the related conclusions of the Independent Trustees may not change substantially from year to year. However, the information requested by, and provided to, the Independent
Trustees with respect to the issues, factors and concerns and on which their conclusions are based is updated annually and, in some cases, may differ substantially from the previous year. The Independent Trustees schedule annually a separate
in-person meeting that is dedicated to the annual review process (the "special meeting"). At the special meeting and throughout the annual review process, the Independent Trustees take a fresh look at each of the issues, factors and concerns
in light of the latest available information and each year present one or more sets of comments and questions to management with respect to specific issues, factors and concerns. Management responds to such comments and questions to the
satisfaction of the Independent Trustees before the annual review process is completed and prior to the Independent Trustees voting on proposals to approve continuation of the agreements and plans.
State Street Institutional
Funds
Other Information, continued — September 30,
2022 (Unaudited)
| ○
|
Comparisons of the
Fund’s expense ratio (with detail of component expenses) to the expense ratios of a group of comparable mutual funds selected by the independent third-party data provider (the “Expense Group” and/or “Expense Universe”);
|
| ○
|
A chart showing the
Fund’s historical average net assets relative to its total expenses, management fees, and non-management expenses over the past five calendar years; and |
| ○
|
Comparisons
of the Fund’s contractual management fee to the contractual management fees of comparable mutual funds at different asset levels. |
| •
|
Comparative information
concerning fees charged by the Adviser and Sub-Advisers for managing institutional accounts using investment strategies and techniques similar to those used in managing the Funds, as applicable; and |
| •
|
Profitability analyses for
(a) the Adviser and Sub-Advisers with respect to each applicable Fund and (b) affiliates of SSGA FM that provide services to the Funds (“Affiliated Service Providers”). |
Information about
Portfolio Management
| •
|
Descriptions of the
investment management services provided by the Adviser and Sub-Advisers, including their investment strategies and processes; |
| •
|
Information concerning the
allocation of brokerage; and |
| •
|
Information regarding the
procedures and processes used to value the assets of the Funds. |
Information about the
Adviser and Sub-Advisers
| •
|
Reports detailing the
financial results and condition of SSGA FM and its affiliates, as well as of the Sub-Advisers; |
| •
|
Descriptions of the
qualifications, education and experience of the individual investment and other professionals responsible for managing the portfolios of the Funds and for Fund operations; |
| •
|
Information relating to
compliance with and the administration of the Codes of Ethics adopted by the Adviser and Sub-Advisers; |
| •
|
Information about the
Adviser’s and each Sub-Adviser’s proxy voting policies and procedures and information regarding the Adviser’s and each Sub-Adviser’s practices for overseeing proxy vendors; |
| •
|
Information concerning
the resources devoted by the Adviser and Sub-Advisers to overseeing compliance by the Funds and their service providers, including information concerning compliance with investment policies and restrictions and other operating policies of the Funds;
|
| •
|
A description of the
adequacy and sophistication of the Adviser’s and Sub-Advisers’ technology and systems with respect to investment and administrative matters and a description of any material improvements or changes in technology or systems in the past
year; |
| •
|
A description of the business
continuity and disaster recovery plans of the Adviser and Sub-Advisers; and |
| •
|
Information regarding the
Adviser’s and Sub-Advisers’ risk management processes. |
Other Relevant
Information
| •
|
Information concerning the
nature, extent, quality and cost of services provided to the Funds by SSGA FM in its capacity as the Fund’s administrator (the “Administrator”); |
| •
|
Information concerning
the nature, extent, quality and cost of various non-investment management services provided to the Funds by affiliates of the Adviser, including the custodian, sub-administrator and fund accountant of the Funds, as applicable, and the role of the
Adviser in managing the Funds’ relationship with these service providers; |
State Street Institutional
Funds
Other Information, continued — September 30,
2022 (Unaudited)
| •
|
Copies of the Advisory
Agreement and Sub-Advisory Agreements and agreements with other service providers of the Funds; |
| •
|
Responses to a request for
information reviewed prior to the April 6, 2022 and May 11-12 meetings by Independent Counsel, requesting specific information from each of: |
| ○
|
SSGA FM, in its capacity
as the Funds’ Adviser and Administrator, with respect to its operations relating to the Funds and its approximate profit margins from such operations for the calendar year ended December 31, 2021; and the relevant operations of other
Affiliated Service Providers to the Funds, together with their approximate profit margins from such relevant operations for the calendar year ended December 31, 2021; |
| ○
|
The Sub-Advisers, with
respect to their operations relating to the Institutional Small-Cap Equity Fund and their approximate profitability from such operations for the calendar year ended December 31, 2021; |
| ○
|
State Street Bank and Trust
Company (“State Street”), the sub-administrator, custodian, and fund accountant for the Funds, with respect to its operations relating to the Funds; and |
| ○
|
State
Street Global Advisors Funds Distributors, LLC, the principal underwriter and distributor of the shares of the Funds (the “Distributor”), with respect to its operations relating to the Funds, together with the Funds’ related
distribution plans and arrangements under Rule 12b-1 of the 1940 Act; |
| •
|
Information from SSGA FM,
State Street, the Distributor and the Sub-Advisers with respect to the Funds, as applicable, providing any material changes to the previous information supplied in response to the letter from Independent Counsel prior to the executive session of the
Board on May 11-12, 2022; and |
| •
|
Materials provided by
Broadridge, circulated to the Independent Trustees and to Independent Counsel. |
In addition to the information identified above, the Board
considered information provided from time to time by the Adviser and Sub-Advisers, and other service providers of the Funds throughout the year at meetings of the Board and its committees. At such meetings, the Trustees received, among other
things, presentations by the portfolio managers and other investment professionals of the Adviser and Sub-Advisers relating to the performance of the Funds, as applicable, and the investment strategies used in pursuing each Fund’s investment
objective.
The Independent Trustees were assisted
throughout the contract review process by their Independent Counsel. The Independent Trustees relied upon the advice of such counsel and their own business judgment in determining the material factors to be considered in evaluating the
Agreements, and the weight to be given to each such factor. The conclusions reached with respect to the Agreements were based on a comprehensive evaluation of all the information provided and not any single factor. Moreover, each Trustee
may have placed varying emphasis on particular factors in reaching conclusions with respect to each Fund.
Results of the
Process
Based on a consideration of the
foregoing and such other information as deemed relevant, including the factors and conclusions described below, at the meeting held on May 11-12, 2022 the Board, including a majority of the Independent Trustees, voted to approve the continuation of
the Agreements effective June 1, 2022, for an additional year with respect to all Funds.
Nature, Extent and
Quality of Services
In considering whether to
approve the Agreements, the Board evaluated the nature, extent and quality of services provided to each applicable Fund by the Adviser and Sub-Advisers.
The Board considered the Adviser’s management
capabilities and investment process with respect to the types of investments held by each Fund, including the education, experience and number of investment professionals and other personnel who provide portfolio management, investment research, and
similar services to the Fund. The Board evaluated, where relevant, the abilities and experience of such investment personnel in analyzing particular markets, industries and specific issuers of securities in these markets and industries.
The Board also considered the substantial expertise of the Adviser in developing and applying proprietary quantitative models for managing various Funds that
State Street Institutional
Funds
Other Information, continued — September 30,
2022 (Unaudited)
invest primarily in equity securities. With respect to those Funds
that invest primarily in fixed-income securities, the Board considered the extensive experience and resources committed by the Adviser to the evaluation of a portfolio’s quality distribution and sector and interest rate exposure. For the
Institutional Small-Cap Equity Fund, the Board considered the Adviser’s process used for overseeing multiple sub-advisers. The Board considered the extensive experience and resources committed by the Adviser to risk management, including with
respect to investment risk, liquidity risk, operational risk, counterparty risk and model risk. Further, the Board considered material enhancements made to the risk management processes and systems over the past year. The Trustees also
considered the significant risks assumed by the Adviser in connection with the services provided to the Funds, including reputational and entrepreneurial risks. The Board also took into account the compensation paid to recruit and retain investment
personnel, and the time and attention devoted to the Funds by senior management, as well as the Adviser’s succession planning process.
The Board had previously reviewed the compliance programs
of SSGA FM and various Affiliated Service Providers. Among other things, the Board considered compliance and reporting matters relating to personal trading by investment personnel, selective disclosure of portfolio holdings, late trading, frequent
trading, portfolio valuation, business continuity, the allocation of investment opportunities and the voting of proxies. The Board also considered the performance of certain portions of the business continuity plan which have been invoked in
response to the COVID-19 pandemic.
In connection with
their consideration of the services provided by each of the Sub-Advisers, the Board considered each Sub-Adviser’s attributes relating to its investment philosophy oriented toward long-term performance, its process for selecting investments,
its experienced professionals, access to significant technological resources and a favorable history and reputation. The Board also considered the review process undertaken by SSGA FM and SSGA FM’s favorable assessment of the nature and
quality of the investment sub-advisory services provided by each Sub-Adviser to the Institutional Small-Cap Equity Fund. The Board also considered the Institutional Small-Cap Equity Fund’s multi-manager structure and how each
Sub-Adviser’s approach to small-cap investing fits within the Institutional Small-Cap Equity Fund’s overall strategy.
On the basis of the foregoing and other relevant
information, the Board concluded that the Adviser and each Sub-Adviser can be expected to continue to provide high quality investment management and related services for the Funds.
Fund
Performance
The Board compared each
Fund’s investment performance to the performance of an appropriate benchmark and universe of comparable mutual funds for various time periods ended December 31, 2021. For purposes of these comparisons the Independent Trustees relied
extensively on the Performance Group, Performance Universe and Lipper Index and the analyses of the related data provided by Broadridge. Among other information, the Board considered the following performance information in its evaluation of each
Fund:
State Street Institutional Premier Growth
Equity Fund. The Board considered that the Fund’s performance was above the medians of its Performance Group and Performance Universe for the 1-, 3-, 5- and 10-year periods. The Board also
considered that the Fund’s performance was above its Lipper Index for the 1-, 3- and 10-year periods and was below its Lipper Index for the 5-year period.
State Street Institutional U.S. Equity Fund. The Board considered that the Fund’s performance was below the medians of its Performance Group and Performance Universe for the 1-year period and was above the medians of its Performance Group and
Performance Universe for the 3-, 5- and 10-year periods. The Board also considered that the Fund’s performance was above its Lipper Index for the 1-, 3-, 5- and 10-year periods.
State Street Institutional Small-Cap Equity Fund. The Board considered that the Fund’s performance was below the median of its Performance Group for the 1-year period, was above the median of its Performance Group for the 3- and 5-year periods, and was
equal to the median of its Performance Group for the 10-year period. The Board also considered that the Fund’s performance was below the median of its Performance Universe for the 1-year period and was above the median of its Performance
Universe for the 3-, 5- and 10-year periods. The Board also considered that
State Street Institutional
Funds
Other Information, continued — September 30,
2022 (Unaudited)
the Fund’s performance was below its Lipper Index for the 1-year
period and was above its Lipper Index for the 3-, 5- and 10-year periods. The Board took into account management’s discussion of the Fund’s performance, including its strong long-term performance.
On the basis of the foregoing and other relevant information,
the Board concluded that the performance of each Fund is satisfactory or is being appropriately monitored and/or addressed by management.
Management Fees and
Expenses
The Board reviewed the contractual
investment advisory fee rates payable by each Fund and actual fees paid by each Fund, net of waivers, if any, as well as the fees paid to each of the Sub-Advisers by the Adviser, which reduced the net management fees retained by the Adviser. For the
Institutional Small-Cap Equity Fund, the Board also reviewed (i) the allocation of the total advisory fees between SSGA FM and the Sub-Advisers, and (ii) the services required of SSGA FM to oversee the Sub-Advisers for those services. As part of its
review, the Board considered each Fund’s management fee and total expense ratio, including the portion attributable to administrative services provided by SSGA FM (both before and after giving effect to any expense caps), as compared to its
Expense Group and Expense Universe, as constructed by Broadridge, and the related Broadridge analysis for each of the Funds. The Board also considered the comparability of the fees charged and the services provided to each Fund by the Adviser
and Sub-Advisers to the fees charged and services provided to other clients of the Adviser and Sub-Advisers, including institutional accounts, as applicable. In addition, the Board considered the willingness of the Adviser to provide
undertakings from time to time to waive fees or pay expenses of certain Funds to limit the total expenses borne by shareholders of such Funds. SSGA FM reviewed with the Board the Funds’ unitary fee structure where SSGA FM (and not the Funds)
bears most of the Funds’ operating expenses, therefore affecting SSGA FM’s profitability. The Board also considered that the sub-advisory fees are paid by the Adviser out of its advisory fees it receives from the Funds and are not paid
by the Funds. Among other information, the Board considered the following expense information in its evaluation of each Fund:
State Street Institutional Premier Growth Equity Fund. The Board considered that the Fund’s actual management fee was below the medians of its Expense Group and Expense Universe. The Board also considered that the Fund’s total expenses were below the
medians of its Expense Group and Expense Universe.
State Street Institutional U.S. Equity Fund. The Board considered that the Fund’s actual management fee was below the medians of its Expense Group and Expense Universe. The Board also considered that the Fund’s total expenses were below the
medians of its Expense Group and Expense Universe.
State Street Institutional Small-Cap Equity Fund. The Board considered that the Fund’s actual management fee was above the medians of its Expense Group and Expense Universe. The Board also considered that the Fund’s total expenses were above the
median of its Expense Group and below the median of its Expense Universe. The Board considered management’s discussion of the Fund’s expenses.
On the basis of the foregoing and other relevant
information, and in light of the nature, extent and quality of the services provided by the Adviser and Sub-Advisers, the Board concluded that the fees and the expense ratio of each Fund compare favorably to the fees and expenses of the Expense
Group and Expense Universe and are reasonable in relation to the services provided.
Profitability
The Board reviewed the level of profits realized by the
Adviser and its affiliates and the Sub-Advisers in providing investment advisory and other services to each applicable Fund and to all funds within the fund complex. The Board considered other direct and indirect benefits received by SSGA FM
and Affiliated Service Providers and the Sub-Advisers in connection with their relationships with the applicable Funds, including, where applicable, soft dollar commission benefits generated through Fund portfolio transactions. The Board
further considered the profitability of each of the Affiliated Service Providers with respect to their services to the Funds and/or fund complex. The Board also considered the various risks borne by SSGA FM and State Street in connection with their
various roles in servicing the Funds, including reputational and entrepreneurial risks.
State Street Institutional
Funds
Other Information, continued — September 30,
2022 (Unaudited)
The Board concluded that the profitability of the Adviser
with respect to the Funds, and the profitability range of each of the Affiliated Service Providers with respect to its services to the Funds, were reasonable in relation to the services provided.
The Board also considered that the sub-advisory fee rate
under each Sub-Advisory Agreement was negotiated with each Sub-Adviser at arm’s length. In considering the profitability to each Sub-Adviser in connection with its relationship to the applicable Fund, the Trustees noted that the fees under the
Sub-Advisory Agreement are paid by the Adviser out of the advisory fees that the Adviser receives from the Fund. For these reasons, the Board concluded that the profitability of each Sub-Adviser from its relationship with the Fund was not
material to their deliberations with respect to the consideration of approval of the applicable Sub-Advisory Agreement.
Economies of
Scale
In reviewing management fees and
profitability, the Board also considered the extent to which the Adviser and its affiliates, on the one hand, and each Fund and all Funds as a group, on the other hand, can expect to realize benefits from economies of scale as the assets of the
Funds increase. The Board acknowledged the difficulty in accurately measuring the benefits resulting from the economies of scale with respect to the management of any specific Fund or the Funds taken as a whole. The Board noted that the
advisory fee for each Fund contains breakpoints. The Board concluded that, in light of the current size of each Fund and all Funds as a group, the level of profitability of the Adviser and its affiliates with respect to each Fund and all Funds
as a group over various time periods, and the comparative management fee and expense ratio of each Fund during these periods, it does not appear that the Adviser or its affiliates has realized benefits from economies of scale in managing the assets
of the Funds to such an extent that previously agreed advisory fees should be reduced or that additional breakpoints in such fees should be implemented for any Fund at this time. The Board noted that the fees under the Sub-Advisory Agreements
are paid by the Adviser out of the advisory fees that the Adviser receives under the Advisory Agreement. Therefore, the Board concluded that the potential for economies of scale in each Sub-Adviser’s management of the Institutional Small-Cap
Equity Fund is not a material factor to the approval of the Sub-Advisory Agreements.
Conclusions
In reaching its decision to approve the Agreements, the
Board did not identify any single factor as being controlling, but based its recommendation on each of the factors it considered. Each Trustee may have contributed different weight to the various factors. Based upon the materials
reviewed, the representations made and the considerations described above, and as part of its deliberations, the Board, including the Independent Trustees, concluded that the Adviser and Sub-Advisers possess the capability and resources to perform
the duties required of them under the Agreements.
Further, based upon its review of the Agreements, the
materials provided, and the considerations described above, the Board, including the Independent Trustees, concluded that (1) the terms of the Advisory Agreement and Sub-Advisory Agreements are reasonable, fair, and in the best interests of each
Fund and its respective shareholders, and (2) the rates payable under the Advisory Agreement and Sub-Advisory Agreements are fair and reasonable in light of the usual and customary charges made for services of the same nature and quality.
State Street Institutional
Funds
Other Information, continued — September 30,
2022 (Unaudited)
TRUSTEES AND OFFICERS
Name,
Address, and
Year of Birth |
Position(s)
Held
with Trust |
Term
of
Office and
Length of
Time Served |
Principal
Occupation
During Past Five Years
and Relevant Experience |
Number
of
Funds
in Fund
Complex
Overseen
by
Trustee† |
Other
Directorships
Held by Trustee
During Past Five Years |
|
INDEPENDENT TRUSTEES |
Michael
F. Holland
c/o SSGA Funds
Management, Inc.
One Iron Street Boston,
MA 02210
YOB: 1944 |
Trustee
and
Co-Chairperson
of the Board |
Term:
Until
successor is
elected and
qualified
Elected: 1/19 |
Chairman,
Holland &
Company L.L.C.
(investment adviser)
(1995 - present). |
57
|
Director,
the Holland Series
Fund, Inc.; Director, The China
Fund, Inc. (1992 – 2017);
Director, The Taiwan Fund,
Inc. (2007 – 2017); Director,
Reaves Utility Income Fund,
Inc.; and Director, Blackstone/
GSO Loans (and
Real Estate)
Funds. |
| |
|
|
|
|
|
Patrick
J. Riley
c/o SSGA Funds
Management, Inc.
One Iron Street
Boston, MA 02210
YOB: 1948 |
Trustee
and
Co-Chairperson
of the Board |
Term:
Until
successor is
elected and
qualified
Elected: 1/19 |
2002
to May 2010, Associate
Justice of the Superior Court,
Commonwealth of
Massachusetts; 1985 to 2002,
Partner, Riley, Burke
& Donahue, L.L.P. (law firm);
1998 to Present, Independent
Director, State Street Global
Advisers Europe Limited.
(investment company); 1998 to
Present, Independent Director,
SSGA Liquidity plc (formerly,
SSGA Cash Management
Fund plc); January 2009 to
Present, Independent Director,
SSGA Fixed Income plc;
and
January 2009 - 2019,
Independent Director, SSGA
Qualified Funds PLC. |
57
|
Board
Director and Chairman,
SPDR Europe 1PLC Board
(2011 - Present); Board
Director and Chairman, SPDR
Europe II, PLC (2013 -
Present). |
State Street Institutional
Funds
Other Information, continued — September 30,
2022 (Unaudited)
Name,
Address, and
Year of Birth |
Position(s)
Held
with Trust |
Term
of
Office and
Length of
Time Served |
Principal
Occupation
During Past Five Years
and Relevant Experience |
Number
of
Funds
in Fund
Complex
Overseen
by
Trustee† |
Other
Directorships
Held by Trustee
During Past Five Years |
|
INDEPENDENT TRUSTEES (continued) |
| |
|
|
|
|
|
John
R. Costantino
c/o SSGA Funds
Management, Inc.
One Iron Street
Boston, MA 02210
YOB: 1946 |
Trustee
and
Chairperson of
the Qualified Legal
Compliance
Committee |
Term:
Until
successor is
elected and
qualified
Elected: 1997 |
Senior
Advisor to NGN Capital
LLC (January 2020 -
Present); Managing General
Partner, NGN Capital LLC
(2006 - December 2019). |
57
|
Director
of Kleinfeld Bridal Corp. (January 2016 - present); Trustee of Neuroscience Research Institute (1986 - present); Trustee of Fordham University (1989 - 1995 and 2001 - 2007) and Trustee Emeritus (2007 - present); Trustee of GE Funds (1993 - February
2011); Director of Artes Medical (2006 - 2008);
Trustee of Gregorian University Foundation (1992 - 2007); Chairman of the Board of Directors, Vivaldi Biosciences Inc. (May 2017 - present); Chairman of the Supervisory Board, Vivaldi Biosciences
AG. (May 2017 - present); Trustee, Gallim Dance (December 2021 - present). |
| |
|
|
|
|
|
Donna
M. Rapaccioli
c/o SSGA Funds
Management, Inc.
One Iron Street
Boston, MA 02210
YOB: 1962 |
Trustee
and
Chairperson of
the Audit Committee |
Term:
Until
successor is
elected and
qualified
Appointed:
1/12
Elected: 6/16 |
Dean
of the Gabelli School of
Business (2007 - June 2022) and
Accounting Professor (1987 -
present) at Fordham
University. |
57
|
Director-
Graduate
Management Admissions
Council (2015 - present);
Trustee of Emmanuel College
(2010 - 2019). |
| |
|
|
|
|
|
Richard
D. Shirk
c/o SSGA Funds
Management, Inc.
One Iron Street
Boston, MA 02210
YOB: 1945 |
Trustee
and
Chairperson
of the Nominating Committee
Chairperson of the Governance
Committee |
Term:
Until
successor is
elected and
qualified
Elected: 1/19 |
March
2001 to April 2002,
Chairman (1996 to March
2001, President and Chief
Executive Officer), Cerulean
Companies, Inc. (holding
company) (Retired); 1992 to
March 2001, President and
Chief Executive Officer, Blue
Cross
Blue Shield of Georgia
(health insurer,
managed healthcare). |
57
|
1998
to December 2008,
Chairman, Board Member and
December 2008 to Present,
Investment Committee
Member, Healthcare Georgia
Foundation (private
foundation); September 2002
to 2012, Lead Director and
Board Member,
Amerigroup
Corp. (managed health care);
1999 to 2013, Board Member
and (since 2001 - 2017) Investment
Committee Member, Woodruff
Arts Center; 2003 to 2009,
Trustee, Gettysburg College;
Board member, Aerocare Holdings
(2003 - January 2021), Regenesis Biomedical Inc. (April 2012 - present). |
State Street Institutional
Funds
Other Information, continued — September 30,
2022 (Unaudited)
Name,
Address, and
Year of Birth |
Position(s)
Held
with Trust |
Term
of
Office and
Length of
Time Served |
Principal
Occupation
During Past Five Years
and Relevant Experience |
Number
of
Funds
in Fund
Complex
Overseen
by
Trustee† |
Other
Directorships
Held by Trustee
During Past Five Years |
|
INDEPENDENT TRUSTEES (continued) |
| |
|
|
|
|
|
Michael
A. Jessee
c/o SSGA Funds
Management, Inc.
One Iron Street
Boston, MA 02210
YOB: 1946 |
Trustee
and
Chairperson of the
Valuation Committee |
Term:
Until
successor is
elected and
qualified
Elected: 1/19 |
Retired;
formerly, President
and Chief Executive Officer of
the Federal Home Loan Bank
of Boston (1989 - 2009);
Trustee, Randolph-Macon
College (2004 - 2016). |
57
|
None.
|
| |
|
|
|
|
|
Margaret
McLaughlin
c/o SSGA Funds
Management, Inc.
One Iron Street
Boston, MA 02210
YOB: 1967 |
Trustee
|
Term:
Indefinite Appointed:
9/22 |
Consultant
(since 2020) Bates Group (consultants); Consultant (2019 - 2020) Madison Dearborn Partners (private equity); General Counsel/CCO (2011 - 2019) Kramer Van Kirk Credit Strategies L.P./Mariana Systems LLC (Investment Adviser/SaaS Technology). |
57
|
Director,
Manning & Napier Fund Inc. (2021 - present). |
| |
|
|
|
|
|
George
Pereira
c/o SSGA Funds
Management, Inc.
One Iron Street
Boston, MA 02210
YOB: 1964 |
Trustee
|
Term:
Indefinite Appointed: 9/22 |
Chief
Operating Officer (January 2011 - September 2020) and Chief Financial Officer (November 2004 - September 2020), Charles Schwab Investment Management. |
57
|
Director,
Pacific Premier Bancorp, Pacific Premier Bank (2021 – present); Director, Charles Schwab Asset Management (Ireland) Ltd., & Charles Schwab Worldwide Funds plc. (2005 – 2020); Director, Rotaplast International, Inc. (non-profit
providing free medical services to children worldwide) (2012 – 2018). |
|
INTERESTED TRUSTEE(1) |
Ellen
M. Needham(2)
SSGA Funds
Management, Inc.
One Iron Street
Boston, MA 02210
YOB: 1967 |
Trustee
and
President |
Term:
Until
successor is
elected and
qualified
Elected: 1/19 |
Chairman,
SSGA Funds
Management, Inc. (March
2020 - present); President and
Director, SSGA Funds
Management, Inc. (2001 -
present)*; Senior Managing
Director, State Street Global
Advisors (1992 - present)*;
Manager, State
Street Global
Advisors Funds Distributors,
LLC (May 2017 - present).* |
57
|
Board
Director,
SSGA SPDR ETFs,
Europe I plc (May 2020 – present);
Board Director,
SSGA SPDR ETFs Europe II plc (May 2020 – present). |
| |
|
|
|
|
|
|
(1) |
The individual
listed below is a Trustee who is an "interested person," as defined in the 1940 Act, of the Trust ("Interested Trustee"). |
|
(2) |
Ms. Needham is
an Interested Trustee because of her employment by SSGA FM, an affiliate of the Trust. |
| *
|
Served in
various capacities and/or with various affiliated entities during noted time period. |
| †
|
For
the purpose of determining the number of portfolios overseen by the Trustees, “Fund Complex” comprises registered investment companies for which SSGA FM serves as Adviser. |
State Street Institutional
Funds
Other Information, continued — September 30,
2022 (Unaudited)
The following lists the principal officers for the Trust, as
well as their mailing addresses and ages, positions with the Trust and length of time served, and present and principal occupations:
Name,
Address, and
Year of Birth |
Position(s)
Held
with Trust |
Term
of
Office and
Length of
Time Served |
Principal
Occupation
During Past Five Years |
|
OFFICERS: |
Ellen
M. Needham
SSGA Funds Management, Inc.
One Iron Street
Boston, MA 02210
YOB: 1967 |
President
and
Trustee |
Term:
Indefinite
Elected:
4/20 |
Chairman,
SSGA Funds Management, Inc. (March 2020 - present); President and Director, SSGA Funds Management, Inc. (2001 - present)*; Senior Managing Director, State Street Global Advisors (1992 - present)*; Manager, State Street Global Advisors Funds
Distributors, LLC (May 2017 - present).* |
| |
|
|
|
Bruce
S. Rosenberg
SSGA Funds Management, Inc.
One Iron Street
Boston, MA 02210
YOB: 1961 |
Treasurer
|
Term:
Indefinite
Elected: 4/19 |
Managing
Director, State Street Global Advisors and SSGA Funds Management, Inc. (July 2015 - present); Director, Credit Suisse (April 2008 - July 2015). |
| |
|
|
|
Ann
M. Carpenter
SSGA Funds Management, Inc.
One Iron Street
Boston, MA 02210
YOB: 1966 |
Vice
President
and Deputy
Treasurer |
Term:
Indefinite
Elected: 4/19
|
Chief
Operating Officer, SSGA Funds Management, Inc. (April 2005 - present)*; Managing Director, State Street Global Advisors (2005 - present).* |
| |
|
|
|
Chad
C. Hallett
SSGA Funds Management, Inc.
One Iron Street
Boston, MA 02210
YOB: 1969 |
Deputy
Treasurer |
Term:
Indefinite
Elected: 4/19 |
Vice
President, State Street Global Advisors and SSGA Funds Management, Inc. (November 2014 - present); Vice President, State Street Bank and Trust Company (2001 - November 2014).* |
| |
|
|
|
Darlene
Anderson-Vasquez
SSGA Funds Management, Inc.
One Iron Street
Boston, MA 02210
YOB: 1968 |
Deputy
Treasurer |
Term:
Indefinite
Elected: 4/19 |
Managing
Director, State Street Global Advisors and SSGA Funds Management, Inc. (May 2016 - present); Senior Vice President, John Hancock Investments (September 2007 - May 2016). |
| |
|
|
|
Arthur
A. Jensen
SSGA Funds Management, Inc.
1600 Summer Street
Stamford, CT 06905
YOB: 1966 |
Deputy
Treasurer |
Term:
Indefinite
Elected: 4/19 |
Vice
President, State Street Global Advisors and SSGA Funds Management, Inc. (July 2016 - present); Mutual Funds Controller, GE Asset Management Incorporated (April 2011 - July 2016). |
| |
|
|
|
David
K. Lancaster
SSGA Funds Management, Inc.
One Iron Street
Boston, MA 02210
YOB: 1971 |
Assistant
Treasurer |
Term:
Indefinite
Elected: 11/20 |
Vice
President, State Street Global Advisors and SSGA Funds Management, Inc. (July 2017 - present); Assistant Vice President, State Street Bank and Trust Company (November 2011 - July 2017). |
State Street Institutional
Funds
Other Information, continued — September 30,
2022 (Unaudited)
Name,
Address, and
Year of Birth |
Position(s)
Held
with Trust |
Term
of
Office and
Length of
Time Served |
Principal
Occupation
During Past Five Years |
|
OFFICERS: (continued) |
| |
|
|
|
Ryan
Hill
SSGA Funds Management, Inc.
One Iron Street, Boston, MA 02210
YOB:1982 |
Assistant
Treasurer |
Term:
Indefinite
Elected: 5/22 |
Vice
President, State Street Global Advisors and SSGA Funds Management, Inc. (May 2017 - present); Assistant Vice President, State Street Bank and Trust Company (May 2014 - May 2017). |
| |
|
|
|
John
Bettencourt
SSGA Funds Management, Inc.
One Iron Street,
Boston, MA 02210
YOB:1976 |
Assistant
Treasurer |
Term:
Indefinite
Elected: 5/22 |
Vice
President, State Street Global Advisors and SSGA Funds Management, Inc. (March 2020 - present); Assistant Vice President, State Street Global Advisors (June 2007 - March 2020). |
| |
|
|
|
Brian
Harris
SSGA Funds Management, Inc.
One Iron Street
Boston, MA 02210
YOB: 1973 |
Chief
Compliance
Officer, Anti-Money
Laundering Officer
and Code of Ethics
Compliance Officer |
Term:
Indefinite
Elected: 6/16
Term: Indefinite
Elected: 4/19 |
Managing
Director, State Street Global Advisors and SSGA Funds Management, Inc. (June 2013 - Present).* |
| |
|
|
|
Sean
O’Malley
SSGA Funds Management, Inc.
One Iron Street
Boston, MA 02210
YOB: 1969 |
Chief
Legal Officer |
Term:
Indefinite
Elected: 8/19 |
Senior
Vice President and General Counsel, State Street Global Advisors (May 2022 – present);
Senior Vice President and Deputy General Counsel, State Street Global Advisors (November 2013 – May 2022). |
| |
|
|
|
David
Barr
SSGA Funds Management, Inc.
One Iron Street
Boston, MA 02210
YOB: 1974 |
Secretary
|
Term:
Indefinite
Elected: 9/20 |
Vice
President and Senior Counsel, State Street Global Advisors (October 2019 - present); Vice President and Counsel Eaton Vance Corp. (October 2010 - October 2019). |
| |
|
|
|
David
Urman
SSGA Funds Management, Inc.
One Iron Street
Boston, MA 02210
YOB: 1985 |
Assistant
Secretary |
Term:
Indefinite
Elected: 8/19 |
Vice
President and Senior Counsel, State Street Global Advisors (April 2019 - present); Vice President and Counsel, State Street Global Advisors (August 2015 - April 2019); Associate, Ropes & Gray LLP (November 2012 - August 2015). |
| |
|
|
|
| *
|
Served
in various capacities and/or with various affiliated entities during noted time period. |
[This page
intentionally left blank]
State Street Institutional
Funds
Trustees
Michael F. Holland, Co-Chairperson
Patrick J. Riley, Co-Chairperson
John R. Costantino
Donna M. Rapaccioli
Michael A. Jessee
Richard D. Shirk
Ellen M. Needham
Margaret McLaughlin
George Pereira
Officers
Ellen M. Needham, President
Brian Harris, Chief Compliance Officer, Anti-Money Laundering Officer and Code of Ethics Compliance Officer
Bruce S. Rosenberg, Treasurer
Ann M. Carpenter, Vice President and Deputy Treasurer
Chad C. Hallett, Deputy Treasurer
Arthur A. Jensen, Deputy Treasurer
Darlene Anderson-Vasquez, Deputy Treasurer
David K. Lancaster, Assistant Treasurer
Ryan Hill, Assistant Treasurer
John Bettencourt, Assistant
Treasurer
Sean O'Malley, Chief Legal Officer
David Barr, Secretary
David Urman, Assistant Secretary
Investment Adviser and Administrator
SSGA Funds Management, Inc.
One Iron Street
Boston, Massachusetts 02210
Custodian and Sub-Administrator
State Street Bank and Trust Company
One Lincoln Street
Boston, Massachusetts 02111
Distributor
State Street Global Advisors Funds
Distributors, LLC
One Iron
Street
Boston, Massachusetts
02210
Independent Registered Public Accounting Firm
Ernst & Young LLP
200 Clarendon Street
Boston, Massachusetts 02116
(b) Not applicable.
Item 2. Code of Ethics.
As of the end of the
period covered by this report, State Street Institutional Funds (the “Trust,” “Fund Entity” or “Registrant”) has adopted a code of ethics, as defined in Item 2(b) of Form N-CSR,
that applies to the Registrant’s principal executive officer, principal financial officer, principal accounting officer or controller, or persons performing similar functions, regardless of whether these individuals are employed by the
Registrant or a third party (the “Code”). That Code comprises written standards that are reasonably designed to deter wrongdoing and to promote: (1) honest and ethical conduct, including the ethical handling of actual or apparent
conflicts of interest between personal and professional relationships; (2) full, fair, accurate, timely and understandable disclosure in reports and documents that the Registrant files with, or submits to, the U.S. Securities Exchange
Commission (the “SEC”) and in other public communications made by the Registrant; (3) compliance with applicable laws and governmental rules and regulations; (4) the prompt internal reporting to an appropriate person or persons
identified in the Code of violations of the Code; and (5) accountability for adherence to the Code. For the period covered by the report, the Code was combined with other mutual funds advised by SSGA Funds Management, Inc. (“SSGA FM”
or the “Adviser”). The Registrant has not made any amendments to the Code that relates to any element of the code of ethics definition set forth in Item 2(b) of Form N-CSR during the covered period.
The Registrant has not granted any waivers from any provisions of the Code during the covered period. A copy of the Code is filed as Exhibit 13(a)(1) to this Form N-CSR.
Item 3. Audit Committee Financial Expert.
The Trust’s Board of Trustees (the “Board”) has determined that the Trust has the following “audit committee financial experts” as
defined in Item 3(b) of Form N-CSR serving on its audit committee (the “Audit Committee”): Messrs. Michael F. Holland, Richard D. Shirk and John R. Costantino and Ms. Donna M. Rapaccioli.
Each of the “audit committee financial experts” is “independent” as that term is defined in Item 3(a)(2) of Form N-CSR.
An “audit committee financial expert” is not an “expert” for any purpose, including for purposes of Section 11 of the Securities Act
of 1933, as amended, as a result of being designated as an “audit committee financial expert.” Further, the designation of a person as an “audit committee financial expert” does not mean that the person has any greater duties,
obligations, or liability than those imposed on the person without the “audit committee financial expert” designation. Similarly, the designation of a person as an “audit committee financial expert” does not affect the duties,
obligations, or liability of any other member of the Audit Committee or the Board.
Item 4. Principal Accountant Fees and Services.
For the fiscal years ended September 30, 2022 and September 30, 2021, the aggregate audit fees billed for professional services
rendered by Ernst & Young LLP (“E&Y”), the Trust’s principal accountant, for the audit of the Trust’s annual financial statements or services normally provided by E&Y in connection with the Trust’s statutory
and regulatory filings and engagements were $85,147 and $128,971, respectively.
For the fiscal years ended September 30, 2022 and September 30, 2021, there were no fees for assurance and related services by
E&Y reasonably related to the performance of the audit of the Trust’s financial statements that were not reported under paragraph (a) of this Item.
For the fiscal years ended September 30, 2022 and September 30, 2021, the aggregate tax fees billed for professional services rendered by
E&Y were $6,477 and $28,526, respectively. Tax services related to the review of year-end distribution requirements for the fiscal year ended September 30, 2022 and the review of year-end distribution requirements as well as tax compliance, tax
advice, and tax planning in the form of preparation of excise filings and income tax returns for the fiscal year ended September 30, 2021.
For the fiscal years ended September 30, 2022 and September 30, 2021, there were no fees billed for professional services rendered by
E&Y for products and services provided by E&Y to the Trust, other than the services reported in paragraphs (a) through (c).
For the fiscal years ended September 30, 2022 and September 30, 2021, the aggregate fees for professional services rendered by
E&Y for products and services provided by E&Y to the Adviser and any entity controlling, controlled by, or under common control with the Adviser that provides ongoing services to the Trust that (i) relate directly to the operations and
financial reporting of the Trust and (ii) were pre-approved by the Audit Committee were approximately $9,327,125 and $8,904,469, respectively.
| |
(e)(1) |
Audit Committee Pre-Approval Policies and Procedures
|
The Trust’s Audit Committee Charter states the following with respect to
pre-approval procedures:
The Audit Committee shall have the following duties and powers:
| |
• |
|
To pre-approve engagements by a Fund Entity’s independent auditor for non-audit services to be rendered to
the Adviser (not including any subadviser whose role is primarily portfolio management and is subcontracted with or overseen by another investment adviser), and any entity controlling, controlled by, or under common control with the Adviser that
provides ongoing services to the Fund, if the engagement relates directly to the operations and financial reporting of the Fund; |
| |
• |
|
To establish, if deemed necessary or appropriate as an alternative to Committee pre-approval of services to be
provided by the independent auditor as required by paragraph (ii) above, policies and procedures to permit such services to be pre-approved by other means, such as by action of a designated member or members of the Committee, subject to the
requirement that the decision of any member to whom authority is delegated to pre-approve an activity shall be presented to the full Committee at its next scheduled meeting; |
Alternate Pre-Approval Procedure:
| |
• |
|
The Chairperson, or a Co-Chairperson, of the Committee is authorized to pre-approve any engagement involving the
Fund Entity’s independent auditors to the same extent as the Committee. Any pre-approval decision by the Chairperson, or a Co-Chairperson, under the foregoing authority shall be presented to the Committee at its next scheduled meeting.
|
| |
(e)(2) |
Percentages of Services |
None of the services described in paragraphs (b) through (d) of this Item were performed in reliance on paragraph (c)(7)(i)(C) of Rule 2-01 of Regulation S-X during the period of time for which such rule was effective.
| |
(g) |
Total Fees Paid By Adviser and Certain Affiliates |
The aggregate non-audit fees billed for by E&Y for services rendered to the Trust and the Adviser
and any entity controlling, controlled by, or under common control with the Adviser that provided ongoing services to the Trust were as follows:
|
|
|
|
|
|
|
|
|
| |
|
FY 2022
(in millions) |
|
|
FY 2021
(in millions) |
|
| Non audit services billed to: |
|
|
|
|
|
|
|
|
| Registrant: |
|
|
See Item 4 |
(c) |
|
|
See Item 4 |
(c) |
| Investment Adviser: |
|
|
— |
|
|
|
— |
|
| Other entities in the Investment Company Complex (1)(2): |
|
|
|
|
|
|
|
|
| Audit Related Fees |
|
$ |
18.1 |
|
|
$ |
18.4 |
|
| Tax Fees |
|
$ |
5.4 |
|
|
$ |
4.4 |
|
| All Other Fees |
|
$ |
14.5 |
|
|
$ |
14.5 |
|
| (1) |
Information is for the calendar years 2022 and 2021, respectively. |
| (2) |
Services under the caption Audit-Related Fees consisted principally of reports on the processing of
transactions by servicing organizations, audits of employee benefit plan, non-statutory audits and due diligence procedures. Services under the caption Tax Fees consisted principally of expatriate, compliance
and corporate tax advisory services. Services under the caption All Other Fees primarily related to statutory and financial statement audits and the requirement to opine on the design and operating effectiveness of internal control over financial
reporting. |
| |
(h) |
E&Y notified the Trust’s Audit Committee of all non-audit
services that were rendered by E&Y to the Adviser and any entity controlling, controlled by, or under common control with the Adviser that provides services to the Trust, which services were not required to be
pre-approved pursuant to paragraph (c)(7)(ii) of Rule 2-01 of Regulation S-X, allowing the Trust’s Audit Committee to
consider whether such services were compatible with maintaining E&Y’s independence. |
Item 5. Audit Committee of Listed Registrants.
Not applicable to the Registrant.
Item 6.
Investments.
| (a) |
Schedules of Investments are included as part of the reports to shareholders filed under Item 1 of this Form N-CSR. |
| (b) |
Not applicable to the Registrant. |
Item 7. Disclosure of Proxy Voting Policies and Procedures for Closed-End Management Investment Companies.
Not applicable to the Registrant.
Item 8. Portfolio Managers of Closed-End Management Investment Companies.
Not applicable to the Registrant.
Item 9. Purchases
of Equity Securities by Closed-End Management Investment Company and Affiliated Purchasers.
Not applicable
to the Registrant.
Item 10. Submission of Matters to a Vote of Security Holders.
There were no material changes to the procedures by which shareholders may recommend nominees to the Board.
Item 11. Controls and Procedures.
(a) The Registrant’s principal executive officer and principal financial officer have concluded that the Registrant’s disclosure controls and
procedures (as defined in Rule 30a-3(c) under the Investment Company Act of 1940, as amended (the “1940 Act”)) are effective to provide reasonable assurance that information required to be disclosed
by the Registrant on Form N-CSR is recorded, processed, summarized and reported as of a date within 90 days of the filing date of this report, based on their evaluation of these controls and procedures
required by Rule 30a-3(b) under the 1940 Act and Rules 13a-15(b) or 15d-15(b) under the Securities Exchange Act of 1934, as
amended.
(b) There were no changes in the Registrant’s internal control over financial reporting (as defined in Rule
30a-3(d) under the 1940 Act) that occurred during the period covered by this report that have materially affected, or are reasonably likely to materially affect, the Registrant’s internal control over
financial reporting.
Item 12. Disclosure of Securities Lending Activities for Closed-End
Management Investment Companies.
(a) Not applicable to the Registrant.
(b) Not applicable to the Registrant.
Item 13.
Exhibits.
SIGNATURES
Pursuant to the requirements of the Securities Exchange Act of 1934 and the Investment Company Act of 1940, the Registrant has duly caused this report to be
signed on its behalf by the undersigned, thereunto duly authorized.
|
|
|
| Registrant: STATE STREET INSTITUTIONAL FUNDS |
|
|
| By: |
|
/s/ Ellen M. Needham |
|
|
Ellen M. Needham President |
|
| Date: December 7, 2022 |
Pursuant to the requirements of the Securities Exchange Act of 1934 and the Investment Company Act of 1940, this report has
been signed below by the following persons on behalf of the Registrant and in the capacities and on the dates indicated.
|
|
|
| By: |
|
/s/ Ellen M. Needham |
|
|
Ellen M. Needham |
|
|
President (Principal Executive Officer) |
|
| Date: December 7, 2022 |
|
|
| By: |
|
/s/ Bruce S. Rosenberg |
|
|
Bruce S. Rosenberg |
|
|
Treasurer (Principal Financial and Accounting Officer) |
|
| Date: December 7, 2022 |
ATTACHMENTS / EXHIBITS
CODE OF ETHICS
SECTION 302 CERTIFICATION
SECTION 906 CERTIFICATION


 Tweet
Tweet Share
Share