

Form N-CSR PIONEER SERIES TRUST X For: Mar 31
 Tweet
Tweet Share
Share
UNITED STATES
SECURITIES AND EXCHANGE COMMISSION
Washington, D.C. 20549
FORM N-CSR
CERTIFIED SHAREHOLDER REPORT OF REGISTERED
MANAGEMENT INVESTMENT COMPANIES
Investment Company Act file number 811-21108
Pioneer Series Trust X
(Exact name of registrant as specified in charter)
60 State Street, Boston, MA 02109
(Address of principal executive offices) (ZIP code)
Christopher J. Kelley, Amundi Asset Management, Inc.,
60 State Street, Boston, MA 02109
(Name and address of agent for service)
Registrant’s telephone number, including area code: (617) 742-7825
Date of fiscal year end: March 31, 2023
Date of reporting period: April 1, 2022 through March 31, 2023
Form N-CSR is to be used by management investment companies to file reports with the Commission not later than 10 days after the transmission to stockholders of any report that is required to be transmitted to stockholders under Rule 30e-1 under the Investment Company Act of 1940 (17 CFR 270.30e-1). The Commission may use the information provided on Form N-CSR in its regulatory, disclosure review, inspection, and policymaking roles.
A registrant is required to disclose the information specified by Form N-CSR, and the Commission will make this information public. A registrant is not required to respond to the collection of information contained in Form N-CSR unless the Form displays a currently valid Office of Management and Budget (“OMB”) control number. Please direct comments concerning the accuracy of the information collection burden estimate and any suggestions for reducing the burden to Secretary, Securities and Exchange Commission, 450 Fifth Street, NW, Washington, DC 20549-0609. The OMB has reviewed this collection of information under the clearance requirements of 44 U.S.C. ss. 3507.
ITEM 1. REPORTS TO STOCKHOLDERS.
| A: MAFRX | C: MCFRX | C2: MAUCX | K: MAUKX | Y: MYFRX |


Head of the Americas, President and CEO of US
Amundi Asset Management US, Inc.
May 2023
| Q | How did the Fund perform during the 12-month period ended March 31, 2023? |
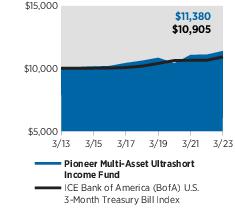
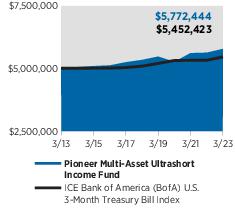
| A | Pioneer Multi-Asset Ultrashort Income Fund’s Class A shares returned 2.62% at net asset value (NAV) during the 12-month period ended March 31, 2023, while the Fund’s benchmark, the ICE Bank of America (ICE BofA) US 3-Month Treasury Bill Index, returned 2.50%. During the same period, the average return of the 237 mutual funds in Morningstar’s Ultrashort Bond category was 1.89%. |
| Q | Can you describe the market environment for fixed-income investors over the 12-month period ended March 31, 2023? |
| A | Entering the reporting period, geopolitical developments weighed heavily on investors’ appetites for riskier assets, such as stocks and corporate bonds. These included Russia’s ongoing war against Ukraine and the shuttering of China’s economy, as the Chinese government implemented strict lockdowns in major cities as part of its “Zero-COVID” policy. Both crises served to exacerbate ongoing supply-chain pressures and threaten the global economic growth outlook. |
| At the same time, we began experiencing high levels of inflation not seen in roughly 40 years. The US consumer price index (CPI) began to post year-over-year increases in excess of 8% beginning with the March 2022 readout, and peaked at over 9% in June 2022. By the late spring of 2022, investors began speculating as to whether the US Federal Reserve (Fed) would be able to achieve a “soft landing,” in which economic growth slows yet remains positive as inflation is brought under control. With inflation a key concern among market participants, as well as the Fed’s |
| response to it, and the pace of economic growth, returns for riskier assets turned deeply negative by mid-2022. | |
| The Fed would aggressively increase interest rates between May and September 2022, bringing the target range for the federal funds rate up to 3.00% ‒ 3.25%, in sharp contrast to the 0.25% ‒ 0.50% target range at the beginning of the second calendar quarter of 2022 (April). US Treasury yields moved sharply higher in response to the Fed’s determined stance, and the yield curve became inverted as the market began anticipating a recession. (A yield curve is a line that plots the interest rates, at a set point in time, of bonds having equal credit quality but differing maturity dates. An inverted yield curve represents a situation where yields on longer-term debt instruments are lower than the yields on shorter-term debt instruments.) | |
| Towards the end of 2022, with inflation beginning to show signs of modest easing, investors began to anticipate a pivot by the Fed to a more “dovish” stance on monetary policy, despite another increase to the federal funds rate target range of 75 basis point (bps) in early November. (A basis point is equal to 1/100th of a percentage point.) However, in December, the markets soon turned their attention to the potential recessionary effects of the higher-interest-rate regime put in place by the Fed, which led riskier assets to retrace some of the gains they had realized during a brief rally early in the fourth quarter. The Fed implemented a more modest 50 bps increase to the federal funds target range at its December meeting, leaving the target range at 4.25% ‒ 4.50% at the end of 2022, its highest level since the fall of 2007. | |
| Entering the new calendar year, riskier assets rallied again, amid renewed investor optimism that the Fed and other leading central banks were poised to stop raising interest rates. January 2023 saw Treasury yields pull back from their more recent highs on the outlook for a potential easing of monetary policy. That, in turn, boosted performance for bonds in general. In addition, the reopening of China’s economy as the government unwound its “Zero-COVID” policy helped ease concerns about slowing global economic growth. Against this backdrop, areas of the market that had lagged during the 2022 sell-offs, such as growth stocks and corporate credit, outperformed. On February 1, 2023, the Fed |
| once again raised the federal funds target range, this time by a less aggressive 25 bps, bringing the target to 4.50% ‒ 4.75%. | |
| In March, however, the failure of three US banks and the collapse of European banking giant Credit Suisse raised fears of a financial crisis. In response, the Fed implemented a new lending program to support bank liquidity, while market participants began to anticipate interest-rate cuts by the Fed over the second half of the calendar year. The prospect of a more dovish stance on monetary policy and a “flight to safety” by investors in the wake of the banking-system issues drove Treasury yields sharply lower, which in turn lent support to bond-market returns. At its March 23 meeting, the Fed went forward with another modest 25 bps increase to the federal funds target, bringing the range to 4.75% ‒ 5.00%. The financial markets viewed the latest rate increase as an indication that the Fed believed the financial system, overall, remained on solid footing. As of March 31, 2023, the yield on the one-year Treasury note closed at 4.64%, versus 1.63% 12 months earlier. | |
| Q | Can you review your principal investment strategies during the 12-month period ended March 31, 2023, and how the strategies affected the Fund’s benchmark-relative performance? |
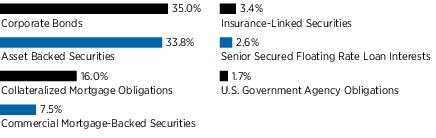
| A | The largest positive contributors to the Fund’s benchmark-relative performance during the period came from the portfolio’s exposures to securitized assets, including credit-risk-transfer issues (CRTs) within the residential mortgage-backed securities (RMBS) segment, asset-backed securities (ABS), and collateralized loan obligation (CLOs). (CRTs are securities that transfer a portion of the risk associated with credit losses within pools of conventional residential mortgage loans from the government-sponsored entities, or GSEs, Fannie Mae and Freddie Mac, to the private sector.) The performance of securitized assets generally lagged the rally in corporate credit at the end of 2022, but began to close the gap over the first quarter of 2023. |
| Exposures to investment-grade corporate bonds within the financials sector, despite a volatile month of March (2023), made the next-largest positive contribution to the Fund’s relative returns for the 12-mont period. Within the banking segment, we have heavily favored investments in shorter-maturity bonds |
| issued by large, diversified, multinational institutions. Additional positive contributions to the Fund’s relative returns came from holdings of industrial and utilities issues within the portfolio’s investment-grade corporates allocation. Finally, the Fund’s modest position in insurance-linked securities (ILS) proved additive to relative results. | |
| The largest detractor from the Fund’s benchmark-relative performance for the 12-month period was the portfolio’s allocation to commercial MBS (CMBS), as an expected contraction in bank lending weighed on investors’ sentiment towards the commercial real estate market. A modest allocation to floating-rate bank loans also detracted from relative returns during the period. | |
| Q | Can you discuss the factors that affected the Fund’s income generation, or distributions* to shareholders, either positively or negatively, during the 12-month period ended March 31, 2023? |
| A | Credit spreads widened over the period, which led to an increase in the Fund’s monthly distribution rate. We believe the income-generation of the Fund has remained attractive. (Credit spreads are commonly defined as the differences in yield between Treasuries and other types of fixed-income securities with similar maturities.) |
| Q | Did the Fund have any exposure to derivative securities during the 12-month period ended March 31, 2023? |
| A | We have invested the Fund in certain derivative instruments as a potential hedge against interest-rate risk on some of the portfolio’s positions, such as agency MBS and ABS, but the investments have typically amounted to a very small portion of the Fund’s invested assets/notional value. During the 12-month period, the Fund had a small allocation to US Treasury futures, which had no material effect on performance. |
| Q | What is your assessment of the current investment climate for the Fund? |
| A | We believe the recent banking-system stress has clearly softened the outlook for the US economy. The actions of the US Treasury, |
| * | Distributions are not guaranteed. |
| Federal Deposit Insurance Corporation (FDIC), and the Fed at the onset of the difficulties seemed designed, in our view, to serve as a firewall to help control additional deposit runs and prevent systemic contagion that could lead to a sudden credit crunch, as experienced in 2008. So far, we believe the measures appear to have been successful, as investors’ focus has shifted from “who is next?” to “what are the medium-term, systemic effects?” | |
| With respect to the latter question, we believe, over the intermediate-term, bank lending and credit conditions are likely to tighten as regional banks strive to boost balance-sheet liquidity, absorb the higher costs of attracting deposits with the rise in short-term interest rates, and consider the stability of their funding sources. In the coming months, we expect bank regulators will be closely scrutinizing the susceptibility of banks to “deposit flight”; and, over the longer term, we believe it is likely that regional banks will face higher regulatory capital and liquidity requirements. | |
| In our view, a slowdown in lending by regional banks will be negative for economic growth, and makes a recession likely in the second half of 2023, unless the Federal Open Market Committee (FOMC) significantly eases monetary policy, and relatively soon. Given the Fed’s emphasis on bringing down persistently sticky domestic inflation, which is usually a lagging indicator, we suspect that the Fed could be too slow to cut rates to prevent a recession. |
| (As a percentage of total investments)* | ||
| 1. | Federal National Mortgage Association, 6.00%, 4/15/53 (TBA) | 0.87% |
| 2. | Standard Chartered Plc, 6.589% (SOFR + 174 bps), 3/30/26 (144A) | 0.64 |
| 3. | Federal National Mortgage Association, 4.50%, 4/15/53 (TBA) | 0.62 |
| 4. | Royal Bank of Canada, 4.908% (SOFR + 30 bps), 1/19/24 | 0.60 |
| 5. | Goldman Sachs Group, Inc., 5.305% (SOFR + 50 bps), 9/10/24 | 0.57 |
| 6. | Radnor Re, Ltd., Series 2021-1, Class M1C, 7.26% (SOFR30A + 270 bps), 12/27/33 (144A) | 0.55 |
| 7. | Daimler Trucks Finance North America LLC, 5.526% (SOFR + 100 bps), 4/5/24 (144A) | 0.55 |
| 8. | Gracie Point International Funding, Series 2022-1A, Class A, 6.871% (SOFR30A + 225 bps), 4/1/24 (144A) | 0.54 |
| 9. | Wells Fargo & Co., 5.956% (SOFR + 132 bps), 4/25/26 | 0.53 |
| 10. | Purchasing Power Funding LLC, Series 2021-A, Class A, 1.57%, 10/15/25 (144A) | 0.52 |
| * | Excludes short-term investments and all derivative contracts except for options purchased. The Fund is actively managed, and current holdings may be different. The holdings listed should not be considered recommendations to buy or sell any securities. |
| Class | 3/31/23 | 3/31/22 |
| A | $9.53 | $9.61 |
| C | $9.53 | $9.61 |
| C2 | $9.53 | $9.62 |
| K | $9.56 | $9.64 |
| Y | $9.54 | $9.63 |
| Class | Net
Investment Income |
Short-Term
Capital Gains |
Long-Term
Capital Gains |
| A | $0.3263 | $— | $— |
| C | $0.2953 | $— | $— |
| C2 | $0.2977 | $— | $— |
| K | $0.3493 | $— | $— |
| Y | $0.3418 | $— | $— |
| Performance Update | 3/31/23 | Class A Shares |
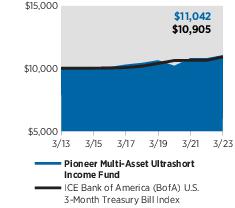
| Performance Update | 3/31/23 | Class C Shares |

| Performance Update | 3/31/23 | Class C2 Shares |
| Performance Update | 3/31/23 | Class K Shares |
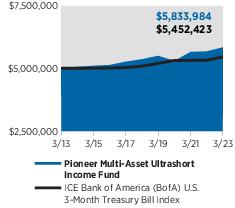
| Performance Update | 3/31/23 | Class Y Shares |
| (1) | ongoing costs, including management fees, distribution and/or service (12b-1) fees, and other Fund expenses; and |
| (2) | transaction costs, including sales charges (loads) on purchase payments. |
| (1) | Divide your account value by
$1,000 Example: an $8,600 account value ÷ $1,000 = 8.6 |
| (2) | Multiply the result in (1) above by the corresponding share class’s number in the third row under the heading entitled “Expenses Paid During Period” to estimate the expenses you paid on your account during this period. |
| Share Class | A | C | C2 | K | Y |
| Beginning
Account Value on 10/1/22 |
$1,000.00 | $1,000.00 | $1,000.00 | $1,000.00 | $1,000.00 |
| Ending
Account Value (after expenses) on 3/31/23 |
$1,028.90 | $1,026.20 | $1,026.30 | $1,030.10 | $1,028.60 |
| Expenses
Paid During Period* |
$3.04 | $4.65 | $4.60 | $1.92 | $2.28 |
| * | Expenses are equal to the Fund’s annualized expense ratio of 0.60%, 0.92%, 0.91%, 0.38%, and 0.45% for Class A, Class C, Class C2, Class K, and Class Y shares, respectively, multiplied by the average account value over the period, multiplied by 182/365 (to reflect the one-half year period). |
| Share Class | A | C | C2 | K | Y |
| Beginning
Account Value on 10/1/22 |
$1,000.00 | $1,000.00 | $1,000.00 | $1,000.00 | $1,000.00 |
| Ending
Account Value (after expenses) on 3/31/23 |
$1,021.94 | $1,020.34 | $1,020.39 | $1,023.04 | $1,022.69 |
| Expenses
Paid During Period* |
$3.02 | $4.63 | $4.58 | $1.92 | $2.27 |
| * | Expenses are equal to the Fund’s annualized expense ratio of 0.60%, 0.92%, 0.91%, 0.38%, and 0.45% for Class A, Class C, Class C2, Class K, and Class Y shares, respectively, multiplied by the average account value over the period, multiplied by 182/365 (to reflect the one-half year period). |
| Principal
Amount USD ($) |
Value | |||||
| UNAFFILIATED ISSUERS — 97.7% | ||||||
| Senior
Secured Floating Rate Loan Interests — 2.2% of Net Assets*(a) |
||||||
| Advertising Sales — 0.1% | ||||||
| 965,000 | Clear Channel Outdoor Holdings, Inc., Term B Loan, 8.325% (Term SOFR + 350 bps), 8/21/26 | $ 902,124 | ||||
| 1,475,298 | Outfront Media Capital LLC (Outfront Media Capital Corporation), Extended Term Loan, 6.59% (LIBOR + 175 bps), 11/18/26 | 1,453,169 | ||||
| Total Advertising Sales | $2,355,293 | |||||
| Advertising Services — 0.0%† | ||||||
| 740,625 | Dotdash Meredith, Inc., Term Loan B, 8.765% (Term SOFR + 400 bps), 12/1/28 | $ 670,266 | ||||
| Total Advertising Services | $670,266 | |||||
| Aerospace & Defense — 0.0%† | ||||||
| 1,462,500 | ADS Tactical, Inc., Initial Term Loan, 10.59% (LIBOR + 575 bps), 3/19/26 | $ 1,349,156 | ||||
| Total Aerospace & Defense | $1,349,156 | |||||
| Auto Parts & Equipment — 0.0%† | ||||||
| 488,377 | IXS Holdings, Inc., Initial Term Loan, 9.479% (Term SOFR + 425 bps), 3/5/27 | $ 405,963 | ||||
| Total Auto Parts & Equipment | $405,963 | |||||
| Auto-Truck Trailers — 0.0%† | ||||||
| 1,485,000 | Novae LLC, Tranche B Term Loan, 9.696% (Term SOFR + 500 bps), 12/22/28 | $ 1,286,381 | ||||
| Total Auto-Truck Trailers | $1,286,381 | |||||
| Batteries/Battery Systems — 0.0%† | ||||||
| 656,875 | Energizer Holdings, Inc., 2020 Term Loan, 7.116% (Term SOFR + 225 bps), 12/22/27 | $ 653,180 | ||||
| Total Batteries/Battery Systems | $653,180 | |||||
| Building & Construction — 0.0%† | ||||||
| 1,229,940 | Service Logic Acquisition, Inc., First Lien Closing Date Initial Term Loan, 8.825% (LIBOR + 400 bps), 10/29/27 | $ 1,214,566 | ||||
| Total Building & Construction | $1,214,566 | |||||
| Building & Construction Products — 0.0%† | ||||||
| 490,000 | Cornerstone Building Brands, Inc., Tranche B Term Loan, 7.934% (LIBOR + 325 bps), 4/12/28 | $ 434,875 | ||||
| Total Building & Construction Products | $434,875 | |||||
| Principal
Amount USD ($) |
Value | |||||
| Building Production — 0.0%† | ||||||
| 500,000(b) | Koppers Inc., Term Loan, 3/8/30 | $ 491,250 | ||||
| Total Building Production | $491,250 | |||||
| Cable & Satellite Television — 0.1% | ||||||
| 2,946,701 | Charter Communications Operating LLC, Term B-2 Loan, 6.557% (Term SOFR + 175 bps), 2/1/27 | $ 2,923,681 | ||||
| 987,500 | Radiate Holdco LLC, Amendment No. 6 Term Loan, 8.09% (LIBOR + 325 bps), 9/25/26 | 812,219 | ||||
| 1,025,000 | Virgin Media Bristol LLC, Facility Q, 7.934% (LIBOR + 325 bps), 1/31/29 | 1,016,580 | ||||
| Total Cable & Satellite Television | $4,752,480 | |||||
| Casino Services — 0.1% | ||||||
| 1,600,946 | Flutter Entertainment Plc, USD Term Loan, 7.409% (LIBOR + 225 bps), 7/21/26 | $ 1,601,947 | ||||
| Total Casino Services | $1,601,947 | |||||
| Cellular Telecom — 0.0%† | ||||||
| 1,231,250 | Xplornet Communications, Inc., First Lien Refinancing Term Loan, 8.84% (LIBOR + 400 bps), 10/2/28 | $ 1,000,237 | ||||
| Total Cellular Telecom | $1,000,237 | |||||
| Chemicals-Diversified — 0.1% | ||||||
| 2,554,500 | Mativ Holdings, Inc., Term B Loan, 8.625% (Term SOFR + 375 bps), 4/20/28 | $ 2,484,251 | ||||
| Total Chemicals-Diversified | $2,484,251 | |||||
| Chemicals-Specialty — 0.1% | ||||||
| 982,500 | INEOS Styrolution Group GmbH, 2026 Tranche B Dollar Term Loan, 7.59% (Term SOFR + 275 bps), 1/29/26 | $ 974,210 | ||||
| 987,500 | Olympus Water US Holding Corp., Initial Dollar Term Loan, 8.938% (LIBOR + 375 bps), 11/9/28 | 936,890 | ||||
| 1,719,380 | Tronox Finance LLC, First Lien Refinancing Term Loan, 7.075% (LIBOR + 225 bps), 3/10/28 | 1,684,993 | ||||
| Total Chemicals-Specialty | $3,596,093 | |||||
| Commercial Services — 0.1% | ||||||
| 505,484 | CoreLogic, Inc. (fka First American Corporation), First Lien Initial Term Loan, 8.375% (LIBOR + 350 bps), 6/2/28 | $ 432,505 | ||||
| Principal
Amount USD ($) |
Value | |||||
| Commercial Services — (continued) | ||||||
| 470,250 | Pre-Paid Legal Services, Inc., First Lien Initial Term Loan, 8.591% (LIBOR + 375 bps), 12/15/28 | $ 463,843 | ||||
| 1,760,527 | Trans Union LLC, 2019 Replacement Term B-5 Loan, 6.59% (LIBOR + 175 bps), 11/16/26 | 1,749,838 | ||||
| Total Commercial Services | $2,646,186 | |||||
| Computer Data Security — 0.1% | ||||||
| 1,234,375 | Magenta Buyer LLC, First Lien Initial Term Loan, 9.58% (LIBOR + 475 bps), 7/27/28 | $ 1,018,359 | ||||
| 691,228 | Vision Solutions, Inc. (Precisely Software Incorporated), First Lien Third Amendment Term Loan, 8.818% (LIBOR + 400 bps), 4/24/28 | 612,169 | ||||
| Total Computer Data Security | $1,630,528 | |||||
| Computer Software — 0.0%† | ||||||
| 495,000 | Cornerstone OnDemand, Inc., First Lien Initial Term Loan, 8.59% (LIBOR + 375 bps), 10/16/28 | $ 458,494 | ||||
| 392,000 | Rackspace Technology Global, Inc., First Lien 2021 Term B Loan, 7.595% (LIBOR + 275 bps), 2/15/28 | 211,680 | ||||
| Total Computer Software | $670,174 | |||||
| Consulting Services — 0.0%† | ||||||
| 923,400 | MAG DS Corp., Initial Term Loan, 10.498% (Term SOFR + 550 bps), 4/1/27 | $ 849,528 | ||||
| Total Consulting Services | $849,528 | |||||
| Consumer Products — 0.0%† | ||||||
| 490,000 | Spectrum Brands, Inc., 2021 Term Loan, 6.96% (LIBOR + 200 bps), 3/3/28 | $ 486,325 | ||||
| Total Consumer Products | $486,325 | |||||
| Containers-Paper & Plastic — 0.1% | ||||||
| 2,827,375 | Berry Global, Inc., Term Z Loan, 6.51% (LIBOR + 175 bps), 7/1/26 | $ 2,822,074 | ||||
| 1,476,313 | ProAmpac PG Borrower LLC, First Lien 2020-1 Term Loan, 7.959% (LIBOR + 375 bps), 11/3/25 | 1,450,477 | ||||
| Total Containers-Paper & Plastic | $4,272,551 | |||||
| Cruise Lines — 0.1% | ||||||
| 1,458,750 | Carnival Corp., Initial Advance, 7.84% (LIBOR + 300 bps), 6/30/25 | $ 1,443,433 | ||||
| Total Cruise Lines | $1,443,433 | |||||
| Principal
Amount USD ($) |
Value | |||||
| Diagnostic Equipment — 0.0%† | ||||||
| 1,468,837 | Curia Global, Inc., First Lien 2021 Term Loan, 8.526% (Term SOFR + 375 bps), 8/30/26 | $ 1,262,282 | ||||
| Total Diagnostic Equipment | $1,262,282 | |||||
| Direct Marketing — 0.0%† | ||||||
| 582,726 | Red Ventures, LLC (New Imagitas, Inc.), First Lien Term B-4 Loan, 7.807% (Term SOFR + 300 bps), 3/3/30 | $ 578,719 | ||||
| Total Direct Marketing | $578,719 | |||||
| Disposable Medical Products — 0.1% | ||||||
| 992,500 | Medline Borrower, LP, Initial Dollar Term Loan, 8.09% (LIBOR + 325 bps), 10/23/28 | $ 968,860 | ||||
| 900,000 | Sotera Health Holdings LLC, First Lien Refinancing Loan, 7.575% (Term SOFR + 275 bps), 12/11/26 | 870,187 | ||||
| Total Disposable Medical Products | $1,839,047 | |||||
| E-Commerce — 0.0%† | ||||||
| 491,250 | CNT Holdings I Corp., First Lien Initial Term Loan, 8.125% (Term SOFR + 350 bps), 11/8/27 | $ 483,636 | ||||
| Total E-Commerce | $483,636 | |||||
| Electric-Generation — 0.0%† | ||||||
| 886,132 | Eastern Power LLC (Eastern Covert Midco LLC), Term Loan, 8.909% (LIBOR + 375 bps), 10/2/25 | $ 821,888 | ||||
| 550,134 | Vistra Operations Company LLC (fka Tex Operations Company LLC), 2018 Incremental Term Loan, 6.459% (LIBOR + 175 bps), 12/31/25 | 547,841 | ||||
| Total Electric-Generation | $1,369,729 | |||||
| Electric-Integrated — 0.0%† | ||||||
| 479,452 | Pike Corp., 2028 Initial Term Loan, 7.85% (LIBOR + 300 bps), 1/21/28 | $ 476,884 | ||||
| Total Electric-Integrated | $476,884 | |||||
| Entertainment Software — 0.0%† | ||||||
| 835,125 | Playtika Holding Corp., Term B-1 Loan, 7.59% (LIBOR + 275 bps), 3/13/28 | $ 830,800 | ||||
| Total Entertainment Software | $830,800 | |||||
| Finance-Investment Banker — 0.1% | ||||||
| 1,461,313 | Citadel Securities LP, 2021 Term Loan, 7.422% (Term SOFR + 250 bps), 2/2/28 | $ 1,451,084 | ||||
| 931,000 | Hudson River Trading LLC, Term Loan, 7.921% (Term SOFR + 300 bps), 3/20/28 | 875,140 | ||||
| Total Finance-Investment Banker | $2,326,224 | |||||
| Principal
Amount USD ($) |
Value | |||||
| Finance-Leasing Company — 0.1% | ||||||
| 1,225,559 | Avolon TLB Borrower 1 (US) LLC, 2021 Term B-5 Loan, 7.011% (LIBOR + 225 bps), 12/1/27 | $ 1,228,316 | ||||
| 1,343,926 | Avolon TLB Borrower 1 (US) LLC, Term B-4 Loan, 6.262% (LIBOR + 150 bps), 2/12/27 | 1,336,535 | ||||
| 1,517,397 | Castlelake Aviation One Designated Activity Company, 2023 Incremental Term Loan, 7.783% (Term SOFR + 275 bps), 10/22/27 | 1,497,797 | ||||
| Total Finance-Leasing Company | $4,062,648 | |||||
| Food-Wholesale & Distributions — 0.0%† | ||||||
| 834,167 | US Foods, Inc. (aka U.S. Foodservice, Inc.), Incremental B-2019 Term Loan, 6.907% (Term SOFR + 200 bps), 9/13/26 | $ 831,400 | ||||
| Total Food-Wholesale & Distributions | $831,400 | |||||
| Footwear & Related Apparel — 0.1% | ||||||
| 2,512,500 | Crocs, Inc., Term Loan, 8.407% (Term SOFR + 350 bps), 2/20/29 | $ 2,508,239 | ||||
| Total Footwear & Related Apparel | $2,508,239 | |||||
| Gambling (Non-Hotel) — 0.0%† | ||||||
| 990,000 | Bally's Corp., Term B Facility Loan, 7.959% (LIBOR + 325 bps), 10/2/28 | $ 948,173 | ||||
| Total Gambling (Non-Hotel) | $948,173 | |||||
| Home Furnishings — 0.0%† | ||||||
| 985,000 | Herman Miller, Inc. , Initial Term B Loan, 6.922% (Term SOFR + 200 bps), 7/19/28 | $ 962,837 | ||||
| Total Home Furnishings | $962,837 | |||||
| Independent Power Producer — 0.0%† | ||||||
| 734,312 | Calpine Construction Finance Company, L.P., Term B Loan, 6.84% (LIBOR + 200 bps), 1/15/25 | $ 734,485 | ||||
| 477,250 | EFS Cogen Holdings I LLC, Term B Advance, 8.66% (LIBOR + 350 bps), 10/1/27 | 465,915 | ||||
| Total Independent Power Producer | $1,200,400 | |||||
| Internet Security — 0.0%† | ||||||
| 932,249 | NortonLifeLock, Inc., Term Loan B, 6.907% (Term SOFR + 200 bps), 9/12/29 | $ 923,043 | ||||
| Total Internet Security | $923,043 | |||||
| Investment
Management & Advisory Services — 0.1% |
||||||
| 985,000 | Edelman Financial Engines Center LLC, First Lien 2021 Initial Term Loan, 8.59% (LIBOR + 375 bps), 4/7/28 | $ 952,782 | ||||
| Principal
Amount USD ($) |
Value | |||||
| Investment
Management & Advisory Services — (continued) |
||||||
| 990,000 | LHS Borrower LLC, Initial Term Loan, 9.657% (Term SOFR + 475 bps), 2/16/29 | $ 804,375 | ||||
| 1,487,415 | Russell Investments US Institutional Holdco, Inc., 2025 Term Loan, 8.331% (LIBOR + 350 bps), 5/30/25 | 1,460,765 | ||||
| Total Investment Management & Advisory Services | $3,217,922 | |||||
| Lasers-System & Components — 0.1% | ||||||
| 2,395,536 | Coherent Corp., Initial Term B Loan, 7.672% (Term SOFR + 275 bps), 7/2/29 | $ 2,377,569 | ||||
| Total Lasers-Syst/Components | $2,377,569 | |||||
| Machinery-Pumps — 0.0%† | ||||||
| 1,011,480 | Circor International, Inc., Initial Term Loan, 10.34% (LIBOR + 550 bps), 12/20/28 | $ 1,003,894 | ||||
| Total Machinery-Pumps | $1,003,894 | |||||
| Medical Information Systems — 0.0%† | ||||||
| 663,600 | athenahealth Group, Inc., Initial Term Loan, 8.259% (Term SOFR + 350 bps), 2/15/29 | $ 619,139 | ||||
| Total Medical Information Systems | $619,139 | |||||
| Medical Labs & Testing Services — 0.1% | ||||||
| 183,640 | Envision Healthcare Corp., First Out Term Loan, 12.923% (Term SOFR + 788 bps), 3/31/27 | $ 160,685 | ||||
| 1 | Envision Healthcare Corp., Second Out Term Loan, 9.148% (Term SOFR + 425 bps), 3/31/27 | — | ||||
| 1,558,500 | Envision Healthcare Corp., Third Out Term Loan, 8.648% (Term SOFR + 375 bps), 3/31/27 | 268,841 | ||||
| 1,785,527 | Phoenix Guarantor Inc., First Lien Tranche B-1 Term Loan, 8.09% (LIBOR + 325 bps), 3/5/26 | 1,742,843 | ||||
| 1,228,125 | Phoenix Guarantor Inc., First Lien Tranche B-3 Term Loan, 8.34% (LIBOR + 350 bps), 3/5/26 | 1,198,766 | ||||
| 1,329,750 | U.S. Anesthesia Partners, Inc., First Lien Initial Term Loan, 8.912% (LIBOR + 425 bps), 10/1/28 | 1,284,158 | ||||
| Total Medical Labs & Testing Services | $4,655,293 | |||||
| Medical Products — 0.1% | ||||||
| 1,466,058 | NMN Holdings III Corp., First Lien Closing Date Term Loan, 8.591% (LIBOR + 375 bps), 11/13/25 | $ 1,260,810 | ||||
| 314,895 | NMN Holdings III Corp., First Lien Delayed Draw Term Loan, 8.59% (LIBOR + 375 bps), 11/13/25 | 270,022 | ||||
| Total Medical Products | $1,530,832 | |||||
| Principal
Amount USD ($) |
Value | |||||
| Medical-Drugs — 0.0%† | ||||||
| 800,000 | Padagis LLC, Term B Loan, 9.538% (LIBOR + 475 bps), 7/6/28 | $ 736,000 | ||||
| Total Medical-Drugs | $736,000 | |||||
| Medical-Hospitals — 0.0%† | ||||||
| 1,287,000 | EyeCare Partners LLC, First Lien Amendment No. 1 Term Loan, 8.59% (LIBOR + 375 bps), 11/15/28 | $ 1,051,318 | ||||
| Total Medical-Hospitals | $1,051,318 | |||||
| Metal Processors & Fabrication — 0.0%† | ||||||
| 331,728 | WireCo WorldGroup, Inc., Initial Term Loan, 9.063% (LIBOR + 425 bps), 11/13/28 | $ 329,032 | ||||
| Total Metal Processors & Fabrication | $329,032 | |||||
| Networking Products — 0.0%† | ||||||
| 1,159 | GoTo Group, Inc., First Lien Initial Term Loan, 9.59% (LIBOR + 475 bps), 8/31/27 | $ — | ||||
| Total Networking Products | $— | |||||
| Non-hazardous Waste Disposal — 0.0%† | ||||||
| 736,875 | WIN Waste Innovations Holdings Inc., Initial Term Loan, 7.672% (Term SOFR + 275 bps), 3/24/28 | $ 700,339 | ||||
| Total Non-hazardous Waste Disposal | $700,339 | |||||
| Office Automation & Equipment — 0.0%† | ||||||
| 1,068,200 | Pitney Bowes, Inc., Refinancing Tranche B Term Loan, 8.922% (Term SOFR + 400 bps), 3/17/28 | $ 1,026,807 | ||||
| Total Office Automation & Equipment | $1,026,807 | |||||
| Physical Practice Management — 0.0%† | ||||||
| 872,325 | Team Health Holdings, Inc., Extended Term Loan, 10.057% (Term SOFR + 525 bps), 3/2/27 | $ 609,173 | ||||
| Total Physical Practice Management | $609,173 | |||||
| Private Equity — 0.0%† | ||||||
| 743,302 | Victory Capital Holdings, Inc., Tranche B-2 Term Loan, 6.954% (Term SOFR + 225 bps), 7/1/26 | $ 738,308 | ||||
| Total Private Equity | $738,308 | |||||
| Property & Casualty Insurance — 0.1% | ||||||
| 1,170,403 | Asurion LLC, New B-8 Term Loan, 8.091% (LIBOR + 325 bps), 12/23/26 | $ 1,091,401 | ||||
| Principal
Amount USD ($) |
Value | |||||
| Property & Casualty Insurance — (continued) | ||||||
| 980,000 | Asurion LLC, New B-9 Term Loan, 8.09% (LIBOR + 325 bps), 7/31/27 | $ 901,600 | ||||
| 2,648,384 | Asurion, LLC, New B-11 Term Loan, 9.157% (Term SOFR + 425 bps), 8/19/28 | 2,460,791 | ||||
| Total Property & Casualty Insurance | $4,453,792 | |||||
| Protection-Safety — 0.0%† | ||||||
| 911,903 | Prime Security Services Borrower LLC, First Lien 2021 Refinancing Term B-1 Loan, 7.517% (LIBOR + 275 bps), 9/23/26 | $ 910,136 | ||||
| Total Protection-Safety | $910,136 | |||||
| Publishing — 0.0%† | ||||||
| 995,000 | Houghton Mifflin Harcourt Company, First Lien Term B Loan, 10.157% (Term SOFR + 525 bps), 4/9/29 | $ 894,567 | ||||
| Total Publishing | $894,567 | |||||
| Racetracks — 0.0%† | ||||||
| 490,000 | Churchill Downs Inc., 2021 Incremental Term B Loan, 6.85% (LIBOR + 200 bps), 3/17/28 | $ 487,550 | ||||
| Total Racetracks | $487,550 | |||||
| Recreational Centers — 0.0%† | ||||||
| 1,220,288 | Fitness International LLC, Term B Loan, 8.076% (Term SOFR + 325 bps), 4/18/25 | $ 1,169,189 | ||||
| Total Recreational Centers | $1,169,189 | |||||
| Rental Auto & Equipment — 0.1% | ||||||
| 1,940,653 | Avis Budget Car Rental LLC, New Tranche B Term Loan, 6.60% (LIBOR + 175 bps), 8/6/27 | $ 1,911,543 | ||||
| Total Rental Auto & Equipment | $1,911,543 | |||||
| Retail — 0.1% | ||||||
| 1,143,333 | Highline Aftermarket Acquisition LLC, First Lien Initial Term Loan, 9.34% (LIBOR + 450 bps), 11/9/27 | $ 1,103,317 | ||||
| 961,912 | Petco Health & Wellness Co., Inc., First Lien Initial Term Loan, 8.41% (Term SOFR + 325 bps), 3/3/28 | 945,937 | ||||
| 738,750 | PetSmart LLC, Initial Term Loan, 8.657% (Term SOFR + 375 bps), 2/11/28 | 733,979 | ||||
| 737,324 | RVR Dealership Holdings LLC, Term Loan, 8.554% (Term SOFR + 375 bps), 2/8/28 | 637,785 | ||||
| Total Retail | $3,421,018 | |||||
| Principal
Amount USD ($) |
Value | |||||
| Retail-Restaurants — 0.0%† | ||||||
| 1,172,825 | 1011778 B.C. Unlimited Liability Co., Term B-4 Loan, 6.59% (LIBOR + 175 bps), 11/19/26 | $ 1,161,976 | ||||
| Total Retail-Restaurants | $1,161,976 | |||||
| Security Services — 0.1% | ||||||
| 1,970,000 | Allied Universal Holdco LLC (f/k/a USAGM Holdco LLC), Initial U.S. Dollar Term Loan, 8.657% (Term SOFR + 375 bps), 5/12/28 | $ 1,872,731 | ||||
| 1,500,000 | Garda World Security Corp., Term B-2 Loan, 9.109% (Term SOFR + 425 bps), 10/30/26 | 1,490,000 | ||||
| Total Security Services | $3,362,731 | |||||
| Soap & Cleaning Preparation — 0.0%† | ||||||
| 987,500 | Knight Health Holdings LLC, Term B Loan, 10.09% (LIBOR + 525 bps), 12/23/28 | $ 522,141 | ||||
| Total Soap & Cleaning Preparation | $522,141 | |||||
| Telephone-Integrated — 0.1% | ||||||
| 1,867,211 | Level 3 Financing, Inc., Tranche B 2027 Term Loan, 6.672% (Term SOFR + 175 bps), 3/1/27 | $ 1,575,071 | ||||
| Total Telephone-Integrated | $1,575,071 | |||||
| Textile-Home Furnishings — 0.0%† | ||||||
| 1,782,000 | Runner Buyer, Inc., Initial Term Loan, 10.454% (LIBOR + 550 bps), 10/20/28 | $ 1,345,410 | ||||
| Total Textile-Home Furnishings | $1,345,410 | |||||
| Transportation - Trucks — 0.0%† | ||||||
| 1,477,500 | Carriage Purchaser, Inc., Term B Loan, 9.09% (LIBOR + 425 bps), 9/30/28 | $ 1,419,093 | ||||
| Total Transportation - Trucks | $1,419,093 | |||||
| Total
Senior Secured Floating Rate Loan Interests (Cost $102,602,971) |
$96,128,567 | |||||
| Asset Backed
Securities — 28.4% of Net Assets |
||||||
| 69,681(a) | 321 Henderson Receivables I LLC, Series 2004-A, Class A1, 5.034% (1 Month USD LIBOR + 35 bps), 9/15/45 (144A) | $ 68,954 | ||||
| 14,028(a) | 321 Henderson Receivables I LLC, Series 2006-1A, Class A1, 4.884% (1 Month USD LIBOR + 20 bps), 3/15/41 (144A) | 14,007 | ||||
| 433,747(a) | 321 Henderson Receivables I LLC, Series 2006-2A, Class A1, 4.884% (1 Month USD LIBOR + 20 bps), 6/15/41 (144A) | 423,354 | ||||
| Principal
Amount USD ($) |
Value | |||||
| Asset Backed Securities — (continued) | ||||||
| 504,211(a) | 321 Henderson Receivables I LLC, Series 2006-3A, Class A1, 4.884% (1 Month USD LIBOR + 20 bps), 9/15/41 (144A) | $ 489,522 | ||||
| 955,016(a) | 321 Henderson Receivables LLC, Series 2005-1A, Class A1, 4.914% (1 Month USD LIBOR + 23 bps), 11/15/40 (144A) | 933,934 | ||||
| 3,550,000(a) | 522 Funding CLO, Ltd., Series 2020-6A, Class X, 5.915% (3 Month USD LIBOR + 110 bps), 10/23/34 (144A) | 3,547,504 | ||||
| 3,000,000(a) | ABPCI Direct Lending Fund CLO V Ltd., Series 2019-5A, Class CR, 9.008% (3 Month USD LIBOR + 420 bps), 4/20/31 (144A) | 2,716,767 | ||||
| 5,000,000(a) | ABPCI Direct Lending Fund CLO X LP, Series 2020-10A, Class A1A, 6.758% (3 Month USD LIBOR + 195 bps), 1/20/32 (144A) | 4,950,370 | ||||
| 1,687,336 | ACC Auto Trust, Series 2021-A, Class A, 1.08%, 4/15/27 (144A) | 1,674,160 | ||||
| 12,611,000 | ACC Auto Trust, Series 2021-A, Class B, 1.79%, 4/15/27 (144A) | 12,280,266 | ||||
| 2,105,322 | ACC Auto Trust, Series 2022-A, Class A, 4.58%, 7/15/26 (144A) | 2,072,241 | ||||
| 2,000,000 | ACC Auto Trust, Series 2022-A, Class D, 10.07%, 3/15/29 (144A) | 1,922,502 | ||||
| 2,393,804 | ACHV ABS Trust, Series 2023-1PL, Class A, 6.42%, 3/18/30 (144A) | 2,391,227 | ||||
| 1,000,000 | ACM Auto Trust, Series 2022-1A, Class C, 5.48%, 4/20/29 (144A) | 989,845 | ||||
| 4,562,000 | ACM Auto Trust, Series 2022-1A, Class D, 8.58%, 4/20/29 (144A) | 4,468,406 | ||||
| 8,415,261 | ACM Auto Trust, Series 2023-1A, Class A, 6.61%, 1/22/30 (144A) | 8,404,661 | ||||
| 7,750,000 | ACM Auto Trust, Series 2023-1A, Class C, 8.59%, 1/22/30 (144A) | 7,727,065 | ||||
| 12,900,000(a) | ACRES Commercial Realty, Ltd., Series 2021-FL2, Class A, 6.109% (1 Month USD LIBOR + 140 bps), 1/15/37 (144A) | 12,563,604 | ||||
| 2,586,112(a) | Allegro CLO XIII, Ltd., Series 2021-1A, Class X, 5.808% (3 Month USD LIBOR + 100 bps), 7/20/34 (144A) | 2,575,106 | ||||
| 2,562,500(a) | Allegro CLO XIV, Ltd., Series 2021-2A, Class X, 5.792% (3 Month USD LIBOR + 100 bps), 10/15/34 (144A) | 2,561,011 | ||||
| 8,570,000 | AM Capital Funding LLC, Series 2018-1, Class A, 4.98%, 12/15/23 (144A) | 8,470,310 | ||||
| 3,035,000 | American Credit Acceptance Receivables Trust, Series 2020-3, Class E, 3.88%, 8/13/26 (144A) | 2,974,284 | ||||
| Principal
Amount USD ($) |
Value | |||||
| Asset Backed Securities — (continued) | ||||||
| 8,599,535 | American Credit Acceptance Receivables Trust, Series 2023-1, Class A, 5.45%, 9/14/26 (144A) | $ 8,579,783 | ||||
| 6,500,000(a) | Americredit Automobile Receivables Trust, Series 2023-1, Class A2B, 5.288% (SOFR30A + 73 bps), 10/19/26 | 6,488,293 | ||||
| 16,206(a) | Amortizing Residential Collateral Trust, Series 2002-BC5, Class M1, 5.88% (1 Month USD LIBOR + 103 bps), 7/25/32 | 16,012 | ||||
| 2,500,000 | Amur Equipment Finance Receivables IX LLC, Series 2021-1A, Class C, 1.75%, 6/21/27 (144A) | 2,346,506 | ||||
| 1,750,000 | Amur Equipment Finance Receivables IX LLC, Series 2021-1A, Class D, 2.30%, 11/22/27 (144A) | 1,616,372 | ||||
| 2,300,000(a) | Antares CLO LTD, Series 2019-2A, Class D, 9.565% (3 Month USD LIBOR + 475 bps), 1/23/32 (144A) | 2,077,947 | ||||
| 2,068,467(a) | Apres Static CLO, Ltd., Series 2019-1A, Class A1R, 5.862% (3 Month USD LIBOR + 107 bps), 10/15/28 (144A) | 2,054,999 | ||||
| 2,420,587 | Aqua Finance Trust, Series 2019-A, Class A, 3.14%, 7/16/40 (144A) | 2,289,201 | ||||
| 4,485,856 | Aqua Finance Trust, Series 2020-AA, Class A, 1.90%, 7/17/46 (144A) | 4,186,046 | ||||
| 5,245,826 | Aqua Finance Trust, Series 2021-A, Class A, 1.54%, 7/17/46 (144A) | 4,705,412 | ||||
| 7,500,000(a) | Arbor Realty Collateralized Loan Obligation, Ltd., Series 2020-FL1, Class D, 7.392% (1 Month Term SOFR + 256 bps), 2/15/35 (144A) | 7,312,146 | ||||
| 1,000,000(a) | Arbor Realty Commercial Real Estate Notes, Ltd., Series 2021-FL3, Class D, 6.884% (1 Month USD LIBOR + 220 bps), 8/15/34 (144A) | 916,590 | ||||
| 2,500,000(a) | Arbor Realty Commercial Real Estate Notes, Ltd., Series 2021-FL4, Class E, 8.084% (1 Month USD LIBOR + 340 bps), 11/15/36 (144A) | 2,179,353 | ||||
| 1,500,000(a) | Arbor Realty Commercial Real Estate Notes, Ltd., Series 2022-FL1, Class E, 8.308% (SOFR30A + 375 bps), 1/15/37 (144A) | 1,326,233 | ||||
| 4,000,000(a) | Ares LVII CLO, Ltd., Series 2020-57A, Class XR, 5.818% (3 Month USD LIBOR + 100 bps), 1/25/35 (144A) | 3,999,800 | ||||
| 5,191,362 | Arivo Acceptance Auto Loan Receivables Trust, Series 2022-1A, Class A, 3.93%, 5/15/28 (144A) | 5,050,217 | ||||
| 250,000(a) | ASSURANT CLO Ltd., Series 2018-2A, Class D, 7.658% (3 Month USD LIBOR + 285 bps), 4/20/31 (144A) | 230,906 | ||||
| 1,508,990 | Atalaya Equipment Leasing Trust, Series 2021-1A, Class A2, 1.23%, 5/15/26 (144A) | 1,470,881 | ||||
| Principal
Amount USD ($) |
Value | |||||
| Asset Backed Securities — (continued) | ||||||
| 4,064,037(a) | Atlas Senior Loan Fund III, Ltd., Series 2013-1A, Class AR, 5.707% (3 Month USD LIBOR + 83 bps), 11/17/27 (144A) | $ 4,037,726 | ||||
| 10,000,000(a) | AUF Funding LLC, Series 2022-1A, Class A1LN, 7.058% (3 Month Term SOFR + 250 bps), 1/20/31 (144A) | 9,981,840 | ||||
| 1,600,000 | Avid Automobile Receivables Trust, Series 2021-1, Class F, 5.16%, 10/16/28 (144A) | 1,438,967 | ||||
| 7,668,282 | Avid Automobile Receivables Trust, Series 2023-1, Class A, 6.63%, 7/15/26 (144A) | 7,675,023 | ||||
| 3,000,000 | Avid Automobile Receivables Trust, Series 2023-1, Class B, 7.12%, 3/15/27 (144A) | 3,000,869 | ||||
| 6,250,000(a) | Barings Middle Market CLO, Ltd., Series 2018-IA, Class A1, 6.322% (3 Month USD LIBOR + 153 bps), 1/15/31 (144A) | 6,175,575 | ||||
| 3,500,000(a) | BDS, Ltd., Series 2020-FL5, Class C, 6.856% (1 Month Term SOFR + 216 bps), 2/16/37 (144A) | 3,397,369 | ||||
| 174,971(a) | Bear Stearns Asset Backed Securities Trust, Series 2001-3, Class A1, 5.745% (1 Month USD LIBOR + 90 bps), 10/27/32 | 170,663 | ||||
| 1,430,422 | BHG Securitization Trust, Series 2021-B, Class A, 0.90%, 10/17/34 (144A) | 1,362,572 | ||||
| 3,975,619 | BHG Securitization Trust, Series 2022-C, Class A, 5.32%, 10/17/35 (144A) | 3,941,455 | ||||
| 1,993,242(a) | Black Diamond CLO, Ltd., Series 2017-1A, Class A1AR, 5.866% (3 Month USD LIBOR + 105 bps), 4/24/29 (144A) | 1,988,079 | ||||
| 3,306,657 | Blackbird Capital Aircraft, Series 2021-1A, Class A, 2.443%, 7/15/46 (144A) | 2,866,210 | ||||
| 5,500,000(a) | Brightwood Capital MM CLO, Ltd., Series 2020-1A, Class B1R, 8.074% (3 Month Term SOFR + 375 bps), 1/15/31 (144A) | 5,468,551 | ||||
| 1,500,000(a) | Brightwood Capital MM CLO, Ltd., Series 2020-1A, Class C1R, 9.837% (3 Month Term SOFR + 550 bps), 1/15/31 (144A) | 1,481,169 | ||||
| 5,900,000(a) | Brightwood Capital MM CLO, Ltd., Series 2020-1A, Class DR, 10.574% (3 Month Term SOFR + 625 bps), 1/15/31 (144A) | 5,600,286 | ||||
| 9,825,000(a) | BRSP, Ltd., Series 2021-FL1, Class A, 5.911% (1 Month USD LIBOR + 115 bps), 8/19/38 (144A) | 9,505,059 | ||||
| 4,050,000(a) | BRSP, Ltd., Series 2021-FL1, Class D, 7.461% (1 Month USD LIBOR + 270 bps), 8/19/38 (144A) | 3,762,547 | ||||
| 3,600,000(a) | BRSP, Ltd., Series 2021-FL1, Class E, 8.211% (1 Month USD LIBOR + 345 bps), 8/19/38 (144A) | 3,397,093 | ||||
| 2,000,000(a) | BSPRT Issuer, Ltd., Series 2021-FL7, Class D, 7.434% (1 Month USD LIBOR + 275 bps), 12/15/38 (144A) | 1,875,168 | ||||
| Principal
Amount USD ($) |
Value | |||||
| Asset Backed Securities — (continued) | ||||||
| 369,912 | BXG Receivables Note Trust, Series 2020-A, Class B, 2.49%, 2/28/36 (144A) | $ 333,363 | ||||
| 8,000,000(a) | CAL Receivables LLC, Series 2022-1, Class B, 8.908% (SOFR30A + 435 bps), 10/15/26 (144A) | 7,712,728 | ||||
| 7,950,000 | CarNow Auto Receivables Trust, Series 2020-1A, Class D, 7.36%, 9/16/24 (144A) | 7,954,097 | ||||
| 72,352 | CarNow Auto Receivables Trust, Series 2021-1A, Class B, 1.38%, 2/17/26 (144A) | 72,187 | ||||
| 774,074 | CarNow Auto Receivables Trust, Series 2022-1A, Class A, 3.44%, 7/15/24 (144A) | 773,194 | ||||
| 1,750,000 | CarNow Auto Receivables Trust, Series 2022-1A, Class B, 4.89%, 3/16/26 (144A) | 1,728,341 | ||||
| 2,333,581 | CarNow Auto Receivables Trust, Series 2023-1A, Class A, 6.62%, 12/16/24 (144A) | 2,336,109 | ||||
| 2,000,000 | CarNow Auto Receivables Trust, Series 2023-1A, Class D, 7.99%, 2/15/28 (144A) | 1,970,244 | ||||
| 2,848,799 | Cartiga Asset Finance Trust LLC, Series 2023-1, Class A, 7.00%, 3/15/35 (144A) | 2,850,109 | ||||
| 2,490,458 | Carvana Auto Receivables Trust, Series 2019-4A, Class D, 3.07%, 7/15/25 (144A) | 2,457,966 | ||||
| 4,732,601 | Carvana Auto Receivables Trust, Series 2020-N1A, Class D, 3.43%, 1/15/26 (144A) | 4,669,062 | ||||
| 3,504,854 | Carvana Auto Receivables Trust, Series 2021-N3, Class A1, 0.35%, 6/12/28 | 3,421,182 | ||||
| 1,000,000 | Carvana Auto Receivables Trust, Series 2021-P2, Class D, 2.02%, 5/10/28 | 835,972 | ||||
| 13(c) | Centex Home Equity Loan Trust, Series 2003-A, Class AF6, 3.654%, 3/25/33 | 13 | ||||
| 1,143,592(a) | Cerberus Loan Funding XXVIII LP, Series 2020-1A, Class A, 6.642% (3 Month USD LIBOR + 185 bps), 10/15/31 (144A) | 1,134,872 | ||||
| 2,511,898(a) | Chesapeake Funding II LLC, Series 2020-1A, Class A2, 5.334% (1 Month USD LIBOR + 65 bps), 8/15/32 (144A) | 2,511,365 | ||||
| 1,500,000(a) | Churchill Middle Market CLO III, Ltd., Series 2021-1A, Class C, 7.416% (3 Month USD LIBOR + 260 bps), 10/24/33 (144A) | 1,376,582 | ||||
| 5,000,000(a) | Churchill Middle Market CLO III, Ltd., Series 2021-1A, Class E, 12.976% (3 Month USD LIBOR + 816 bps), 10/24/33 (144A) | 4,237,495 | ||||
| 4,800,000(a) | CIFC Funding, Ltd., Series 2021-7A, Class X, 5.715% (3 Month USD LIBOR + 90 bps), 1/23/35 (144A) | 4,796,976 | ||||
| 5,379,687 | CIG Auto Receivables Trust, Series 2019-1A, Class D, 4.85%, 5/15/26 (144A) | 5,354,473 | ||||
| Principal
Amount USD ($) |
Value | |||||
| Asset Backed Securities — (continued) | ||||||
| 672,022 | CIG Auto Receivables Trust, Series 2021-1A, Class A, 0.69%, 4/14/25 (144A) | $ 658,442 | ||||
| 3,770,000 | CIG Auto Receivables Trust, Series 2021-1A, Class C, 1.79%, 4/12/27 (144A) | 3,588,533 | ||||
| 515,000(a) | Citibank Credit Card Issuance Trust, Series 2018-A4, Class A4, 5.049% (1 Month USD LIBOR + 34 bps), 6/9/25 | 515,047 | ||||
| 3,977,130 | Commercial Equipment Finance LLC, Series 2021-A, Class A, 2.05%, 2/16/27 (144A) | 3,847,213 | ||||
| 353,296 | Commonbond Student Loan Trust, Series 2016-B, Class A1, 2.73%, 10/25/40 (144A) | 332,686 | ||||
| 97,194(a) | Commonbond Student Loan Trust, Series 2016-B, Class A2, 6.295% (1 Month USD LIBOR + 145 bps), 10/25/40 (144A) | 95,413 | ||||
| 949,779(a) | Commonbond Student Loan Trust, Series 2017-AGS, Class A2, 5.695% (1 Month USD LIBOR + 85 bps), 5/25/41 (144A) | 931,260 | ||||
| 1,338,677(a) | Commonbond Student Loan Trust, Series 2017-BGS, Class A2, 5.495% (1 Month USD LIBOR + 65 bps), 9/25/42 (144A) | 1,286,093 | ||||
| 70,511 | Commonbond Student Loan Trust, Series 2017-BGS, Class C, 4.44%, 9/25/42 (144A) | 61,504 | ||||
| 1,026,767(a) | Commonbond Student Loan Trust, Series 2018-AGS, Class A2, 5.345% (1 Month USD LIBOR + 50 bps), 2/25/44 (144A) | 995,885 | ||||
| 2,055,232(a) | Commonbond Student Loan Trust, Series 2018-BGS, Class A2, 5.415% (1 Month USD LIBOR + 57 bps), 9/25/45 (144A) | 1,997,334 | ||||
| 1,155,021(a) | Commonbond Student Loan Trust, Series 2018-CGS, Class A2, 5.645% (1 Month USD LIBOR + 80 bps), 2/25/46 (144A) | 1,138,179 | ||||
| 2,034,699(a) | Commonbond Student Loan Trust, Series 2019-AGS, Class A2, 5.745% (1 Month USD LIBOR + 90 bps), 1/25/47 (144A) | 1,995,055 | ||||
| 6,414,334 | Conn's Receivables Funding LLC, Series 2021-A, Class B, 2.87%, 5/15/26 (144A) | 6,352,099 | ||||
| 1,588,498 | Conn's Receivables Funding LLC, Series 2021-A, Class C, 4.59%, 5/15/26 (144A) | 1,537,353 | ||||
| 4,470,000 | Continental Credit Card ABS LLC, Series 2019-1A, Class B, 4.95%, 8/15/26 (144A) | 4,410,934 | ||||
| 4,398,000 | Continental Credit Card ABS LLC, Series 2019-1A, Class C, 6.16%, 8/15/26 (144A) | 4,290,012 | ||||
| 3,927,366 | Credit Acceptance Auto Loan Trust, Series 2020-1A, Class C, 2.59%, 6/15/29 (144A) | 3,921,702 | ||||
| 1,355,971 | Credito Real USA Auto Receivables Trust, Series 2021-1A, Class A, 1.35%, 2/16/27 (144A) | 1,332,301 | ||||
| Principal
Amount USD ($) |
Value | |||||
| Asset Backed Securities — (continued) | ||||||
| 7,870,000 | Credito Real USA Auto Receivables Trust, Series 2021-1A, Class B, 2.87%, 2/16/27 (144A) | $ 7,483,620 | ||||
| 1,350,000 | Crossroads Asset Trust, Series 2021-A, Class B, 1.12%, 6/20/25 (144A) | 1,333,863 | ||||
| 500,000 | Crossroads Asset Trust, Series 2021-A, Class D, 2.52%, 1/20/26 (144A) | 475,938 | ||||
| 78 | Delta Funding Home Equity Loan Trust, Series 1997-2, Class A6, 7.04%, 6/25/27 | 38 | ||||
| 8,000,000 | Dext ABS LLC, 5.68%, 3/15/24 (144A) | 8,000,000 | ||||
| 2,000,000 | Dext ABS LLC, Series 2023-1, Class A2, 5.99%, 3/15/32 (144A) | 1,999,821 | ||||
| 3,606,599(a) | Donlen Fleet Lease Funding 2 LLC, Series 2021-2, Class A1, 5.09% (1 Month USD LIBOR + 33 bps), 12/11/34 (144A) | 3,592,791 | ||||
| 467,948(a) | DRB Prime Student Loan Trust, Series 2017-A, Class A1, 5.695% (1 Month USD LIBOR + 85 bps), 5/27/42 (144A) | 467,508 | ||||
| 4,900,000(a) | Ellington CLO III, Ltd., Series 2018-3A, Class B, 6.808% (3 Month USD LIBOR + 200 bps), 7/20/30 (144A) | 4,755,401 | ||||
| 6,500,000(a) | Ellington CLO III, Ltd., Series 2018-3A, Class C, 7.058% (3 Month USD LIBOR + 225 bps), 7/20/30 (144A) | 6,156,397 | ||||
| 1,867,652(a) | Ellington CLO IV, Ltd., Series 2019-4A, Class AR, 6.372% (3 Month USD LIBOR + 158 bps), 4/15/29 (144A) | 1,861,722 | ||||
| 7,000,000(a) | Ellington CLO IV, Ltd., Series 2019-4A, Class BR, 6.792% (3 Month USD LIBOR + 200 bps), 4/15/29 (144A) | 6,948,298 | ||||
| 3,362,500(a) | Ellington CLO IV, Ltd., Series 2019-4A, Class CR, 7.542% (3 Month USD LIBOR + 275 bps), 4/15/29 (144A) | 3,307,510 | ||||
| 750,000(a) | Elmwood CLO IV, Ltd., Series 2020-1A, Class X, 5.492% (3 Month USD LIBOR + 70 bps), 4/15/33 (144A) | 749,963 | ||||
| 9,425,000 | Exeter Automobile Receivables Trust, Series 2020-2A, Class D, 4.73%, 4/15/26 (144A) | 9,349,368 | ||||
| 2,500,000 | Exeter Automobile Receivables Trust, Series 2023-1A, Class A3, 5.58%, 4/15/26 | 2,504,010 | ||||
| 57,877 | FCI Funding LLC, Series 2019-1A, Class A, 3.63%, 2/18/31 (144A) | 57,807 | ||||
| 1,967,944 | FCI Funding LLC, Series 2021-1A, Class A, 1.13%, 4/15/33 (144A) | 1,914,091 | ||||
| 1,475,958 | FCI Funding LLC, Series 2021-1A, Class B, 1.53%, 4/15/33 (144A) | 1,429,474 | ||||
| Principal
Amount USD ($) |
Value | |||||
| Asset Backed Securities — (continued) | ||||||
| 3,487,356 | FHF Trust, Series 2021-1A, Class A, 1.27%, 3/15/27 (144A) | $ 3,349,403 | ||||
| 2,071,664 | FHF Trust, Series 2021-2A, Class A, 0.83%, 12/15/26 (144A) | 1,972,776 | ||||
| 7,000,000 | Flagship Credit Auto Trust, Series 2023-1, Class A2, 5.38%, 12/15/26 (144A) | 6,980,407 | ||||
| 3,000,000(a) | Ford Credit Auto Owner Trust, Series 2023-A, Class A2B, 5.322% (SOFR30A + 72 bps), 3/15/26 | 3,003,668 | ||||
| 5,000,000(a) | Fort Washington CLO, Series 2019-1A, Class AR, 5.938% (3 Month USD LIBOR + 113 bps), 10/20/32 (144A) | 4,916,965 | ||||
| 8,250,000(a) | Fortress Credit Opportunities IX CLO, Ltd., Series 2017-9A, Class A1TR, 6.342% (3 Month USD LIBOR + 155 bps), 10/15/33 (144A) | 7,966,010 | ||||
| 2,401,159(a) | Fortress Credit Opportunities VI CLO, Ltd., Series 2015-6A, Class A1TR, 6.17% (3 Month USD LIBOR + 136 bps), 7/10/30 (144A) | 2,381,376 | ||||
| 8,006,846(a) | Fortress Credit Opportunities XVII CLO, Ltd., Series 2022-17A, Class A, 6.028% (3 Month Term SOFR + 137 bps), 1/15/30 (144A) | 7,904,358 | ||||
| 7,000,000(a) | Fortress Credit Opportunities XVII CLO, Ltd., Series 2022-17A, Class C, 7.308% (3 Month Term SOFR + 265 bps), 1/15/30 (144A) | 6,637,323 | ||||
| 5,094,054 | Foundation Finance Trust, Series 2021-1A, Class A, 1.27%, 5/15/41 (144A) | 4,531,089 | ||||
| 2,920,262 | Foundation Finance Trust, Series 2021-2A, Class A, 2.19%, 1/15/42 (144A) | 2,686,717 | ||||
| 3,250,000 | Foursight Capital Automobile Receivables Trust, Series 2023-1, Class A2, 5.43%, 10/15/26 (144A) | 3,235,245 | ||||
| 1,300,000 | Freed ABS Trust, Series 2021-1CP, Class C, 2.83%, 3/20/28 (144A) | 1,276,114 | ||||
| 1,000,000 | Freed ABS Trust, Series 2021-3FP, Class D, 2.37%, 11/20/28 (144A) | 919,783 | ||||
| 12,000,000 | Genesis Sales Finance Master Trust, Series 2021-AA, Class A, 1.20%, 12/21/26 (144A) | 11,347,685 | ||||
| 1,000,000 | Genesis Sales Finance Master Trust, Series 2021-AA, Class D, 2.09%, 12/21/26 (144A) | 919,871 | ||||
| 10,000,000 | GLS Auto Receivables Issuer Trust, Series 2023-1A, Class A2, 5.98%, 8/17/26 (144A) | 10,021,193 | ||||
| 2,695,000 | GLS Auto Receivables Issuer Trust, Series 2023-1A, Class D, 7.01%, 1/16/29 (144A) | 2,739,519 | ||||
| 323,344 | Gold Key Resorts LLC, Series 2014-A, Class B, 3.72%, 3/17/31 (144A) | 319,151 | ||||
| Principal
Amount USD ($) |
Value | |||||
| Asset Backed Securities — (continued) | ||||||
| 500,000(a) | Goldentree Loan Management US CLO 1, Ltd., Series 2017-1A, Class ER2, 11.308% (3 Month USD LIBOR + 650 bps), 4/20/34 (144A) | $ 458,270 | ||||
| 4,024,490(a) | Golub Capital Partners CLO 24M-R, Ltd., Series 2015-24A, Class AR, 6.406% (3 Month USD LIBOR + 160 bps), 11/5/29 (144A) | 3,959,929 | ||||
| 8,258,707(a) | Golub Capital Partners CLO 25M, Ltd., Series 2015-25A, Class AR, 6.186% (3 Month USD LIBOR + 138 bps), 5/5/30 (144A) | 8,149,634 | ||||
| 10,000,000(a) | Golub Capital Partners CLO 34M, Ltd., Series 2017-34A, Class AR, 6.506% (3 Month USD LIBOR + 170 bps), 3/14/31 (144A) | 9,837,710 | ||||
| 5,000,000(a) | Golub Capital Partners CLO 46M, Ltd., Series 2019-46A, Class A1A, 6.608% (3 Month USD LIBOR + 180 bps), 4/20/32 (144A) | 4,928,510 | ||||
| 9,221,017(a) | Gracie Point International Funding, Series 2021-1A, Class A, 5.598% (1 Month USD LIBOR + 75 bps), 11/1/23 (144A) | 9,215,595 | ||||
| 1,889,000(a) | Gracie Point International Funding, Series 2021-1A, Class C, 7.248% (1 Month USD LIBOR + 240 bps), 11/1/23 (144A) | 1,886,398 | ||||
| 19,961,273(a) | Gracie Point International Funding, Series 2022-1A, Class A, 6.871% (SOFR30A + 225 bps), 4/1/24 (144A) | 19,876,739 | ||||
| 1,405,000(a) | Gracie Point International Funding, Series 2022-1A, Class D, 9.121% (SOFR30A + 450 bps), 4/1/24 (144A) | 1,397,428 | ||||
| 4,600,000(a) | Gracie Point International Funding, Series 2022-2A, Class A, 7.38% (SOFR30A + 275 bps), 7/1/24 (144A) | 4,601,363 | ||||
| 500,000(a) | Gracie Point International Funding, Series 2022-2A, Class D, 10.017% (SOFR30A + 550 bps), 7/1/24 (144A) | 500,108 | ||||
| 2,500,000(a) | Gracie Point International Funding, Series 2022-2A, Class E, 11.517% (SOFR30A + 700 bps), 7/1/24 (144A) | 2,500,433 | ||||
| 5,000,000(a) | Gracie Point International Funding, Series 2022-3A, Class A, 7.767% (SOFR30A + 325 bps), 11/1/24 (144A) | 5,007,834 | ||||
| 3,000,000(a) | Gracie Point International Funding, Series 2022-3A, Class C, 9.017% (SOFR30A + 450 bps), 11/1/24 (144A) | 3,004,676 | ||||
| 1,000,000(a) | Gracie Point International Funding, Series 2022-3A, Class D, 10.267% (SOFR30A + 575 bps), 11/1/24 (144A) | 1,001,551 | ||||
| Principal
Amount USD ($) |
Value | |||||
| Asset Backed Securities — (continued) | ||||||
| 3,520,000(a) | Great Lakes CLO VI LLC, Series 2021-6A, Class AX, 5.992% (3 Month USD LIBOR + 120 bps), 1/15/34 (144A) | $ 3,466,661 | ||||
| 5,220,500 | HOA Funding LLC - HOA, Series 2021-1A, Class A2, 4.723%, 8/20/51 (144A) | 4,321,702 | ||||
| 2,050,000 | HOA Funding LLC - HOA, Series 2021-1A, Class B, 7.432%, 8/20/51 (144A) | 1,634,852 | ||||
| 4,000,000(a) | ICG US CLO, Ltd., Series 2017-1A, Class ERR, 12.162% (3 Month USD LIBOR + 736 bps), 7/28/34 (144A) | 3,395,820 | ||||
| 3,375,000(a) | Ivy Hill Middle Market Credit Fund IX, Ltd., Series 9A, Class XRR, 5.853% (3 Month Term SOFR + 120 bps), 4/23/34 (144A) | 3,314,523 | ||||
| 7,000,000(a) | Ivy Hill Middle Market Credit Fund XII, Ltd., Series 12A, Class A1TR, 6.408% (3 Month USD LIBOR + 160 bps), 7/20/33 (144A) | 6,781,404 | ||||
| 524,516 | JPMorgan Chase Bank N.A. - CACLN, Series 2020-1, Class B, 0.991%, 1/25/28 (144A) | 518,824 | ||||
| 74,901 | JPMorgan Chase Bank N.A. - CACLN, Series 2020-2, Class B, 0.84%, 2/25/28 (144A) | 73,399 | ||||
| 2,648,648 | JPMorgan Chase Bank N.A. - CACLN, Series 2021-1, Class B, 0.875%, 9/25/28 (144A) | 2,564,789 | ||||
| 608,600 | JPMorgan Chase Bank N.A. - CACLN, Series 2021-1, Class C, 1.024%, 9/25/28 (144A) | 589,178 | ||||
| 588,588 | JPMorgan Chase Bank N.A. - CACLN, Series 2021-1, Class D, 1.174%, 9/25/28 (144A) | 569,459 | ||||
| 4,000,000 | JPMorgan Chase Bank N.A. - CACLN, Series 2021-1, Class F, 4.28%, 9/25/28 (144A) | 3,663,382 | ||||
| 3,175,074 | JPMorgan Chase Bank N.A. - CACLN, Series 2021-2, Class B, 0.889%, 12/26/28 (144A) | 3,060,595 | ||||
| 285,757 | JPMorgan Chase Bank N.A. - CACLN, Series 2021-2, Class C, 0.969%, 12/26/28 (144A) | 275,240 | ||||
| 564,458 | JPMorgan Chase Bank N.A. - CACLN, Series 2021-2, Class D, 1.138%, 12/26/28 (144A) | 543,786 | ||||
| 711,231 | JPMorgan Chase Bank N.A. - CACLN, Series 2021-3, Class B, 0.76%, 2/26/29 (144A) | 674,766 | ||||
| 11,300,000 | Kubota Credit Owner Trust, Series 2023-1A, Class A2, 5.40%, 2/17/26 (144A) | 11,287,666 | ||||
| 5,250,000 | LAD Auto Receivables Trust, Series 2023-1A, Class A2, 5.68%, 10/15/26 (144A) | 5,241,855 | ||||
| 1,862,009(a) | Laurel Road Prime Student Loan Trust, Series 2017-C, Class A1, 5.395% (1 Month USD LIBOR + 55 bps), 11/25/42 (144A) | 1,839,901 | ||||
| 100,000(a) | LCM 28, Ltd., Series 28A, Class X, 5.708% (3 Month USD LIBOR + 90 bps), 10/20/30 (144A) | 99,995 | ||||
| Principal
Amount USD ($) |
Value | |||||
| Asset Backed Securities — (continued) | ||||||
| 8,000,000(a) | LCM XVIII LP, Series 18A, Class A1R, 5.828% (3 Month USD LIBOR + 102 bps), 4/20/31 (144A) | $ 7,879,688 | ||||
| 4,327,774 | Lendingpoint Asset Securitization Trust, Series 2021-A, Class B, 1.46%, 12/15/28 (144A) | 4,302,725 | ||||
| 2,794,513 | Lendingpoint Asset Securitization Trust, Series 2022-A, Class A, 1.68%, 6/15/29 (144A) | 2,777,693 | ||||
| 17,398,716 | Lendingpoint Asset Securitization Trust, Series 2022-C, Class A, 6.56%, 2/15/30 (144A) | 17,341,721 | ||||
| 9,000,000 | LendingPoint Asset Securitization Trust, Series 2020-REV1, Class B, 4.494%, 10/15/28 (144A) | 8,796,991 | ||||
| 1,230,353 | LendingPoint Pass-Through Trust Series, Series 2022-ST1, Class A, 2.50%, 3/15/28 (144A) | 1,175,924 | ||||
| 3,924,291 | LFS LLC, Series 2021-A, Class A, 2.46%, 4/15/33 (144A) | 3,749,104 | ||||
| 8,138,882 | LFS LLC, Series 2021-B, Class A, 2.40%, 12/15/33 (144A) | 7,639,887 | ||||
| 6,790,054 | Libra Solutions LLC, Series 2022-1A, Class A, 4.75%, 5/15/34 (144A) | 6,687,406 | ||||
| 11,782,722 | Libra Solutions LLC, Series 2023-1A, Class A, 7.00%, 2/15/35 (144A) | 11,754,100 | ||||
| 5,302,225 | Libra Solutions LLC, Series 2023-1A, Class B, 10.25%, 2/15/35 (144A) | 5,299,574 | ||||
| 1,459,276 | Lunar Structured Aircraft Portfolio Notes, Series 2021-1, Class A, 2.636%, 10/15/46 (144A) | 1,269,877 | ||||
| 5,938,059(a) | Magnetite VII, Ltd., Series 2012-7A, Class A1R2, 5.592% (3 Month USD LIBOR + 80 bps), 1/15/28 (144A) | 5,882,656 | ||||
| 20,395 | Marlette Funding Trust, Series 2019-1A, Class C, 4.42%, 4/16/29 (144A) | 20,363 | ||||
| 1,835,446 | Marlette Funding Trust, Series 2022-1A, Class A, 1.36%, 4/15/32 (144A) | 1,814,962 | ||||
| 2,007,081 | Marlette Funding Trust, Series 2022-3A, Class A, 5.18%, 11/15/32 (144A) | 1,991,909 | ||||
| 2,000,000(a) | MCF CLO IX, Ltd., Series 2019-1A, Class A2R, 6.408% (3 Month Term SOFR + 175 bps), 7/17/31 (144A) | 1,907,660 | ||||
| 4,530,000(a) | MCF CLO IX, Ltd., Series 2019-1A, Class CR, 7.358% (3 Month Term SOFR + 270 bps), 7/17/31 (144A) | 4,279,287 | ||||
| 2,500,000(a) | MCF CLO VII LLC, Series 2017-3A, Class ER, 13.958% (3 Month USD LIBOR + 915 bps), 7/20/33 (144A) | 2,285,068 | ||||
| 5,587,114(a) | MCF CLO VIII, Ltd., Series 2018-1A, Class A2AR, 7.195% (3 Month USD LIBOR + 240 bps), 7/18/30 (144A) | 5,552,434 | ||||
| 10,000,000 | Mercury Financial Credit Card Master Trust, Series 2022-1A, Class A, 2.50%, 9/21/26 (144A) | 9,384,212 | ||||
| Principal
Amount USD ($) |
Value | |||||
| Asset Backed Securities — (continued) | ||||||
| 7,000,000 | Mercury Financial Credit Card Master Trust, Series 2022-1A, Class B, 3.20%, 9/21/26 (144A) | $ 6,518,830 | ||||
| 3,000,000 | Mercury Financial Credit Card Master Trust, Series 2022-2A, Class C, 10.83%, 3/22/27 (144A) | 2,916,356 | ||||
| 12,000,000 | Mercury Financial Credit Card Master Trust, Series 2023-1A, Class A, 8.04%, 9/20/27 (144A) | 12,004,265 | ||||
| 21,007(a) | Merrill Lynch Mortgage Investors Trust Series, Series 2004-OPT1, Class A1B, 5.705% (1 Month USD LIBOR + 86 bps), 6/25/35 | 21,201 | ||||
| 5,919,673(a) | MF1, Ltd., Series 2020-FL4, Class A, 6.474% (1 Month Term SOFR + 181 bps), 11/15/35 (144A) | 5,906,722 | ||||
| 9,000,000(a) | MF1, Ltd., Series 2021-FL6, Class E, 7.659% (1 Month USD LIBOR + 295 bps), 7/16/36 (144A) | 8,330,242 | ||||
| 2,300,000(a) | MF1, Ltd., Series 2021-FL7, Class D, 7.311% (1 Month USD LIBOR + 255 bps), 10/16/36 (144A) | 2,094,734 | ||||
| 3,300,000(a) | MF1, Ltd., Series 2021-FL7, Class E, 7.561% (1 Month USD LIBOR + 280 bps), 10/16/36 (144A) | 3,091,635 | ||||
| 3,645,000 | Mission Lane Credit Card Master Trust, Series 2021-A, Class A, 1.59%, 9/15/26 (144A) | 3,540,269 | ||||
| 4,000,000 | Mission Lane Credit Card Master Trust, Series 2021-A, Class B, 2.24%, 9/15/26 (144A) | 3,812,014 | ||||
| 8,051,906(a) | MJX Venture Management II LLC, Series 2014-18RR, Class A, 6.012% (3 Month USD LIBOR + 122 bps), 10/16/29 (144A) | 7,981,959 | ||||
| 1,100,000(a) | Monroe Capital MML CLO VII, Ltd., Series 2018-2A, Class D, 8.959% (3 Month USD LIBOR + 405 bps), 11/22/30 (144A) | 1,007,139 | ||||
| 145,551(a) | Morgan Stanley Home Equity Loan Trust, Series 2006-2, Class A4, 5.405% (1 Month USD LIBOR + 56 bps), 2/25/36 | 142,068 | ||||
| 2,100,378 | MVW LLC, Series 2021-1WA, Class A, 1.14%, 1/22/41 (144A) | 1,912,200 | ||||
| 988,992 | MVW Owner Trust, Series 2019-1A, Class A, 2.89%, 11/20/36 (144A) | 936,690 | ||||
| 1,394,476(a) | National Collegiate Trust, Series 2007-A, Class A, 5.14% (1 Month USD LIBOR + 30 bps), 5/25/31 (144A) | 1,336,728 | ||||
| 821,217 | Navient Private Education Refi Loan Trust, Series 2021-CA, Class A, 1.06%, 10/15/69 (144A) | 716,836 | ||||
| 3,585,365(a) | Navient Student Loan Trust, Series 2021-1A, Class A1B, 5.445% (1 Month USD LIBOR + 60 bps), 12/26/69 (144A) | 3,443,812 | ||||
| 16,517 | Nelnet Private Education Loan Trust, Series 2016-A, Class A1B, 3.60%, 12/26/40 (144A) | 16,480 | ||||
| Principal
Amount USD ($) |
Value | |||||
| Asset Backed Securities — (continued) | ||||||
| 4,318,193(a) | Nelnet Student Loan Trust, Series 2005-2, Class A5, 5.047% (3 Month USD LIBOR + 10 bps), 3/23/37 | $ 4,214,890 | ||||
| 982,902 | Nelnet Student Loan Trust, Series 2021-A, Class APT2, 1.36%, 4/20/62 (144A) | 881,552 | ||||
| 5,025,391(a) | Nelnet Student Loan Trust, Series 2021-DA, Class AFL, 5.451% (1 Month USD LIBOR + 69 bps), 4/20/62 (144A) | 4,889,891 | ||||
| 3,250,000(a) | Neuberger Berman CLO XXI, Ltd., Series 2016-21A, Class XR2, 5.708% (3 Month USD LIBOR + 90 bps), 4/20/34 (144A) | 3,248,304 | ||||
| 2,120,390(a) | Newtek Small Business Loan Trust, Series 2018-1, Class A, 7.45% (PRIME - 55 bps), 2/25/44 (144A) | 2,091,211 | ||||
| 2,120,390(a) | Newtek Small Business Loan Trust, Series 2018-1, Class B, 8.75% (PRIME + 75 bps), 2/25/44 (144A) | 2,099,503 | ||||
| 4,576,771(a) | Newtek Small Business Loan Trust, Series 2019-1, Class A, 7.10% (PRIME - 90 bps), 12/25/44 (144A) | 4,489,679 | ||||
| 976,378(a) | Newtek Small Business Loan Trust, Series 2019-1, Class B, 8.25% (PRIME + 25 bps), 12/25/44 (144A) | 956,638 | ||||
| 3,622,433(a) | Newtek Small Business Loan Trust, Series 2021-1, Class A, 7.75% (PRIME - 25 bps), 12/25/48 (144A) | 3,497,676 | ||||
| 891,898 | NMEF Funding LLC, Series 2019-A, Class C, 3.30%, 8/17/26 (144A) | 889,184 | ||||
| 9,360,000 | NMEF Funding LLC, Series 2019-A, Class D, 4.39%, 8/17/26 (144A) | 9,331,274 | ||||
| 290,000 | NMEF Funding LLC, Series 2021-A, Class B, 1.85%, 12/15/27 (144A) | 280,826 | ||||
| 2,500,000 | NMEF Funding LLC, Series 2021-A, Class D, 5.78%, 12/15/27 (144A) | 2,428,311 | ||||
| 92,907(a) | NovaStar Mortgage Funding Trust Series, Series 2003-1, Class A2, 5.625% (1 Month USD LIBOR + 78 bps), 5/25/33 | 87,916 | ||||
| 4,591,641 | Oasis Securitization Funding LLC, Series 2021-2A, Class A, 2.143%, 10/15/33 (144A) | 4,513,990 | ||||
| 2,261,071 | Oasis Securitization Funding LLC, Series 2021-2A, Class B, 5.147%, 10/15/33 (144A) | 2,219,782 | ||||
| 1,500,000(a) | Ocean Trails CLO XII, Ltd., Series 2022-12A, Class E, 12.749% (3 Month Term SOFR + 811 bps), 7/20/35 (144A) | 1,337,435 | ||||
| 771,665 | Octane Receivables Trust, Series 2020-1A, Class A, 1.71%, 2/20/25 (144A) | 765,828 | ||||
| 3,147,058 | Octane Receivables Trust, Series 2021-1A, Class A, 0.93%, 3/22/27 (144A) | 3,044,275 | ||||
| 2,750,000 | Octane Receivables Trust, Series 2021-1A, Class C, 2.23%, 11/20/28 (144A) | 2,483,982 | ||||
| Principal
Amount USD ($) |
Value | |||||
| Asset Backed Securities — (continued) | ||||||
| 574,634 | Octane Receivables Trust, Series 2021-2A, Class A, 1.21%, 9/20/28 (144A) | $ 551,665 | ||||
| 2,813,000 | Octane Receivables Trust, Series 2022-1A, Class D, 5.54%, 2/20/29 (144A) | 2,666,523 | ||||
| 4,429,043 | Octane Receivables Trust, Series 2023-1A, Class A, 5.87%, 5/21/29 (144A) | 4,438,588 | ||||
| 500,000(a) | OHA Credit Funding 5, Ltd., Series 2020-5A, Class X, 5.345% (3 Month USD LIBOR + 55 bps), 4/18/33 (144A) | 499,975 | ||||
| 3,363,356 | Oportun Funding LLC, Series 2022-1, Class A, 3.25%, 6/15/29 (144A) | 3,300,750 | ||||
| 6,000,000 | Oportun Funding XIV LLC, Series 2021-A, Class B, 1.76%, 3/8/28 (144A) | 5,642,500 | ||||
| 3,000,000 | Oportun Funding XIV LLC, Series 2021-A, Class D, 5.40%, 3/8/28 (144A) | 2,799,049 | ||||
| 10,000,000 | Oportun Issuance Trust, Series 2021-C, Class A, 2.18%, 10/8/31 (144A) | 9,003,865 | ||||
| 1,090,017 | Oscar US Funding X LLC, Series 2019-1A, Class A4, 3.27%, 5/10/26 (144A) | 1,080,168 | ||||
| 4,000,000(a) | OSD CLO, Ltd., Series 2021-23A, Class D, 7.742% (3 Month USD LIBOR + 295 bps), 4/17/31 (144A) | 3,630,060 | ||||
| 5,000,000(a) | Owl Rock CLO I, Ltd., Series 2019-1A, Class B, 7.615% (3 Month USD LIBOR + 270 bps), 5/20/31 (144A) | 4,789,880 | ||||
| 11,000,000(a) | Owl Rock CLO II, Ltd., Series 2019-2A, Class ALR, 6.358% (3 Month USD LIBOR + 155 bps), 4/20/33 (144A) | 10,653,632 | ||||
| 2,600,000(a) | Owl Rock CLO IV, Ltd., Series 2020-4A, Class A1R, 6.515% (3 Month USD LIBOR + 160 bps), 8/20/33 (144A) | 2,522,803 | ||||
| 750,000(a) | OZLM XXIII, Ltd., Series 2019-23A, Class X, 5.692% (3 Month USD LIBOR + 90 bps), 4/15/34 (144A) | 749,872 | ||||
| 851,765 | Pagaya AI Debt Selection Trust, Series 2021-1, Class A, 1.18%, 11/15/27 (144A) | 844,834 | ||||
| 300,255 | Pagaya AI Debt Selection Trust, Series 2021-5, Class A, 1.53%, 8/15/29 (144A) | 292,755 | ||||
| 14,430,856 | Pagaya AI Debt Trust, Series 2022-1, Class A, 2.03%, 10/15/29 (144A) | 13,941,851 | ||||
| 1,562,417 | Pagaya AI Debt Trust, Series 2022-5, Class A, 8.096%, 6/17/30 (144A) | 1,572,275 | ||||
| 5,000,000 | Pagaya AI Debt Trust, Series 2023-1, Class A, 7.556%, 7/15/30 (144A) | 5,002,561 | ||||
| 4,000,000(a) | Palmer Square Loan Funding, Ltd., Series 2020-4A, Class C, 8.558% (3 Month USD LIBOR + 360 bps), 11/25/28 (144A) | 3,875,056 | ||||
| Principal
Amount USD ($) |
Value | |||||
| Asset Backed Securities — (continued) | ||||||
| 1,250,000(a) | Palmer Square Loan Funding, Ltd., Series 2021-2A, Class D, 9.915% (3 Month USD LIBOR + 500 bps), 5/20/29 (144A) | $ 1,128,151 | ||||
| 16,127,652(a) | Palmer Square Loan Funding, Ltd., Series 2022-1A, Class A1, 5.682% (3 Month Term SOFR + 105 bps), 4/15/30 (144A) | 15,929,524 | ||||
| 239,894 | Pawnee Equipment Receivables Series LLC, Series 2020-1, Class A, 1.37%, 11/17/25 (144A) | 237,978 | ||||
| 3,250,000 | Pawneee Equipment Receivables Series LLC, Series 2021-1, Class D, 2.75%, 7/15/27 (144A) | 2,917,317 | ||||
| 2,166,278 | PEAR LLC, Series 2020-1, Class A, 3.75%, 12/15/32 (144A) | 2,131,514 | ||||
| 9,243,238 | PEAR LLC, Series 2021-1, Class A, 2.60%, 1/15/34 (144A) | 8,750,590 | ||||
| 3,000,000 | PEAR LLC, Series 2021-1, Class B, 0.000%, 1/15/34 (144A) | 2,053,200 | ||||
| 2,500,000 | PFS Financing Corp., Series 2021-A, Class A, 0.71%, 4/15/26 (144A) | 2,379,984 | ||||
| 4,692,527(a) | Prodigy Finance CMDAC, Series 2021-1A, Class A, 6.095% (1 Month USD LIBOR + 125 bps), 7/25/51 (144A) | 4,575,142 | ||||
| 19,292,000 | Purchasing Power Funding LLC, Series 2021-A, Class A, 1.57%, 10/15/25 (144A) | 18,862,331 | ||||
| 4,860,000 | Purchasing Power Funding LLC, Series 2021-A, Class C, 2.53%, 10/15/25 (144A) | 4,505,043 | ||||
| 2,310,000 | Purchasing Power Funding LLC, Series 2021-A, Class D, 4.37%, 10/15/25 (144A) | 2,151,050 | ||||
| 871,907(a) | RAAC Series Trust, Series 2006-RP1, Class M2, 6.045% (1 Month USD LIBOR + 120 bps), 10/25/45 (144A) | 869,351 | ||||
| 1,854,606 | Reach Financial LLC, Series 2022-1A, Class A, 3.76%, 11/15/29 (144A) | 1,823,157 | ||||
| 5,636,211(a) | ReadyCap Lending Small Business Loan Trust, Series 2019-2, Class A, 7.50% (PRIME - 50 bps), 12/27/44 (144A) | 5,380,943 | ||||
| 2,961,176(a) | Regatta VI Funding, Ltd., Series 2016-1A, Class XR, 5.608% (3 Month USD LIBOR + 80 bps), 4/20/34 (144A) | 2,959,920 | ||||
| 3,441,176(a) | Regatta VII Funding, Ltd., Series 2016-1A, Class X, 5.813% (3 Month USD LIBOR + 85 bps), 6/20/34 (144A) | 3,427,040 | ||||
| 4,000,000(a) | Regatta XXIII Funding, Ltd., Series 2021-4A, Class X, 5.758% (3 Month USD LIBOR + 95 bps), 1/20/35 (144A) | 3,999,800 | ||||
| Principal
Amount USD ($) |
Value | |||||
| Asset Backed Securities — (continued) | ||||||
| 7,500,000(a) | Rosy Blue Carat S.A., Series 2018-1, Class A2R, 0.000% (1 Month Term SOFR + 411 bps), 3/15/30 (144A) | $ 7,599,000 | ||||
| 7,230,025 | Santander Bank Auto Credit-Linked Notes, Series 2022-B, Class B, 5.721%, 8/16/32 (144A) | 7,205,129 | ||||
| 5,061,017 | Santander Bank Auto Credit-Linked Notes, Series 2022-B, Class D, 6.793%, 8/16/32 (144A) | 5,023,636 | ||||
| 3,959,738 | Santander Bank Auto Credit-Linked Notes Series, Series 2022-A, Class B, 5.281%, 5/15/32 (144A) | 3,875,064 | ||||
| 1,881,237 | Santander Bank NA - SBCLN, Series 2021-1A, Class B, 1.833%, 12/15/31 (144A) | 1,805,964 | ||||
| 1,406,437 | Santander Consumer Auto Receivables Trust, Series 2021-BA, Class B, 1.45%, 10/16/28 (144A) | 1,381,323 | ||||
| 1,474,670 | Santander Consumer Auto Receivables Trust, Series 2021-CA, Class C, 2.97%, 6/15/28 (144A) | 1,422,511 | ||||
| 14,865 | Santander Drive Auto Receivables Trust, Series 2022-2, Class A2, 2.12%, 10/15/26 | 14,843 | ||||
| 2,500,000 | Santander Drive Auto Receivables Trust, Series 2022-2, Class B, 3.44%, 9/15/27 | 2,429,798 | ||||
| 1,295,014 | SCF Equipment Leasing LLC, Series 2021-1A, Class A3, 0.83%, 8/21/28 (144A) | 1,246,033 | ||||
| 504,222 | Sierra Timeshare Receivables Funding LLC, Series 2021-1A, Class A, 0.99%, 11/20/37 (144A) | 470,003 | ||||
| 1,600,000(a) | Silver Rock CLO II, Ltd., Series 2021-2A, Class X, 5.858% (3 Month USD LIBOR + 105 bps), 1/20/35 (144A) | 1,599,216 | ||||
| 4,259,364(a) | SLM Private Credit Student Loan Trust, Series 2007-A, Class A4A, 5.106% (3 Month USD LIBOR + 24 bps), 12/16/41 | 4,039,102 | ||||
| 886,671 | Small Business Lending Trust, Series 2020-A, Class C, 5.01%, 12/15/26 (144A) | 863,918 | ||||
| 1,400,000 | SoFi Consumer Loan Program Trust, Series 2023-1S, Class A, 5.81%, 5/15/31 (144A) | 1,401,058 | ||||
| 101,516(a) | Sofi Professional Loan Program LLC, Series 2016-D, Class A1, 5.795% (1 Month USD LIBOR + 95 bps), 1/25/39 (144A) | 101,244 | ||||
| 42,712(a) | Sofi Professional Loan Program LLC, Series 2017-A, Class A1, 5.545% (1 Month USD LIBOR + 70 bps), 3/26/40 (144A) | 42,650 | ||||
| 41,879(a) | Sofi Professional Loan Program LLC, Series 2017-C, Class A1, 5.445% (1 Month USD LIBOR + 60 bps), 7/25/40 (144A) | 41,757 | ||||
| 38,848(a) | Sofi Professional Loan Program LLC, Series 2018-A, Class A1, 5.195% (1 Month USD LIBOR + 35 bps), 2/25/42 (144A) | 38,809 | ||||
| Principal
Amount USD ($) |
Value | |||||
| Asset Backed Securities — (continued) | ||||||
| 3,000,000(a) | Sound Point CLO XVI, Ltd., Series 2017-2A, Class D, 8.418% (3 Month USD LIBOR + 360 bps), 7/25/30 (144A) | $ 2,572,500 | ||||
| 2,161,726 | SpringCastle America Funding LLC, Series 2020-AA, Class A, 1.97%, 9/25/37 (144A) | 1,967,171 | ||||
| 4,765,184(a) | STAR Trust, Series 2021-SFR2, Class A, 5.659% (1 Month USD LIBOR + 95 bps), 1/17/24 (144A) | 4,644,480 | ||||
| 6,250,000(a) | STAR Trust, Series 2021-SFR2, Class E, 6.709% (1 Month USD LIBOR + 200 bps), 1/17/24 (144A) | 5,768,464 | ||||
| 2,473,845 | Stonepeak ABS, Series 2021-1A, Class AA, 2.301%, 2/28/33 (144A) | 2,264,548 | ||||
| 9,000,000(a) | STWD, Ltd., Series 2021-FL2, Class A, 5.909% (1 Month USD LIBOR + 120 bps), 4/18/38 (144A) | 8,808,327 | ||||
| 6,000,000(a) | STWD, Ltd., Series 2021-SIF1, Class A, 6.292% (3 Month USD LIBOR + 150 bps), 4/15/32 (144A) | 5,737,500 | ||||
| 3,320,000(a) | STWD, Ltd., Series 2021-SIF1, Class C, 7.142% (3 Month USD LIBOR + 235 bps), 4/15/32 (144A) | 3,099,851 | ||||
| 12,000,000(a) | STWD, Ltd., Series 2021-SIF2A, Class A1, 6.208% (3 Month Term SOFR + 155 bps), 1/15/33 (144A) | 11,829,192 | ||||
| 6,000,000(a) | STWD, Ltd., Series 2021-SIF2A, Class D, 8.508% (3 Month Term SOFR + 385 bps), 1/15/33 (144A) | 5,563,878 | ||||
| 2,750,000 | Tesla Auto Lease Trust, Series 2021-A, Class B, 1.02%, 3/20/25 (144A) | 2,665,702 | ||||
| 1,003,179 | Theorem Funding Trust, Series 2022-1A, Class A, 1.85%, 2/15/28 (144A) | 980,634 | ||||
| 3,325,000(a) | THL Credit Wind River CLO, Ltd., Series 2019-1A, Class XR, 5.758% (3 Month USD LIBOR + 95 bps), 7/20/34 (144A) | 3,323,151 | ||||
| 1,326,354 | Tidewater Auto Receivables Trust, Series 2018-AA, Class E, 5.48%, 10/15/26 (144A) | 1,324,361 | ||||
| 2,750,000 | Tidewater Auto Receivables Trust, Series 2020-AA, Class E, 3.35%, 7/17/28 (144A) | 2,663,441 | ||||
| 2,938,595(a) | Towd Point Asset Trust, Series 2018-SL1, Class A, 5.445% (1 Month USD LIBOR + 60 bps), 1/25/46 (144A) | 2,916,591 | ||||
| 11,000,000(a) | Towd Point Asset Trust, Series 2018-SL1, Class B, 5.895% (1 Month USD LIBOR + 105 bps), 1/25/46 (144A) | 10,512,842 | ||||
| 11,500,000(a) | Trafigura Securitisation Finance Plc, Series 2021-1A, Class A1, 5.214% (1 Month USD LIBOR + 53 bps), 1/15/25 (144A) | 11,191,823 | ||||
| 1,000,000 | Tricolor Auto Securitization Trust, Series 2021-1A, Class D, 1.92%, 5/15/26 (144A) | 976,901 | ||||
| 3,250,000 | Tricolor Auto Securitization Trust, Series 2021-1A, Class E, 3.23%, 9/15/26 (144A) | 3,097,269 | ||||
| Principal
Amount USD ($) |
Value | |||||
| Asset Backed Securities — (continued) | ||||||
| 802,403 | Tricolor Auto Securitization Trust, Series 2022-1A, Class A, 3.30%, 2/18/25 (144A) | $ 795,117 | ||||
| 5,000,000 | Tricolor Auto Securitization Trust, Series 2022-1A, Class E, 7.79%, 8/16/27 (144A) | 4,794,428 | ||||
| 7,518,476 | Tricolor Auto Securitization Trust, Series 2023-1A, Class A, 6.48%, 8/17/26 (144A) | 7,515,240 | ||||
| 4,018,000 | Tricon American Homes Trust, Series 2017-SFR2, Class F, 5.104%, 1/17/36 (144A) | 3,936,000 | ||||
| 16,400,000(a) | TRTX Issuer, Ltd., Series 2019-FL3, Class C, 6.958% (1 Month Term SOFR + 221 bps), 10/15/34 (144A) | 15,623,634 | ||||
| 1,180,168 | TVEST LLC, Series 2020-A, Class A, 4.50%, 7/15/32 (144A) | 1,171,761 | ||||
| 3,330,708 | TVEST LLC, Series 2021-A, Class A, 2.35%, 9/15/33 (144A) | 3,242,420 | ||||
| 4,700,000 | United Auto Credit Securitization Trust, Series 2021-1, Class F, 4.30%, 9/10/27 (144A) | 4,459,078 | ||||
| 2,500,000 | United Auto Credit Securitization Trust, Series 2022-2, Class B, 5.41%, 12/10/25 (144A) | 2,471,905 | ||||
| 2,377,421 | United Auto Credit Securitization Trust, Series 2023-1, Class A, 5.57%, 7/10/25 (144A) | 2,374,890 | ||||
| 36,178 | Upstart Pass-Through Trust Series, Series 2020-ST2, Class A, 3.50%, 3/20/28 (144A) | 35,597 | ||||
| 622,930 | Upstart Pass-Through Trust Series, Series 2021-ST4, Class A, 2.00%, 7/20/27 (144A) | 579,275 | ||||
| 2,683,575 | Upstart Pass-Through Trust Series, Series 2021-ST5, Class A, 2.00%, 7/20/27 (144A) | 2,559,882 | ||||
| 4,033,521 | Upstart Pass-Through Trust Series, Series 2022-ST2, Class A, 3.80%, 4/20/30 (144A) | 3,776,896 | ||||
| 1,704,431 | Upstart Securitization Trust, Series 2021-1, Class B, 1.89%, 3/20/31 (144A) | 1,682,860 | ||||
| 2,667,973 | Upstart Securitization Trust, Series 2021-5, Class A, 1.31%, 11/20/31 (144A) | 2,597,019 | ||||
| 26,316(a) | Venture 32 CLO, Ltd., Series 2018-32RR, Class AX, 5.548% (3 Month USD LIBOR + 75 bps), 7/19/31 (144A) | 26,230 | ||||
| 1,587,963 | Veros Auto Receivables Trust, Series 2021-1, Class A, 0.92%, 10/15/26 (144A) | 1,571,831 | ||||
| 2,000,000 | Veros Auto Receivables Trust, Series 2021-1, Class C, 3.64%, 8/15/28 (144A) | 1,867,991 | ||||
| 3,478,026 | VFI ABS LLC, Series 2022-1A, Class A, 2.23%, 3/24/28 (144A) | 3,379,175 | ||||
| 709,106 | Westgate Resorts LLC, Series 2020-1A, Class A, 2.713%, 3/20/34 (144A) | 692,304 | ||||
| 850,927 | Westgate Resorts LLC, Series 2020-1A, Class C, 6.213%, 3/20/34 (144A) | 840,933 | ||||
| Principal
Amount USD ($) |
Value | |||||
| Asset Backed Securities — (continued) | ||||||
| 4,730,650 | Westgate Resorts LLC, Series 2022-1A, Class C, 2.488%, 8/20/36 (144A) | $ 4,460,558 | ||||
| 4,015,943(a) | Westlake Automobile Receivables Trust, Series 2022-1A, Class A2B, 5.258% (SOFR30A + 70 bps), 12/16/24 (144A) | 4,013,610 | ||||
| 7,765,000(a) | Westlake Automobile Receivables Trust, Series 2023-1A, Class A2B, 5.408% (SOFR30A + 85 bps), 6/15/26 (144A) | 7,758,610 | ||||
| 9,000,000(a) | Westlake Automobile Receivables Trust, Series 2023-2A, Class A2B, 5.608% (SOFR30A + 75 bps), 7/15/26 (144A) | 8,976,700 | ||||
| 6,759,146 | Willis Engine Structured Trust VI, Series 2021-A, Class B, 5.438%, 5/15/46 (144A) | 4,733,417 | ||||
| 4,846(a) | Wilshire Mortgage Loan Trust, Series 1997-2, Class A6, 5.125% (1 Month USD LIBOR + 28 bps), 5/25/28 | 4,820 | ||||
| 5,000,000(a) | Woodmont Trust, Series 2020-7A, Class A1A, 6.692% (3 Month USD LIBOR + 190 bps), 1/15/32 (144A) | 4,904,640 | ||||
| 5,000,000(a) | World Omni Select Auto Trust, Series 2023-A, Class A2B, 5.696% (SOFR30A + 85 bps), 3/15/27 | 4,953,460 | ||||
| 6,500,000(a) | Z Capital Credit Partners CLO, Ltd., Series 2019-1A, Class BR, 6.792% (3 Month USD LIBOR + 200 bps), 7/16/31 (144A) | 6,393,751 | ||||
| 6,000,000(a) | Z Capital Credit Partners CLO, Ltd., Series 2019-1A, Class DR, 9.792% (3 Month USD LIBOR + 500 bps), 7/16/31 (144A) | 5,706,762 | ||||
| Total
Asset Backed Securities (Cost $1,266,958,730) |
$1,233,372,384 | |||||
| Collateralized Mortgage
Obligations—13.4% of Net Assets |
||||||
| 33,399(c) | Bear Stearns Mortgage Securities, Inc., Series 1997-6, Class 3B1, 3.172%, 6/25/30 | $ 32,864 | ||||
| 39,292(a) | Bellemeade Re, Ltd., Series 2018-3A, Class M1B, 6.695% (1 Month USD LIBOR + 185 bps), 10/25/28 (144A) | 39,284 | ||||
| 9,678,259(a) | Bellemeade Re, Ltd., Series 2018-3A, Class M2, 7.595% (1 Month USD LIBOR + 275 bps), 10/25/28 (144A) | 9,702,602 | ||||
| 4,136,127(a) | Bellemeade Re, Ltd., Series 2019-1A, Class M2, 7.545% (1 Month USD LIBOR + 270 bps), 3/25/29 (144A) | 4,145,094 | ||||
| 2,800,000(a) | Bellemeade Re, Ltd., Series 2019-3A, Class B1, 7.345% (1 Month USD LIBOR + 250 bps), 7/25/29 (144A) | 2,781,897 | ||||
| Principal
Amount USD ($) |
Value | |||||
| Collateralized
Mortgage Obligations—(continued) |
||||||
| 3,973,673(a) | Bellemeade Re, Ltd., Series 2019-4A, Class M1C, 7.345% (1 Month USD LIBOR + 250 bps), 10/25/29 (144A) | $ 3,982,793 | ||||
| 5,141,172(a) | Bellemeade Re, Ltd., Series 2020-3A, Class M1C, 8.545% (1 Month USD LIBOR + 370 bps), 10/25/30 (144A) | 5,204,818 | ||||
| 5,000,000(a) | Bellemeade Re, Ltd., Series 2020-4A, Class B1, 9.845% (1 Month USD LIBOR + 500 bps), 6/25/30 (144A) | 5,097,320 | ||||
| 1,579,122(a) | Bellemeade Re, Ltd., Series 2020-4A, Class M2B, 8.445% (1 Month USD LIBOR + 360 bps), 6/25/30 (144A) | 1,588,937 | ||||
| 2,900,000(a) | Bellemeade Re, Ltd., Series 2021-1A, Class M1B, 6.76% (SOFR30A + 220 bps), 3/25/31 (144A) | 2,896,399 | ||||
| 812,474(a) | Bellemeade Re, Ltd., Series 2021-2A, Class M1A, 5.76% (SOFR30A + 120 bps), 6/25/31 (144A) | 806,534 | ||||
| 6,613,208(a) | Bellemeade Re, Ltd., Series 2021-3A, Class A2, 5.56% (SOFR30A + 100 bps), 9/25/31 (144A) | 6,418,151 | ||||
| 15,000,000(a) | Bellemeade Re, Ltd., Series 2021-3A, Class M1C, 6.11% (SOFR30A + 155 bps), 9/25/31 (144A) | 14,472,613 | ||||
| 15,964,000(a) | Bellemeade Re, Ltd., Series 2022-1, Class M1C, 8.26% (SOFR30A + 370 bps), 1/26/32 (144A) | 15,515,906 | ||||
| 721,264(a) | Brass NO 8 Plc, Series 8A, Class A1, 5.572% (3 Month USD LIBOR + 70 bps), 11/16/66 (144A) | 714,553 | ||||
| 572,409(c) | BRAVO Residential Funding Trust, Series 2021-NQM2, Class A2, 1.28%, 3/25/60 (144A) | 535,430 | ||||
| 58,253(c) | Cascade Funding Mortgage Trust, Series 2019-RM3, Class A, 2.80%, 6/25/69 (144A) | 56,228 | ||||
| 8,944,226(c) | Cascade Funding Mortgage Trust, Series 2021-HB6, Class A, 0.898%, 6/25/36 (144A) | 8,481,275 | ||||
| 200,000(c) | CFMT LLC, Series 2020-HB4, Class M3, 2.72%, 12/26/30 (144A) | 185,605 | ||||
| 8,000,000(c) | CFMT LLC, Series 2020-HB4, Class M4, 4.948%, 12/26/30 (144A) | 7,426,104 | ||||
| 3,300,000(c) | CFMT LLC, Series 2021-HB5, Class M3, 2.91%, 2/25/31 (144A) | 3,061,857 | ||||
| 7,218,175(c) | CFMT LLC, Series 2021-HB7, Class A, 1.151%, 10/27/31 (144A) | 6,770,411 | ||||
| 9,000,000(c) | CFMT LLC, Series 2021-HB7, Class M2, 2.679%, 10/27/31 (144A) | 8,246,174 | ||||
| 6,450,000(c) | CFMT LLC, Series 2021-HB7, Class M4, 5.072%, 10/27/31 (144A) | 5,839,351 | ||||
| 3,042,941(c) | CFMT LLC, Series 2022-HB8, Class A, 3.75%, 4/25/25 (144A) | 2,963,125 | ||||
| Principal
Amount USD ($) |
Value | |||||
| Collateralized
Mortgage Obligations—(continued) |
||||||
| 8,000,000(c) | CFMT LLC, Series 2022-HB8, Class M3, 3.75%, 4/25/25 (144A) | $ 6,740,560 | ||||
| 7,758,307(a) | Chase Mortgage Finance Corp., Series 2021-CL1, Class M1, 5.76% (SOFR30A + 120 bps), 2/25/50 (144A) | 7,001,307 | ||||
| 2,008,032(a) | Chase Mortgage Finance Corp., Series 2021-CL1, Class M2, 5.91% (SOFR30A + 135 bps), 2/25/50 (144A) | 1,736,717 | ||||
| 1,156,140(a) | Chase Mortgage Finance Corp., Series 2021-CL1, Class M3, 6.11% (SOFR30A + 155 bps), 2/25/50 (144A) | 983,261 | ||||
| 16,393,370(a) | Connecticut Avenue Securities Trust, Series 2019-HRP1, Class M2, 6.995% (1 Month USD LIBOR + 215 bps), 11/25/39 (144A) | 16,352,480 | ||||
| 2,515,000(a) | Connecticut Avenue Securities Trust, Series 2022-R01, Class 1M2, 6.46% (SOFR30A + 190 bps), 12/25/41 (144A) | 2,407,469 | ||||
| 5,622,997(a) | Connecticut Avenue Securities Trust, Series 2022-R02, Class 2M1, 5.76% (SOFR30A + 120 bps), 1/25/42 (144A) | 5,577,535 | ||||
| 8,284,153(a) | Connecticut Avenue Securities Trust, Series 2022-R04, Class 1M1, 6.56% (SOFR30A + 200 bps), 3/25/42 (144A) | 8,289,175 | ||||
| 3,182,030(a) | Connecticut Avenue Securities Trust, Series 2022-R09, Class 2M1, 7.068% (SOFR30A + 250 bps), 9/25/42 (144A) | 3,186,697 | ||||
| 9,443,325(a) | Connecticut Avenue Securities Trust, Series 2023-R01, Class 1M1, 6.968% (SOFR30A + 240 bps), 12/25/42 (144A) | 9,464,298 | ||||
| 4,667,030(a) | Connecticut Avenue Securities Trust, Series 2023-R02, Class 1M1, 6.868% (SOFR30A + 230 bps), 1/25/43 (144A) | 4,661,853 | ||||
| 5,174(a) | CSFB Mortgage-Backed Pass-Through Certificates Series, Series 2004-AR5, Class 11A2, 5.585% (1 Month USD LIBOR + 74 bps), 6/25/34 | 5,173 | ||||
| 4,410,148(a) | Eagle Re, Ltd., Series 2018-1, Class M1, 6.545% (1 Month USD LIBOR + 170 bps), 11/25/28 (144A) | 4,405,460 | ||||
| 9,231,011(a) | Eagle Re, Ltd., Series 2019-1, Class M1B, 6.645% (1 Month USD LIBOR + 180 bps), 4/25/29 (144A) | 9,216,095 | ||||
| 4,164,253(a) | Eagle Re, Ltd., Series 2020-1, Class M1B, 6.295% (1 Month USD LIBOR + 145 bps), 1/25/30 (144A) | 4,157,257 | ||||
| 666,055(a) | Eagle Re, Ltd., Series 2021-1, Class M1B, 6.71% (SOFR30A + 215 bps), 10/25/33 (144A) | 666,030 | ||||
| 3,360,000(a) | Eagle Re, Ltd., Series 2021-2, Class M1C, 8.01% (SOFR30A + 345 bps), 4/25/34 (144A) | 3,397,331 | ||||
| Principal
Amount USD ($) |
Value | |||||
| Collateralized
Mortgage Obligations—(continued) |
||||||
| 4,095,511(a) | Fannie Mae Connecticut Avenue Securities, Series 2018-C01, Class 1EB1, 5.295% (1 Month USD LIBOR + 45 bps), 7/25/30 | $ 4,076,633 | ||||
| 1,651,912(a) | Fannie Mae Connecticut Avenue Securities, Series 2021-R02, Class 2M1, 5.46% (SOFR30A + 90 bps), 11/25/41 (144A) | 1,631,353 | ||||
| 969,695(a) | Fannie Mae Trust, Series 2003-W6, Class F, 4.967% (1 Month USD LIBOR + 35 bps), 9/25/42 | 952,282 | ||||
| 371,993(a) | Fannie Mae Trust, Series 2005-W3, Class 2AF, 5.065% (1 Month USD LIBOR + 22 bps), 3/25/45 | 367,956 | ||||
| 29,489(c) | Fannie Mae Trust, Series 2005-W3, Class 3A, 3.74%, 4/25/45 | 28,475 | ||||
| 37,804(c) | Fannie Mae Trust, Series 2005-W4, Class 3A, 3.273%, 6/25/45 | 36,628 | ||||
| 331,674(a) | Fannie Mae Whole Loan, Series 2007-W1, Class 1AF1, 5.105% (1 Month USD LIBOR + 26 bps), 11/25/46 | 327,895 | ||||
| 32,279(a) | Federal Home Loan Mortgage Corp. REMICs, Series 1695, Class EG, 5.638% (1 Month USD LIBOR + 105 bps), 3/15/24 | 32,347 | ||||
| 73,220(a) | Federal Home Loan Mortgage Corp. REMICs, Series 2106, Class F, 5.134% (1 Month USD LIBOR + 45 bps), 12/15/28 | 72,819 | ||||
| 42,679(a) | Federal Home Loan Mortgage Corp. REMICs, Series 2122, Class FD, 5.034% (1 Month USD LIBOR + 35 bps), 2/15/29 | 42,363 | ||||
| 10,166(a) | Federal Home Loan Mortgage Corp. REMICs, Series 2156, Class FQ, 5.034% (1 Month USD LIBOR + 35 bps), 5/15/29 | 10,142 | ||||
| 74,486(a) | Federal Home Loan Mortgage Corp. REMICs, Series 2186, Class FY, 5.284% (1 Month USD LIBOR + 60 bps), 4/15/28 | 74,528 | ||||
| 21,469(a) | Federal Home Loan Mortgage Corp. REMICs, Series 2368, Class AF, 5.634% (1 Month USD LIBOR + 95 bps), 10/15/31 | 21,631 | ||||
| 22,376(a) | Federal Home Loan Mortgage Corp. REMICs, Series 2377, Class FE, 5.284% (1 Month USD LIBOR + 60 bps), 11/15/31 | 22,300 | ||||
| 55,051(a) | Federal Home Loan Mortgage Corp. REMICs, Series 2411, Class FR, 5.284% (1 Month USD LIBOR + 60 bps), 6/15/31 | 54,874 | ||||
| 44,635(a) | Federal Home Loan Mortgage Corp. REMICs, Series 2432, Class FH, 5.384% (1 Month USD LIBOR + 70 bps), 3/15/32 | 44,746 | ||||
| Principal
Amount USD ($) |
Value | |||||
| Collateralized
Mortgage Obligations—(continued) |
||||||
| 125,140(a) | Federal Home Loan Mortgage Corp. REMICs, Series 2439, Class F, 5.684% (1 Month USD LIBOR + 100 bps), 3/15/32 | $ 126,660 | ||||
| 168,843(a) | Federal Home Loan Mortgage Corp. REMICs, Series 2470, Class AF, 5.684% (1 Month USD LIBOR + 100 bps), 3/15/32 | 170,844 | ||||
| 105,729(a) | Federal Home Loan Mortgage Corp. REMICs, Series 2471, Class FD, 5.684% (1 Month USD LIBOR + 100 bps), 3/15/32 | 107,013 | ||||
| 33,001(a) | Federal Home Loan Mortgage Corp. REMICs, Series 2498, Class FQ, 5.284% (1 Month USD LIBOR + 60 bps), 9/15/32 | 32,867 | ||||
| 36,178(a) | Federal Home Loan Mortgage Corp. REMICs, Series 2543, Class EF, 5.034% (1 Month USD LIBOR + 35 bps), 12/15/32 | 35,846 | ||||
| 192,260(a) | Federal Home Loan Mortgage Corp. REMICs, Series 2551, Class FD, 5.084% (1 Month USD LIBOR + 40 bps), 1/15/33 | 190,865 | ||||
| 120,962(a) | Federal Home Loan Mortgage Corp. REMICs, Series 2567, Class FJ, 5.084% (1 Month USD LIBOR + 40 bps), 2/15/33 | 120,076 | ||||
| 55,559(a) | Federal Home Loan Mortgage Corp. REMICs, Series 2577, Class FA, 5.234% (1 Month USD LIBOR + 55 bps), 2/15/33 | 55,241 | ||||
| 4,388(a) | Federal Home Loan Mortgage Corp. REMICs, Series 2585, Class FD, 5.184% (1 Month USD LIBOR + 50 bps), 12/15/32 | 4,355 | ||||
| 62,162(a) | Federal Home Loan Mortgage Corp. REMICs, Series 2614, Class FV, 6.162% (1 Month USD LIBOR + 150 bps), 5/15/33 | 62,875 | ||||
| 90,637(a) | Federal Home Loan Mortgage Corp. REMICs, Series 2631, Class FC, 5.084% (1 Month USD LIBOR + 40 bps), 6/15/33 | 89,920 | ||||
| 48,710(a) | Federal Home Loan Mortgage Corp. REMICs, Series 2711, Class FA, 5.684% (1 Month USD LIBOR + 100 bps), 11/15/33 | 49,356 | ||||
| 63,293(a) | Federal Home Loan Mortgage Corp. REMICs, Series 2916, Class NF, 4.934% (1 Month USD LIBOR + 25 bps), 1/15/35 | 62,705 | ||||
| 205,518(a) | Federal Home Loan Mortgage Corp. REMICs, Series 2976, Class LF, 5.024% (1 Month USD LIBOR + 34 bps), 5/15/35 | 202,347 | ||||
| 50,832(a) | Federal Home Loan Mortgage Corp. REMICs, Series 3012, Class FE, 4.934% (1 Month USD LIBOR + 25 bps), 8/15/35 | 50,569 | ||||
| Principal
Amount USD ($) |
Value | |||||
| Collateralized
Mortgage Obligations—(continued) |
||||||
| 53,839(a) | Federal Home Loan Mortgage Corp. REMICs, Series 3042, Class PF, 4.934% (1 Month USD LIBOR + 25 bps), 8/15/35 | $ 53,377 | ||||
| 38,410(a) | Federal Home Loan Mortgage Corp. REMICs, Series 3067, Class FA, 5.034% (1 Month USD LIBOR + 35 bps), 11/15/35 | 37,805 | ||||
| 29,939(a) | Federal Home Loan Mortgage Corp. REMICs, Series 3102, Class FG, 4.984% (1 Month USD LIBOR + 30 bps), 1/15/36 | 29,635 | ||||
| 76,475(a) | Federal Home Loan Mortgage Corp. REMICs, Series 3117, Class EF, 5.034% (1 Month USD LIBOR + 35 bps), 2/15/36 | 75,470 | ||||
| 163,777(a) | Federal Home Loan Mortgage Corp. REMICs, Series 3117, Class FE, 4.984% (1 Month USD LIBOR + 30 bps), 2/15/36 | 161,094 | ||||
| 88,186(a) | Federal Home Loan Mortgage Corp. REMICs, Series 3122, Class FP, 4.984% (1 Month USD LIBOR + 30 bps), 3/15/36 | 87,354 | ||||
| 53,745(a) | Federal Home Loan Mortgage Corp. REMICs, Series 3147, Class PF, 4.984% (1 Month USD LIBOR + 30 bps), 4/15/36 | 53,236 | ||||
| 131,941(a) | Federal Home Loan Mortgage Corp. REMICs, Series 3173, Class FC, 5.104% (1 Month USD LIBOR + 42 bps), 6/15/36 | 129,964 | ||||
| 298,346(a) | Federal Home Loan Mortgage Corp. REMICs, Series 3175, Class FE, 4.994% (1 Month USD LIBOR + 31 bps), 6/15/36 | 293,932 | ||||
| 178,530(a) | Federal Home Loan Mortgage Corp. REMICs, Series 3181, Class HF, 5.184% (1 Month USD LIBOR + 50 bps), 7/15/36 | 176,547 | ||||
| 10,876(a) | Federal Home Loan Mortgage Corp. REMICs, Series 3191, Class FE, 5.084% (1 Month USD LIBOR + 40 bps), 7/15/36 | 10,743 | ||||
| 138,449(a) | Federal Home Loan Mortgage Corp. REMICs, Series 3221, Class FW, 5.104% (1 Month USD LIBOR + 42 bps), 9/15/36 | 136,363 | ||||
| 46,280(a) | Federal Home Loan Mortgage Corp. REMICs, Series 3222, Class FN, 5.084% (1 Month USD LIBOR + 40 bps), 9/15/36 | 45,554 | ||||
| 151,857(a) | Federal Home Loan Mortgage Corp. REMICs, Series 3239, Class EF, 5.034% (1 Month USD LIBOR + 35 bps), 11/15/36 | 149,083 | ||||
| 73,904(a) | Federal Home Loan Mortgage Corp. REMICs, Series 3239, Class FB, 5.034% (1 Month USD LIBOR + 35 bps), 11/15/36 | 72,605 | ||||
| Principal
Amount USD ($) |
Value | |||||
| Collateralized
Mortgage Obligations—(continued) |
||||||
| 119,216(a) | Federal Home Loan Mortgage Corp. REMICs, Series 3247, Class FA, 4.934% (1 Month USD LIBOR + 25 bps), 8/15/36 | $ 116,305 | ||||
| 178,680(a) | Federal Home Loan Mortgage Corp. REMICs, Series 3266, Class F, 4.984% (1 Month USD LIBOR + 30 bps), 1/15/37 | 174,243 | ||||
| 103,010(a) | Federal Home Loan Mortgage Corp. REMICs, Series 3307, Class FT, 4.924% (1 Month USD LIBOR + 24 bps), 7/15/34 | 101,112 | ||||
| 10,953(a) | Federal Home Loan Mortgage Corp. REMICs, Series 3315, Class F, 5.024% (1 Month USD LIBOR + 34 bps), 5/15/37 | 10,697 | ||||
| 291,265(a) | Federal Home Loan Mortgage Corp. REMICs, Series 3373, Class FB, 5.264% (1 Month USD LIBOR + 58 bps), 10/15/37 | 288,434 | ||||
| 32,862(a) | Federal Home Loan Mortgage Corp. REMICs, Series 3376, Class FM, 5.304% (1 Month USD LIBOR + 62 bps), 10/15/37 | 32,609 | ||||
| 101,711(a) | Federal Home Loan Mortgage Corp. REMICs, Series 3560, Class FA, 5.934% (1 Month USD LIBOR + 125 bps), 5/15/37 | 103,326 | ||||
| 173,669(a) | Federal Home Loan Mortgage Corp. REMICs, Series 3610, Class FA, 5.384% (1 Month USD LIBOR + 70 bps), 12/15/39 | 173,406 | ||||
| 56,486(a) | Federal Home Loan Mortgage Corp. REMICs, Series 3708, Class PF, 5.034% (1 Month USD LIBOR + 35 bps), 7/15/40 | 56,065 | ||||
| 977(a) | Federal Home Loan Mortgage Corp. REMICs, Series 3784, Class F, 5.084% (1 Month USD LIBOR + 40 bps), 7/15/23 | 976 | ||||
| 2,343(a) | Federal Home Loan Mortgage Corp. REMICs, Series 3792, Class DF, 5.084% (1 Month USD LIBOR + 40 bps), 11/15/40 | 2,341 | ||||
| 15,738(a) | Federal Home Loan Mortgage Corp. REMICs, Series 3867, Class FD, 5.034% (1 Month USD LIBOR + 35 bps), 5/15/41 | 15,535 | ||||
| 22,061(a) | Federal Home Loan Mortgage Corp. REMICs, Series 3914, Class LF, 4.884% (1 Month USD LIBOR + 20 bps), 8/15/26 | 21,995 | ||||
| 28,743(a) | Federal Home Loan Mortgage Corp. REMICs, Series 3970, Class GF, 4.984% (1 Month USD LIBOR + 30 bps), 9/15/26 | 28,712 | ||||
| 45,925(a) | Federal Home Loan Mortgage Corp. REMICs, Series 3982, Class FL, 5.234% (1 Month USD LIBOR + 55 bps), 12/15/39 | 45,861 | ||||
| Principal
Amount USD ($) |
Value | |||||
| Collateralized
Mortgage Obligations—(continued) |
||||||
| 34,480(a) | Federal Home Loan Mortgage Corp. REMICs, Series 4056, Class QF, 5.034% (1 Month USD LIBOR + 35 bps), 12/15/41 | $ 34,004 | ||||
| 2,458(a) | Federal National Mortgage Association REMICs, Series 1993-230, Class FA, 5.217% (1 Month USD LIBOR + 60 bps), 12/25/23 | 2,458 | ||||
| 5,735(a) | Federal National Mortgage Association REMICs, Series 1993-247, Class FA, 6.726% (12 mo. USD LIBOR + 140 bps), 12/25/23 | 5,725 | ||||
| 5,735(a) | Federal National Mortgage Association REMICs, Series 1993-247, Class FE, 5.845% (1 Month USD LIBOR + 100 bps), 12/25/23 | 5,743 | ||||
| 17,108(a) | Federal National Mortgage Association REMICs, Series 1994-40, Class FC, 5.345% (1 Month USD LIBOR + 50 bps), 3/25/24 | 17,137 | ||||
| 5,688(a) | Federal National Mortgage Association REMICs, Series 1997-46, Class FA, 5.261% (1 Month USD LIBOR + 50 bps), 7/18/27 | 5,630 | ||||
| 5,715(a) | Federal National Mortgage Association REMICs, Series 1998-21, Class F, 3.821% (1 Year CMT Index + 35 bps), 3/25/28 | 5,676 | ||||
| 22,736(a) | Federal National Mortgage Association REMICs, Series 2000-47, Class FD, 5.395% (1 Month USD LIBOR + 55 bps), 12/25/30 | 22,631 | ||||
| 81,746(a) | Federal National Mortgage Association REMICs, Series 2001-35, Class F, 5.445% (1 Month USD LIBOR + 60 bps), 7/25/31 | 81,467 | ||||
| 29,329(a) | Federal National Mortgage Association REMICs, Series 2001-37, Class F, 5.345% (1 Month USD LIBOR + 50 bps), 8/25/31 | 29,187 | ||||
| 168,930(a) | Federal National Mortgage Association REMICs, Series 2001-50, Class FQ, 5.445% (1 Month USD LIBOR + 60 bps), 11/25/31 | 168,353 | ||||
| 74,329(a) | Federal National Mortgage Association REMICs, Series 2001-65, Class F, 5.445% (1 Month USD LIBOR + 60 bps), 11/25/31 | 74,292 | ||||
| 47,979(a) | Federal National Mortgage Association REMICs, Series 2001-69, Class FA, 5.445% (1 Month USD LIBOR + 60 bps), 7/25/31 | 47,810 | ||||
| 111,277(a) | Federal National Mortgage Association REMICs, Series 2001-72, Class FB, 5.745% (1 Month USD LIBOR + 90 bps), 12/25/31 | 111,982 | ||||
| 35,682(a) | Federal National Mortgage Association REMICs, Series 2001-81, Class FL, 5.411% (1 Month USD LIBOR + 65 bps), 1/18/32 | 35,646 | ||||
| Principal
Amount USD ($) |
Value | |||||
| Collateralized
Mortgage Obligations—(continued) |
||||||
| 62,683(a) | Federal National Mortgage Association REMICs, Series 2002-1, Class FC, 5.545% (1 Month USD LIBOR + 70 bps), 1/25/32 | $ 62,840 | ||||
| 174,460(a) | Federal National Mortgage Association REMICs, Series 2002-13, Class FD, 5.745% (1 Month USD LIBOR + 90 bps), 3/25/32 | 175,364 | ||||
| 108,235(a) | Federal National Mortgage Association REMICs, Series 2002-34, Class FA, 5.261% (1 Month USD LIBOR + 50 bps), 5/18/32 | 108,087 | ||||
| 101,249(a) | Federal National Mortgage Association REMICs, Series 2002-56, Class FN, 5.845% (1 Month USD LIBOR + 100 bps), 7/25/32 | 102,488 | ||||
| 15,324(a) | Federal National Mortgage Association REMICs, Series 2002-58, Class FD, 5.445% (1 Month USD LIBOR + 60 bps), 8/25/32 | 15,312 | ||||
| 65,127(a) | Federal National Mortgage Association REMICs, Series 2002-77, Class F, 5.445% (1 Month USD LIBOR + 60 bps), 12/25/32 | 65,065 | ||||
| 46,199(a) | Federal National Mortgage Association REMICs, Series 2002-82, Class FB, 5.345% (1 Month USD LIBOR + 50 bps), 12/25/32 | 46,006 | ||||
| 60,899(a) | Federal National Mortgage Association REMICs, Series 2002-90, Class FH, 5.345% (1 Month USD LIBOR + 50 bps), 9/25/32 | 60,460 | ||||
| 34,107(a) | Federal National Mortgage Association REMICs, Series 2002-92, Class FB, 5.495% (1 Month USD LIBOR + 65 bps), 4/25/30 | 34,144 | ||||
| 66,027(a) | Federal National Mortgage Association REMICs, Series 2002-93, Class FH, 5.345% (1 Month USD LIBOR + 50 bps), 1/25/33 | 65,739 | ||||
| 110,098(a) | Federal National Mortgage Association REMICs, Series 2003-107, Class FD, 5.345% (1 Month USD LIBOR + 50 bps), 11/25/33 | 109,563 | ||||
| 164,633(a) | Federal National Mortgage Association REMICs, Series 2003-31, Class FM, 5.345% (1 Month USD LIBOR + 50 bps), 4/25/33 | 163,874 | ||||
| 73,971(a) | Federal National Mortgage Association REMICs, Series 2003-42, Class JF, 5.345% (1 Month USD LIBOR + 50 bps), 5/25/33 | 73,466 | ||||
| 675(a) | Federal National Mortgage Association REMICs, Series 2003-49, Class FY, 5.245% (1 Month USD LIBOR + 40 bps), 6/25/23 | 675 | ||||
| 53,896(a) | Federal National Mortgage Association REMICs, Series 2003-7, Class FA, 5.595% (1 Month USD LIBOR + 75 bps), 2/25/33 | 54,122 | ||||
| Principal
Amount USD ($) |
Value | |||||
| Collateralized
Mortgage Obligations—(continued) |
||||||
| 98,111(a) | Federal National Mortgage Association REMICs, Series 2003-8, Class FJ, 5.195% (1 Month USD LIBOR + 35 bps), 2/25/33 | $ 97,778 | ||||
| 113,057(a) | Federal National Mortgage Association REMICs, Series 2004-52, Class FW, 5.245% (1 Month USD LIBOR + 40 bps), 7/25/34 | 112,231 | ||||
| 30,327(a) | Federal National Mortgage Association REMICs, Series 2004-54, Class FN, 5.295% (1 Month USD LIBOR + 45 bps), 7/25/34 | 30,167 | ||||
| 91,932(a) | Federal National Mortgage Association REMICs, Series 2004-79, Class FM, 5.145% (1 Month USD LIBOR + 30 bps), 11/25/24 | 91,754 | ||||
| 106,937(a) | Federal National Mortgage Association REMICs, Series 2005-83, Class KT, 5.145% (1 Month USD LIBOR + 30 bps), 10/25/35 | 105,375 | ||||
| 118,754(a) | Federal National Mortgage Association REMICs, Series 2005-83, Class LF, 5.155% (1 Month USD LIBOR + 31 bps), 2/25/35 | 117,900 | ||||
| 65,963(a) | Federal National Mortgage Association REMICs, Series 2006-104, Class GF, 5.165% (1 Month USD LIBOR + 32 bps), 11/25/36 | 64,940 | ||||
| 22,400(a) | Federal National Mortgage Association REMICs, Series 2006-11, Class FB, 5.145% (1 Month USD LIBOR + 30 bps), 3/25/36 | 22,082 | ||||
| 33,067(a) | Federal National Mortgage Association REMICs, Series 2006-115, Class BF, 5.085% (1 Month USD LIBOR + 24 bps), 12/25/36 | 32,432 | ||||
| 68,384(a) | Federal National Mortgage Association REMICs, Series 2006-34, Class FA, 5.155% (1 Month USD LIBOR + 31 bps), 5/25/36 | 67,282 | ||||
| 125,809(a) | Federal National Mortgage Association REMICs, Series 2006-42, Class CF, 5.295% (1 Month USD LIBOR + 45 bps), 6/25/36 | 124,510 | ||||
| 50,891(a) | Federal National Mortgage Association REMICs, Series 2006-56, Class FC, 5.135% (1 Month USD LIBOR + 29 bps), 7/25/36 | 50,340 | ||||
| 11,928(a) | Federal National Mortgage Association REMICs, Series 2006-70, Class BF, 5.395% (1 Month USD LIBOR + 55 bps), 8/25/36 | 11,786 | ||||
| 27,519(a) | Federal National Mortgage Association REMICs, Series 2006-82, Class F, 5.415% (1 Month USD LIBOR + 57 bps), 9/25/36 | 27,283 | ||||
| 23,057(a) | Federal National Mortgage Association REMICs, Series 2007-100, Class YF, 5.395% (1 Month USD LIBOR + 55 bps), 10/25/37 | 22,791 | ||||
| Principal
Amount USD ($) |
Value | |||||
| Collateralized
Mortgage Obligations—(continued) |
||||||
| 33,798(a) | Federal National Mortgage Association REMICs, Series 2007-103, Class AF, 5.845% (1 Month USD LIBOR + 100 bps), 3/25/37 | $ 33,901 | ||||
| 36,573(a) | Federal National Mortgage Association REMICs, Series 2007-110, Class FA, 5.465% (1 Month USD LIBOR + 62 bps), 12/25/37 | 36,296 | ||||
| 58,692(a) | Federal National Mortgage Association REMICs, Series 2007-13, Class FA, 5.095% (1 Month USD LIBOR + 25 bps), 3/25/37 | 57,025 | ||||
| 74,611(a) | Federal National Mortgage Association REMICs, Series 2007-2, Class FT, 5.095% (1 Month USD LIBOR + 25 bps), 2/25/37 | 72,701 | ||||
| 50,891(a) | Federal National Mortgage Association REMICs, Series 2007-41, Class FA, 5.245% (1 Month USD LIBOR + 40 bps), 5/25/37 | 49,998 | ||||
| 149,743(a) | Federal National Mortgage Association REMICs, Series 2007-50, Class FN, 5.085% (1 Month USD LIBOR + 24 bps), 6/25/37 | 146,870 | ||||
| 13,991(a) | Federal National Mortgage Association REMICs, Series 2007-57, Class FA, 5.075% (1 Month USD LIBOR + 23 bps), 6/25/37 | 13,769 | ||||
| 38,229(a) | Federal National Mortgage Association REMICs, Series 2007-58, Class FA, 5.095% (1 Month USD LIBOR + 25 bps), 6/25/37 | 37,259 | ||||
| 34,311(a) | Federal National Mortgage Association REMICs, Series 2007-66, Class FB, 5.245% (1 Month USD LIBOR + 40 bps), 7/25/37 | 34,120 | ||||
| 90,523(a) | Federal National Mortgage Association REMICs, Series 2007-7, Class FJ, 5.045% (1 Month USD LIBOR + 20 bps), 2/25/37 | 88,560 | ||||
| 138,475(a) | Federal National Mortgage Association REMICs, Series 2007-85, Class FG, 5.345% (1 Month USD LIBOR + 50 bps), 9/25/37 | 136,583 | ||||
| 183,354(a) | Federal National Mortgage Association REMICs, Series 2007-91, Class FB, 5.445% (1 Month USD LIBOR + 60 bps), 10/25/37 | 181,824 | ||||
| 59,957(a) | Federal National Mortgage Association REMICs, Series 2007-92, Class OF, 5.415% (1 Month USD LIBOR + 57 bps), 9/25/37 | 59,598 | ||||
| 33,902(a) | Federal National Mortgage Association REMICs, Series 2007-93, Class FD, 5.395% (1 Month USD LIBOR + 55 bps), 9/25/37 | 33,568 | ||||
| 17,849(a) | Federal National Mortgage Association REMICs, Series 2007-98, Class FD, 5.295% (1 Month USD LIBOR + 45 bps), 6/25/37 | 17,572 | ||||
| Principal
Amount USD ($) |
Value | |||||
| Collateralized
Mortgage Obligations—(continued) |
||||||
| 18,107(a) | Federal National Mortgage Association REMICs, Series 2008-6, Class FA, 5.545% (1 Month USD LIBOR + 70 bps), 2/25/38 | $ 18,011 | ||||
| 101,166(a) | Federal National Mortgage Association REMICs, Series 2008-88, Class FA, 6.065% (1 Month USD LIBOR + 122 bps), 10/25/38 | 103,236 | ||||
| 48,390(a) | Federal National Mortgage Association REMICs, Series 2009-113, Class FB, 5.395% (1 Month USD LIBOR + 55 bps), 1/25/40 | 47,996 | ||||
| 30,250(a) | Federal National Mortgage Association REMICs, Series 2010-43, Class FD, 5.445% (1 Month USD LIBOR + 60 bps), 5/25/40 | 29,955 | ||||
| 90,896(a) | Federal National Mortgage Association REMICs, Series 2010-43, Class IF, 5.345% (1 Month USD LIBOR + 50 bps), 5/25/40 | 90,047 | ||||
| 91,298(a) | Federal National Mortgage Association REMICs, Series 2012-40, Class PF, 5.345% (1 Month USD LIBOR + 50 bps), 4/25/42 | 89,790 | ||||
| 1,134,552(a) | Freddie Mac STACR REMIC Trust, Series 2020-HQA2, Class M2, 7.945% (1 Month USD LIBOR + 310 bps), 3/25/50 (144A) | 1,162,579 | ||||
| 1,574,724(a) | Freddie Mac STACR REMIC Trust, Series 2021-DNA3, Class M1, 5.31% (SOFR30A + 75 bps), 10/25/33 (144A) | 1,564,953 | ||||
| 6,468,244(a) | Freddie Mac STACR REMIC Trust, Series 2021-DNA5, Class M2, 6.21% (SOFR30A + 165 bps), 1/25/34 (144A) | 6,347,563 | ||||
| 1,525,101(a) | Freddie Mac STACR REMIC Trust, Series 2021-DNA6, Class M1, 5.36% (SOFR30A + 80 bps), 10/25/41 (144A) | 1,511,388 | ||||
| 3,568,882(a) | Freddie Mac STACR REMIC Trust, Series 2021-DNA7, Class M1, 5.41% (SOFR30A + 85 bps), 11/25/41 (144A) | 3,514,570 | ||||
| 1,475,000(a) | Freddie Mac STACR REMIC Trust, Series 2021-DNA7, Class M2, 6.36% (SOFR30A + 180 bps), 11/25/41 (144A) | 1,401,356 | ||||
| 7,550,000(a) | Freddie Mac STACR REMIC Trust, Series 2021-HQA1, Class M2, 6.81% (SOFR30A + 225 bps), 8/25/33 (144A) | 7,267,812 | ||||
| 4,700,000(a) | Freddie Mac STACR REMIC Trust, Series 2021-HQA3, Class M2, 6.66% (SOFR30A + 210 bps), 9/25/41 (144A) | 4,230,229 | ||||
| 9,977,928(a) | Freddie Mac STACR REMIC Trust, Series 2021-HQA4, Class M1, 5.51% (SOFR30A + 95 bps), 12/25/41 (144A) | 9,612,462 | ||||
| Principal
Amount USD ($) |
Value | |||||
| Collateralized
Mortgage Obligations—(continued) |
||||||
| 12,380,000(a) | Freddie Mac STACR REMIC Trust, Series 2022-DNA1, Class M2, 7.06% (SOFR30A + 250 bps), 1/25/42 (144A) | $ 11,420,550 | ||||
| 5,590,000(a) | Freddie Mac STACR REMIC Trust, Series 2022-DNA2, Class M1B, 6.96% (SOFR30A + 240 bps), 2/25/42 (144A) | 5,429,859 | ||||
| 2,594,936(a) | Freddie Mac STACR REMIC Trust, Series 2022-DNA6, Class M1A, 6.71% (SOFR30A + 215 bps), 9/25/42 (144A) | 2,601,731 | ||||
| 5,665,169(a) | Freddie Mac STACR REMIC Trust, Series 2022-HQA1, Class M1A, 6.66% (SOFR30A + 210 bps), 3/25/42 (144A) | 5,665,160 | ||||
| 3,045,033(a) | Freddie Mac STACR REMIC Trust, Series 2022-HQA3, Class M1A, 6.86% (SOFR30A + 230 bps), 8/25/42 (144A) | 3,052,632 | ||||
| 680,352(a) | Freddie Mac STACR Trust, Series 2019-FTR2, Class M1, 5.795% (1 Month USD LIBOR + 95 bps), 11/25/48 (144A) | 676,975 | ||||
| 70,526(a) | Freddie Mac STRIPS, Series 237, Class F14, 5.084% (1 Month USD LIBOR + 40 bps), 5/15/36 | 69,504 | ||||
| 65,939(a) | Freddie Mac STRIPS, Series 239, Class F29, 4.934% (1 Month USD LIBOR + 25 bps), 8/15/36 | 64,699 | ||||
| 285,056(a) | Freddie Mac STRIPS, Series 239, Class F30, 4.984% (1 Month USD LIBOR + 30 bps), 8/15/36 | 280,330 | ||||
| 82,672(a) | Freddie Mac STRIPS, Series 244, Class F22, 5.034% (1 Month USD LIBOR + 35 bps), 12/15/36 | 81,482 | ||||
| 8,440,935(a) | Freddie Mac Structured Agency Credit Risk Debt Notes, Series 2013-DN2, Class M2, 9.095% (1 Month USD LIBOR + 425 bps), 11/25/23 | 8,567,000 | ||||
| 3,425,000(a) | Freddie Mac Structured Agency Credit Risk Debt Notes, Series 2017-HRP1, Class B1D, 7.345% (1 Month USD LIBOR + 250 bps), 12/25/42 | 3,269,301 | ||||
| 3,819,575(a) | Freddie Mac Structured Agency Credit Risk Debt Notes, Series 2017-HRP1, Class M2, 7.295% (1 Month USD LIBOR + 245 bps), 12/25/42 | 3,824,302 | ||||
| 590,346(a) | Freddie Mac Structured Agency Credit Risk Debt Notes, Series 2017-HRP1, Class M2D, 6.095% (1 Month USD LIBOR + 125 bps), 12/25/42 | 583,876 | ||||
| 3,620,000(a) | Freddie Mac Structured Agency Credit Risk Debt Notes, Series 2021-DNA2, Class M2, 6.86% (SOFR30A + 230 bps), 8/25/33 (144A) | 3,565,773 | ||||
| 33,767(a) | Government National Mortgage Association, Series 2003-7, Class FB, 4.928% (1 Month USD LIBOR + 20 bps), 1/16/33 | 33,666 | ||||
| Principal
Amount USD ($) |
Value | |||||
| Collateralized
Mortgage Obligations—(continued) |
||||||
| 223,820(a) | Government National Mortgage Association, Series 2005-16, Class FA, 5.011% (1 Month USD LIBOR + 25 bps), 2/20/35 | $ 221,429 | ||||
| 237,326(a) | Government National Mortgage Association, Series 2005-3, Class FC, 4.978% (1 Month USD LIBOR + 25 bps), 1/16/35 | 235,288 | ||||
| 77,136(a) | Government National Mortgage Association, Series 2008-69, Class FA, 5.261% (1 Month USD LIBOR + 50 bps), 8/20/38 | 77,055 | ||||
| 73,546(a) | Government National Mortgage Association, Series 2009-66, Class UF, 5.728% (1 Month USD LIBOR + 100 bps), 8/16/39 | 74,377 | ||||
| 54,656(a) | Government National Mortgage Association, Series 2009-92, Class FJ, 5.408% (1 Month USD LIBOR + 68 bps), 10/16/39 | 54,703 | ||||
| 5,347,200(a) | Home Re, Ltd., Series 2019-1, Class M1, 6.495% (1 Month USD LIBOR + 165 bps), 5/25/29 (144A) | 5,345,344 | ||||
| 557,652(a) | Home Re, Ltd., Series 2020-1, Class M1C, 8.995% (1 Month USD LIBOR + 415 bps), 10/25/30 (144A) | 558,714 | ||||
| 4,178,285(a) | Home Re, Ltd., Series 2021-1, Class M1B, 6.395% (1 Month USD LIBOR + 155 bps), 7/25/33 (144A) | 4,172,289 | ||||
| 7,360,000(a) | Home Re, Ltd., Series 2021-1, Class M2, 7.695% (1 Month USD LIBOR + 285 bps), 7/25/33 (144A) | 7,233,059 | ||||
| 205,277(a) | Home Re, Ltd., Series 2021-2, Class M1A, 5.81% (SOFR30A + 125 bps), 1/25/34 (144A) | 205,128 | ||||
| 14,283,000(a) | Home Re, Ltd., Series 2021-2, Class M1C, 7.36% (SOFR30A + 280 bps), 1/25/34 (144A) | 13,839,429 | ||||
| 3,000,000(a) | Home Re, Ltd., Series 2022-1, Class M1A, 7.41% (SOFR30A + 285 bps), 10/25/34 (144A) | 3,017,610 | ||||
| 4,718,664 | IMS Ecuadorian Mortgage Trust, Series 2021-1, Class GA, 3.40%, 8/18/43 (144A) | 4,388,357 | ||||
| 1,867,435(c) | JP Morgan Mortgage Trust, Series 2014-IVR3, Class B4, 3.792%, 9/25/44 (144A) | 1,727,451 | ||||
| 233,819(c) | JP Morgan Mortgage Trust, Series 2014-IVR6, Class B1, 5.856%, 7/25/44 (144A) | 232,916 | ||||
| 9,309,541(a) | JP Morgan Mortgage Trust, Series 2018-7FRB, Class A2, 5.595% (1 Month USD LIBOR + 75 bps), 4/25/46 (144A) | 8,896,647 | ||||
| 1,525,685(a) | JP Morgan Mortgage Trust, Series 2018-7FRB, Class A3, 5.595% (1 Month USD LIBOR + 75 bps), 4/25/46 (144A) | 1,453,151 | ||||
| 7,636,847(c) | JP Morgan Mortgage Trust, Series 2018-7FRB, Class B1, 5.795%, 4/25/46 (144A) | 7,009,262 | ||||
| 7,223,111(c) | JP Morgan Mortgage Trust, Series 2018-7FRB, Class B2, 5.795%, 4/25/46 (144A) | 6,604,909 | ||||
| Principal
Amount USD ($) |
Value | |||||
| Collateralized
Mortgage Obligations—(continued) |
||||||
| 960,156(a) | JP Morgan Seasoned Mortgage Trust, Series 2014-1, Class AM, 5.345% (1 Month USD LIBOR + 50 bps), 5/25/33 (144A) | $ 917,913 | ||||
| 3,869,141(c) | JP Morgan Seasoned Mortgage Trust, Series 2014-1, Class B1, 5.007%, 5/25/33 (144A) | 3,689,532 | ||||
| 3,606,653(c) | JP Morgan Seasoned Mortgage Trust, Series 2014-1, Class B2, 5.007%, 5/25/33 (144A) | 3,434,178 | ||||
| 2,780,413(c) | JP Morgan Seasoned Mortgage Trust, Series 2014-1, Class B3, 5.007%, 5/25/33 (144A) | 2,634,176 | ||||
| 140,887(c) | JP Morgan Trust, Series 2015-1, Class 1A14, 5.788%, 12/25/44 (144A) | 135,339 | ||||
| 3,186,783(a) | JPMorgan Chase Bank N.A. - CHASE, Series 2019-CL1, Class M1, 6.195% (1 Month USD LIBOR + 135 bps), 4/25/47 (144A) | 2,941,472 | ||||
| 7,738,729(a) | LSTAR Securities Investment, Ltd., Series 2021-1, Class A, 7.648% (1 Month USD LIBOR + 280 bps), 2/1/26 (144A) | 7,579,705 | ||||
| 4,602(c) | Merrill Lynch Mortgage Investors Trust Series MLCC, Series 2003-G, Class A3, 5.957%, 1/25/29 | 4,394 | ||||
| 382,535(a) | Merrill Lynch Mortgage Investors Trust Series MLCC, Series 2003-H, Class A1, 5.485% (1 Month USD LIBOR + 64 bps), 1/25/29 | 336,505 | ||||
| 138,916(a) | Merrill Lynch Mortgage Investors Trust Series MLCC, Series 2004-B, Class A2, 5.765% (6 Month USD LIBOR + 54 bps), 5/25/29 | 129,813 | ||||
| 11,731(a) | Merrill Lynch Mortgage Investors Trust Series MLCC, Series 2004-C, Class A2B, 6.149% (6 Month USD LIBOR + 100 bps), 7/25/29 | 11,201 | ||||
| 71,447(c) | Merrill Lynch Mortgage Investors Trust Series MLCC, Series 2004-D, Class A3, 6.714%, 9/25/29 | 67,055 | ||||
| 125,659(c) | Morgan Stanley Residential Mortgage Loan Trust, Series 2014-1A, Class A1, 6.01%, 6/25/44 (144A) | 125,143 | ||||
| 2,564,000(c) | Morgan Stanley Residential Mortgage Loan Trust, Series 2014-1A, Class B4, 6.01%, 6/25/44 (144A) | 2,325,515 | ||||
| 6,911,667(a) | NewRez Warehouse Securitization Trust, Series 2021-1, Class E, 8.095% (1 Month USD LIBOR + 325 bps), 5/25/55 (144A) | 6,806,440 | ||||
| 1,500,000(a) | Oaktown Re II, Ltd., Series 2018-1A, Class B1, 8.895% (1 Month USD LIBOR + 405 bps), 7/25/28 (144A) | 1,506,419 | ||||
| 5,067,342(a) | Oaktown Re II, Ltd., Series 2018-1A, Class M1, 6.395% (1 Month USD LIBOR + 155 bps), 7/25/28 (144A) | 5,064,858 | ||||
| 10,802,000(a) | Oaktown Re II, Ltd., Series 2018-1A, Class M2, 7.695% (1 Month USD LIBOR + 285 bps), 7/25/28 (144A) | 10,823,066 | ||||
| Principal
Amount USD ($) |
Value | |||||
| Collateralized
Mortgage Obligations—(continued) |
||||||
| 4,970,000(a) | Oaktown Re III, Ltd., Series 2019-1A, Class B1A, 8.345% (1 Month USD LIBOR + 350 bps), 7/25/29 (144A) | $ 4,982,541 | ||||
| 1,631,000(a) | Oaktown Re III, Ltd., Series 2019-1A, Class B1B, 9.195% (1 Month USD LIBOR + 435 bps), 7/25/29 (144A) | 1,636,733 | ||||
| 9,523,079(a) | Oaktown Re III, Ltd., Series 2019-1A, Class M1B, 6.795% (1 Month USD LIBOR + 195 bps), 7/25/29 (144A) | 9,523,045 | ||||
| 5,750,000(a) | Oaktown Re VI, Ltd., Series 2021-1A, Class M1B, 6.61% (SOFR30A + 205 bps), 10/25/33 (144A) | 5,710,154 | ||||
| 3,500,000(a) | Oaktown Re VII, Ltd., Series 2021-2, Class M1B, 7.46% (SOFR30A + 290 bps), 4/25/34 (144A) | 3,455,053 | ||||
| 66,604(a) | Pepper Residential Securities Trust, Series 21A, Class A1U, 5.608% (1 Month USD LIBOR + 88 bps), 1/16/60 (144A) | 66,585 | ||||
| 442,170(a) | Pepper Residential Securities Trust No. 22, Series 22A, Class A1U, 5.761% (1 Month USD LIBOR + 100 bps), 6/20/60 (144A) | 441,648 | ||||
| 1,124,241(a) | Pepper Residential Securities Trust No. 25, Series 25A, Class A1U, 5.729% (1 Month USD LIBOR + 93 bps), 3/12/61 (144A) | 1,121,799 | ||||
| 16,117,000(a) | PNMAC GMSR Issuer Trust, Series 2018-GT2, Class A, 7.495% (1 Month USD LIBOR + 265 bps), 8/25/25 (144A) | 15,940,058 | ||||
| 7,664,895(a) | Radnor Re, Ltd., Series 2019-1, Class M1B, 6.795% (1 Month USD LIBOR + 195 bps), 2/25/29 (144A) | 7,662,061 | ||||
| 2,350,000(a) | Radnor Re, Ltd., Series 2020-1, Class B1, 7.845% (1 Month USD LIBOR + 300 bps), 1/25/30 (144A) | 2,159,816 | ||||
| 11,587,180(a) | Radnor Re, Ltd., Series 2020-1, Class M1B, 6.295% (1 Month USD LIBOR + 145 bps), 1/25/30 (144A) | 11,529,567 | ||||
| 7,400,000(a) | Radnor Re, Ltd., Series 2020-1, Class M1C, 6.595% (1 Month USD LIBOR + 175 bps), 1/25/30 (144A) | 7,313,202 | ||||
| 20,516,000(a) | Radnor Re, Ltd., Series 2021-1, Class M1C, 7.26% (SOFR30A + 270 bps), 12/27/33 (144A) | 20,193,101 | ||||
| 1,790,000(a) | Radnor Re, Ltd., Series 2021-1, Class M2, 7.71% (SOFR30A + 315 bps), 12/27/33 (144A) | 1,716,670 | ||||
| 12,590,000(a) | Radnor Re, Ltd., Series 2021-2, Class M1B, 8.26% (SOFR30A + 370 bps), 11/25/31 (144A) | 12,293,693 | ||||
| 1,000,000(a) | Radnor RE, Ltd., Series 2022-1, Class M1A, 8.234% (SOFR30A + 375 bps), 9/25/32 (144A) | 1,011,433 | ||||
| 1,048,936(a) | RESI Finance LP, Series 2003-CB1, Class B3, 6.21% (1 Month USD LIBOR + 145 bps), 6/10/35 (144A) | 832,931 | ||||
| Principal
Amount USD ($) |
Value | |||||
| Collateralized
Mortgage Obligations—(continued) |
||||||
| 326,743(a) | Resimac MBS Trust, Series 2018-2A, Class A1A, 5.61% (1 Month USD LIBOR + 85 bps), 4/10/50 (144A) | $ 326,568 | ||||
| 839,565(a) | RESIMAC Premier Series, Series 2019-2A, Class A1, 5.84% (1 Month USD LIBOR + 95 bps), 2/10/51 (144A) | 839,216 | ||||
| 1,201,521(a) | RESIMAC Premier Series, Series 2020-1A, Class A1A, 5.759% (1 Month USD LIBOR + 105 bps), 2/7/52 (144A) | 1,197,558 | ||||
| 1,680,790(c) | RMF Buyout Issuance Trust, Series 2021-HB1, Class A, 1.259%, 11/25/31 (144A) | 1,606,114 | ||||
| 7,747,796(a) | STACR Trust, Series 2018-HRP1, Class B1, 8.595% (1 Month USD LIBOR + 375 bps), 4/25/43 (144A) | 7,777,141 | ||||
| 255,316(a) | STACR Trust, Series 2018-HRP1, Class M2, 6.495% (1 Month USD LIBOR + 165 bps), 4/25/43 (144A) | 255,316 | ||||
| 7,158,237(a) | STACR Trust, Series 2018-HRP2, Class M3, 7.245% (1 Month USD LIBOR + 240 bps), 2/25/47 (144A) | 7,148,735 | ||||
| 10,125,049(a) | STACR Trust, Series 2018-HRP2, Class M3AS, 5.845% (1 Month USD LIBOR + 100 bps), 2/25/47 (144A) | 10,049,915 | ||||
| 7,314,792 | Towd Point Mortgage Trust, Series 2020-4, Class XA, 3.25%, 10/25/60 (144A) | 6,691,894 | ||||
| 7,507,180(a) | Triangle Re, Ltd., Series 2021-1, Class M2, 8.745% (1 Month USD LIBOR + 390 bps), 8/25/33 (144A) | 7,547,028 | ||||
| 2,950,606(a) | Triangle Re, Ltd., Series 2021-2, Class M1B, 7.445% (1 Month USD LIBOR + 260 bps), 10/25/33 (144A) | 2,957,089 | ||||
| 7,880,000(a) | Triangle Re, Ltd., Series 2021-3, Class M1B, 7.46% (SOFR30A + 290 bps), 2/25/34 (144A) | 7,678,538 | ||||
| Total
Collateralized Mortgage Obligations (Cost $596,280,210) |
$582,543,985 | |||||
| Commercial
Mortgage-Backed Securities—6.3% of Net Assets |
||||||
| 5,328,000(a) | AREIT Trust, Series 2022-CRE6, Class E, 7.959% (SOFR30A + 340 bps), 1/16/37 (144A) | $ 4,775,084 | ||||
| 8,000,000(a) | BAMLL Commercial Mortgage Securities Trust, Series 2019-RLJ, Class C, 6.284% (1 Month USD LIBOR + 160 bps), 4/15/36 (144A) | 7,804,186 | ||||
| 4,093,771(a) | BDS, Series 2021-FL8, Class A, 5.681% (1 Month USD LIBOR + 92 bps), 1/18/36 (144A) | 3,923,932 | ||||
| 1,150,000(a) | BFLD Trust, Series 2020-OBRK, Class A, 6.991% (1 Month Term SOFR + 216 bps), 11/15/28 (144A) | 1,139,302 | ||||
| 12,000,000(a) | BX Commercial Mortgage Trust, Series 2021-CIP, Class B, 5.955% (1 Month USD LIBOR + 127 bps), 12/15/38 (144A) | 11,458,464 | ||||
| Principal
Amount USD ($) |
Value | |||||
| Commercial
Mortgage-Backed Securities—(continued) |
||||||
| 4,633,575(a) | BX Commercial Mortgage Trust, Series 2021-XL2, Class D, 6.081% (1 Month USD LIBOR + 140 bps), 10/15/38 (144A) | $ 4,343,119 | ||||
| 9,300,000(a) | BX Trust, Series 2019-ATL, Class B, 6.071% (1 Month USD LIBOR + 139 bps), 10/15/36 (144A) | 9,018,719 | ||||
| 8,000,000(a) | BXP Trust, Series 2017-CQHP, Class B, 5.784% (1 Month USD LIBOR + 110 bps), 11/15/34 (144A) | 7,521,811 | ||||
| 2,171,167(a) | CG-CCRE Commercial Mortgage Trust, Series 2014-FL1, Class B, 5.834% (1 Month USD LIBOR + 115 bps), 6/15/31 (144A) | 2,167,703 | ||||
| 1,127,000(a) | CG-CCRE Commercial Mortgage Trust, Series 2014-FL2, Class A, 6.538% (1 Month USD LIBOR + 185 bps), 11/15/31 (144A) | 1,101,892 | ||||
| 6,000,000(a) | CGDB Commercial Mortgage Trust, Series 2019-MOB, Class C, 6.134% (1 Month USD LIBOR + 145 bps), 11/15/36 (144A) | 5,721,262 | ||||
| 7,443,791(a) | CHC Commercial Mortgage Trust 2019, Series 2019-CHC, Class C, 6.434% (1 Month USD LIBOR + 175 bps), 6/15/34 (144A) | 6,991,139 | ||||
| 6,000,000(a) | CLNY Trust, Series 2019-IKPR, Class B, 6.419% (1 Month Term SOFR + 159 bps), 11/15/38 (144A) | 5,533,413 | ||||
| 9,975,183(a) | Credit Suisse Mortgage Capital Certificates, Series 2019-ICE4, Class E, 6.834% (1 Month USD LIBOR + 215 bps), 5/15/36 (144A) | 9,652,941 | ||||
| 813,475(a) | Freddie Mac Multifamily Structured Credit Risk, Series 2021-MN1, Class M1, 6.484% (SOFR30A + 200 bps), 1/25/51 (144A) | 763,540 | ||||
| 8,000,000(a) | Great Wolf Trust, Series 2019-WOLF, Class D, 6.874% (1 Month Term SOFR + 205 bps), 12/15/36 (144A) | 7,758,148 | ||||
| 4,300,000(a) | GS Mortgage Securities Corp. Trust, Series 2018-HART, Class A, 5.78% (1 Month USD LIBOR + 109 bps), 10/15/31 (144A) | 3,999,475 | ||||
| 9,729,000(a) | GS Mortgage Securities Corp. Trust, Series 2018-HART, Class B, 5.99% (1 Month USD LIBOR + 130 bps), 10/15/31 (144A) | 8,934,581 | ||||
| 8,720,000(a) | GS Mortgage Securities Corp. Trust, Series 2018-TWR, Class A, 5.834% (1 Month USD LIBOR + 115 bps), 7/15/31 (144A) | 7,673,600 | ||||
| 5,500,000(a) | GS Mortgage Securities Corp. Trust, Series 2019-70P, Class D, 6.434% (1 Month USD LIBOR + 175 bps), 10/15/36 (144A) | 4,890,190 | ||||
| 7,400,000(a) | GS Mortgage Securities Corp. Trust, Series 2019-SMP, Class D, 6.634% (1 Month USD LIBOR + 195 bps), 8/15/32 (144A) | 6,746,538 | ||||
| Principal
Amount USD ($) |
Value | |||||
| Commercial
Mortgage-Backed Securities—(continued) |
||||||
| 10,000,000(a) | GS Mortgage Securities Corp. Trust, Series 2020-DUNE, Class A, 5.784% (1 Month USD LIBOR + 110 bps), 12/15/36 (144A) | $ 9,834,245 | ||||
| 5,000,000(a) | GS Mortgage Securities Corp. Trust, Series 2020-DUNE, Class E, 7.184% (1 Month USD LIBOR + 250 bps), 12/15/36 (144A) | 4,720,001 | ||||
| 1,100,000(a) | GS Mortgage Securities Corp. Trust, Series 2021-IP, Class E, 8.234% (1 Month USD LIBOR + 355 bps), 10/15/36 (144A) | 1,009,612 | ||||
| 7,656,826(a) | HPLY Trust, Series 2019-HIT, Class C, 6.284% (1 Month USD LIBOR + 160 bps), 11/15/36 (144A) | 7,367,499 | ||||
| 4,000,000(a) | JP Morgan Chase Commercial Mortgage Securities Trust, Series 2018-WPT, Class CFL, 6.601% (1 Month USD LIBOR + 190 bps), 7/5/33 (144A) | 3,440,000 | ||||
| 3,600,000(a) | JP Morgan Chase Commercial Mortgage Securities Trust, Series 2019-BKWD, Class C, 6.534% (1 Month USD LIBOR + 185 bps), 9/15/29 (144A) | 3,176,413 | ||||
| 10,300,000(a) | JP Morgan Chase Commercial Mortgage Securities Trust, Series 2019-MFP, Class E, 6.844% (1 Month USD LIBOR + 216 bps), 7/15/36 (144A) | 9,651,698 | ||||
| 6,735,000(a) | JP Morgan Chase Commercial Mortgage Securities Trust, Series 2020-609M, Class A, 6.055% (1 Month USD LIBOR + 137 bps), 10/15/33 (144A) | 6,134,649 | ||||
| 8,050,000(a) | MBRT, Series 2019-MBR, Class B, 6.184% (1 Month USD LIBOR + 150 bps), 11/15/36 (144A) | 7,867,474 | ||||
| 8,500,000(a) | Morgan Stanley Capital I Trust, Series 2017-ASHF, Class B, 6.059% (1 Month USD LIBOR + 138 bps), 11/15/34 (144A) | 8,167,076 | ||||
| 7,980,000(a) | Morgan Stanley Capital I Trust, Series 2018-BOP, Class B, 5.934% (1 Month USD LIBOR + 125 bps), 8/15/33 (144A) | 6,583,500 | ||||
| 6,300,000(a) | Natixis Commercial Mortgage Securities Trust, Series 2019-MILE, Class B, 6.707% (1 Month Term SOFR + 188 bps), 7/15/36 (144A) | 5,836,742 | ||||
| 3,972,455(a) | Ready Capital Mortgage Financing LLC, Series 2021-FL6, Class A, 5.795% (1 Month USD LIBOR + 95 bps), 7/25/36 (144A) | 3,844,131 | ||||
| 2,175,000(a) | Ready Capital Mortgage Financing LLC, Series 2021-FL6, Class D, 7.245% (1 Month USD LIBOR + 240 bps), 7/25/36 (144A) | 1,995,720 | ||||
| 1,519,000(a) | Ready Capital Mortgage Financing LLC, Series 2021-FL6, Class E, 7.745% (1 Month USD LIBOR + 290 bps), 7/25/36 (144A) | 1,386,170 | ||||
| Principal
Amount USD ($) |
Value | |||||
| Commercial
Mortgage-Backed Securities—(continued) |
||||||
| 4,825,000(a) | Ready Capital Mortgage Financing LLC, Series 2021-FL7, Class D, 7.795% (1 Month USD LIBOR + 295 bps), 11/25/36 (144A) | $ 4,478,703 | ||||
| 8,740,000(a) | Ready Capital Mortgage Financing LLC, Series 2022-FL8, Class E, 8.818% (SOFR30A + 425 bps), 1/25/37 (144A) | 8,365,759 | ||||
| 4,374,433(a) | Tharaldson Hotel Portfolio Trust, Series 2018-THL, Class C, 6.36% (1 Month USD LIBOR + 165 bps), 11/11/34 (144A) | 4,217,533 | ||||
| 2,798,108(c) | Velocity Commercial Capital Loan Trust, Series 2023-1, Class A, 6.47%, 1/25/53 (144A) | 2,796,710 | ||||
| 12,800,000(a) | Wells Fargo Commercial Mortgage Trust, Series 2017-SMP, Class C, 6.009% (1 Month USD LIBOR + 133 bps), 12/15/34 (144A) | 11,969,069 | ||||
| 11,316,024(a) | XCALI Mortgage Trust, Series 2019-1, Class A, 8.412% (1 Month USD LIBOR + 375 bps), 11/6/21 (144A) | 11,209,293 | ||||
| 10,495,725(a) | XCALI Mortgage Trust, Series 2020-1, Class A, 7.062% (1 Month USD LIBOR + 240 bps), 2/6/23 (144A) | 10,371,466 | ||||
| 13,048,418(a) | XCALI Mortgage Trust, Series 2020-2, Class A, 6.662% (1 Month USD LIBOR + 200 bps), 2/15/23 (144A) | 13,011,352 | ||||
| 4,375,000(a) | XCALI Mortgage Trust, Series 2020-5, Class A, 7.988% (1 Month Term SOFR + 337 bps), 10/15/23 (144A) | 4,344,232 | ||||
| Total
Commercial Mortgage-Backed Securities (Cost $289,185,801) |
$273,698,086 | |||||
| Corporate Bonds — 29.4% of Net Assets | ||||||
| Auto Manufacturers — 3.2% | ||||||
| 5,000,000 | American Honda Finance Corp., 3.45%, 7/14/23 | $ 4,974,064 | ||||
| 18,480,000(a) | American Honda Finance Corp., 5.476% (SOFR + 92 bps), 1/12/26 | 18,366,776 | ||||
| 9,147,000 | BMW US Capital LLC, 3.80%, 4/6/23 (144A) | 9,146,052 | ||||
| 12,030,000(a) | BMW US Capital LLC, 5.101% (SOFR + 38 bps), 8/12/24 (144A) | 11,932,723 | ||||
| 20,000,000(a) | Daimler Trucks Finance North America LLC, 5.526% (SOFR + 100 bps), 4/5/24 (144A) | 19,919,852 | ||||
| 18,670,000(a) | General Motors Financial Co., Inc., 5.201% (SOFR + 62 bps), 10/15/24 | 18,389,798 | ||||
| 6,360,000(a) | General Motors Financial Co., Inc., 5.559% (SOFR + 76 bps), 3/8/24 | 6,312,733 | ||||
| Principal
Amount USD ($) |
Value | |||||
| Auto Manufacturers — (continued) | ||||||
| 6,215,000(a) | General Motors Financial Co., Inc., 5.841% (SOFR + 130 bps), 4/7/25 | $ 6,173,711 | ||||
| 2,253,000 | Hyundai Capital America, 4.125%, 6/8/23 (144A) | 2,247,615 | ||||
| 15,645,000 | Mercedes-Benz Finance North America LLC, 3.70%, 5/4/23 (144A) | 15,628,132 | ||||
| 11,000,000(a) | Nissan Motor Acceptance Co. LLC, 5.648% (3 Month USD LIBOR + 64 bps), 3/8/24 (144A) | 10,863,325 | ||||
| 9,255,000(a) | Toyota Motor Credit Corp., 5.112% (SOFR + 56 bps), 1/10/25 | 9,186,143 | ||||
| 5,000,000 | Volkswagen Group of America Finance LLC, 3.125%, 5/12/23 (144A) | 4,985,673 | ||||
| Total Auto Manufacturers | $138,126,597 | |||||
| Banks — 20.0% | ||||||
| 10,000,000(a) | ANZ New Zealand Int'l, Ltd., 5.341% (SOFR + 60 bps), 2/18/25 (144A) | $ 9,902,785 | ||||
| 12,400,000(a) | Banco Santander SA, 5.982% (SOFR + 124 bps), 5/24/24 | 12,368,431 | ||||
| 5,700,000(a) | Bank of America Corp., 5.272% (BSBY3M + 43 bps), 5/28/24 | 5,672,982 | ||||
| 5,000,000(a) | Bank of America Corp., 5.334% (SOFR + 69 bps), 4/22/25 | 4,946,750 | ||||
| 3,643,000(a) | Bank of America Corp., 5.366% (SOFR + 66 bps), 2/4/25 | 3,603,097 | ||||
| 9,450,000(a) | Bank of America Corp., 5.378% (SOFR + 73 bps), 10/24/24 | 9,363,636 | ||||
| 2,811,000(a) | Bank of America Corp., 5.614% (SOFR + 97 bps), 7/22/27 | 2,767,590 | ||||
| 12,000,000(a) | Bank of Montreal, 4.861% (SOFR + 32 bps), 7/9/24 | 11,903,275 | ||||
| 14,760,000(a) | Bank of Montreal, 5.084% (SOFR + 27 bps), 9/15/23 | 14,741,625 | ||||
| 8,100,000(a) | Bank of Montreal, 5.439% (SOFR + 62 bps), 9/15/26 | 7,902,566 | ||||
| 9,060,000(a) | Bank of Montreal, 5.517% (SOFR + 71 bps), 12/12/24 | 9,009,074 | ||||
| 18,800,000(a) | Bank of Nova Scotia, 5.453% (SOFR + 90 bps), 4/11/25 | 18,744,293 | ||||
| 8,000,000(a) | Bank of Nova Scotia, 5.003% (SOFR + 46 bps), 1/10/25 | 7,887,474 | ||||
| 9,200,000(a) | Bank of Nova Scotia, 5.026% (SOFR + 45 bps), 4/15/24 | 9,151,754 | ||||
| 13,700,000 | Banque Federative du Credit Mutuel SA, 0.65%, 2/27/24 (144A) | 13,120,535 | ||||
| 15,095,000(a) | Banque Federative du Credit Mutuel SA, 5.108% (SOFR + 41 bps), 2/4/25 (144A) | 14,850,256 | ||||
| 2,620,000(a) | Banque Federative du Credit Mutuel SA, 5.768% (3 Month USD LIBOR + 96 bps), 7/20/23 (144A) | 2,615,177 | ||||
| Principal
Amount USD ($) |
Value | |||||
| Banks — (continued) | ||||||
| 12,519,000 | BNP Paribas S.A., 3.80%, 1/10/24 (144A) | $ 12,297,902 | ||||
| 4,740,000 | Canadian Imperial Bank of Commerce, 0.95%, 6/23/23 | 4,692,126 | ||||
| 18,400,000(a) | Canadian Imperial Bank of Commerce, 5.212% (SOFR + 40 bps), 12/14/23 | 18,347,966 | ||||
| 11,083,000(a) | Citigroup, Inc., 5.33% (SOFR + 69 bps), 1/25/26 | 10,863,413 | ||||
| 12,550,000(a) | Citigroup, Inc., 6.131% (SOFR + 137 bps), 5/24/25 | 12,555,309 | ||||
| 1,575,000(a) | Citigroup, Inc., 6.36% (SOFR + 153 bps), 3/17/26 | 1,581,999 | ||||
| 15,000,000(a) | Cooperatieve Rabobank UA, 4.923% (SOFR + 38 bps), 1/10/25 | 14,848,819 | ||||
| 10,000,000(a) | Credit Suisse AG, 5.072% (SOFR + 39 bps), 2/2/24 | 9,703,916 | ||||
| 17,960,000(a) | DNB Bank ASA, 5.679% (SOFR + 83 bps), 3/28/25 (144A) | 17,869,527 | ||||
| 7,000,000(a) | Federation des Caisses Desjardins du Quebec, 5.185% (SOFR + 43 bps), 5/21/24 (144A) | 6,943,198 | ||||
| 5,000,000 | First Horizon Corp., 3.55%, 5/26/23 | 4,939,950 | ||||
| 4,600,000 | Goldman Sachs Group, Inc., 1.217%, 12/6/23 | 4,467,782 | ||||
| 13,880,000(a) | Goldman Sachs Group, Inc., 5.108% (SOFR + 49 bps), 10/21/24 | 13,735,177 | ||||
| 20,725,000(a) | Goldman Sachs Group, Inc., 5.305% (SOFR + 50 bps), 9/10/24 | 20,622,035 | ||||
| 1,576,000(a) | Goldman Sachs Group, Inc., 5.592% (SOFR + 79 bps), 12/9/26 | 1,533,948 | ||||
| 7,084,000(a) | Goldman Sachs Group, Inc., 5.612% (SOFR + 81 bps), 3/9/27 | 6,854,015 | ||||
| 10,000,000(a) | HSBC Holdings Plc, 5.322% (SOFR + 58 bps), 11/22/24 | 9,779,696 | ||||
| 7,750,000(a) | HSBC Holdings Plc, 6.222% (SOFR + 143 bps), 3/10/26 | 7,697,393 | ||||
| 17,530,000 | HSBC USA, Inc., 5.625%, 3/17/25 | 17,562,964 | ||||
| 15,270,000(a) | Huntington National Bank, 5.921% (SOFR + 119 bps), 5/16/25 | 14,823,555 | ||||
| 10,300,000(a) | ING Groep NV, 6.489% (SOFR + 164 bps), 3/28/26 | 10,345,236 | ||||
| 8,000,000(a) | JPMorgan Chase & Co., 5.313% (SOFR + 54 bps), 6/1/25 | 7,919,845 | ||||
| 5,922,000(a) | JPMorgan Chase & Co., 5.405% (SOFR + 60 bps), 12/10/25 | 5,814,891 | ||||
| 11,800,000(a) | JPMorgan Chase & Co., 5.545% (3 Month USD LIBOR + 73 bps), 4/23/24 | 11,748,193 | ||||
| 12,270,000(a) | JPMorgan Chase & Co., 5.782% (SOFR + 97 bps), 6/14/25 | 12,192,653 | ||||
| 8,667,000(a) | JPMorgan Chase & Co., 5.968% (SOFR + 132 bps), 4/26/26 | 8,634,710 | ||||
| 11,294,000(a) | KeyBank NA, 5.189% (SOFR + 34 bps), 1/3/24 | 11,149,324 | ||||
| 11,019,000 | Lloyds Banking Group Plc, 4.05%, 8/16/23 | 10,939,184 | ||||
| Principal
Amount USD ($) |
Value | |||||
| Banks — (continued) | ||||||
| 7,140,000(a) | Macquarie Bank, Ltd., 6.14% (SOFR + 131 bps), 3/21/25 (144A) | $ 7,140,685 | ||||
| 13,975,000(a) | Macquarie Group, Ltd., 5.288% (SOFR + 71 bps), 10/14/25 (144A) | 13,570,970 | ||||
| 16,100,000 | Mitsubishi UFJ Financial Group, Inc., 3.761%, 7/26/23 | 16,008,362 | ||||
| 16,600,000(a) | Mitsubishi UFJ Financial Group, Inc., 6.237% (SOFR + 165 bps), 7/18/25 | 16,604,554 | ||||
| 7,055,000(a) | Morgan Stanley, 5.273% (SOFR + 63 bps), 1/24/25 | 6,954,240 | ||||
| 16,703,000(a) | Morgan Stanley, 5.702% (SOFR + 95 bps), 2/18/26 | 16,448,780 | ||||
| 5,700,000(a) | Morgan Stanley, 5.772% (SOFR + 117 bps), 4/17/25 | 5,685,351 | ||||
| 15,000,000(a) | National Bank of Canada, 5.192% (SOFR + 49 bps), 8/6/24 | 14,862,209 | ||||
| 4,200,000(a) | NatWest Markets Plc, 5.251% (SOFR + 53 bps), 8/12/24 (144A) | 4,135,820 | ||||
| 17,240,000(a) | NatWest Markets Plc, 6.29% (SOFR + 145 bps), 3/22/25 (144A) | 17,110,858 | ||||
| 22,000,000(a) | Royal Bank of Canada, 4.908% (SOFR + 30 bps), 1/19/24 | 21,853,034 | ||||
| 4,620,000(a) | Royal Bank of Canada, 5.223% (SOFR + 57 bps), 4/27/26 | 4,525,121 | ||||
| 15,380,000(a) | Royal Bank of Canada, 5.418% (SOFR + 84 bps), 4/14/25 | 15,308,905 | ||||
| 10,000,000 | Santander Holdings USA, Inc., 3.50%, 6/7/24 | 9,705,051 | ||||
| 17,000,000(a) | Societe Generale S.A., 5.668% (SOFR + 105 bps), 1/21/26 (144A) | 16,556,137 | ||||
| 8,880,000(a) | Standard Chartered Plc, 5.683% (SOFR + 93 bps), 11/23/25 (144A) | 8,712,894 | ||||
| 23,250,000(a) | Standard Chartered Plc, 6.589% (SOFR + 174 bps), 3/30/26 (144A) | 23,312,101 | ||||
| 6,520,000 | State Street Corp., 3.10%, 5/15/23 | 6,500,511 | ||||
| 16,100,000 | Sumitomo Mitsui Financial Group, Inc., 3.748%, 7/19/23 | 16,004,176 | ||||
| 15,085,000(a) | Sumitomo Mitsui Financial Group, Inc., 5.973% (SOFR + 143 bps), 1/13/26 | 15,161,900 | ||||
| 16,700,000(a) | Sumitomo Mitsui Trust Bank, Ltd., 5.252% (SOFR + 44 bps), 9/16/24 (144A) | 16,574,867 | ||||
| 18,540,000(a) | Sumitomo Mitsui Trust Bank, Ltd., 5.907% (SOFR + 112 bps), 3/9/26 (144A) | 18,451,804 | ||||
| 15,000,000 | Swedbank AB, 1.30%, 6/2/23 (144A) | 14,877,420 | ||||
| 17,090,000(a) | Swedbank AB, 5.759% (SOFR + 91 bps), 4/4/25 (144A) | 16,997,201 | ||||
| 9,825,000(a) | Toronto-Dominion Bank, 5.155% (SOFR + 35 bps), 9/10/24 | 9,743,354 | ||||
| Principal
Amount USD ($) |
Value | |||||
| Banks — (continued) | ||||||
| 11,667,000(a) | Toronto-Dominion Bank, 5.395% (SOFR + 59 bps), 9/10/26 | $ 11,387,334 | ||||
| 1,000,000(a) | Toronto-Dominion Bank, 5.438% (3 Month USD LIBOR + 64 bps), 7/19/23 | 999,350 | ||||
| 9,000,000(a) | Truist Bank, 4.783% (SOFR + 20 bps), 1/17/24 | 8,879,850 | ||||
| 5,800,000(a) | UBS AG, 5.069% (SOFR + 36 bps), 2/9/24 (144A) | 5,770,471 | ||||
| 10,800,000(a) | UBS AG, 5.098% (SOFR + 32 bps), 6/1/23 (144A) | 10,788,642 | ||||
| 15,000,000(a) | UBS AG, 5.159% (SOFR + 45 bps), 8/9/24 (144A) | 14,902,207 | ||||
| 14,110,000(a) | UBS Group AG, 6.301% (SOFR + 158 bps), 5/12/26 (144A) | 14,069,331 | ||||
| 19,340,000(a) | Wells Fargo & Co., 5.956% (SOFR + 132 bps), 4/25/26 | 19,320,080 | ||||
| Total Banks | $867,939,596 | |||||
| Diversified Financial Services — 1.2% | ||||||
| 10,700,000(a) | AerCap Ireland Capital DAC/AerCap Global Aviation Trust, 5.529% (SOFR + 68 bps), 9/29/23 | $ 10,602,906 | ||||
| 9,873,000(c) | Capital One Financial Corp., 1.343% (SOFR + 69 bps), 12/6/24 | 9,534,153 | ||||
| 18,200,000(a) | Capital One Financial Corp., 5.489% (SOFR + 69 bps), 12/6/24 | 17,806,724 | ||||
| 15,250,000(a) | Capital One Financial Corp., 6.069% (SOFR + 135 bps), 5/9/25 | 15,003,804 | ||||
| Total Diversified Financial Services | $52,947,587 | |||||
| Electric — 1.8% | ||||||
| 6,440,000(a) | American Electric Power Co., Inc., 5.294% (3 Month USD LIBOR + 48 bps), 11/1/23 | $ 6,411,217 | ||||
| 7,600,000(a) | CenterPoint Energy, Inc., 5.373% (SOFR + 65 bps), 5/13/24 | 7,530,375 | ||||
| 9,175,000(a) | Dominion Energy, Inc., 5.396% (3 Month USD LIBOR + 53 bps), 9/15/23 | 9,140,999 | ||||
| 11,360,000(a) | Florida Power & Light Co., 4.966% (SOFR + 25 bps), 5/10/23 | 11,349,573 | ||||
| 7,005,000(a) | National Rural Utilities Cooperative Finance Corp., 5.103% (SOFR + 40 bps), 8/7/23 | 6,985,621 | ||||
| 6,500,000(a) | NextEra Energy Capital Holdings, Inc., 5.092% (SOFR + 40 bps), 11/3/23 | 6,464,154 | ||||
| 13,575,000(a) | NextEra Energy Capital Holdings, Inc., 5.85% (SOFR + 102 bps), 3/21/24 | 13,526,636 | ||||
| 4,485,000 | NextEra Energy Capital Holdings, Inc., 6.051%, 3/1/25 | 4,562,599 | ||||
| Principal
Amount USD ($) |
Value | |||||
| Electric — (continued) | ||||||
| 6,545,000 | Public Service Enterprise Group, Inc., 0.841%, 11/8/23 | $ 6,357,066 | ||||
| 7,000,000(a) | Southern Co., 5.086% (SOFR + 37 bps), 5/10/23 | 6,989,921 | ||||
| Total Electric | $79,318,161 | |||||
| Healthcare-Products — 0.2% | ||||||
| 7,224,000(a) | Thermo Fisher Scientific, Inc., 5.117% (SOFR + 53 bps), 10/18/24 | $ 7,176,395 | ||||
| Total Healthcare-Products | $7,176,395 | |||||
| Healthcare-Services — 0.2% | ||||||
| 7,000,000 | Aetna, Inc., 2.80%, 6/15/23 | $ 6,966,680 | ||||
| Total Healthcare-Services | $6,966,680 | |||||
| Insurance — 1.1% | ||||||
| 13,700,000(a) | Athene Global Funding, 5.301% (SOFR + 56 bps), 8/19/24 (144A) | $ 13,439,591 | ||||
| 6,250,000(a) | Metropolitan Life Global Funding I, 5.74% (SOFR + 91 bps), 3/21/25 (144A) | 6,204,731 | ||||
| 6,500,000(a) | Principal Life Global Funding II, 5.016% (SOFR + 45 bps), 4/12/24 (144A) | 6,470,737 | ||||
| 5,400,000(a) | Principal Life Global Funding II, 5.142% (SOFR + 38 bps), 8/23/24 (144A) | 5,347,928 | ||||
| 9,030,000(a) | Protective Life Global Funding, 5.829% (SOFR + 98 bps), 3/28/25 (144A) | 8,984,974 | ||||
| 8,115,000(a) | Protective Life Global Funding, 5.857% (SOFR + 105 bps), 12/11/24 (144A) | 8,115,495 | ||||
| Total Insurance | $48,563,456 | |||||
| Oil & Gas — 0.2% | ||||||
| 9,584,000 | Eni S.p.A., 4.00%, 9/12/23 (144A) | $ 9,504,769 | ||||
| Total Oil & Gas | $9,504,769 | |||||
| Pharmaceuticals — 0.4% | ||||||
| 15,000,000 | Cigna Corp., 3.75%, 7/15/23 | $ 14,927,193 | ||||
| Total Pharmaceuticals | $14,927,193 | |||||
| Pipelines — 0.3% | ||||||
| 15,000,000 | Williams Cos, Inc., 4.30%, 3/4/24 | $ 14,845,960 | ||||
| Total Pipelines | $14,845,960 | |||||
| Retail — 0.5% | ||||||
| 12,249,000 | AutoZone, Inc., 3.125%, 7/15/23 | $ 12,157,997 | ||||
| 10,812,000 | TJX Cos., Inc., 2.50%, 5/15/23 | 10,780,332 | ||||
| Total Retail | $22,938,329 | |||||
| Principal
Amount USD ($) |
Value | |||||
| Semiconductors — 0.3% | ||||||
| 9,147,000 | Broadcom Corp./Broadcom Cayman Finance, Ltd., 3.625%, 1/15/24 | $ 9,012,857 | ||||
| 4,600,000 | Skyworks Solutions, Inc., 0.90%, 6/1/23 | 4,561,354 | ||||
| Total Semiconductors | $13,574,211 | |||||
| Total
Corporate Bonds (Cost $1,288,830,935) |
$1,276,828,934 | |||||
| Insurance-Linked
Securities — 2.8%# of Net Assets |
||||||
| Event Linked Bonds — 1.8% | ||||||
| Earthquakes – California — 0.1% | ||||||
| 2,000,000(a) | Phoenician Re, 7.591%, (3 Month U.S. Treasury Bill + 290 bps), 12/14/24 (144A) | $ 1,890,800 | ||||
| 4,000,000(a) | Ursa Re II, 8.633%, (3 Month U.S. Treasury Bill + 394 bps), 12/7/23 (144A) | 3,925,600 | ||||
| $ 5,816,400 | ||||||
| Earthquakes – Mexico — 0.0%† | ||||||
| 500,000(a) | International Bank for Reconstruction & Development, 8.574%, (3 Month USD LIBOR + 350 bps), 3/13/24 (144A) | $ 497,550 | ||||
| Earthquakes - U.S. — 0.0%† | ||||||
| 1,000,000(a) | Torrey Pines Re Pte, 8.613%, (3 Month U.S. Treasury Bill + 392 bps), 6/7/24 (144A) | $ 970,900 | ||||
| Earthquakes - U.S. & Canada — 0.1% | ||||||
| 2,500,000(a) | Acorn Re, 7.193%, (3 Month U.S. Treasury Bill + 250 bps), 11/7/24 (144A) | $ 2,380,000 | ||||
| Flood - U.S. — 0.0%† | ||||||
| 1,500,000(a) | FloodSmart Re, 15.943%, (3 Month U.S. Treasury Bill + 1,125 bps), 2/25/25 (144A) | $ 1,395,000 | ||||
| Multiperil – Florida — 0.0%† | ||||||
| 250,000(a) | Sanders Re II, 10.483%, (3 Month U.S. Treasury Bill + 579 bps), 6/7/23 (144A) | $ 246,250 | ||||
| Multiperil – U.S. — 0.7% | ||||||
| 1,500,000(a) | Bonanza Re, 9.563%, (3 Month U.S. Treasury Bill + 487 bps), 2/20/24 (144A) | $ 1,274,700 | ||||
| 125,000(a) | Caelus Re V, 4.793%, (1 Month U.S. Treasury Bill + 10 bps), 6/5/24 (144A) | 100,000 | ||||
| 750,000(a) | Caelus Re V, 4.793%, (3 Month U.S. Treasury Bill + 10 bps), 6/9/25 (144A) | 75 | ||||
| 500,000(a) | Caelus Re V, 5.193%, (3 Month U.S. Treasury Bill + 50 bps), 6/9/25 (144A) | 350,000 | ||||
| Principal
Amount USD ($) |
Value | |||||
| Multiperil – U.S. — (continued) | ||||||
| 750,000(a) | Caelus Re VI, 10.073%, (3 Month U.S. Treasury Bill + 538 bps), 6/7/24 (144A) | $ 723,375 | ||||
| 4,500,000(a) | Easton Re Pte, 9.223%, (3 Month U.S. Treasury Bill + 453 bps), 1/8/24 (144A) | 4,367,250 | ||||
| 2,000,000(a) | Four Lakes Re, 8.963%, (3 Month U.S. Treasury Bill + 427 bps), 1/7/25 (144A) | 1,849,000 | ||||
| 1,750,000(a) | Four Lakes Re, 11.993%, (3 Month U.S. Treasury Bill + 730 bps), 1/5/24 (144A) | 1,632,750 | ||||
| 500,000(a) | Herbie Re, 11.423%, (3 Month U.S. Treasury Bill + 673 bps), 1/8/25 (144A) | 451,000 | ||||
| 5,000,000(a) | Matterhorn Re, 10.099%, (SOFR + 525 bps), 3/24/25 (144A) | 4,396,500 | ||||
| 2,000,000(a) | Matterhorn Re, 12.599%, (SOFR + 775 bps), 3/24/25 (144A) | 1,744,400 | ||||
| 5,000,000(a) | Residential Re, 9.873%, (3 Month U.S. Treasury Bill + 518 bps), 12/6/25 (144A) | 4,468,000 | ||||
| 1,500,000(a) | Residential Re, 10.873%, (3 Month U.S. Treasury Bill + 618 bps), 12/6/24 (144A) | 1,429,200 | ||||
| 2,750,000(a) | Sanders Re II, 7.783%, (3 Month U.S. Treasury Bill + 309 bps), 4/7/25 (144A) | 2,630,375 | ||||
| 3,000,000(a) | Sanders Re II, 7.943%, (3 Month U.S. Treasury Bill + 325 bps), 4/7/25 (144A) | 2,865,300 | ||||
| 3,000,000(a) | Sanders Re III, 8.193%, (3 Month U.S. Treasury Bill + 350 bps), 4/7/26 (144A) | 2,827,500 | ||||
| 1,000,000(a) | Sussex Re, 13.073%, (3 Month U.S. Treasury Bill + 838 bps), 1/8/25 (144A) | 913,800 | ||||
| $ 32,023,225 | ||||||
| Multiperil – U.S. & Canada — 0.2% | ||||||
| 2,500,000(a) | Hypatia, 14.193%, (3 Month U.S. Treasury Bill + 950 bps), 6/7/23 (144A) | $ 2,507,500 | ||||
| 1,000,000(a) | Hypatia, 14.968%, (3 Month U.S. Treasury Bill + 1,028 bps), 6/7/23 (144A) | 978,100 | ||||
| 250,000(a) | Matterhorn Re, 10.549%, (SOFR + 575 bps), 12/8/25 (144A) | 208,375 | ||||
| 1,000,000(a) | Mona Lisa Re, 11.693%, (3 Month U.S. Treasury Bill + 700 bps), 7/8/25 (144A) | 893,900 | ||||
| 4,000,000(a) | Mystic Re IV, 10.823%, (3 Month U.S. Treasury Bill + 613 bps), 1/8/25 (144A) | 3,640,400 | ||||
| $ 8,228,275 | ||||||
| Multiperil – U.S. Regional — 0.1% | ||||||
| 700,000(a) | First Coast Re II Pte, 10.353%, (3 Month U.S. Treasury Bill + 566 bps), 6/7/23 (144A) | $ 697,410 | ||||
| 1,000,000(a) | Kilimanjaro III Re, 5.25%, (3 Month U.S. Treasury Bill + 525 bps), 6/25/25 (144A) | 945,600 | ||||
| Principal
Amount USD ($) |
Value | |||||
| Multiperil – U.S. Regional — (continued) | ||||||
| 3,500,000(a) | Long Point Re IV, 8.943%, (3 Month U.S. Treasury Bill + 425 bps), 6/1/26 (144A) | $ 3,436,300 | ||||
| 400,000(a) | Matterhorn Re, 9.693%, (3 Month U.S. Treasury Bill + 500 bps), 1/8/24 (144A) | 336,000 | ||||
| $ 5,415,310 | ||||||
| Multiperil – Worldwide — 0.0%† | ||||||
| 1,500,000(a) | Northshore Re II, 10.443%, (3 Month U.S. Treasury Bill + 575 bps), 1/8/24 (144A) | $ 1,439,850 | ||||
| Pandemic – U.S — 0.1% | ||||||
| 3,000,000(a) | Vitality Re XI, 6.193%, (3 Month U.S. Treasury Bill + 150 bps), 1/9/24 (144A) | $ 2,950,500 | ||||
| 1,250,000(a) | Vitality Re XI, 6.493%, (3 Month U.S. Treasury Bill + 180 bps), 1/9/24 (144A) | 1,224,625 | ||||
| $ 4,175,125 | ||||||
| Windstorm – Florida — 0.1% | ||||||
| 2,000,000(a) | Integrity Re, 11.693%, (3 Month U.S. Treasury Bill + 700 bps), 6/6/25 (144A) | $ 1,800,000 | ||||
| 2,200,000(a) | Merna Re II, 10.193%, (3 Month U.S. Treasury Bill + 550 bps), 7/8/24 (144A) | 1,840,300 | ||||
| $ 3,640,300 | ||||||
| Windstorm - Jamaica — 0.1% | ||||||
| 4,000,000(a) | International Bank for Reconstruction & Development, 9.221%, (SOFR + 440 bps), 12/29/23 (144A) | $ 3,902,400 | ||||
| Windstorm - Mexico — 0.0%† | ||||||
| 500,000(a) | International Bank for Reconstruction & Development, 11.574%, (3 Month USD LIBOR + 650 bps), 3/13/24 (144A) | $ 490,700 | ||||
| Windstorm - North Carolina — 0.1% | ||||||
| 3,000,000(a) | Cape Lookout Re, 9.693%, (3 Month U.S. Treasury Bill + 500 bps), 3/28/25 (144A) | $ 2,832,000 | ||||
| Windstorm - Texas — 0.1% | ||||||
| 2,500,000(a) | Alamo Re II, 10.213%, (1 Month U.S. Treasury Bill + 552 bps), 6/8/23 (144A) | $ 2,515,500 | ||||
| Windstorm – U.S. — 0.0%† | ||||||
| 2,000,000(a) | Bonanza Re, 9.563%, (3 Month U.S. Treasury Bill + 487 bps), 12/23/24 (144A) | $ 1,710,000 | ||||
| 250,000(a) | Bonanza Re, 10.443%, (3 Month U.S. Treasury Bill + 575 bps), 3/16/25 (144A) | 205,950 | ||||
| $ 1,915,950 | ||||||
| Principal
Amount USD ($) |
Value | ||||||
| Windstorm – U.S. Regional — 0.1% | |||||||
| 2,500,000(a) | Citrus Re, 9.793%, (3 Month U.S. Treasury Bill + 510 bps), 6/7/25 (144A) | $ 2,375,000 | |||||
| 1,000,000(a) | Commonwealth Re, 8.193%, (3 Month U.S. Treasury Bill + 350 bps), 7/8/25 (144A) | 961,000 | |||||
| $ 3,336,000 | |||||||
| Total Event Linked Bonds | $ 81,220,735 | ||||||
| Face
Amount USD ($) |
||||||
| Collateralized Reinsurance — 0.5% | ||||||
| Earthquakes – California — 0.1% | ||||||
| 2,980,000(d) + | Adare Re 2022-2, 9/30/28 | $ 3,068,497 | ||||
| Multiperil – Massachusetts — 0.1% | ||||||
| 1,500,000(d)(e) + | Ailsa Re 2022, 5/31/28 | $ 1,506,509 | ||||
| 3,000,000(d)(e) + | Denning Re 2022, 6/30/28 | 2,992,374 | ||||
| $ 4,498,883 | ||||||
| Multiperil – U.S. — 0.1% | ||||||
| 2,088,182(d)(e) + | Ballybunion Re 2022, 12/31/27 | $ 39,572 | ||||
| 1,053,082(d)(e) + | Ballybunion Re 2022-2, 5/31/28 | 1,069,415 | ||||
| 3,250,000(d)(e) + | Port Royal Re 2022, 4/30/28 | 3,242,722 | ||||
| $ 4,351,709 | ||||||
| Multiperil – Worldwide — 0.2% | ||||||
| 1,750,000(d)(e) + | Celadon Re 2022, 3/31/28 | $ 1,750,875 | ||||
| 1,000,000(d)(e) + | Cypress Re 2017, 1/31/24 | 100 | ||||
| 4,500,000(d)(e) + | Gamboge Re 2022, 3/31/28 | 4,584,150 | ||||
| 223,000(d)(e) + | Limestone Re 2019-2B, 10/1/23 (144A) | 7,448 | ||||
| 2,500,000(d)(e) + | Resilience Re, 5/1/23 | — | ||||
| $ 6,342,573 | ||||||
| Windstorm – Florida — 0.0%† | ||||||
| 2,000,000(d)(e) + | Formby Re 2018, 2/29/24 | $ 64,047 | ||||
| 800,000(d)(e) + | Portrush Re 2017, 6/15/23 | 170,160 | ||||
| $ 234,207 | ||||||
| Windstorm - North Carolina — 0.0%† | ||||||
| 2,000,000(d) + | Isosceles Re 2022-A, 4/30/28 | $ 20,200 | ||||
| 2,000,000(d) + | Isosceles Re 2022-A, 4/30/28 | 20,200 | ||||
| $ 40,400 | ||||||
| Face
Amount USD ($) |
Value | |||||
| Windstorm – U.S. Regional — 0.0%† | ||||||
| 1,500,000(d)(e) + | Isosceles Insurance 2021, 7/10/23 | $ 1,477,500 | ||||
| 1,500,000(d)(e) + | Oakmont Re 2022, 4/1/28 | 471,758 | ||||
| $ 1,949,258 | ||||||
| Total Collateralized Reinsurance | $20,485,527 | |||||
| Reinsurance Sidecars — 0.5% | ||||||
| Multiperil – U.S. — 0.0%† | ||||||
| 2,000,000(e)(f) + | Harambee Re 2018, 12/31/24 | $ — | ||||
| 4,000,000(f) + | Harambee Re 2019, 12/31/24 | 6,000 | ||||
| $ 6,000 | ||||||
| Multiperil – Worldwide — 0.5% | ||||||
| 2,000(d)(e) + | Alturas Re 2019-1, 3/10/24 (144A) | $ 9,146 | ||||
| 36,448(f) + | Alturas Re 2019-2, 3/10/24 | 12,400 | ||||
| 4,000,000(e)(f) + | Alturas Re 2021-3, 7/31/25 | 646,000 | ||||
| 421,041(e)(f) + | Alturas Re 2022-2, 12/31/27 | 158,438 | ||||
| 4,000,000(d) + | Bantry Re 2019, 12/31/24 | 68,073 | ||||
| 3,000,000(d)(e) + | Bantry Re 2022, 12/31/27 | 350,583 | ||||
| 3,658,035(d)(e) + | Berwick Re 2019-1, 12/31/24 | 583,457 | ||||
| 4,500,000(d)(e) + | Berwick Re 2022, 12/31/27 | 286,913 | ||||
| 35,797(d) + | Eden Re II, 3/22/23 (144A) | 32,072 | ||||
| 4,000(d) + | Eden Re II, 3/22/23 (144A) | 3,062 | ||||
| 3,000,000(d)(e) + | Gleneagles Re 2022, 12/31/27 | 1,562,353 | ||||
| 2,118,314(d) + | Gullane Re 2018, 12/31/24 | 100,036 | ||||
| 500,000(e)(f) + | Lion Rock Re 2019, 1/31/24 | — | ||||
| 2,744,544(e)(f) + | Lorenz Re 2019, 6/30/23 | 29,915 | ||||
| 3,000,000(d) + | Merion Re 2018-2, 12/31/24 | 227,665 | ||||
| 4,000,000(d)(e) + | Merion Re 2022-2, 12/31/27 | 3,792,446 | ||||
| 2,941,254(d)(e) + | Pangaea Re 2019-3, 7/1/23 | 105,799 | ||||
| 4,000,000(d)(e) + | Pangaea Re 2021-3, 7/1/25 | 30,488 | ||||
| 2,500,000(d) + | Pangaea Re 2022-1, 12/31/27 | 83,060 | ||||
| 3,500,000(d)(e) + | Pangaea Re 2022-3, 5/31/28 | 3,622,500 | ||||
| 4,000,000(d) + | RosaPenna Re 2021, 7/31/25 | 52,373 | ||||
| 3,500,000(d)(e) + | RosaPenna Re 2022, 6/30/28 | 3,711,750 | ||||
| 800,000(d) + | Sector Re V, 3/1/24 (144A) | 390,391 | ||||
| 1,861(d) + | Sector Re V, 3/1/24 (144A) | 44,531 | ||||
| 160,000(d) + | Sector Re V, 12/1/24 (144A) | 267,899 | ||||
| 50,000(d)(e) + | Sector Re V, 12/1/26 (144A) | 234,120 | ||||
| 3,000,000(f) + | Thopas Re 2019, 12/31/24 | 9,900 | ||||
| 3,500,000(f) + | Thopas Re 2022, 12/31/27 | 58,100 | ||||
| 4,000,000(f) + | Torricelli Re 2021, 7/31/25 | 166,012 | ||||
| 4,000,000(e)(f) + | Torricelli Re 2022, 6/30/28 | 4,292,800 | ||||
| 2,000,000(d) + | Versutus Re 2018, 12/31/24 | 5,200 | ||||
| Face
Amount USD ($) |
Value | ||||||
| Multiperil – Worldwide — (continued) | |||||||
| 1,765,095(d) + | Versutus Re 2019-A, 12/31/24 | $ — | |||||
| 1,434,906(d) + | Versutus Re 2019-B, 12/31/24 | — | |||||
| 750,000(e)(f) + | Viribus Re 2018, 12/31/24 | — | |||||
| 2,500,000(f) + | Viribus Re 2019, 12/31/24 | 17,750 | |||||
| 1,724,784(d)(e) + | Woburn Re 2018, 12/31/24 | 38,077 | |||||
| 809,418(d)(e) + | Woburn Re 2019, 12/31/24 | 140,095 | |||||
| $ 21,133,404 | |||||||
| Total Reinsurance Sidecars | $21,139,404 | ||||||
| Industry Loss Warranties — 0.0%† | |||||||
| Windstorm – U.S. — 0.0%† | |||||||
| 750,000(d)(e) + | Ballylifin Re 2022, 5/31/28 | $ 3,450 | |||||
| Total Industry Loss Warranties | $3,450 | ||||||
| Total
Insurance-Linked Securities (Cost $128,426,920) |
$122,849,116 | ||||||
| Principal
Amount USD ($) |
||||||
| U.S.
Government and Agency Obligations — 1.5% of Net Assets |
||||||
| 24(a) | Federal Home Loan Mortgage Corp., 4.187%, (1 Year CMT Index + 227 bps), 10/1/23 | $ 24 | ||||
| 1,289(a) | Federal Home Loan Mortgage Corp., 4.250%, (12 mo. USD LIBOR + 200 bps), 11/1/33 | 1,264 | ||||
| 2,295,463 | Federal National Mortgage Association, 3.000%, 3/1/47 | 2,110,836 | ||||
| 3,352(a) | Federal National Mortgage Association, 3.954%, (12 mo. USD LIBOR + 167 bps), 1/1/48 | 3,281 | ||||
| 3,866(a) | Federal National Mortgage Association, 4.185%, (1 Year CMT Index + 209 bps), 9/1/32 | 3,829 | ||||
| 1,442(a) | Federal National Mortgage Association, 4.230%, (1 Year CMT Index + 211 bps), 10/1/32 | 1,405 | ||||
| 5,171(a) | Federal National Mortgage Association, 4.295%, (1 Year CMT Index + 217 bps), 2/1/34 | 5,054 | ||||
| 23,000,000 | Federal National Mortgage Association, 4.500%, 4/15/53 (TBA) | 22,535,304 | ||||
| Principal
Amount USD ($) |
Value | |||||
| U.S.
Government and Agency Obligations — (continued) |
||||||
| 8,000,000 | Federal National Mortgage Association, 5.500%, 4/1/53 (TBA) | $ 8,080,781 | ||||
| 31,000,000 | Federal National Mortgage Association, 6.000%, 4/15/53 (TBA) | 31,640,586 | ||||
| Total
U.S. Government and Agency Obligations (Cost $63,518,199) |
$64,382,364 | |||||
| SHORT TERM
INVESTMENTS — 13.7% of Net Assets |
||||||
| Repurchase Agreements — 6.1% | ||||||
| 103,230,000 | Bank of America, 4.81%, dated 3/31/23, to be purchased on 4/3/23 for $103,271,378, collateralized by $105,294,615 U.S. Treasury Note, 1.25%-4.625%, 3/15/26-12/31/26 | $ 103,230,000 | ||||
| 48,380,000 | Scotia
Capital Inc., 4.8%, dated 3/31/23, to be purchased on 4/3/23 for $48,399,352, collateralized by the following: $947,090 Federal Home Loan Mortgage Corporation, 4.0%, 4/1/34-3/1/47, $16,213,065 Federal National Mortgage Association, 2.5%, 5/1/50, $32,207,250 U.S. Treasury Note, 0.125%, 7/31/23 |
48,380,000 | ||||
| 45,220,000 | RBC
Dominion Securities Inc., 4.8%, dated 3/31/23, to be purchased on 4/3/23 for $45,238,088, collateralized by the following: $3,206,882 U.S. Treasury Bill, 7/5/23-3/21/24, $39,153,677 U.S. Treasury Floating Rate Note, 4.760%-4.768%, 7/31/23-7/31/24, $3,782,324 U.S. Treasury Note, 0.25%-2.65%, 6/30/25-5/31/27 |
45,220,000 | ||||
| 32,610,000 | Toronto-Dominion Bank, 4.79%, dated 3/31/23, to be purchased on 4/3/23 for $32,623,017, collateralized by $33,262,273 U.S. Treasury Notes, 0.5%-4.25%, 10/15/24-5/15/30 | 32,610,000 | ||||
| 32,610,000 | Toronto-Dominion Bank, 4.8%, dated 3/31/23, to be purchased on 4/3/23 for $32,623,044, collateralized by $33,262,200 Government National Mortgage Association, 3.0%-5.5%, 1/20/52-12/20/52 | 32,610,000 | ||||
| $ 262,050,000 | ||||||
| Commercial Paper — 7.6% of Net Assets | ||||||
| 22,000,000(g) | Alexandria Real Estate Equities, Inc., 5.211%, 4/13/23 | $ 21,960,182 | ||||
| 13,000,000(g) | Canadian Natural Resources, Ltd., 5.642%, 4/12/23 | 12,976,461 | ||||
| 1,100,000(g) | Centerpoint Energy, Inc., 5.002%, 4/3/23 | 1,099,546 | ||||
| Principal
Amount USD ($) |
Value | |||||
| Commercial Paper — (continued) | ||||||
| 4,000,000(g) | Centerpoint Energy, Inc., 0.000%, 4/4/23 | $ 3,999,444 | ||||
| 11,000,000(g) | Centerpoint Energy, Inc., 5.26%, 4/11/23 | 10,982,969 | ||||
| 13,300,000(g) | Dollar General Corp., 4.952%, 3/1/28 | 13,294,370 | ||||
| 8,700,000(g) | Dollar General Corp., 5.109%, 4/10/23 | 8,687,569 | ||||
| 22,000,000(g) | Duke Energy Corp., 5.641%, 4/3/23 | 21,990,687 | ||||
| 22,000,000(g) | Elevance Health, Inc., 4.902%, 4/3/23 | 21,991,017 | ||||
| 10,365,000(g) | Enbridge, Inc., 5.158%, 4/11/23 | 10,348,148 | ||||
| 18,000,000(g) | Energy Transfer LP, 5.553%, 4/3/23 | 17,991,869 | ||||
| 10,700,000(g) | Eversource Energy, 5.054%, 4/5/23 | 10,692,529 | ||||
| 18,000,000(g) | FMC Corp., 5.703%, 4/3/23 | 17,991,930 | ||||
| 22,000,000(g) | Healthpeak Properties, Inc., 5.51%, 4/4/23 | 21,987,494 | ||||
| 18,000,000(g) | Jabil, Inc., 5.603%, 4/3/23 | 17,991,568 | ||||
| 4,000,000(g) | Mohawk Industries, Inc., 5.154%, 4/5/23 | 3,997,167 | ||||
| 18,000,000(g) | Mohawk Industries, Inc., 5.059%, 4/12/23 | 17,968,896 | ||||
| 23,500,000(g) | Prudential PLC, 4.815%, 4/5/23 | 23,484,278 | ||||
| 22,000,000(g) | The Dow Chemical Co., 5.005%, 4/6/23 | 21,981,153 | ||||
| 22,000,000(g) | UDR, Inc., 5.16%, 4/6/23 | 21,981,263 | ||||
| 22,000,000(g) | WEC Energy Group, 5.16%, 4/11/23 | 21,965,374 | ||||
| 5,600,000(g) | Wisconsin Public Service Corp., 4.952%, 4/3/23 | 5,597,656 | ||||
| Total
Commercial Paper (Cost $331,005,566) |
$330,961,570 | |||||
| TOTAL
SHORT TERM INVESTMENTS (Cost $593,055,566) |
$593,011,570 | |||||
| TOTAL
INVESTMENTS IN UNAFFILIATED ISSUERS — 97.7% (Cost $4,328,859,332) |
$ 4,242,815,006 | |||||
| OTHER ASSETS AND LIABILITIES — 2.3% | $ 100,623,669 | |||||
| net assets — 100.0% | $4,343,438,675 | |||||
| (TBA) | “To Be Announced” Securities. |
| bps | Basis Points. |
| CMT | Constant Maturity Treasury Index. |
| LIBOR | London Interbank Offered Rate. |
| PRIME | U.S. Federal Funds Rate. |
| REMICs | Real Estate Mortgage Investment Conduits. |
| SOFR | Secured Overnight Financing Rate. |
| SOFR30A | Secured Overnight Financing Rate 30 Day Average. |
| STRIPS | Separate Trading of Registered Interest and Principal of Securities |
| (144A) | Security is exempt from registration under Rule 144A of the Securities Act of 1933. Such securities may be resold normally to qualified institutional buyers in a transaction exempt from registration. At March 31, 2023, the value of these securities amounted to $2,519,945,418, or 58.0% of net assets. |
| (a) | Floating rate note. Coupon rate, reference index and spread shown at March 31, 2023. |
| (b) | This term loan will settle after March 31, 2023, at which time the interest rate will be determined. |
| (c) | The interest rate is subject to change periodically. The interest rate and/or reference index and spread shown at March 31, 2023. |
| (d) | Issued as participation notes. |
| (e) | Non-income producing security. |
| (f) | Issued as preference shares. |
| (g) | Rate shown represents yield-to-maturity. |
| * | Senior secured floating rate loan interests in which the Fund invests generally pay interest at rates that are periodically re-determined by reference to a base lending rate plus a premium. These base lending rates are generally (i) the lending rate offered by one or more major European banks, such as LIBOR or SOFR, (ii) the prime rate offered by one or more major United States banks, (iii) the rate of a certificate of deposit or (iv) other base lending rates used by commercial lenders. The interest rate shown is the rate accruing at March 31, 2023. |
| † | Amount rounds to less than 0.1%. |
| + | Security is valued using significant unobservable inputs (Level 3). |
| # | Securities are restricted as to resale. |
| Restricted Securities | Acquisition date | Cost | Value |
| Acorn Re | 10/25/2021 | $2,500,000 | $ 2,380,000 |
| Adare Re 2022-2 | 10/20/2022 | 2,980,000 | 3,068,497 |
| Ailsa Re 2022 | 6/30/2022 | 1,450,260 | 1,506,509 |
| Alamo Re II | 5/29/2020 | 2,500,000 | 2,515,500 |
| Alturas Re 2019-1 | 12/20/2018 | 2,000 | 9,146 |
| Alturas Re 2019-2 | 12/19/2018 | 31,877 | 12,400 |
| Alturas Re 2021-3 | 7/1/2021 | 1,132,665 | 646,000 |
| Alturas Re 2022-2 | 1/6/2022 | 198,922 | 158,438 |
| Ballybunion Re 2022 | 3/9/2022 | 3,338 | 39,572 |
| Ballybunion Re 2022-2 | 8/9/2022 | 1,053,082 | 1,069,415 |
| Ballylifin Re 2022 | 7/15/2022 | 610,875 | 3,450 |
| Bantry Re 2019 | 2/1/2019 | — | 68,073 |
| Bantry Re 2022 | 1/28/2022 | 222,536 | 350,583 |
| Berwick Re 2019-1 | 12/31/2018 | 437,104 | 583,457 |
| Berwick Re 2022 | 12/28/2021 | 280,613 | 286,913 |
| Bonanza Re | 2/13/2020 | 1,500,000 | 1,274,700 |
| Bonanza Re | 12/15/2020 | 2,000,000 | 1,710,000 |
| Bonanza Re | 3/11/2022 | 250,000 | 205,950 |
| Caelus Re V | 4/27/2017 | 125,000 | 100,000 |
| Caelus Re V | 5/4/2018 | 500,000 | 350,000 |
| Restricted Securities | Acquisition date | Cost | Value |
| Caelus Re V | 5/4/2018 | $ 750,000 | $ 75 |
| Caelus Re VI | 2/20/2020 | 750,000 | 723,375 |
| Cape Lookout Re | 3/16/2022 | 3,000,000 | 2,832,000 |
| Celadon Re 2022 | 9/13/2022 | 1,488,553 | 1,750,875 |
| Citrus Re | 4/11/2022 | 2,500,000 | 2,375,000 |
| Commonwealth Re | 6/15/2022 | 1,000,000 | 961,000 |
| Cypress Re 2017 | 1/24/2017 | 3,361 | 100 |
| Denning Re 2022 | 7/11/2022 | 2,930,481 | 2,992,374 |
| Easton Re Pte | 12/15/2020 | 4,500,000 | 4,367,250 |
| Eden Re II | 12/14/2018 | 1,152 | 3,062 |
| Eden Re II | 1/22/2019 | 4,198 | 32,072 |
| First Coast Re II Pte | 6/15/2020 | 698,587 | 697,410 |
| FloodSmart Re | 2/14/2022 | 1,500,000 | 1,395,000 |
| Formby Re 2018 | 7/9/2018 | 6,214 | 64,047 |
| Four Lakes Re | 11/5/2020 | 1,750,000 | 1,632,750 |
| Four Lakes Re | 12/15/2021 | 2,000,000 | 1,849,000 |
| Gamboge Re 2022 | 4/11/2022 | 4,046,823 | 4,584,150 |
| Gleneagles Re 2022 | 1/18/2022 | 1,468,603 | 1,562,353 |
| Gullane Re 2018 | 3/26/2018 | — | 100,036 |
| Harambee Re 2018 | 12/19/2017 | 42,461 | — |
| Harambee Re 2019 | 12/20/2018 | — | 6,000 |
| Herbie Re | 10/19/2020 | 500,000 | 451,000 |
| Hypatia | 7/10/2020 | 2,500,000 | 2,507,500 |
| Hypatia | 7/10/2020 | 1,000,000 | 978,100 |
| Integrity Re | 5/9/2022 | 2,000,000 | 1,800,000 |
| International Bank for Reconstruction & Development | 2/28/2020 | 500,000 | 497,550 |
| International Bank for Reconstruction & Development | 2/28/2020 | 500,000 | 490,700 |
| International Bank for Reconstruction & Development | 7/19/2021 | 4,000,000 | 3,902,400 |
| Isosceles Insurance 2021 | 6/25/2021 | 1,500,000 | 1,477,500 |
| Isosceles Re 2022-A | 7/6/2022 | — | 20,200 |
| Isosceles Re 2022-A | 7/6/2022 | — | 20,200 |
| Kilimanjaro III Re | 6/15/2022 | 1,000,000 | 945,600 |
| Limestone Re 2019-2B | 6/20/2018 | 1,771 | 7,448 |
| Lion Rock Re 2019 | 12/17/2018 | — | — |
| Long Point Re IV | 5/13/2022 | 3,500,000 | 3,436,300 |
| Lorenz Re 2019 | 6/26/2019 | 525,988 | 29,915 |
| Matterhorn Re | 6/5/2020 | 398,642 | 336,000 |
| Matterhorn Re | 12/15/2021 | 250,000 | 208,375 |
| Matterhorn Re | 3/10/2022 | 5,000,000 | 4,396,500 |
| Matterhorn Re | 3/10/2022 | 2,000,000 | 1,744,400 |
| Merion Re 2018-2 | 12/28/2017 | — | 227,665 |
| Merion Re 2022-2 | 2/22/2022 | 4,000,000 | 3,792,446 |
| Merna Re II | 6/8/2021 | 2,200,000 | 1,840,300 |
| Restricted Securities | Acquisition date | Cost | Value |
| Mona Lisa Re | 6/22/2021 | $1,000,000 | $ 893,900 |
| Mystic Re IV | 6/9/2021 | 4,000,000 | 3,640,400 |
| Northshore Re II | 12/2/2020 | 1,500,000 | 1,439,850 |
| Oakmont Re 2022 | 5/4/2022 | 345,065 | 471,758 |
| Pangaea Re 2019-3 | 7/25/2019 | 88,238 | 105,799 |
| Pangaea Re 2021-3 | 6/17/2021 | 138,303 | 30,488 |
| Pangaea Re 2022-1 | 1/7/2022 | — | 83,060 |
| Pangaea Re 2022-3 | 6/27/2022 | 3,500,000 | 3,622,500 |
| Phoenician Re | 12/1/2021 | 2,000,000 | 1,890,800 |
| Port Royal Re 2022 | 6/3/2022 | 3,142,230 | 3,242,722 |
| Portrush Re 2017 | 6/12/2017 | 613,588 | 170,160 |
| Residential Re | 10/30/2020 | 1,500,000 | 1,429,200 |
| Residential Re | 10/28/2021 | 5,000,000 | 4,468,000 |
| Resilience Re | 2/8/2017 | 1,209 | — |
| RosaPenna Re 2021 | 7/16/2021 | — | 52,373 |
| RosaPenna Re 2022 | 9/6/2022 | 3,500,000 | 3,711,750 |
| Sanders Re II | 5/20/2020 | 250,000 | 246,250 |
| Sanders Re II | 5/24/2021 | 3,000,000 | 2,865,300 |
| Sanders Re II | 11/23/2021 | 2,752,500 | 2,630,375 |
| Sanders Re III | 3/22/2022 | 3,000,000 | 2,827,500 |
| Sector Re V | 4/23/2019 | 546,018 | 390,391 |
| Sector Re V | 5/1/2019 | 1,861 | 44,531 |
| Sector Re V | 1/1/2020 | 4,628 | 267,899 |
| Sector Re V | 12/6/2021 | 50,000 | 234,120 |
| Sussex Re | 12/7/2020 | 1,000,000 | 913,800 |
| Thopas Re 2019 | 12/21/2018 | — | 9,900 |
| Thopas Re 2022 | 2/7/2022 | — | 58,100 |
| Torrey Pines Re Pte | 3/12/2021 | 1,000,000 | 970,900 |
| Torricelli Re 2021 | 7/1/2021 | — | 166,012 |
| Torricelli Re 2022 | 7/26/2022 | 4,000,000 | 4,292,800 |
| Ursa Re II | 10/8/2020 | 4,000,000 | 3,925,600 |
| Versutus Re 2018 | 1/31/2018 | — | 5,200 |
| Versutus Re 2019-A | 1/28/2019 | — | — |
| Versutus Re 2019-B | 12/24/2018 | — | — |
| Viribus Re 2018 | 12/22/2017 | 15,839 | — |
| Viribus Re 2019 | 12/27/2018 | — | 17,750 |
| Vitality Re XI | 1/23/2020 | 3,000,000 | 2,950,500 |
| Vitality Re XI | 1/23/2020 | 1,248,271 | 1,224,625 |
| Woburn Re 2018 | 3/20/2018 | 521,925 | 38,077 |
| Woburn Re 2019 | 1/30/2019 | 112,139 | 140,095 |
| Total Restricted Securities | $122,849,116 | ||
| % of Net assets | 2.8% |
FIXED INCOME INDEX FUTURES CONTRACTS
| Number
of Contracts Short |
Description | Expiration
Date |
Notional
Amount |
Market
Value |
Unrealized
(Depreciation) |
| 921 | U.S. 2 Year Note (CBT) | 6/30/23 | $ (188,184,020) | $ (190,143,329) | $ (1,959,309) |
| 186 | U.S. 10 Year Note (CBT) | 6/21/23 | (20,815,461) | (21,375,469) | (560,008) |
| $ (208,999,481) | $ (211,518,798) | $ (2,519,317) | |||
| TOTAL FUTURES CONTRACTS | $(208,999,481) | $(211,518,798) | $(2,519,317) | ||
| Purchases | Sales | |
| Long-Term U.S. Government Securities | $ — | $ 51,109,995 |
| Other Long-Term Securities | $1,316,445,618 | $2,126,125,211 |
| Aggregate gross unrealized appreciation for all investments in which there is an excess of value over tax cost | $ 11,406,935 |
| Aggregate gross unrealized depreciation for all investments in which there is an excess of tax cost over value | (101,898,258) |
| Net unrealized depreciation | $ (90,491,323) |
| Level 1 | – | unadjusted quoted prices in active markets for identical securities. |
| Level 2 | – | other significant observable inputs (including quoted prices for similar securities, interest rates, prepayment speeds, credit risks, etc.). See Notes to Financial Statements — Note 1A. |
| Level 3 | – | significant unobservable inputs (including the Adviser's own assumptions in determining fair value of investments). See Notes to Financial Statements — Note 1A. |
| Level 1 | Level 2 | Level 3 | Total | |
| Senior Secured Floating Rate Loan Interests | $ — | $ 96,128,567 | $ — | $ 96,128,567 |
| Asset Backed Securities | — | 1,233,372,384 | — | 1,233,372,384 |
| Collateralized Mortgage Obligations | — | 582,543,985 | — | 582,543,985 |
| Commercial Mortgage-Backed Securities | — | 273,698,086 | — | 273,698,086 |
| Corporate Bonds | — | 1,276,828,934 | — | 1,276,828,934 |
| Insurance-Linked Securities | ||||
| Collateralized Reinsurance | ||||
| Earthquakes – California | — | — | 3,068,497 | 3,068,497 |
| Multiperil – Massachusetts | — | — | 4,498,883 | 4,498,883 |
| Multiperil – U.S. | — | — | 4,351,709 | 4,351,709 |
| Multiperil – Worldwide | — | — | 6,342,573 | 6,342,573 |
| Windstorm – Florida | — | — | 234,207 | 234,207 |
| Windstorm - North Carolina | — | — | 40,400 | 40,400 |
| Windstorm – U.S. Regional | — | — | 1,949,258 | 1,949,258 |
| Reinsurance Sidecars | ||||
| Multiperil – U.S. | — | — | 6,000 | 6,000 |
| Multiperil – Worldwide | — | — | 21,133,404 | 21,133,404 |
| Industry Loss Warranties | ||||
| Windstorm – U.S. | — | — | 3,450 | 3,450 |
| All Other Insurance-Linked Securities | — | 81,220,735 | — | 81,220,735 |
| U.S. Government and Agency Obligations | — | 64,382,364 | — | 64,382,364 |
| Repurchase Agreements | — | 262,050,000 | — | 262,050,000 |
| Commercial Paper | — | 330,961,570 | — | 330,961,570 |
| Total Investments in Securities | $ — | $ 4,201,186,625 | $ 41,628,381 | $ 4,242,815,006 |
| Level 1 | Level 2 | Level 3 | Total | |
| Other Financial Instruments | ||||
| Net unrealized depreciation on futures contracts | $(2,519,317) | $ — | $ — | $ (2,519,317) |
| Total Other Financial Instruments | $ (2,519,317) | $ — | $ — | $ (2,519,317) |
| ASSETS: | |
| Investments in unaffiliated issuers, at value (cost $4,328,859,332) | $4,242,815,006 |
| Cash | 154,758,282 |
| Futures collateral | 3,205,773 |
| Receivables — | |
| Investment securities sold | 3,826,344 |
| Fund shares sold | 33,212,660 |
| Interest | 18,205,296 |
| Other assets | 36,054 |
| Total assets | $ 4,456,059,415 |
| LIABILITIES: | |
| Payables — | |
| Investment securities purchased | $ 79,276,278 |
| Fund shares repurchased | 29,650,020 |
| Distributions | 1,703,995 |
| Trustees' fees | 37,610 |
| Collateral due from broker for TBA Securities | 654,394 |
| Variation margin for futures contracts | 193,454 |
| Unrealized depreciation on unfunded loan commitments | 5,462 |
| Management fees | 111,044 |
| Administrative expenses | 119,233 |
| Distribution fees | 22,304 |
| Accrued expenses | 846,946 |
| Total liabilities | $ 112,620,740 |
| NET ASSETS: | |
| Paid-in capital | $4,697,212,312 |
| Distributable earnings (loss) | (353,773,637) |
| Net assets | $4,343,438,675 |
| NET ASSET VALUE PER SHARE: | |
| No par value (unlimited number of shares authorized) | |
| Class A (based on $1,126,766,676/118,287,561 shares) | $ 9.53 |
| Class C (based on $83,702,873/8,781,183 shares) | $ 9.53 |
| Class C2 (based on $8,462,908/887,621 shares) | $ 9.53 |
| Class K (based on $465,248,015/48,690,635 shares) | $ 9.56 |
| Class Y (based on $2,659,258,203/278,646,042 shares) | $ 9.54 |
| INVESTMENT INCOME: | ||
| Interest from unaffiliated issuers (net of foreign taxes withheld $31,262) | $174,516,486 | |
| Dividends from unaffiliated issuers | 4,721,900 | |
| Total Investment Income | $179,238,386 | |
| EXPENSES: | ||
| Management fees | $ 14,173,086 | |
| Administrative expenses | 1,158,954 | |
| Transfer agent fees | ||
| Class A | 428,813 | |
| Class C | 44,378 | |
| Class C2 | 3,729 | |
| Class K | 83 | |
| Class Y | 1,959,447 | |
| Distribution fees | ||
| Class A | 2,800,273 | |
| Class C | 544,576 | |
| Class C2 | 53,134 | |
| Shareowner communications expense | 113,048 | |
| Custodian fees | 47,242 | |
| Registration fees | 360,541 | |
| Professional fees | 615,398 | |
| Printing expense | 59,106 | |
| Officers' and Trustees' fees | 303,002 | |
| Insurance expense | 49,234 | |
| Miscellaneous | 224,866 | |
| Total expenses | $ 22,938,910 | |
| Net investment income | $156,299,476 | |
| REALIZED AND UNREALIZED GAIN (LOSS) ON INVESTMENTS: | ||
| Net realized gain (loss) on: | ||
| Investments in unaffiliated issuers | $ (23,677,052) | |
| Futures contracts | 22,999,901 | $ (677,151) |
| Change in net unrealized appreciation (depreciation) on: | ||
| Investments in unaffiliated issuers | $ (34,277,913) | |
| Futures contracts | (8,518,166) | |
| Unfunded loan commitments | (23) | $ (42,796,102) |
| Net realized and unrealized gain (loss) on investments | $ (43,473,253) | |
| Net increase in net assets resulting from operations | $112,826,223 |
| Year
Ended 3/31/23 |
Year
Ended 3/31/22 | |
| FROM OPERATIONS: | ||
| Net investment income (loss) | $ 156,299,476 | $ 51,446,930 |
| Net realized gain (loss) on investments | (677,151) | 2,457,088 |
| Change in net unrealized appreciation (depreciation) on investments | (42,796,102) | (44,779,660) |
| Net increase in net assets resulting from operations | $ 112,826,223 | $ 9,124,358 |
| DISTRIBUTIONS TO SHAREOWNERS: | ||
| Class A ($0.33 and $0.12 per share, respectively) | $ (45,177,410) | $ (21,372,537) |
| Class C ($0.30 and $0.08 per share, respectively) | (3,171,931) | (1,510,772) |
| Class C2 ($0.30 and $0.09 per share, respectively) | (304,605) | (161,898) |
| Class K ($0.35 and $0.14 per share, respectively) | (14,837,824) | (5,277,867) |
| Class Y ($0.34 and $0.13 per share, respectively) | (93,891,768) | (33,910,767) |
| Total distributions to shareowners | $ (157,383,538) | $ (62,233,841) |
| FROM FUND SHARE TRANSACTIONS: | ||
| Net proceeds from sales of shares | $ 2,526,795,632 | $ 3,570,493,668 |
| Reinvestment of distributions | 143,378,011 | 57,192,875 |
| Cost of shares repurchased | (3,367,262,456) | (2,951,666,742) |
| Net increase (decrease) in net assets resulting from Fund share transactions | $ (697,088,813) | $ 676,019,801 |
| Net increase (decrease) in net assets | $ (741,646,128) | $ 622,910,318 |
| NET ASSETS: | ||
| Beginning of year | $ 5,085,084,803 | $ 4,462,174,485 |
| End of year | $ 4,343,438,675 | $ 5,085,084,803 |
| Year
Ended 3/31/23 Shares |
Year
Ended 3/31/23 Amount |
Year
Ended 3/31/22 Shares |
Year
Ended 3/31/22 Amount | |
| Class A | ||||
| Shares sold | 51,546,875 | $ 491,379,155 | 147,680,358 | $ 1,432,006,948 |
| Reinvestment of distributions | 4,633,351 | 44,082,938 | 2,166,658 | 20,986,743 |
| Less shares repurchased | (127,741,729) | (1,217,403,060) | (120,772,781) | (1,170,018,795) |
| Net
increase (decrease) |
(71,561,503) | $ (681,940,967) | 29,074,235 | $ 282,974,896 |
| Class C | ||||
| Shares sold | 888,298 | $ 8,462,519 | 1,057,619 | $ 10,260,634 |
| Reinvestment of distributions | 330,923 | 3,150,518 | 155,433 | 1,507,013 |
| Less shares repurchased | (6,655,032) | (63,442,174) | (8,963,636) | (86,929,011) |
| Net decrease | (5,435,811) | $ (51,829,137) | (7,750,584) | $ (75,161,364) |
| Class C2 | ||||
| Shares sold | 68,056 | $ 648,782 | 109,304 | $ 1,061,100 |
| Reinvestment of distributions | 3,410 | 32,472 | 1,691 | 16,401 |
| Less shares repurchased | (832,791) | (7,952,273) | (461,619) | (4,477,612) |
| Net decrease | (761,325) | $ (7,271,019) | (350,624) | $ (3,400,111) |
| Class K | ||||
| Shares sold | 14,966,722 | $ 143,123,150 | 13,900,269 | $ 135,064,288 |
| Reinvestment of distributions | 1,553,923 | 14,832,180 | 541,677 | 5,262,947 |
| Less shares repurchased | (7,490,765) | (71,627,487) | (8,968,708) | (87,058,011) |
| Net increase | 9,029,880 | $ 86,327,843 | 5,473,238 | $ 53,269,224 |
| Class Y | ||||
| Shares sold | 197,282,641 | $ 1,883,182,026 | 205,254,670 | $ 1,992,100,698 |
| Reinvestment of distributions | 8,525,407 | 81,279,903 | 3,031,623 | 29,419,771 |
| Less shares repurchased | (210,298,894) | (2,006,837,462) | (165,246,141) | (1,603,183,313) |
| Net
increase (decrease) |
(4,490,846) | $ (42,375,533) | 43,040,152 | $ 418,337,156 |
| Year
Ended 3/31/23 |
Year
Ended 3/31/22 |
Year
Ended 3/31/21 |
Year
Ended 3/31/20 |
Year
Ended 3/31/19 | |
| Class A | |||||
| Net asset value, beginning of period | $ 9.61 | $ 9.71 | $ 9.26 | $ 9.92 | $ 9.95 |
| Increase (decrease) from investment operations: | |||||
| Net investment income (loss) (a) | $ 0.31 | $ 0.09 | $ 0.12 | $ 0.25 | $ 0.26 |
| Net realized and unrealized gain (loss) on investments | (0.06) | (0.07) | 0.47 | (0.64) | (0.03) |
| Net increase (decrease) from investment operations | $ 0.25 | $ 0.02 | $ 0.59 | $ (0.39) | $ 0.23 |
| Distributions to shareowners: | |||||
| Net investment income | $ (0.33) | $ (0.12) | $ (0.14) | $ (0.27) | $ (0.26) |
| Total distributions | $ (0.33) | $ (0.12) | $ (0.14) | $ (0.27) | $ (0.26) |
| Net increase (decrease) in net asset value | $ (0.08) | $ (0.10) | $ 0.45 | $ (0.66) | $ (0.03) |
| Net asset value, end of period | $ 9.53 | $ 9.61 | $ 9.71 | $ 9.26 | $ 9.92 |
| Total return (b) | 2.62% | 0.16% | 6.42% | (4.02)% | 2.32% |
| Ratio of net expenses to average net assets | 0.60% | 0.59% | 0.60% | 0.58% | 0.59% |
| Ratio of net investment income (loss) to average net assets | 3.21% | 0.96% | 1.29% | 2.52% | 2.58% |
| Portfolio turnover rate | 34% | 52% | 51% | 100% | 61% |
| Net assets, end of period (in thousands) | $1,126,767 | $1,824,401 | $1,561,042 | $1,628,082 | $1,506,433 |
| (a) | The per-share data presented above is based on the average shares outstanding for the period presented. |
| (b) | Assumes initial investment at net asset value at the beginning of each period, reinvestment of all distributions, the complete redemption of the investment at net asset value at the end of each period and no sales charges. Total return would be reduced if sales charges were taken into account. |
| Year
Ended 3/31/23 |
Year
Ended 3/31/22 |
Year
Ended 3/31/21 |
Year
Ended 3/31/20 |
Year
Ended 3/31/19 | |
| Class C | |||||
| Net asset value, beginning of period | $ 9.61 | $ 9.71 | $ 9.26 | $ 9.91 | $ 9.94 |
| Increase (decrease) from investment operations: | |||||
| Net investment income (loss) (a) | $ 0.28 | $ 0.06 | $ 0.10 | $ 0.22 | $ 0.22 |
| Net realized and unrealized gain (loss) on investments | (0.06) | (0.08) | 0.46 | (0.63) | (0.02) |
| Net increase (decrease) from investment operations | $ 0.22 | $ (0.02) | $ 0.56 | $ (0.41) | $ 0.20 |
| Distributions to shareowners: | |||||
| Net investment income | $ (0.30) | $ (0.08) | $ (0.11) | $ (0.24) | $ (0.23) |
| Total distributions | $ (0.30) | $ (0.08) | $ (0.11) | $ (0.24) | $ (0.23) |
| Net increase (decrease) in net asset value | $ (0.08) | $ (0.10) | $ 0.45 | $ (0.65) | $ (0.03) |
| Net asset value, end of period | $ 9.53 | $ 9.61 | $ 9.71 | $ 9.26 | $ 9.91 |
| Total return (b) | 2.29% | (0.17)% | 6.09% | (4.24)% | 1.99% |
| Ratio of net expenses to average net assets | 0.92% | 0.91% | 0.91% | 0.89% | 0.91% |
| Ratio of net investment income (loss) to average net assets | 2.90% | 0.66% | 1.00% | 2.25% | 2.22% |
| Portfolio turnover rate | 34% | 52% | 51% | 100% | 61% |
| Net assets, end of period (in thousands) | $83,703 | $136,692 | $213,396 | $300,129 | $425,928 |
| (a) | The per-share data presented above is based on the average shares outstanding for the period presented. |
| (b) | Assumes initial investment at net asset value at the beginning of each period, reinvestment of all distributions and the complete redemption of the investment at net asset value at the end of each period. |
| Year
Ended 3/31/23 |
Year
Ended 3/31/22 |
Year
Ended 3/31/21 |
Year
Ended 3/31/20 |
Year
Ended 3/31/19 | |
| Class C2 | |||||
| Net asset value, beginning of period | $ 9.62 | $ 9.72 | $ 9.27 | $ 9.91 | $ 9.94 |
| Increase (decrease) from investment operations: | |||||
| Net investment income (loss) (a) | $ 0.27 | $ 0.07 | $ 0.10 | $ 0.21 | $ 0.22 |
| Net realized and unrealized gain (loss) on investments | (0.06) | (0.08) | 0.46 | (0.61) | (0.02) |
| Net increase (decrease) from investment operations | $ 0.21 | $ (0.01) | $ 0.56 | $ (0.40) | $ 0.20 |
| Distributions to shareowners: | |||||
| Net investment income | $ (0.30) | $ (0.09) | $ (0.11) | $ (0.24) | $ (0.23) |
| Total distributions | $ (0.30) | $ (0.09) | $ (0.11) | $ (0.24) | $ (0.23) |
| Net increase (decrease) in net asset value | $ (0.09) | $ (0.10) | $ 0.45 | $ (0.64) | $ (0.03) |
| Net asset value, end of period | $ 9.53 | $ 9.62 | $ 9.72 | $ 9.27 | $ 9.91 |
| Total return (b) | 2.21% | (0.14)% | 6.09% | (4.13)% | 1.98% |
| Ratio of net expenses to average net assets | 0.91% | 0.88% | 0.90% | 0.88% | 0.91% |
| Ratio of net investment income (loss) to average net assets | 2.85% | 0.69% | 1.00% | 2.17% | 2.25% |
| Portfolio turnover rate | 34% | 52% | 51% | 100% | 61% |
| Net assets, end of period (in thousands) | $8,463 | $15,861 | $19,432 | $20,982 | $8,604 |
| (a) | The per-share data presented above is based on the average shares outstanding for the period presented. |
| (b) | Assumes initial investment at net asset value at the beginning of each period, reinvestment of all distributions, the complete redemption of the investment at net asset value at the end of each period and no sales charges. Total return would be reduced if sales charges were taken into account. |
| Year
Ended 3/31/23 |
Year
Ended 3/31/22 |
Year
Ended 3/31/21 |
Year
Ended 3/31/20 |
Year
Ended 3/31/19 | |
| Class K | |||||
| Net asset value, beginning of period | $ 9.64 | $ 9.74 | $ 9.29 | $ 9.93 | $ 9.96 |
| Increase (decrease) from investment operations: | |||||
| Net investment income (loss) (a) | $ 0.35 | $ 0.12 | $ 0.15 | $ 0.28 | $ 0.28 |
| Net realized and unrealized gain (loss) on investments | (0.08) | (0.08) | 0.46 | (0.62) | (0.03) |
| Net increase (decrease) from investment operations | $ 0.27 | $ 0.04 | $ 0.61 | $ (0.34) | $ 0.25 |
| Distributions to shareowners: | |||||
| Net investment income | $ (0.35) | $ (0.14) | $ (0.16) | $ (0.30) | $ (0.28) |
| Total distributions | $ (0.35) | $ (0.14) | $ (0.16) | $ (0.30) | $ (0.28) |
| Net increase (decrease) in net asset value | $ (0.08) | $ (0.10) | $ 0.45 | $ (0.64) | $ (0.03) |
| Net asset value, end of period | $ 9.56 | $ 9.64 | $ 9.74 | $ 9.29 | $ 9.93 |
| Total return (b) | 2.86% | 0.39% | 6.64% | (3.60)% | 2.54% |
| Ratio of net expenses to average net assets | 0.38% | 0.36% | 0.37% | 0.36% | 0.37% |
| Ratio of net investment income (loss) to average net assets | 3.71% | 1.20% | 1.52% | 2.79% | 2.82% |
| Portfolio turnover rate | 34% | 52% | 51% | 100% | 61% |
| Net assets, end of period (in thousands) | $465,248 | $382,288 | $332,949 | $264,405 | $274,682 |
| (a) | The per-share data presented above is based on the average shares outstanding for the period presented. |
| (b) | Assumes initial investment at net asset value at the beginning of each period, reinvestment of all distributions and the complete redemption of the investment at net asset value at the end of each period. |
| Year
Ended 3/31/23 |
Year
Ended 3/31/22 |
Year
Ended 3/31/21 |
Year
Ended 3/31/20 |
Year
Ended 3/31/19 | |
| Class Y | |||||
| Net asset value, beginning of period | $ 9.63 | $ 9.73 | $ 9.27 | $ 9.92 | $ 9.96 |
| Increase (decrease) from investment operations: | |||||
| Net investment income (loss) (a) | $ 0.34 | $ 0.11 | $ 0.14 | $ 0.27 | $ 0.27 |
| Net realized and unrealized gain (loss) on investments | (0.09) | (0.08) | 0.48 | (0.63) | (0.04) |
| Net increase (decrease) from investment operations | $ 0.25 | $ 0.03 | $ 0.62 | $ (0.36) | $ 0.23 |
| Distributions to shareowners: | |||||
| Net investment income | $ (0.34) | $ (0.13) | $ (0.16) | $ (0.29) | $ (0.27) |
| Total distributions | $ (0.34) | $ (0.13) | $ (0.16) | $ (0.29) | $ (0.27) |
| Net increase (decrease) in net asset value | $ (0.09) | $ (0.10) | $ 0.46 | $ (0.65) | $ (0.04) |
| Net asset value, end of period | $ 9.54 | $ 9.63 | $ 9.73 | $ 9.27 | $ 9.92 |
| Total return (b) | 2.67% | 0.30% | 6.67% | (3.78)% | 2.37% |
| Ratio of net expenses to average net assets | 0.45% | 0.44% | 0.45% | 0.44% | 0.45% |
| Ratio of net investment income (loss) to average net assets | 3.53% | 1.12% | 1.45% | 2.69% | 2.74% |
| Portfolio turnover rate | 34% | 52% | 51% | 100% | 61% |
| Net assets, end of period (in thousands) | $2,659,258 | $2,725,842 | $2,335,355 | $2,990,790 | $3,669,866 |
| (a) | The per-share data presented above is based on the average shares outstanding for the period presented. |
| (b) | Assumes initial investment at net asset value at the beginning of each period, reinvestment of all distributions and the complete redemption of the investment at net asset value at the end of each period. |
| A. | Security Valuation |
| The net asset value of the Fund is computed once daily, on each day the New York Stock Exchange (“NYSE”) is open, as of the close of regular trading on the NYSE. | |
| Fixed-income securities are valued by using prices supplied by independent pricing services, which consider such factors as market prices, market events, quotations from one or more brokers, Treasury spreads, yields, maturities and ratings, or may use a pricing matrix or other fair value methods or techniques to provide an estimated value of the security or instrument. A pricing matrix is a means of valuing a debt security on the basis of current market prices for other debt securities, historical trading patterns in the market for fixed-income securities and/or other factors. Non-U.S. debt securities that are listed on an |
| exchange will be valued at the bid price obtained from an independent third party pricing service. When independent third party pricing services are unable to supply prices, or when prices or market quotations are considered to be unreliable, the value of that security may be determined using quotations from one or more broker-dealers. | |
| Loan interests are valued at the mean between the last available bid and asked prices from one or more brokers or dealers as obtained from Loan Pricing Corporation, an independent third party pricing service. If price information is not available from Loan Pricing Corporation, or if the price information is deemed to be unreliable, price information will be obtained from an alternative loan interest pricing service. If no reliable price quotes are available from either the primary or alternative pricing service, broker quotes will be solicited. | |
| Event-linked bonds are valued at the bid price obtained from an independent third party pricing service. Other insurance-linked securities (including reinsurance sidecars, collateralized reinsurance and industry loss warranties) may be valued at the bid price obtained from an independent pricing service, or through a third party using a pricing matrix, insurance industry valuation models, or other fair value methods or techniques to provide an estimated value of the instrument. | |
| Futures contracts are generally valued at the closing settlement price established by the exchange on which they are traded. | |
| The value of foreign securities is translated into U.S. dollars based on foreign currency exchange rate quotations supplied by a third party pricing source. Trading in non-U.S. equity securities is substantially completed each day at various times prior to the close of the NYSE. The values of such securities used in computing the net asset value of the Fund's shares are determined as of such times. The Adviser may use a fair value model developed by an independent pricing service to value non-U.S. equity securities. | |
| Repurchase agreements are valued at par. Cash may include overnight time deposits at approved financial institutions. | |
| Securities or loan interests for which independent pricing services or broker-dealers are unable to supply prices or for which market prices and/or quotations are not readily available or are considered to be unreliable are valued by a fair valuation team comprised of certain personnel of the Adviser. The Adviser is designated as the valuation designee for the Fund pursuant to Rule 2a-5 under the 1940 Act. The Adviser’s fair valuation team is responsible for monitoring developments that may impact fair valued securities. |
| Inputs used when applying fair value methods to value a security may include credit ratings, the financial condition of the company, current market conditions and comparable securities. The Adviser may use fair value methods if it is determined that a significant event has occurred after the close of the exchange or market on which the security trades and prior to the determination of the Fund's net asset value. Examples of a significant event might include political or economic news, corporate restructurings, natural disasters, terrorist activity or trading halts. Thus, the valuation of the Fund's securities may differ significantly from exchange prices, and such differences could be material. | |
| B. | Investment Income and Transactions |
| Dividend income is recorded on the ex-dividend date, except that certain dividends from foreign securities where the ex-dividend date may have passed are recorded as soon as the Fund becomes aware of the ex-dividend data in the exercise of reasonable diligence. | |
| Interest income, including interest on income-bearing cash accounts, is recorded on the accrual basis. Dividend and interest income are reported net of unrecoverable foreign taxes withheld at the applicable country rates and net of income accrued on defaulted securities. | |
| Interest and dividend income payable by delivery of additional shares is reclassified as PIK (payment-in-kind) income upon receipt and is included in interest and dividend income, respectively. | |
| Principal amounts of mortgage-backed securities are adjusted for monthly paydowns. Premiums and discounts related to certain mortgage-backed securities are amortized or accreted in proportion to the monthly paydowns. All discounts/premiums on purchase prices of debt securities are accreted/amortized for financial reporting purposes over the life of the respective securities, and such accretion/amortization is included in interest income. | |
| Security transactions are recorded as of trade date. Gains and losses on sales of investments are calculated on the identified cost method for both financial reporting and federal income tax purposes. | |
| C. | Federal Income Taxes |
| It is the Fund 's policy to comply with the requirements of the Internal Revenue Code applicable to regulated investment companies and to distribute all of its net taxable income and net realized capital gains, if any, to its shareowners. Therefore, no provision for federal income taxes is required. As of March 31, 2023, the Fund did not accrue any interest or |
| penalties with respect to uncertain tax positions, which, if applicable, would be recorded as an income tax expense on the Statement of Operations. Tax returns filed within the prior three years remain subject to examination by federal and state tax authorities. | |
| The amount and character of income and capital gain distributions to shareowners are determined in accordance with federal income tax rules, which may differ from U.S. GAAP. Distributions in excess of net investment income or net realized gains are temporary over distributions for financial statement purposes resulting from differences in the recognition or classification of income or distributions for financial statement and tax purposes. Capital accounts within the financial statements are adjusted for permanent book/tax differences to reflect tax character, but are not adjusted for temporary differences. | |
| At March 31, 2023, the Fund reclassified $404,450 to increase distributable earnings and $404,450 to decrease paid-in capital to reflect permanent book/tax differences. These adjustments have no impact on net assets or the results of operations. | |
| At March 31, 2023, the Fund was permitted to carry forward indefinitely $159,500,633 of short-term losses and $107,090,579 of long-term losses. | |
| The tax character of distributions paid during the years ended March 31, 2023 and March 31, 2022, was as follows: |
| 2023 | 2022 | |
| Distributions paid from: | ||
| Ordinary income | $157,383,538 | $62,233,841 |
| Total | $157,383,538 | $62,233,841 |
| 2023 | |
| Distributable earnings/(losses): | |
| Undistributed ordinary income | $ 5,018,355 |
| Capital loss carryforward | (266,591,212) |
| Other book/tax temporary differences | (1,703,995) |
| Net unrealized depreciation | (90,496,785) |
| Total | $(353,773,637) |
| D. | Fund Shares |
| The Fund records sales and repurchases of its shares as of trade date. The Distributor earned $0 in underwriting commissions on the sale of Class A shares during the year ended March 31, 2023. | |
| E. | Class Allocations |
| Income, common expenses and realized and unrealized gains and losses are calculated at the Fund level and allocated daily to each class of shares based on its respective percentage of adjusted net assets at the beginning of the day. | |
| Distribution fees are calculated based on the average daily net asset value attributable to Class A, Class C and Class C2 shares of the Fund, respectively (see Note 5). Class K and Class Y shares do not pay distribution fees. All expenses and fees paid to the Fund's transfer agent for its services are allocated among the classes of shares based on the number of accounts in each class and the ratable allocation of related out-of-pocket expenses (see Note 4). | |
| The Fund declares as daily dividends substantially all of its net investment income. All dividends are paid on a monthly basis. Short-term capital gain distributions, if any, may be declared with the daily dividends. Distributions to shareowners are recorded as of the ex-dividend date. Distributions paid by the Fund with respect to each class of shares are calculated in the same manner and at the same time, except that net investment income dividends to Class A, Class C, Class C2, Class K and Class Y shares can reflect different transfer agent and distribution expense rates. | |
| F. | Risks |
| The value of securities held by the Fund may go up or down, sometimes rapidly or unpredictably, due to general market conditions, such as real or perceived adverse economic, political or regulatory conditions, recessions, the spread of infectious illness or other public health issues, inflation, changes in interest rates, armed conflict including Russia's military invasion of Ukraine, sanctions against Russia, other nations or individuals or companies and possible countermeasures, lack of liquidity in the bond markets or adverse investor sentiment. In the past several years, financial markets have experienced increased volatility, depressed valuations, decreased liquidity and heightened uncertainty. These conditions may continue, recur, worsen or spread. Recently, inflation and interest rates have increased and may rise further. These circumstances could adversely affect the value and liquidity of the |
| Fund's investments, impair the Fund's ability to satisfy redemption requests, and negatively impact the Fund's performance. Raising the ceiling on U.S. government debt has become increasingly politicized. Any failure to increase the ceiling on U.S. government debt could lead to a default on U.S. government obligations, with unpredictable consequences for economies and markets. | |
| The global pandemic of the novel coronavirus respiratory disease designated COVID-19 has resulted in major disruption to economies and markets around the world, including the United States. Global financial markets have experienced extreme volatility and severe losses, and trading in many instruments has been disrupted. Liquidity for many instruments has been greatly reduced for periods of time. Some sectors of the economy and individual issuers have experienced particularly large losses. These circumstances may continue to affect adversely the value and liquidity of the Fund's investments. Following Russia’s invasion of Ukraine, Russian securities have lost all, or nearly all, their market value. Other securities or markets could be similarly affected by past or future political, geopolitical or other events or conditions. | |
| Governments and central banks, including the U.S. Federal Reserve, have taken extraordinary and unprecedented actions to support local and global economies and the financial markets. These actions have resulted in significant expansion of public debt, including in the U.S. The consequences of high public debt, including its future impact on the economy and securities markets, may not be known for some time. | |
| The U.S. and other countries are periodically involved in disputes over trade and other matters, which may result in tariffs, investment restrictions and adverse impacts on affected companies and securities. For example, the U.S. has imposed tariffs and other trade barriers on Chinese exports, has restricted sales of certain categories of goods to China, and has established barriers to investments in China. Trade disputes may adversely affect the economies of the U.S. and its trading partners, as well as companies directly or indirectly affected and financial markets generally. If the political climate between the U.S. and China does not improve or continues to deteriorate, if China were to attempt unification of Taiwan by force, or if other geopolitical conflicts develop or get worse, economies, markets and individual securities may be severely affected both regionally and globally, and the value of the Fund's assets may go down. | |
| At times, the Fund’s investments may represent industries or industry sectors that are interrelated or have common risks, making the Fund |
| more susceptible to any economic, political, or regulatory developments or other risks affecting those industries and sectors. | |
| The Fund’s investments in foreign markets and countries with limited developing markets may subject the Fund to a greater degree of risk than investments in a developed market. These risks include disruptive political or economic conditions, military conflicts and sanctions, terrorism, sustained economic downturns, financial instability, less liquid trading markets, extreme price volatility, currency risks, reduction of government or central bank support, inadequate accounting standards, tariffs, tax disputes or other tax burdens, nationalization or expropriation of assets, and the imposition of adverse governmental laws, arbitrary application of laws and regulations or lack of rule of law and investment and repatriation restrictions. Lack of information and less market regulation also may affect the value of these securities. Withholding and other non-U.S. taxes may decrease the Fund’s return. Non-U.S. issuers may be located in parts of the world that have historically been prone to natural disasters. Investing in depositary receipts is subject to many of the same risks as investing directly in non-U.S. issuers. Depositary receipts may involve higher expenses and may trade at a discount (or premium) to the underlying security. | |
| Russia launched a large-scale invasion of Ukraine on February 24, 2022. In response to the military action by Russia, various countries, including the U.S., the United Kingdom, and European Union issued broad-ranging economic sanctions against Russia and Belarus and certain companies and individuals. Since then, Russian securities have lost all, or nearly all, their market value, and many other issuers, securities and markets have been adversely affected. The United States and other countries may impose sanctions on other countries, companies and individuals in light of Russia’s military invasion. The extent and duration of the military action or future escalation of such hostilities, the extent and impact of existing and future sanctions, market disruptions and volatility, and the result of any diplomatic negotiations cannot be predicted. These and any related events could have a significant impact on the value and liquidity of certain Fund investments, on Fund performance and the value of an investment in the Fund, particularly with respect to securities and commodities, such as oil, natural gas and food commodities, as well as other sectors with exposure to Russian issuers or issuers in other countries affected by the invasion, and are likely to have collateral impacts on market sectors globally. | |
| The Fund may invest in mortgage-related and asset-backed securities. The value of mortgage-related and asset-backed securities will be influenced by factors affecting the assets underlying such securities. As |
| a result, during periods of declining asset value, difficult or frozen credit markets, swings in interest rates, or deteriorating economic conditions, mortgage-related and asset-backed securities may decline in value, face valuation difficulties, become more volatile and/or become illiquid. Mortgage-backed securities tend to be more sensitive to changes in interest rate than other types of debt securities. These securities are also subject to prepayment and extension risks. Some of these securities may receive little or no collateral protection from the underlying assets and are thus subject to the risk of default. The risk of such defaults is generally higher in the case of mortgage-backed investments offered by non-governmental issuers and those that include so-called "sub-prime" mortgages. The structure of some of these securities may be complex and there may be less available information than for other types of debt securities. Upon the occurrence of certain triggering events or defaults, the Fund may become the holder of underlying assets at a time when those assets may be difficult to sell or may be sold only at a loss. | |
| The Fund may invest in credit risk transfer securities. Credit risk transfer securities are unguaranteed and unsecured debt securities issued by government sponsored enterprises and therefore are not directly linked to or backed by the underlying mortgage loans. As a result, in the event that a government sponsored enterprise fails to pay principal or interest on its credit risk transfer securities or goes through a bankruptcy, insolvency or similar proceeding, holders of such credit risk transfer securities have no direct recourse to the underlying mortgage loans and will generally receive recovery on par with other unsecured note holders in such a scenario. The risks associated with an investment in credit risk transfer securities are different than the risks associated with an investment in mortgage-backed securities issued by Fannie Mae and Freddie Mac, or other government sponsored enterprise or issued by a private issuer, because some or all of the mortgage default or credit risk associated with the underlying mortgage loans is transferred to investors. As a result, investors in these securities could lose some or all of their investment in these securities if the underlying mortgage loans default. | |
| The Fund invests in below-investment-grade (high-yield) debt securities and preferred stocks. Some of these high-yield securities may be convertible into equity securities of the issuer. Debt securities rated below investment-grade are commonly referred to as “junk bonds” and are considered speculative with respect to the issuer's capacity to pay interest and repay principal. These securities involve greater risk of loss, are subject to greater price volatility, and may be less liquid and more |
| difficult to value, especially during periods of economic uncertainty or change, than higher rated debt securities. | |
| The market prices of the Fund's fixed income securities may fluctuate significantly when interest rates change. The value of your investment will generally go down when interest rates rise. A rise in rates tends to have a greater impact on the prices of longer term or duration securities. For example, if interest rates increase by 1%, the value of a Fund's portfolio with a portfolio duration of ten years would be expected to decrease by 10%, all other things being equal. In recent years interest rates and credit spreads in the U.S. have been at historic lows. The U.S. Federal Reserve has raised certain interest rates, and interest rates may continue to go up. A general rise in interest rates could adversely affect the price and liquidity of fixed income securities. The maturity of a security may be significantly longer than its effective duration. A security's maturity and other features may be more relevant than its effective duration in determining the security's sensitivity to other factors affecting the issuer or markets generally, such as changes in credit quality or in the yield premium that the market may establish for certain types of securities (sometimes called "credit spread"). In general, the longer its maturity the more a security may be susceptible to these factors. When the credit spread for a fixed income security goes up, or "widens," the value of the security will generally go down. | |
| If an issuer or guarantor of a security held by the Fund or a counterparty to a financial contract with the Fund defaults on its obligation to pay principal and/or interest, has its credit rating downgraded or is perceived to be less creditworthy, or the credit quality or value of any underlying assets declines, the value of your investment will typically decline. Changes in actual or perceived creditworthiness may occur quickly. The Fund could be delayed or hindered in its enforcement of rights against an issuer, guarantor or counterparty. | |
| The Fund’s investments, payment obligations and financing terms may be based on floating rates, such as LIBOR (London Interbank Offered Rate) or SOFR (Secured Overnight Financing Rate). ICE Benchmark Administration, the administrator of LIBOR, ceased publication of most LIBOR settings on a representative basis at the end of 2021 and is expected to cease publication of a majority of U.S. dollar LIBOR settings on a representative basis after June 30, 2023. In addition, global regulators have announced that, with limited exceptions, no new LIBOR-based contracts should be entered into after 2021. Actions by regulators have resulted in the establishment of alternative reference rates to LIBOR in most major currencies. Markets are developing in response to these new rates, but questions around liquidity in these rates and how |
| to appropriately adjust these rates to eliminate any economic value transfer at the time of transition remain a significant concern. The effect of any changes to - or discontinuation of - LIBOR on the Fund will vary depending on, among other things, existing fallback provisions in individual contracts and whether, how, and when industry participants develop and widely adopt new reference rates and fallbacks for both legacy and new products and instruments. The transition process may involve, among other things, increased volatility or illiquidity in markets for instruments that rely on LIBOR. The transition may also result in a reduction in the value of certain LIBOR-based investments held by the Fund or reduce the effectiveness of related transactions such as hedges. Any such effects of the transition away from LIBOR, as well as other unforeseen effects, could result in losses for the Fund. Because the usefulness of LIBOR as a benchmark may deteriorate during the transition period, these effects could occur at any time. | |
| With the increased use of technologies such as the Internet to conduct business, the Fund is susceptible to operational, information security and related risks. While the Fund’s Adviser has established business continuity plans in the event of, and risk management systems to prevent, limit or mitigate, such cyber-attacks, there are inherent limitations in such plans and systems, including the possibility that certain risks have not been identified. Furthermore, the Fund cannot control the cybersecurity plans and systems put in place by service providers to the Fund such as the Fund’s custodian and accounting agent, and the Fund’s transfer agent. In addition, many beneficial owners of Fund shares hold them through accounts at broker-dealers, retirement platforms and other financial market participants over which neither the Fund nor the Adviser exercises control. Each of these may in turn rely on service providers to them, which are also subject to the risk of cyber-attacks. Cybersecurity failures or breaches at the Adviser or the Fund’s service providers or intermediaries have the ability to cause disruptions and impact business operations, potentially resulting in financial losses, interference with the Fund’s ability to calculate its net asset value, impediments to trading, the inability of Fund shareowners to effect share purchases, redemptions or exchanges or receive distributions, loss of or unauthorized access to private shareowner information and violations of applicable privacy and other laws, regulatory fines, penalties, reputational damage, or additional compliance costs. Such costs and losses may not be covered under any insurance. In addition, maintaining vigilance against cyber-attacks may involve substantial costs over time, and system enhancements may themselves be subject to cyber-attacks. |
| The Fund’s prospectus contains unaudited information regarding the Fund’s principal risks. Please refer to that document when considering the Fund’s principal risks. | |
| G. | Restricted Securities |
| Restricted Securities are subject to legal or contractual restrictions on resale. Restricted securities generally are resold in transactions exempt from registration under the Securities Act of 1933. Private placement securities are generally considered to be restricted except for those securities traded between qualified institutional investors under the provisions of Rule 144A of the Securities Act of 1933. | |
| Disposal of restricted investments may involve negotiations and expenses, and prompt sale at an acceptable price may be difficult to achieve. Restricted investments held by the Fund at March 31, 2023 are listed in the Schedule of Investments. | |
| H. | Insurance-Linked Securities (“ILS”) |
| The Fund invests in ILS. The Fund could lose a portion or all of the principal it has invested in an ILS, and the right to additional interest or dividend payments with respect to the security, upon the occurrence of one or more trigger events, as defined within the terms of an insurance-linked security. Trigger events, generally, are hurricanes, earthquakes, or other natural events of a specific size or magnitude that occur in a designated geographic region during a specified time period, and/or that involve losses or other metrics that exceed a specific amount. There is no way to accurately predict whether a trigger event will occur, and accordingly, ILS carry significant risk. The Fund is entitled to receive principal, and interest and/or dividend payments so long as no trigger event occurs of the description and magnitude specified by the instrument. In addition to the specified trigger events, ILS may expose the Fund to other risks, including but not limited to issuer (credit) default, adverse regulatory or jurisdictional interpretations and adverse tax consequences. | |
| The Fund’s investments in ILS may include event-linked bonds. ILS also may include special purpose vehicles (“SPVs”) or similar instruments structured to comprise a portion of a reinsurer’s catastrophe-oriented business, known as quota share instruments (sometimes referred to as reinsurance sidecars), or to provide reinsurance relating to specific risks to insurance or reinsurance companies through a collateralized instrument, known as collateralized reinsurance. Structured reinsurance investments also may include industry loss warranties (“ILWs”). A traditional ILW takes the form of a bilateral reinsurance contract, but |
| there are also products that take the form of derivatives, collateralized structures, or exchange-traded instruments. | |
| Where the ILS are based on the performance of underlying reinsurance contracts, the Fund has limited transparency into the individual underlying contracts, and therefore must rely upon the risk assessment and sound underwriting practices of the issuer. Accordingly, it may be more difficult for the Adviser to fully evaluate the underlying risk profile of the Fund’s structured reinsurance investments, and therefore the Fund’s assets are placed at greater risk of loss than if the Adviser had more complete information. Structured reinsurance instruments generally will be considered illiquid securities by the Fund. These securities may be difficult to purchase, sell or unwind. Illiquid securities also may be difficult to value. If the Fund is forced to sell an illiquid asset, the Fund may be forced to sell at a loss. | |
| I. | Repurchase Agreements |
| Repurchase agreements are arrangements under which the Fund purchases securities from a broker-dealer or a bank, called the counterparty, upon the agreement of the counterparty to repurchase the securities from the Fund at a later date, and at a specific price, which is typically higher than the purchase price paid by the Fund. The securities purchased serve as the Fund's collateral for the obligation of the counterparty to repurchase the securities. The value of the collateral, including accrued interest, is required to be equal to or in excess of the repurchase price. The collateral for all repurchase agreements is held in safekeeping in the customer-only account of the Fund's custodian or a sub-custodian of the Fund. The Adviser is responsible for determining that the value of the collateral remains at least equal to the repurchase price. In the event of a default by the counterparty, the Fund is entitled to sell the securities, but the Fund may not be able to sell them for the price at which they were purchased, thus causing a loss to the Fund. Additionally, if the counterparty becomes insolvent, there is some risk that the Fund will not have a right to the securities, or the immediate right to sell the securities. | |
| Open repurchase agreements at March 31, 2023 are disclosed in the Schedule of Investments. | |
| J. | Futures Contracts |
| The Fund may enter into futures transactions in order to attempt to hedge against changes in interest rates, securities prices and currency exchange rates or to seek to increase total return. Futures contracts are types of derivatives. |
| All futures contracts entered into by the Fund are traded on a futures exchange. Upon entering into a futures contract, the Fund is required to deposit with a broker an amount of cash or securities equal to the minimum "initial margin" requirements of the associated futures exchange. The amount of cash deposited with the broker as collateral at March 31, 2023 is recorded as "Futures collateral" on the Statement of Assets and Liabilities. | |
| Subsequent payments for futures contracts ("variation margin") are paid or received by the Fund, depending on the daily fluctuation in the value of the contracts, and are recorded by the Fund as unrealized appreciation or depreciation. Cash received from or paid to the broker related to previous margin movement is held in a segregated account at the broker and is recorded as either "Due from broker for futures" or "Due to broker for futures" on the Statement of Assets and Liabilities. When the contract is closed, the Fund realizes a gain or loss equal to the difference between the opening and closing value of the contract as well as any fluctuation in foreign currency exchange rates where applicable. Futures contracts are subject to market risk, interest rate risk and currency exchange rate risk. Changes in value of the contracts may not directly correlate to the changes in value of the underlying securities. With futures, there is reduced counterparty credit risk to the Fund since futures are exchange-traded and the exchange's clearinghouse, as counterparty to all exchange-traded futures, guarantees the futures against default. | |
| The average notional value of futures contracts short position during the year ended March 31, 2023 was $283,233,413. Open futures contracts outstanding at March 31, 2023 are listed in the Schedule of Investments. |
| Shareowner Communications: | |
| Class A | $ 25,932 |
| Class C | 9,073 |
| Class C2 | 74 |
| Class K | 420 |
| Class Y | 77,549 |
| Total | $113,048 |
| Statement
of Assets and Liabilities |
Interest
Rate Risk |
Credit
Risk |
Foreign
Exchange Rate Risk |
Equity
Risk |
Commodity
Risk |
| Liabilities | |||||
| Net unrealized depreciation on futures contracts* | $2,519,317 | $ — | $ — | $ — | $ — |
| Total Value | $2,519,317 | $— | $— | $— | $— |
| * | Includes cumulative unrealized appreciation (depreciation) of futures contracts as reported in the Schedule of Investments. Only net variation margin is reported within the assets and/or liabilities on the Statement of Assets and Liabilities. |
| Statement of Operations | Interest
Rate Risk |
Credit
Risk |
Foreign
Exchange Rate Risk |
Equity
Risk |
Commodity
Risk |
| Net Realized Gain (Loss) on | |||||
| Futures contracts | $22,999,901 | $ — | $ — | $ — | $ — |
| Total Value | $22,999,901 | $— | $— | $— | $— |
| Change in Net Unrealized Appreciation (Depreciation) on | |||||
| Futures contracts | $ (8,518,166) | $ — | $ — | $ — | $ — |
| Total Value | $ (8,518,166) | $— | $— | $— | $— |
| Loan | Principal | Cost | Value | Unrealized
Appreciation (Depreciation) |
| athenahealth Group, Inc. | $81,522 | $81,522 | $76,060 | $(5,462) |

May 25, 2023
Amundi Asset Management US, Inc.
The Bank of New York Mellon Corporation
Ernst & Young LLP
Amundi Distributor US, Inc.
Morgan, Lewis & Bockius LLP
BNY Mellon Investment Servicing (US) Inc.
| Name,
Age and Position Held With the Fund |
Term
of Office and Length of Service |
Principal Occupation(s) During At Least The Past Five Years | Other
Directorships Held by Trustee During At Least The Past Five Years |
| Thomas
J. Perna (72) Chairman of the Board and Trustee |
Trustee
since 2011. Serves until a successor trustee is elected or earlier retirement or removal. |
Private investor (2004 – 2008 and 2013 – present); Chairman (2008 – 2013) and Chief Executive Officer (2008 – 2012), Quadriserv, Inc. (technology products for securities lending industry); and Senior Executive Vice President, The Bank of New York (financial and securities services) (1986 – 2004) | Director,
Broadridge Financial Solutions, Inc. (investor communications and securities processing provider for financial services industry) (2009 – present); Director, Quadriserv, Inc. (2005 – 2013); and Commissioner, New Jersey State Civil Service Commission (2011 – 2015) |
| John
E. Baumgardner, Jr. (72)* Trustee |
Trustee
since 2019. Serves until a successor trustee is elected or earlier retirement or removal. |
Of Counsel (2019 – present), Partner (1983-2018), Sullivan & Cromwell LLP (law firm). | Chairman,
The Lakeville Journal Company, LLC, (privately-held community newspaper group) (2015-present) |
| Diane
Durnin (66) Trustee |
Trustee
since 2019. Serves until a successor trustee is elected or earlier retirement or removal. |
Managing Director - Head of Product Strategy and Development, BNY Mellon Investment Management (investment management firm) (2012-2018); Vice Chairman – The Dreyfus Corporation (2005 – 2018): Executive Vice President Head of Product, BNY Mellon Investment Management (2007-2012); Executive Director- Product Strategy, Mellon Asset Management (2005-2007); Executive Vice President Head of Products, Marketing and Client Service, Dreyfus Corporation (investment management firm) (2000-2005); Senior Vice President Strategic Product and Business Development, Dreyfus Corporation (1994-2000) | None |
| Name,
Age and Position Held With the Fund |
Term
of Office and Length of Service |
Principal Occupation(s) During At Least The Past Five Years | Other
Directorships Held by Trustee During At Least The Past Five Years |
| Benjamin
M. Friedman (78) Trustee |
Trustee
since 2011. Serves until a successor trustee is elected or earlier retirement or removal. |
William Joseph Maier Professor of Political Economy, Harvard University (1972 – present) | Trustee,
Mellon Institutional Funds Investment Trust and Mellon Institutional Funds Master Portfolio (oversaw 17 portfolios in fund complex) (1989 - 2008) |
| Craig
C. MacKay (60) Trustee |
Trustee
since 2021. Serves until a successor trustee is elected or earlier retirement or removal. |
Partner, England & Company, LLC (advisory firm) (2012 – present); Group Head – Leveraged Finance Distribution, Oppenheimer & Company (investment bank) (2006 – 2012); Group Head – Private Finance & High Yield Capital Markets Origination, SunTrust Robinson Humphrey (investment bank) (2003 – 2006); and Founder and Chief Executive Officer, HNY Associates, LLC (investment bank) (1996 – 2003) | Director,
Equitable Holdings, Inc. (financial services holding company) (2022 – present); Board Member of Carver Bancorp, Inc. (holding company) and Carver Federal Savings Bank, NA (2017 – present); Advisory Council Member, MasterShares ETF (2016 – 2017); Advisory Council Member, The Deal (financial market information publisher) (2015 – 2016); Board Co-Chairman and Chief Executive Officer, Danis Transportation Company (privately-owned commercial carrier) (2000 – 2003); Board Member and Chief Financial Officer, Customer Access Resources (privately-owned teleservices company) (1998 – 2000); Board Member, Federation of Protestant Welfare Agencies (human services agency) (1993 – present); and Board Treasurer, Harlem Dowling Westside Center (foster care agency) (1999 – 2018) |
| Name,
Age and Position Held With the Fund |
Term
of Office and Length of Service |
Principal Occupation(s) During At Least The Past Five Years | Other
Directorships Held by Trustee During At Least The Past Five Years |
| Lorraine
H. Monchak (66) Trustee |
Trustee
since 2017. (Advisory Trustee from 2014 - 2017). Serves until a successor trustee is elected or earlier retirement or removal. |
Chief Investment Officer, 1199 SEIU Funds (healthcare workers union pension funds) (2001 – present); Vice President – International Investments Group, American International Group, Inc. (insurance company) (1993 – 2001); Vice President – Corporate Finance and Treasury Group, Citibank, N.A. (1980 – 1986 and 1990 – 1993); Vice President – Asset/Liability Management Group, Federal Farm Funding Corporation (government-sponsored issuer of debt securities) (1988 – 1990); Mortgage Strategies Group, Shearson Lehman Hutton, Inc. (investment bank) (1987 – 1988); Mortgage Strategies Group, Drexel Burnham Lambert, Ltd. (investment bank) (1986 – 1987) | None |
| Marguerite
A. Piret (74) Trustee |
Trustee
since 2011. Serves until a successor trustee is elected or earlier retirement or removal. |
Chief Financial Officer, American Ag Energy, Inc. (controlled environment and agriculture company) (2016 – present); President and Chief Executive Officer, Metric Financial Inc. (formerly known as Newbury Piret Company) (investment banking firm) (1981 – 2019) | Director
of New America High Income Fund, Inc. (closed-end investment company) (2004 – present); and Member, Board of Governors, Investment Company Institute (2000 – 2006) |
| Name,
Age and Position Held With the Fund |
Term
of Office and Length of Service |
Principal Occupation(s) During At Least The Past Five Years | Other
Directorships Held by Trustee During At Least The Past Five Years |
| Fred
J. Ricciardi (76) Trustee |
Trustee
since 2014. Serves until a successor trustee is elected or earlier retirement or removal. |
Private investor (2020 – present); Consultant (investment company services) (2012 – 2020); Executive Vice President, BNY Mellon (financial and investment company services) (1969 – 2012); Director, BNY International Financing Corp. (financial services) (2002 – 2012); Director, Mellon Overseas Investment Corp. (financial services) (2009 – 2012); Director, Financial Models (technology) (2005-2007); Director, BNY Hamilton Funds, Ireland (offshore investment companies) (2004-2007); Chairman/Director, AIB/BNY Securities Services, Ltd., Ireland (financial services) (1999-2006); Chairman, BNY Alternative Investment Services, Inc. (financial services) (2005-2007) | None |
| * Mr. Baumgardner is Of Counsel to Sullivan & Cromwell LLP, which acts as counsel to the Independent Trustees of each Pioneer Fund. | |||
| Name,
Age and Position Held With the Fund |
Term
of Office and Length of Service |
Principal Occupation(s) During At Least The Past Five Years | Other
Directorships Held by Trustee During At Least The Past Five Years |
| Lisa
M. Jones (60)** Trustee, President and Chief Executive Officer |
Trustee
since 2017. Serves until a successor trustee is elected or earlier retirement or removal |
Director, CEO and President of Amundi US, Inc. (investment management firm) (since September 2014); Director, CEO and President of Amundi Asset Management US, Inc. (since September 2014); Director, CEO and President of Amundi Distributor US, Inc. (since September 2014); Director, CEO and President of Amundi Asset Management US, Inc. (since September 2014); Chair, Amundi US, Inc., Amundi Distributor US, Inc. and Amundi Asset Management US, Inc. (September 2014 – 2018); Managing Director, Morgan Stanley Investment Management (investment management firm) (2010 – 2013); Director of Institutional Business, CEO of International, Eaton Vance Management (investment management firm) (2005 – 2010); Director of Amundi Holdings US, Inc. (since 2017) | Director
of Clearwater Analytics (provider of web-based investment accounting software for reporting and reconciliation services) (September 2022 – present) |
| Kenneth
J. Taubes (64)** Trustee |
Trustee
since 2014. Serves until a successor trustee is elected or earlier retirement or removal |
Director and Executive Vice President (since 2008) and Chief Investment Officer, U.S. (since 2010) of Amundi US, Inc. (investment management firm); Director and Executive Vice President and Chief Investment Officer, U.S. of Amundi US (since 2008); Executive Vice President and Chief Investment Officer, U.S. of Amundi Asset Management US, Inc. (since 2009); Portfolio Manager of Amundi US (since 1999); Director of Amundi Holdings US, Inc. (since 2017) | None |
| ** Ms. Jones and Mr. Taubes are Interested Trustees because they are officers or directors of the Fund’s investment adviser and certain of its affiliates. | |||
| Name,
Age and Position Held With the Fund |
Term
of Office and Length of Service |
Principal Occupation(s) During At Least The Past Five Years | Other
Directorships Held by Trustee During At Least The Past Five Years |
| Christopher
J. Kelley (58) Secretary and Chief Legal Officer |
Since
2011. Serves at the discretion of the Board |
Vice President and Associate General Counsel of Amundi US since January 2008; Secretary and Chief Legal Officer of all of the Pioneer Funds since June 2010; Assistant Secretary of all of the Pioneer Funds from September 2003 to May 2010; Vice President and Senior Counsel of Amundi US from July 2002 to December 2007 | None |
| Thomas
Reyes (60) Assistant Secretary |
Since
2011. Serves at the discretion of the Board |
Assistant General Counsel of Amundi US since May 2013 and Assistant Secretary of all the Pioneer Funds since June 2010; Counsel of Amundi US from June 2007 to May 2013 | None |
| Heather
L. Melito-Dezan (46) Assistant Secretary |
Since
2022. Serves at the discretion of the Board |
Director – Trustee and Board Relationships of Amundi US since September 2019; Private practice from 2017 – 2019. | None |
| Anthony
J. Koenig, Jr. (59) Treasurer and Chief Financial and Accounting Officer |
Since
2021. Serves at the discretion of the Board |
Managing Director, Chief Operations Officer and Fund Treasurer of Amundi US since May 2021; Treasurer of all of the Pioneer Funds since May 2021; Assistant Treasurer of all of the Pioneer Funds from January 2021 to May 2021; and Chief of Staff, US Investment Management of Amundi US from May 2008 to January 2021 | None |
| Luis
I. Presutti (57) Assistant Treasurer |
Since
2011. Serves at the discretion of the Board |
Director – Fund Treasury of Amundi US since 1999; and Assistant Treasurer of all of the Pioneer Funds since 1999 | None |
| Gary
Sullivan (64) Assistant Treasurer |
Since
2011. Serves at the discretion of the Board |
Senior Manager – Fund Treasury of Amundi US since 2012; and Assistant Treasurer of all of the Pioneer Funds since 2002 | None |
| Antonio
Furtado (40) Assistant Treasurer |
Since
2020. Serves at the discretion of the Board |
Fund Oversight Manager – Fund Treasury of Amundi US since 2020; Assistant Treasurer of all of the Pioneer Funds since 2020; and Senior Fund Treasury Analyst from 2012 - 2020 | None |
| Name,
Age and Position Held With the Fund |
Term
of Office and Length of Service |
Principal Occupation(s) During At Least The Past Five Years | Other
Directorships Held by Trustee During At Least The Past Five Years |
| Michael
Melnick (52) Assistant Treasurer |
Since
2021. Serves at the discretion of the Board |
Vice President - Deputy Fund Treasurer of Amundi US since May 2021; Assistant Treasurer of all of the Pioneer Funds since July 2021; Director of Regulatory Reporting of Amundi US from 2001 – 2021; and Director of Tax of Amundi US from 2000 - 2001 | None |
| John
Malone (52) Chief Compliance Officer |
Since
2018. Serves at the discretion of the Board |
Managing Director, Chief Compliance Officer of Amundi US Asset Management; Amundi Asset Management US, Inc.; and the Pioneer Funds since September 2018; Chief Compliance Officer of Amundi Distributor US, Inc. since January 2014. | None |
| Brandon
Austin (51) Anti-Money Laundering Officer |
Since
2022. Serves at the discretion of the Board |
Director, Financial Security – Amundi Asset Management; Anti-Money Laundering Officer of all the Pioneer Funds since March 2022: Director of Financial Security of Amundi US since July 2021; Vice President, Head of BSA, AML and OFAC, Deputy Compliance Manager, Crédit Agricole Indosuez Wealth Management (investment management firm) (2013 – 2021) | None |
new accounts, prospectuses, applications
and service forms
account information and transactions
| Retirement plans information | 1-800-622-0176 |
P.O. Box 534427
Pittsburgh, PA 15253-4427
| Our toll-free fax | 1-800-225-4240 |
| Our internet e-mail address |
[email protected] (for general questions about Amundi only) |

60 State Street
Boston, MA 02109
60 State Street, Boston, MA 02109
Underwriter of Pioneer Mutual Funds, Member SIPC
© 2023 Amundi Asset Management US, Inc. 25671-11-0523
| A: PIGFX | C: FUNCX | K: PFGKX | R: PFGRX | Y: FUNYX |


Head of the Americas, President and CEO of US
Amundi Asset Management US, Inc.
May 2023
| Q | How did the Fund perform during the 12-month period ended March 31, 2023? |
| A | Pioneer Fundamental Growth Fund’s Class A shares returned -6.44% at net asset value during the 12-month period ended March 31, 2023, while the Fund’s benchmark, the Russell 1000 Growth Index (the Russell Index), returned -10.90%. During the same period, the average return of the 1,250 mutual funds in Morningstar’s Large Growth Funds category was -12.67%. |
| Q | How would you describe the investment environment for domestic equities during the 12-month period ended March 31, 2023? |
| A | The 12-month period featured substantial declines in US equities as investors faced a deteriorating macroeconomic environment as well as persistent geopolitical challenges. Facing the highest levels of inflation in more than 40 years, the Federal Reserve (Fed) aggressively raised interest rates throughout the period, while specifically acknowledging the risk of pushing the US economy into recession. Consumer confidence weakened considerably in light of steeply rising prices for consumer goods, thus heightening investors’ concerns about the prospects for a broader macroeconomic slowdown or contraction. As the period progressed, however, market participants began to anticipate a potential peak in interest rates as inflationary pressures began to ease, at least somewhat. |
| Stock prices in general were volatile during the period. Sharp declines during the second quarter of 2022 (April through June) led to the worst “first half-year” performance for the broad- |
| market Standard & Poor’s 500 Index (S&P 500) since 1970. Domestic stocks then rebounded in July and early August of 2022, responding favorably to solid corporate earnings reports as well as investors’ hopes that the Fed’s actions with regard to monetary policy could quickly bring inflation under control. By September, however, continued and persistent price pressures led to another steep pullback by equities, which left major market indices firmly in “bear” territory, with most falling by 20% from their previous highs. The rollercoaster ride then continued as stocks rebounded again during the fourth quarter of 2022 and first quarter of 2023, amid renewed hopes that the Fed would end its rate-hiking cycle, particularly in the wake of a banking crisis during March 2023, which saw three US banks fail (Signature Bank, Silvergate, and Silicon Valley—or SVB Financial). The failures spurred the Fed, the US Treasury, and the Federal Deposit Insurance Corporation (FDIC) to take actions to help bolster the banking system and caused investors to speculate that the Fed might have to pause, if not completely end, its interest-rate increases. | |
| Within the large-cap equity universe, value stocks outperformed growth stocks over the 12-month period, and particularly during the second quarter of 2022. At that time, successive interest-rate increases from the Fed in response to extremely high inflation figures forced investors to consider that growth-oriented companies with more distant future cash flow prospects might not be able to keep outperforming their value-oriented counterparts in an environment where higher “risk-free” returns were available. Growth stocks then helped lead a brief market rally early in the third quarter of 2022, but a September pullback eroded most of their relative gains, and value stocks continued to outperform in the fourth quarter. A market pivot toward growth stocks in the first quarter of 2023 helped reduce the underperformance relative to value stocks for the 12-month period as a whole. That said, for the full 12-month period, growth stocks, as measured by the Russell 1000 Growth Index (the Russell Index), returned -10.90%, while value stocks, as |
| measured by the Russell 1000 Value Index, were down by 5.91%, representing a roughly five percent performance advantage for value versus growth. | |
| Q | What factors contributed to and detracted from the Fund's benchmark-relative performance during the 12-month period ended March 31, 2023? |
| A | During the 12-month period, we maintained our traditional discipline of focusing the Fund’s investments on shares of what we believe are higher-quality corporations with stable businesses and steady earnings. Because of our focus on mitigating portfolio risk, the Fund’s performance has often lagged that of the benchmark when markets have preferred higher-growth names over more valuation-oriented names, as has been the case, on occasion, in recent years. However, given the market's numerous pullbacks during the 12-month period, the Fund outperformed its benchmark, particularly during the second quarter of 2022 and during the September 2022 market decline. |
| Exposures to reasonably valued growth stocks, which experienced less severe declines, overall, than high-growth, high-valuation growth stocks, drove the Fund's relative outperformance for the period. Over the course of the 12-month period, the returns of stocks that are components of the Russell Index were highly correlated with their price-to-earnings (P/E) ratios, and so the Fund's underweight positions in stocks with high P/E ratios contributed positively to relative performance. (P/E Ratio represents the price of a stock divided by its earnings per share.) | |
| From a sector perspective, stock selection results in the consumer discretionary sector contributed the most to the Fund’s positive benchmark-relative performance during the period. Stock selection results in the energy and information technology sectors also aided relative returns. | |
| Conversely, adverse stock selection results in the financials sector were a key detractor from the Fund’s relative performance. |
| Underweight portfolio exposure to the information technology sector also detracted from relative returns over the 12-month period. | |
| Q | Which individual stocks led positive contributions to the Fund’s benchmark-relative performance during the 12-month period ended March 31, 2023? |
| A | The portfolio position that made the largest positive contribution to the Fund's benchmark-relative performance for the 12-month period was Schlumberger. The oilfield services company performed particularly well during the fourth quarter of 2022, as the company reported better-than-expected earnings, driven by an uptick in international well-construction activity. With rising demand for its services after years of underinvestment in oil and gas, and given the global need for energy security in the wake of the Russia/Ukraine conflict, we believe Schlumberger is well-positioned to potentially benefit from what we anticipate could be a multi-year energy capital-expenditure cycle. |
| Property-and-casualty insurance company Progressive was another key positive contributor to the Fund’s relative returns during the period. The insurer has benefited from a strong pricing environment, as auto policies have renewed at higher rates to compensate for rising claims costs over the past year. We anticipate that, as used car prices continue to moderate, costs per claim are likely to decline. In addition, the need for insurance in both good times and bad makes the stock defensive in nature, which we find suitable for the current investment environment. | |
| Lastly, the Fund's lack of exposure to electric vehicle (EV) manufacturer and benchmark component Tesla made a large positive contribution to relative performance for the period, particularly amid the stock's price drop of more than 50% during the fourth quarter of 2022. We remain concerned about the valuation of Tesla’s stock, especially amid signs of increased competition for the company in the EV market. |
| Q | Which individual stocks detracted most significantly from the Fund's benchmark-relative performance during the 12-month period ended March 31, 2023? |
| A | The portfolio position that detracted the most from the Fund's benchmark-relative returns for the 12-month period was Charles Schwab. The brokerage firm’s stock price declined late in the period as investors reacted negatively to the aforementioned bank failures in March 2023, and as the subsequent FDIC takeover of SVB Financial led to increased scrutiny of companies – like Schwab – offering banking services. Schwab then experienced an acceleration of deposit outflows as customers moved money into higher-yielding money market funds. Schwab's deposit base consists mostly of FDIC-insured retail and commercial deposits, in contrast to SVB's reliance on deposits from venture-capital-funded start-ups. However, even though deposit outflows from Schwab have moderated, we anticipate that the banking sector could face increased capital requirements that could potentially weigh on profitability as regulators seek to reduce the likelihood of similar bank failures in the future. For this reason, the Fund's management team has put Schwab's stock under intensive review, though we continued to hold the shares in the portfolio as of period-end. |
| Exposure to PayPal also constrained the Fund’s relative performance. As the period progressed, investors grew concerned that a weakening economy could lead to a decrease in e-commerce spending and increased potential for PayPal to experience market-share losses. Despite the possibility that consumer spending might decline in the short run, we nevertheless believe that the payment-network provider could continue benefiting from the shift to a cashless society, given PayPal’s strong competitive position. In addition, PayPal has renewed its focus on profitability, which we believe could help mitigate any deceleration in growth. | |
| Lastly, the Fund’s position in Alphabet, the parent company of Google, was a notable detractor from benchmark-relative results. The stock price fell sharply amid rising concerns about the effects potentially weaker macroeconomic conditions could have on advertising spending. We still value the company's leadership position in online searches, its highly popular Android |
| smartphone operating system, and the growth opportunities for its YouTube video-sharing website. We view Alphabet’s stock as unusually attractive from a valuation standpoint, given the company’s consistently high returns on capital, steady secular growth, and exposure to the high-demand cloud-computing services business. | |
| Q | Did the Fund have any exposure to derivative securities during the 12-month period ended March 31, 2023? |
| A | No, the Fund did not hold any derivatives during the period. |
| Q | Which positions did you add to the Fund's portfolio during the 12-month period ended March 31, 2023? |
| A | During the 12-month period, we initiated Fund positions in Visa, Advanced Micro Devices (AMD), Intuitive Surgical, Walt Disney, and Intuit. |
| We added shares of Visa, the electronic payments processor, to the portfolio early in the period. Visa has one of the leading global card networks, features high incremental margins, and, similar to portfolio holding MasterCard, the company has a wide competitive “moat” around its business. We believe Visa could benefit from the secular shift to a cashless society, and from near-term acceleration in cross-border travel on a global scale. (A moat, or wide moat, is a type of sustainable competitive advantage possessed by a business that makes it difficult for rivals to wear down its market share.) | |
| We also took advantage of heightened volatility to add semiconductor company AMD to the portfolio during the period. AMD, a designer of CPUs and GPUs, has focused on consumer, enterprise, and data-center applications. As the stock’s valuation grew more attractive over the period, we felt AMD had become a good fit for inclusion in the portfolio, according to our disciplined investment process. We also view a recent acquisition by AMD favorably, as we believe it could add greater capacity and stability to the company’s business and heighten its exposure to the fast-growing data-center market. | |
| We also initiated a position in robotic surgery pioneer Intuitive Surgical. The company has generated high returns on capital, |
| and, given what has been an industry-leading position, we believe Intuitive could stand to benefit from secular growth in robotic surgery, making it an excellent fit with our investment approach. | |
| Late in the 12-month period, we added shares of business software specialist Intuit and entertainment giant Walt Disney to the portfolio. We view Intuit as a company with a solid competitive moat derived from significant market share, high switching costs, strength in its consumer segment, and in its products for self-employed individuals and small business owners. Intuit has benefited from several secular trends and has a history of developing highly attractive, easy-to-use solutions that have generated strong returns on capital. Finally, the stock's valuation, in our view, did not reflect the long-term potential for Intuit to expand its software ecosystem for owners of small businesses, and its year-round personal finance offerings. | |
| Walt Disney is a previous Fund holding that we added back to the portfolio in the first quarter of 2023. After meeting with CEO Bob Iger, we have concluded that Disney's new focus on profitability may result in a material improvement in earnings as the company seeks to reduce costs and streamlines capital allocations. Moreover, we felt the stock's valuation did not reflect the sustainable competitive advantages the company has in its theme parks, studios, and other assets, nor did it reflect the potential secular growth prospects Disney has with regard to content creation and distribution. We believe that is especially true of Disney's streaming business, which, in our view, could become profitable under Iger's leadership. | |
| Q | Which positions did you eliminate from the Fund’s portfolio during the 12-month period ended March 31, 2023? |
| A | During the period, we exited the Fund’s positions in Stanley Black & Decker, Marsh and McLennan, and Pfizer. |
| With regard to toolmaker Stanley Black & Decker, the company had been facing difficult circumstances, including supply-chain issues and decreased demand due to the cooling housing market. Rising mortgage rates exacerbated those problems, and we concluded that Stanley Black & Decker’s challenges could persist, and therefore decided to exit the portfolio’s position. |
| We also sold the Fund’s shares of insurance broker Marsh and McLennan during the period. The stock price had held up reasonably well; however, we believed the valuation was high, especially given the risk that the consulting portion of Marsh’s business could come under pressure in the event of an economic slowdown or contraction. | |
| Lastly, late in the period, we exited the Fund's position in pharmaceutical firm Pfizer. We had been reducing the size of the position throughout 2022 as our pandemic-centered investment thesis played out and the stock's valuation became less appealing. Demand for several of Pfizer's COVID-19-related products, particularly Paxlovid, has waned. That factor, combined with Pfizer's announced intention to make a $43 billion acquisition, which we believe is an elevated valuation, led us to conclude that the risk/reward profile for the stock was no longer favorable. | |
| Q | What is your outlook heading into the next fiscal year for the Fund, and how is this outlook reflected in the Fund’s positioning? |
| A | As we look ahead, most economic indicators have continued to point to much slower growth over the next several quarters. The interest-rate increases by the Fed over the past year are just now starting to affect the real economy, and while we believe inflation may have peaked and could decline from here, profit-margin contraction could still dampen corporate earnings. |
| We also believe the recent dislocations in the regional banking sector could cause further tightening in financial conditions over the coming months as banks tighten their lending standards to preserve liquidity. That, in turn, could lead the Fed to scale back further rate increases, although we think hopes for rate cuts later in the year may prove to be premature. If the Fed does cut rates, we think it would be the result of greater-than-expected economic weakness, which would likely be detrimental to corporate earnings. The stock market has tended to react negatively in such an environment. | |
| Despite having seen growth stocks start 2023 on a strong, if volatile, note, we remain cautious that the rebound may be little more than a bear-market rally driven by the more speculative parts of the market, and by the recent resurgence in share prices |
| of mega-cap technology stocks. In 2022, a contraction in earnings multiples as interest rates increased drove the decline in equities. In our view, the next phase of the market, whether up or down, will be earnings-driven, and we believe earnings estimates for the next 12 months have remained too high. | |
| A mild recession, in our view, is more likely than a “soft landing,” in which economic growth slows yet remains positive as inflation is brought under control. In either scenario, we believe corporate earnings estimates will likely decline as companies take a more cautious approach to 2023, given the economic uncertainty. By mid-2023, if the market adequately discounts a potential recession, we anticipate becoming more constructive on equities. While expectations are for market volatility to remain high in 2023, we think the market may look forward to an earnings recovery as the year progresses, and end the year higher than where it started. | |
| Against that backdrop, we have remained highly selective with respect to the stocks that we add to the portfolio, and have continued to avoid investing in what we view as speculative and unprofitable companies that could easily remain out of favor for a protracted period. | |
| From a positioning perspective, as of period-end, the Fund has benchmark-relative overweight positions in what we view as high-quality financials and health care stocks. We have maintained an underweight portfolio allocation to the information technology sector, but we have reduced the extent of that underweight recently, as valuations within the sector, in our view, have become more attractive. | |
| Regardless of the macroeconomic backdrop, we remain committed to investing the portfolio in shares of companies that are highly profitable and feature both strong balance sheets and sustainable business models. We seek to hold shares of companies that we believe are capable of surviving a prolonged and deep recession, and emerging with the financial firepower to invest and thrive during the subsequent recovery. |
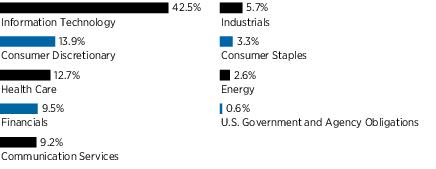
| (As a percentage of total investments)* | ||
| 1. | Microsoft Corp. | 8.04% |
| 2. | Alphabet, Inc., Class C | 7.68 |
| 3. | Mastercard, Inc., Class A | 4.98 |
| 4. | Apple, Inc. | 4.75 |
| 5. | Amazon.com, Inc. | 4.64 |
| 6. | Thermo Fisher Scientific, Inc. | 3.67 |
| 7. | Eli Lilly & Co. | 3.49 |
| 8. | Amphenol Corp., Class A | 3.34 |
| 9. | QUALCOMM, Inc. | 3.34 |
| 10. | PepsiCo., Inc. | 3.31 |
| * | Excludes short-term investments and all derivative contracts except for options purchased. The Fund is actively managed, and current holdings may be different. The holdings listed should not be considered recommendations to buy or sell any securities. |
| Class | 3/31/23 | 3/31/22 |
| A | $26.24 | $29.25 |
| C | $21.88 | $24.76 |
| K | $26.46 | $29.39 |
| R | $25.13 | $28.17 |
| Y | $26.76 | $29.73 |
| Class | Net
Investment Income |
Short-Term
Capital Gains |
Long-Term
Capital Gains |
| A | $— | $0.0586 | $1.0044 |
| C | $— | $0.0586 | $1.0044 |
| K | $— | $0.0586 | $1.0044 |
| R | $— | $0.0586 | $1.0044 |
| Y | $— | $0.0586 | $1.0044 |
| Performance Update | 3/31/23 | Class A Shares |
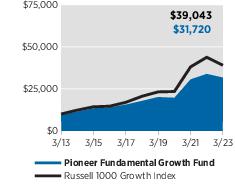
| Performance Update | 3/31/23 | Class C Shares |

| Performance Update | 3/31/23 | Class K Shares |
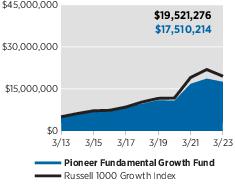
| Performance Update | 3/31/23 | Class R Shares |
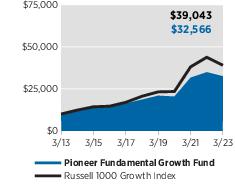
| Performance Update | 3/31/23 | Class Y Shares |
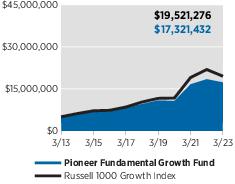
| (1) | ongoing costs, including management fees, distribution and/or service (12b-1) fees, and other Fund expenses; and |
| (2) | transaction costs, including sales charges (loads) on purchase payments. |
| (1) | Divide your account value by
$1,000 Example: an $8,600 account value ÷ $1,000 = 8.6 |
| (2) | Multiply the result in (1) above by the corresponding share class’s number in the third row under the heading entitled “Expenses Paid During Period” to estimate the expenses you paid on your account during this period. |
| Share Class | A | C | K | R | Y |
| Beginning
Account Value on 10/1/22 |
$1,000.00 | $1,000.00 | $1,000.00 | $1,000.00 | $1,000.00 |
| Ending
Account Value (after expenses) on 3/31/23 |
$1,169.50 | $1,165.90 | $1,171.40 | $1,167.40 | $1,171.20 |
| Expenses
Paid During Period* |
$5.52 | $9.40 | $3.63 | $7.57 | $4.11 |
| * | Expenses are equal to the Fund’s annualized expense ratio of 1.02%, 1.74%, 0.67%, 1.40%, and 0.76% for Class A, Class C, Class K, Class R, and Class Y shares, respectively, multiplied by the average account value over the period, multiplied by 182/365 (to reflect the one-half year period). |
| Share Class | A | C | K | R | Y |
| Beginning
Account Value on 10/1/22 |
$1,000.00 | $1,000.00 | $1,000.00 | $1,000.00 | $1,000.00 |
| Ending
Account Value (after expenses) on 3/31/23 |
$1,019.85 | $1,016.26 | $1,021.59 | $1,017.95 | $1,021.14 |
| Expenses
Paid During Period* |
$5.14 | $8.75 | $3.38 | $7.04 | $3.83 |
| * | Expenses are equal to the Fund’s annualized expense ratio of 1.02%, 1.74%, 0.67%, 1.40%, and 0.76% for Class A, Class C, Class K, Class R, and Class Y shares, respectively, multiplied by the average account value over the period, multiplied by 182/365 (to reflect the one-half year period). |
| Shares | Value | |||||
| UNAFFILIATED ISSUERS — 99.5% | ||||||
| Common Stocks — 97.8% of Net Assets | ||||||
| Beverages — 3.2% | ||||||
| 975,984 | PepsiCo., Inc. | $ 177,921,883 | ||||
| Total Beverages | $177,921,883 | |||||
| Broadline Retail — 4.6% | ||||||
| 2,415,789(a) | Amazon.com, Inc. | $ 249,526,846 | ||||
| Total Broadline Retail | $249,526,846 | |||||
| Capital Markets — 6.2% | ||||||
| 2,674,856 | Charles Schwab Corp. | $ 140,108,957 | ||||
| 178,422 | FactSet Research Systems, Inc. | 74,061,188 | ||||
| 1,218,683 | Intercontinental Exchange, Inc. | 127,096,450 | ||||
| Total Capital Markets | $341,266,595 | |||||
| Commercial Services & Supplies — 0.9% | ||||||
| 683,568(a) | Copart, Inc. | $ 51,411,149 | ||||
| Total Commercial Services & Supplies | $51,411,149 | |||||
| Communications Equipment — 2.4% | ||||||
| 458,942 | Motorola Solutions, Inc. | $ 131,317,074 | ||||
| Total Communications Equipment | $131,317,074 | |||||
| Electrical Equipment — 1.9% | ||||||
| 351,700 | Eaton Corp. Plc | $ 60,260,278 | ||||
| 143,376 | Rockwell Automation, Inc. | 42,073,687 | ||||
| Total Electrical Equipment | $102,333,965 | |||||
| Electronic
Equipment, Instruments & Components — 5.8% |
||||||
| 2,198,341 | Amphenol Corp., Class A | $ 179,648,427 | ||||
| 708,463 | CDW Corp. | 138,072,354 | ||||
| Total Electronic Equipment, Instruments & Components | $317,720,781 | |||||
| Energy Equipment & Services — 2.5% | ||||||
| 2,797,139 | Schlumberger, NV | $ 137,339,525 | ||||
| Total Energy Equipment & Services | $137,339,525 | |||||
| Entertainment — 1.5% | ||||||
| 435,211 | Electronic Arts, Inc. | $ 52,421,165 | ||||
| 278,474(a) | Walt Disney Co. | 27,883,602 | ||||
| Total Entertainment | $80,304,767 | |||||
| Financial Services — 8.7% | ||||||
| 737,626 | Mastercard, Inc., Class A | $ 268,060,665 | ||||
| Shares | Value | |||||
| Financial Services — (continued) | ||||||
| 563,116(a) | PayPal Holdings, Inc. | $ 42,763,029 | ||||
| 728,974 | Visa, Inc., Class A | 164,354,478 | ||||
| Total Financial Services | $475,178,172 | |||||
| Health Care Equipment & Supplies — 3.1% | ||||||
| 1,248,292(a) | Edwards Lifesciences Corp. | $ 103,271,197 | ||||
| 269,710(a) | Intuitive Surgical, Inc. | 68,902,814 | ||||
| Total Health Care Equipment & Supplies | $172,174,011 | |||||
| Hotels, Restaurants & Leisure — 2.7% | ||||||
| 38,809(a) | Booking Holdings, Inc. | $ 102,937,380 | ||||
| 311,760 | Hilton Worldwide Holdings, Inc. | 43,917,631 | ||||
| Total Hotels, Restaurants & Leisure | $146,855,011 | |||||
| Insurance — 3.1% | ||||||
| 1,188,475 | Progressive Corp. | $ 170,023,233 | ||||
| Total Insurance | $170,023,233 | |||||
| Interactive Media & Services — 7.6% | ||||||
| 3,974,811(a) | Alphabet, Inc., Class C | $ 413,380,344 | ||||
| Total Interactive Media & Services | $413,380,344 | |||||
| Life Sciences Tools & Services — 6.0% | ||||||
| 508,931 | Danaher Corp. | $ 128,270,969 | ||||
| 342,572 | Thermo Fisher Scientific, Inc. | 197,448,224 | ||||
| Total Life Sciences Tools & Services | $325,719,193 | |||||
| Machinery — 1.2% | ||||||
| 276,324 | Illinois Tool Works, Inc. | $ 67,271,078 | ||||
| Total Machinery | $67,271,078 | |||||
| Pharmaceuticals — 3.4% | ||||||
| 546,740 | Eli Lilly & Co. | $ 187,761,451 | ||||
| Total Pharmaceuticals | $187,761,451 | |||||
| Professional Services — 1.5% | ||||||
| 441,697 | Verisk Analytics, Inc. | $ 84,743,986 | ||||
| Total Professional Services | $84,743,986 | |||||
| Semiconductors
& Semiconductor Equipment — 7.0% |
||||||
| 1,006,836(a) | Advanced Micro Devices, Inc. | $ 98,679,996 | ||||
| 373,867 | NVIDIA Corp. | 103,849,037 | ||||
| 1,406,832 | QUALCOMM, Inc. | 179,483,627 | ||||
| Total Semiconductors & Semiconductor Equipment | $382,012,660 | |||||
| Software — 13.3% | ||||||
| 383,625(a) | Adobe, Inc. | $ 147,837,566 | ||||
| 76,668 | Intuit, Inc. | 34,180,894 | ||||
| Shares | Value | |||||
| Software — (continued) | ||||||
| 1,500,283 | Microsoft Corp. | $ 432,531,589 | ||||
| 560,743(a) | Salesforce, Inc. | 112,025,237 | ||||
| Total Software | $726,575,286 | |||||
| Specialty Retail — 6.5% | ||||||
| 147,411(a) | O'Reilly Automotive, Inc. | $ 125,148,991 | ||||
| 1,074,422 | Ross Stores, Inc. | 114,028,407 | ||||
| 1,465,818 | TJX Cos., Inc. | 114,861,498 | ||||
| Total Specialty Retail | $354,038,896 | |||||
| Technology
Hardware, Storage & Peripherals — 4.7% |
||||||
| 1,548,827 | Apple, Inc. | $ 255,401,572 | ||||
| Total Technology Hardware, Storage & Peripherals | $255,401,572 | |||||
| Total
Common Stocks (Cost $2,715,964,457) |
$5,350,277,478 | |||||
| Principal
Amount USD ($) |
||||||
| U.S.
Government and Agency Obligations — 0.6% of Net Assets |
||||||
| 30,000,000(b) | U.S. Treasury Bills, 4/4/23 | $ 29,996,171 | ||||
| Total
U.S. Government and Agency Obligations (Cost $29,988,537) |
$29,996,171 | |||||
| SHORT TERM
INVESTMENTS — 1.1% of Net Assets |
||||||
| Repurchase Agreements — 0.7% | ||||||
| 36,400,000 | Bank of America, 4.81%, dated 3/31/23, to be purchased on 4/3/23 for $36,414,590, collateralized by $37,128,047 U.S. Treasury Note, 1.25%-2.0%, 6/30/24-8/31/24 | $ 36,400,000 | ||||
| $ 36,400,000 | ||||||
| Shares | Value | |||||
| Open-End Fund — 0.4% | ||||||
| 23,052,599(c) | Dreyfus
Government Cash Management, Institutional Shares, 4.71% |
$ 23,052,599 | ||||
| $ 23,052,599 | ||||||
| TOTAL
SHORT TERM INVESTMENTS (Cost $59,452,599) |
$59,452,599 | |||||
| TOTAL
INVESTMENTS IN UNAFFILIATED ISSUERS — 99.5% (Cost $2,805,405,593) |
$5,439,726,248 | |||||
| OTHER ASSETS AND LIABILITIES — 0.5% | $ 28,844,955 | |||||
| net assets — 100.0% | $5,468,571,203 | |||||
| (a) | Non-income producing security. |
| (b) | Security issued with a zero coupon. Income is recognized through accretion of discount. |
| (c) | Rate periodically changes. Rate disclosed is the 7-day yield at March 31, 2023. |
| Aggregate gross unrealized appreciation for all investments in which there is an excess of value over tax cost | $2,637,109,564 |
| Aggregate gross unrealized depreciation for all investments in which there is an excess of tax cost over value | (15,070,422) |
| Net unrealized appreciation | $2,622,039,142 |
| Level 1 | – | unadjusted quoted prices in active markets for identical securities. |
| Level 2 | – | other significant observable inputs (including quoted prices for similar securities, interest rates, prepayment speeds, credit risks, etc.). See Notes to Financial Statements — Note 1A. |
| Level 3 | – | significant unobservable inputs (including the Adviser's own assumptions in determining fair value of investments). See Notes to Financial Statements — Note 1A. |
| Level 1 | Level 2 | Level 3 | Total | |
| Common Stocks | $5,350,277,478 | $ — | $— | $5,350,277,478 |
| U.S. Government and Agency Obligations | — | 29,996,171 | — | 29,996,171 |
| Repurchase Agreements | — | 36,400,000 | — | 36,400,000 |
| Open-End Fund | 23,052,599 | — | — | 23,052,599 |
| Total Investments in Securities | $ 5,373,330,077 | $ 66,396,171 | $ — | $ 5,439,726,248 |
| ASSETS: | |
| Investments in unaffiliated issuers, at value (cost $2,805,405,593) | $5,439,726,248 |
| Cash | 36,403,094 |
| Receivables — | |
| Fund shares sold | 12,664,517 |
| Dividends | 2,191,059 |
| Interest | 257,228 |
| Due from the Adviser | 721 |
| Other assets | 71,416 |
| Total assets | $5,491,314,283 |
| LIABILITIES: | |
| Payables — | |
| Fund shares repurchased | $ 20,972,096 |
| Distributions | 1,196 |
| Transfer agent fees | 1,072,076 |
| Management fees | 268,497 |
| Administrative expenses | 155,261 |
| Distribution fees | 42,229 |
| Accrued expenses | 231,725 |
| Total liabilities | $ 22,743,080 |
| NET ASSETS: | |
| Paid-in capital | $2,846,873,852 |
| Distributable earnings | 2,621,697,351 |
| Net assets | $5,468,571,203 |
| NET ASSET VALUE PER SHARE: | |
| No par value (unlimited number of shares authorized) | |
| Class A (based on $1,006,630,078/38,361,408 shares) | $ 26.24 |
| Class C (based on $224,126,191/10,245,307 shares) | $ 21.88 |
| Class K (based on $731,131,403/27,627,042 shares) | $ 26.46 |
| Class R (based on $96,175,084/3,826,653 shares) | $ 25.13 |
| Class Y (based on $3,410,508,447/127,467,626 shares) | $ 26.76 |
| MAXIMUM OFFERING PRICE PER SHARE: | |
| Class A (based on $26.24 net asset value per share/100%-5.75% maximum sales charge) | $ 27.84 |
| INVESTMENT INCOME: | ||
| Dividends from unaffiliated issuers | $46,927,851 | |
| Interest from unaffiliated issuers | 310,207 | |
| Total Investment Income | $ 47,238,058 | |
| EXPENSES: | ||
| Management fees | $32,485,763 | |
| Administrative expenses | 1,447,283 | |
| Transfer agent fees | ||
| Class A | 971,101 | |
| Class C | 178,176 | |
| Class K | 5,762 | |
| Class R | 246,221 | |
| Class Y | 3,085,868 | |
| Distribution fees | ||
| Class A | 2,481,945 | |
| Class C | 2,620,499 | |
| Class R | 472,868 | |
| Shareowner communications expense | 235,035 | |
| Custodian fees | 50,204 | |
| Registration fees | 123,346 | |
| Professional fees | 501,144 | |
| Printing expense | 71,857 | |
| Officers' and Trustees' fees | 348,455 | |
| Insurance expense | 40,285 | |
| Miscellaneous | 193,759 | |
| Total expenses | $ 45,559,571 | |
| Less fees waived and expenses reimbursed by the Adviser | (23,728) | |
| Net expenses | $ 45,535,843 | |
| Net investment income | $ 1,702,215 | |
| REALIZED AND UNREALIZED GAIN (LOSS) ON INVESTMENTS: | ||
| Net realized gain (loss) on: | ||
| Investments in unaffiliated issuers | $ 4,379,884 | |
| Change in net unrealized appreciation (depreciation) on: | ||
| Investments in unaffiliated issuers | $ (430,738,196) | |
| Net realized and unrealized gain (loss) on investments | $(426,358,312) | |
| Net increase in net assets resulting from operations | $ (424,656,097) |
| Year
Ended 3/31/23 |
Year
Ended 3/31/22 | |
| FROM OPERATIONS: | ||
| Net investment income (loss) | $ 1,702,215 | $ (8,494,681) |
| Net realized gain (loss) on investments | 4,379,884 | 899,724,189 |
| Change in net unrealized appreciation (depreciation) on investments | (430,738,196) | (136,872,132) |
| Net increase (decrease) in net assets resulting from operations | $ (424,656,097) | $ 754,357,376 |
| DISTRIBUTIONS TO SHAREOWNERS: | ||
| Class A ($1.06 and $6.41 per share, respectively) | $ (40,524,950) | $ (220,439,180) |
| Class C ($1.06 and $6.41 per share, respectively) | (12,076,330) | (83,770,214) |
| Class K ($1.06 and $6.45 per share, respectively) | (28,722,503) | (170,015,835) |
| Class R ($1.06 and $6.41 per share, respectively) | (4,002,407) | (21,346,897) |
| Class Y ($1.06 and $6.42 per share, respectively) | (127,942,583) | (721,203,108) |
| Total distributions to shareowners | $ (213,268,773) | $(1,216,775,234) |
| FROM FUND SHARE TRANSACTIONS: | ||
| Net proceeds from sales of shares | $ 1,286,919,419 | $ 1,166,360,816 |
| Reinvestment of distributions | 190,150,893 | 1,082,103,084 |
| Cost of shares repurchased | (1,641,920,640) | (2,195,790,517) |
| In-kind redemptions | — | (118,841,723) |
| Net decrease in net assets resulting from Fund share transactions | $ (164,850,328) | $ (66,168,340) |
| Net decrease in net assets | $ (802,775,198) | $ (528,586,198) |
| NET ASSETS: | ||
| Beginning of year | $ 6,271,346,401 | $ 6,799,932,599 |
| End of year | $ 5,468,571,203 | $ 6,271,346,401 |
| Year
Ended 3/31/23 Shares |
Year
Ended 3/31/23 Amount |
Year
Ended 3/31/22 Shares |
Year
Ended 3/31/22 Amount | |
| Class A | ||||
| Shares sold | 5,572,757 | $ 141,439,708 | 5,916,957 | $ 193,390,629 |
| Reinvestment of distributions | 1,426,771 | 35,355,376 | 6,120,527 | 190,042,360 |
| Less shares repurchased | (8,270,446) | (210,553,850) | (8,283,604) | (270,947,644) |
| Net
increase (decrease) |
(1,270,918) | $ (33,758,766) | 3,753,880 | $ 112,485,345 |
| Class C | ||||
| Shares sold | 777,200 | $ 16,585,707 | 954,022 | $ 27,190,474 |
| Reinvestment of distributions | 551,991 | 11,431,724 | 2,977,434 | 78,455,403 |
| Less shares repurchased | (5,499,084) | (117,360,748) | (4,966,819) | (142,043,233) |
| Net decrease | (4,169,893) | $ (89,343,317) | (1,035,363) | $ (36,397,356) |
| Class K | ||||
| Shares sold | 6,058,204 | $ 154,002,209 | 7,266,187 | $ 257,346,721 |
| Reinvestment of distributions | 1,081,116 | 26,984,664 | 5,186,648 | 161,912,679 |
| Less shares repurchased | (8,262,193) | (215,969,328) | (10,190,949) | (333,765,561) |
| Net
increase (decrease) |
(1,122,873) | $ (34,982,455) | 2,261,886 | $ 85,493,839 |
| Class R | ||||
| Shares sold | 454,486 | $ 11,063,987 | 575,060 | $ 18,183,749 |
| Reinvestment of distributions | 152,300 | 3,620,180 | 703,930 | 21,082,679 |
| Less shares repurchased | (747,578) | (18,143,975) | (810,799) | (25,924,419) |
| Net
increase (decrease) |
(140,792) | $ (3,459,808) | 468,191 | $ 13,342,009 |
| Class Y | ||||
| Shares sold | 37,242,069 | $ 963,827,808 | 20,581,872 | $ 670,249,243 |
| Reinvestment of distributions | 4,467,470 | 112,758,949 | 19,986,382 | 630,609,963 |
| Less shares repurchased | (42,011,533) | (1,079,892,739) | (41,837,910) | (1,423,109,660) |
| In-kind redemptions | — | — | (3,317,748) | (118,841,723) |
| Net decrease | (301,994) | $ (3,305,982) | (4,587,404) | $ (241,092,177) |
| Year
Ended 3/31/23 |
Year
Ended 3/31/22 |
Year
Ended 3/31/21 |
Year
Ended 3/31/20 |
Year
Ended 3/31/19 | |
| Class A | |||||
| Net asset value, beginning of period | $ 29.25 | $ 31.88 | $ 22.43 | $ 24.21 | $ 22.66 |
| Increase (decrease) from investment operations: | |||||
| Net investment income (loss) (a) | $ (0.03) | $ (0.09) | $ (0.03)(b) | $ 0.04 | $ 0.06 |
| Net realized and unrealized gain (loss) on investments | (1.92) | 3.87 | 12.31 | (0.36) | 2.77 |
| Net increase (decrease) from investment operations | $ (1.95) | $ 3.78 | $ 12.28 | $ (0.32) | $ 2.83 |
| Distributions to shareowners: | |||||
| Net investment income | $ — | $ — | $ — | $ (0.01) | $ (0.05) |
| Net realized gain | (1.06) | (6.41) | (2.83) | (1.45) | (1.23) |
| Total distributions | $ (1.06) | $ (6.41) | $ (2.83) | $ (1.46) | $ (1.28) |
| Net increase (decrease) in net asset value | $ (3.01) | $ (2.63) | $ 9.45 | $ (1.78) | $ 1.55 |
| Net asset value, end of period | $ 26.24 | $ 29.25 | $ 31.88 | $ 22.43 | $ 24.21 |
| Total return (c) | (6.44)% | 10.70% | 55.55% | (2.17)% | 12.90% |
| Ratio of net expenses to average net assets | 1.02% | 1.00% | 1.04% | 1.07% | 1.09% |
| Ratio of net investment income (loss) to average net assets | (0.13)% | (0.26)% | (0.10)% | 0.16% | 0.25% |
| Portfolio turnover rate | 12% | 18%(d) | 24% | 23%(d) | 26% |
| Net assets, end of period (in thousands) | $1,006,630 | $1,159,356 | $1,143,970 | $805,102 | $1,042,168 |
| (a) | The per-share data presented above is based on the average shares outstanding for the period presented. |
| (b) | The amount shown for a share outstanding does not correspond with net investment income on the Statement of Operations for the period due to timing of the sales and repurchase of shares. |
| (c) | Assumes initial investment at net asset value at the beginning of each period, reinvestment of all distributions, the complete redemption of the investment at net asset value at the end of each period and no sales charges. Total return would be reduced if sales charges were taken into account. |
| (d) | Portfolio turnover excludes the value of portfolio securities received or delivered as a result of in-kind fund share transactions. |
| Year
Ended 3/31/23 |
Year
Ended 3/31/22 |
Year
Ended 3/31/21 |
Year
Ended 3/31/20 |
Year
Ended 3/31/19 | |
| Class C | |||||
| Net asset value, beginning of period | $ 24.76 | $ 28.01 | $ 20.07 | $ 21.93 | $ 20.73 |
| Increase (decrease) from investment operations: | |||||
| Net investment income (loss) (a) | $ (0.18) | $ (0.28) | $ (0.21)(b) | $ (0.12)(b) | $ (0.08)(b) |
| Net realized and unrealized gain (loss) on investments | (1.64) | 3.44 | 10.98 | (0.29) | 2.51 |
| Net increase (decrease) from investment operations | $ (1.82) | $ 3.16 | $ 10.77 | $ (0.41) | $ 2.43 |
| Distributions to shareowners: | |||||
| Net realized gain | $ (1.06) | $ (6.41) | $ (2.83) | $ (1.45) | $ (1.23) |
| Total distributions | $ (1.06) | $ (6.41) | $ (2.83) | $ (1.45) | $ (1.23) |
| Net increase (decrease) in net asset value | $ (2.88) | $ (3.25) | $ 7.94 | $ (1.86) | $ 1.20 |
| Net asset value, end of period | $ 21.88 | $ 24.76 | $ 28.01 | $ 20.07 | $ 21.93 |
| Total return (c) | (7.10)% | 9.91% | 54.53% | (2.81)% | 12.12% |
| Ratio of net expenses to average net assets | 1.74% | 1.71% | 1.72% | 1.74% | 1.73% |
| Ratio of net investment income (loss) to average net assets | (0.86)% | (0.98)% | (0.79)% | (0.51)% | (0.39)% |
| Portfolio turnover rate | 12% | 18%(d) | 24% | 23%(d) | 26% |
| Net assets, end of period (in thousands) | $224,126 | $356,963 | $432,822 | $372,488 | $444,786 |
| (a) | The per-share data presented above is based on the average shares outstanding for the period presented. |
| (b) | The amount shown for a share outstanding does not correspond with net investment income on the Statement of Operations for the period due to timing of the sales and repurchase of shares. |
| (c) | Assumes initial investment at net asset value at the beginning of each period, reinvestment of all distributions, the complete redemption of the investment at net asset value at the end of each period and no sales charges. Total return would be reduced if sales charges were taken into account. |
| (d) | Portfolio turnover excludes the value of portfolio securities received or delivered as a result of in-kind fund share transactions. |
| Year
Ended 3/31/23 |
Year
Ended 3/31/22 |
Year
Ended 3/31/21 |
Year
Ended 3/31/20 |
Year
Ended 3/31/19 | |
| Class K | |||||
| Net asset value, beginning of period | $ 29.39 | $ 31.94 | $ 22.43 | $ 24.21 | $ 22.68 |
| Increase (decrease) from investment operations: | |||||
| Net investment income (loss) (a) | $ 0.06 | $ 0.03(b) | $ 0.08 | $ 0.15 | $ 0.16 |
| Net realized and unrealized gain (loss) on investments | (1.93) | 3.87 | 12.34 | (0.36) | 2.76 |
| Net increase (decrease) from investment operations | $ (1.87) | $ 3.90 | $ 12.42 | $ (0.21) | $ 2.92 |
| Distributions to shareowners: | |||||
| Net investment income | $ — | $ (0.04) | $ (0.08) | $ (0.12) | $ (0.16) |
| Net realized gain | (1.06) | (6.41) | (2.83) | (1.45) | (1.23) |
| Total distributions | $ (1.06) | $ (6.45) | $ (2.91) | $ (1.57) | $ (1.39) |
| Net increase (decrease) in net asset value | $ (2.93) | $ (2.55) | $ 9.51 | $ (1.78) | $ 1.53 |
| Net asset value, end of period | $ 26.46 | $ 29.39 | $ 31.94 | $ 22.43 | $ 24.21 |
| Total return (c) | (6.14)% | 11.08% | 56.21% | (1.78)% | 13.39% |
| Ratio of net expenses to average net assets | 0.67% | 0.66% | 0.65% | 0.66% | 0.66% |
| Ratio of net investment income (loss) to average net assets | 0.22% | 0.09% | 0.28% | 0.58% | 0.68% |
| Portfolio turnover rate | 12% | 18%(d) | 24% | 23%(d) | 26% |
| Net assets, end of period (in thousands) | $731,131 | $844,949 | $846,019 | $639,430 | $680,094 |
| (a) | The per-share data presented above is based on the average shares outstanding for the period presented. |
| (b) | The amount shown for a share outstanding does not correspond with net investment income on the Statement of Operations for the period due to timing of the sales and repurchase of shares. |
| (c) | Assumes initial investment at net asset value at the beginning of each period, reinvestment of all distributions and the complete redemption of the investment at net asset value at the end of each period. |
| (d) | Portfolio turnover excludes the value of portfolio securities received or delivered as a result of in-kind fund share transactions. |
| Year
Ended 3/31/23 |
Year
Ended 3/31/22 |
Year
Ended 3/31/21 |
Year
Ended 3/31/20 |
Year
Ended 3/31/19 | |
| Class R | |||||
| Net asset value, beginning of period | $ 28.17 | $ 31.03 | $ 21.95 | $ 23.79 | $ 22.31 |
| Increase (decrease) from investment operations: | |||||
| Net investment income (loss) (a) | $ (0.13) | $ (0.21) | $ (0.13)(b) | $ (0.04)(b) | $ (0.01)(b) |
| Net realized and unrealized gain (loss) on investments | (1.85) | 3.76 | 12.04 | (0.35) | 2.72 |
| Net increase (decrease) from investment operations | $ (1.98) | $ 3.55 | $ 11.91 | $ (0.39) | $ 2.71 |
| Distributions to shareowners: | |||||
| Net realized gain | $ (1.06) | $ (6.41) | $ (2.83) | $ (1.45) | $ (1.23) |
| Total distributions | $ (1.06) | $ (6.41) | $ (2.83) | $ (1.45) | $ (1.23) |
| Net increase (decrease) in net asset value | $ (3.04) | $ (2.86) | $ 9.08 | $ (1.84) | $ 1.48 |
| Net asset value, end of period | $ 25.13 | $ 28.17 | $ 31.03 | $ 21.95 | $ 23.79 |
| Total return (c) | (6.80)% | 10.22% | 55.07% | (2.50)% | 12.52% |
| Ratio of net expenses to average net assets | 1.40% | 1.40% | 1.39% | 1.40% | 1.39% |
| Ratio of net investment income (loss) to average net assets | (0.51)% | (0.66)% | (0.46)% | (0.17)% | (0.04)% |
| Portfolio turnover rate | 12% | 18%(d) | 24% | 23%(d) | 26% |
| Net assets, end of period (in thousands) | $96,175 | $111,781 | $108,568 | $85,892 | $114,781 |
| Ratios with no waiver of fees and assumption of expenses by the Adviser and no reduction for fees paid indirectly: | |||||
| Total expenses to average net assets | 1.43% | 1.40% | 1.39% | 1.42% | 1.39% |
| Net investment income (loss) to average net assets | (0.54)% | (0.66)% | (0.46)% | (0.19)% | (0.04)% |
| (a) | The per-share data presented above is based on the average shares outstanding for the period presented. |
| (b) | The amount shown for a share outstanding does not correspond with net investment income on the Statement of Operations for the period due to timing of the sales and repurchase of shares. |
| (c) | Assumes initial investment at net asset value at the beginning of each period, reinvestment of all distributions and the complete redemption of the investment at net asset value at the end of each period. |
| (d) | Portfolio turnover excludes the value of portfolio securities received or delivered as a result of in-kind fund share transactions. |
| Year
Ended 3/31/23 |
Year
Ended 3/31/22 |
Year
Ended 3/31/21 |
Year
Ended 3/31/20 |
Year
Ended 3/31/19 | |
| Class Y | |||||
| Net asset value, beginning of period | $ 29.73 | $ 32.25 | $ 22.63 | $ 24.42 | $ 22.86 |
| Increase (decrease) from investment operations: | |||||
| Net investment income (loss) (a) | $ 0.03 | $ (0.01) | $ 0.05 | $ 0.12 | $ 0.14 |
| Net realized and unrealized gain (loss) on investments | (1.94) | 3.91 | 12.45 | (0.36) | 2.79 |
| Net increase (decrease) from investment operations | $ (1.91) | $ 3.90 | $ 12.50 | $ (0.24) | $ 2.93 |
| Distributions to shareowners: | |||||
| Net investment income | $ — | $ (0.01) | $ (0.05) | $ (0.10) | $ (0.14) |
| Net realized gain | (1.06) | (6.41) | (2.83) | (1.45) | (1.23) |
| Total distributions | $ (1.06) | $ (6.42) | $ (2.88) | $ (1.55) | $ (1.37) |
| Net increase (decrease) in net asset value | $ (2.97) | $ (2.52) | $ 9.62 | $ (1.79) | $ 1.56 |
| Net asset value, end of period | $ 26.76 | $ 29.73 | $ 32.25 | $ 22.63 | $ 24.42 |
| Total return (b) | (6.20)% | 10.97% | 56.06% | (1.89)% | 13.28% |
| Ratio of net expenses to average net assets | 0.76% | 0.76% | 0.76% | 0.76% | 0.77% |
| Ratio of net investment income (loss) to average net assets | 0.13% | (0.03)% | 0.18% | 0.47% | 0.58% |
| Portfolio turnover rate | 12% | 18%(c) | 24% | 23%(c) | 26% |
| Net assets, end of period (in thousands) | $3,410,508 | $3,798,296 | $4,268,553 | $3,232,510 | $3,563,173 |
| (a) | The per-share data presented above is based on the average shares outstanding for the period presented. |
| (b) | Assumes initial investment at net asset value at the beginning of each period, reinvestment of all distributions and the complete redemption of the investment at net asset value at the end of each period. |
| (c) | Portfolio turnover excludes the value of portfolio securities received or delivered as a result of in-kind fund share transactions. |
| A. | Security Valuation |
| The net asset value of the Fund is computed once daily, on each day the New York Stock Exchange (“NYSE”) is open, as of the close of regular trading on the NYSE. | |
| Equity securities that have traded on an exchange are valued by using the last sale price on the principal exchange where they are traded. Equity securities that have not traded on the date of valuation, or securities for which sale prices are not available, generally are valued using the mean between the last bid and asked prices or, if both last bid and asked prices are not available, at the last quoted bid price. Last sale and bid and asked prices are provided by independent third party pricing services. In the case of equity securities not traded on an exchange, prices are typically determined by independent third party pricing services using a variety of techniques and methods. |
| The value of foreign securities is translated into U.S. dollars based on foreign currency exchange rate quotations supplied by a third party pricing source. Trading in non-U.S. equity securities is substantially completed each day at various times prior to the close of the NYSE. The values of such securities used in computing the net asset value of the Fund's shares are determined as of such times. The Adviser may use a fair value model developed by an independent pricing service to value non-U.S. equity securities. | |
| Shares of open-end registered investment companies (including money market mutual funds) are valued at such funds’ net asset value. | |
| Securities for which independent pricing services or broker-dealers are unable to supply prices or for which market prices and/or quotations are not readily available or are considered to be unreliable are valued by a fair valuation team comprised of certain personnel of the Adviser. The Adviser is designated as the valuation designee for the Fund pursuant to Rule 2a-5 under the 1940 Act. The Adviser’s fair valuation team is responsible for monitoring developments that may impact fair valued securities. | |
| Inputs used when applying fair value methods to value a security may include credit ratings, the financial condition of the company, current market conditions and comparable securities. The Adviser may use fair value methods if it is determined that a significant event has occurred after the close of the exchange or market on which the security trades and prior to the determination of the Fund's net asset value. Examples of a significant event might include political or economic news, corporate restructurings, natural disasters, terrorist activity or trading halts. Thus, the valuation of the Fund's securities may differ significantly from exchange prices, and such differences could be material. | |
| Repurchase agreements are valued at par. Cash may include overnight time deposits at approved financial institutions. | |
| B. | Investment Income and Transactions |
| Dividend income is recorded on the ex-dividend date, except that certain dividends from foreign securities where the ex-dividend date may have passed are recorded as soon as the Fund becomes aware of the ex-dividend data in the exercise of reasonable diligence. | |
| Interest income, including interest on income-bearing cash accounts, is recorded on the accrual basis. Dividend and interest income are reported |
| net of unrecoverable foreign taxes withheld at the applicable country rates and net of income accrued on defaulted securities. | |
| Interest and dividend income payable by delivery of additional shares is reclassified as PIK (payment-in-kind) income upon receipt and is included in interest and dividend income, respectively. | |
| Security transactions are recorded as of trade date. Gains and losses on sales of investments are calculated on the identified cost method for both financial reporting and federal income tax purposes. | |
| C. | Federal Income Taxes |
| It is the Fund 's policy to comply with the requirements of the Internal Revenue Code applicable to regulated investment companies and to distribute all of its net taxable income and net realized capital gains, if any, to its shareowners. Therefore, no provision for federal income taxes is required. As of March 31, 2023, the Fund did not accrue any interest or penalties with respect to uncertain tax positions, which, if applicable, would be recorded as an income tax expense on the Statement of Operations. Tax returns filed within the prior three years remain subject to examination by federal and state tax authorities. | |
| The amount and character of income and capital gain distributions to shareowners are determined in accordance with federal income tax rules, which may differ from U.S. GAAP. Distributions in excess of net investment income or net realized gains are temporary over distributions for financial statement purposes resulting from differences in the recognition or classification of income or distributions for financial statement and tax purposes. Capital accounts within the financial statements are adjusted for permanent book/tax differences to reflect tax character, but are not adjusted for temporary differences. | |
| At March 31, 2023, the Fund was permitted to carry forward indefinitely $2,017,329 of short-term losses and $0 of long-term losses. | |
| The tax character of distributions paid during the years ended March 31, 2023 and March 31, 2022, was as follows: |
| 2023 | 2022 | |
| Distributions paid from: | ||
| Ordinary income | $ 11,767,976 | $ 25,708,852 |
| Long-term capital gains | 201,500,797 | 1,191,066,382 |
| Total | $213,268,773 | $1,216,775,234 |
| 2023 | |
| Distributable earnings/(losses): | |
| Undistributed ordinary income | $ 1,675,538 |
| Capital loss carryforward | (2,017,329) |
| Net unrealized appreciation | 2,622,039,142 |
| Total | $2,621,697,351 |
| D. | Fund Shares |
| The Fund records sales and repurchases of its shares as of trade date. The Distributor earned $63,838 in underwriting commissions on the sale of Class A shares during the year ended March 31, 2023. | |
| E. | Class Allocations |
| Income, common expenses and realized and unrealized gains and losses are calculated at the Fund level and allocated daily to each class of shares based on its respective percentage of adjusted net assets at the beginning of the day. | |
| Distribution fees are calculated based on the average daily net asset value attributable to Class A, Class C and Class R shares of the Fund, respectively (see Note 5). Class K and Class Y shares do not pay distribution fees. All expenses and fees paid to the Fund's transfer agent for its services are allocated among the classes of shares based on the number of accounts in each class and the ratable allocation of related out-of-pocket expenses (see Note 4). | |
| Distributions to shareowners are recorded as of the ex-dividend date. Distributions paid by the Fund with respect to each class of shares are calculated in the same manner and at the same time, except that net investment income dividends to Class A, Class C, Class K, Class R and Class Y shares can reflect different transfer agent and distribution expense rates. | |
| F. | Risks |
| The value of securities held by the Fund may go up or down, sometimes rapidly or unpredictably, due to general market conditions, such as real or perceived adverse economic, political or regulatory conditions, recessions, the spread of infectious illness or other public health issues, inflation, changes in interest rates, armed conflict including Russia's |
| military invasion of Ukraine, sanctions against Russia, other nations or individuals or companies and possible countermeasures, lack of liquidity in the bond markets or adverse investor sentiment. In the past several years, financial markets have experienced increased volatility, depressed valuations, decreased liquidity and heightened uncertainty. These conditions may continue, recur, worsen or spread. Recently, inflation and interest rates have increased and may rise further. These circumstances could adversely affect the value and liquidity of the Fund's investments, impair the Fund's ability to satisfy redemption requests, and negatively impact the Fund's performance. Raising the ceiling on U.S. government debt has become increasingly politicized. Any failure to increase the ceiling on U.S. government debt could lead to a default on U.S. government obligations, with unpredictable consequences for economies and markets. | |
| The global pandemic of the novel coronavirus respiratory disease designated COVID-19 has resulted in major disruption to economies and markets around the world, including the United States. Global financial markets have experienced extreme volatility and severe losses, and trading in many instruments has been disrupted. Liquidity for many instruments has been greatly reduced for periods of time. Some sectors of the economy and individual issuers have experienced particularly large losses. These circumstances may continue to affect adversely the value and liquidity of the Fund's investments. Following Russia’s invasion of Ukraine, Russian securities have lost all, or nearly all, their market value. Other securities or markets could be similarly affected by past or future political, geopolitical or other events or conditions. | |
| Governments and central banks, including the U.S. Federal Reserve, have taken extraordinary and unprecedented actions to support local and global economies and the financial markets. These actions have resulted in significant expansion of public debt, including in the U.S. The consequences of high public debt, including its future impact on the economy and securities markets, may not be known for some time. | |
| The U.S. and other countries are periodically involved in disputes over trade and other matters, which may result in tariffs, investment restrictions and adverse impacts on affected companies and securities. For example, the U.S. has imposed tariffs and other trade barriers on Chinese exports, has restricted sales of certain categories of goods to China, and has established barriers to investments in China. Trade disputes may adversely affect the economies of the U.S. and its trading partners, as well as companies directly or indirectly affected and financial markets generally. If the political climate between the U.S. and China does not improve or continues to deteriorate, if China were to |
| attempt unification of Taiwan by force, or if other geopolitical conflicts develop or get worse, economies, markets and individual securities may be severely affected both regionally and globally, and the value of the Fund's assets may go down. | |
| At times, the Fund’s investments may represent industries or industry sectors that are interrelated or have common risks, making the Fund more susceptible to any economic, political, or regulatory developments or other risks affecting those industries and sectors. | |
| Normally, the Fund invests at least 80% of its net assets in equity securities of large companies. Large companies may fall out of favor with investors and underperform the overall equity market. | |
| Russia launched a large-scale invasion of Ukraine on February 24, 2022. In response to the military action by Russia, various countries, including the U.S., the United Kingdom, and European Union issued broad-ranging economic sanctions against Russia and Belarus and certain companies and individuals. Since then, Russian securities have lost all, or nearly all, their market value, and many other issuers, securities and markets have been adversely affected. The United States and other countries may impose sanctions on other countries, companies and individuals in light of Russia’s military invasion. The extent and duration of the military action or future escalation of such hostilities, the extent and impact of existing and future sanctions, market disruptions and volatility, and the result of any diplomatic negotiations cannot be predicted. These and any related events could have a significant impact on the value and liquidity of certain Fund investments, on Fund performance and the value of an investment in the Fund, particularly with respect to securities and commodities, such as oil, natural gas and food commodities, as well as other sectors with exposure to Russian issuers or issuers in other countries affected by the invasion, and are likely to have collateral impacts on market sectors globally. | |
| With the increased use of technologies such as the Internet to conduct business, the Fund is susceptible to operational, information security and related risks. While the Fund’s Adviser has established business continuity plans in the event of, and risk management systems to prevent, limit or mitigate, such cyber-attacks, there are inherent limitations in such plans and systems, including the possibility that certain risks have not been identified. Furthermore, the Fund cannot control the cybersecurity plans and systems put in place by service providers to the Fund such as the Fund’s custodian and accounting agent, and the Fund’s transfer agent. In addition, many beneficial owners of Fund shares hold them through accounts at broker-dealers, |
| retirement platforms and other financial market participants over which neither the Fund nor the Adviser exercises control. Each of these may in turn rely on service providers to them, which are also subject to the risk of cyber-attacks. Cybersecurity failures or breaches at the Adviser or the Fund’s service providers or intermediaries have the ability to cause disruptions and impact business operations, potentially resulting in financial losses, interference with the Fund’s ability to calculate its net asset value, impediments to trading, the inability of Fund shareowners to effect share purchases, redemptions or exchanges or receive distributions, loss of or unauthorized access to private shareowner information and violations of applicable privacy and other laws, regulatory fines, penalties, reputational damage, or additional compliance costs. Such costs and losses may not be covered under any insurance. In addition, maintaining vigilance against cyber-attacks may involve substantial costs over time, and system enhancements may themselves be subject to cyberattacks. | |
| As of the date of this report, a significant portion of the Fund’s net asset value is attributable to net unrealized capital gains on portfolio securities. If the Fund realizes capital gains in excess of realized capital losses and any available capital loss carryforwards in any fiscal year, it generally will be required to distribute that excess to shareholders. You may receive distributions that are attributable to appreciation that was present in the Fund’s portfolio securities at the time you made your investment but had not been realized at that time, or that are attributable to capital gains or other income that, although realized by the Fund, had not yet been distributed at the time you made your investment. Unless you purchase shares through a tax-advantaged account (such as an IRA or 401(k) plan), these distributions will be taxable to you. You should consult your tax adviser about the tax consequences of your investment in the Fund. | |
| The Fund’s prospectus contains unaudited information regarding the Fund’s principal risks. Please refer to that document when considering the Fund’s principal risks. | |
| G. | Repurchase Agreements |
| Repurchase agreements are arrangements under which the Fund purchases securities from a broker-dealer or a bank, called the counterparty, upon the agreement of the counterparty to repurchase the securities from the Fund at a later date, and at a specific price, which is typically higher than the purchase price paid by the Fund. The securities purchased serve as the Fund's collateral for the obligation of the counterparty to repurchase the securities. The value of the collateral, |
| including accrued interest, is required to be equal to or in excess of the repurchase price. The collateral for all repurchase agreements is held in safekeeping in the customer-only account of the Fund's custodian or a sub-custodian of the Fund. The Adviser is responsible for determining that the value of the collateral remains at least equal to the repurchase price. In the event of a default by the counterparty, the Fund is entitled to sell the securities, but the Fund may not be able to sell them for the price at which they were purchased, thus causing a loss to the Fund. Additionally, if the counterparty becomes insolvent, there is some risk that the Fund will not have a right to the securities, or the immediate right to sell the securities. Open repurchase agreements at March 31, 2023 are disclosed in the Schedule of Investments. |
| Shareowner Communications: | |
| Class A | $ 75,163 |
| Class C | 22,677 |
| Class K | 23,713 |
| Class R | 3,359 |
| Class Y | 110,123 |
| Total | $ 235,035 |

May 25, 2023
Amundi Asset Management US, Inc.
The Bank of New York Mellon Corporation
Ernst & Young LLP
Amundi Distributor US, Inc.
Morgan, Lewis & Bockius LLP
BNY Mellon Investment Servicing (US) Inc.
| Name,
Age and Position Held With the Fund |
Term
of Office and Length of Service |
Principal Occupation(s) During At Least The Past Five Years | Other
Directorships Held by Trustee During At Least The Past Five Years |
| Thomas
J. Perna (72) Chairman of the Board and Trustee |
Trustee
since 2006. Serves until a successor trustee is elected or earlier retirement or removal. |
Private investor (2004 – 2008 and 2013 – present); Chairman (2008 – 2013) and Chief Executive Officer (2008 – 2012), Quadriserv, Inc. (technology products for securities lending industry); and Senior Executive Vice President, The Bank of New York (financial and securities services) (1986 – 2004) | Director,
Broadridge Financial Solutions, Inc. (investor communications and securities processing provider for financial services industry) (2009 – present); Director, Quadriserv, Inc. (2005 – 2013); and Commissioner, New Jersey State Civil Service Commission (2011 – 2015) |
| John
E. Baumgardner, Jr. (72)* Trustee |
Trustee
since 2019. Serves until a successor trustee is elected or earlier retirement or removal. |
Of Counsel (2019 – present), Partner (1983-2018), Sullivan & Cromwell LLP (law firm). | Chairman,
The Lakeville Journal Company, LLC, (privately-held community newspaper group) (2015-present) |
| Diane
Durnin (66) Trustee |
Trustee
since 2019. Serves until a successor trustee is elected or earlier retirement or removal. |
Managing Director - Head of Product Strategy and Development, BNY Mellon Investment Management (investment management firm) (2012-2018); Vice Chairman – The Dreyfus Corporation (2005 – 2018): Executive Vice President Head of Product, BNY Mellon Investment Management (2007-2012); Executive Director- Product Strategy, Mellon Asset Management (2005-2007); Executive Vice President Head of Products, Marketing and Client Service, Dreyfus Corporation (investment management firm) (2000-2005); Senior Vice President Strategic Product and Business Development, Dreyfus Corporation (1994-2000) | None |
| Name,
Age and Position Held With the Fund |
Term
of Office and Length of Service |
Principal Occupation(s) During At Least The Past Five Years | Other
Directorships Held by Trustee During At Least The Past Five Years |
| Benjamin
M. Friedman (78) Trustee |
Trustee
since 2008. Serves until a successor trustee is elected or earlier retirement or removal. |
William Joseph Maier Professor of Political Economy, Harvard University (1972 – present) | Trustee,
Mellon Institutional Funds Investment Trust and Mellon Institutional Funds Master Portfolio (oversaw 17 portfolios in fund complex) (1989 - 2008) |
| Craig
C. MacKay (60) Trustee |
Trustee
since 2021. Serves until a successor trustee is elected or earlier retirement or removal. |
Partner, England & Company, LLC (advisory firm) (2012 – present); Group Head – Leveraged Finance Distribution, Oppenheimer & Company (investment bank) (2006 – 2012); Group Head – Private Finance & High Yield Capital Markets Origination, SunTrust Robinson Humphrey (investment bank) (2003 – 2006); and Founder and Chief Executive Officer, HNY Associates, LLC (investment bank) (1996 – 2003) | Director,
Equitable Holdings, Inc. (financial services holding company) (2022 – present); Board Member of Carver Bancorp, Inc. (holding company) and Carver Federal Savings Bank, NA (2017 – present); Advisory Council Member, MasterShares ETF (2016 – 2017); Advisory Council Member, The Deal (financial market information publisher) (2015 – 2016); Board Co-Chairman and Chief Executive Officer, Danis Transportation Company (privately-owned commercial carrier) (2000 – 2003); Board Member and Chief Financial Officer, Customer Access Resources (privately-owned teleservices company) (1998 – 2000); Board Member, Federation of Protestant Welfare Agencies (human services agency) (1993 – present); and Board Treasurer, Harlem Dowling Westside Center (foster care agency) (1999 – 2018) |
| Name,
Age and Position Held With the Fund |
Term
of Office and Length of Service |
Principal Occupation(s) During At Least The Past Five Years | Other
Directorships Held by Trustee During At Least The Past Five Years |
| Lorraine
H. Monchak (66) Trustee |
Trustee
since 2017. (Advisory Trustee from 2014 - 2017). Serves until a successor trustee is elected or earlier retirement or removal. |
Chief Investment Officer, 1199 SEIU Funds (healthcare workers union pension funds) (2001 – present); Vice President – International Investments Group, American International Group, Inc. (insurance company) (1993 – 2001); Vice President – Corporate Finance and Treasury Group, Citibank, N.A. (1980 – 1986 and 1990 – 1993); Vice President – Asset/Liability Management Group, Federal Farm Funding Corporation (government-sponsored issuer of debt securities) (1988 – 1990); Mortgage Strategies Group, Shearson Lehman Hutton, Inc. (investment bank) (1987 – 1988); Mortgage Strategies Group, Drexel Burnham Lambert, Ltd. (investment bank) (1986 – 1987) | None |
| Marguerite
A. Piret (74) Trustee |
Trustee
since 2002. Serves until a successor trustee is elected or earlier retirement or removal. |
Chief Financial Officer, American Ag Energy, Inc. (controlled environment and agriculture company) (2016 – present); President and Chief Executive Officer, Metric Financial Inc. (formerly known as Newbury Piret Company) (investment banking firm) (1981 – 2019) | Director
of New America High Income Fund, Inc. (closed-end investment company) (2004 – present); and Member, Board of Governors, Investment Company Institute (2000 – 2006) |
| Name,
Age and Position Held With the Fund |
Term
of Office and Length of Service |
Principal Occupation(s) During At Least The Past Five Years | Other
Directorships Held by Trustee During At Least The Past Five Years |
| Fred
J. Ricciardi (76) Trustee |
Trustee
since 2014. Serves until a successor trustee is elected or earlier retirement or removal. |
Private investor (2020 – present); Consultant (investment company services) (2012 – 2020); Executive Vice President, BNY Mellon (financial and investment company services) (1969 – 2012); Director, BNY International Financing Corp. (financial services) (2002 – 2012); Director, Mellon Overseas Investment Corp. (financial services) (2009 – 2012); Director, Financial Models (technology) (2005-2007); Director, BNY Hamilton Funds, Ireland (offshore investment companies) (2004-2007); Chairman/Director, AIB/BNY Securities Services, Ltd., Ireland (financial services) (1999-2006); Chairman, BNY Alternative Investment Services, Inc. (financial services) (2005-2007) | None |
| * Mr. Baumgardner is Of Counsel to Sullivan & Cromwell LLP, which acts as counsel to the Independent Trustees of each Pioneer Fund. | |||
| Name,
Age and Position Held With the Fund |
Term
of Office and Length of Service |
Principal Occupation(s) During At Least The Past Five Years | Other
Directorships Held by Trustee During At Least The Past Five Years |
| Lisa
M. Jones (60)** Trustee, President and Chief Executive Officer |
Trustee
since 2017. Serves until a successor trustee is elected or earlier retirement or removal |
Director, CEO and President of Amundi US, Inc. (investment management firm) (since September 2014); Director, CEO and President of Amundi Asset Management US, Inc. (since September 2014); Director, CEO and President of Amundi Distributor US, Inc. (since September 2014); Director, CEO and President of Amundi Asset Management US, Inc. (since September 2014); Chair, Amundi US, Inc., Amundi Distributor US, Inc. and Amundi Asset Management US, Inc. (September 2014 – 2018); Managing Director, Morgan Stanley Investment Management (investment management firm) (2010 – 2013); Director of Institutional Business, CEO of International, Eaton Vance Management (investment management firm) (2005 – 2010); Director of Amundi Holdings US, Inc. (since 2017) | Director
of Clearwater Analytics (provider of web-based investment accounting software for reporting and reconciliation services) (September 2022 – present) |
| Kenneth
J. Taubes (64)** Trustee |
Trustee
since 2014. Serves until a successor trustee is elected or earlier retirement or removal |
Director and Executive Vice President (since 2008) and Chief Investment Officer, U.S. (since 2010) of Amundi US, Inc. (investment management firm); Director and Executive Vice President and Chief Investment Officer, U.S. of Amundi US (since 2008); Executive Vice President and Chief Investment Officer, U.S. of Amundi Asset Management US, Inc. (since 2009); Portfolio Manager of Amundi US (since 1999); Director of Amundi Holdings US, Inc. (since 2017) | None |
| ** Ms. Jones and Mr. Taubes are Interested Trustees because they are officers or directors of the Fund’s investment adviser and certain of its affiliates. | |||
| Name,
Age and Position Held With the Fund |
Term
of Office and Length of Service |
Principal Occupation(s) During At Least The Past Five Years | Other
Directorships Held by Trustee During At Least The Past Five Years |
| Christopher
J. Kelley (58) Secretary and Chief Legal Officer |
Since
2003. Serves at the discretion of the Board |
Vice President and Associate General Counsel of Amundi US since January 2008; Secretary and Chief Legal Officer of all of the Pioneer Funds since June 2010; Assistant Secretary of all of the Pioneer Funds from September 2003 to May 2010; Vice President and Senior Counsel of Amundi US from July 2002 to December 2007 | None |
| Thomas
Reyes (60) Assistant Secretary |
Since
2010. Serves at the discretion of the Board |
Assistant General Counsel of Amundi US since May 2013 and Assistant Secretary of all the Pioneer Funds since June 2010; Counsel of Amundi US from June 2007 to May 2013 | None |
| Heather
L. Melito-Dezan (46) Assistant Secretary |
Since
2022. Serves at the discretion of the Board |
Director – Trustee and Board Relationships of Amundi US since September 2019; Private practice from 2017 – 2019. | None |
| Anthony
J. Koenig, Jr. (59) Treasurer and Chief Financial and Accounting Officer |
Since
2021. Serves at the discretion of the Board |
Managing Director, Chief Operations Officer and Fund Treasurer of Amundi US since May 2021; Treasurer of all of the Pioneer Funds since May 2021; Assistant Treasurer of all of the Pioneer Funds from January 2021 to May 2021; and Chief of Staff, US Investment Management of Amundi US from May 2008 to January 2021 | None |
| Luis
I. Presutti (57) Assistant Treasurer |
Since
2002. Serves at the discretion of the Board |
Director – Fund Treasury of Amundi US since 1999; and Assistant Treasurer of all of the Pioneer Funds since 1999 | None |
| Gary
Sullivan (64) Assistant Treasurer |
Since
2002. Serves at the discretion of the Board |
Senior Manager – Fund Treasury of Amundi US since 2012; and Assistant Treasurer of all of the Pioneer Funds since 2002 | None |
| Antonio
Furtado (40) Assistant Treasurer |
Since
2020. Serves at the discretion of the Board |
Fund Oversight Manager – Fund Treasury of Amundi US since 2020; Assistant Treasurer of all of the Pioneer Funds since 2020; and Senior Fund Treasury Analyst from 2012 - 2020 | None |
| Name,
Age and Position Held With the Fund |
Term
of Office and Length of Service |
Principal Occupation(s) During At Least The Past Five Years | Other
Directorships Held by Trustee During At Least The Past Five Years |
| Michael
Melnick (52) Assistant Treasurer |
Since
2021. Serves at the discretion of the Board |
Vice President - Deputy Fund Treasurer of Amundi US since May 2021; Assistant Treasurer of all of the Pioneer Funds since July 2021; Director of Regulatory Reporting of Amundi US from 2001 – 2021; and Director of Tax of Amundi US from 2000 - 2001 | None |
| John
Malone (52) Chief Compliance Officer |
Since
2018. Serves at the discretion of the Board |
Managing Director, Chief Compliance Officer of Amundi US Asset Management; Amundi Asset Management US, Inc.; and the Pioneer Funds since September 2018; Chief Compliance Officer of Amundi Distributor US, Inc. since January 2014. | None |
| Brandon
Austin (51) Anti-Money Laundering Officer |
Since
2022. Serves at the discretion of the Board |
Director, Financial Security – Amundi Asset Management; Anti-Money Laundering Officer of all the Pioneer Funds since March 2022: Director of Financial Security of Amundi US since July 2021; Vice President, Head of BSA, AML and OFAC, Deputy Compliance Manager, Crédit Agricole Indosuez Wealth Management (investment management firm) (2013 – 2021) | None |
new accounts, prospectuses, applications
and service forms
account information and transactions
| Retirement plans information | 1-800-622-0176 |
P.O. Box 534427
Pittsburgh, PA 15253-4427
| Our toll-free fax | 1-800-225-4240 |
| Our internet e-mail address |
[email protected] (for general questions about Amundi only) |
60 State Street
Boston, MA 02109
60 State Street, Boston, MA 02109
Underwriter of Pioneer Mutual Funds, Member SIPC
© 2023 Amundi Asset Management US, Inc. 19341-17-0523
ITEM 2. CODE OF ETHICS.
(a) Disclose whether, as of the end of the period covered by the report, the registrant has adopted a code of ethics that applies to the registrant’s principal executive officer, principal financial officer, principal accounting officer or controller, or persons performing similar functions, regardless of whether these individuals are employed by the registrant or a third party. If the registrant has not adopted such a code of ethics, explain why it has not done so.
The registrant has adopted, as of the end of the period covered by this report, a code of ethics that applies to the registrant’s principal executive officer, principal financial officer, principal accounting officer and controller.
(b) For purposes of this Item, the term “code of ethics” means written standards that are reasonably designed to deter wrongdoing and to promote:
(1) Honest and ethical conduct, including the ethical handling of actual or apparent conflicts of interest between personal and professional relationships;
(2) Full, fair, accurate, timely, and understandable disclosure in reports and documents that a registrant files with, or submits to, the Commission and in other public communications made by the registrant;
(3) Compliance with applicable governmental laws, rules, and regulations;
(4) The prompt internal reporting of violations of the code to an appropriate person or persons identified in the code; and
(5) Accountability for adherence to the code.
(c) The registrant must briefly describe the nature of any amendment, during the period covered by the report, to a provision of its code of ethics that applies to the registrant’s principal executive officer, principal financial officer, principal accounting officer or controller, or persons performing similar functions, regardless of whether these individuals are employed by the registrant or a third party, and that relates to any element of the code of ethics definition enumerated in paragraph (b) of this Item. The registrant must file a copy of any such amendment as an exhibit pursuant to Item 10(a), unless the registrant has elected to satisfy paragraph (f) of this Item by posting its code of ethics on its website pursuant to paragraph (f)(2) of this Item, or by undertaking to provide its code of ethics to any person without charge, upon request, pursuant to paragraph (f)(3) of this Item.
The registrant has made no amendments to the code of ethics during the period covered by this report.
(d) If the registrant has, during the period covered by the report, granted a waiver, including an implicit waiver, from a provision of the code of ethics to the registrant’s principal executive officer, principal financial officer, principal accounting officer or controller, or persons performing similar functions, regardless of whether these individuals are employed by the registrant or a third party, that relates to one or more of the items set forth in paragraph (b) of this Item, the registrant must briefly describe the nature of the waiver, the name of the person to whom the waiver was granted, and the date of the waiver.
Not applicable.
(e) If the registrant intends to satisfy the disclosure requirement under paragraph (c) or (d) of this Item regarding an amendment to, or a waiver from, a provision of its code of ethics that applies to the registrant’s principal executive officer, principal financial officer, principal accounting officer or controller, or persons performing similar functions and that relates to any element of the code of ethics definition enumerated in paragraph (b) of this Item by posting such information on its Internet website, disclose the registrant’s Internet address and such intention.
Not applicable.
(f) The registrant must:
(1) File with the Commission, pursuant to Item 12(a)(1), a copy of its code of ethics that applies to the registrant’s principal executive officer, principal financial officer, principal accounting officer or controller, or persons performing similar functions, as an exhibit to its annual report on this Form N-CSR (see attachment);
(2) Post the text of such code of ethics on its Internet website and disclose, in its most recent report on this Form N-CSR, its Internet address and the fact that it has posted such code of ethics on its Internet website; or
(3) Undertake in its most recent report on this Form N-CSR to provide to any person without charge, upon request, a copy of such code of ethics and explain the manner in which such request may be made. See Item 10(2)
ITEM 3. AUDIT COMMITTEE FINANCIAL EXPERT.
(a) (1) Disclose that the registrant’s Board of Trustees has determined that the registrant either:
(i) Has at least one audit committee financial expert serving on its audit committee; or
(ii) Does not have an audit committee financial expert serving on its audit committee.
The registrant’s Board of Trustees has determined that the registrant has at least one audit committee financial expert.
(2) If the registrant provides the disclosure required by paragraph (a)(1)(i) of this Item, it must disclose the name of the audit committee financial expert and whether that person is “independent.” In order to be considered “independent” for purposes of this Item, a member of an audit committee may not, other than in his or her capacity as a member of the audit committee, the Board of Trustees, or any other board committee:
(i) Accept directly or indirectly any consulting, advisory, or other compensatory fee from the issuer; or
(ii) Be an “interested person” of the investment company as defined in Section 2(a)(19) of the Act (15 U.S.C. 80a-2(a)(19)).
Mr. Fred J. Ricciardi, an independent Trustee, is such an audit committee financial expert.
(3) If the registrant provides the disclosure required by paragraph (a)(1) (ii) of this Item, it must explain why it does not have an audit committee financial expert.
Not applicable.
ITEM 4. PRINCIPAL ACCOUNTANT FEES AND SERVICES.
(a) Disclose, under the caption AUDIT FEES, the aggregate fees billed for each of the last two fiscal years for professional services rendered by the principal accountant for the audit of the registrant’s annual financial statements or services that are normally provided by the accountant in connection with statutory and regulatory filings or engagements for those fiscal years.
The audit fees for the Trust were $97,986 payable to Ernst & Young LLP for the year ended March 31, 2023 and $ 91,150 for the year ended March 31, 2022.
(b) Disclose, under the caption AUDIT-RELATED FEES, the aggregate fees billed in each of the last two fiscal years for assurance and related services by the principal accountant that are reasonably related to the performance of the audit of the registrant’s financial statements and are not reported under paragraph (a) of this Item. Registrants shall describe the nature of the services comprising the fees disclosed under this category.
There were no audit-related services in 2023 or 2022.
(c) Disclose, under the caption TAX FEES, the aggregate fees billed in each of the last two fiscal years for professional services rendered by the principal accountant for tax compliance, tax advice, and tax planning. Registrants shall describe the nature of the services comprising the fees disclosed under this category.
The Trust paid aggregate non-audit fees to Ernst & Young LLP for tax services of $28,430 and $26,447 during the fiscal years ended March 31, 2023 and 2022, respectively.
(d) Disclose, under the caption ALL OTHER FEES, the aggregate fees billed in each of the last two fiscal years for products and services provided by the principal accountant, other than the services reported in paragraphs (a) through (c) of this Item. Registrants shall describe the nature of the services comprising the fees disclosed under this category.
There were no other fees in 2023 or 2022.
(e) (1) Disclose the audit committee’s pre-approval policies and procedures described in paragraph (c)(7) of Rule 2-01 of Regulation S-X.
PIONEER FUNDS
APPROVAL OF AUDIT, AUDIT-RELATED, TAX AND OTHER SERVICES
PROVIDED BY THE INDEPENDENT AUDITOR
SECTION I - POLICY PURPOSE AND APPLICABILITY
The Pioneer Funds recognize the importance of maintaining the independence of their outside auditors. Maintaining independence is a shared responsibility involving Amundi Asset Management US, Inc., the audit committee and the independent auditors.
The Funds recognize that a Fund’s independent auditors: 1) possess knowledge of the Funds, 2) are able to incorporate certain services into the scope of the audit, thereby avoiding redundant work, cost and disruption of Fund personnel and processes, and 3) have expertise that has value to the Funds. As a result, there are situations where it is desirable to use the Fund’s independent auditors for services in addition to the annual audit and where the potential for conflicts of interests are minimal. Consequently, this policy, which is intended to comply with Rule 210.2-01(C)(7), sets forth guidelines and procedures to be followed by the Funds when retaining the independent audit firm to perform audit, audit-related tax and other services under those circumstances, while also maintaining independence.
Approval of a service in accordance with this policy for a Fund shall also constitute approval for any other Fund whose pre-approval is required pursuant to Rule 210.2-01(c)(7)(ii).
In addition to the procedures set forth in this policy, any non-audit services that may be provided consistently with Rule 210.2-01 may be approved by the Audit Committee itself and any pre-approval that may be waived in accordance with Rule 210.2-01(c)(7)(i)(C) is hereby waived.
Selection of a Fund’s independent auditors and their compensation shall be determined by the Audit Committee and shall not be subject to this policy.
SECTION II - POLICY
| SERVICE CATEGORY |
SERVICE CATEGORY DESCRIPTION |
SPECIFIC PRE-APPROVED SERVICE SUBCATEGORIES | ||
| I. AUDIT SERVICES | Services that are directly related to performing the independent audit of the Funds | • Accounting research assistance
• SEC consultation, registration statements, and reporting
• Tax accrual related matters
• Implementation of new accounting standards
• Compliance letters (e.g. rating agency letters)
• Regulatory reviews and assistance regarding financial matters
• Semi-annual reviews (if requested)
• Comfort letters for closed end offerings | ||
| II. AUDIT-RELATED SERVICES | Services which are not prohibited under Rule
210.2-01(C)(4) (the “Rule”) and are related extensions of the audit services support the audit, or use the knowledge/expertise gained from the audit procedures as a foundation to complete the project. In most cases, if the Audit-Related Services are not performed by the Audit firm, the scope of the Audit Services would likely increase. The Services are typically well-defined and governed by accounting professional standards (AICPA, SEC, etc.) |
• AICPA attest and agreed-upon procedures
• Technology control assessments
• Financial reporting control assessments
• Enterprise security architecture assessment | ||
| AUDIT COMMITTEE APPROVAL POLICY |
AUDIT COMMITTEE REPORTING POLICY | |
| • “One-time” pre-approval for the audit period for all pre-approved specific service subcategories. Approval of the independent auditors as auditors for a Fund shall constitute pre approval for these services. |
• A summary of all such services and related fees reported at each regularly scheduled Audit Committee meeting. | |
| • “One-time” pre-approval for the fund fiscal year within a specified dollar limit for all pre-approved specific service subcategories |
• A summary of all such services and related fees (including comparison to specified dollar limits) reported quarterly. | |
| • Specific approval is needed to exceed the pre-approved dollar limit for these services (see general Audit Committee approval policy below for details on obtaining specific approvals)
• Specific approval is needed to use the Fund’s auditors for Audit-Related Services not denoted as “pre-approved”, or to add a specific service subcategory as “pre-approved” |
|
SECTION III - POLICY DETAIL, CONTINUED
| SERVICE CATEGORY |
SERVICE CATEGORY DESCRIPTION |
SPECIFIC PRE-APPROVED SERVICE SUBCATEGORIES | ||
| III. TAX SERVICES | Services which are not prohibited by the Rule,
if an officer of the Fund determines that using the Fund’s auditor to provide these services creates significant synergy in the form of efficiency, minimized disruption, or the ability to maintain a desired level of confidentiality. |
• Tax planning and support
• Tax controversy assistance
• Tax compliance, tax returns, excise tax returns and support
• Tax opinions |
| AUDIT COMMITTEE APPROVAL POLICY |
AUDIT COMMITTEE REPORTING POLICY | |
| • “One-time” pre-approval for the fund fiscal year within a specified dollar limit |
• A summary of all such services and related fees (including comparison to specified dollar limits) reported quarterly. | |
| • Specific approval is needed to exceed the pre-approved dollar limits for these services (see general Audit Committee approval policy below for details on obtaining specific approvals) |
||
| • Specific approval is needed to use the Fund’s auditors for tax services not denoted as pre-approved, or to add a specific service subcategory as “pre-approved” |
||
SECTION III - POLICY DETAIL, CONTINUED
| SERVICE CATEGORY |
SERVICE CATEGORY DESCRIPTION |
SPECIFIC PRE-APPROVED SERVICE SUBCATEGORIES | ||
| IV. OTHER SERVICES
A. SYNERGISTIC, UNIQUE QUALIFICATIONS |
Services which are not prohibited by the Rule, if an officer of the Fund determines that using the Fund’s auditor to provide these services creates significant synergy in the form of efficiency, minimized disruption, the ability to maintain a desired level of confidentiality, or where the Fund’s auditors posses unique or superior qualifications to provide these services, resulting in superior value and results for the Fund. | • Business Risk Management support
• Other control and regulatory compliance projects |
| AUDIT COMMITTEE APPROVAL POLICY |
AUDIT COMMITTEE REPORTING POLICY | |
| • “One-time” pre-approval for the fund fiscal year within a specified dollar limit
• Specific approval is needed to exceed the pre-approved dollar limits for these services (see general Audit Committee approval policy below for details on obtaining specific approvals)
• Specific approval is needed to use the Fund’s auditors for “Synergistic” or “Unique Qualifications” Other Services not denoted as pre-approved to the left, or to add a specific service subcategory as “pre-approved” |
• A summary of all such services and related fees (including comparison to specified dollar limits) reported quarterly. |
SECTION III - POLICY DETAIL, CONTINUED
| SERVICE CATEGORY |
SERVICE CATEGORY DESCRIPTION |
SPECIFIC PROHIBITED SERVICE SUBCATEGORIES | ||
| PROHIBITED SERVICES | Services which result in the auditors losing independence status under the Rule. | 1. Bookkeeping or other services related to the accounting records or financial statements of the audit client*
2. Financial information systems design and implementation*
3. Appraisal or valuation services, fairness* opinions, or contribution-in-kind reports
4. Actuarial services (i.e., setting actuarial reserves versus actuarial audit work)*
5. Internal audit outsourcing services*
6. Management functions or human resources
7. Broker or dealer, investment advisor, or investment banking services
8. Legal services and expert services unrelated to the audit
9. Any other service that the Public Company Accounting Oversight Board determines, by regulation, is impermissible |
| AUDIT COMMITTEE APPROVAL POLICY |
AUDIT COMMITTEE REPORTING POLICY | |
| • These services are not to be performed with the exception of the(*) services that may be permitted if they would not be subject to audit procedures at the audit client (as defined in rule 2-01(f)(4)) level the firm providing the service. |
• A summary of all services and related fees reported at each regularly scheduled Audit Committee meeting will serve as continual confirmation that has not provided any restricted services. |
GENERAL AUDIT COMMITTEE APPROVAL POLICY:
| • | For all projects, the officers of the Funds and the Fund’s auditors will each make an assessment to determine that any proposed projects will not impair independence. |
| • | Potential services will be classified into the four non-restricted service categories and the “Approval of Audit, Audit-Related, Tax and Other Services” Policy above will be applied. Any services outside the specific pre-approved service subcategories set forth above must be specifically approved by the Audit Committee. |
| • | At least quarterly, the Audit Committee shall review a report summarizing the services by service category, including fees, provided by the Audit firm as set forth in the above policy. |
(2) Disclose the percentage of services described in each of paragraphs (b) through (d) of this Item that were approved by the audit committee pursuant to paragraph (c)(7)(i)(C) of Rule 2-01 of Regulation S-X.
Non-Audit Services
Beginning with non-audit service contracts entered into on or after May 6, 2003, the effective date of the new SEC pre-approval rules, the Trust’s/Fund’s audit committee is required to pre-approve services to affiliates defined by SEC rules to the extent that the services are determined to have a direct impact on the operations or financial reporting of the Trust. For the years ended March 31, 2023 and 2022, there were no services provided to an affiliate that required the Trust’s audit committee pre-approval.
(f) If greater than 50 percent, disclose the percentage of hours expended on the principal accountants engagement to audit the registrant’s financial statements for the most recent fiscal year that were attributed to work performed by persons other than the principal accountant’s full-time, permanent employees.
N/A
(g) Disclose the aggregate non-audit fees billed by the registrants accountant for services rendered to the registrant, and rendered to the registrants investment adviser (not including any sub-adviser whose role is primarily portfolio management and is subcontracted with or overseen by another investment adviser), and any entity controlling, controlled by, or under common control with the adviser that provides ongoing services to the registrant for each of the last two fiscal years of the registrant.
The Trust paid aggregate non-audit fees to Ernst & Young LLP for tax services of $28,430 and $26,447 during the fiscal years ended March 31, 2023 and 2022, respectively.
(h) Disclose whether the registrants audit committee of the Board of Trustees has considered whether the provision of non-audit services that were rendered to the registrants investment adviser (not including any subadviser whose role is primarily portfolio management and is subcontracted with or overseen by another investment adviser), and any entity controlling, controlled by, or under common control with the investment adviser that provides ongoing services to the registrant that were not pre-approved pursuant to paragraph (c)(7)(ii) of Rule 2-01 of Regulation S-X is compatible with maintaining the principal accountant’s independence.
The Fund’s audit committee of the Board of Trustees has considered whether the provision of non-audit services that were rendered to the Affiliates (as defined) that were not pre- approved pursuant to paragraph (c)(7)(ii) of Rule 2-01 of Regulation S-X is compatible with maintaining the principal accountant’s independence.
ITEM 5. AUDIT COMMITTEE OF LISTED REGISTRANTS
(a) If the registrant is a listed issuer as defined in Rule 10A-3 under the Exchange Act (17 CFR 240.10A-3), state whether or not the registrant has a separately-designated standing audit committee established in accordance with Section 3(a)(58)(A) of the Exchange Act (15 U.S.C. 78c(a)(58)(A)). If the registrant has such a committee, however designated, identify each committee member. If the entire board of directors is acting as the registrant’s audit committee as specified in Section 3(a)(58)(B) of the Exchange Act (15 U.S.C. 78c(a)(58)(B)), so state.
N/A
(b) If applicable, provide the disclosure required by Rule 10A-3(d) under the Exchange Act (17 CFR 240.10A-3(d)) regarding an exemption from the listing standards for audit committees.
N/A
ITEM 6. SCHEDULE OF INVESTMENTS.
File Schedule of Investments in securities of unaffiliated issuers as of the close of the reporting period as set forth in 210.1212 of Regulation S-X [17 CFR 210.12-12], unless the schedule is included as part of the report to shareholders filed under Item 1 of this Form.
Included in Item 1
ITEM 7. DISCLOSURE OF PROXY VOTING POLICIES AND PROCEDURES FOR CLOSED-END MANAGEMENT INVESTMENT COMPANIES.
A closed-end management investment company that is filing an annual report on this Form N-CSR must, unless it invests exclusively in non-voting securities, describe the policies and procedures that it uses to determine how to vote proxies relating to portfolio securities, including the procedures that the company uses when a vote presents a conflict between the interests of its shareholders, on the one hand, and those of the company’s investment adviser; principal underwriter; or any affiliated person (as defined in Section 2(a)(3) of the Investment Company Act of 1940 (15 U.S.C. 80a-2(a)(3)) and the rules thereunder) of the company, its investment adviser, or its principal underwriter, on the other. Include any policies and procedures of the company’s investment adviser, or any other third party, that the company uses, or that are used on the company’s behalf, to determine how to vote proxies relating to portfolio securities.
Not applicable to open-end management investment companies.
ITEM 8. PORTFOLIO MANAGERS OF CLOSED-END MANAGEMENT INVESTMENT COMPANIES.
(a) If the registrant is a closed-end management investment company that is filing an annual report on this Form N-CSR, provide the following information:
(1) State the name, title, and length of service of the person or persons employed by or associated with the registrant or an investment adviser of the registrant who are primarily responsible for the day-to-day management of the registrant’s portfolio (“Portfolio Manager”). Also state each Portfolio Manager’s business experience during the past 5 years.
Not applicable to open-end management investment companies.
ITEM 9. PURCHASES OF EQUITY SECURITIES BY CLOSED-END MANAGEMENT INVESTMENT COMPANY AND AFFILIATED PURCHASERS.
(a) If the registrant is a closed-end management investment company, in the following tabular format, provide the information specified in paragraph (b) of this Item with respect to any purchase made by or on behalf of the registrant or any affiliated purchaser, as defined in Rule 10b-18(a)(3) under the Exchange Act (17 CFR 240.10b-18(a)(3)), of shares or other units of any class of the registrant’s equity securities that is registered by the registrant pursuant to Section 12 of the Exchange Act (15 U.S.C. 781).
Not applicable to open-end management investment companies.
ITEM 10. SUBMISSION OF MATTERS TO A VOTE OF SECURITY HOLDERS.
Describe any material changes to the procedures by which shareholders may recommend nominees to the registrant’s board of directors, where those changes were implemented after the registrant last provided disclosure in response to the requirements of Item 407(c)(2)(iv) of Regulation S-R(17 CFR 229.407)(as required by Item 22(b)(15)) of Schedule 14A (17 CFR 240.14a-101), or this Item.
There have been no material changes to the procedures by which the shareholders may recommend nominees to the registrant’s board of directors since the registrant last provided disclosure in response to the requirements of Item 407(c)(2)(iv) of Regulation S-R of Schedule 14(A) in its definitive proxy statement, or this item.
ITEM 11. CONTROLS AND PROCEDURES.
(a) Disclose the conclusions of the registrant’s principal executive and principal financials officers, or persons performing similar functions, regarding the effectiveness of the registrant’s disclosure controls and procedures (as defined in Rule 30a-3(c) under the Act (17 CFR 270.30a-3(c))) as of a date within 90 days of the filing date of the report that includes the disclosure required by this paragraph, based on the evaluation of these controls and procedures required by Rule 30a-3(b) under the Act (17 CFR 270.30(a)-3(b) and Rules 13a-15(b) or 15d-15(b) under the Exchange Act (17 CFR 240.13a-15(b) or 240.15d-15(b)).
The registrant’s principal executive officer and principal financial officer have concluded that the registrant’s disclosure controls and procedures are effective based on the evaluation of these controls and procedures as of a date within 90 days of the filing date of this report.
(b) Disclose any change in the registrant’s internal control over financial reporting (as defined in Rule 30a-3(d) under the Act (17CFR 270.30a-3(d)) that occurred during the period covered by this report that has materially affected, or is reasonably likely to materially affect, the registrant’s internal control over financial reporting.
There were no significant changes in the registrant’s internal control over financial reporting that occurred during the period covered by this report that have materially affected, or are reasonably likely to materially affect, the registrant’s internal control over financial reporting.
Item 12. Disclosure of Securities Lending Activities for Closed-End Management Investment Companies.
(a) If the registrant is a closed-end management investment company, provide the following dollar amounts of income and compensation related to the securities lending activities of the registrant during its most recent fiscal year:
N/A
(1) Gross income from securities lending activities;
N/A
(2) All fees and/or compensation for each of the following securities lending activities and related services: any share of revenue generated by the securities lending program paid to the securities lending agent(s) (revenue split); fees paid for cash collateral management services (including fees deducted from a pooled cash collateral reinvestment vehicle) that are not included in the revenue split; administrative fees that are not included in the revenue split; fees for indemnification that are not included in the revenue split; rebates paid to borrowers; and any other fees relating to the securities lending program that are not included in the revenue split, including a description of those other fees;
N/A
(3) The aggregate fees/compensation disclosed pursuant to paragraph (2); and
N/A
(4) Net income from securities lending activities (i.e., the dollar amount in paragraph (1) minus the dollar amount in paragraph (3)).
If a fee for a service is included in the revenue split, state that the fee is included in the revenue split.
N/A
(b) If the registrant is a closed-end management investment company, describe the services provided to the registrant by the securities lending agent in the registrants most recent fiscal year.
N/A
ITEM 13. EXHIBITS.
(a) File the exhibits listed below as part of this Form. Letter or number the exhibits in the sequence indicated.
SIGNATURES
[See General Instruction F]
Pursuant to the requirements of the Securities Exchange Act of 1934 and the Investment Company Act of 1940, the registrant has duly caused this report to be signed on its behalf by the undersigned, thereunto duly authorized.
(Registrant) Pioneer Series Trust X
By (Signature and Title)* /s/ Lisa M. Jones
Lisa M. Jones, President and Chief Executive Officer
Date June 5, 2023
Pursuant to the requirements of the Securities Exchange Act of 1934 and the Investment Company Act of 1940, this report has been signed below by the following persons on behalf of the registrant and in the capacities and on the dates indicated.
By (Signature and Title)* /s/ Lisa M. Jones
Lisa M. Jones, President and Chief Executive Officer
Date June 5, 2023
By (Signature and Title)* /s/ Anthony J. Koenig, Jr.
Anthony J. Koenig, Jr., Managing Director, Chief Operations Officer & Treasurer of the Funds
Date June 5, 2023
* Print the name and title of each signing officer under his or her signature.
ATTACHMENTS / EXHIBITS
Create E-mail Alert Related Categories
SEC FilingsSign up for StreetInsider Free!
Receive full access to all new and archived articles, unlimited portfolio tracking, e-mail alerts, custom newswires and RSS feeds - and more!
