

Form N-CSR PFS FUNDS For: Nov 30
 Tweet
Tweet Share
ShareUNITED STATES
SECURITIES AND EXCHANGE COMMISSION
WASHINGTON, D.C. 20549
| FORM N-CSR |
CERTIFIED SHAREHOLDER REPORT OF REGISTERED MANAGEMENT
INVESTMENT COMPANIES
Investment Company Act file number 811-09781
PFS Funds
(Exact name of registrant as specified in charter)
1939 Friendship Drive, Suite C, El Cajon, CA 92020
(Address of principal executive offices) (Zip code)
CT Corporation System
155 Federal St., Suite 700, Boston, MA 02110
(Name and address of agent for service)
Registrant’s telephone number, including area code: (619) 588-9700
Date of fiscal year end: November 30
Date of reporting period: November 30, 2022
Item 1. Report to Stockholders.
|
ANNUAL REPORT
|
| Taylor Frigon Core Growth Fund Annual Report November 30, 2022 (Unaudited) |
For the year ended November 30, 2022, the Taylor Frigon Core Growth Fund (the “Fund”) underperformed the S&P Mid Cap 400® Index, S&P Small Cap 600 Index and the S&P 500® Index (the “S&P 500”). The Fund returned (46.51)% whereas its primary benchmark, the S&P Mid Cap 400® Index, returned (3.29)% . The economic and market uncertainty caused by high inflation and unprecedented interest rate hikes hit the Fund—which is primarily made up of early-stage, high growth companies—particularly hard, resulting in “underperformance” versus its benchmark for the period.
Performance of the Fund for the period was mixed between a variety of different sectors and industries. The top performing company came from the information technology space, Impinj, Inc., a company that develops radio-frequency identification (RFID) hardware and software to enable Internet of Things solutions for its customers. The worst performer came from the industrial machinery space, Kornit Digital Ltd., a company that produces digital printers for on-demand garment manufacturing. Other top performers for the year include NAPCO Security Technologies, a leading security solutions provider, Tower Semiconductor Ltd., the leading foundry of analog semiconductor solutions, QuickLogic Corp., a fabless semiconductor manufacturer, and PROCEPT BioRobotics Corp., a medical device company that has developed an innovative Aquablation procedure to treat prostate enlargement. Tower Semiconductor was the third best performing company in the Fund for the period, but we sold out of our position on February 15 after the company announced it would be acquired by Intel. The Fund’s weakest performers were similarly diversified. They include Grid Dynamics Holdings, Inc., a leading digital transformation service provider, Silvergate Capital Corp., a bank providing services to the digital asset industry, Carvana Co., an online used car retailer, and Coinbase Global, Inc., which operates the largest cryptocur-rency exchange in the United States.
This mixed performance across a diverse set of industries and spaces may be a result of a market “trading” environment that was marked by the “growth versus value” trade. Those with a more short-term mindset, concerned about sustained higher inflation and the severe actions the U.S. Federal Reserve has taken to combat non-transitory inflation, appear to have cycled out of so-called “growth” companies and sought “safety” by cycling into so-called “value” companies. We see such activity as nonsense and noise. It is our view that solid and innovative companies, over time, tend to do quite well—regardless of inflation or deflation—thus, we pay no attention to these trading games. While it is never our approach to consider such short-term trading in our investment management process, nonetheless, our portfolio can be impacted by these conditions when they are the dominant theme in the minds of traders during a particular period. Our strategy is to focus on the individual businesses in which we are invested, and not concern ourselves with the machinations and whims of the trading environment, but we do think that phenomenon may be partly responsible for some of the price action in our portfolio companies.
As we look forward to 2023, we remain excited that much of the portfolio continues to consist of companies that we believe are very early in their lifecycles with plenty of room for exceptional growth ahead of them. We continue to see the most significant exposure, and thus the most significant opportunities, in the Information Technology and Healthcare Technology areas.
Despite recent “underperformance,” we remain highly convinced that our narrative-based investment approach that seeks to identify the underlying trends that will drive economic
2022 Annual Report 1
growth in the coming years will continue to prove resilient in the long run. While the market will likely continue to grapple with the impact of an inflationary environment for the foreseeable future, which could prolong the recent heightened volatility and result in further short-term weakness in our portfolio, we generally view such circumstances as opportunities to add to positions whenever possible in order to set ourselves up for a strong move back to the upside.
During this most recent market downturn, we have witnessed the ramifications of what we believe has been an overly loose monetary policy, and the unwinding of this policy may continue to cause further disruption in the near term. This is precisely why the “business-based” approach to investing is a hallmark of the strategy deployed by the Taylor Frigon Core Growth Fund and, we believe, will be the path to future success, especially in times such as we are entering. We will continue to align ourselves with what we believe are well-managed, innovative companies that have the capability to navigate the storms of extreme uncertainty and find their way to fertile fields of future growth.
Thank you for your continued support as a shareholder and we look forward to our next update.
Sincerely,
Gerry Frigon
Portfolio Manager
Past performance does not guarantee future results. The investment return and principal value of an investment in the Fund will fluctuate so that an investors shares, when redeemed, may be worth more or less than their original cost. Current performance may be higher or lower than the performance data quoted. Performance data current to the most recent month end are available by calling 1-888-897-4821.
The Taylor Frigon Core Growth Fund’s prospectus contains important information about the Fund’s investment objectives, potential risks, management fees, charges and expenses, and other information and should be read and considered carefully before investing. You may obtain a current copy of the Fund’s prospectus by calling 1-888-897-4821. Distributed by Arbor Court Capital, LLC.
2022 Annual Report 2
Taylor Frigon Core Growth Fund (Unaudited)

PERFORMANCE INFORMATION
November 30, 2022 NAV $14.70
Average Annual Total Returns for the Periods ended November 30, 2022
| Since | ||||||||
| 1 Year(A) | 3 Years(A) | 5 Years(A) | Inception(A) | |||||
| Taylor Frigon Core Growth Fund | (46.51)% | 3.46% | 7.56% | 10.10% | ||||
| S&P Mid Cap 400® Index (B) | (3.29)% | 10.30% | 7.98% | 9.19% | ||||
| S&P 500® Index (C) | (9.21)% | 10.91% | 10.98% | 14.43% |
Annual Fund Operating Expense Ratio (from 3/30/2022 Prospectus): 1.45%
The Fund’s expense ratio for the fiscal year ended November 30, 2022 can be found in the financial highlights included within this report.
(A) 1 Year, 3 Years, 5 Years and Since Inception returns include change in share prices and in each case includes reinvestment of any dividends and capital gain distributions. The Taylor Frigon Core Growth Fund commenced operations on December 27, 2016.
(B) The S&P Mid Cap 400® Index measures the performance of the midcapitalization segment of the U.S. equity universe. The Index is a capitalization weighted index composed of 400 domestic common stocks.
(C) The S&P 500® Index is a widely recognized unmanaged index of equity prices and is representative of a broader market and range of securities than is found in the Fund’s portfolio. The Index is an unmanaged benchmark that assumes reinvestment of all distributions and excludes the effect of taxes and fees.
PAST PERFORMANCE DOES NOT GUARANTEE FUTURE RESULTS. INVESTMENT RETURN AND PRINCIPAL VALUE WILL FLUCTUATE SO THAT SHARES, WHEN REDEEMED, MAY BE WORTH MORE OR LESS THAN THEIR ORIGINAL COST. RETURNS DO NOT REFLECT THE DEDUCTION OF TAXES THAT A SHAREHOLDER WOULD PAY ON FUND DISTRIBUTIONS OR THE REDEMPTION OF FUND SHARES. CURRENT PERFORMANCE MAY BE LOWER OR HIGHER THAN THE PERFORMANCE DATA QUOTED. TO OBTAIN PERFORMANCE DATA CURRENT TO THE MOST RECENT MONTH END, PLEASE CALL 1-888-897-4821. AN INVESTMENT IN THE FUND IS SUBJECT TO INVESTMENT RISKS, INCLUDING THE POSSIBLE LOSS OF THE PRINCIPAL AMOUNT INVESTED. THE FUND'S DISTRIBUTOR IS ARBOR COURT CAPITAL, LLC.
2022 Annual Report 3
Taylor Frigon Core Growth Fund (Unaudited)
| Taylor Frigon Core Growth Fund by Sectors (as a percentage of Net Assets) November 30, 2022 |
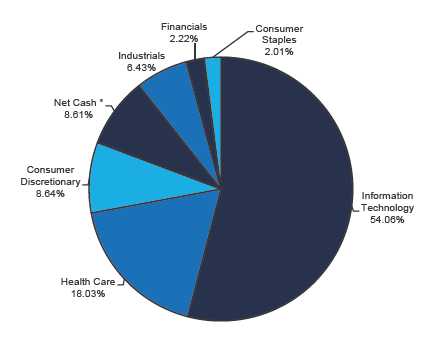
* Net Cash represents cash and other assets in excess of liabilities.
Availability of Quarterly Schedule of Investments
The Fund publicly files its complete schedule of portfolio holdings with the Securities and Exchange Commission (“SEC”) for the first and third quarters of each fiscal year on Form N-PORT. The Fund’s Form N-PORT is available on the SEC’s website at http://www.sec.gov.
| Proxy Voting Guidelines |
Taylor Frigon Capital Management, LLC, the Fund’s investment adviser (“Adviser”), is responsible for exercising the voting rights associated with the securities held by the Fund. A description of the policies and procedures used by the Adviser in fulfilling this responsibility is available without charge on the Fund’s website at www.taylorfrigonfunds.com. It is also included in the Fund’s Statement of Additional Information, which is available on the SEC’s website at http://www.sec.gov.
Information regarding how the Fund voted proxies, Form N-PX, relating to portfolio securities during the most recent period ended June 30th, is available without charge, upon request, by calling our toll free number (1-888-897-4821). This information is also available on the SEC’s website at http://www.sec.gov.
2022 Annual Report 4
| Expense Example (Unaudited) |
Shareholders of this Fund incur ongoing costs consisting of management and service fees. Although the Fund charges no sales loads or transaction fees, you will be assessed fees for outgoing wire transfers, returned checks and stop payment orders at prevailing rates charged by Mutual Shareholder Services, LLC, the Fund’s transfer agent. IRA accounts will be charged an $8.00 annual maintenance fee. If shares are redeemed within 90 days or less of purchase from the Fund, the shares are subject to a 2% redemption fee. Additionally, your account will be indirectly subject to the expenses of any underlying funds. The following example is intended to help you understand your ongoing costs of investing in the Fund and to compare these costs with similar costs of investing in other mutual funds. The example is based on an investment of $1,000 invested in the Fund on June 1, 2022 and held through November 30, 2022.
| Actual Expenses |
The first line of the table below provides information about actual account values and actual expenses. In order to estimate the expenses a shareholder paid during the period covered by this report, shareholders can divide their account value by $1,000 (for example, an $8,600 account value divided by $1,000 = 8.6) and then multiply the result by the number in the first line under the heading entitled “Expenses Paid During the Period.”
Hypothetical Example for Comparison Purposes
The second line of the table below provides information about hypothetical account values and hypothetical expenses based on the Fund’s actual expense ratio and an assumed rate of return of 5% per year before expenses, which is not the Fund’s actual return. The hypothetical account values and expenses may not be used to estimate the actual ending account balance or expenses paid by a shareholder for the period. Shareholders may use this information to compare the ongoing costs of investing in this Fund and other funds. To do so, compare this 5% hypothetical example with the 5% hypothetical examples that appear in other funds’ shareholder reports.
Please note that the expenses shown in the table are meant to highlight your ongoing costs only and do not reflect any transactional costs, such as redemption fees or the charges assessed by Mutual Shareholder Services, LLC as described above and expenses of any underlying funds. Therefore, the second line of the table is useful in comparing ongoing costs only, and will not help you determine the relative total costs of owning different funds. In addition, if these transactional costs were included, your costs would have been higher.
| Expenses Paid | ||||||
| Beginning | Ending | During the Period* | ||||
| Account Value | Account Value | June 1, 2022 to | ||||
| June 1, 2022 | November 30, 2022 | November 30, 2022 | ||||
| Actual | $1,000.00 | $919.90 | $6.98 | |||
| Hypothetical | $1,000.00 | $1,017.80 | $7.33 | |||
| (5% annual return | ||||||
| before expenses) | ||||||
| * | Expenses are equal to the Fund’s annualized expense ratio of 1.45%, multiplied by the average account value over the period, multiplied by 183/365 (to reflect the one-half year period). |
2022 Annual Report 5
| Taylor Frigon Core Growth Fund | ||||
| Schedule of Investments | ||||
| November 30, 2022 | ||||
| Shares | Fair Value | % of Net Assets | ||
| COMMON STOCKS | ||||
| Biological Products (No Diagnostic Substances) | ||||
| 279,212 Compugen Ltd. * (Israel) | $ | 335,054 | 1.00 | % |
| Communications Equipment, NEC | ||||
| 60,153 Napco Security Technologies, Inc. * | 1,586,836 | 4.76 | % | |
| Computer Storage Devices | ||||
| 41,581 Pure Storage, Inc. - Class A * | 1,213,749 | 3.64 | % | |
| Electromedical & Electrotherapeutic Apparatus | ||||
| 24,332 InMode Ltd. * (Israel) | 934,106 | 2.80 | % | |
| Electronic Components, NEC | ||||
| 9,415 Impinj, Inc. * | 1,200,883 | 3.60 | % | |
| Finance Services | ||||
| 9,031 Coinbase Global, Inc. - Class A * | 412,988 | 1.24 | % | |
| Food and Kindred Products | ||||
| 93,707 Real Good Food Company, Inc. - Class A * | 670,005 | 2.01 | % | |
| In Vitro & In Vivo Diagnostic Substances | ||||
| 1,593 IDEXX Laboratories, Inc. * | 678,411 | 2.03 | % | |
| IT Services | ||||
| 5,080 CloudFlare, Inc. - Class A * | 249,631 | |||
| 76,132 Grid Dynamics Holdings, Inc. - Class A * | 969,922 | |||
| 2,432 MongoDB, Inc. - Class A * | 371,342 | |||
| 4,773 NICE Ltd. * ** | 926,774 | |||
| 5,945 Twilio Inc. - Class A * | 291,424 | |||
| 2,809,093 | 8.42 | % | ||
| Orthopedic, Prosthetic & Surgical Appliances & Supplies | ||||
| 5,796 Edwards Lifesciences Corporation * | 447,741 | 1.34 | % | |
| Printed Circuit Boards | ||||
| 215,903 Nano Dimension Ltd. * ** | 533,280 | 1.60 | % | |
| Printing Trades Machinery & Equipment | ||||
| 24,844 Kornit Digital Ltd. * (Israel) | 637,000 | 1.91 | % | |
| Radio & TV Broadcasting & Communications Equipment | ||||
| 71,155 Vuzix Corporation * | 296,716 | 0.89 | % | |
| Retail - Auto Dealers & Gasoline Stations | ||||
| 13,764 Carvana Co. - Class A * | 106,120 | 0.32 | % | |
| Retail - Eating & Drinking Places | ||||
| 23,000 Dutch Bros Inc. - Class A * | 868,020 | 2.60 | % | |
| Retail - Shoe Stores | ||||
| 17,899 Boot Barn Holdings, Inc. * | 1,205,498 | 3.61 | % | |
| Semiconductors & Related Devices | ||||
| 2,653 Monolithic Power Systems, Inc. | 1,013,340 | |||
| 169,289 QuickLogic Corporation * | 1,047,899 | |||
| 2,061,239 | 6.18 | % | ||
| Services - Business Services, NEC | ||||
| 11,622 Fiverr International Ltd. * (Israel) | 408,746 | |||
| 62,819 Repay Holdings Corporation - Class A * | 556,576 | |||
| 965,322 | 2.89 | % | ||
| Services - Computer Integrated Systems Design | ||||
| 33,836 Ebix, Inc. | 642,546 | 1.93 | % | |
| Services - Computer Programming Services | ||||
| 2,605 EPAM Systems, Inc. * | 960,151 | 2.88 | % | |
| Services - Computer Programming, Data Processing, Etc. | ||||
| 8,458 Wix.com Ltd. * (Israel) | 765,364 | 2.29 | % | |
| * Non-Income Producing Security. ** ADR - American Depositary Receipt. The accompanying notes are an integral part of these financial statements. |
2022 Annual Report 6
| Taylor Frigon Core Growth Fund | |||||
| Schedule of Investments | |||||
| November 30, 2022 | |||||
| Shares | Fair Value | % of Net Assets | |||
| COMMON STOCKS | |||||
| Services - Help Supply Services | |||||
| 12,438 TTEC Holdings, Inc. | $ | 596,402 | 1.79 | % | |
| Services - Miscellaneous Business Services | |||||
| 8,325 NV5 Global, Inc. * | 1,203,046 | 3.61 | % | ||
| Services - Prepackaged Software | |||||
| 12,115 Alteryx, Inc. - Class A * | 543,358 | ||||
| 5,243 Bill.com Holdings, Inc. * | 631,362 | ||||
| 7,176 Coupa Software Incorporated * | 453,810 | ||||
| 8,104 CyberArk Software Ltd. * (Israel) | 1,208,063 | ||||
| 14,687 Procore Technologies, Inc. * | 719,222 | ||||
| 74,016 Zuora, Inc. - Class A * | 568,443 | ||||
| 4,124,258 | 12.36 | % | |||
| Special Industry Machinery, NEC | |||||
| 149,955 Velo3D, Inc. * | 304,409 | 0.91 | % | ||
| State Commercial Banks | |||||
| 11,895 Silvergate Capital Corporation - Class A * | 326,280 | 0.98 | % | ||
| Surgical & Medical Instruments & Apparatus | |||||
| 123,214 Apyx Medical Corporation * | 216,857 | ||||
| 27,569 Brainsway Ltd. * ** | 52,243 | ||||
| 37,078 ClearPoint Neuro, Inc. * | 349,646 | ||||
| 19,252 Glaukos Corporation * | 896,566 | ||||
| 11,057 NovoCure Limited (Jersey) * | 849,620 | ||||
| 18,357 PROCEPT BioRobotics Corporation | 787,515 | ||||
| 156,781 Vapotherm, Inc. * | 139,535 | ||||
| 3,291,982 | 9.87 | % | |||
| Telephone & Telegraph Apparatus | |||||
| 105,838 Akoustis Technologies, Inc. * | 402,184 | ||||
| 30,189 AudioCodes Ltd. (Israel) | 579,629 | ||||
| 981,813 | 2.94 | % | |||
| X-Ray Apparatus & Tubes & Related Irradiation Apparatus | |||||
| 31,053 Nano-X Imaging Ltd. (Israel) * | 330,714 | 0.99 | % | ||
| Total for Common Stocks (Cost $34,161,738) | 30,489,026 | 91.39 | % | ||
| Total Investment Securities | 30,489,026 | ||||
| (Cost $34,161,738) | |||||
| Other Assets in Excess of Liabilities | 2,872,215 | 8.61 | % | ||
| Net Assets | $ | 33,361,241 | 100.00 | % | |
| * Non-Income Producing Security. ** ADR - American Depositary Receipt. The accompanying notes are an integral part of these financial statements. |
2022 Annual Report 7
| Taylor Frigon Core Growth Fund | ||||
| Statement of Assets and Liabilities | ||||
| November 30, 2022 | ||||
| Assets: | ||||
| Investment Securities at Fair Value | $ | 30,489,026 | ||
| (Cost $34,161,738) | ||||
| Cash | 2,818,753 | |||
| Receivable for Shareholder Purchases | 103,093 | |||
| Total Assets | 33,410,872 | |||
| Liabilities: | ||||
| Payable for Shareholder Redemptions | 10,900 | |||
| Management Fees Payable | 26,654 | |||
| Service Fees Payable | 12,077 | |||
| Total Liabilities | 49,631 | |||
| Net Assets | $ | 33,361,241 | ||
| Net Assets Consist of: | ||||
| Paid In Capital | $ | 38,068,043 | ||
| Accumulated Deficit | (4,706,802 | ) | ||
| Net Assets, for 2,269,725 Shares Outstanding | $ | 33,361,241 | ||
| (Unlimited shares authorized) | ||||
| Net Asset Value and Offering Price Per Share | ||||
| ($33,361,241/2,269,725 shares) | $ | 14.70 | ||
| Redemption Price * ($14.70 x 0.98) (Note 2) | $ | 14.41 | ||
| Statement of Operations | ||||
| For the fiscal year ended November 30, 2022 | ||||
| Investment Income: | ||||
| Dividends (Net of Foreign Withholding Taxes of $6,500) | $ | 33,717 | ||
| Total Investment Income | 33,717 | |||
| Expenses: | ||||
| Management Fees (Note 4) | 407,778 | |||
| Service Fees (Note 4) | 183,500 | |||
| Total Expenses | 591,278 | |||
| Net Investment Income/(Loss) | (557,561 | ) | ||
| Net Realized and Unrealized Gain/(Loss) on Investments: | ||||
| Net Realized Gain/(Loss) on Investments | (500,719 | ) | ||
| Net Change in Unrealized Appreciation/(Depreciation) on Investments | (27,324,607 | ) | ||
| Net Realized and Unrealized Gain/(Loss) on Investments | (27,825,326 | ) | ||
| Net Increase/(Decrease) in Net Assets from Operations | $ | (28,382,887 | ) | |
| * Reflects a 2% redemption fee if shares are redeemed within 90 days or less of purchase. |
| The accompanying notes are an integral part of these financial statements. |
2022 Annual Report 8
| Taylor Frigon Core Growth Fund | ||||||||
| Statements of Changes in Net Assets | ||||||||
| 12/1/2021 | 12/1/2020 | |||||||
| to | to | |||||||
| 11/30/2022 | 11/30/2021 | |||||||
| From Operations: | ||||||||
| Net Investment Income/(Loss) | $ | (557,561 | ) | $ | (753,940 | ) | ||
| Net Realized Gain/(Loss) on Investments | (500,719 | ) | 6,011,030 | |||||
| Net Change in Unrealized Appreciation/(Depreciation) on Investments | (27,324,607 | ) | 5,970,814 | |||||
| Net Increase/(Decrease) in Net Assets from Operations | (28,382,887 | ) | 11,227,904 | |||||
| From Distributions to Shareholders: | (5,473,820 | ) | (2,355,555 | ) | ||||
| From Capital Share Transactions: | ||||||||
| Proceeds From Sale of Shares | 6,393,834 | 11,693,236 | ||||||
| Proceeds From Redemption Fees (Note 2) | 3,403 | 11,139 | ||||||
| Shares Issued on Reinvestment of Dividends | 5,473,354 | 2,355,555 | ||||||
| Cost of Shares Redeemed | (5,508,791 | ) | (6,507,708 | ) | ||||
| Net Increase/(Decrease) from Shareholder Activity | 6,361,800 | 7,552,222 | ||||||
| Net Increase/(Decrease) in Net Assets | (27,494,907 | ) | 16,424,571 | |||||
| Net Assets at Beginning of Year | 60,856,148 | 44,431,577 | ||||||
| Net Assets at End of Year | $ | 33,361,241 | $ | 60,856,148 | ||||
| Share Transactions: | ||||||||
| Issued | 354,515 | 390,505 | ||||||
| Reinvested | 206,230 | 90,390 | ||||||
| Redeemed | (299,459 | ) | (223,445 | ) | ||||
| Net Increase/(Decrease) in Shares | 261,286 | 257,450 | ||||||
| Shares Outstanding Beginning of Year | 2,008,439 | 1,750,989 | ||||||
| Shares Outstanding End of Year | 2,269,725 | 2,008,439 | ||||||
| Financial Highlights | ||||||||||||||||||||
| Selected data for a share outstanding | 12/1/2021 | 12/1/2020 | 12/1/2019 | 12/1/2018 | 12/1/2017 | |||||||||||||||
| throughout the period: | to | to | to | to | to | |||||||||||||||
| 11/30/2022 | 11/30/2021 | 11/30/2020 | 11/30/2019 | 11/30/2018 | ||||||||||||||||
| Net Asset Value - | ||||||||||||||||||||
| Beginning of Year | $ | 30.30 | $ | 25.38 | $ | 15.65 | $ | 13.83 | $ | 12.28 | ||||||||||
| Net Investment Income/(Loss) (a) | (0.25 | ) | (0.40 | ) | (0.25 | ) | (0.18 | ) | (0.17 | ) | ||||||||||
| Net Gain/(Loss) on Securities (b) | ||||||||||||||||||||
| (Realized and Unrealized) | (12.63 | ) | 6.65 | 10.23 | 2.22 | 1.72 | ||||||||||||||
| Total from Investment Operations | (12.88 | ) | 6.25 | 9.98 | 2.04 | 1.55 | ||||||||||||||
| Distributions (From Net Investment Income) | - | - | - | - | - | |||||||||||||||
| Distributions (From Realized Capital Gains) | (2.72 | ) | (1.34 | ) | (0.26 | ) | (0.22 | ) | - | |||||||||||
| Total Distributions | (2.72 | ) | (1.34 | ) | (0.26 | ) | (0.22 | ) | - | |||||||||||
| Proceeds from Redemption Fee (Note 2) | - | + | 0.01 | 0.01 | - | + | - | + | ||||||||||||
| Net Asset Value - | ||||||||||||||||||||
| End of Year | $ | 14.70 | $ | 30.30 | $ | 25.38 | $ | 15.65 | $ | 13.83 | ||||||||||
| Total Return (c) | (46.51 | )% | 25.54 | % | 64.93 | % | 15.43 | % | 12.62 | % | ||||||||||
| Ratios/Supplemental Data | ||||||||||||||||||||
| Net Assets - End of Year (Thousands) | $ | 33,361 | $ | 60,856 | $ | 44,432 | $ | 19,639 | $ | 12,469 | ||||||||||
| Ratio of Expenses to Average Net Assets | 1.45 | % | 1.45 | % | 1.45 | % | 1.45 | % | 1.45 | % | ||||||||||
| Ratio of Net Investment Income/(Loss) to | ||||||||||||||||||||
| Average Net Assets | (1.37 | )% | (1.34 | )% | (1.34 | )% | (1.27 | )% | (1.27 | )% | ||||||||||
| Portfolio Turnover Rate | 27.53 | % | 17.06 | % | 28.92 | % | 14.73 | % | 26.99 | % |
| + Less than $0.005. (a) Per share amounts were calculated using the average shares method. (b) Realized and unrealized gains and losses per share in this caption are balancing amounts necessary to rec- oncile the change in net asset value for the period, and may not reconcile with the aggregate gains and losses in the Statement of Operations due to share transactions for the period. (c) Total return represents the rate that the investor would have earned or lost on an investment in the Fund assuming reinvestment of dividends. Returns do not reflect the deduction of taxes a shareholder would pay on Fund distributions or redemption of Fund shares. |
| The accompanying notes are an integral part of these financial statements. |
2022 Annual Report 9
NOTES TO THE FINANCIAL STATEMENTS
TAYLOR FRIGON CORE GROWTH FUND
November 30, 2022
1.) ORGANIZATION
The Taylor Frigon Core Growth Fund (the “Fund”) was organized as a diversified series of PFS Funds (the “Trust”) on December 7, 2016, and commenced operations on December 27, 2016. The Trust was established under the laws of Massachusetts by an Agreement and Declaration of Trust dated January 13, 2000, which was amended and restated as of January 20, 2011. The Trust is registered as an open-end investment company under the Investment Company Act of 1940, as amended (the “1940 Act”). The Trust may offer an unlimited number of shares of beneficial interest in a number of separate series, each series representing a distinct fund with its own investment objectives and policies. As of November 30, 2022, there were thirteen series authorized by the Trust. The Fund’s objective is to seek long-term capital appreciation. The investment adviser to the Fund is Taylor Frigon Capital Management, LLC (the “Adviser”).
2.) SIGNIFICANT ACCOUNTING POLICIES
The Fund is an investment company and accordingly follows the investment company accounting and reporting guidance of the Financial Accounting Standards Board (“FASB”) Accounting Standards Codification Topic 946 Financial Services - Investment Companies. The financial statements are prepared in conformity with accounting principles generally accepted in the United States of America (“GAAP”). The Fund follows the significant accounting policies described in this section.
SECURITY VALUATION
All investments in securities are recorded at their estimated fair value, as described in Note 3. The Trust’s Board of Trustees (“Board”) has designated the Advisor as “Valuation Designee” pursuant to Rule 2a-5 under the 1940 Act.
SHARE VALUATION
The net asset value (the “NAV”) is generally calculated as of the close of trading on the New York Stock Exchange (the “Exchange”) (normally 4:00 p.m. Eastern time) every day the Exchange is open. The NAV is calculated by taking the total value of the Fund’s assets, subtracting its liabilities, and then dividing by the total number of shares outstanding, rounded to the nearest cent. The offering price and redemption price per share is equal to the net asset value per share, except that shares of the Fund are subject to a redemption fee of 2% if redeemed within 90 days or less of purchase. During the fiscal year ended November 30, 2022, proceeds from redemption fees were $3,403.
FEDERAL INCOME TAXES
The Fund’s policy is to continue to comply with the requirements of the Internal Revenue Code that are applicable to regulated investment companies and to distribute all of its taxable income to shareholders. Therefore, no federal income tax provision is required. It is the Fund’s policy to distribute annually, prior to the end of the calendar year, dividends sufficient to satisfy excise tax requirements of the Internal Revenue Code. This Internal Revenue Code requirement may cause an excess of distributions over the book year-end accumulated income. In addition, it is the Fund’s policy to distribute annually, after the end of the fiscal year, any remaining net investment income and net realized capital gains.
The Fund recognizes the tax benefits of certain tax positions only where the position is “more likely than not” to be sustained assuming examination by tax authorities. Management has analyzed the Fund’s tax positions, and has concluded that no liability for unrecognized tax benefits should be recorded related to uncertain tax positions taken on returns filed for open tax years. The Fund identifies its major tax jurisdictions as U.S. Federal tax authorities; however, the Fund is not aware of any tax positions for which it is reasonably possible that the total amounts of unrecognized tax benefits will change materially in the next twelve months. The Fund recognizes interest and penalties, if any, related to unrecognized tax benefits as income tax expense in the Statement of Operations. During the fiscal year ended November 30, 2022, the Fund did not incur any interest or penalties.
DISTRIBUTIONS TO SHAREHOLDERS
Distributions to shareholders, which are determined in accordance with income tax regulations, are recorded on the ex-dividend date.
The treatment for financial reporting purposes of distributions made to shareholders during the year from net investment income or net realized capital gains may differ from their ultimate treatment for federal income tax purposes. The differences between book and tax basis are caused
2022 Annual Report 10
Notes to the Financial Statements - continued
primarily by differences in the timing of the recognition of certain components of income, expense, or realized capital gain for federal income tax purposes. Where such differences are permanent in nature, they are reclassified in the components of the net assets based on their ultimate characterization for federal income tax purposes. Any such reclassifications will have no effect on net assets, result of operations, or net asset value per share of the Fund.
USE OF ESTIMATES
The financial statements are prepared in accordance with GAAP, which requires management to make estimates and assumptions that affect the reported amounts of assets and liabilities and disclosure of contingent assets and liabilities at the date of the financial statements and the reported amounts of increases and decreases in net assets from operations during the reporting period. Actual results could differ from those estimates.
EXPENSES
Expenses incurred by the Trust that do not relate to a specific fund of the Trust are allocated to the individual funds based on each fund’s relative net assets or another appropriate basis.
OTHER
The Fund records security transactions based on a trade date for financial reporting purposes. Dividend income is recognized on the ex-dividend date, and interest income, if any, is recognized on an accrual basis. The Fund uses the specific identification method in computing gain or loss on the sale of investment securities. Withholding taxes on foreign dividends have been provided for in accordance with the Fund’s understanding of the applicable country’s tax rules and rates.
3.) INVESTMENT SECURITIES VALUATIONS
The Fund utilizes various methods to measure the fair value of its investments on a recurring basis. GAAP establishes a hierarchy that prioritizes inputs to valuation methods. The three levels of inputs are:
Level 1 - Unadjusted quoted prices in active markets for identical assets or liabilities that the Fund has the ability to access.
Level 2 - Observable inputs other than quoted prices in active markets included in level 1 that are observable for the asset or liability, either directly or indirectly. These inputs may include quoted prices for the identical instrument on an inactive market, prices for similar instruments, interest rates, prepayment speeds, credit risk, yield curves, default rates and similar data.
Level 3 - Unobservable inputs for the asset or liability, to the extent relevant observable inputs are not available, representing the Fund’s own assumptions about the assumptions a market participant would use in valuing the asset or liability, and would be based on the best information available.
The availability of observable inputs can vary from security to security and is affected by a wide variety of factors, including, for example, the type of security, whether the security is new and not yet established in the marketplace, the liquidity of markets, and other characteristics particular to the security. To the extent that valuation is based on models or inputs that are less observable or unobservable in the market, the determination of fair value requires more judgment. Accordingly, the degree of judgment exercised in determining fair value is greatest for instruments categorized in level 3.
The inputs used to measure fair value may fall into different levels of the fair value hierarchy. In such cases, for disclosure purposes, the level in the fair value hierarchy within which the fair value measurement falls in its entirety, is determined based on the lowest level input that is significant to the fair value measurement in its entirety.
VALUATION OF FUND ASSETS
A description of the valuation techniques applied to the Fund’s major categories of assets and liabilities measured at fair value on a recurring basis follows.
Equity securities (common stocks, including ADRs). Equity securities generally are valued by using market quotations, but may be valued on the basis of prices furnished by a pricing service when the Valuation Designee believes such prices accurately reflect the fair value of such securities. Securities that are traded on any stock exchange or on the NASDAQ over-the-counter market are generally valued by the pricing service at the last quoted sale price. Lacking a last sale price, an equity security is generally valued by the pricing service at its last bid price. Generally, if the security is traded in an active market and is valued at the last sale price, the security is categorized as a level 1 security, and if an equity security is valued by the pricing service at its last
2022 Annual Report 11
Notes to the Financial Statements - continued
bid, it is generally categorized as a level 2 security. When market quotations are not readily available, when the Valuation Designee determines that the market quotation or the price provided by the pricing service does not accurately reflect the current fair value, or when restricted securities are being valued, such securities are valued as determined in good faith by the Valuation Designee, subject to review of the Board and are categorized in level 2 or level 3, when appropriate.
In accordance with the Trust’s good faith pricing guidelines, the Valuation Designee is required to consider all appropriate factors relevant to the value of securities for which it has determined other pricing sources are not available or reliable as described above. There is no standard procedure for determining fair value, since fair value depends upon the circumstances of each individual case. As a general principle, the current fair value of an issue of securities being valued by the Valuation Designee would appear to be the amount which the owner might reasonably expect to receive for them upon their current sale. Methods which are in accordance with this principle may, for example, be based on (i) a multiple of earnings; (ii) a discount from market of a similar freely traded security (including a derivative security or a basket of securities traded on other markets, exchanges or among dealers); or (iii) yield to maturity with respect to debt issues, or a combination of these and other methods. The Board maintains responsibilities for the fair value determinations under Rule 2a-5 under the Investment Company Act of 1940 and oversees the Valuation Designee.
The following table summarizes the inputs used to value the Fund’s assets measured at fair value as of November 30, 2022:
| Valuation Inputs of Assets | Level 1 | Level 2 | Level 3 | Total | ||||
| Common Stocks | $30,489,026 | $0 | $0 | $30,489,026 |
The Fund did not hold any Level 3 assets during the fiscal year ended November 30, 2022.
The Fund did not invest in derivative instruments during the fiscal year ended November 30, 2022.
4.) INVESTMENT ADVISORY AGREEMENT
The Fund has entered into an investment advisory agreement (“Management Agreement”) with the Adviser. The Adviser manages the investment portfolio of the Fund, subject to policies adopted by the Trust’s Board of Trustees. Under the Management Agreement, the Adviser, at its own expense and without reimbursement from the Trust, furnishes office space and all necessary office facilities, equipment, and executive personnel necessary for managing the Fund and pays the operating expenses of the Fund excluding management fees, brokerage fees and commissions, taxes, borrowing costs (such as (a) interest and (b) dividend expenses on securities sold short), ADR fees, fees and expenses of acquired funds, fees pursuant to Rule 12b-1 distribution plans, and extraordinary or non-recurring expenses. For its services, the Adviser receives an investment management fee equal to 1.00% of the average daily net assets of the Fund.
As a result of the above calculation, for the fiscal year ended November 30, 2022, the Adviser earned management fees totaling $407,778. At November 30, 2022, the Fund owed the Adviser management fees of $26,654.
Additionally, the Fund has a Services Agreement with the Adviser (the “Services Agreement”). Under the Services Agreement the Adviser receives an additional fee of 0.45% of the average daily net assets up to $100 million, and 0.25% of such assets in excess of $100 million and is obligated to pay the operating expenses of the Fund excluding management fees, brokerage fees and commissions, 12b-1 fees (if any), taxes, borrowing costs (such as (a) interest and (b) dividend expenses on securities sold short), ADR fees, the cost of acquired funds and extraordinary expenses.
For the fiscal year ended November 30, 2022, the Adviser earned services fees of $183,500. At November 30, 2022, the Fund owed the Adviser services fees of $12,077.
5.) RELATED PARTY TRANSACTIONS
Jeffrey R. Provence of Premier Fund Solutions, Inc. (the “Administrator”) also serves as trustee/officer of the Fund. Mr. J. Provence, as an owner of the Administrator, receives benefits from the administration fees paid by the Adviser.
The Trustees who are not interested persons of the Fund were paid a total of $3,750, in Trustees’ fees for their services to the Fund for the fiscal year ended November 30, 2022. These fees were paid by the Adviser.
2022 Annual Report 12
Notes to the Financial Statements - continued
6.) PURCHASES AND SALES OF SECURITIES
For the fiscal year ended November 30, 2022, purchases and sales of investment securities other than short-term investments and U.S. Government obligations aggregated $11,143,205 and $11,259,403, respectively.
7.) CONTROL OWNERSHIP
The beneficial ownership, either directly or indirectly, of more than 25% of the voting securities of a fund creates a presumption of control of that fund, under Section 2(a)(9) of the 1940 Act. As of November 30, 2022, Charles Schwab & Co., Inc. (“Schwab”), for the benefit of its customers, held, in aggregate, 81.10% of the shares in the Fund. The Trust does not know whether any underlying accounts held at Schwab, owned or controlled 25% or more of the voting securities of the Fund.
8.) TAX MATTERS
For Federal income tax purposes, the cost of securities owned at November 30, 2022 was $34,208,619. At November 30, 2022, the composition of unrealized appreciation (the excess of value over tax cost) and depreciation (the excess of tax cost over value) on a tax basis was as follows:
| Appreciation | (Depreciation) | Net Appreciation/(Depreciation) | |||||
| $8,763,190 | ($12,482,783) | ($3,719,593) |
The tax character of distributions was as follows:
| Fiscal Year Ended | Fiscal Year Ended | |||||
| November 30, 2022 | November 30, 2021 | |||||
| Ordinary Income | $ -0- | $ -0- | ||||
| Long-term Capital Gain | 5,473,820 | 2,355,555 | ||||
| $ 5,473,820 | $ 2,355,555 |
As of November 30, 2022, the components of distributable earnings (accumulated losses) on a tax basis were as follows:
| Other Accumulated Losses | $ (987,209 | ) | |
| Unrealized Depreciation on Investments - Net | (3,719,593 | ) | |
| $ (4,706,802 | ) |
As of November 30, 2022, the difference between book and tax basis unrealized appreciation was attributed to the tax treatment of passive foreign investment companies (“PFICs”) and the deferral of wash sales. Under current tax law, late-year ordinary losses incurred after December 31 of a Fund’s fiscal year may be deferred and treated as occurring on the first business day of the following fiscal year for tax purposes. As of November 30, 2022, other accumulated losses included deferred late year ordinary losses of $486,490, and an available unused short-term capital loss carryforward of $500,719 with no expiration.
For the fiscal year ended November 30, 2022, the following reclassification was primarily attributed to the reclassification of net operating loss.
| Paid in Capital | $(644,478 | ) | |
| Total Distributable Earnings | 644,478 |
9.) CONCENTRATION OF SECTOR RISK
If a Fund has significant investments in the securities of issuers in industries within a particular sector, any development affecting that sector will have a greater impact on the value of the net assets of the Fund than would be the case if the Fund did not have significant investments in that sector. In addition, this may increase the risk of loss of an investment in the Fund and increase the volatility of the Fund’s NAV per share. From time to time, circumstances may affect a particular sector and the companies within such sector. For instance, economic or market factors, regulation or deregulation, and technological or other developments may negatively impact all companies in a particular sector and therefore the value of a Fund’s portfolio will be adversely affected. As of November 30, 2022, the Fund had 54.06% of the value of its net assets invested in stocks within the Information Technology sector.
10.) CASH – CONCENTRATION IN UNINSURED ACCOUNT
For cash management purposes, the Fund may concentrate cash with the Fund’s custodian. This may result in cash balances exceeding the Federal Deposit Insurance Corporation (“FDIC”) insurance limits. As of November 30, 2022, the Fund held $2,818,753 in cash at US Bank, N. A., exceeding the FDIC insurance limit of $250,000.
2022 Annual Report 13
Notes to the Financial Statements - continued
11.) COVID-19 RISKS
Unexpected local, regional or global events, such as war; acts of terrorism; financial, political or social disruptions; natural, environmental or man-made disasters; the spread of infectious illnesses or other public health issues; and recessions and depressions could have a significant impact on the Fund and its investments and may impair market liquidity. Such events can cause investor fear, which can adversely affect the economies of nations, regions and the market in general, in ways that cannot necessarily be foreseen. The impact of COVID-19 has adversely affected, and other infectious illness outbreaks that may arise in the future could adversely affect, the economies of many nations and the entire global economy, individual issuers and capital markets in ways that cannot necessarily be foreseen. Public health crises caused by the COVID-19 outbreak may exacerbate other pre-existing political, social and economic risks in certain countries or globally. The duration of the COVID-19 outbreak and its effects cannot be determined with certainty.
12.) SUBSEQUENT EVENTS
Management has evaluated subsequent events through the date of issuance of these financial statements and has noted no such events.
2022 Annual Report 14
REPORT OF INDEPENDENT REGISTERED PUBLIC ACCOUNTING FIRM
To the Shareholders of Taylor Frigon Core Growth Fund and
Board of Trustees of PFS Funds
Opinion on the Financial Statements
We have audited the accompanying statement of assets and liabilities, including the schedule of investments, of Taylor Frigon Core Growth Fund (the “Fund”), a series of PFS Funds, as of November 30, 2022, the related statement of operations for the year then ended, the statements of changes in net assets for each of the two years in the period then ended, the related notes, and the financial highlights for each of the five years in the period then ended (collectively referred to as the “financial statements”). In our opinion, the financial statements present fairly, in all material respects, the financial position of the Fund as of November 30, 2022, the results of its operations for the year then ended, the changes in net assets for each of the two years in the period then ended, and the financial highlights for each of the five years in the period then ended, in conformity with accounting principles generally accepted in the United States of America.
Basis for Opinion
These financial statements are the responsibility of the Fund’s management. Our responsibility is to express an opinion on the Fund’s financial statements based on our audits. We are a public accounting firm registered with the Public Company Accounting Oversight Board (United States) (“PCAOB”) and are required to be independent with respect to the Fund in accordance with the U.S. federal securities laws and the applicable rules and regulations of the Securities and Exchange Commission and the PCAOB.
We conducted our audits in accordance with the standards of the PCAOB. Those standards require that we plan and perform the audit to obtain reasonable assurance about whether the financial statements are free of material misstatement whether due to error or fraud.
Our audits included performing procedures to assess the risks of material misstatement of the financial statements, whether due to error or fraud, and performing procedures that respond to those risks. Such procedures included examining, on a test basis, evidence regarding the amounts and disclosures in the financial statements. Our procedures included confirmation of securities owned as of November 30, 2022, by correspondence with the custodian. Our audits also included evaluating the accounting principles used and significant estimates made by management, as well as evaluating the overall presentation of the financial statements. We believe that our audits provide a reasonable basis for our opinion.
We have served as the Fund’s auditor since 2016.
COHEN & COMPANY, LTD.
Milwaukee, Wisconsin
January 25, 2023
2022 Annual Report 15
| ADDITIONAL INFORMATION November 30, 2022 (Unaudited) |
1.) PROXY VOTING RESULTS
On September 7, 2022, a special meeting of the shareholders of the Trust was held at the offices of Mutual Shareholder Services, LLC, 8000 Town Centre Drive, Suite 400, Broadview Heights, Ohio 44147 for the following purpose: 1. To elect the proposed individuals to the Board of Trustees.
Below are the voting results from the special meeting, at which each Trustee listed below was elected:
| For | Withheld | ||
| 1) Allen C. Brown | 39,902,214 | 830,243 | |
| 2) Robert L. Boerner | 40,020,838 | 711,621 | |
| 3) John W. Czechowicz | 40,028,062 | 704,397 |
2022 Annual Report 16
| Trustees and Officers (Unaudited) |
The Board of Trustees supervises the business activities of the Trust. The names of the Trustees and executive officers of the Trust are shown below. For more information regarding the Trustees, please refer to the Statement of Additional Information, which is available upon request by calling 1-888-897-4821. Each Trustee serves until the Trustee sooner dies, resigns, retires, or is removed.
The Trustees and Officers of the Trust and their principal business activities during the past five years are:
Interested Trustees and Officers
| Number of | |||||
| Principal | Portfolios In | Other | |||
| Name, | Position(s) | Term of Office | Occupation(s) | Fund | Directorships |
| Address(1), | Held With | and Length of | During | Complex | Held By |
| and Year of Birth | the Trust | Time Served | Past 5 Years | Overseen By | Trustee |
| Trustee | |||||
| Ross C. Provence, | President | Indefinite Term; | General Partner and Portfolio | N/A | N/A |
| Year of Birth: 1938 | Since 2000 | Manager for Value Trend Capital | |||
| Management, LP (1995 to current). | |||||
| Estate planning attorney (1963 to | |||||
| current). | |||||
| Jeffrey R. Provence(2), | Trustee, | Indefinite Term; | CEO, Premier Fund Solutions, Inc. | 13 | Blue Chip |
| Year of Birth: 1969 | Secretary | Since 2000 | (2001 to current). General Partner | Investor Funds, | |
| and | and Portfolio Manager for Value | Meeder Funds | |||
| Treasurer | Trend Capital Management, LP | ||||
| (1995 to current). | |||||
| Julian G. Winters, | Chief | Indefinite Term; | Managing Member, Watermark | N/A | N/A |
| Year of Birth: 1968 | Compliance | Since 2010 | Solutions LLC (investment compli- | ||
| Officer | ance and consulting) (2007 to cur- | ||||
| rent). | |||||
| (1) The address of each trustee and officer is c/o PFS Funds, 1939 Friendship Drive, Suite C, El Cajon, California 92020. (2) Jeffrey R. Provence is considered an “interested person” as defined in Section 2(a)(19) of the Investment Company Act of 1940 by virtue of his position with the Trust. |
Independent Trustees
| Number of | |||||
| Principal | Portfolios In | Other | |||
| Name, | Position | Term of Office | Occupation(s) | Fund | Directorships |
| Address(1), | Held With | and Length of | During | Complex | Held By |
| and Year of Birth | the Trust | Time Served | Past 5 Years | Overseen By | Trustee |
| Trustee | |||||
| Thomas H. Addis III, | Independent | Indefinite Term; | Executive Director/CEO, Southern | 13 | None |
| Year of Birth: 1945 | Trustee | Since 2000 | California PGA (2006 to current). | ||
| Robert L. Boerner, | Independent | Indefinite Term; | Owner / Broker of Gecko Realty | 13 | None |
| Year of Birth: 1969 | Trustee | Since 2022 | (2008 to current). | ||
| Allen C. Brown, | Independent | Indefinite Term; | Retired. Law Office of Allen C. Brown, | 13 | Blue Chip |
| Year of Birth: 1943 | Trustee | Since 2010 | estate planning and business attorney | Investor Funds | |
| (1970 to 2021). | |||||
| John W. Czechowicz, | Independent | Indefinite Term; | CPA at CWDL (2016 to current). | 13 | None |
| Year of Birth: 1983 | Trustee | Since 2022 | |||
(1) The address of each trustee and officer is c/o PFS Funds, 1939 Friendship Drive, Suite C, El Cajon, California 92020.
2022 Annual Report 17
|
Investment Adviser
|
| This report is provided for the general information of the shareholders of the Taylor Frigon Core Growth Fund. This report is not intended for distribution to prospective investors in the Fund, unless preceded or accompanied by an effective prospectus. |
Taylor Frigon Core Growth Fund
www.taylorfrigonfunds.com
1-888-897-4821
Item 2. Code of Ethics.
The registrant has adopted a code of ethics that applies to the registrant’s principal executive officer and the principal financial officer. The registrant has not made any amendments to its code of ethics during the covered period. The registrant has not granted any waivers from any provisions of the code of ethics during the covered period. A copy of the registrant’s Code of Ethics is filed herewith.
Item 3. Audit Committee Financial Expert.
The registrant’s Board of Trustees has determined that George Cossolias is an audit committee finical expert. Mr. Cossolias is independent for purposes of this Item 3.
Item 4. Principal Accountant Fees and Services.
(a-d) The following table details the aggregate fees billed for each of the last two fiscal years for audit fees, audit-related fees, tax fees and other fees by the principal accountant to the registrant. The principal accountant has provided no services to the adviser or any entity controlled by, or under common control with the adviser that provides ongoing services to the registrant.
| FYE 11/30/2022 | FYE 11/30/2021 | |||
| Audit Fees | $13,750 | $13,750 | ||
| Audit-Related Fees | $0 | $0 | ||
| Tax Fees | $3,000 | $3,000 | ||
| All Other Fees | $750 | $750 |
Nature of Tax Fees: preparation of Excise Tax Statement and 1120 RIC.
All Other Fees: Semi-Annual Report Review
(e) (1) The audit committee approves all audit and non-audit related services and, therefore, has not adopted pre-approval policies and procedures described in paragraph (c)(7) of Rule 2-01 of Regulation S-X.
(e) (2) None of the services described in paragraph (b) through (d) of this Item were approved by the audit committee pursuant to paragraph (c)(7)(i)(C) of Rule 2-01 of Regulation S-X.
(f) All of the principal accountant’s hours spent on auditing the registrant’s financial statements were attributed to work performed by full-time permanent employees of the principal accountant.
(g) The following table indicates the aggregate non-audit fees billed by the registrant’s principal accountant for services to the registrant , the registrant’s investment adviser (not sub-adviser), and any entity controlling, controlled by, or under common control with the adviser that provides ongoing services to the registrant, for the last two years.
| Non-Audit Fees | FYE 11/30/2022 | FYE 11/30/2021 | ||
| Registrant | $3,750 | $3,750 | ||
| Registrant’s Investment Adviser | $0 | $0 |
(h) The principal accountant provided no services to the investment adviser or any entity controlling, controlled by, or under common control with the adviser that provides ongoing services to the registrant.
Item 5. Audit Committee of Listed Companies. Not applicable.
Item 6. Investments.
(a) Not applicable. Schedule filed with Item 1.
(b) Not applicable.
Item 7. Disclosure of Proxy Voting Policies and Procedures for Closed-End Management Investment Companies. Not applicable.
Item 8. Portfolio Managers of Closed End Management Investment Companies. Not applicable.
Item 9. Purchases of Equity Securities by Closed-End Management Investment Companies and Affiliated Purchasers. Not applicable.
Item 10. Submission of Matters to a Vote of Security Holders.
The registrant has not adopted procedures by which shareholders may recommend nominees to the registrant’s board of trustees.
Item 11. Controls and Procedures.
(a) The Registrant’s president and chief financial officer concluded that the disclosure controls and procedures (as defined in Rule 30a-3(c) under the Act (17 CFR 270.30a -3(c))) as of a date within 90 days of the filing date of the report that includes the disclosure required by this paragraph, based on the evaluation of these controls and procedures required by Rule 30a-3(b) under the Act (17 CFR 270.30a -3(b)) and Rules 13a-15(b) or 15d-15(b) under the Exchange Act (17 CFR 240.13a -15(b) or 240.15d -15(b)).
(b) There were no changes in the registrant’s internal control over financial reporting (as defined in Rule 30a-3(d) under the Act (17 CFR 270.30a -3(d)) that occurred during the period covered by this report that has materially affected, or is reasonably likely to materially affect, the registrant’s internal control over financial reporting.
Item 12. Disclosure of Securities Lending Activities for Closed-End Management Investment Companies.
Not applicable.
Item 13. Exhibits.
(a)(1) Code of Ethics. Filed herewith.
(a)(2) Certifications pursuant to Section 302 of the Sarbanes-Oxley Act of 2002. Filed herewith.
(a)(3) Not applicable.
(a)(4) Not applicable.
(b) Certification pursuant to Section 906 of the Sarbanes-Oxley Act of 2002. Filed herewith.
| SIGNATURES |
Pursuant to the requirements of the Securities Exchange Act of 1934 and the Investment Company Act of 1940, the registrant has duly caused this report to be signed on its behalf by the undersigned, thereunto duly authorized.
| PFS Funds |
| By: /s/Ross C. Provence Ross C. Provence President |
| Date: 2/3/2023 |
Pursuant to the requirements of the Securities Exchange Act of 1934 and the Investment Company Act of 1940, this report has been signed below by the following persons on behalf of the registrant and in the capacities and on the dates indicated.
| By: /s/Ross C. Provence Ross C. Provence President |
| Date: 2/3/2023 |
|
By: /s/Jeffrey R. Provence |
| Date: 2/3/2023 |
ATTACHMENTS / EXHIBITS
Serious News for Serious Traders! Try StreetInsider.com Premium Free!
You May Also Be Interested In
- Valstybės investicinis kapitalas UAB audited Annual information for the year 2023
- ROSEN, A LEADING AND TOP RANKED LAW FIRM, Encourages Lifecore Biomedical Inc. f/k/a Landec Corporation Investors to Inquire About Securities Class Action Investigation – LFCR, LNDC
- LINCOLN ALERT: Bragar Eagel & Squire, P.C. Announces that a Class Action Lawsuit Has Been Filed Against Lincoln National Corporation and Encourages Investors to Contact the Firm
Create E-mail Alert Related Categories
SEC FilingsSign up for StreetInsider Free!
Receive full access to all new and archived articles, unlimited portfolio tracking, e-mail alerts, custom newswires and RSS feeds - and more!
