

Form N-CSR LEGG MASON PARTNERS INCO For: Mar 31
 Tweet
Tweet Share
Share
UNITED STATES
SECURITIES AND EXCHANGE COMMISSION
Washington, D.C. 20549
FORM N-CSR
CERTIFIED SHAREHOLDER REPORT OF REGISTERED
MANAGEMENT INVESTMENT COMPANIES
Investment Company Act file number 811-04254
Legg Mason Partners Income Trust
(Exact name of registrant as specified in charter)
620 Eighth Avenue, 47th Floor,
New York, NY 10018
(Address of principal executive offices) (Zip code)
Marc A. De Oliveira
Franklin Templeton
100 First Stamford Place
Stamford, CT 06902
(Name and address of agent for service)
Registrant’s telephone number, including area code: 877-6LM-FUND/656-3863
Date of fiscal year end: March 31
Date of reporting period: March 31, 2022
| ITEM 1. | REPORT TO STOCKHOLDERS. |
The Annual Report to Stockholders is filed herewith.

| Annual Report | March 31, 2022 |
WESTERN ASSET
INTERMEDIATE-TERM MUNICIPALS FUND

| INVESTMENT PRODUCTS: NOT FDIC INSURED • NO BANK GUARANTEE • MAY LOSE VALUE |
Fund objective
The Fund seeks to provide as high a level of income exempt from regular federal income tax* as is consistent with prudent investing.
* A portion of the income may be subject to the federal alternative minimum tax (“AMT”), and state and local taxes will apply. Capital gains, if any, are fully taxable. Please consult your personal tax or legal adviser.
| II | Western Asset Intermediate-Term Municipals Fund |

Dear Shareholder,
We are pleased to provide the annual report of Western Asset Intermediate-Term Municipals Fund for the twelve-month reporting period ended March 31, 2022. Please read on for a detailed look at prevailing economic and market conditions during the Fund’s reporting period and to learn how those conditions have affected Fund performance.
As always, we remain committed to providing you with excellent service and a full spectrum of investment choices. We also remain committed to supplementing the support you receive from your financial advisor. One way we accomplish this is through our website, www.franklintempleton.com. Here you can gain immediate access to market and investment information, including:
| • | Fund prices and performance, |
| • | Market insights and commentaries from our portfolio managers, and |
| • | A host of educational resources. |
We look forward to helping you meet your financial goals.
Sincerely,

Jane Trust, CFA
President and Chief Executive Officer
April 29, 2022
| Western Asset Intermediate-Term Municipals Fund |
III |
Q. What is the Fund’s investment strategy?
A. The Fund seeks to provide as high a level of income exempt from regular federal income tax as is consistent with prudent investing.
Under normal circumstances, the Fund invests at least 80% of its assets in “municipal securities.” Municipal securities include debt obligations issued by any of the fifty states and certain other municipal issuers and their political sub-divisions, agencies and public authorities, certain other governmental issuers (such as Puerto Rico, the U.S. Virgin Islands and Guam) and other qualifying issuers, the income from which is exempt from regular federal income tax. The interest on municipal securities is exempt from regular federal income tax but may be subject to the federal alternative minimum tax (“AMT”). These securities include participation or other interests in municipal securities issued or backed by banks, insurance companies and other financial institutions. We select securities primarily by identifying undervalued sectors and individual securities, while also selecting securities that we believe will benefit from changes in market conditions.
Although the Fund may invest in securities of any maturity, the Fund normally maintains an average effective portfolio maturity of between three and ten years. The Fund focuses on investment grade bonds (that is, securities rated in the Baa/BBB categories or above or, if unrated or we deemed to be unrated, securities we determined to be of comparable quality), but may invest up to 20% of its assets in below investment grade bonds, commonly referred to as “high yield” or “junk” bonds.
The Fund may also invest in securities of other open-end or closed-end investment companies, including exchange-traded funds (“ETFs”), that invest primarily in municipal securities.
Instead of, and/or in addition to, investing directly in particular securities, the Fund may use derivatives and other synthetic instruments that are intended to provide economic exposure to the securities or the issuer or to be used as a hedging technique — to the extent consistent with its 80% policy. The Fund may also engage in a variety of transactions using derivatives in order to change the investment characteristics of its portfolio (such as shortening or lengthening duration) and for other purposes. The Fund may leverage its assets by investing proceeds received through tender option bond transactions, which is considered a form of borrowing.
At Western Asset Management Company, LLC (“Western Asset”), the Fund’s subadviser, we utilize a fixed income team approach, with decisions derived from interaction among various investment management sector specialists. The sector teams are comprised of Western Asset’s senior portfolio management personnel, research analysts and an in-house economist. Under this team approach, management of client fixed income portfolios will reflect a consensus of interdisciplinary views within the Western Asset organization.
| Western Asset Intermediate-Term Municipals Fund 2022 Annual Report |
|
1 |
|
Fund overview (cont’d)
Q. What were the overall market conditions during the Fund’s reporting period?
A. Fixed income markets experienced periods of volatility and, overall, declined over the twelve-month reporting period ended March 31, 2022. Volatility was driven by a number of factors, including the repercussions from the COVID-19 pandemic, rebounding global growth, sharply rising inflation and interest rates, central bank monetary policy tightening, and the war in Ukraine.
Short-term U.S. Treasury yields moved sharply higher as the Federal Reserve Board (the “Fed”) telegraphed that it expected to begin raising interest rates at its meeting in March 2022. The yield for the two-year Treasury note began the reporting period at 0.16% and ended the reporting period at 2.28%. The low of 0.13% occurred on June 2, 2021. The high of 2.35% took place on March 28 and March 29, 2022. Long-term U.S. Treasury yields also moved higher, as positive economic data and rising inflation triggered expectations that the Fed would begin removing its monetary policy accommodation. The yield for the ten-year Treasury note began the reporting period at 1.74% and ended the reporting period at 2.32%. The low of 1.19% took place on August 3 and August 4, 2021, and the high of 2.48% occurred on March 25, 2022.
The municipal bond market generated negative returns and underperformed its taxable bond counterpart during the twelve-month reporting period. Over that time, the Bloomberg Municipal Bond Indexi and the Bloomberg U.S. Aggregate Indexii returned -4.47% and -4.15%, respectively. Both the taxable and tax-free bond markets were negatively impacted by sharply rising long-term interest rates.
Q. How did we respond to these changing market conditions?
A. There were several adjustments to the Fund during the reporting period, including reducing its duration. From a sector perspective, we increased the Fund’s allocation to pre-refunded bonds, while reducing its exposures to industrial revenue and transportation bonds. In terms of our quality biases, we pared our allocation to securities rated BBB, while increasing our exposure to higher quality investment-grade securities.
Performance review
For the twelve months ended March 31, 2022, Class A shares of Western Asset Intermediate-Term Municipals Fund, excluding sales charges, returned -3.20%. The Fund’s unmanaged benchmark, the Bloomberg 1-15 Year Municipal Bond Indexiii, returned -4.21% for the same period. The Lipper Intermediate Municipal Debt Funds Category Averageiv returned -3.87% over the same time frame.
Certain investors may be subject to the AMT, and state and local taxes will apply. Capital gains, if any, are fully taxable. Please consult your personal tax or legal adviser.
|
2 |
Western Asset Intermediate-Term Municipals Fund 2022 Annual Report |
| Performance Snapshot as of March 31, 2022 (unaudited) | ||||||||
| (excluding sales charges) | 6 months | 12 months | ||||||
| Western Asset Intermediate-Term Municipals Fund: | ||||||||
| Class A |
-4.62 | % | -3.20 | % | ||||
| Class C |
-4.89 | % | -3.76 | % | ||||
| Class I |
-4.55 | % | -3.05 | % | ||||
| Class IS |
-4.51 | % | -2.83 | % | ||||
| Bloomberg Municipal 1-15 Year Bond Index | -4.97 | % | -4.21 | % | ||||
| Lipper Intermediate Municipal Debt Funds Category Average | -4.98 | % | -3.87 | % | ||||
The performance shown represents past performance. Past performance is no guarantee of future results and current performance may be higher or lower than the performance shown above. Principal value, investment returns and yields will fluctuate and investors’ shares, when redeemed, may be worth more or less than their original cost. To obtain performance data current to the most recent month-end, please visit our website at www.franklintempleton.com.
All share class returns assume the reinvestment of all distributions at net asset value and the deduction of all Fund expenses. Returns have not been adjusted to include sales charges that may apply or the deduction of taxes that a shareholder would pay on Fund distributions. If sales charges were reflected, the performance quoted would be lower. Performance figures for periods shorter than one year represent cumulative figures and are not annualized.
Fund performance figures reflect fee waivers and/or expense reimbursements, without which the performance would have been lower.
The 30-Day SEC Yields for the period ended March 31, 2022 for Class A, Class C, Class I, and Class IS shares were 1.47%, 0.91%, 1.66% and 1.73%, respectively. Absent fee waivers and/or expense reimbursements, the 30-Day SEC Yield for Class I shares would have been 1.62%. The 30-Day SEC Yield, calculated pursuant to the standard SEC formula, is based on the Fund’s investments over an annualized trailing 30-day period, and not on the distributions paid by the Fund, which may differ.
| Total Annual Operating Expenses (unaudited) |
As of the Fund’s current prospectus dated July 30, 2021, the gross total annual fund operating expense ratios for Class A, Class C, Class I and Class IS shares were 0.59%, 1.18%, 0.45% and 0.37%, respectively.
Actual expenses may be higher. For example, expenses may be higher than those shown if average net assets decrease. Net assets are more likely to decrease and Fund expense ratios are more likely to increase when markets are volatile.
As a result of expense limitation arrangements, the ratio of total annual fund operating expenses, other than interest, brokerage, taxes, extraordinary expenses and acquired fund fees and expenses, to average net assets will not exceed 0.75% for Class A shares, 1.35% for Class C shares, 0.43% for Class I shares and 0.40% for Class IS shares. In addition, the ratio of total annual fund operating expenses for Class IS shares will not exceed the ratio of total annual fund operating expenses for Class I shares. This expense limitation arrangement cannot be terminated prior to December 31, 2023 without the Board of Trustees’ consent.
| Western Asset Intermediate-Term Municipals Fund 2022 Annual Report |
|
3 |
|
Fund overview (cont’d)
The manager is permitted to recapture amounts waived and/or reimbursed to a class within two years after the fiscal year in which the manager earned the fee or incurred the expense if the class’ total annual fund operating expenses have fallen to a level below the expense limitation (“expense cap”) in effect at the time the fees were earned or the expenses incurred. In no case will the manager recapture any amount that would result, on any particular business day of the Fund, in the class’ total annual fund operating expenses exceeding the expense cap or any other lower limit then in effect.
Q. What were the leading contributors to performance?
A. The largest contributor to the Fund’s relative performance during the reporting period was its yield curve positioning. In particular, having an underweight to the short end of the yield curve was beneficial, as these rates moved higher than longer-term rates. In terms of the Fund’s quality positioning, an overweight to securities rated BBB was additive for results. From a sector positioning perspective, an overweight to transportation and security selection of industrial revenue bonds added the most value.
Q. What were the leading detractors from performance?
A. The largest detractor from the Fund’s relative performance during the reporting period was its duration positioning. More specifically, having a longer duration than that of the benchmark was not rewarded, as rates moved sharply higher during the twelve-month reporting period. An overweight to below-investment-grade bonds was negative for results given periods of investor risk aversion. Finally, an overweight to the industrial revenue sector and security selection within pre-refunded sector were headwinds for performance.
Thank you for your investment in Western Asset Intermediate-Term Municipals Fund. As always, we appreciate that you have chosen us to manage your assets and we remain focused on achieving the Fund’s investment goals.
Sincerely,
Western Asset Management Company, LLC
April 13, 2022
RISKS: The Fund’s investments are subject to interest rate, inflation, reinvestment and credit risks. As interest rates rise, bond prices fall, reducing the value of the Fund’s share price. Municipal securities purchased by the Fund may be adversely affected by changes in the financial condition of municipal issuers and insurers, regulatory and political developments, uncertainties and public perceptions, and other factors. Lower rated, higher yielding bonds known as “junk bonds” are subject to greater credit risk, including the risk of default, than higher rated obligations. Investing in securities issued by other investment companies, including exchange-traded funds (“ETFs”), involves risks similar to those of investing directly in the securities and other assets held by the investment company or ETF. The Fund will pay brokerage commissions in connection with the purchase and sale of shares of ETFs. In addition, the Fund indirectly bears its pro rata share of the fees and expenses incurred by a fund it invests in, including advisory fees. These expenses are in addition to the expenses that the Fund bears
|
4 |
Western Asset Intermediate-Term Municipals Fund 2022 Annual Report |
directly in connection with its own operations. The Fund may use derivatives, such as options and futures, which can be illiquid, may disproportionately increase losses, and may have a potentially large impact on Fund performance. Please see the Fund’s prospectus for a more complete discussion of these and other risks and the Fund’s investment strategies.
The mention of sector breakdowns is for informational purposes only and should not be construed as a recommendation to purchase or sell any securities. The information provided regarding such sectors is not a sufficient basis upon which to make an investment decision. Investors seeking financial advice regarding the appropriateness of investing in any securities or investment strategies discussed should consult their financial professional. Portfolio holdings are subject to change at any time and may not be representative of the portfolio managers’ current or future investments. The Fund’s portfolio composition is subject to change at any time.
All investments are subject to risk including the possible loss of principal. Past performance is no guarantee of future results. All index performance reflects no deduction for fees, expenses or taxes. Please note that an investor cannot invest directly in an index.
The information provided is not intended to be a forecast of future events, a guarantee of future results or investment advice. Views expressed may differ from those of the firm as a whole.
| i | The Bloomberg Municipal Bond Index is a market value weighted index of investment grade municipal bonds with maturities of one year or more. |
| ii | The Bloomberg U.S. Aggregate Index is a broad-based bond index comprised of government, corporate, mortgage-and asset-backed issues, rated investment grade or higher, and having at least one year to maturity. |
| iii | The Bloomberg 1–15 Year Municipal Bond Index is a market value weighted index of investment grade (Baa3/BBB-or higher) fixed-rate municipal bonds with maturities of one to fifteen years. |
| iv | Lipper, Inc., a wholly-owned subsidiary of Refinitiv, provides independent insight on global collective investments. Returns are based on the period ended March 31, 2022, including the reinvestment of all distributions, including returns of capital, if any, calculated among the 221 funds for the six-month period and among the 215 funds for the twelve-month period in the Fund’s Lipper category, and excluding sales charges, if any. |
| Western Asset Intermediate-Term Municipals Fund 2022 Annual Report |
|
5 |
|
Investment breakdown (%) as a percent of total investments
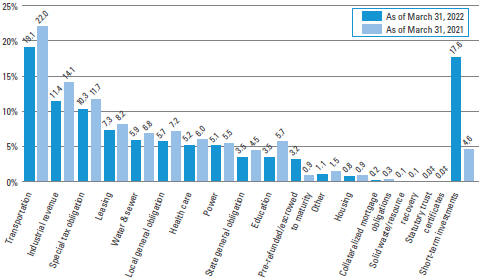
| † | The bar graph above represents the composition of the Fund’s investments as of March 31, 2022 and March 31, 2021. The Fund is actively managed. As a result, the composition of the Fund’s investments is subject to change at any time. |
| ‡ | Represents less than 0.1%. |
| 6 | Western Asset Intermediate-Term Municipals Fund 2022 Annual Report |
Example
As a shareholder of the Fund, you may incur two types of costs: (1) transaction costs, including front-end and back-end sales charges (loads) on purchase payments; and (2) ongoing costs, including management fees; service and/or distribution (12b-1) fees; and other Fund expenses. This example is intended to help you understand your ongoing costs (in dollars) of investing in the Fund and to compare these costs with the ongoing costs of investing in other mutual funds.
This example is based on an investment of $1,000 invested on October 1, 2021 and held for the six months ended March 31, 2022.
Actual expenses
The table below titled “Based on Actual Total Return” provides information about actual account values and actual expenses. You may use the information provided in this table, together with the amount you invested, to estimate the expenses that you paid over the period. To estimate the expenses you paid on your account, divide your ending account value by $1,000 (for example, an $8,600 ending account value divided by $1,000 = 8.6), then multiply the result by the number under the heading entitled “Expenses Paid During the Period”.
Hypothetical example for comparison purposes
The table below titled “Based on Hypothetical Total Return” provides information about hypothetical account values and hypothetical expenses based on the actual expense ratio and an assumed rate of return of 5.00% per year before expenses, which is not the Fund’s actual return. The hypothetical account values and expenses may not be used to estimate the actual ending account balance or expenses you paid for the period. You may use the information provided in this table to compare the ongoing costs of investing in the Fund and other funds. To do so, compare the 5.00% hypothetical example relating to the Fund with the 5.00% hypothetical examples that appear in the shareholder reports of the other funds.
Please note that the expenses shown in the table below are meant to highlight your ongoing costs only and do not reflect any transactional costs, such as front-end or back-end sales charges (loads). Therefore, the table is useful in comparing ongoing costs only, and will not help you determine the relative total costs of owning different funds. In addition, if these transaction costs were included, your costs would have been higher.
| Based on actual total return1 | Based on hypothetical total return1 | |||||||||||||||||||||||||||||||||||||||||||||
| Actual Total Return Without Sales Charge2 |
Beginning Account Value |
Ending Account Value |
Annualized Expense Ratio |
Expenses the |
Hypothetical Annualized Total Return |
Beginning Account Value |
Ending Account Value |
Annualized Expense Ratio |
Expenses Paid During the Period3 |
|||||||||||||||||||||||||||||||||||||
| Class A | -4.62 | % | $ | 1,000.00 | $ | 953.80 | 0.59 | % | $ | 2.87 | Class A | 5.00 | % | $ | 1,000.00 | $ | 1,021.99 | 0.59 | % | $ | 2.97 | |||||||||||||||||||||||||
| Class C | -4.89 | 1,000.00 | 951.10 | 1.18 | 5.74 | Class C | 5.00 | 1,000.00 | 1,019.05 | 1.18 | 5.94 | |||||||||||||||||||||||||||||||||||
| Class I | -4.55 | 1,000.00 | 954.50 | 0.43 | 2.10 | Class I | 5.00 | 1,000.00 | 1,022.79 | 0.43 | 2.17 | |||||||||||||||||||||||||||||||||||
| Class IS | -4.51 | 1,000.00 | 954.90 | 0.37 | 1.80 | Class IS | 5.00 | 1,000.00 | 1,023.09 | 0.37 | 1.87 | |||||||||||||||||||||||||||||||||||
| Western Asset Intermediate-Term Municipals Fund 2022 Annual Report |
|
7 |
|
Fund expenses (unaudited) (cont’d)
| 1 | For the six months ended March 31, 2022. |
| 2 | Assumes the reinvestment of all distributions, including returns of capital, if any, at net asset value and does not reflect the deduction of the applicable sales charge with respect to Class A shares. Total return is not annualized, as it may not be representative of the total return for the year. Performance figures may reflect compensating balance arrangements, fee waivers and/or expense reimbursements. In the absence of compensating balance arrangements, fee waivers and/or expense reimbursements, the total return would have been lower. Past performance is no guarantee of future results. |
| 3 | Expenses (net of compensating balance arrangements, fee waivers and/or expense reimbursements) are equal to each class’ respective annualized expense ratio multiplied by the average account value over the period, multiplied by the number of days in the most recent fiscal half-year (182), then divided by 365. |
| 8 | Western Asset Intermediate-Term Municipals Fund 2022 Annual Report |
| Average annual total returns | ||||||||||||||||
| Without sales charges1 | Class A | Class C | Class I | Class IS | ||||||||||||
| Twelve Months Ended 3/31/22 | -3.20 | % | -3.76 | % | -3.05 | % | -2.83 | % | ||||||||
| Five Years Ended 3/31/22 | 2.12 | 1.52 | 2.28 | N/A | ||||||||||||
| Ten Years Ended 3/31/22 | 2.24 | 1.65 | 2.38 | N/A | ||||||||||||
| Inception* through 3/31/22 | — | — | — | 2.49 | ||||||||||||
| With sales charges2 | Class A | Class C | Class I | Class IS | ||||||||||||
| Twelve Months Ended 3/31/22 | -5.37 | % | -3.76 | % | -3.05 | % | -2.83 | % | ||||||||
| Five Years Ended 3/31/22 | 1.64 | 1.52 | 2.28 | N/A | ||||||||||||
| Ten Years Ended 3/31/22 | 2.01 | 1.65 | 2.38 | N/A | ||||||||||||
| Inception* through 3/31/22 | — | — | — | 2.49 | ||||||||||||
| Cumulative total returns | ||||
| Without sales charges1 | ||||
| Class A (3/31/12 through 3/31/22) | 24.79 | % | ||
| Class C (3/31/12 through 3/31/22) | 17.78 | |||
| Class I (3/31/12 through 3/31/22) | 26.56 | |||
| Class IS (Inception date of 9/18/18 through 3/31/22) | 9.07 | |||
All figures represent past performance and are not a guarantee of future results. Investment return and principal value of an investment will fluctuate so that an investor’s shares, when redeemed, may be worth more or less than their original cost. The returns shown do not reflect the deduction of taxes that a shareholder would pay on Fund distributions or the redemption of Fund shares. Performance figures may reflect compensating balance arrangements, fee waivers and/or expense reimbursements. In the absence of compensating balance arrangements, fee waivers and/or expense reimbursements, the total return would have been lower.
| 1 | Assumes the reinvestment of all distributions, including returns of capital, if any, at net asset value and does not reflect the deduction of the applicable sales charge with respect to Class A shares. |
| 2 | Assumes the reinvestment of all distributions, including returns of capital, if any, at net asset value. In addition, Class A shares reflect the deduction of the maximum initial sales charge of 2.25%. |
| * | Inception dates for Class A, C, I and IS shares are November 28, 1988, December 19, 2001, September 28, 2007 and September 18, 2018, respectively. |
| Western Asset Intermediate-Term Municipals Fund 2022 Annual Report |
|
9 |
|
Fund performance (unaudited) (cont’d)
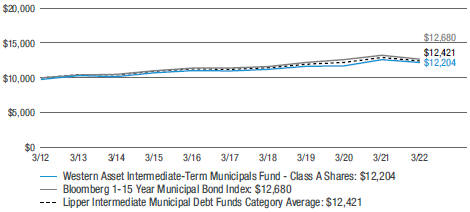
Historical performance
Value of $10,000 invested
Class A Shares of Western Asset Intermediate-Term Municipals Fund vs. Bloomberg 1-15 Year Municipal Bond Index and Lipper Intermediate Municipal Debt Funds Category Average† — March 2012 - March 2022
All figures represent past performance and are not a guarantee of future results. Investment return and principal value of an investment will fluctuate so that an investor’s shares, when redeemed, may be worth more or less than their original cost. The returns shown do not reflect the deduction of taxes that a shareholder would pay on Fund distributions or the redemption of Fund shares. Performance figures may reflect compensating balance arrangements, fee waivers and/or expense reimbursements. In the absence of compensating balance arrangements, fee waivers and/or expense reimbursements, the total return would have been lower.
| † | Hypothetical illustration of $10,000 invested in Class A shares of Western Asset Intermediate-Term Municipals Fund on March 31, 2012, assuming the deduction of the maximum initial sales charge of 2.25% at the time of investment and the reinvestment of all distributions, including returns of capital, if any, at net asset value through March 31, 2022. The hypothetical illustration also assumes a $10,000 investment in the Bloomberg 1-15 Year Municipal Bond Index and the Lipper Intermediate Municipal Debt Funds Category Average. The Bloomberg 1-15 Year Municipal Bond Index (the “Index”) is a market value weighted index of investment grade (Baa3/BBB-or higher), fixed-rate municipal bonds with maturities of one to fifteen years. The Index is unmanaged and is not subject to the same management and trading expenses as a mutual fund. Please note that an investor cannot invest directly in an index. The Lipper Intermediate Municipal Debt Funds Category Average is comprised of the Fund’s peer group of mutual funds. The performance of the Fund’s other classes may be greater or less than the Class A shares’ performance indicated on this chart, depending on whether greater or lesser sales charges and fees were incurred by shareholders investing in the other classes. |
| 10 | Western Asset Intermediate-Term Municipals Fund 2022 Annual Report |
March 31, 2022
Western Asset Intermediate-Term Municipals Fund
(Percentages shown based on Fund net assets)
| Security | Rate | Maturity Date |
Face Amount |
Value | ||||||||||||
| Municipal Bonds — 81.5% | ||||||||||||||||
| Alabama — 1.4% |
||||||||||||||||
| Jefferson County, AL, Sewer Revenue: |
||||||||||||||||
| Convertible CAB, Subordinated Lien, Warrants, Step bond, Series F, Refunding (0.000% to 10/1/23 then 7.900%) |
0.000 | % | 10/1/50 | $ | 9,000,000 | $ | 9,170,558 | |||||||||
| Subordinated Lien Warrants, Series D |
5.000 | % | 10/1/22 | 2,000,000 | 2,036,372 | |||||||||||
| Subordinated Lien Warrants, Series D |
5.000 | % | 10/1/23 | 4,000,000 | 4,187,498 | |||||||||||
| Southeast Alabama Gas Supply District, Gas Supply Revenue, Project #2, Series A |
4.000 | % | 6/1/24 | 25,125,000 | 25,907,835 | (a)(b) | ||||||||||
| Total Alabama |
41,302,263 | |||||||||||||||
| Alaska — 0.4% |
||||||||||||||||
| Alaska State Housing Finance Corp. Revenue: |
||||||||||||||||
| State Capital Project II, Series B |
5.000 | % | 12/1/37 | 750,000 | 872,085 | |||||||||||
| State Capital Project, Series B |
4.000 | % | 12/1/35 | 1,000,000 | 1,092,134 | |||||||||||
| State Capital Project, Series B |
4.000 | % | 12/1/36 | 750,000 | 818,343 | |||||||||||
| Northern Tobacco Securitization Corp., AK, Revenue: |
||||||||||||||||
| Asset Backed Senior Bonds, Class 1, Series A, Refunding |
5.000 | % | 6/1/26 | 1,085,000 | 1,180,586 | |||||||||||
| Asset Backed Senior Bonds, Class 1, Series A, Refunding |
5.000 | % | 6/1/27 | 1,000,000 | 1,103,728 | |||||||||||
| Asset Backed Senior Bonds, Class 1, Series A, Refunding |
5.000 | % | 6/1/28 | 1,650,000 | 1,841,515 | |||||||||||
| Asset Backed Senior Bonds, Class 1, Series A, Refunding |
5.000 | % | 6/1/29 | 1,250,000 | 1,408,733 | |||||||||||
| Asset Backed Senior Bonds, Class 1, Series A, Refunding |
5.000 | % | 6/1/30 | 1,750,000 | 1,989,326 | |||||||||||
| Total Alaska |
10,306,450 | |||||||||||||||
| Arizona — 2.0% |
||||||||||||||||
| Arizona State IDA, Education Revenue: |
||||||||||||||||
| Academies Math & Science Project, Refunding, SD Credit Program |
5.000 | % | 7/1/37 | 700,000 | 764,861 | |||||||||||
| Basis School Project, Credit Enhanced, SD Credit Program, Refunding |
5.000 | % | 7/1/37 | 850,000 | 937,852 | |||||||||||
| Lincoln South Beltway Project |
5.000 | % | 2/1/24 | 2,000,000 | 2,108,739 | |||||||||||
| Lincoln South Beltway Project |
5.000 | % | 8/1/24 | 2,000,000 | 2,134,791 | |||||||||||
| Lincoln South Beltway Project |
5.000 | % | 2/1/25 | 1,500,000 | 1,618,695 | |||||||||||
| Arizona State IDA, Hospital Revenue: |
||||||||||||||||
| Phoenix Children’s Hospital Project |
5.000 | % | 2/1/36 | 1,100,000 | 1,280,401 | |||||||||||
| Phoenix Children’s Hospital Project |
5.000 | % | 2/1/40 | 1,300,000 | 1,502,960 | |||||||||||
See Notes to Financial Statements.
| Western Asset Intermediate-Term Municipals Fund 2022 Annual Report |
|
11 |
|
Schedule of investments (cont’d)
March 31, 2022
Western Asset Intermediate-Term Municipals Fund
(Percentages shown based on Fund net assets)
| Security | Rate | Maturity Date |
Face Amount |
Value | ||||||||||||
| Arizona — continued |
||||||||||||||||
| Chandler, AZ, IDA Revenue: |
||||||||||||||||
| Intel Corp. Project |
2.700 | % | 8/14/23 | $ | 8,000,000 | $ | 8,067,554 | (a)(b)(c) | ||||||||
| Intel Corp. Project |
5.000 | % | 6/3/24 | 8,900,000 | 9,414,869 | (a)(b)(c) | ||||||||||
| Navajo Nation, AZ, Series A, Refunding |
5.000 | % | 12/1/25 | 3,400,000 | 3,574,443 | (d) | ||||||||||
| Phoenix, AZ, Civic Improvement Corp., Airport Revenue: |
||||||||||||||||
| Junior Lien, Refunding |
5.000 | % | 7/1/27 | 4,000,000 | 4,261,702 | |||||||||||
| Senior Lien, Series 2018 |
5.000 | % | 7/1/36 | 3,715,000 | 4,143,896 | (c) | ||||||||||
| Senior Lien, Series 2018 |
5.000 | % | 7/1/37 | 4,300,000 | 4,793,360 | (c) | ||||||||||
| Senior Lien, Series 2018 |
5.000 | % | 7/1/38 | 5,085,000 | 5,661,696 | (c) | ||||||||||
| Phoenix, AZ, IDA, Great Hearts Academies, Refunding |
5.000 | % | 7/1/36 | 1,600,000 | 1,694,021 | |||||||||||
| Salt Verde, AZ, Financial Corp., Natural Gas Revenue, Series 2007 |
5.000 | % | 12/1/32 | 3,665,000 | 4,245,959 | |||||||||||
| Total Arizona |
56,205,799 | |||||||||||||||
| California — 8.4% |
||||||||||||||||
| Alameda, CA, Corridor Transportation Authority Revenue: |
||||||||||||||||
| Second Subordinated Lien, Series B, Refunding |
5.000 | % | 10/1/34 | 3,000,000 | 3,290,693 | |||||||||||
| Second Subordinated Lien, Series B, Refunding |
5.000 | % | 10/1/36 | 4,200,000 | 4,599,745 | |||||||||||
| Anaheim, CA, Housing & Public Improvements Authority, Sewer Revenue, Refunding |
5.000 | % | 2/1/36 | 2,060,000 | 2,339,433 | |||||||||||
| Anaheim, CA, Public Financing Authority Lease Revenue: |
||||||||||||||||
| Series A, Refunding |
5.000 | % | 5/1/28 | 1,100,000 | 1,170,231 | (e) | ||||||||||
| Series A, Refunding |
5.000 | % | 5/1/29 | 1,255,000 | 1,335,127 | (e) | ||||||||||
| Series A, Refunding |
5.000 | % | 5/1/30 | 1,700,000 | 1,808,539 | (e) | ||||||||||
| Series A, Refunding |
5.000 | % | 5/1/31 | 1,850,000 | 1,968,116 | (e) | ||||||||||
| Bay Area Toll Authority, CA, Toll Bridge Revenue: |
||||||||||||||||
| San Francisco Bay Area, Series B-1 (SIFMA Municipal Swap Index Yield + 1.100%) |
1.610 | % | 4/1/24 | 3,000,000 | 3,035,804 | (a)(b) | ||||||||||
| San Francisco Bay Area, Series C-1 (SIFMA Municipal Swap Index Yield + 0.900%) |
1.410 | % | 5/1/23 | 30,000,000 | 30,095,481 | (a)(b) | ||||||||||
| California State Community Choice Financing Authority Revenue, Clean Energy Project, Green Bond, Climate Bond Certified, Series A |
4.000 | % | 12/1/27 | 2,300,000 | 2,432,608 | (a)(b) | ||||||||||
See Notes to Financial Statements.
|
12 |
Western Asset Intermediate-Term Municipals Fund 2022 Annual Report |
Western Asset Intermediate-Term Municipals Fund
(Percentages shown based on Fund net assets)
| Security | Rate | Maturity Date |
Face Amount |
Value | ||||||||||||
| California — continued |
||||||||||||||||
| California State Infrastructure & Economic Development Bank Revenue, UCSF 2130 Third Street |
5.000 | % | 5/15/42 | $ | 6,000,000 | $ | 6,844,675 | |||||||||
| California State MFA Revenue: |
||||||||||||||||
| Senior Lien, LINXS APM Project, Series A |
5.000 | % | 12/31/34 | 4,550,000 | 4,993,701 | (c) | ||||||||||
| Senior Lien, LINXS APM Project, Series A |
5.000 | % | 12/31/43 | 4,500,000 | 4,903,158 | (c) | ||||||||||
| California State MFA Special Facility Revenue, United Airlines, Inc., Los Angeles International Airport Project |
4.000 | % | 7/15/29 | 500,000 | 510,074 | (c) | ||||||||||
| California State MFA, Lease Revenue, Orange County, CA, Civic Center Infrastructure Improvement Program |
5.000 | % | 6/1/43 | 3,000,000 | 3,412,017 | |||||||||||
| California State PCFA Water Furnishing Revenue: |
||||||||||||||||
| Poseidon Resources |
5.000 | % | 7/1/27 | 7,595,000 | 8,105,615 | (c)(d) | ||||||||||
| San Diego County Water Authority Desalination Project, Refunding |
5.000 | % | 7/1/39 | 1,500,000 | 1,661,534 | (d) | ||||||||||
| California State, GO: |
||||||||||||||||
| Various Purpose, Refunding |
4.000 | % | 11/1/36 | 2,735,000 | 2,932,583 | |||||||||||
| Various Purpose, Refunding |
5.000 | % | 10/1/41 | 3,000,000 | 3,564,452 | |||||||||||
| California Statewide CDA Revenue, Provident Group-Pomona Properties LLC, Series A |
5.600 | % | 1/15/36 | 8,405,000 | 8,557,496 | (d) | ||||||||||
| Golden State, CA, Tobacco Securitization Corp. Revenue: |
||||||||||||||||
| Tobacco Settlement Funded, Series A-1 |
5.000 | % | 6/1/33 | 5,000,000 | 5,798,398 | (e) | ||||||||||
| Tobacco Settlement Funded, Series A-1 |
5.000 | % | 6/1/35 | 3,000,000 | 3,479,039 | (e) | ||||||||||
| Tobacco Settlement Funded, Series A-1, Refunding |
5.000 | % | 6/1/34 | 7,000,000 | 8,117,757 | (e) | ||||||||||
| Long Beach, CA, Bond Finance Authority, Natural Gas Purchase Revenue, Series A |
5.250 | % | 11/15/23 | 3,975,000 | 4,174,254 | |||||||||||
| Los Angeles County, CA, MTA, Sales Tax Revenue: |
||||||||||||||||
| Senior Proposition C, Series B |
5.000 | % | 7/1/34 | 5,000,000 | 5,761,481 | |||||||||||
| Senior Proposition C, Series B |
5.000 | % | 7/1/35 | 5,000,000 | 5,756,611 | |||||||||||
| Los Angeles, CA, Department of Airports Revenue: |
||||||||||||||||
| Los Angeles International Airport, Series A, Refunding |
5.000 | % | 5/15/36 | 3,690,000 | 4,282,090 | |||||||||||
| Los Angeles International Airport, Subordinated, Series D |
5.000 | % | 5/15/37 | 1,775,000 | 1,988,552 | (c) | ||||||||||
See Notes to Financial Statements.
| Western Asset Intermediate-Term Municipals Fund 2022 Annual Report |
|
13 |
|
Schedule of investments (cont’d)
March 31, 2022
Western Asset Intermediate-Term Municipals Fund
(Percentages shown based on Fund net assets)
| Security | Rate | Maturity Date |
Face Amount |
Value | ||||||||||||
| California — continued |
||||||||||||||||
| Subordinated, Los Angeles International Airport, Series B |
5.000 | % | 5/15/35 | $ | 1,000,000 | $ | 1,089,984 | (c) | ||||||||
| Subordinated, Los Angeles International Airport, Series B |
5.000 | % | 5/15/36 | 1,000,000 | 1,089,455 | (c) | ||||||||||
| Subordinated, Los Angeles International Airport, Series C |
5.000 | % | 5/15/37 | 4,925,000 | 5,483,663 | (c) | ||||||||||
| Subordinated, Los Angeles International Airport, Series C |
5.000 | % | 5/15/38 | 2,500,000 | 2,780,570 | (c) | ||||||||||
| Subordinated, Los Angeles International Airport, Series D |
5.000 | % | 5/15/34 | 1,000,000 | 1,123,688 | (c) | ||||||||||
| Subordinated, Los Angeles International Airport, Series D |
5.000 | % | 5/15/35 | 1,695,000 | 1,902,914 | (c) | ||||||||||
| Subordinated, Los Angeles International Airport, Series D |
5.000 | % | 5/15/36 | 1,275,000 | 1,430,336 | (c) | ||||||||||
| Los Angeles, CA, Department of Water & Power, Power System Revenue: |
||||||||||||||||
| Series C |
5.000 | % | 7/1/36 | 6,450,000 | 7,290,598 | |||||||||||
| Series C |
5.000 | % | 7/1/37 | 3,000,000 | 3,386,236 | |||||||||||
| M-S-R Energy Authority, CA, Natural Gas Revenue: |
||||||||||||||||
| Series A |
6.125 | % | 11/1/29 | 1,780,000 | 2,049,051 | |||||||||||
| Series B |
6.125 | % | 11/1/29 | 17,040,000 | 19,616,942 | |||||||||||
| Northern California Energy Authority, Commodity Supply Revenue, Series A |
4.000 | % | 7/1/24 | 3,000,000 | 3,084,162 | (a)(b) | ||||||||||
| River Islands, CA, Public Financing Authority Special Tax: |
||||||||||||||||
| Community Facilities District No. 2003-1, Refunding |
5.250 | % | 9/1/34 | 5,570,000 | 5,734,150 | |||||||||||
| Community Facilities District No. 2003-1, Series A-1, Refunding |
5.000 | % | 9/1/27 | 580,000 | 597,084 | |||||||||||
| Riverside County, CA, Transportation Commission Sales Tax Revenue, Limited Tax, Series A |
5.250 | % | 6/1/26 | 4,000,000 | 4,163,874 | (e) | ||||||||||
| Riverside, CA, Electric Revenue: |
||||||||||||||||
| Series A, Refunding |
5.000 | % | 10/1/36 | 6,250,000 | 7,171,549 | |||||||||||
| Series A, Refunding |
5.000 | % | 10/1/43 | 3,000,000 | 3,427,995 | |||||||||||
| Riverside, CA, Sewer Revenue: |
||||||||||||||||
| Series A, Refunding |
5.000 | % | 8/1/34 | 6,645,000 | 7,698,601 | |||||||||||
| Series A, Refunding |
5.000 | % | 8/1/35 | 3,115,000 | 3,601,909 | |||||||||||
| Series A, Refunding |
5.000 | % | 8/1/36 | 1,000,000 | 1,155,440 | |||||||||||
See Notes to Financial Statements.
|
14 |
Western Asset Intermediate-Term Municipals Fund 2022 Annual Report |
Western Asset Intermediate-Term Municipals Fund
(Percentages shown based on Fund net assets)
| Security | Rate | Maturity Date |
Face Amount |
Value | ||||||||||||
| California — continued |
||||||||||||||||
| San Bernardino City, CA, Unified School District: |
||||||||||||||||
| COP, School Financing Project, AGM |
5.000 | % | 10/1/34 | $ | 1,000,000 | $ | 1,144,761 | |||||||||
| COP, School Financing Project, AGM |
5.000 | % | 10/1/35 | 1,500,000 | 1,715,737 | |||||||||||
| San Francisco, CA, City & County Airport Commission, International Airport Revenue: |
||||||||||||||||
| Series A |
5.000 | % | 1/1/34 | 1,000,000 | 1,121,068 | (c) | ||||||||||
| Series E |
5.000 | % | 5/1/50 | 2,500,000 | 2,745,895 | (c) | ||||||||||
| Sanger, CA, USD Revenue, COP, Capital Projects, Refunding, AGM |
5.000 | % | 6/1/49 | 3,000,000 | 3,248,578 | |||||||||||
| Southern California Public Power Authority, Natural Gas Project Revenue, Project Number 1, Series A |
5.250 | % | 11/1/26 | 2,000,000 | 2,242,616 | |||||||||||
| Southern California Water Replenishment District Financing Authority, Replenishment Revenue: |
||||||||||||||||
| Series 2018 |
5.000 | % | 8/1/36 | 2,300,000 | 2,672,189 | |||||||||||
| Series 2018 |
5.000 | % | 8/1/43 | 2,000,000 | 2,308,024 | |||||||||||
| Tobacco Securitization Authority of Southern California: |
||||||||||||||||
| San Diego County Tobacco Asset Securitization Corporation, Series A |
5.000 | % | 6/1/34 | 655,000 | 740,092 | |||||||||||
| San Diego County Tobacco Asset Securitization Corporation, Series A |
5.000 | % | 6/1/36 | 1,000,000 | 1,124,685 | |||||||||||
| San Diego County Tobacco Asset Securitization Corporation, Series A |
5.000 | % | 6/1/37 | 1,000,000 | 1,123,806 | |||||||||||
| San Diego County Tobacco Asset Securitization Corporation, Series A |
5.000 | % | 6/1/38 | 750,000 | 841,363 | |||||||||||
| Total California |
241,826,279 | |||||||||||||||
| Colorado — 1.1% |
||||||||||||||||
| Base Village Metropolitan District #2, CO, GO, Series A, Refunding |
5.500 | % | 12/1/36 | 500,000 | 515,442 | |||||||||||
| Colorado State Health Facilities Authority Revenue, Commonspirit Health Project, Series A-2 |
5.000 | % | 8/1/44 | 5,500,000 | 6,165,020 | |||||||||||
| Denver, CO, City & County Special Facility Apartment Revenue, United Airlines Inc. Project, Refunding |
5.000 | % | 10/1/32 | 4,800,000 | 4,943,617 | (c) | ||||||||||
| District of Vauxmont Metropolitan, CO, GO: |
||||||||||||||||
| Series 2019, Refunding, AGM |
5.000 | % | 12/15/27 | 255,000 | 280,977 | |||||||||||
| Series 2020, Refunding, AGM |
5.000 | % | 12/1/26 | 385,000 | 430,915 | |||||||||||
See Notes to Financial Statements.
| Western Asset Intermediate-Term Municipals Fund 2022 Annual Report |
|
15 |
|
Schedule of investments (cont’d)
March 31, 2022
Western Asset Intermediate-Term Municipals Fund
(Percentages shown based on Fund net assets)
| Security | Rate | Maturity Date |
Face Amount |
Value | ||||||||||||
| Colorado — continued |
||||||||||||||||
| Series 2020, Refunding, AGM |
5.000 | % | 12/1/28 | $ | 415,000 | $ | 480,492 | |||||||||
| Public Authority for Colorado Energy, Natural Gas Purchase Revenue: |
||||||||||||||||
| Series 2008 |
6.125 | % | 11/15/23 | 6,485,000 | 6,778,257 | |||||||||||
| Series 2008 |
6.250 | % | 11/15/28 | 8,000,000 | 9,273,922 | |||||||||||
| Regional Transportation District: |
||||||||||||||||
| Denver Transit Partners Eagle P3 Project, Series A |
5.000 | % | 1/15/30 | 700,000 | 793,285 | |||||||||||
| Denver Transit Partners Eagle P3 Project, Series A |
5.000 | % | 1/15/31 | 450,000 | 514,507 | |||||||||||
| Denver Transit Partners Eagle P3 Project, Series A |
5.000 | % | 7/15/31 | 400,000 | 456,805 | |||||||||||
| Total Colorado |
30,633,239 | |||||||||||||||
| Connecticut — 1.3% |
||||||||||||||||
| Connecticut State HEFA Revenue: |
||||||||||||||||
| Sacred Heart University Issue, Series I-1, Refunding |
5.000 | % | 7/1/36 | 1,150,000 | 1,279,626 | |||||||||||
| Sacred Heart University Issue, Series I-1, Refunding |
5.000 | % | 7/1/42 | 2,000,000 | 2,211,809 | |||||||||||
| Connecticut State Special Tax Revenue: |
||||||||||||||||
| Transportation Infrastructure, Series A |
5.000 | % | 5/1/33 | 3,000,000 | 3,523,698 | |||||||||||
| Transportation Infrastructure, Series A |
5.000 | % | 5/1/34 | 4,500,000 | 5,268,374 | |||||||||||
| Transportation Infrastructure, Series A |
5.000 | % | 1/1/37 | 5,000,000 | 5,621,347 | |||||||||||
| Connecticut State, GO: |
||||||||||||||||
| Series A |
5.000 | % | 4/15/30 | 750,000 | 874,662 | |||||||||||
| Series C |
4.000 | % | 6/1/35 | 1,525,000 | 1,648,889 | |||||||||||
| Series C |
4.000 | % | 6/1/37 | 1,000,000 | 1,070,988 | |||||||||||
| Series C |
4.000 | % | 6/1/38 | 1,250,000 | 1,335,751 | |||||||||||
| Series E |
5.000 | % | 10/15/34 | 2,900,000 | 3,198,298 | |||||||||||
| South Central, CT, Regional Water Authority, Water System Revenue: |
||||||||||||||||
| Thirty Third, Series B-1, Refunding |
5.000 | % | 8/1/41 | 1,750,000 | 2,015,921 | |||||||||||
| Thirty Third, Series B-2, Refunding |
5.000 | % | 8/1/31 | 2,000,000 | 2,322,828 | |||||||||||
| Thirty Third, Series B-2, Refunding |
5.000 | % | 8/1/32 | 2,200,000 | 2,554,619 | |||||||||||
| University of Connecticut, Student Fee Revenue, Series A |
5.000 | % | 11/15/43 | 2,900,000 | 3,289,499 | |||||||||||
| Total Connecticut |
36,216,309 | |||||||||||||||
| Delaware — 0.2% |
||||||||||||||||
| Delaware State Health Facilities Authority Revenue, Series 2018 |
5.000 | % | 6/1/43 | 4,420,000 | 4,945,934 | |||||||||||
See Notes to Financial Statements.
|
16 |
Western Asset Intermediate-Term Municipals Fund 2022 Annual Report |
Western Asset Intermediate-Term Municipals Fund
(Percentages shown based on Fund net assets)
| Security | Rate | Maturity Date |
Face Amount |
Value | ||||||||||||
| District of Columbia — 0.4% |
||||||||||||||||
| District of Columbia Revenue: |
||||||||||||||||
| Ingleside Rock Creek Project, Series A |
5.000 | % | 7/1/32 | $ | 500,000 | $ | 519,089 | |||||||||
| Ingleside Rock Creek Project, Series A |
5.000 | % | 7/1/37 | 500,000 | 514,817 | |||||||||||
| KIPP DC Issue, Series A, Refunding |
5.000 | % | 7/1/37 | 4,010,000 | 4,376,502 | |||||||||||
| KIPP DC Project, Series B, Refunding |
5.000 | % | 7/1/37 | 5,000,000 | 5,456,986 | |||||||||||
| Total District of Columbia |
10,867,394 | |||||||||||||||
| Florida — 3.9% |
||||||||||||||||
| Broward County, FL, Airport System Revenue: |
||||||||||||||||
| Series 2017 |
5.000 | % | 10/1/36 | 1,750,000 | 1,940,598 | (c) | ||||||||||
| Series 2017 |
5.000 | % | 10/1/42 | 1,500,000 | 1,653,889 | (c) | ||||||||||
| Series A |
5.000 | % | 10/1/27 | 1,750,000 | 1,959,592 | (c) | ||||||||||
| Broward County, FL, Port Facilities Revenue, Series B |
5.000 | % | 9/1/31 | 10,155,000 | 11,567,741 | (c) | ||||||||||
| Broward County, FL, School Board, COP: |
||||||||||||||||
| Series A, Refunding |
5.000 | % | 7/1/27 | 4,000,000 | 4,360,710 | |||||||||||
| Series A, Refunding |
5.000 | % | 7/1/28 | 5,500,000 | 5,995,976 | |||||||||||
| Series A, Refunding |
5.000 | % | 7/1/30 | 5,000,000 | 5,416,530 | |||||||||||
| Central Florida Expressway Authority Revenue: |
||||||||||||||||
| Senior Lien, Refunding |
5.000 | % | 7/1/37 | 1,250,000 | 1,408,304 | |||||||||||
| Senior Lien, Refunding |
5.000 | % | 7/1/38 | 1,000,000 | 1,125,069 | |||||||||||
| Cityplace, FL, Community Development District, Special Assessment Revenue, Refunding |
5.000 | % | 5/1/22 | 1,860,000 | 1,865,472 | |||||||||||
| Florida Atlantic University, FL, Finance Corp., Capital Improvements Revenue, Series 2019 A |
5.000 | % | 7/1/35 | 5,775,000 | 6,611,927 | |||||||||||
| Florida State Development Finance Corp., Educational Facilities Revenue, Renaissance Charter School Inc. Projects, Series A |
6.000 | % | 6/15/35 | 1,900,000 | 2,058,070 | (d) | ||||||||||
| Florida State Mid-Bay Bridge Authority Revenue: |
||||||||||||||||
| Series A, Refunding |
5.000 | % | 10/1/26 | 2,000,000 | 2,175,442 | |||||||||||
| Series A, Refunding |
5.000 | % | 10/1/27 | 3,000,000 | 3,256,328 | |||||||||||
| Series A, Refunding |
5.000 | % | 10/1/28 | 1,000,000 | 1,083,094 | |||||||||||
| Hillsborough County, FL, Aviation Authority Revenue, Tampa International Airport, Series A |
5.000 | % | 10/1/47 | 3,000,000 | 3,389,230 | (c) | ||||||||||
| Jacksonville, FL, Sales Tax Revenue, Better Jacksonville, Refunding |
5.000 | % | 10/1/25 | 4,750,000 | 4,833,077 | |||||||||||
| Lee County, FL, Airport Revenue: |
||||||||||||||||
| Series A, Refunding |
5.000 | % | 10/1/31 | 500,000 | 584,265 | (c) | ||||||||||
| Series A, Refunding |
5.000 | % | 10/1/32 | 3,000,000 | 3,485,575 | (c) | ||||||||||
See Notes to Financial Statements.
| Western Asset Intermediate-Term Municipals Fund 2022 Annual Report |
|
17 |
|
Schedule of investments (cont’d)
March 31, 2022
Western Asset Intermediate-Term Municipals Fund
(Percentages shown based on Fund net assets)
| Security | Rate | Maturity Date |
Face Amount |
Value | ||||||||||||
| Florida — continued |
||||||||||||||||
| Series A, Refunding, AGM |
5.000 | % | 10/1/22 | $ | 2,045,000 | $ | 2,050,411 | (c) | ||||||||
| Miami-Dade County, FL, Aviation Revenue: |
||||||||||||||||
| Series A, Refunding |
4.000 | % | 10/1/34 | 1,600,000 | 1,698,802 | |||||||||||
| Series A, Refunding |
4.000 | % | 10/1/35 | 1,505,000 | 1,596,259 | |||||||||||
| Series A, Refunding |
4.000 | % | 10/1/36 | 1,000,000 | 1,059,549 | |||||||||||
| Series A, Refunding |
4.000 | % | 10/1/37 | 2,075,000 | 2,197,314 | |||||||||||
| Series A, Refunding |
4.000 | % | 10/1/38 | 2,250,000 | 2,378,861 | |||||||||||
| Series A, Refunding |
4.000 | % | 10/1/39 | 1,500,000 | 1,577,728 | |||||||||||
| Miami-Dade County, FL, Expressway Authority Toll System Revenue: |
||||||||||||||||
| Series B, Refunding |
5.000 | % | 7/1/24 | 3,000,000 | 3,183,363 | |||||||||||
| Series B, Refunding |
5.000 | % | 7/1/25 | 3,730,000 | 3,970,651 | |||||||||||
| Series B, Refunding |
5.000 | % | 7/1/26 | 1,700,000 | 1,809,294 | |||||||||||
| Series B, Refunding |
5.000 | % | 7/1/27 | 2,350,000 | 2,497,355 | |||||||||||
| Series B, Refunding |
5.000 | % | 7/1/28 | 1,000,000 | 1,061,347 | |||||||||||
| Series B, Refunding |
5.000 | % | 7/1/30 | 2,500,000 | 2,651,673 | |||||||||||
| Series B, Refunding |
5.000 | % | 7/1/31 | 2,750,000 | 2,916,840 | |||||||||||
| Miami-Dade County, FL, Health Facilities Authority Hospital Revenue: |
||||||||||||||||
| Nicklaus Children’s Hospital, Refunding |
5.000 | % | 8/1/35 | 1,020,000 | 1,143,159 | |||||||||||
| Nicklaus Children’s Hospital, Refunding |
5.000 | % | 8/1/36 | 635,000 | 711,001 | |||||||||||
| Nicklaus Children’s Hospital, Refunding |
5.000 | % | 8/1/37 | 1,010,000 | 1,130,350 | |||||||||||
| Orange County, FL, Health Facilities Authority Revenue, Presbyterian Retirement Communities, Refunding |
5.000 | % | 8/1/36 | 3,745,000 | 4,012,563 | |||||||||||
| Palm Beach County, FL, Health Facilities Authority Revenue: |
||||||||||||||||
| Toby & Leon Cooperman Sinai Residences of Boca Raton Expansion, Series 2022, Refunding |
4.000 | % | 6/1/31 | 1,100,000 | 1,095,779 | |||||||||||
| Toby & Leon Cooperman Sinai Residences of Boca Raton Expansion, Series B |
2.625 | % | 6/1/25 | 4,650,000 | 4,557,848 | |||||||||||
| Tampa, FL, Hospital Revenue: |
||||||||||||||||
| H. Lee Moffit Cancer Center Project, Series B |
5.000 | % | 7/1/40 | 1,250,000 | 1,427,685 | |||||||||||
| H. Lee Moffitt Cancer Center Project, Series B |
4.000 | % | 7/1/45 | 1,000,000 | 1,030,689 | |||||||||||
| Total Florida |
110,529,410 | |||||||||||||||
See Notes to Financial Statements.
|
18 |
Western Asset Intermediate-Term Municipals Fund 2022 Annual Report |
Western Asset Intermediate-Term Municipals Fund
(Percentages shown based on Fund net assets)
| Security | Rate | Maturity Date |
Face Amount |
Value | ||||||||||||
| Georgia — 0.9% |
||||||||||||||||
| Brookhaven, GA, Development Authority Revenue, Children’s Healthcare of Atlanta, Inc., Series A |
4.000 | % | 7/1/44 | $ | 3,500,000 | $ | 3,712,413 | |||||||||
| Dahlonega, GA, Downtown Development Authority Revenue: |
||||||||||||||||
| North Georgia MAC LLC Project, Refunding |
5.000 | % | 7/1/31 | 1,400,000 | 1,570,481 | |||||||||||
| North Georgia MAC LLC Project, Refunding |
5.000 | % | 7/1/34 | 770,000 | 865,569 | |||||||||||
| DeKalb County, GA, Water & Sewer Revenue, Series A |
5.250 | % | 10/1/26 | 2,500,000 | 2,508,225 | |||||||||||
| Georgia State Higher Education Facilities Authority Revenue, USG Real Estate, Refunding |
5.000 | % | 6/15/33 | 1,600,000 | 1,834,420 | |||||||||||
| Georgia State Municipal Electric Authority Power Revenue: |
||||||||||||||||
| Series A |
4.000 | % | 1/1/51 | 645,000 | 638,484 | |||||||||||
| Series A, AGM |
4.000 | % | 1/1/46 | 1,200,000 | 1,254,202 | |||||||||||
| Series A, AGM |
4.000 | % | 1/1/46 | 780,000 | 815,232 | |||||||||||
| Series A, Refunding |
5.000 | % | 1/1/34 | 850,000 | 997,518 | |||||||||||
| Series A, Refunding |
5.000 | % | 1/1/35 | 875,000 | 1,021,901 | |||||||||||
| Series A, Refunding |
5.000 | % | 1/1/36 | 1,075,000 | 1,254,248 | |||||||||||
| Series A, Refunding |
5.000 | % | 1/1/37 | 1,000,000 | 1,165,145 | |||||||||||
| Main Street Natural Gas Inc., GA, Gas Project Revenue: |
||||||||||||||||
| Series A |
5.000 | % | 5/15/33 | 2,750,000 | 3,031,200 | |||||||||||
| Series C |
4.000 | % | 9/1/26 | 2,125,000 | 2,217,232 | (a)(b) | ||||||||||
| Private Colleges & Universities Authority, GA, Revenue, Savannah College of Art & Design Inc. Project |
5.000 | % | 4/1/28 | 2,000,000 | 2,120,474 | (e) | ||||||||||
| Total Georgia |
25,006,744 | |||||||||||||||
| Guam — 0.1% |
||||||||||||||||
| Government of Guam, Business Privilege Tax Revenue, Series F, Refunding |
4.000 | % | 1/1/42 | 3,180,000 | 3,195,721 | |||||||||||
| Illinois — 11.7% |
||||||||||||||||
| Chicago, IL, Board of Education, Dedicated Capital Improvement, Special Tax Revenue: |
||||||||||||||||
| Series 2017 |
5.000 | % | 4/1/42 | 1,700,000 | 1,815,025 | |||||||||||
| Series 2018 |
5.000 | % | 4/1/36 | 1,270,000 | 1,369,213 | |||||||||||
| Series 2018 |
5.000 | % | 4/1/37 | 1,400,000 | 1,507,865 | |||||||||||
| Chicago, IL, Board of Education, GO: |
||||||||||||||||
| Dedicated, Series A |
5.000 | % | 12/1/38 | 1,500,000 | 1,631,975 | |||||||||||
See Notes to Financial Statements.
| Western Asset Intermediate-Term Municipals Fund 2022 Annual Report |
|
19 |
|
Schedule of investments (cont’d)
March 31, 2022
Western Asset Intermediate-Term Municipals Fund
(Percentages shown based on Fund net assets)
| Security | Rate | Maturity Date |
Face Amount |
Value | ||||||||||||
| Illinois — continued |
||||||||||||||||
| Dedicated, Series A |
5.000 | % | 12/1/43 | $ | 18,000,000 | $ | 19,520,924 | |||||||||
| Dedicated, Series G, Refunding |
5.000 | % | 12/1/34 | 2,230,000 | 2,404,056 | |||||||||||
| Series A |
5.000 | % | 12/1/32 | 6,050,000 | 6,644,013 | |||||||||||
| Series A |
5.000 | % | 12/1/35 | 1,450,000 | 1,583,646 | |||||||||||
| Series A |
5.000 | % | 12/1/37 | 2,540,000 | 2,769,986 | |||||||||||
| Series A |
5.000 | % | 12/1/40 | 1,750,000 | 1,897,958 | |||||||||||
| Series A, Refunding |
5.000 | % | 12/1/29 | 2,500,000 | 2,753,428 | |||||||||||
| Series C, Refunding |
5.000 | % | 12/1/24 | 2,500,000 | 2,650,516 | |||||||||||
| Series C, Refunding |
5.000 | % | 12/1/25 | 1,000,000 | 1,076,199 | |||||||||||
| Series D |
5.000 | % | 12/1/46 | 1,000,000 | 1,067,759 | |||||||||||
| Chicago, IL, GO: |
||||||||||||||||
| Series A |
5.000 | % | 1/1/40 | 7,075,000 | 7,651,973 | |||||||||||
| Series A |
5.000 | % | 1/1/44 | 2,200,000 | 2,365,023 | |||||||||||
| Series A, Refunding |
5.000 | % | 1/1/25 | 4,000,000 | 4,250,113 | |||||||||||
| Series A, Refunding |
5.000 | % | 1/1/26 | 1,250,000 | 1,344,386 | |||||||||||
| Series A, Refunding |
5.000 | % | 1/1/27 | 2,250,000 | 2,445,113 | |||||||||||
| Series C, Refunding |
5.000 | % | 1/1/25 | 2,765,000 | 2,937,890 | |||||||||||
| Chicago, IL, Metropolitan Water Reclamation District Greater Chicago, GO: |
||||||||||||||||
| Series B, Green Bond |
5.000 | % | 12/1/25 | 1,235,000 | 1,331,876 | (e) | ||||||||||
| Series B, Green Bond |
5.000 | % | 12/1/26 | 1,275,000 | 1,375,014 | (e) | ||||||||||
| Series B, Green Bond |
5.000 | % | 12/1/27 | 1,360,000 | 1,466,682 | (e) | ||||||||||
| Series B, Green Bond |
5.000 | % | 12/1/28 | 1,425,000 | 1,536,780 | (e) | ||||||||||
| Series B, Green Bond |
5.000 | % | 12/1/30 | 1,575,000 | 1,698,547 | (e) | ||||||||||
| Series B, Green Bond |
5.000 | % | 12/1/31 | 1,650,000 | 1,779,430 | (e) | ||||||||||
| Series B, Green Bond |
5.000 | % | 12/1/32 | 1,735,000 | 1,871,097 | (e) | ||||||||||
| Series B, Green Bond |
5.000 | % | 12/1/33 | 1,820,000 | 1,962,765 | (e) | ||||||||||
| Series B, Green Bond |
5.000 | % | 12/1/34 | 1,910,000 | 2,059,825 | (e) | ||||||||||
| Chicago, IL, O’Hare International Airport Revenue: |
||||||||||||||||
| Senior Lien, Series D |
5.250 | % | 1/1/36 | 7,445,000 | 8,272,874 | |||||||||||
| Senior Lien, Series D |
5.250 | % | 1/1/37 | 4,600,000 | 5,107,411 | |||||||||||
| Series A, Refunding |
5.000 | % | 1/1/33 | 2,145,000 | 2,275,512 | (c) | ||||||||||
| Series B, Refunding |
5.000 | % | 1/1/33 | 4,500,000 | 4,789,770 | |||||||||||
| Series B, Refunding |
5.000 | % | 1/1/34 | 10,505,000 | 11,152,761 | |||||||||||
| Series C |
5.000 | % | 1/1/30 | 6,010,000 | 6,385,509 | (c) | ||||||||||
| Trips Obligated Group |
5.000 | % | 7/1/38 | 1,500,000 | 1,658,421 | (c) | ||||||||||
| Chicago, IL, Transit Authority Revenue, Series A, Refunding |
5.000 | % | 12/1/45 | 5,900,000 | 6,638,920 | |||||||||||
See Notes to Financial Statements.
|
20 |
Western Asset Intermediate-Term Municipals Fund 2022 Annual Report |
Western Asset Intermediate-Term Municipals Fund
(Percentages shown based on Fund net assets)
| Security | Rate | Maturity Date |
Face Amount |
Value | ||||||||||||
| Illinois — continued |
||||||||||||||||
| Chicago, IL, Transit Authority, Sales Tax Receipts Revenue, Second Lien, Series A, Refunding |
4.000 | % | 12/1/50 | $ | 2,000,000 | $ | 2,104,726 | |||||||||
| Chicago, IL, Wastewater Transmission Revenue: |
||||||||||||||||
| Second Lien |
5.000 | % | 1/1/30 | 1,635,000 | 1,707,673 | |||||||||||
| Second Lien |
5.000 | % | 1/1/31 | 1,500,000 | 1,566,410 | |||||||||||
| Second Lien |
5.000 | % | 1/1/32 | 1,000,000 | 1,044,099 | |||||||||||
| Second Lien |
5.000 | % | 1/1/33 | 1,035,000 | 1,080,462 | |||||||||||
| Second Lien, Series B, Refunding |
5.000 | % | 1/1/36 | 4,000,000 | 4,399,236 | |||||||||||
| Chicago, IL, Waterworks Revenue: |
||||||||||||||||
| Second Lien Project |
5.000 | % | 11/1/30 | 1,785,000 | 1,896,459 | |||||||||||
| Second Lien Project |
5.000 | % | 11/1/31 | 2,000,000 | 2,125,399 | |||||||||||
| Second Lien Project |
5.000 | % | 11/1/33 | 1,500,000 | 1,593,663 | |||||||||||
| Second Lien Project |
5.000 | % | 11/1/34 | 1,000,000 | 1,061,670 | |||||||||||
| Second Lien, Refunding, AGM |
5.000 | % | 11/1/28 | 2,000,000 | 2,307,098 | |||||||||||
| Second Lien, Series 2017, Refunding |
5.000 | % | 11/1/29 | 1,600,000 | 1,810,543 | |||||||||||
| Cook County, IL, Sales Tax Revenue: |
||||||||||||||||
| Series A, Refunding |
5.000 | % | 11/15/32 | 1,415,000 | 1,666,135 | |||||||||||
| Series A, Refunding |
5.000 | % | 11/15/38 | 2,000,000 | 2,314,148 | |||||||||||
| Elk Grove Village, IL, GO: |
||||||||||||||||
| Property Tax |
5.000 | % | 1/1/29 | 550,000 | 617,118 | |||||||||||
| Property Tax |
5.000 | % | 1/1/30 | 885,000 | 990,040 | |||||||||||
| Illinois State Finance Authority Revenue: |
||||||||||||||||
| Benedictine University, Refunding, Series 2021 |
5.000 | % | 10/1/25 | 505,000 | 536,605 | |||||||||||
| Benedictine University, Refunding, Series 2021 |
5.000 | % | 10/1/27 | 630,000 | 683,963 | |||||||||||
| NorthShore University HealthSystem, Refunding, Series A |
5.000 | % | 8/15/33 | 1,000,000 | 1,172,334 | |||||||||||
| NorthShore University HealthSystem, Refunding, Series A |
5.000 | % | 8/15/34 | 2,000,000 | 2,338,535 | |||||||||||
| Provident Group - UIC Surgery Center LLC - University of Illinois Health Services Facility Project |
5.000 | % | 10/1/32 | 400,000 | 467,237 | |||||||||||
| Provident Group - UIC Surgery Center LLC - University of Illinois Health Services Facility Project |
5.000 | % | 10/1/34 | 430,000 | 500,879 | |||||||||||
See Notes to Financial Statements.
| Western Asset Intermediate-Term Municipals Fund 2022 Annual Report |
|
21 |
|
Schedule of investments (cont’d)
March 31, 2022
Western Asset Intermediate-Term Municipals Fund
(Percentages shown based on Fund net assets)
| Security | Rate | Maturity Date |
Face Amount |
Value | ||||||||||||
| Illinois — continued |
||||||||||||||||
| Provident Group - UIC Surgery Center LLC - University of Illinois Health Services Facility Project |
5.000 | % | 10/1/35 | $ | 395,000 | $ | 459,637 | |||||||||
| Provident Group - UIC Surgery Center LLC - University of Illinois Health Services Facility Project |
4.000 | % | 10/1/40 | 1,250,000 | 1,326,060 | |||||||||||
| Illinois State Finance Authority Revenue, Student Housing & Academic Facilities Revenue, Chicago LLC, University of Illinois Chicago Project, Series A |
5.000 | % | 2/15/37 | 700,000 | 754,466 | |||||||||||
| Illinois State Sports Facilities Authority Revenue: |
||||||||||||||||
| State Tax Supported, Refunding, AGM |
5.250 | % | 6/15/30 | 5,000,000 | 5,244,142 | |||||||||||
| State Tax Supported, Refunding, AGM |
5.250 | % | 6/15/31 | 8,000,000 | 8,380,178 | |||||||||||
| State Tax Supported, Refunding, AGM |
5.250 | % | 6/15/32 | 9,500,000 | 9,937,008 | |||||||||||
| Illinois State Toll Highway Authority Revenue, Series C, Refunding |
5.000 | % | 1/1/25 | 5,000,000 | 5,393,674 | |||||||||||
| Illinois State University, Auxiliary Facilities System Revenue: |
||||||||||||||||
| Series A, Refunding, AGM |
5.000 | % | 4/1/26 | 510,000 | 562,179 | |||||||||||
| Series A, Refunding, AGM |
5.000 | % | 4/1/28 | 475,000 | 542,612 | |||||||||||
| Illinois State, GO: |
||||||||||||||||
| Series 2016 |
5.000 | % | 11/1/33 | 3,150,000 | 3,415,976 | |||||||||||
| Series 2016, Refunding |
5.000 | % | 2/1/29 | 2,200,000 | 2,405,502 | |||||||||||
| Series A |
5.000 | % | 3/1/33 | 5,000,000 | 5,620,268 | |||||||||||
| Series A |
5.000 | % | 3/1/34 | 4,000,000 | 4,483,524 | |||||||||||
| Series A |
5.000 | % | 3/1/35 | 2,300,000 | 2,565,745 | |||||||||||
| Series A |
5.000 | % | 5/1/36 | 4,665,000 | 5,057,577 | |||||||||||
| Series A |
5.000 | % | 5/1/39 | 4,800,000 | 5,191,979 | |||||||||||
| Series A, Refunding |
5.000 | % | 10/1/27 | 12,805,000 | 14,113,216 | |||||||||||
| Series A, Refunding |
5.000 | % | 10/1/28 | 2,000,000 | 2,230,605 | |||||||||||
| Series A, Refunding |
5.000 | % | 10/1/30 | 1,275,000 | 1,407,778 | |||||||||||
| Series B, Refunding |
5.000 | % | 9/1/27 | 6,015,000 | 6,627,089 | |||||||||||
| Series B, Refunding |
5.000 | % | 10/1/27 | 3,000,000 | 3,306,494 | |||||||||||
| Series D |
5.000 | % | 11/1/27 | 6,975,000 | 7,689,866 | |||||||||||
| Kane County, IL, School District #131 Aurora East Side, GO, Series A, AGM |
4.000 | % | 12/1/35 | 800,000 | 864,406 | |||||||||||
See Notes to Financial Statements.
|
22 |
Western Asset Intermediate-Term Municipals Fund 2022 Annual Report |
Western Asset Intermediate-Term Municipals Fund
(Percentages shown based on Fund net assets)
| Security | Rate | Maturity Date |
Face Amount |
Value | ||||||||||||
| Illinois — continued |
||||||||||||||||
| Metropolitan Pier & Exposition Authority, IL, Revenue: |
||||||||||||||||
| McCormick Place Expansion Project, Series A, Refunding |
4.000 | % | 12/15/42 | $ | 7,400,000 | $ | 7,417,377 | |||||||||
| McCormick Place Expansion Project, Series A, Refunding |
4.000 | % | 6/15/50 | 14,500,000 | 14,416,436 | |||||||||||
| McCormick Place Expansion Project, Series A, Refunding |
5.000 | % | 6/15/50 | 14,000,000 | 14,938,143 | |||||||||||
| McCormick Place Expansion Project, Series B, Refunding |
5.000 | % | 12/15/28 | 2,000,000 | 2,205,047 | |||||||||||
| McCormick Place Expansion Project, Series B, Refunding |
5.000 | % | 12/15/30 | 625,000 | 684,870 | |||||||||||
| Regional Transportation Authority, IL, GO: |
||||||||||||||||
| Series A |
4.000 | % | 6/1/46 | 10,920,000 | 11,382,312 | |||||||||||
| Series A, Refunding, NATL |
6.000 | % | 7/1/29 | 12,990,000 | 15,362,900 | |||||||||||
| Sales Tax Securitization Corp., IL, Series A, Refunding |
5.000 | % | 1/1/28 | 1,750,000 | 1,968,365 | |||||||||||
| University of Illinois, COP: |
||||||||||||||||
| Series C, Refunding |
5.000 | % | 3/15/25 | 1,250,000 | 1,322,677 | |||||||||||
| Series C, Refunding |
5.000 | % | 3/15/26 | 1,800,000 | 1,900,755 | |||||||||||
| Total Illinois |
334,213,550 | |||||||||||||||
| Indiana — 1.1% |
||||||||||||||||
| Indiana State Finance Authority, Health System Revenue, Indiana University Health, Series B |
2.250 | % | 7/1/25 | 2,350,000 | 2,377,656 | (a)(b) | ||||||||||
| Indiana State Finance Authority Environmental Facilities Revenue, Indianapolis Power & Light Company Project, Series A, Refunding |
1.400 | % | 8/1/29 | 7,000,000 | 6,164,951 | |||||||||||
| Indiana State Finance Authority Revenue, Marion General Hospital, Series A |
4.000 | % | 7/1/45 | 2,750,000 | 2,925,327 | |||||||||||
| Indiana State Health Facility Financing Authority Revenue: |
||||||||||||||||
| Ascension Health Credit Group |
5.000 | % | 11/15/35 | 6,000,000 | 6,547,772 | |||||||||||
| Ascension Health Credit Group |
5.000 | % | 11/15/36 | 4,000,000 | 4,362,278 | |||||||||||
| Indianapolis, IN, Local Public Improvement Bond Bank: |
||||||||||||||||
| Indianapolis Airport Authority Project, Revenue, Series D, Refunding |
5.000 | % | 1/1/26 | 2,900,000 | 3,154,749 | (c) | ||||||||||
See Notes to Financial Statements.
| Western Asset Intermediate-Term Municipals Fund 2022 Annual Report |
|
23 |
|
Schedule of investments (cont’d)
March 31, 2022
Western Asset Intermediate-Term Municipals Fund
(Percentages shown based on Fund net assets)
| Security | Rate | Maturity Date |
Face Amount |
Value | ||||||||||||
| Indiana — continued |
||||||||||||||||
| Indianapolis Airport Authority Project, Series A |
5.000 | % | 1/1/27 | $ | 4,500,000 | $ | 4,980,802 | (c) | ||||||||
| Valparaiso, IN, Exempt Facility Revenue, Pratt Paper LLC Project |
5.875 | % | 1/1/24 | 300,000 | 310,293 | (c) | ||||||||||
| Total Indiana |
30,823,828 | |||||||||||||||
| Kansas — 0.0%†† |
||||||||||||||||
| Wyandotte County, KS, Turner Unified School District #202, GO, Series A, AGM |
4.000 | % | 9/1/36 | 775,000 | 812,778 | |||||||||||
| Kentucky — 1.7% |
||||||||||||||||
| Carroll County, KY, Environmental Facilities Revenue, Kentucky Utilities Company Project, Series A |
1.750 | % | 9/1/26 | 5,000,000 | 4,739,992 | (a)(b)(c) | ||||||||||
| Carroll County, KY, PCR, Kentucky Utilities Company Project, Series A, Refunding |
1.550 | % | 9/1/26 | 6,000,000 | 5,748,373 | (a)(b) | ||||||||||
| Kentucky State PEA, Gas Supply Revenue, Series A |
4.000 | % | 6/1/26 | 13,750,000 | 14,480,139 | (a)(b) | ||||||||||
| Kentucky State Turnpike Authority Economic Development Road Revenue: |
||||||||||||||||
| Revitalization Project, Series B, Refunding |
5.000 | % | 7/1/27 | 1,435,000 | 1,622,773 | |||||||||||
| Revitalization Project, Series B, Refunding |
5.000 | % | 7/1/28 | 1,000,000 | 1,134,551 | |||||||||||
| Louisville/Jefferson County, KY, Metropolitan Government Health System Revenue: |
||||||||||||||||
| Gas and Electric Company Project, Series A |
1.750 | % | 7/1/26 | 2,250,000 | 2,225,355 | (a)(b) | ||||||||||
| Norton Healthcare Inc., Series C |
5.000 | % | 10/1/26 | 5,000,000 | 5,573,530 | (a)(b) | ||||||||||
| Owensboro, KY, Electric Light & Power System Revenue: |
||||||||||||||||
| Series B, Refunding |
4.000 | % | 1/1/23 | 1,600,000 | 1,627,451 | |||||||||||
| Series B, Refunding |
5.000 | % | 1/1/24 | 1,350,000 | 1,417,578 | |||||||||||
| Series B, Refunding |
5.000 | % | 1/1/27 | 650,000 | 729,632 | |||||||||||
| Trimble County, KY, Revenue, Louisville Gas and Electric Company Project, Series A, Refunding |
1.300 | % | 9/1/27 | 9,000,000 | 8,243,090 | (a)(b)(c) | ||||||||||
| Total Kentucky |
47,542,464 | |||||||||||||||
| Louisiana — 1.2% |
||||||||||||||||
| Louisiana Local Government Environmental Facilities & Community Development Authority Revenue, East Baton Rouge Sewerage Commission Project, Series B, Refunding |
0.875 | % | 2/1/25 | 7,000,000 | 6,718,853 | (a)(b) | ||||||||||
| Louisiana State Offshore Terminal Authority Revenue, Loop LLC Project, Series A |
1.650 | % | 12/1/23 | 5,015,000 | 4,981,174 | (a)(b) | ||||||||||
See Notes to Financial Statements.
|
24 |
Western Asset Intermediate-Term Municipals Fund 2022 Annual Report |
Western Asset Intermediate-Term Municipals Fund
(Percentages shown based on Fund net assets)
| Security | Rate | Maturity Date |
Face Amount |
Value | ||||||||||||
| Louisiana — continued |
||||||||||||||||
| Shreveport, LA, Water & Sewer Revenue: |
||||||||||||||||
| Refunding, AGM |
5.000 | % | 12/1/28 | $ | 2,440,000 | $ | 2,685,959 | |||||||||
| Refunding, AGM |
5.000 | % | 12/1/29 | 2,000,000 | 2,200,123 | |||||||||||
| St. Charles Parish, LA, Gulf Opportunity Zone Revenue, Valero Energy Corp., Convertible |
4.000 | % | 6/1/22 | 10,000,000 | 10,033,738 | (a)(b) | ||||||||||
| St. John the Baptist Parish, LA, State Revenue: |
||||||||||||||||
| Marathon Oil Corp. Project, Refunding |
2.125 | % | 7/1/24 | 5,250,000 | 5,177,918 | (a)(b) | ||||||||||
| Marathon Oil Corp. Project, Refunding |
2.200 | % | 7/1/26 | 3,750,000 | 3,631,269 | (a)(b) | ||||||||||
| Total Louisiana |
35,429,034 | |||||||||||||||
| Maryland — 0.3% |
||||||||||||||||
| Maryland State EDC, Student Housing Revenue: |
||||||||||||||||
| University of Maryland College Park Project, Refunding, AGM |
4.000 | % | 6/1/26 | 625,000 | 670,465 | |||||||||||
| University of Maryland College Park Project, Refunding, AGM |
5.000 | % | 6/1/27 | 1,400,000 | 1,553,979 | |||||||||||
| University of Maryland College Park Project, Refunding, AGM |
5.000 | % | 6/1/30 | 1,550,000 | 1,714,302 | |||||||||||
| University of Maryland College Park Project, Refunding, AGM |
5.000 | % | 6/1/31 | 1,000,000 | 1,106,719 | |||||||||||
| Maryland State Stadium Authority Built to Learn Revenue, Series A |
4.000 | % | 6/1/47 | 4,000,000 | 4,215,145 | |||||||||||
| Total Maryland |
9,260,610 | |||||||||||||||
| Massachusetts — 1.5% |
||||||||||||||||
| Massachusetts State Department of Transportation, Metropolitan Highway System Revenue: |
||||||||||||||||
| Series B-1, Refunding |
5.000 | % | 1/1/35 | 1,000,000 | 1,163,001 | |||||||||||
| Series B-1, Refunding |
5.000 | % | 1/1/36 | 2,000,000 | 2,324,167 | |||||||||||
| Series B-1, Refunding |
5.000 | % | 1/1/37 | 1,000,000 | 1,160,801 | |||||||||||
| Massachusetts State DFA Revenue: |
||||||||||||||||
| Brandeis University, Series S-1, Refunding |
5.000 | % | 10/1/34 | 1,740,000 | 2,015,642 | |||||||||||
| Brandeis University, Series S-1, Refunding |
5.000 | % | 10/1/38 | 1,210,000 | 1,395,928 | |||||||||||
| Dana-Farber Cancer Institute, Series N |
5.000 | % | 12/1/34 | 2,000,000 | 2,230,084 | |||||||||||
| Foxborough Regional Charter School, Series B, Refunding |
5.000 | % | 7/1/37 | 1,000,000 | 1,058,358 | |||||||||||
| Mass General Brigham Issue, Series A-1 |
5.000 | % | 1/31/30 | 4,000,000 | 4,705,395 | (a)(b) | ||||||||||
| Partners Healthcare System, Refunding |
5.000 | % | 7/1/37 | 1,500,000 | 1,701,792 | |||||||||||
| Seven Hills Foundation and Affiliates Issue, Refunding |
4.000 | % | 9/1/39 | 580,000 | 605,429 | |||||||||||
See Notes to Financial Statements.
| Western Asset Intermediate-Term Municipals Fund 2022 Annual Report |
|
25 |
|
Schedule of investments (cont’d)
March 31, 2022
Western Asset Intermediate-Term Municipals Fund
(Percentages shown based on Fund net assets)
| Security | Rate | Maturity Date |
Face Amount |
Value | ||||||||||||
| Massachusetts — continued |
||||||||||||||||
| Sterling and Francine Clark Art Institute, Refunding |
5.000 | % | 7/1/36 | $ | 3,035,000 | $ | 3,291,462 | |||||||||
| UMass Boston Student Housing Project |
5.000 | % | 10/1/28 | 2,900,000 | 3,182,931 | |||||||||||
| Wellforce Issue, Series A |
5.000 | % | 7/1/34 | 1,325,000 | 1,503,697 | |||||||||||
| Massachusetts State Port Authority Revenue: |
||||||||||||||||
| Series A |
5.000 | % | 7/1/33 | 4,880,000 | 5,526,756 | (c) | ||||||||||
| Series E |
5.000 | % | 7/1/46 | 4,000,000 | 4,523,151 | (c) | ||||||||||
| Massachusetts State Water Resources Authority Revenue, General, Series C, Green Bond, Refunding |
4.000 | % | 8/1/36 | 7,000,000 | 7,445,126 | |||||||||||
| Total Massachusetts |
43,833,720 | |||||||||||||||
| Michigan — 2.4% |
||||||||||||||||
| Detroit, MI, Downtown Development Authority, Tax Increment Revenue: |
||||||||||||||||
| Series A, Refunding, AGM |
5.000 | % | 7/1/36 | 2,000,000 | 2,111,429 | |||||||||||
| Series A, Refunding, AGM |
5.000 | % | 7/1/38 | 1,350,000 | 1,424,609 | |||||||||||
| Great Lakes, MI, Water Authority Water Supply System Revenue: |
||||||||||||||||
| Senior Lien, Series C, Refunding |
5.000 | % | 7/1/33 | 7,700,000 | 8,560,058 | |||||||||||
| Senior Lien, Series C, Refunding |
5.000 | % | 7/1/35 | 4,500,000 | 4,998,775 | |||||||||||
| Kent County, MI, Gerald R. Ford International Airport, GO, Authority Revenue, County Guaranty |
5.000 | % | 1/1/46 | 1,000,000 | 1,143,944 | (c) | ||||||||||
| Michigan Finance Authority Revenue, Tobacco Settlement Asset-Backed, Series A-1, Refunding |
4.000 | % | 6/1/39 | 1,850,000 | 1,944,200 | |||||||||||
| Michigan State Finance Authority Revenue: |
||||||||||||||||
| Detroit School District, Series A, Refunding, Q-SBLF |
5.000 | % | 5/1/23 | 2,000,000 | 2,070,854 | |||||||||||
| Detroit School District, Series A, Refunding, Q-SBLF |
5.000 | % | 5/1/24 | 2,000,000 | 2,125,164 | |||||||||||
| Detroit School District, Series A, Refunding, Q-SBLF |
5.000 | % | 5/1/25 | 1,500,000 | 1,634,911 | |||||||||||
| Hospital Revenue, Trinity Health Credit Group, Series A, Refunding |
5.000 | % | 12/1/42 | 2,250,000 | 2,519,035 | |||||||||||
| Local Government Loan Program, Detroit, MI, Water & Sewer Department, Second Lien Local Project, Series C, Refunding |
5.000 | % | 7/1/33 | 1,500,000 | 1,621,541 | |||||||||||
| Local Government Loan Program, Detroit, MI, Water & Sewer Department, Series D2, Refunding, AGM |
5.000 | % | 7/1/24 | 11,500,000 | 12,241,952 | |||||||||||
See Notes to Financial Statements.
|
26 |
Western Asset Intermediate-Term Municipals Fund 2022 Annual Report |
Western Asset Intermediate-Term Municipals Fund
(Percentages shown based on Fund net assets)
| Security | Rate | Maturity Date |
Face Amount |
Value | ||||||||||||
| Michigan — continued |
||||||||||||||||
| Local Government Loan Program, Detroit, MI, Water & Sewer Department, Series D2, Refunding, AGM |
5.000 | % | 7/1/28 | $ | 3,660,000 | $ | 3,902,785 | |||||||||
| Local Government Loan Program, Detroit, MI, Water & Sewer Department, Series D-2, Refunding |
5.000 | % | 7/1/34 | 700,000 | 756,264 | |||||||||||
| Michigan State Strategic Fund Limited Obligation Revenue: |
||||||||||||||||
| Consumers Energy Company Project |
1.800 | % | 10/1/24 | 6,500,000 | 6,500,887 | (a)(b)(c) | ||||||||||
| Graphic Packaging International, LLC Coated Recycled Machine Project, Green Bonds |
4.000 | % | 10/1/26 | 2,750,000 | 2,880,077 | (a)(b)(c) | ||||||||||
| I-75 Improvement Project |
5.000 | % | 12/31/43 | 4,000,000 | 4,358,948 | (c) | ||||||||||
| Michigan Senate Offices Project, Series A |
5.000 | % | 10/15/28 | 1,190,000 | 1,302,729 | |||||||||||
| Michigan Senate Offices Project, Series A |
5.000 | % | 10/15/31 | 1,640,000 | 1,792,437 | |||||||||||
| Michigan Senate Offices Project, Series A |
5.000 | % | 10/15/33 | 1,985,000 | 2,167,386 | |||||||||||
| Michigan Senate Offices Project, Series A |
5.000 | % | 10/15/35 | 1,000,000 | 1,090,461 | |||||||||||
| Walled Lake Consolidated School District, GO, Q-SBLF |
5.000 | % | 5/1/45 | 2,300,000 | 2,664,045 | |||||||||||
| Total Michigan |
69,812,491 | |||||||||||||||
| Mississippi — 0.4% |
||||||||||||||||
| Mississippi Hospital Equipment & Facilities Authority Revenue, North Mississippi Health Services, Series II, Refunding |
5.000 | % | 3/1/27 | 6,000,000 | 6,631,650 | (a)(b) | ||||||||||
| Mississippi State Development Bank Special Obligation: |
||||||||||||||||
| Jackson, Mississippi Sales Tax Revenue Infrastructure Project |
5.000 | % | 9/1/27 | 1,325,000 | 1,503,334 | |||||||||||
| Jackson, Mississippi Sales Tax Revenue Infrastructure Project |
5.000 | % | 9/1/29 | 1,750,000 | 2,036,373 | |||||||||||
| Total Mississippi |
10,171,357 | |||||||||||||||
| Missouri — 0.4% |
||||||||||||||||
| Cape Girardeau County, MO, IDA, Healthcare Facilities Revenue, Southeast Health |
4.000 | % | 3/1/41 | 1,250,000 | 1,292,026 | |||||||||||
| Kansas City, MO, IDA, Airport System Revenue: |
||||||||||||||||
| Kansas City International Airport Terminal Modernization Project, Series B |
5.000 | % | 3/1/35 | 3,250,000 | 3,618,044 | (c) | ||||||||||
| Kansas City International Airport Terminal Modernization Project, Series B |
5.000 | % | 3/1/36 | 4,000,000 | 4,449,590 | (c) | ||||||||||
See Notes to Financial Statements.
| Western Asset Intermediate-Term Municipals Fund 2022 Annual Report |
|
27 |
|
Schedule of investments (cont’d)
March 31, 2022
Western Asset Intermediate-Term Municipals Fund
(Percentages shown based on Fund net assets)
| Security | Rate | Maturity Date |
Face Amount |
Value | ||||||||||||
| Missouri — continued |
||||||||||||||||
| Kansas City International Airport Terminal Modernization Project, Series B |
5.000 | % | 3/1/37 | $ | 1,500,000 | $ | 1,666,937 | (c) | ||||||||
| Missouri State Health Senior Living Facilities Revenue, Lutheran Senior Services Projects, Series A |
5.000 | % | 2/1/34 | 1,350,000 | 1,447,680 | |||||||||||
| Total Missouri |
12,474,277 | |||||||||||||||
| Nebraska — 0.3% |
||||||||||||||||
| Central Plains, NE, Energy Project, Gas Project Revenue, Project #3, Series A, Refunding |
5.000 | % | 9/1/36 | 4,500,000 | 5,268,397 | |||||||||||
| Douglas County, NE, Hospital Authority No. 2 Revenue, Children’s Hospital Obligated Group |
5.000 | % | 11/15/25 | 2,100,000 | |
2,293,113 |
(a)(b) | |||||||||
| Total Nebraska |
7,561,510 | |||||||||||||||
| Nevada — 0.2% |
||||||||||||||||
| Clark County, NV, GO, Pledged Revenue, Stadium Improvements, Series A |
5.000 | % | 6/1/38 | 5,000,000 | 5,701,966 | |||||||||||
| New Hampshire — 0.0%†† |
||||||||||||||||
| National Finance Authority, NH, Solid Waste Disposal Revenue, Waste Management, Inc. Project, Series A2, Refunding |
2.150 | % | 7/1/24 | 1,500,000 | 1,486,336 | (a)(b)(c) | ||||||||||
| New Jersey — 6.8% |
||||||||||||||||
| Casino Reinvestment Development Authority, NJ, Luxury Tax Revenue: |
||||||||||||||||
| Refunding, AGM |
5.000 | % | 11/1/26 | 1,000,000 | 1,061,137 | |||||||||||
| Refunding, AGM |
5.000 | % | 11/1/27 | 1,500,000 | 1,589,102 | |||||||||||
| Refunding, AGM |
5.000 | % | 11/1/29 | 1,500,000 | 1,584,471 | |||||||||||
| Refunding, AGM |
5.000 | % | 11/1/31 | 1,000,000 | 1,054,192 | |||||||||||
| New Brunswick, NJ, Parking Authority, City GTD, Series A, Refunding, BAM |
5.000 | % | 9/1/35 | 2,000,000 | 2,195,741 | |||||||||||
| New Jersey State, GO, COVID-19 Emergency, Series A |
5.000 | % | 6/1/26 | 18,600,000 | 20,563,924 | |||||||||||
| New Jersey State EDA Revenue: |
||||||||||||||||
| Motor Vehicle Surcharges Revenue, Subordinated, Series A, Refunding |
5.000 | % | 7/1/33 | 3,000,000 | 3,281,236 | |||||||||||
| Provident Group - Rowan Properties LLC, Rowan University Housing Project |
5.000 | % | 1/1/30 | 2,400,000 | 2,469,763 | |||||||||||
| Provident Group - Rowan Properties LLC, Rowan University Housing Project, Series A |
5.000 | % | 1/1/35 | 1,750,000 | 1,794,909 | |||||||||||
| School Facilities Construction, Series BBB, Refunding |
5.500 | % | 6/15/31 | 2,000,000 | 2,302,984 | (e) | ||||||||||
| School Facilities Construction, Series DDD |
5.000 | % | 6/15/32 | 3,000,000 | 3,423,614 | (e) | ||||||||||
See Notes to Financial Statements.
|
28 |
Western Asset Intermediate-Term Municipals Fund 2022 Annual Report |
Western Asset Intermediate-Term Municipals Fund
(Percentages shown based on Fund net assets)
| Security | Rate | Maturity Date |
Face Amount |
Value | ||||||||||||
| New Jersey — continued |
||||||||||||||||
| School Facilities Construction, Series DDD |
5.000 | % | 6/15/33 | $ | 2,450,000 | $ | 2,680,017 | |||||||||
| School Facilities Construction, Series DDD |
5.000 | % | 6/15/35 | 1,000,000 | 1,090,861 | |||||||||||
| School Facilities Construction, Series DDD |
5.000 | % | 6/15/42 | 4,380,000 | 4,747,757 | |||||||||||
| School Facilities Construction, Series I, Refunding, State Appropriations (SIFMA Municipal Swap Index Yield + 1.600%) |
2.110 | % | 3/1/28 | 20,000,000 | 20,177,836 | (b) | ||||||||||
| School Facilities Construction, Series NN, Refunding |
5.000 | % | 3/1/24 | 4,060,000 | 4,170,814 | |||||||||||
| School Facilities Construction, Series QQQ |
4.000 | % | 6/15/39 | 1,000,000 | 1,032,213 | |||||||||||
| School Facilities Construction, Series S |
5.000 | % | 6/15/32 | 1,700,000 | 1,937,432 | |||||||||||
| School Facilities Construction, Series S |
4.000 | % | 6/15/37 | 1,250,000 | 1,300,115 | |||||||||||
| School Facilities Construction, Series S |
4.000 | % | 6/15/38 | 1,200,000 | 1,243,364 | |||||||||||
| School Facilities Construction, Series S |
4.000 | % | 6/15/41 | 1,750,000 | 1,799,302 | |||||||||||
| School Facilities Construction, Series WW, State Appropriations |
5.250 | % | 6/15/29 | 11,390,000 | |
12,518,140 |
(e) | |||||||||
| School Facilities Construction, Series WW, State Appropriations |
5.250 | % | 6/15/30 | 10,685,000 | 11,743,312 | (e) | ||||||||||
| Transit Transportation Project, Series A |
5.000 | % | 11/1/32 | 1,000,000 | 1,124,394 | |||||||||||
| Transit Transportation Project, Series A |
5.000 | % | 11/1/33 | 4,750,000 | 5,336,079 | |||||||||||
| New Jersey State EDA, Special Facility Revenue, Port Newark Container Terminal LLC Project, Refunding |
5.000 | % | 10/1/37 | 1,400,000 | 1,521,579 | (c) | ||||||||||
| New Jersey State Health Care Facilities Financing Authority: |
||||||||||||||||
| University Hospital, Series A, AGM |
5.000 | % | 7/1/25 | 2,350,000 | 2,547,054 | |||||||||||
| University Hospital, Series A, AGM |
5.000 | % | 7/1/28 | 2,000,000 | 2,166,068 | |||||||||||
| University Hospital, Series A, AGM |
5.000 | % | 7/1/30 | 1,200,000 | 1,298,803 | |||||||||||
| New Jersey State Transportation Trust Fund Authority Revenue: |
||||||||||||||||
| Federal Highway Reimbursement, Refunding, Series A |
5.000 | % | 6/15/24 | 1,500,000 | 1,593,990 | |||||||||||
| Federal Highway Reimbursement, Series A, Refunding |
5.000 | % | 6/15/29 | 6,500,000 | 7,195,681 | |||||||||||
| Transportation Program, Series AA |
4.000 | % | 6/15/37 | 2,250,000 | 2,340,208 | |||||||||||
| Transportation Program, Series AA |
5.000 | % | 6/15/37 | 2,000,000 | 2,250,245 | |||||||||||
| Transportation Program, Series AA |
5.000 | % | 6/15/37 | 3,165,000 | 3,610,560 | (f) | ||||||||||
| Transportation Program, Series AA |
4.000 | % | 6/15/38 | 3,000,000 | 3,108,411 | |||||||||||
| Transportation Program, Series AA |
5.000 | % | 6/15/38 | 3,000,000 | 3,366,082 | |||||||||||
| Transportation Program, Series AA, Refunding |
5.000 | % | 6/15/36 | 4,200,000 | 4,801,245 | (f) | ||||||||||
See Notes to Financial Statements.
| Western Asset Intermediate-Term Municipals Fund 2022 Annual Report |
|
29 |
|
Schedule of investments (cont’d)
March 31, 2022
Western Asset Intermediate-Term Municipals Fund
(Percentages shown based on Fund net assets)
| Security | Rate | Maturity Date |
Face Amount |
Value | ||||||||||||
| New Jersey — continued |
||||||||||||||||
| Transportation Program, Series BB |
4.000 | % | 6/15/36 | $ | 3,500,000 | $ | 3,637,966 | |||||||||
| Transportation System, Series A, Refunding |
5.000 | % | 12/15/27 | 1,625,000 | 1,823,520 | |||||||||||
| Transportation System, Series A, Refunding |
5.000 | % | 12/15/28 | 11,375,000 | 12,856,655 | |||||||||||
| New Jersey State Turnpike Authority Revenue: |
||||||||||||||||
| Series A, Refunding |
5.000 | % | 1/1/32 | 9,000,000 | 9,861,444 | |||||||||||
| Series A, Refunding |
5.000 | % | 1/1/33 | 10,230,000 | 11,193,784 | |||||||||||
| Tobacco Settlement Financing Corp., NJ, Revenue: |
||||||||||||||||
| Series A, Refunding |
5.000 | % | 6/1/35 | 3,250,000 | 3,595,627 | |||||||||||
| Series A, Refunding |
5.000 | % | 6/1/36 | 3,000,000 | 3,312,753 | |||||||||||
| Total New Jersey |
194,304,384 | |||||||||||||||
| New Mexico — 0.1% |
||||||||||||||||
| Farmington, NM, PCR, Public Service Co. Project, Refunding |
2.125 | % | 6/1/22 | 1,965,000 | 1,966,444 | (a)(b) | ||||||||||
| New York — 10.5% |
||||||||||||||||
| Hudson Yards Infrastructure Corp., NY, Second Indenture Revenue, Series A, Refunding |
5.000 | % | 2/15/35 | 10,000,000 | 11,178,582 | |||||||||||
| Long Island, NY, Power Authority: |
||||||||||||||||
| Series A, Refunding |
5.000 | % | 9/1/34 | 1,860,000 | 2,209,285 | |||||||||||
| Series A, Refunding |
5.000 | % | 9/1/38 | 1,400,000 | 1,630,020 | |||||||||||
| Series B |
1.500 | % | 9/1/26 | 5,500,000 | 5,300,035 | (a)(b) | ||||||||||
| Series B, Refunding |
5.000 | % | 9/1/32 | 5,820,000 | 6,484,543 | |||||||||||
| MTA, NY, Transportation Revenue: |
||||||||||||||||
| Green Bonds, Series A-2 |
5.000 | % | 11/15/24 | 1,315,000 | 1,407,648 | |||||||||||
| Green Bonds, Series C-1, Refunding |
4.000 | % | 11/15/37 | 1,750,000 | 1,803,998 | |||||||||||
| Green Bonds, Series D-1 |
5.000 | % | 11/15/43 | 1,650,000 | 1,823,661 | |||||||||||
| Green Bonds, Series E |
5.000 | % | 11/15/29 | 1,000,000 | 1,143,007 | |||||||||||
| Green Bonds, Series E, Refunding |
4.000 | % | 11/15/26 | 2,250,000 | 2,395,472 | |||||||||||
| Green Bonds, Series E, Refunding |
5.000 | % | 11/15/27 | 3,750,000 | 4,207,127 | |||||||||||
| Green Bonds, Series E, Refunding |
5.000 | % | 11/15/28 | 3,000,000 | 3,401,139 | |||||||||||
| Series A-2 |
5.000 | % | 5/15/30 | 5,250,000 | 6,027,048 | (a)(b) | ||||||||||
| Series B, Refunding |
5.000 | % | 11/15/37 | 1,660,000 | 1,810,133 | |||||||||||
| Nassau County, NY, Industrial Development Agency, Step bond, Continuing Care Retirement Community Revenue Project |
5.000 | % | 1/1/58 | 551,102 | 423,059 | (b) | ||||||||||
| New York City, NY, GO: |
||||||||||||||||
| Series C |
5.000 | % | 8/1/38 | 6,500,000 | 7,537,512 | |||||||||||
| Step bond, Subseries F-4 (5.000% to 12/1/25 then 9.000%) |
5.000 | % | 12/1/25 | 3,500,000 | 3,804,752 | (a)(b) | ||||||||||
| Subseries F-1 |
5.000 | % | 3/1/37 | 6,000,000 | 7,038,511 | |||||||||||
See Notes to Financial Statements.
|
30 |
Western Asset Intermediate-Term Municipals Fund 2022 Annual Report |
Western Asset Intermediate-Term Municipals Fund
(Percentages shown based on Fund net assets)
| Security | Rate | Maturity Date |
Face Amount |
Value | ||||||||||||
| New York — continued |
||||||||||||||||
| Subseries F-1 |
4.000 | % | 3/1/38 | $ | 1,000,000 | $ | 1,060,476 | |||||||||
| Subseries F-1 |
5.000 | % | 3/1/39 | 1,500,000 | 1,746,287 | |||||||||||
| Subseries F-1 |
4.000 | % | 3/1/40 | 1,500,000 | 1,584,380 | |||||||||||
| Subseries F-1 |
5.000 | % | 3/1/42 | 3,500,000 | 4,051,874 | |||||||||||
| New York City, NY, Industrial Development Agency Revenue: |
||||||||||||||||
| Yankee Stadium Project, Series A, Refunding, AGM |
5.000 | % | 3/1/28 | 500,000 | 566,315 | |||||||||||
| Yankee Stadium Project, Series A, Refunding, AGM |
5.000 | % | 3/1/29 | 1,500,000 | 1,718,841 | |||||||||||
| Yankee Stadium Project, Series A, Refunding, AGM |
5.000 | % | 3/1/30 | 1,600,000 | 1,850,761 | |||||||||||
| New York City, NY, Municipal Water Finance Authority, Water & Sewer System Revenue, Subordinated, Series BB-2, Refunding |
5.000 | % | 6/15/32 | 3,000,000 | 3,405,683 | |||||||||||
| New York City, NY, TFA Revenue Future Tax Secured: |
||||||||||||||||
| Series A |
4.000 | % | 11/1/38 | 3,000,000 | 3,184,783 | |||||||||||
| Series C |
4.000 | % | 5/1/38 | 3,500,000 | 3,715,580 | |||||||||||
| Series C |
4.000 | % | 5/1/39 | 5,000,000 | 5,299,573 | |||||||||||
| New York City, NY, TFA, Building Aid Revenue: |
||||||||||||||||
| Fiscal 2015, Series S-1, State Aid Withholding |
5.000 | % | 7/15/29 | 2,500,000 | 2,693,034 | |||||||||||
| Fiscal 2015, Series S-1, State Aid Withholding |
5.000 | % | 7/15/30 | 4,000,000 | 4,305,482 | |||||||||||
| Refunding, Series S-2A, State Aid Withholding |
5.000 | % | 7/15/29 | 2,500,000 | 2,917,460 | |||||||||||
| New York State Dormitory Authority, Sales Tax Revenue: |
||||||||||||||||
| Bidding Group 3, Series E, Refunding |
5.000 | % | 3/15/38 | 7,620,000 | 8,697,243 | |||||||||||
| State Supported, Series A |
5.000 | % | 3/15/40 | 6,000,000 | 6,696,704 | |||||||||||
| New York State Dormitory Authority, School Districts Revenue Financing Program, Series A, AGM |
5.000 | % | 10/1/29 | 7,800,000 | 9,070,787 | |||||||||||
| New York State Dormitory Authority, State Personal Income Tax Revenue: |
||||||||||||||||
| Bidding Group 4, Series A, Refunding |
5.000 | % | 3/15/44 | 9,565,000 | 10,725,408 | |||||||||||
| Series A, Unrefunded |
5.000 | % | 2/15/43 | 5,810,000 | 6,393,863 | |||||||||||
See Notes to Financial Statements.
| Western Asset Intermediate-Term Municipals Fund 2022 Annual Report |
|
31 |
|
Schedule of investments (cont’d)
March 31, 2022
Western Asset Intermediate-Term Municipals Fund
(Percentages shown based on Fund net assets)
| Security | Rate | Maturity Date |
Face Amount |
Value | ||||||||||||
| New York — continued |
||||||||||||||||
| New York State Liberty Development Corp., Liberty Revenue, 3 World Trade Center Project, Class 1, Refunding |
5.000 | % | 11/15/44 | $ | 10,000,000 | $ | 10,475,763 | (d) | ||||||||
| New York State Thruway Authority General Revenue: |
||||||||||||||||
| Junior Indebtedness Obligations, Junior Lien, Series A |
5.000 | % | 1/1/33 | 4,500,000 | 4,923,952 | |||||||||||
| Junior Indebtedness Obligations, Junior Lien, Series A |
5.000 | % | 1/1/34 | 2,100,000 | 2,297,055 | |||||||||||
| Junior Indebtedness Obligations, Junior Lien, Series A |
5.000 | % | 1/1/35 | 250,000 | 273,271 | |||||||||||
| Junior Indebtedness Obligations, Junior Lien, Series A |
5.000 | % | 1/1/36 | 2,115,000 | 2,310,287 | |||||||||||
| New York State Thruway Authority, State Personal Income Tax Revenue, Series A |
5.000 | % | 3/15/26 | 1,800,000 | 1,856,967 | |||||||||||
| New York State Transportation Development Corp., Special Facilities Revenue: |
||||||||||||||||
| Delta Air Lines Inc., LaGuardia Airport Terminals C and D Redevelopment Project |
5.000 | % | 1/1/30 | 4,750,000 | 5,213,372 | (c) | ||||||||||
| Delta Air Lines Inc., LaGuardia Airport Terminals C and D Redevelopment Project |
5.000 | % | 1/1/32 | 6,480,000 | 7,083,633 | (c) | ||||||||||
| LaGuardia Airport Terminal B Redevelopment Project, Series A |
5.000 | % | 7/1/34 | 1,000,000 | 1,050,759 | (c) | ||||||||||
| LaGuardia Airport Terminal B |
||||||||||||||||
| Redevelopment Project, Series A, AGM |
4.000 | % | 7/1/35 | 13,335,000 | 13,730,803 | (c) | ||||||||||
| LaGuardia Airport Terminal B Redevelopment Project, Series A, AGM |
4.000 | % | 7/1/37 | 8,000,000 | 8,227,712 | (c) | ||||||||||
| Series C |
5.000 | % | 12/1/29 | 2,500,000 | 2,809,808 | |||||||||||
| Terminal 4 John F. Kennedy International Airport Project, Series C, Refunding |
5.000 | % | 12/1/27 | 1,000,000 | 1,103,006 | |||||||||||
| New York State Urban Development Corp. Revenue: |
||||||||||||||||
| State Personal Income Tax, Refunding |
5.000 | % | 3/15/43 | 8,950,000 | 10,195,434 | |||||||||||
| State Personal Income Tax, Series A |
5.000 | % | 3/15/41 | 7,945,000 | 9,099,841 | |||||||||||
| State Personal Income Tax, Series A |
4.000 | % | 3/15/45 | 7,750,000 | 8,102,544 | |||||||||||
| Port Authority of New York & New Jersey Revenue: |
||||||||||||||||
| Consolidated Series One Hundred Eighty |
5.000 | % | 9/1/27 | 5,000,000 | 5,302,306 | (c) | ||||||||||
| Consolidated Series One Hundred Eighty |
5.000 | % | 9/1/28 | 5,000,000 | 5,298,687 | (c) | ||||||||||
| Series 194, Refunding |
5.000 | % | 10/15/33 | 10,000,000 | 10,925,933 | |||||||||||
| Series 226, Refunding |
5.000 | % | 10/15/39 | 3,105,000 | 3,559,474 | (c) | ||||||||||
See Notes to Financial Statements.
|
32 |
Western Asset Intermediate-Term Municipals Fund 2022 Annual Report |
Western Asset Intermediate-Term Municipals Fund
(Percentages shown based on Fund net assets)
| Security | Rate | Maturity Date |
Face Amount |
Value | ||||||||||||
| New York — continued |
||||||||||||||||
| Triborough Bridge & Tunnel Authority, NY, Revenue: |
||||||||||||||||
| General-MTA Bridges & Tunnels, Series A |
5.000 | % | 11/15/43 | $ | 2,465,000 | $ | 2,810,278 | |||||||||
| General-MTA Bridges & Tunnels, Series A |
5.000 | % | 11/15/49 | 10,000,000 | 11,289,858 | |||||||||||
| General-MTA Bridges & Tunnels, Series A |
5.000 | % | 11/15/51 | 10,500,000 | 12,073,446 | |||||||||||
| Senior Lien, Series C-1A |
5.000 | % | 5/15/51 | 4,650,000 | 5,358,797 | |||||||||||
| Troy, NY, Capital Resource Corp., Revenue: |
||||||||||||||||
| Rensselaer Polytechnic Institute Project, Series A, Refunding |
5.000 | % | 9/1/36 | 500,000 | 582,198 | |||||||||||
| Rensselaer Polytechnic Institute Project, Series A, Refunding |
5.000 | % | 9/1/37 | 1,375,000 | 1,600,013 | |||||||||||
| Utility Debt Securitization Authority, NY, Revenue, Restructuring, Series TE |
5.000 | % | 12/15/27 | 3,000,000 | 3,157,306 | |||||||||||
| Total New York |
300,022,569 | |||||||||||||||
| North Carolina — 0.6% |
||||||||||||||||
| Charlotte, NC, COP, Series P |
5.000 | % | 6/1/44 | 2,380,000 | 2,739,282 | |||||||||||
| Charlotte, NC, Airport Revenue: |
||||||||||||||||
| Charlotte Douglas International Airport |
5.000 | % | 7/1/36 | 1,100,000 | 1,263,037 | |||||||||||
| Charlotte Douglas International Airport |
5.000 | % | 7/1/38 | 1,500,000 | 1,718,736 | |||||||||||
| Charlotte Douglas International Airport |
5.000 | % | 7/1/39 | 1,000,000 | 1,144,287 | |||||||||||
| Charlotte Douglas International Airport |
4.000 | % | 7/1/44 | 1,500,000 | 1,575,103 | |||||||||||
| North Carolina State Limited Obligation Revenue, Series A |
5.000 | % | 5/1/32 | 2,000,000 | 2,341,526 | |||||||||||
| North Carolina State Turnpike Authority: |
||||||||||||||||
| Triangle Expressway System Revenue, Senior Lien, Refunding |
5.000 | % | 1/1/43 | 4,000,000 | 4,506,563 | |||||||||||
| Triangle Expressway System Revenue, Senior Lien, Refunding, AGM |
5.000 | % | 1/1/31 | 500,000 | 560,337 | |||||||||||
| Total North Carolina |
15,848,871 | |||||||||||||||
| Ohio — 0.8% |
||||||||||||||||
| American Municipal Power Inc., OH, Revenue: |
||||||||||||||||
| AMP Fremont Energy Center Project, Series A, Refunding |
5.000 | % | 2/15/28 | 2,250,000 | 2,578,387 | |||||||||||
| AMP Fremont Energy Center Project, Series A, Refunding |
5.000 | % | 2/15/29 | 1,250,000 | 1,431,857 | |||||||||||
| AMP Fremont Energy Center Project, Series A, Refunding |
5.000 | % | 2/15/35 | 1,500,000 | 1,775,335 | |||||||||||
| Buckeye, OH, Tobacco Settlement Financing Authority Revenue: |
||||||||||||||||
| Senior Bonds, Series A-2, Refunding |
5.000 | % | 6/1/34 | 1,000,000 | 1,129,299 | |||||||||||
See Notes to Financial Statements.
| Western Asset Intermediate-Term Municipals Fund 2022 Annual Report |
|
33 |
|
Schedule of investments (cont’d)
March 31, 2022
Western Asset Intermediate-Term Municipals Fund
(Percentages shown based on Fund net assets)
| Security | Rate | Maturity Date |
Face Amount |
Value | ||||||||||||
| Ohio — continued |
||||||||||||||||
| Senior Bonds, Series A-2, Refunding |
5.000 | % | 6/1/35 | $ | 1,000,000 | $ | 1,127,322 | |||||||||
| Senior Bonds, Series A-2, Refunding |
5.000 | % | 6/1/36 | 750,000 | 844,126 | |||||||||||
| Senior Bonds, Series B-2, Refunding |
5.000 | % | 6/1/55 | 2,500,000 | 2,603,483 | |||||||||||
| Ohio State Air Quality Development Authority Revenue, American Electric Company Project, Series B, Refunding |
2.500 | % | 10/1/29 | 3,000,000 | 2,938,513 | (a)(b)(c) | ||||||||||
| Ohio State Higher Educational Facility Revenue: |
||||||||||||||||
| University of Dayton 2018 Project, Series B, Refunding |
5.000 | % | 12/1/32 | 1,000,000 | 1,136,351 | |||||||||||
| Xavier University 2020 Project, Series F, Refunding |
5.000 | % | 5/1/35 | 880,000 | 1,018,739 | |||||||||||
| Xavier University 2020 Project, Series F, Refunding |
5.000 | % | 5/1/36 | 925,000 | 1,069,902 | |||||||||||
| Xavier University 2020 Project, Series F, Refunding |
4.000 | % | 5/1/38 | 745,000 | 786,906 | |||||||||||
| Xavier University 2020 Project, Series F, Refunding |
4.000 | % | 5/1/40 | 600,000 | 631,864 | |||||||||||
| Ohio State Hospital Revenue: |
||||||||||||||||
| University Hospitals Health Systems Inc., Series E, Refunding |
5.000 | % | 1/15/35 | 1,000,000 | 1,120,551 | |||||||||||
| University Hospitals Health Systems Inc., Series E, Refunding |
5.000 | % | 1/15/36 | 1,200,000 | 1,343,615 | |||||||||||
| Ohio State Private Activity Revenue, Portsmouth Bypass Project |
5.000 | % | 12/31/39 | 800,000 | 848,580 | (c) | ||||||||||
| Total Ohio |
22,384,830 | |||||||||||||||
| Oregon — 0.8% |
||||||||||||||||
| Lane & Douglas Counties, OR, School District #28J Fern Ridge, GO: |
||||||||||||||||
| Convertible Deferred Interest, Series A, School Board Guaranty |
5.000 | % | 6/15/30 | 3,170,000 | 3,519,475 | |||||||||||
| Convertible Deferred Interest, Series A, School Board Guaranty |
5.000 | % | 6/15/36 | 2,000,000 | 2,238,557 | (e) | ||||||||||
| Medford, OR, Hospital Facilities Authority Revenue, Asante Project, Series A, Refunding |
5.000 | % | 8/15/45 | 2,000,000 | 2,270,700 | |||||||||||
| Multnomah County, OR, School District No 7, Reynolds, GO, Deferred Interest, Series B, School Board Guaranty |
0.000 | % | 6/15/31 | 2,000,000 | 1,432,469 | |||||||||||
| Oregon State Health & Science University, Revenue, Series B, Refunding |
5.000 | % | 7/1/35 | 4,650,000 | 5,161,420 | |||||||||||
See Notes to Financial Statements.
|
34 |
Western Asset Intermediate-Term Municipals Fund 2022 Annual Report |
Western Asset Intermediate-Term Municipals Fund
(Percentages shown based on Fund net assets)
| Security | Rate | Maturity Date |
Face Amount |
Value | ||||||||||||
| Oregon — continued |
||||||||||||||||
| Port of Portland, OR, Airport Revenue: |
||||||||||||||||
| Portland International Airport, Series 24B |
5.000 | % | 7/1/42 | $ | 1,530,000 | $ | 1,687,584 | (c) | ||||||||
| Portland International Airport, Series 26C, Refunding |
5.000 | % | 7/1/26 | 500,000 | 549,251 | (c) | ||||||||||
| Portland International Airport, Series 26C, Refunding |
5.000 | % | 7/1/27 | 1,000,000 | 1,116,200 | (c) | ||||||||||
| Washington Clackamas & Yamhill Counties, OR, School District #88J, GO, Sherwood, School Board Guaranty |
5.000 | % | 6/15/32 | 1,250,000 | 1,420,350 | |||||||||||
| Washington Multnomah & Yamhill Counties, OR, School District #1J West Union, GO, Hillsboro, School Board Guaranty |
5.000 | % | 6/15/34 | 3,000,000 | 3,408,839 | |||||||||||
| Total Oregon |
22,804,845 | |||||||||||||||
| Pennsylvania — 3.0% |
||||||||||||||||
| Berks County, PA, IDA, Healthcare Facilities Revenue: |
||||||||||||||||
| Highlands at Wyomissing, Refunding |
5.000 | % | 5/15/32 | 400,000 | 432,723 | |||||||||||
| Highlands at Wyomissing, Refunding |
5.000 | % | 5/15/37 | 375,000 | 403,845 | |||||||||||
| Commonwealth Financing Authority, PA, Tobacco Master Settlement Payment Revenue |
5.000 | % | 6/1/30 | 2,290,000 | 2,578,469 | |||||||||||
| Cumberland County, PA, Municipal Authority Revenue: |
||||||||||||||||
| Diakon Lutheran Social Ministries Project |
5.000 | % | 1/1/25 | 265,000 | 285,644 | (g) | ||||||||||
| Diakon Lutheran Social Ministries Project |
5.000 | % | 1/1/26 | 285,000 | 307,202 | (e) | ||||||||||
| Diakon Lutheran Social Ministries, Refunding |
5.000 | % | 1/1/25 | 660,000 | 711,415 | (g) | ||||||||||
| Diakon Lutheran Social Ministries, Refunding |
5.000 | % | 1/1/25 | 1,075,000 | 1,156,158 | |||||||||||
| Diakon Lutheran Social Ministries, Refunding |
5.000 | % | 1/1/26 | 715,000 | 770,699 | (e) | ||||||||||
| Diakon Lutheran Social Ministries, Refunding |
5.000 | % | 1/1/26 | 1,500,000 | 1,610,688 | |||||||||||
| Diakon Lutheran Social Ministries, Refunding |
5.000 | % | 1/1/27 | 300,000 | 323,370 | (e) | ||||||||||
| Diakon Lutheran Social Ministries, Refunding |
5.000 | % | 1/1/27 | 575,000 | 615,368 | |||||||||||
| Penn State Health |
4.000 | % | 11/1/35 | 2,000,000 | 2,121,964 | |||||||||||
| Lancaster County, PA, Hospital Authority Revenue: |
||||||||||||||||
| Penn State Health, Series 2021 |
5.000 | % | 11/1/38 | 1,000,000 | 1,142,340 | |||||||||||
See Notes to Financial Statements.
| Western Asset Intermediate-Term Municipals Fund 2022 Annual Report |
|
35 |
|
Schedule of investments (cont’d)
March 31, 2022
Western Asset Intermediate-Term Municipals Fund
(Percentages shown based on Fund net assets)
| Security |
Rate |
Maturity Date |
Face Amount |
Value |
||||||||||||
| Pennsylvania — continued |
||||||||||||||||
| Penn State Health, Series 2021 |
5.000 | % | 11/1/39 | $ | 1,100,000 | $ | 1,255,628 | |||||||||
| Penn State Health, Series 2021 |
5.000 | % | 11/1/40 | 1,300,000 | 1,481,897 | |||||||||||
| Penn State Health, Series 2021 |
5.000 | % | 11/1/41 | 1,725,000 | 1,961,439 | |||||||||||
| Penn State Health, Series 2021 |
5.000 | % | 11/1/46 | 3,900,000 | 4,384,829 | |||||||||||
| Luzerne County, PA, GO, Series A, Refunding, AGM |
5.000 | % | 11/15/29 | 3,000,000 | 3,291,365 | |||||||||||
| Pennsylvania State Turnpike Commission Revenue: |
||||||||||||||||
| Series A, Refunding |
5.000 | % | 12/1/47 | 4,750,000 | 5,509,814 | |||||||||||
| Series B |
5.000 | % | 12/1/36 | 1,000,000 | 1,185,272 | |||||||||||
| Series B |
5.000 | % | 12/1/37 | 1,750,000 | 2,067,494 | |||||||||||
| Series B |
5.000 | % | 12/1/38 | 2,000,000 | 2,350,673 | |||||||||||
| Series B |
5.000 | % | 12/1/39 | 3,000,000 | 3,515,457 | |||||||||||
| Series B |
5.000 | % | 12/1/40 | 2,250,000 | 2,632,552 | |||||||||||
| Series B |
5.000 | % | 12/1/45 | 2,000,000 | 2,295,329 | |||||||||||
| Subordinated, Series B |
4.000 | % | 12/1/46 | 3,500,000 | 3,626,939 | |||||||||||
| Philadelphia, PA, Airport Revenue: |
||||||||||||||||
| Series A, Refunding |
5.000 | % | 6/15/33 | 6,625,000 | 7,087,434 | (c) | ||||||||||
| Series A, Refunding |
5.000 | % | 6/15/34 | 6,955,000 | 7,440,469 | (c) | ||||||||||
| Philadelphia, PA, Authority for IDR, Lease Revenue, Refunding |
5.000 | % | 10/1/30 | 3,500,000 | 4,116,910 | |||||||||||
| Philadelphia, PA, GO: |
||||||||||||||||
| Series B |
5.000 | % | 2/1/35 | 2,100,000 | 2,421,927 | |||||||||||
| Series B |
5.000 | % | 2/1/36 | 1,500,000 | 1,728,522 | |||||||||||
| Philadelphia, PA, School District, GO, Series A, State Aid Withholding |
5.000 | % | 9/1/28 | 2,285,000 | 2,492,191 | |||||||||||
| Philadelphia, PA, Water & Wastewater Revenue, Series A |
5.000 | % | 11/1/45 | 6,300,000 | 7,268,791 | |||||||||||
| State Public School Building Authority, PA, Lease Revenue: |
||||||||||||||||
| Philadelphia SD Project, Series A, Refunding, AGM, State Aid Withholding |
5.000 | % | 6/1/31 | 1,380,000 | 1,535,536 | |||||||||||
| Philadelphia SD Project, Series A, Refunding, AGM, State Aid Withholding |
5.000 | % | 6/1/33 | 4,150,000 | 4,606,141 | |||||||||||
| Total Pennsylvania |
86,716,494 | |||||||||||||||
| Puerto Rico — 2.3% |
||||||||||||||||
| Puerto Rico Commonwealth Aqueduct & Sewer Authority Revenue: |
||||||||||||||||
| Senior Lien, Series A, Refunding |
5.000 | % | 7/1/47 | 8,155,000 | 8,899,943 | (d) | ||||||||||
| Senior Lien, Series B, Refunding |
5.000 | % | 7/1/28 | 1,120,000 | 1,244,031 | (d) | ||||||||||
See Notes to Financial Statements.
|
36 |
Western Asset Intermediate-Term Municipals Fund 2022 Annual Report |
Western Asset Intermediate-Term Municipals Fund
(Percentages shown based on Fund net assets)
| Security |
Rate |
Maturity Date |
Face Amount |
Value |
||||||||||||
| Puerto Rico — continued |
||||||||||||||||
| Puerto Rico Commonwealth, GO: |
||||||||||||||||
| CAB, Restructured, Series A-1 |
0.000 | % | 7/1/24 | $ | 79,186 | $ | 72,305 | |||||||||
| CAB, Restructured, Series A-1 |
0.000 | % | 7/1/33 | 198,105 | 114,716 | |||||||||||
| Restructured, Series A-1 |
5.250 | % | 7/1/23 | 171,928 | 176,164 | |||||||||||
| Restructured, Series A-1 |
5.375 | % | 7/1/25 | 171,446 | 181,045 | |||||||||||
| Restructured, Series A-1 |
5.625 | % | 7/1/27 | 169,893 | 185,759 | |||||||||||
| Restructured, Series A-1 |
5.625 | % | 7/1/29 | 167,137 | 186,727 | |||||||||||
| Restructured, Series A-1 |
5.750 | % | 7/1/31 | 162,338 | 185,308 | |||||||||||
| Restructured, Series A-1 |
4.000 | % | 7/1/33 | 153,940 | 150,682 | |||||||||||
| Restructured, Series A-1 |
4.000 | % | 7/1/35 | 138,371 | 133,934 | |||||||||||
| Restructured, Series A-1 |
4.000 | % | 7/1/37 | 118,759 | 114,413 | |||||||||||
| Restructured, Series A-1 |
4.000 | % | 7/1/41 | 161,467 | 153,940 | |||||||||||
| Restructured, Series A-1 |
4.000 | % | 7/1/46 | 167,923 | 158,682 | |||||||||||
| Subseries CW |
0.000 | % | 11/1/43 | 766,656 | 413,036 | (b) | ||||||||||
| Puerto Rico Electric Power Authority Revenue: |
||||||||||||||||
| Series A |
5.000 | % | 7/1/29 | 2,750,000 | 2,633,125 | *(h) | ||||||||||
| Series A |
5.000 | % | 7/1/42 | 3,370,000 | 3,226,775 | *(h) | ||||||||||
| Series A |
5.050 | % | 7/1/42 | 950,000 | 909,625 | *(h) | ||||||||||
| Series DDD, Refunding |
5.000 | % | 7/1/21 | 3,460,000 | 3,304,300 | *(i) | ||||||||||
| Series TT |
5.000 | % | 7/1/37 | 4,775,000 | 4,572,062 | *(h) | ||||||||||
| Series WW |
5.500 | % | 7/1/38 | 840,000 | 811,650 | *(h) | ||||||||||
| Series XX |
5.250 | % | 7/1/40 | 7,730,000 | 7,440,125 | *(h) | ||||||||||
| Series ZZ, Refunding |
5.000 | % | 7/1/18 | 250,000 | 238,750 | *(i) | ||||||||||
| Series ZZ, Refunding |
5.250 | % | 7/1/18 | 850,000 | 816,000 | *(i) | ||||||||||
| Series ZZ, Refunding |
5.250 | % | 7/1/25 | 370,000 | 356,125 | *(h) | ||||||||||
| Puerto Rico Sales Tax Financing Corp., Sales Tax Revenue: |
||||||||||||||||
| CAB, Restructured, Series A-1 |
0.000 | % | 7/1/27 | 3,680,000 | 3,153,689 | |||||||||||
| Restructured, Series A-1 |
4.550 | % | 7/1/40 | 680,000 | 713,946 | |||||||||||
| Restructured, Series A-1 |
4.750 | % | 7/1/53 | 3,750,000 | 3,943,781 | |||||||||||
| Restructured, Series A-1 |
5.000 | % | 7/1/58 | 11,000,000 | 11,722,696 | |||||||||||
| Restructured, Series A-2 |
4.329 | % | 7/1/40 | 1,130,000 | 1,171,781 | |||||||||||
| Restructured, Series A-2 |
4.329 | % | 7/1/40 | 2,170,000 | 2,251,777 | |||||||||||
| Restructured, Series A-2A |
4.550 | % | 7/1/40 | 6,040,000 | 6,341,517 | |||||||||||
| Total Puerto Rico |
65,978,409 | |||||||||||||||
See Notes to Financial Statements.
| Western Asset Intermediate-Term Municipals Fund 2022 Annual Report |
|
37 |
|
Schedule of investments (cont’d)
March 31, 2022
Western Asset Intermediate-Term Municipals Fund
(Percentages shown based on Fund net assets)
| Security |
Rate |
Maturity Date |
Face Amount |
Value |
||||||||||||
| Rhode Island — 0.2% |
||||||||||||||||
| Rhode Island State Health & Educational Building Corp. Revenue: |
||||||||||||||||
| Hospital Financing, Lifespan Obligated Group, Refunding |
5.000 | % | 5/15/28 | $ | 2,500,000 | $ | 2,747,008 | |||||||||
| Hospital Financing, Lifespan Obligated Group, Refunding |
5.000 | % | 5/15/29 | 2,000,000 | 2,191,458 | |||||||||||
| Hospital Financing, Lifespan Obligated Group, Refunding |
5.000 | % | 5/15/30 | 1,570,000 | 1,715,493 | |||||||||||
| Total Rhode Island |
6,653,959 | |||||||||||||||
| South Carolina — 0.5% |
||||||||||||||||
| Richland County, SC, Environmental Improvement Revenue, International Paper Co. Project, Series A, Refunding |
3.875 | % | 4/1/23 | 3,850,000 | 3,925,186 | (c) | ||||||||||
| SCAGO, SC, Educational Facilities Corp. for Pickens School District Revenue: |
||||||||||||||||
| Refunding |
5.000 | % | 12/1/29 | 3,500,000 | 3,815,850 | |||||||||||
| Refunding |
5.000 | % | 12/1/30 | 2,250,000 | 2,453,047 | |||||||||||
| South Carolina State Ports Authority Revenue: |
||||||||||||||||
| Series 2018 |
5.000 | % | 7/1/36 | 2,850,000 | 3,160,177 | (c) | ||||||||||
| Series 2018 |
5.000 | % | 7/1/37 | 2,000,000 | 2,216,248 | (c) | ||||||||||
| Total South Carolina |
15,570,508 | |||||||||||||||
| Tennessee — 1.8% |
||||||||||||||||
| Metropolitan Government of Nashville & Davidson County, TN, Water & Sewer Revenue: |
||||||||||||||||
| Subordinated, Green Bonds, Series A |
5.000 | % | 7/1/42 | 3,200,000 | 3,571,952 | |||||||||||
| Subordinated, Series B |
5.000 | % | 7/1/42 | 1,500,000 | 1,674,352 | |||||||||||
| Metropolitan Nashville, TN, Airport Authority Revenue: |
||||||||||||||||
| Series B |
5.000 | % | 7/1/25 | 1,500,000 | 1,613,275 | (c) | ||||||||||
| Series B |
5.000 | % | 7/1/26 | 1,750,000 | 1,914,999 | (c) | ||||||||||
| Tennessee State Energy Acquisition Corp., Gas Revenue, Series C |
5.000 | % | 2/1/24 | 25,000,000 | 26,235,710 | |||||||||||
| Tennessee State Energy Acquisition Corp., Natural Gas Revenue: |
||||||||||||||||
| Series 2018 |
4.000 | % | 11/1/25 | 9,000,000 | 9,302,302 | (a)(b) | ||||||||||
| Series A |
5.250 | % | 9/1/24 | 6,885,000 | 7,356,341 | |||||||||||
| Total Tennessee |
51,668,931 | |||||||||||||||
See Notes to Financial Statements.
|
38 |
Western Asset Intermediate-Term Municipals Fund 2022 Annual Report |
Western Asset Intermediate-Term Municipals Fund
(Percentages shown based on Fund net assets)
| Security |
Rate |
Maturity Date |
Face Amount |
Value |
||||||||||||
| Texas — 8.1% |
||||||||||||||||
| Arlington, TX, Higher Education Finance Corp., Education Revenue: |
||||||||||||||||
| Uplift Education, Series A, Refunding, PSF - GTD |
5.000 | % | 12/1/34 | $ | 650,000 | $ | 732,601 | |||||||||
| Uplift Education, Series A, Refunding, PSF - GTD |
5.000 | % | 12/1/36 | 915,000 | 1,030,866 | |||||||||||
| Uplift Education, Series A, Refunding, PSF - GTD |
5.000 | % | 12/1/37 | 700,000 | 788,451 | |||||||||||
| Arlington, TX, Special Tax Revenue, Subordinated Lien, Series C, BAM |
5.000 | % | 2/15/41 | 3,750,000 | 3,946,840 | |||||||||||
| Austin, TX, Airport System Revenue: |
||||||||||||||||
| Series 2014 |
5.000 | % | 11/15/30 | 2,730,000 | 2,894,913 | (c) | ||||||||||
| Series B |
5.000 | % | 11/15/30 | 5,640,000 | 6,455,172 | (c) | ||||||||||
| Bexar County, TX, Hospital District: |
||||||||||||||||
| GO |
5.000 | % | 2/15/29 | 1,500,000 | 1,738,728 | |||||||||||
| GO |
5.000 | % | 2/15/30 | 2,000,000 | 2,311,650 | |||||||||||
| GO |
5.000 | % | 2/15/31 | 2,250,000 | 2,594,157 | |||||||||||
| Central Texas Turnpike System Revenue: |
||||||||||||||||
| Second Tier, Series C, Refunding |
5.000 | % | 8/15/31 | 10,000,000 | 10,539,809 | |||||||||||
| Second Tier, Series C, Refunding |
5.000 | % | 8/15/32 | 10,000,000 | 10,531,885 | |||||||||||
| Central Texas, Regional Mobility Authority Revenue: |
||||||||||||||||
| Senior Lien, Series B |
5.000 | % | 1/1/46 | 3,750,000 | 4,266,324 | |||||||||||
| Senior Lien, Series E |
5.000 | % | 1/1/45 | 3,500,000 | 3,957,943 | |||||||||||
| Dallas, TX, Area Rapid Transit, Sales Tax Revenue: |
||||||||||||||||
| Series A, Refunding |
5.000 | % | 12/1/34 | 7,500,000 | 8,261,586 | (e) | ||||||||||
| Series A, Refunding |
5.000 | % | 12/1/36 | 4,250,000 | 4,681,565 | (e) | ||||||||||
| Dallas, TX, Hotel Occupancy Tax Revenue, Series 2021, Refunding |
4.000 | % | 8/15/35 | 2,500,000 | 2,646,499 | |||||||||||
| El Paso, TX, GO: |
||||||||||||||||
| Series A, Refunding |
5.000 | % | 8/15/31 | 1,250,000 | 1,461,853 | |||||||||||
| Series A, Refunding |
5.000 | % | 8/15/32 | 1,000,000 | 1,168,480 | |||||||||||
| Series A, Refunding |
5.000 | % | 8/15/33 | 1,000,000 | 1,167,507 | |||||||||||
| Tax and Revenue Certificates of Obligation |
5.000 | % | 8/15/31 | 860,000 | 1,005,755 | |||||||||||
| Grand Parkway Transportation Corp., TX, System Toll Revenue, First Tier Toll Revenue, Series C, Refunding |
4.000 | % | 10/1/40 | 5,375,000 | 5,704,626 | |||||||||||
| Gulf Coast, TX, IDA, Solid Waste Disposal Revenue, Citgo Petroleum Corp. Project |
4.875 | % | 5/1/25 | 3,000,000 | 3,008,280 | (c) | ||||||||||
See Notes to Financial Statements.
| Western Asset Intermediate-Term Municipals Fund 2022 Annual Report |
|
39 |
|
Schedule of investments (cont’d)
March 31, 2022
Western Asset Intermediate-Term Municipals Fund
(Percentages shown based on Fund net assets)
| Security |
Rate |
Maturity Date |
Face Amount |
Value |
||||||||||||
| Texas — continued |
||||||||||||||||
| Harris County, TX, Cultural Education Facilities Finance Corp., Thermal Utility Revenue, Teco Project, Refunding |
5.000 | % | 11/15/30 | $ | 600,000 | $ | 687,820 | |||||||||
| Harris County, TX, Houston Sports Authority Revenue, Senior Lien, Series A, Refunding, AGM |
5.000 | % | 11/15/25 | 9,000,000 | 9,639,008 | |||||||||||
| Houston, TX, Airport System Revenue: |
||||||||||||||||
| Special Facilities, United Airlines Inc., Airport Improvements Project |
5.000 | % | 7/15/28 | 4,500,000 | 4,930,325 | (c) | ||||||||||
| Special Facilities, United Airlines Inc., Technical Operations Center Project |
5.000 | % | 7/15/28 | 2,500,000 | 2,732,558 | (c) | ||||||||||
| Special Facilities, United Airlines Inc., Terminal Improvement Project, Series B1 |
4.000 | % | 7/15/41 | 6,000,000 | 5,853,934 | (c) | ||||||||||
| Subordinated Lien, Series A, Refunding |
5.000 | % | 7/1/33 | 1,500,000 | 1,738,787 | (c) | ||||||||||
| Subordinated Lien, Series A, Refunding |
5.000 | % | 7/1/34 | 1,750,000 | 2,019,766 | (c) | ||||||||||
| Subordinated Lien, Series A, Refunding |
4.000 | % | 7/1/35 | 1,500,000 | 1,579,764 | (c) | ||||||||||
| Subordinated Lien, Series A, Refunding |
4.000 | % | 7/1/36 | 1,500,000 | 1,578,126 | (c) | ||||||||||
| Subordinated Lien, Series C, Refunding |
5.000 | % | 7/1/30 | 2,630,000 | 2,953,540 | (c) | ||||||||||
| Subordinated Lien, Series C, Refunding |
5.000 | % | 7/1/32 | 2,250,000 | 2,518,064 | (c) | ||||||||||
| Subordinated Lien, Series D, Refunding |
5.000 | % | 7/1/30 | 1,665,000 | 1,894,322 | |||||||||||
| Subordinated Lien, Series D, Refunding |
5.000 | % | 7/1/31 | 1,800,000 | 2,043,390 | |||||||||||
| Houston, TX, Utility System Revenue: |
||||||||||||||||
| Combined First Lien, Series C, Refunding |
5.000 | % | 5/15/27 | 5,000,000 | 5,291,623 | |||||||||||
| Combined First Lien, Series C, Refunding |
5.000 | % | 5/15/28 | 5,000,000 | 5,300,158 | |||||||||||
| Love Field, TX, Airport Modernization Corp., General Airport Revenue, Series 2017 |
5.000 | % | 11/1/31 | 1,250,000 | 1,372,758 | (c) | ||||||||||
| Love Field, TX, Airport Modernization Corp., Special Facilities Revenue, Southwest Airlines Co. Project |
5.000 | % | 11/1/22 | 2,205,000 | 2,242,086 | (c) | ||||||||||
| Newark, TX, Higher Education Finance Corp., Education Revenue, TLC Academy, Series A |
4.000 | % | 8/15/31 | 1,500,000 | 1,531,791 | |||||||||||
| North Texas Tollway Authority Revenue: |
||||||||||||||||
| First Tier, Series A, Refunding |
5.000 | % | 1/1/32 | 2,500,000 | 2,740,231 | |||||||||||
| First Tier, Series A, Refunding |
5.000 | % | 1/1/36 | 500,000 | 560,060 | |||||||||||
| First Tier, Series A, Refunding |
5.000 | % | 1/1/37 | 1,305,000 | 1,461,134 | |||||||||||
| First Tier, Series B, Refunding |
5.000 | % | 1/1/34 | 17,310,000 | 18,567,376 | |||||||||||
| Second Tier, Series B, Refunding |
5.000 | % | 1/1/31 | 4,000,000 | 4,179,191 | |||||||||||
| Port Authority of Houston of Harris County, TX, GO: |
||||||||||||||||
| Series A, Refunding |
5.000 | % | 10/1/36 | 3,500,000 | 4,061,397 | (c) | ||||||||||
See Notes to Financial Statements.
|
40 |
Western Asset Intermediate-Term Municipals Fund 2022 Annual Report |
Western Asset Intermediate-Term Municipals Fund
(Percentages shown based on Fund net assets)
| Security | Rate | Maturity Date |
Face Amount |
Value | ||||||||||||
| Texas — continued |
||||||||||||||||
| Series A, Refunding |
5.000 | % | 10/1/37 | $ | 3,425,000 | $ | 3,972,602 | (c) | ||||||||
| Series A, Refunding |
5.000 | % | 10/1/38 | 3,500,000 | 4,054,576 | (c) | ||||||||||
| Socorro, TX, ISD, GO, School Building, PSF - GTD |
5.000 | % | 8/15/41 | 5,200,000 | 5,785,078 | |||||||||||
| Southwest Texas, Higher Education Authority Inc. Revenue, Southern Methodist University Project, Refunding |
5.000 | % | 10/1/41 | 1,750,000 | 1,997,691 | |||||||||||
| Tarrant County, TX, Cultural Education Facilities Finance Corp., Hospital Revenue: |
||||||||||||||||
| Buckner Senior Living Ventana Project, Series A |
6.625 | % | 11/15/37 | 1,590,000 | 1,705,956 | |||||||||||
| Methodist Hospitals of Dallas |
5.000 | % | 10/1/37 | 1,000,000 | 1,185,640 | |||||||||||
| Methodist Hospitals of Dallas |
5.000 | % | 10/1/39 | 1,650,000 | 1,949,422 | |||||||||||
| Methodist Hospitals of Dallas |
5.000 | % | 10/1/40 | 2,000,000 | 2,358,869 | |||||||||||
| Texas Private Activity Bond Surface Transportation Corp., Revenue, LBJ Infrastructure Group LLC I-635 Managed Lanes Project, Series L |
4.000 | % | 6/30/38 | 1,750,000 | 1,829,617 | |||||||||||
| Texas Public Finance Authority, Lease Revenue, Refunding |
4.000 | % | 2/1/35 | 2,000,000 | 2,201,552 | |||||||||||
| Texas State: |
||||||||||||||||
| Municipal Gas Acquisition & Supply Corp. I, Gas Supply Revenue, Senior Lien, Series D |
6.250 | % | 12/15/26 | 16,260,000 | 17,845,363 | |||||||||||
| Municipal Gas Acquisition & Supply Corp. III, Gas Supply Revenue, Refunding |
5.000 | % | 12/15/26 | 5,500,000 | 5,953,814 | |||||||||||
| Texas State Municipal Gas Acquisition & Supply Corp. III, Gas Supply Revenue, Refunding |
5.000 | % | 12/15/29 | 7,000,000 | 7,789,275 | |||||||||||
| Texas State Private Activity Bond Surface Transportation Corp. Revenue, LBJ Infrastructure Group LLC I-635 Managed Lanes Project, Series L |
4.000 | % | 12/31/38 | 800,000 | 836,397 | |||||||||||
| Texas State Public Finance Authority, Lease Revenue, Refunding |
4.000 | % | 2/1/36 | 2,325,000 | 2,557,268 | |||||||||||
| West Harris County, TX, Regional Water Authority, Series W |
4.000 | % | 12/15/45 | 2,100,000 | 2,276,922 | |||||||||||
| Total Texas |
232,672,741 | |||||||||||||||
| U.S. Virgin Islands — 0.3% |
||||||||||||||||
| Virgin Islands Public Finance Authority Revenue: |
||||||||||||||||
| Matching Fund Loan, Senior Lien, Series A |
5.000 | % | 10/1/29 | 1,490,000 | 1,493,444 | |||||||||||
See Notes to Financial Statements.
| Western Asset Intermediate-Term Municipals Fund 2022 Annual Report |
|
41 |
|
Schedule of investments (cont’d)
March 31, 2022
Western Asset Intermediate-Term Municipals Fund
(Percentages shown based on Fund net assets)
| Security | Rate | Maturity Date |
Face Amount |
Value | ||||||||||||
| U.S. Virgin Islands — continued |
||||||||||||||||
| Matching Fund Loan, Subordinated Lien, Series B |
5.000 | % | 10/1/25 | $ | 3,565,000 | $ | 3,540,352 | |||||||||
| Subordinated, Matching Fund Loan, Cruzan Project, Series A |
6.000 | % | 10/1/39 | 705,000 | 706,614 | |||||||||||
| Subordinated, Matching Fund Loan, Diageo Project, Series A |
6.625 | % | 10/1/29 | 3,050,000 | 3,074,845 | |||||||||||
| Total U.S. Virgin Islands |
8,815,255 | |||||||||||||||
| Utah — 0.3% |
||||||||||||||||
| Salt Lake City, UT, Airport Revenue, Series A |
5.000 | % | 7/1/34 | 3,000,000 | 3,299,453 | (c) | ||||||||||
| Utah State Charter School Finance Authority, Charter School Revenue, Syracuse Arts Academy Project, UT CSCE |
5.000 | % | 4/15/37 | 1,285,000 | 1,380,124 | |||||||||||
| Utah State Infrastructure Agency, Telecommunications Revenue: |
||||||||||||||||
| Series 2019 |
5.000 | % | 10/15/28 | 1,845,000 | 2,072,569 | |||||||||||
| Series 2019 |
4.000 | % | 10/15/33 | 600,000 | 629,908 | |||||||||||
| Series 2019 |
4.000 | % | 10/15/36 | 1,000,000 | 1,043,994 | |||||||||||
| Series 2021 |
4.000 | % | 10/15/32 | 500,000 | 526,878 | |||||||||||
| Series 2021 |
4.000 | % | 10/15/35 | 400,000 | 418,206 | |||||||||||
| Series 2021 |
4.000 | % | 10/15/36 | 200,000 | 208,717 | |||||||||||
| Total Utah |
9,579,849 | |||||||||||||||
| Vermont — 0.0%†† |
||||||||||||||||
| University of Vermont & State Agricultural College, Series A |
5.000 | % | 10/1/44 | 1,000,000 | 1,166,952 | |||||||||||
| Virginia — 1.3% |
||||||||||||||||
| Arlington County, VA, IDA Revenue, Virginia Hospital Center, Refunding |
5.000 | % | 7/1/28 | 1,150,000 | 1,332,706 | |||||||||||
| Hampton Roads, VA, Transportation Accountability Commission, Intermediate Lien, Series A |
5.000 | % | 7/1/22 | 5,000,000 | 5,048,917 | |||||||||||
| Virginia Beach, VA, Development Authority, Residential Care Facilities Revenue, Westminster - Canterbury on Chesapeake Bay, Refunding |
5.000 | % | 9/1/44 | 1,500,000 | 1,594,071 | |||||||||||
| Virginia State Small Business Financing Authority Revenue: |
||||||||||||||||
| Bon Secours Mercy Health, Series A, Refunding |
4.000 | % | 12/1/49 | 5,500,000 | 5,711,579 | |||||||||||
| Elizabeth River Crossings OpCo LLC Project |
5.000 | % | 1/1/24 | 1,760,000 | 1,772,935 | (c) | ||||||||||
See Notes to Financial Statements.
|
42 |
Western Asset Intermediate-Term Municipals Fund 2022 Annual Report |
Western Asset Intermediate-Term Municipals Fund
(Percentages shown based on Fund net assets)
| Security | Rate | Maturity Date |
Face Amount |
Value | ||||||||||||
| Virginia — continued |
||||||||||||||||
| National Senior Campuses, Inc., Series A, Refunding |
5.000 | % | 1/1/32 | $ | 1,000,000 | $ | 1,114,855 | |||||||||
| Senior Lien, Elizabeth River Crossing OpCo LLC Project |
5.000 | % | 7/1/24 | 2,900,000 | 2,921,313 | (c) | ||||||||||
| Senior Lien, Elizabeth River Crossing OpCo LLC Project |
5.000 | % | 7/1/25 | 3,875,000 | 3,903,384 | (c) | ||||||||||
| Senior Lien, Elizabeth River Crossing OpCo LLC Project |
5.000 | % | 1/1/26 | 3,290,000 | 3,314,099 | (c) | ||||||||||
| Senior Lien, Elizabeth River Crossing OpCo LLC Project |
5.000 | % | 7/1/26 | 4,700,000 | 4,734,427 | (c) | ||||||||||
| Senior Lien, I-495 Hot Lanes Project, Refunding |
5.000 | % | 6/30/42 | 2,125,000 | 2,399,711 | (c) | ||||||||||
| Senior Lien, I-495 Hot Lanes Project, Refunding |
5.000 | % | 12/31/42 | 2,000,000 | 2,258,551 | (c) | ||||||||||
| The Obligated Group of National Senior Campuses Inc., Series A |
5.000 | % | 1/1/31 | 1,000,000 | 1,116,318 | |||||||||||
| Total Virginia |
37,222,866 | |||||||||||||||
| Washington — 1.6% |
||||||||||||||||
| Energy Northwest, WA, Electric Revenue: |
||||||||||||||||
| Columbia Generating System, Series A, Refunding |
5.000 | % | 7/1/29 | 5,000,000 | 5,449,246 | |||||||||||
| Project One, Series A, Refunding |
5.000 | % | 7/1/27 | 8,500,000 | 9,277,685 | |||||||||||
| Project One, Series A, Refunding |
5.000 | % | 7/1/28 | 10,000,000 | 10,905,061 | |||||||||||
| Port of Seattle, WA, Intermediate Lien Revenue: |
||||||||||||||||
| Series 2019 |
5.000 | % | 4/1/31 | 3,160,000 | 3,590,037 | (c) | ||||||||||
| Series 2019 |
5.000 | % | 4/1/32 | 3,040,000 | 3,449,159 | (c) | ||||||||||
| Series A |
5.000 | % | 5/1/36 | 4,000,000 | 4,403,736 | (c) | ||||||||||
| Washington State Health Care Facilities Authority Revenue: |
||||||||||||||||
| Commonspirit Health, Series B, Refunding |
5.000 | % | 8/1/26 | 2,900,000 | 3,163,169 | (a)(b) | ||||||||||
| Seattle Cancer Care Alliance, Refunding |
5.000 | % | 9/1/38 | 625,000 | 722,114 | |||||||||||
| Seattle Cancer Care Alliance, Refunding |
5.000 | % | 9/1/39 | 500,000 | 576,813 | |||||||||||
| Seattle Cancer Care Alliance, Refunding |
5.000 | % | 9/1/40 | 700,000 | 806,333 | |||||||||||
| Seattle Cancer Care Alliance, Refunding |
5.000 | % | 9/1/45 | 2,000,000 | 2,283,084 | |||||||||||
| Total Washington |
44,626,437 | |||||||||||||||
| West Virginia — 0.4% |
||||||||||||||||
| West Virginia University Revenue, West Virginia Projects, Series B, Refunding |
5.000 | % | 10/1/29 | 3,750,000 | 4,356,215 | (a)(b) | ||||||||||
See Notes to Financial Statements.
| Western Asset Intermediate-Term Municipals Fund 2022 Annual Report |
|
43 |
|
Schedule of investments (cont’d)
March 31, 2022
Western Asset Intermediate-Term Municipals Fund
(Percentages shown based on Fund net assets)
| Security | Rate | Maturity Date |
Face Amount |
Value | ||||||||||||
| West Virginia — continued |
||||||||||||||||
| West Virginia, WV, Parkways Authority Revenue: |
||||||||||||||||
| Senior Lien |
5.000 | % | 6/1/32 | $ | 1,250,000 | $ | 1,519,573 | |||||||||
| Senior Lien |
5.000 | % | 6/1/34 | 1,000,000 | 1,207,162 | |||||||||||
| Senior Lien |
5.000 | % | 6/1/35 | 1,255,000 | 1,510,893 | |||||||||||
| Senior Lien |
5.000 | % | 6/1/39 | 1,500,000 | 1,792,279 | |||||||||||
| Total West Virginia |
10,386,122 | |||||||||||||||
| Wisconsin — 0.8% |
||||||||||||||||
| Central Brown County, WI, Water Authority System Revenue: |
||||||||||||||||
| Series A, Refunding |
5.000 | % | 11/1/31 | 2,510,000 | 2,688,159 | |||||||||||
| Series A, Refunding |
5.000 | % | 11/1/32 | 2,000,000 | 2,141,439 | |||||||||||
| Series A, Refunding |
5.000 | % | 11/1/33 | 2,000,000 | 2,140,400 | |||||||||||
| Series A, Refunding |
5.000 | % | 11/1/34 | 2,000,000 | 2,139,880 | |||||||||||
| Public Finance Authority, WI, Revenue: |
||||||||||||||||
| Bancroft Neurohealth Project, Series A |
5.000 | % | 6/1/36 | 1,540,000 | 1,606,774 | (d) | ||||||||||
| Carmelite System Inc., Obligated Group, Series 2020 |
5.000 | % | 1/1/40 | 1,700,000 | 1,876,775 | |||||||||||
| Renown Regional Medical Center Project, Series A |
5.000 | % | 6/1/36 | 2,250,000 | 2,621,478 | |||||||||||
| Village of Mount Pleasant, WI, Tax Increment Revenue, Series A |
5.000 | % | 4/1/43 | 7,000,000 | 7,916,761 | |||||||||||
| Total Wisconsin |
23,131,666 | |||||||||||||||
| Total Municipal Bonds (Cost — $2,318,416,786) |
|
2,331,681,595 | ||||||||||||||
| Municipal Bonds Deposited in Tender Option Bond Trust (j) — 0.9% | ||||||||||||||||
| New York — 0.9% |
||||||||||||||||
| New York State Urban Development Corp. Revenue, State Personal Income Tax Revenue Bonds,
Bidding Group 3, Series E, Refunding |
4.000 | % | 3/15/41 | 25,170,000 | 26,453,617 | |||||||||||
| Collateralized Mortgage Obligations (k) — 0.2% | ||||||||||||||||
| Federal Home Loan Mortgage Corp. (FHLMC), Multifamily Variable Rate Certificates, M012 A1A1, Step bond |
1.600 | % | 8/15/51 | 3,868,637 | 3,870,585 | |||||||||||
| Federal Home Loan Mortgage Corp. (FHLMC), Multifamily Variable Rate Certificates, M012 A1A2, Step bond |
1.600 | % | 8/15/51 | 2,176,109 | 2,177,204 | |||||||||||
| Total Collateralized Mortgage Obligations (Cost — $6,044,746) |
|
6,047,789 | ||||||||||||||
See Notes to Financial Statements.
|
44 |
Western Asset Intermediate-Term Municipals Fund 2022 Annual Report |
Western Asset Intermediate-Term Municipals Fund
(Percentages shown based on Fund net assets)
| Security | Shares | Value | ||||||||||||||
| Statutory Trust Certificates — 0.0%†† | ||||||||||||||||
| CMS Liquidating Trust (Cost—$989,420) |
200 | $ | 246,039 | *(l)(m) | ||||||||||||
| Total Investments before Short-Term Investments (Cost — $2,354,758,119) |
|
2,364,429,040 | ||||||||||||||
| Rate | Maturity Date |
Face Amount |
||||||||||||||
| Short-Term Investments — 17.6% | ||||||||||||||||
| Municipal Bonds — 17.6% | ||||||||||||||||
| Alabama — 0.2% |
||||||||||||||||
| Mobile County, AL, IDA Revenue, ExxonMobil Project, Refunding |
0.370 | % | 7/15/32 | $ | 4,700,000 | 4,700,000 | (n)(o) | |||||||||
| Arizona — 0.2% |
||||||||||||||||
| Arizona Health Facilities Authority Revenue, Banner Health Obligated Group, Series C, LOC - Bank of America N.A. |
0.340 | % | 1/1/46 | 1,745,000 | 1,745,000 | (n)(o) | ||||||||||
| Arizona State IDA, Hospital Revenue, Phoenix Children’s Hospital, Series A, LOC - JPMorgan Chase & Co. |
0.340 | % | 2/1/48 | 100,000 | 100,000 | (n)(o) | ||||||||||
| Phoenix, AZ, IDA, Health Care Facilities Revenue, Mayo Clinic, Series B, SPA - Northern Trust Co. |
0.350 | % | 11/15/52 | 3,200,000 | 3,200,000 | (n)(o) | ||||||||||
| Total Arizona |
5,045,000 | |||||||||||||||
| California — 0.6% |
||||||||||||||||
| California State MFA Revenue: |
||||||||||||||||
| Chevron USA Inc. Project, Series A |
0.350 | % | 11/1/35 | 2,290,000 | 2,290,000 | (n)(o) | ||||||||||
| Chevron USA Inc. Project, Series A |
0.350 | % | 11/1/35 | 205,000 | 205,000 | (n)(o) | ||||||||||
| Regents of the University of California Medical Center Pooled Revenue, Series O-2, Refunding |
0.330 | % | 5/15/45 | 1,750,000 | 1,750,000 | (n)(o) | ||||||||||
| San Francisco, CA, City & County Airport Commission, International Airport Revenue, Second Series A, Refunding, LOC - Bank of America N.A. |
0.490 | % | 5/1/30 | 10,895,000 | 10,895,000 | (c)(n)(o) | ||||||||||
| San Francisco, CA, City & County Finance Corporation Lease Revenue, Moscone Center Expansion Project, Series 2008-1, Refunding, LOC - State Street Bank & Trust Co. |
0.430 | % | 4/1/30 | 1,340,000 | 1,340,000 | (n)(o) | ||||||||||
| University of California, CA, Revenue, Series AL-3, Refunding |
0.310 | % | 5/15/48 | 740,000 | 740,000 | (n)(o) | ||||||||||
| Total California |
17,220,000 | |||||||||||||||
| Colorado — 0.4% |
||||||||||||||||
| University of Colorado Hospital Authority Revenue, Series C, Refunding, SPA - TD Bank N.A. |
0.500 | % | 11/15/39 | 11,700,000 | 11,700,000 | (n)(o) | ||||||||||
See Notes to Financial Statements.
| Western Asset Intermediate-Term Municipals Fund 2022 Annual Report |
|
45 |
|
Schedule of investments (cont’d)
March 31, 2022
Western Asset Intermediate-Term Municipals Fund
(Percentages shown based on Fund net assets)
| Security | Rate | Maturity Date |
Face Amount |
Value | ||||||||||||
| Delaware — 0.2% |
||||||||||||||||
| University of Delaware Revenue: |
||||||||||||||||
| Series 2005, Refunding, SPA - TD Bank N.A. |
0.360 | % | 11/1/35 | $ | 4,100,000 | $ | 4,100,000 | (n)(o) | ||||||||
| Series C, Refunding, SPA - TD Bank N.A. |
0.360 | % | 11/1/37 | 2,900,000 | 2,900,000 | (n)(o) | ||||||||||
| Total Delaware |
7,000,000 | |||||||||||||||
| District of Columbia — 0.0%†† |
||||||||||||||||
| District of Columbia Revenue, Series A, LOC - TD Bank N.A. |
0.340 | % | 8/15/38 | 400,000 | 400,000 | (n)(o) | ||||||||||
| Florida — 2.2% |
||||||||||||||||
| Florida Gulf Coast University Finance Corp., Capital Improvement Revenue, Housing Projects, Series A, LOC - TD Bank N.A. |
0.510 | % | 2/1/38 | 3,900,000 | 3,900,000 | (n)(o) | ||||||||||
| Hillsborough County, FL, IDA, Healthcare System Revenue: |
||||||||||||||||
| Baycare Health System, Series B, Refunding, LOC - TD Bank N.A. |
0.360 | % | 11/1/38 | 7,900,000 | 7,900,000 | (n)(o) | ||||||||||
| Baycare Health System, Series C, Refunding, LOC - TD Bank N.A. |
0.500 | % | 11/1/38 | 9,500,000 | 9,500,000 | (n)(o) | ||||||||||
| Orange County, FL, Health Facilities Authority Revenue, Orlando Regional Healthcare System, Series E, LOC - TD Bank N.A. |
0.500 | % | 10/1/26 | 13,755,000 | 13,755,000 | (n)(o) | ||||||||||
| St. Lucie County, FL, Solid Waste Disposal Revenue, Florida Power & Light Co. Project, Refunding |
0.390 | % | 5/1/24 | 26,650,000 | 26,650,000 | (c)(n)(o) | ||||||||||
| Total Florida |
61,705,000 | |||||||||||||||
| Illinois — 0.5% |
||||||||||||||||
| Illinois State EFA Revenue, The Adler Planetarium, LOC - PNC Bank N.A. |
0.510 | % | 4/1/31 | 1,900,000 | 1,900,000 | (n)(o) | ||||||||||
| Illinois State Finance Authority Revenue: |
||||||||||||||||
| Edward Hospital Obligated Group, Series B-2, Refunding, LOC - TD Bank N.A. |
0.500 | % | 2/1/40 | 7,925,000 | 7,925,000 | (n)(o) | ||||||||||
| Edward Hospital Obligated Group, Series C, Refunding, LOC - TD Bank N.A. |
0.500 | % | 2/1/29 | 2,080,000 | 2,080,000 | (n)(o) | ||||||||||
| Illinois State Housing Development Authority Revenue, Brainard Landings II Apartments, LOC - U.S. BANK N.A. |
0.520 | % | 5/1/42 | 1,050,000 | 1,050,000 | (c)(n)(o) | ||||||||||
| Total Illinois |
12,955,000 | |||||||||||||||
See Notes to Financial Statements.
|
46 |
Western Asset Intermediate-Term Municipals Fund 2022 Annual Report |
Western Asset Intermediate-Term Municipals Fund
(Percentages shown based on Fund net assets)
| Security | Rate | Maturity Date |
Face Amount |
Value | ||||||||||||
| Indiana — 0.2% |
||||||||||||||||
| Indiana State Finance Authority Hospital Revenue: |
||||||||||||||||
| Parkview Health System Obligated Group, Series B, Refunding, LOC - Wells Fargo Bank N.A. |
0.370 | % | 11/1/39 | $ | 2,600,000 | $ | 2,600,000 | (n)(o) | ||||||||
| Parkview Health System Obligated Group, Series D, Refunding, LOC - Wells Fargo Bank N.A. |
0.370 | % | 11/1/39 | 2,210,000 | 2,210,000 | (n)(o) | ||||||||||
| Total Indiana |
4,810,000 | |||||||||||||||
| Maryland — 0.1% |
||||||||||||||||
| Maryland State Health and Higher Educational Facilities Authority Revenue, University of Maryland Medical System, Series D, LOC - TD Bank N.A. |
0.360 | % | 7/1/41 | 2,085,000 | 2,085,000 | (n)(o) | ||||||||||
| Massachusetts — 0.3% |
||||||||||||||||
| Massachusetts State DFA Revenue: |
||||||||||||||||
| Boston University, Series U-6C, Refunding, LOC - TD Bank N.A. |
0.330 | % | 10/1/42 | 1,000,000 | 1,000,000 | (n)(o) | ||||||||||
| Boston University, Series U-6E, Refunding, LOC - TD Bank N.A. |
0.330 | % | 10/1/42 | 2,500,000 | 2,500,000 | (n)(o) | ||||||||||
| Partners Healthcare System Inc., Series K-1, SPA - Wells Fargo Bank N.A. |
0.500 | % | 7/1/46 | 1,300,000 | 1,300,000 | (n)(o) | ||||||||||
| Massachusetts State HEFA Revenue: |
||||||||||||||||
| Baystate Medical Center, Series K-1,, LOC - TD Bank N.A. |
0.330 | % | 7/1/39 | 200,000 | 200,000 | (n)(o) | ||||||||||
| Harvard University, Series R, Refunding |
0.230 | % | 11/1/49 | 500,000 | 500,000 | (n)(o) | ||||||||||
| Harvard University, Series Y |
0.470 | % | 7/1/35 | 245,000 | 245,000 | (n)(o) | ||||||||||
| Massachusetts Institute of Technology, Series J-1 |
0.480 | % | 7/1/31 | 3,590,000 | 3,590,000 | (n)(o) | ||||||||||
| Partners Healthcare System Inc., Series P-2, SPA - JPMorgan Chase & Co. |
0.500 | % | 7/1/27 | 600,000 | 600,000 | (n)(o) | ||||||||||
| Total Massachusetts |
9,935,000 | |||||||||||||||
| Michigan — 0.0%†† |
||||||||||||||||
| Central Michigan University Revenue, Series A, Refunding, LOC - TD Bank N.A. |
0.510 | % | 10/1/32 | 1,485,000 | 1,485,000 | (n)(o) | ||||||||||
| Minnesota — 0.5% |
||||||||||||||||
| Minneapolis & St. Paul, MN, Housing & Redevelopment Authority Revenue, Series C2, LOC - Wells Fargo Bank N.A. |
0.500 | % | 11/15/34 | 200,000 | 200,000 | (n)(o) | ||||||||||
See Notes to Financial Statements.
| Western Asset Intermediate-Term Municipals Fund 2022 Annual Report |
|
47 |
|
Schedule of investments (cont’d)
March 31, 2022
Western Asset Intermediate-Term Municipals Fund
(Percentages shown based on Fund net assets)
| Security | Rate | Maturity Date |
Face Amount |
Value | ||||||||||||
| Minnesota — continued |
||||||||||||||||
| Minneapolis, MN, Health Care System Revenue, Fairview Health Services, Series C, Refunding, LOC - Wells Fargo Bank N.A. |
0.370 | % | 11/15/48 | $ | 7,150,000 | $ | 7,150,000 | (n)(o) | ||||||||
| Rochester, MN, Health Care Facilities Revenue, Mayo Clinic, Series A |
0.480 | % | 11/15/38 | 2,300,000 | 2,300,000 | (n)(o) | ||||||||||
| St. Paul, MN, Housing and Redevelopment Authority, Allina Health System, Series C, Refunding, LOC - Wells Fargo Bank N.A. |
0.500 | % | 11/15/35 | 5,800,000 | 5,800,000 | (n)(o) | ||||||||||
| Total Minnesota |
15,450,000 | |||||||||||||||
| Mississippi — 1.8% |
||||||||||||||||
| Mississippi State Business Finance Corp., Gulf Opportunity Zone, IDR: |
||||||||||||||||
| Chevron USA Inc. Project, Series A |
0.370 | % | 12/1/30 | 1,000,000 | 1,000,000 | (n)(o) | ||||||||||
| Chevron USA Inc. Project, Series A |
0.370 | % | 11/1/35 | 10,815,000 | 10,815,000 | (n)(o) | ||||||||||
| Chevron USA Inc. Project, Series B |
0.370 | % | 12/1/30 | 1,240,000 | 1,240,000 | (n)(o) | ||||||||||
| Chevron USA Inc. Project, Series B |
0.370 | % | 12/1/30 | 3,020,000 | 3,020,000 | (n)(o) | ||||||||||
| Chevron USA Inc. Project, Series B |
0.370 | % | 11/1/35 | 400,000 | 400,000 | (n)(o) | ||||||||||
| Chevron USA Inc. Project, Series D |
0.370 | % | 11/1/35 | 500,000 | 500,000 | (n)(o) | ||||||||||
| Chevron USA Inc. Project, Series E |
0.370 | % | 12/1/30 | 3,100,000 | 3,100,000 | (n)(o) | ||||||||||
| Chevron USA Inc. Project, Series F |
0.370 | % | 12/1/30 | 11,100,000 | 11,100,000 | (n)(o) | ||||||||||
| Chevron USA Inc. Project, Series G |
0.370 | % | 12/1/30 | 2,015,000 | 2,015,000 | (n)(o) | ||||||||||
| Chevron USA Inc. Project, Series G |
0.370 | % | 11/1/35 | 4,200,000 | 4,200,000 | (n)(o) | ||||||||||
| Chevron USA Inc. Project, Series G |
0.370 | % | 11/1/35 | 3,350,000 | 3,350,000 | (n)(o) | ||||||||||
| Chevron USA Inc. Project, Series H |
0.370 | % | 11/1/35 | 4,800,000 | 4,800,000 | (n)(o) | ||||||||||
| Chevron USA Inc. Project, Series I |
0.370 | % | 11/1/35 | 2,600,000 | 2,600,000 | (n)(o) | ||||||||||
| Chevron USA Inc. Project, Series K |
0.370 | % | 11/1/35 | 2,200,000 | 2,200,000 | (n)(o) | ||||||||||
| Chevron USA Inc. Project, Series L |
0.370 | % | 11/1/35 | 1,430,000 | 1,430,000 | (n)(o) | ||||||||||
| Total Mississippi |
51,770,000 | |||||||||||||||
| Missouri — 0.8% |
||||||||||||||||
| Missouri State HEFA Revenue: |
||||||||||||||||
| BJC Health System, Series A, Refunding, LIQ - U.S. Bank N.A. |
0.500 | % | 5/15/38 | 4,300,000 | 4,300,000 | (n)(o) | ||||||||||
| BJC Health System, Series C, Refunding, LIQ - BJC Health System |
0.500 | % | 5/15/38 | 8,780,000 | 8,780,000 | (n)(o) | ||||||||||
| BJC Health System, Series D |
0.520 | % | 5/15/38 | 10,000,000 | 10,000,000 | (n)(o) | ||||||||||
See Notes to Financial Statements.
|
48 |
Western Asset Intermediate-Term Municipals Fund 2022 Annual Report |
Western Asset Intermediate-Term Municipals Fund
(Percentages shown based on Fund net assets)
| Security | Rate | Maturity Date |
Face Amount |
Value | ||||||||||||
| Missouri — continued |
||||||||||||||||
| Educational Facilities, Saint Louis University, Series B-2, LOC - Wells Fargo Bank N.A. |
0.370 | % | 10/1/35 | $ | 400,000 | $ | 400,000 | (n)(o) | ||||||||
| St. Louis University, Series B, LOC - U.S. Bank N.A. |
0.380 | % | 10/1/24 | 200,000 | 200,000 | (n)(o) | ||||||||||
| Total Missouri |
23,680,000 | |||||||||||||||
| Nevada — 0.5% |
||||||||||||||||
| Clark County, NV, Airport Subordinate Lien, Series C-3, Refunding, LOC - Sumitomo Mitsui Banking |
0.500 | % | 7/1/29 | 15,000,000 | 15,000,000 | (c)(n)(o) | ||||||||||
| New Jersey — 0.9% |
||||||||||||||||
| New Jersey State EDA Revenue, South Jersey Gas Co., Series 2006-1, Remarketing, LOC - JPMorgan Chase & Co. |
0.500 | % | 4/1/36 | 5,000,000 | 5,000,000 | (c)(n)(o) | ||||||||||
| New Jersey State Health Care Facilities Financing Authority Revenue: |
||||||||||||||||
| AHS Hospital Corp., Series B, Refunding, LOC - Bank of America N.A. |
0.510 | % | 7/1/36 | 5,800,000 | 5,800,000 | (n)(o) | ||||||||||
| Hospital Capital Asset Financing Program, Series B, Refunding, LOC - TD Bank N.A. |
0.510 | % | 7/1/35 | 100,000 | 100,000 | (n)(o) | ||||||||||
| Meridian Health System Obligated Group Issue, Series A, LOC - TD Bank N.A. |
0.500 | % | 7/1/33 | 1,500,000 | 1,500,000 | (n)(o) | ||||||||||
| Virtua Health Inc., Series B, LOC - JPMorgan Chase & Co. |
0.330 | % | 7/1/43 | 200,000 | 200,000 | (n)(o) | ||||||||||
| Virtual Health Inc., LOC - Wells Fargo Bank N.A. |
0.460 | % | 7/1/33 | 3,025,000 | 3,025,000 | (n)(o) | ||||||||||
| Virtua-Memorial Hospital Burlington County, Inc., Series D, LOC - TD Bank N.A. |
0.460 | % | 7/1/43 | 9,100,000 | 9,100,000 | (n)(o) | ||||||||||
| Total New Jersey |
24,725,000 | |||||||||||||||
| New York — 5.2% |
||||||||||||||||
| Battery Park City Authority Revenue, NY, Subseries D-2, Refunding, SPA - TD Bank N.A. |
0.480 | % | 11/1/38 | 4,300,000 | 4,300,000 | (n)(o) | ||||||||||
| Build NYC Resource Corp. Revenue: |
||||||||||||||||
| Asia SOC Project V, Refunding, LOC - TD Bank N.A. |
0.490 | % | 4/1/45 | 175,000 | 175,000 | (n)(o) | ||||||||||
| Loan Enhanced Assistance, Series A, LOC - Bank of America N.A. |
0.500 | % | 3/1/38 | 700,000 | 700,000 | (n)(o) | ||||||||||
| Franklin County, NY, Civic Development Corp. Revenue, Alice Hyde Medical Center, LOC - HSBC Bank USA N.A. |
0.530 | % | 10/1/38 | 775,000 | 775,000 | (n)(o) | ||||||||||
See Notes to Financial Statements.
| Western Asset Intermediate-Term Municipals Fund 2022 Annual Report |
|
49 |
|
Schedule of investments (cont’d)
March 31, 2022
Western Asset Intermediate-Term Municipals Fund
(Percentages shown based on Fund net assets)
| Security | Rate | Maturity Date |
Face Amount |
Value | ||||||||||||
| New York — continued |
||||||||||||||||
| MTA, NY, Dedicated Tax Revenue, Series A-1, Refunding, LOC - TD Bank N.A. |
0.360 | % | 11/1/31 | $ | 9,510,000 | $ | 9,510,000 | (n)(o) | ||||||||
| MTA, NY, Transportation Revenue: |
||||||||||||||||
| Subseries D-2, LOC - Landesbank Hessen- Thueringen |
0.390 | % | 11/1/35 | 4,100,000 | 4,100,000 | (n)(o) | ||||||||||
| Subseries G-2, Refunding, LOC - TD Bank N.A. |
0.480 | % | 11/1/32 | 10,125,000 | 10,125,000 | (n)(o) | ||||||||||
| New York City, NY, GO: |
||||||||||||||||
| Subseries D-4, LOC - TD Bank N.A. |
0.360 | % | 8/1/40 | 3,500,000 | 3,500,000 | (n)(o) | ||||||||||
| Subseries E-5, LOC - TD Bank N.A. |
0.360 | % | 3/1/48 | 2,500,000 | 2,500,000 | (n)(o) | ||||||||||
| Subseries G-6, LOC - Mizuho Bank Ltd. |
0.360 | % | 4/1/42 | 8,325,000 | 8,325,000 | (n)(o) | ||||||||||
| Subseries I-4, LOC - TD Bank N.A. |
0.360 | % | 4/1/36 | 2,800,000 | 2,800,000 | (n)(o) | ||||||||||
| New York City, NY, HDC Revenue, Sierra Development, Series A, LOC - FNMA |
0.420 | % | 3/15/33 | 5,700,000 | 5,700,000 | (c)(n)(o) | ||||||||||
| New York City, NY, HDC, MFH Revenue, Beacon Mews Development, Series A, LOC - Citibank N.A. |
0.530 | % | 4/1/39 | 900,000 | 900,000 | (c)(n)(o) | ||||||||||
| New York City, NY, HDC, Multi-Family Mortgage Revenue, The Dorado Apartments, Series A, LOC - Citibank N.A. |
0.500 | % | 6/1/40 | 700,000 | 700,000 | (c)(n)(o) | ||||||||||
| New York City, NY, HDC, Multi-Family Rental Housing Revenue, Related West 89th Street Development, Series A, LOC - FNMA |
0.480 | % | 11/15/29 | 2,000,000 | 2,000,000 | (c)(n)(o) | ||||||||||
| New York City, NY, Health and Hospitals Corp. Revenue, Series C, LOC - TD Bank N.A. |
0.470 | % | 2/15/31 | 9,105,000 | 9,105,000 | (n)(o) | ||||||||||
| New York City, NY, Industrial Development Agency Revenue, Empowerment Zone Revenue, Tiago Holdings, LLC Project, LOC - TD Bank N.A. |
0.520 | % | 1/1/37 | 5,560,000 | 5,560,000 | (c)(n)(o) | ||||||||||
| New York City, NY, Municipal Water Finance Authority, Water & Sewer System Revenue: |
||||||||||||||||
| Second General Resolution Fiscal 2008, Series BB-5, Refunding, SPA - Bank of America N.A. |
0.360 | % | 6/15/33 | 6,970,000 | 6,970,000 | (n)(o) | ||||||||||
| Second General Resolution Fiscal 2009, Series BB-2, Refunding, SPA - UBS AG |
0.360 | % | 6/15/39 | 100,000 | 100,000 | (n)(o) | ||||||||||
| Second General Resolution Fiscal 2009, Subseries BB-1, Refunding, SPA - UBS AG |
0.360 | % | 6/15/39 | 200,000 | 200,000 | (n)(o) | ||||||||||
| Second General Resolution Fiscal 2014, Series AA-1, Refunding, SPA - JPMorgan Chase & Co. |
0.330 | % | 6/15/50 | 200,000 | 200,000 | (n)(o) | ||||||||||
See Notes to Financial Statements.
|
50 |
Western Asset Intermediate-Term Municipals Fund 2022 Annual Report |
Western Asset Intermediate-Term Municipals Fund
(Percentages shown based on Fund net assets)
| Security | Rate | Maturity Date |
Face Amount |
Value | ||||||||||||
| New York — continued |
||||||||||||||||
| Second General Resolution Fiscal 2014, Series AA-3, Refunding, SPA - TD Bank N.A. |
0.360 | % | 6/15/49 | $ | 8,300,000 | $ | 8,300,000 | (n)(o) | ||||||||
| Second General Resolution Fiscal 2014, Series AA-5, Refunding, SPA - Mizuho Bank Ltd. |
0.360 | % | 6/15/48 | 4,775,000 | 4,775,000 | (n)(o) | ||||||||||
| Second General Resolution Fiscal 2014, Series AA6, Refunding, SPA - Mizuho Bank Ltd. |
0.330 | % | 6/15/48 | 200,000 | 200,000 | (n)(o) | ||||||||||
| Second General Resolution Fiscal 2016, Series AA-1, Refunding, SPA - Bank of America N.A. |
0.360 | % | 6/15/48 | 555,000 | 555,000 | (n)(o) | ||||||||||
| Second General Resolution Fiscal 2016, Series AA-2, Refunding, SPA - PNC Bank N.A. |
0.510 | % | 6/15/48 | 4,435,000 | 4,435,000 | (n)(o) | ||||||||||
| Second General Resolution, Fiscal 2011, Series DD-1, SPA - TD Bank N.A. |
0.360 | % | 6/15/43 | 500,000 | 500,000 | (n)(o) | ||||||||||
| New York City, NY, TFA Revenue Future Tax Secured: |
||||||||||||||||
| Subordinated, Subseries E-3, SPA - JPMorgan Chase & Co. |
0.330 | % | 2/1/45 | 1,940,000 | 1,940,000 | (n)(o) | ||||||||||
| Subordinated, Subseries E-4, SPA - JPMorgan Chase & Co. |
0.330 | % | 2/1/45 | 200,000 | 200,000 | (n)(o) | ||||||||||
| Subseries A, Refunding, SPA - TD Bank N.A. |
0.360 | % | 11/1/29 | 5,725,000 | 5,725,000 | (n)(o) | ||||||||||
| Subseries A-3, SPA - Mizuho Bank Ltd. |
0.380 | % | 8/1/43 | 500,000 | 500,000 | (n)(o) | ||||||||||
| New York State Dormitory Authority Revenue: |
||||||||||||||||
| Cornell University, Series A, SPA - Bank of New York Mellon |
0.460 | % | 7/1/33 | 1,530,000 | 1,530,000 | (n)(o) | ||||||||||
| Cornell University, Series B, SPA - Bank of New York Mellon |
0.460 | % | 7/1/33 | 1,505,000 | 1,505,000 | (n)(o) | ||||||||||
| Non-State Supported Debt, Northern Westchester Association, LOC - TD Bank N.A. |
0.480 | % | 11/1/34 | 1,195,000 | 1,195,000 | (n)(o) | ||||||||||
| New York State Energy Research & Development Authority Facilities Revenue, Consolidated Edison Co. of New York Inc. Project, Subseries C-3, LOC - Mizuho Bank Ltd. |
0.500 | % | 11/1/39 | 12,300,000 | 12,300,000 | (c)(n)(o) | ||||||||||
| New York State HFA Revenue: |
||||||||||||||||
| East 39th Street, Series A, LIQ - FNMA, LOC - FNMA |
0.480 | % | 11/15/31 | 1,100,000 | 1,100,000 | (c)(n)(o) | ||||||||||
| 10 Liberty, Series A, LIQ - FHLMC, LOC - FHLMC |
0.400 | % | 5/1/35 | 1,965,000 | 1,965,000 | (n)(o) | ||||||||||
See Notes to Financial Statements.
| Western Asset Intermediate-Term Municipals Fund 2022 Annual Report |
|
51 |
|
Schedule of investments (cont’d)
March 31, 2022
Western Asset Intermediate-Term Municipals Fund
(Percentages shown based on Fund net assets)
| Security | Rate | Maturity Date |
Face Amount |
Value | ||||||||||||
| New York — continued |
||||||||||||||||
| 42nd & 10th Housing, 2008 Series A, LIQ - FHLMC |
0.490 | % | 11/1/41 | $ | 1,100,000 | $ | 1,100,000 | (n)(o) | ||||||||
| 42nd & 10th Housing, Series A, LIQ - FHLMC |
0.530 | % | 11/1/41 | 7,800,000 | 7,800,000 | (c)(n)(o) | ||||||||||
| 55 West 25th Street Housing, Series A, LOC - FNMA |
0.420 | % | 11/15/38 | 100,000 | 100,000 | (c)(n)(o) | ||||||||||
| 350 West 43rd Street Housing, Series A, LOC - Landesbank Hessen-Thueringen |
0.380 | % | 11/1/34 | 8,800,000 | 8,800,000 | (c)(n)(o) | ||||||||||
| 363 West 30th Street Housing, Series A, LIQ - FHLMC, LOC - FHLMC |
0.420 | % | 11/1/32 | 500,000 | 500,000 | (c)(n)(o) | ||||||||||
| Triborough Bridge & Tunnel Authority, NY, Revenue: |
||||||||||||||||
| General-MTA Bridges & Tunnels, Series C, Refunding, LOC - State Street Bank & Trust Co. |
0.340 | % | 1/1/32 | 1,940,000 | 1,940,000 | (n)(o) | ||||||||||
| Subseries B-3, Refunding, LOC - State Street Bank & Trust Co. |
0.390 | % | 1/1/32 | 2,780,000 | 2,780,000 | (n)(o) | ||||||||||
| Westchester County, NY, IDA, Civic Facility Revenue, Northern Westchester Hospital, LOC - TD Bank N.A. |
0.480 | % | 11/1/24 | 1,265,000 | 1,265,000 | (n)(o) | ||||||||||
| Total New York |
149,255,000 | |||||||||||||||
| North Carolina — 0.1% |
||||||||||||||||
| University of North Carolina at Chapel Hill, University of North Carolina Hospitals Revenue, Series A, Refunding, SPA - TD Bank N.A. |
0.500 | % | 2/1/24 | 1,855,000 | 1,855,000 | (n)(o) | ||||||||||
| North Dakota — 0.2% |
||||||||||||||||
| North Dakota State HFA Revenue: |
||||||||||||||||
| Series C, SPA - TD Bank N.A. |
0.500 | % | 1/1/46 | 3,500,000 | 3,500,000 | (n)(o) | ||||||||||
| Series E, SPA - TD Bank N.A. |
0.500 | % | 7/1/36 | 1,100,000 | 1,100,000 | (n)(o) | ||||||||||
| Total North Dakota |
4,600,000 | |||||||||||||||
| Oregon — 0.2% |
||||||||||||||||
| Clackamas County, OR, Hospital Facility Authority Revenue, Legacy Health System, Series A, LOC - U.S. Bank N.A. |
0.510 | % | 6/1/37 | 300,000 | 300,000 | (n)(o) | ||||||||||
| Oregon State Facilities Authority Revenue: |
||||||||||||||||
| Peacehealth, Series A, Refunding, LOC - U.S. Bank N.A. |
0.380 | % | 8/1/34 | 5,600,000 | 5,600,000 | (n)(o) | ||||||||||
| Peacehealth, Series B, Refunding, LOC - TD Bank N.A. |
0.350 | % | 8/1/34 | 780,000 | 780,000 | (n)(o) | ||||||||||
| Total Oregon |
6,680,000 | |||||||||||||||
See Notes to Financial Statements.
|
52 |
Western Asset Intermediate-Term Municipals Fund 2022 Annual Report |
Western Asset Intermediate-Term Municipals Fund
(Percentages shown based on Fund net assets)
| Security | Rate | Maturity Date |
Face Amount |
Value | ||||||||||||
| Pennsylvania — 1.5% |
||||||||||||||||
| Delaware Valley, PA, Regional Finance Authority, Local Government Revenue: |
||||||||||||||||
| Series A, LOC - TD Bank N.A. |
0.500 | % | 5/1/55 | $ | 5,700,000 | $ | 5,700,000 | (n)(o) | ||||||||
| Series D, LOC - TD Bank N.A. |
0.500 | % | 11/1/55 | 8,600,000 | 8,600,000 | (n)(o) | ||||||||||
| Lancaster County, PA, Hospital Authority Revenue, Series D, Refunding, LOC - JPMorgan Chase & Co. |
0.370 | % | 7/1/34 | 1,995,000 | 1,995,000 | (n)(o) | ||||||||||
| Lancaster, PA, IDA Revenue, Willow Valley Retirement Communities Project, Series C, LOC - PNC Bank N.A. |
0.530 | % | 12/1/39 | 400,000 | 400,000 | (n)(o) | ||||||||||
| Pennsylvania State Turnpike Commission Revenue: |
||||||||||||||||
| Second Series, Refunding, LOC - TD Bank N.A. |
0.500 | % | 12/1/38 | 6,620,000 | 6,620,000 | (n)(o) | ||||||||||
| Series 2020, Refunding, LOC - TD Bank N.A. |
0.500 | % | 12/1/39 | 12,500,000 | 12,500,000 | (n)(o) | ||||||||||
| Philadelphia, PA, Authority for IDR, Gift of Life Donor Program Project, LOC - TD Bank N.A. |
0.510 | % | 12/1/34 | 4,050,000 | 4,050,000 | (n)(o) | ||||||||||
| Philadelphia, PA, Gas Works Revenue, Series D, Refunding, LOC - TD Bank N.A. |
0.500 | % | 8/1/31 | 2,000,000 | 2,000,000 | (n)(o) | ||||||||||
| Total Pennsylvania |
41,865,000 | |||||||||||||||
| Texas — 1.0% |
||||||||||||||||
| Gulf Coast Authority, TX, Waste Disposal Authority: |
||||||||||||||||
| ExxonMobil Project |
0.400 | % | 6/1/30 | 11,800,000 | 11,800,000 | (c)(n)(o) | ||||||||||
| ExxonMobil Project, Series B |
0.400 | % | 6/1/25 | 4,000,000 | 4,000,000 | (c)(n)(o) | ||||||||||
| Harris County, TX, Cultural Education Facilities Finance Corp. Revenue, Memorial Hermann Health System, Series C, Refunding |
0.500 | % | 6/1/46 | 4,800,000 | 4,800,000 | (n)(o) | ||||||||||
| Harris County, TX, Cultural Education Facilities Finance Corp., Hospital Revenue, Texas Children’s Hospital, Series C, Refunding, SPA - Bank of America N.A. |
0.340 | % | 10/1/41 | 500,000 | 500,000 | (n)(o) | ||||||||||
| Harris County, TX, Solid Waste Disposal Revenue, Industrial Development Corp. Project |
0.350 | % | 4/1/32 | 1,100,000 | 1,100,000 | (c)(n)(o) | ||||||||||
| Houston, TX, Combined Utility System Revenue, First Lien, Series B-4, Refunding, LOC - PNC Bank N.A. |
0.520 | % | 5/15/34 | 600,000 | 600,000 | (n)(o) | ||||||||||
| Lower Neches Valley Authority, TX, Industrial Development Corp. Revenue: |
||||||||||||||||
| ExxonMobil Corp., Refunding |
0.300 | % | 5/1/46 | 600,000 | 600,000 | (n)(o) | ||||||||||
| ExxonMobil Corp., Series 2010 |
0.300 | % | 11/1/38 | 600,000 | 600,000 | (n)(o) | ||||||||||
See Notes to Financial Statements.
| Western Asset Intermediate-Term Municipals Fund 2022 Annual Report |
|
53 |
|
Schedule of investments (cont’d)
March 31, 2022
Western Asset Intermediate-Term Municipals Fund
(Percentages shown based on Fund net assets)
| Security | Rate | Maturity Date |
Face Amount |
Value | ||||||||||||
| Texas — continued |
||||||||||||||||
| ExxonMobil Corp., Series B, Refunding |
0.400 | % | 11/1/29 | $ | 2,580,000 | $ | 2,580,000 | (c)(n)(o) | ||||||||
| ExxonMobil Corp., Subseries B-2, Refunding |
0.400 | % | 12/1/39 | 2,630,000 | 2,630,000 | (c)(n)(o) | ||||||||||
| Texas State, GO, Series A, SPA - State Street Bank & Trust Co. |
0.520 | % | 6/1/43 | 710,000 | 710,000 | (n)(o) | ||||||||||
| Total Texas |
29,920,000 | |||||||||||||||
| Utah — 0.0%†† |
||||||||||||||||
| Murray City, UT, Hospital Revenue, IHC Health Services Inc., Series A, SPA - JPMorgan Chase & Co. |
0.340 | % | 5/15/37 | 100,000 | 100,000 | (n)(o) | ||||||||||
| Total Short-Term Investments (Cost — $503,940,000) |
|
503,940,000 | ||||||||||||||
| Total Investments — 100.2% (Cost — $2,858,698,119) |
|
2,868,369,040 | ||||||||||||||
| TOB Floating Rate Notes — (0.7)% |
(18,875,000 | ) | ||||||||||||||
| Other Assets in Excess of Other Liabilities — 0.5% |
|
12,518,886 | ||||||||||||||
| Total Net Assets — 100.0% |
$ | 2,862,012,926 | ||||||||||||||
See Notes to Financial Statements.
|
54 |
Western Asset Intermediate-Term Municipals Fund 2022 Annual Report |
Western Asset Intermediate-Term Municipals Fund
| †† | Represents less than 0.1%. |
| * | Non-income producing security. |
| (a) | Maturity date shown represents the mandatory tender date. |
| (b) | Variable rate security. Interest rate disclosed is as of the most recent information available. Certain variable rate securities are not based on a published reference rate and spread but are determined by the issuer or agent and are based on current market conditions. These securities do not indicate a reference rate and spread in their description above. |
| (c) | Income from this issue is considered a preference item for purposes of calculating the alternative minimum tax (“AMT”). |
| (d) | Security is exempt from registration under Rule 144A of the Securities Act of 1933. This security may be resold in transactions that are exempt from registration, normally to qualified institutional buyers. This security has been deemed liquid pursuant to guidelines approved by the Board of Trustees. |
| (e) | Pre-Refunded bonds are generally escrowed with U.S. government obligations and/or U.S. government agency securities. |
| (f) | Securities traded on a when-issued or delayed delivery basis. |
| (g) | Bonds are generally escrowed to maturity by government securities and/or U.S. government agency securities. |
| (h) | The coupon payment on this security is currently in default as of March 31, 2022. |
| (i) | The maturity principal is currently in default as of March 31, 2022. |
| (j) | Represents securities deposited into a special purpose entity, referred to as a Tender Option Bond (“TOB”) trust (Note 1). |
| (k) | Collateralized mortgage obligations are secured by an underlying pool of mortgages or mortgage pass-through certificates that are structured to direct payments on underlying collateral to different series or classes of the obligations. The interest rate may change positively or inversely in relation to one or more interest rates, financial indices or other financial indicators and may be subject to an upper and/or lower limit. |
| (l) | Security is valued in good faith in accordance with procedures approved by the Board of Trustees (Note 1). |
| (m) | Security is valued using significant unobservable inputs (Note 1). |
| (n) | Variable rate demand obligations (“VRDOs”) have a demand feature under which the Fund can tender them back to the issuer or liquidity provider on no more than 7 days notice. The interest rate generally resets on a daily or weekly basis and is determined on the specific interest rate reset date by the remarketing agent, pursuant to a formula specified in official documents for the VRDO, or set at the highest rate allowable as specified in official documents for the VRDO. VRDOs are benchmarked to the Securities Industry and Financial Markets Association (“SIFMA”) Municipal Swap Index. The SIFMA Municipal Swap Index is compiled from weekly interest rate resets of tax-exempt VRDOs reported to the Municipal Securities Rulemaking Board’s Short-term Obligation Rate Transparency System. |
| (o) | Maturity date shown is the final maturity date. The security may be sold back to the issuer before final maturity. |
See Notes to Financial Statements.
| Western Asset Intermediate-Term Municipals Fund 2022 Annual Report |
|
55 |
|
Schedule of investments (cont’d)
March 31, 2022
Western Asset Intermediate-Term Municipals Fund
| Abbreviation(s) used in this schedule: | ||
| AGM | — Assured Guaranty Municipal Corporation — Insured Bonds | |
| BAM | — Build America Mutual — Insured Bonds | |
| CAB | — Capital Appreciation Bonds | |
| CDA | — Communities Development Authority | |
| COP | — Certificates of Participation | |
| CSCE | — Charter School Credit Enhancement | |
| DFA | — Development Finance Agency | |
| EDA | — Economic Development Authority | |
| EDC | — Economic Development Corporation | |
| EFA | — Educational Facilities Authority | |
| FHLMC | — Federal Home Loan Mortgage Corporation | |
| FNMA | — Federal National Mortgage Association | |
| GO | — General Obligation | |
| GTD | — Guaranteed | |
| HDC | — Housing Development Corporation | |
| HEFA | — Health & Educational Facilities Authority | |
| HFA | — Housing Finance Agency | |
| IDA | — Industrial Development Authority | |
| IDR | — Industrial Development Revenue | |
| ISD | — Independent School District | |
| LIQ | — Liquidity Facility | |
| LOC | — Letter of Credit | |
| MFA | — Municipal Finance Authority | |
| MFH | — Multi-Family Housing | |
| MTA | — Metropolitan Transportation Authority | |
| NATL | — National Public Finance Guarantee Corporation — Insured Bonds | |
| PCFA | — Pollution Control Financing Authority | |
| PCR | — Pollution Control Revenue | |
| PEA | — Public Energy Authority | |
| PSF | — Permanent School Fund | |
| Q-SBLF | — Qualified School Board Loan Fund | |
| SCAGO | — South Carolina Association of Government Organizations | |
| SD | — School District | |
| SIFMA | — Securities Industry and Financial Markets Association | |
| SPA | — Standby Bond Purchase Agreement — Insured Bonds | |
| TFA | — Transitional Finance Authority | |
| USD | — Unified School District | |
See Notes to Financial Statements.
|
56 |
Western Asset Intermediate-Term Municipals Fund 2022 Annual Report |
Statement of assets and liabilities
March 31, 2022
| Assets: | ||||
| Investments, at value (Cost — $2,858,698,119) |
$ | 2,868,369,040 | ||
| Cash |
3,850 | |||
| Receivable for securities sold |
37,782,027 | |||
| Interest receivable |
28,980,439 | |||
| Receivable for Fund shares sold |
6,242,761 | |||
| Other assets |
458 | |||
| Prepaid expenses |
46,913 | |||
| Total Assets |
2,941,425,488 | |||
| Liabilities: | ||||
| Payable for securities purchased |
52,021,354 | |||
| TOB Floating Rate Notes (Note 1) |
18,875,000 | |||
| Payable for Fund shares repurchased |
6,666,898 | |||
| Investment management fee payable |
778,076 | |||
| Distributions payable |
248,305 | |||
| Service and/or distribution fees payable |
166,529 | |||
| Interest expense payable |
65,117 | |||
| Trustees’ fees payable |
9,764 | |||
| Accrued expenses |
581,519 | |||
| Total Liabilities |
79,412,562 | |||
| Total Net Assets | $ | 2,862,012,926 | ||
| Net Assets: | ||||
| Par value (Note 7) |
$ | 4,622 | ||
| Paid-in capital in excess of par value |
2,943,311,754 | |||
| Total distributable earnings (loss) |
(81,303,450) | |||
| Total Net Assets | $ | 2,862,012,926 | ||
See Notes to Financial Statements.
| Western Asset Intermediate-Term Municipals Fund 2022 Annual Report |
|
57 |
|
Statement of assets and liabilities (cont’d)
March 31, 2022
| Net Assets: | ||||
| Class A |
$706,182,100 | |||
| Class C |
$113,642,453 | |||
| Class I |
$1,334,988,326 | |||
| Class IS |
$707,200,047 | |||
| Shares Outstanding: | ||||
| Class A |
114,069,241 | |||
| Class C |
18,316,494 | |||
| Class I |
215,706,104 | |||
| Class IS |
114,150,447 | |||
| Net Asset Value: | ||||
| Class A (and redemption price) |
$6.19 | |||
| Class C (and redemption price) |
$6.20 | |||
| Class I (and redemption price) |
$6.19 | |||
| Class IS (and redemption price) |
$6.20 | |||
| Maximum Public Offering Price Per Share: | ||||
| Class A (based on maximum initial sales charge of 2.25%) |
$6.33 | |||
See Notes to Financial Statements.
|
58 |
Western Asset Intermediate-Term Municipals Fund 2022 Annual Report |
For the Year Ended March 31, 2022
| Investment Income: | ||||
| Interest |
$ | 73,175,703 | ||
| Expenses: | ||||
| Investment management fee (Note 2) |
10,062,471 | |||
| Service and/or distribution fees (Notes 2 and 5) |
2,202,809 | |||
| Transfer agent fees (Note 5) |
1,841,004 | |||
| Registration fees |
150,284 | |||
| Interest expense |
126,861 | |||
| Fund accounting fees |
93,969 | |||
| Legal fees |
62,609 | |||
| Audit and tax fees |
57,950 | |||
| Shareholder reports |
50,631 | |||
| Trustees’ fees |
48,210 | |||
| Insurance |
22,241 | |||
| Commitment fees (Note 8) |
21,189 | |||
| Custody fees |
11,748 | |||
| Miscellaneous expenses |
12,200 | |||
| Total Expenses |
14,764,176 | |||
| Less: Fee waivers and/or expense reimbursements (Notes 2 and 5) |
(329,159) | |||
| Net Expenses |
14,435,017 | |||
| Net Investment Income | 58,740,686 | |||
| Realized and Unrealized Loss on Investments (Notes 1 and 3): | ||||
| Net Realized Loss From Investment Transactions |
(2,318,394) | |||
| Change in Net Unrealized Appreciation (Depreciation) From Investments |
(152,470,702) | |||
| Net Loss on Investments | (154,789,096) | |||
| Decrease in Net Assets From Operations | $ | (96,048,410) | ||
See Notes to Financial Statements.
| Western Asset Intermediate-Term Municipals Fund 2022 Annual Report |
|
59 |
|
Statements of changes in net assets
| For the Years Ended March 31, | 2022 | 2021 | ||||||
| Operations: | ||||||||
| Net investment income |
$ | 58,740,686 | $ | 62,513,485 | ||||
| Net realized gain (loss) |
(2,318,394) | 8,499,732 | ||||||
| Change in net unrealized appreciation (depreciation) |
(152,470,702) | 110,102,934 | ||||||
| Increase (Decrease) in Net Assets From Operations |
(96,048,410) | 181,116,151 | ||||||
| Distributions to Shareholders From (Notes 1 and 6): | ||||||||
| Total distributable earnings |
(58,317,914) | (62,203,490) | ||||||
| Decrease in Net Assets From Distributions to Shareholders |
(58,317,914) | (62,203,490) | ||||||
| Fund Share Transactions (Note 7): | ||||||||
| Net proceeds from sale of shares |
1,039,078,992 | 756,118,307 | ||||||
| Reinvestment of distributions |
54,981,705 | 59,298,235 | ||||||
| Cost of shares repurchased |
(746,637,214) | (621,981,519) | ||||||
| Increase in Net Assets From Fund Share Transactions |
347,423,483 | 193,435,023 | ||||||
| Increase in Net Assets |
193,057,159 | 312,347,684 | ||||||
| Net Assets: | ||||||||
| Beginning of year |
2,668,955,767 | 2,356,608,083 | ||||||
| End of year |
$ | 2,862,012,926 | $ | 2,668,955,767 | ||||
See Notes to Financial Statements.
|
60 |
Western Asset Intermediate-Term Municipals Fund 2022 Annual Report |
| For a share of each class of beneficial interest outstanding throughout each year ended March 31: | ||||||||||||||||||||
| Class A Shares1 | 2022 | 2021 | 2020 | 2019 | 2018 | |||||||||||||||
| Net asset value, beginning of year | $6.52 | $6.21 | $6.35 | $6.31 | $6.38 | |||||||||||||||
| Income (loss) from operations: | ||||||||||||||||||||
| Net investment income |
0.13 | 0.16 | 0.18 | 0.20 | 0.20 | |||||||||||||||
| Net realized and unrealized gain (loss) |
(0.33) | 0.31 | (0.14) | 0.04 | (0.07) | |||||||||||||||
| Total income (loss) from operations |
(0.20) | 0.47 | 0.04 | 0.24 | 0.13 | |||||||||||||||
| Less distributions from: | ||||||||||||||||||||
| Net investment income |
(0.13) | (0.16) | (0.18) | (0.20) | (0.20) | |||||||||||||||
| Total distributions |
(0.13) | (0.16) | (0.18) | (0.20) | (0.20) | |||||||||||||||
| Net asset value, end of year | $6.19 | $6.52 | $6.21 | $6.35 | $6.31 | |||||||||||||||
| Total return2 |
(3.20) | % | 7.57 | % | 0.54 | % | 3.88 | % | 2.09 | % | ||||||||||
| Net assets, end of year (millions) | $706 | $700 | $632 | $515 | $585 | |||||||||||||||
| Ratios to average net assets: | ||||||||||||||||||||
| Gross expenses |
0.59 | % | 0.59 | % | 0.65 | % | 0.76 | % | 0.75 | % | ||||||||||
| Net expenses3 |
0.59 | 0.59 | 4 | 0.65 | 4 | 0.76 | 4 | 0.75 | 4 | |||||||||||
| Net investment income |
1.95 | 2.45 | 2.78 | 3.18 | 3.19 | |||||||||||||||
| Portfolio turnover rate | 15 | % | 16 | % | 32 | % | 22 | % | 15 | % | ||||||||||
| 1 | Per share amounts have been calculated using the average shares method. |
| 2 | Performance figures, exclusive of sales charges, may reflect compensating balance arrangements, fee waivers and/or expense reimbursements. In the absence of compensating balance arrangements, fee waivers and/or expense reimbursements, the total return would have been lower. Past performance is no guarantee of future results. |
| 3 | As a result of an expense limitation arrangement, effective August 13, 2019, the ratio of total annual fund operating expenses, other than interest, brokerage, taxes, extraordinary expenses and acquired fund fees and expenses, to average net assets of Class A shares did not exceed 0.75%. This expense limitation arrangement cannot be terminated prior to December 31, 2023 without the Board of Trustees’ consent. |
| 4 | Reflects fee waivers and/or expense reimbursements. |
See Notes to Financial Statements.
| Western Asset Intermediate-Term Municipals Fund 2022 Annual Report |
|
61 |
|
Financial highlights (cont’d)
| For a share of each class of beneficial interest outstanding throughout each year ended March 31: | ||||||||||||||||||||
| Class C Shares1 | 2022 | 2021 | 2020 | 2019 | 2018 | |||||||||||||||
| Net asset value, beginning of year | $6.53 | $6.22 | $6.36 | $6.32 | $6.38 | |||||||||||||||
| Income (loss) from operations: | ||||||||||||||||||||
| Net investment income |
0.09 | 0.12 | 0.14 | 0.16 | 0.17 | |||||||||||||||
| Net realized and unrealized gain (loss) |
(0.33) | 0.31 | (0.14) | 0.04 | (0.06) | |||||||||||||||
| Total income (loss) from operations |
(0.24) | 0.43 | 0.00 | 2 | 0.20 | 0.11 | ||||||||||||||
| Less distributions from: | ||||||||||||||||||||
| Net investment income |
(0.09) | (0.12) | (0.14) | (0.16) | (0.17) | |||||||||||||||
| Total distributions |
(0.09) | (0.12) | (0.14) | (0.16) | (0.17) | |||||||||||||||
| Net asset value, end of year | $6.20 | $6.53 | $6.22 | $6.36 | $6.32 | |||||||||||||||
| Total return3 |
(3.76) | % | 6.93 | % | (0.04) | % | 3.27 | % | 1.50 | % | ||||||||||
| Net assets, end of year (millions) | $114 | $167 | $228 | $433 | $520 | |||||||||||||||
| Ratios to average net assets: | ||||||||||||||||||||
| Gross expenses |
1.18 | % | 1.18 | % | 1.25 | % | 1.34 | % | 1.33 | % | ||||||||||
| Net expenses4 |
1.18 | 1.18 | 5 | 1.25 | 5 | 1.34 | 1.33 | 5 | ||||||||||||
| Net investment income |
1.37 | 1.87 | 2.23 | 2.60 | 2.61 | |||||||||||||||
| Portfolio turnover rate | 15 | % | 16 | % | 32 | % | 22 | % | 15 | % | ||||||||||
| 1 | Per share amounts have been calculated using the average shares method. |
| 2 | Amount represents less than $0.005 per share. |
| 3 | Performance figures may reflect compensating balance arrangements, fee waivers and/or expense reimbursements. In the absence of compensating balance arrangements, fee waivers and/or expense reimbursements, the total return would have been lower. Past performance is no guarantee of future results. |
| 4 | As a result of an expense limitation arrangement, effective August 13, 2019, the ratio of total annual fund operating expenses, other than interest, brokerage, taxes, extraordinary expenses and acquired fund fees and expenses, to average net assets of Class C shares did not exceed 1.35%. This expense limitation arrangement cannot be terminated prior to December 31, 2023 without the Board of Trustees’ consent. |
| 5 | Reflects fee waivers and/or expense reimbursements. |
See Notes to Financial Statements.
|
62 |
Western Asset Intermediate-Term Municipals Fund 2022 Annual Report |
| For a share of each class of beneficial interest outstanding throughout each year ended March 31: | ||||||||||||||||||||
| Class I Shares1 | 2022 | 2021 | 2020 | 2019 | 2018 | |||||||||||||||
| Net asset value, beginning of year | $ | 6.52 | $ | 6.21 | $ | 6.35 | $ | 6.31 | $ | 6.38 | ||||||||||
| Income (loss) from operations: | ||||||||||||||||||||
| Net investment income |
0.14 | 0.17 | 0.19 | 0.21 | 0.21 | |||||||||||||||
| Net realized and unrealized gain (loss) |
(0.33) | 0.31 | (0.14) | 0.04 | (0.07) | |||||||||||||||
| Total income (loss) from operations |
(0.19) | 0.48 | 0.05 | 0.25 | 0.14 | |||||||||||||||
| Less distributions from: | ||||||||||||||||||||
| Net investment income |
(0.14) | (0.17) | (0.19) | (0.21) | (0.21) | |||||||||||||||
| Total distributions |
(0.14) | (0.17) | (0.19) | (0.21) | (0.21) | |||||||||||||||
| Net asset value, end of year | $ | 6.19 | $ | 6.52 | $ | 6.21 | $ | 6.35 | $ | 6.31 | ||||||||||
| Total return2 |
(3.05) | % | 7.76 | % | 0.70 | % | 4.04 | % | 2.24 | % | ||||||||||
| Net assets, end of year (millions) | $ | 1,335 | $ | 1,416 | $ | 1,251 | $ | 1,222 | $ | 1,492 | ||||||||||
| Ratios to average net assets: | ||||||||||||||||||||
| Gross expenses |
0.46 | % | 0.45 | % | 0.52 | % | 0.61 | % | 0.62 | % | ||||||||||
| Net expenses3,4 |
0.43 | 0.43 | 0.49 | 0.60 | 0.60 | |||||||||||||||
| Net investment income |
2.11 | 2.61 | 2.95 | 3.33 | 3.34 | |||||||||||||||
| Portfolio turnover rate | 15 | % | 16 | % | 32 | % | 22 | % | 15 | % | ||||||||||
| 1 | Per share amounts have been calculated using the average shares method. |
| 2 | Performance figures may reflect compensating balance arrangements, fee waivers and/or expense reimbursements. In the absence of compensating balance arrangements, fee waivers and/or expense reimbursements, the total return would have been lower. Past performance is no guarantee of future results. |
| 3 | As a result of an expense limitation arrangement, effective August 13, 2019, the ratio of total annual fund operating expenses, other than interest, brokerage, taxes, extraordinary expenses and acquired fund fees and expenses, to average net assets of Class I shares did not exceed 0.43%. This expense limitation arrangement cannot be terminated prior to December 31, 2023 without the Board of Trustees’ consent. Prior to August 13, 2019, the expense limitation was 0.60%. |
| 4 | Reflects fee waivers and/or expense reimbursements. |
See Notes to Financial Statements.
| Western Asset Intermediate-Term Municipals Fund 2022 Annual Report |
|
63 |
|
Financial highlights (cont’d)
| For a share of each class of beneficial interest outstanding throughout each year ended March 31: | ||||||||||||||||
| Class IS Shares1 | 2022 | 2021 | 2020 | 20192 | ||||||||||||
| Net asset value, beginning of year | $6.52 | $6.21 | $6.36 | $6.26 | ||||||||||||
| Income (loss) from operations: | ||||||||||||||||
| Net investment income |
0.14 | 0.17 | 0.19 | 0.11 | ||||||||||||
| Net realized and unrealized gain (loss) |
(0.32) | 0.31 | (0.15) | 0.11 | ||||||||||||
| Total income (loss) from operations |
(0.18) | 0.48 | 0.04 | 0.22 | ||||||||||||
| Less distributions from: | ||||||||||||||||
| Net investment income |
(0.14) | (0.17) | (0.19) | (0.12) | ||||||||||||
| Total distributions |
(0.14) | (0.17) | (0.19) | (0.12) | ||||||||||||
| Net asset value, end of year | $6.20 | $6.52 | $6.21 | $6.36 | ||||||||||||
| ‘Total return3 |
(2.83) | % | 7.81 | % | 0.61 | % | 3.48 | % | ||||||||
| Net assets, end of year (millions) | $707 | $386 | $245 | $200 | ||||||||||||
| Ratios to average net assets: | ||||||||||||||||
| Gross expenses |
0.37 | % | 0.37 | % | 0.43 | % | 0.53 | %4 | ||||||||
| Net expenses5 |
0.37 | 0.37 | 6 | 0.43 | 6 | 0.53 | 4 | |||||||||
| Net investment income |
2.16 | 2.66 | 3.00 | 3.42 | 4 | |||||||||||
| Portfolio turnover rate | 15 | % | 16 | % | 32 | % | 22 | %7 | ||||||||
| 1 | Per share amounts have been calculated using the average shares method. |
| 2 | For the period September 18, 2018 (inception date) to March 31, 2019. |
| 3 | Performance figures may reflect compensating balance arrangements, fee waivers and/or expense reimbursements. In the absence of compensating balance arrangements, fee waivers and/or expense reimbursements, the total return would have been lower. Past performance is no guarantee of future results. Total returns for periods of less than one year are not annualized. |
| 4 | Annualized. |
| 5 | As a result of an expense limitation arrangement, effective August 13, 2019, the ratio of total annual fund operating expenses, other than interest, brokerage, taxes, extraordinary expenses and acquired fund fees and expenses, to average net assets of Class IS shares did not exceed 0.40%. In addition, the ratio of total annual fund operating expenses for Class IS shares did not exceed the ratio of total annual fund operating expenses for Class I shares. These expense limitation arrangements cannot be terminated prior to December 31, 2023 without the Board of Trustees’ consent. Prior to August 13, 2019, the expense limitation was 0.55%. In addition, the ratio of total annual fund operating expenses for Class IS shares did not exceed the ratio of total annual fund operating expenses for Class I shares. |
| 6 | Reflects fee waivers and/or expense reimbursements. |
| 7 | For the year ended March 31, 2019. |
See Notes to Financial Statements.
|
64 |
Western Asset Intermediate-Term Municipals Fund 2022 Annual Report |
1. Organization and significant accounting policies
Western Asset Intermediate-Term Municipals Fund (the “Fund”) is a separate diversified investment series of Legg Mason Partners Income Trust (the “Trust”). The Trust, a Maryland statutory trust, is registered under the Investment Company Act of 1940, as amended (the “1940 Act”), as an open-end management investment company.
The following are significant accounting policies consistently followed by the Fund and are in conformity with U.S. generally accepted accounting principles (“GAAP”). Estimates and assumptions are required to be made regarding assets, liabilities and changes in net assets resulting from operations when financial statements are prepared. Changes in the economic environment, financial markets and any other parameters used in determining these estimates could cause actual results to differ. Subsequent events have been evaluated through the date the financial statements were issued.
(a) Investment valuation. The valuations for fixed income securities (which may include, but are not limited to, corporate, government, municipal, mortgage-backed, collateralized mortgage obligations and asset-backed securities) and certain derivative instruments are typically the prices supplied by independent third party pricing services, which may use market prices or broker/dealer quotations or a variety of valuation techniques and methodologies. The independent third party pricing services typically use inputs that are observable such as issuer details, interest rates, yield curves, prepayment speeds, credit risks/spreads, default rates and quoted prices for similar securities. Investments in open-end funds are valued at the closing net asset value per share of each fund on the day of valuation. If independent third party pricing services are unable to supply prices for a portfolio investment, or if the prices supplied are deemed by the manager to be unreliable, the market price may be determined by the manager using quotations from one or more broker/dealers or at the transaction price if the security has recently been purchased and no value has yet been obtained from a pricing service or pricing broker. When reliable prices are not readily available, such as when the value of a security has been significantly affected by events after the close of the exchange or market on which the security is principally traded, but before the Fund calculates its net asset value, the Fund values these securities as determined in accordance with procedures approved by the Fund’s Board of Trustees.
The Board of Trustees is responsible for the valuation process and has delegated the supervision of the daily valuation process to the Global Fund Valuation Committee (the “Valuation Committee”). The Valuation Committee, pursuant to the policies adopted by the Board of Trustees, is responsible for making fair value determinations, evaluating the effectiveness of the Fund’s pricing policies, and reporting to the Board of Trustees. When determining the reliability of third party pricing information for investments owned by the Fund, the Valuation Committee, among other things, conducts due diligence reviews of pricing vendors, monitors the daily change in prices and reviews transactions among market participants.
The Valuation Committee will consider pricing methodologies it deems relevant and appropriate when making fair value determinations. Examples of possible methodologies include, but are not limited to, multiple of earnings; discount from market of a similar freely traded security; discounted cash-flow analysis; book value or a multiple thereof; risk premium/yield analysis; yield to maturity; and/or fundamental investment analysis. The
| Western Asset Intermediate-Term Municipals Fund 2022 Annual Report |
|
65 |
|
Notes to financial statements (cont’d)
Valuation Committee will also consider factors it deems relevant and appropriate in light of the facts and circumstances. Examples of possible factors include, but are not limited to, the type of security; the issuer’s financial statements; the purchase price of the security; the discount from market value of unrestricted securities of the same class at the time of purchase; analysts’ research and observations from financial institutions; information regarding any transactions or offers with respect to the security; the existence of merger proposals or tender offers affecting the security; the price and extent of public trading in similar securities of the issuer or comparable companies; and the existence of a shelf registration for restricted securities.
For each portfolio security that has been fair valued pursuant to the policies adopted by the Board of Trustees, the fair value price is compared against the last available and next available market quotations. The Valuation Committee reviews the results of such back testing monthly and fair valuation occurrences are reported to the Board of Trustees quarterly.
The Fund uses valuation techniques to measure fair value that are consistent with the market approach and/or income approach, depending on the type of security and the particular circumstance. The market approach uses prices and other relevant information generated by market transactions involving identical or comparable securities. The income approach uses valuation techniques to discount estimated future cash flows to present value.
GAAP establishes a disclosure hierarchy that categorizes the inputs to valuation techniques used to value assets and liabilities at measurement date. These inputs are summarized in the three broad levels listed below:
| • | Level 1 — quoted prices in active markets for identical investments |
| • | Level 2 — other significant observable inputs (including quoted prices for similar investments, interest rates, prepayment speeds, credit risk, etc.) |
| • | Level 3 — significant unobservable inputs (including the Fund’s own assumptions in determining the fair value of investments) |
The inputs or methodologies used to value securities are not necessarily an indication of the risk associated with investing in those securities.
|
66 |
Western Asset Intermediate-Term Municipals Fund 2022 Annual Report |
The following is a summary of the inputs used in valuing the Fund’s assets carried at fair value:
| ASSETS | ||||||||||||||||
| Description | Quoted Prices (Level 1) |
Other Significant Observable Inputs (Level 2) |
Significant Unobservable Inputs (Level3) |
Total | ||||||||||||
| Long-Term Investments†: | ||||||||||||||||
| Municipal Bonds |
— | $ | 2,331,681,595 | — | $ | 2,331,681,595 | ||||||||||
| Municipal Bonds Deposited in Tender Option Bond Trust |
— | 26,453,617 | — | 26,453,617 | ||||||||||||
| Collateralized Mortgage Obligations |
— | 6,047,789 | — | 6,047,789 | ||||||||||||
| Statutory Trust Certificates |
— | — | $ | 246,039 | 246,039 | |||||||||||
| Total Long-Term Investments | — | 2,364,183,001 | 246,039 | 2,364,429,040 | ||||||||||||
| Short-Term Investments† | — | 503,940,000 | — | 503,940,000 | ||||||||||||
| Total Investments | — | $ | 2,868,123,001 | $ | 246,039 | $ | 2,868,369,040 | |||||||||
| † | See Schedule of Investments for additional detailed categorizations. |
(b) Tender option bonds. The Fund may enter into tender option bond (“TOB”) transactions and may invest in inverse floating rate instruments (“Inverse Floaters”) issued in TOB transactions. The Fund may participate either in structuring an Inverse Floater or purchasing an Inverse Floater in the secondary market. When structuring an Inverse Floater, the Fund deposits securities (typically municipal bonds or other municipal securities) (the “Underlying Bonds”) into a special purpose entity, referred to as a TOB trust. The TOB trust generally issues floating rate notes (“Floaters”) to third parties and residual interest, Inverse Floaters, to the Fund. The Floaters issued by the TOB trust have interest rates which reset weekly and provide the holders of the Floaters the option to tender their notes back to the TOB trust for redemption at par at each reset date. The net proceeds of the sale of the Floaters, after expenses, are received by the Fund and may be invested in additional securities. The Inverse Floaters are inverse floating rate debt instruments, as the return on those bonds is inversely related to changes in a specified interest rate. Distributions on any Inverse Floaters paid to the Fund will be reduced or, in the extreme, eliminated as short-term interest rates rise and will increase when such interest rates fall. Floaters issued by a TOB trust may be senior to the Inverse Floaters held by the Fund. The value and market for Inverse Floaters can be volatile, and Inverse Floaters can have limited liquidity.
An investment in an Inverse Floater structured by the Fund is accounted for as a secured borrowing. The Underlying Bonds deposited into the TOB trust are included in the Fund’s Schedule of Investments and a liability for Floaters (TOB floating rate notes) issued by the TOB trust is recognized in the Fund’s Statement of Assets and Liabilities. The carrying amount of the TOB trust’s floating rate note obligations as reported on the Statement of Assets and Liabilities approximates its fair value. Interest income, including amortization, on the Underlying Bonds is recognized in the Fund’s Statements of Operations. Interest paid to holders of the Floaters, as well as other expenses related to administration, liquidity, remarketing and trustee services of the TOB trust, are recognized in Interest expense in the Fund’s Statement of Operations.
| Western Asset Intermediate-Term Municipals Fund 2022 Annual Report |
|
67 |
|
Notes to financial statements (cont’d)
(c) Securities traded on a when-issued and delayed delivery basis. The Fund may trade securities on a when-issued or delayed delivery basis. In when-issued and delayed delivery transactions, the securities are purchased or sold by the Fund with payment and delivery taking place in the future in order to secure what is considered to be an advantageous price and yield to the Fund at the time of entering into the transaction.
Purchasing such securities involves risk of loss if the value of the securities declines prior to settlement. These securities are subject to market fluctuations and their current value is determined in the same manner as for other securities.
(d) Credit and market risk. Investments in securities that are collateralized by real estate mortgages are subject to certain credit and liquidity risks. When market conditions result in an increase in default rates of the underlying mortgages and the foreclosure values of underlying real estate properties are materially below the outstanding amount of these underlying mortgages, collection of the full amount of accrued interest and principal on these investments may be doubtful. Such market conditions may significantly impair the value and liquidity of these investments and may result in a lack of correlation between their credit ratings and values.
(e) Security transactions and investment income. Security transactions are accounted for on a trade date basis. Interest income (including interest income from payment-in-kind securities), adjusted for amortization of premium and accretion of discount, is recorded on the accrual basis. The cost of investments sold is determined by use of the specific identification method. To the extent any issuer defaults or a credit event occurs that impacts the issuer, the Fund may halt any additional interest income accruals and consider the realizability of interest accrued up to the date of default or credit event.
(f) Distributions to shareholders. Distributions from net investment income of the Fund are declared each business day to shareholders of record and are paid monthly. The Fund intends to satisfy conditions that will enable interest from municipal securities, which is exempt from federal and certain state income taxes, to retain such tax-exempt status when distributed to the shareholders of the Fund. Distributions of net realized gains, if any, are taxable and are declared at least annually. Distributions to shareholders of the Fund are recorded on the ex-dividend date and are determined in accordance with income tax regulations, which may differ from GAAP.
(g) Share class accounting. Investment income, common expenses and realized/ unrealized gains (losses) on investments are allocated to the various classes of the Fund on the basis of daily net assets of each class. Fees relating to a specific class are charged directly to that share class.
(h) Compensating balance arrangements. The Fund has an arrangement with its custodian bank whereby a portion of the custodian’s fees is paid indirectly by credits earned on the Fund’s cash on deposit with the bank.
(i) Federal and other taxes. It is the Fund’s policy to comply with the federal income and excise tax requirements of the Internal Revenue Code of 1986 (the “Code”), as amended, applicable to regulated investment companies. Accordingly, the Fund intends to distribute its taxable income and net realized gains, if any, to shareholders in accordance with timing requirements imposed by the Code. Therefore, no federal or state income tax provision is required in the Fund’s financial statements.
|
68 |
Western Asset Intermediate-Term Municipals Fund 2022 Annual Report |
Management has analyzed the Fund’s tax positions taken on income tax returns for all open tax years and has concluded that as of March 31, 2022, no provision for income tax is required in the Fund’s financial statements. The Fund’s federal and state income and federal excise tax returns for tax years for which the applicable statutes of limitations have not expired are subject to examination by the Internal Revenue Service and state departments of revenue.
(j) Reclassification. GAAP requires that certain components of net assets be reclassified to reflect permanent differences between financial and tax reporting. These reclassifications have no effect on net assets or net asset value per share. During the current year, the Fund had no reclassifications.
2. Investment management agreement and other transactions with affiliates
Legg Mason Partners Fund Advisor, LLC (“LMPFA”) is the Fund’s investment manager and Western Asset Management Company, LLC (“Western Asset”) is the Fund’s subadviser. LMPFA and Western Asset are indirect, wholly-owned subsidiaries of Franklin Resources, Inc. (“Franklin Resources”).
Under the investment management agreement, the Fund pays an investment management fee, calculated daily and paid monthly, at an annual rate of 0.35% of the Fund’s average daily net assets.
LMPFA provides administrative and certain oversight services to the Fund. LMPFA delegates to the subadviser the day-to-day portfolio management of the Fund. For its services, LMPFA pays Western Asset a fee monthly, at an annual rate equal to 70% of the net management fee it receives from the Fund.
As a result of expense limitation arrangements, between the Fund and LMPFA, the ratio of total annual fund operating expenses, other than interest, brokerage, taxes, extraordinary expenses and acquired fund fees and expenses, to average net assets of Class A, Class C, Class I and Class IS shares did not exceed 0.75%, 1.35%, 0.43%, and 0.40%, respectively. In addition, the ratio of total annual fund operating expenses for Class IS shares did not exceed the ratio of total annual fund operating expenses for Class I shares. These expense limitation arrangements cannot be terminated prior to December 31, 2023 without the Board of Trustees’ consent.
During the year ended March 31, 2022, fees waived and/or expenses reimbursed amounted to $329,159.
LMPFA is permitted to recapture amounts waived and/or reimbursed to a class within two years after the fiscal year in which LMPFA earned the fee or incurred the expense if the class’ total annual fund operating expenses have fallen to a level below the expense limitation (“expense cap”) in effect at the time the fees were earned or the expenses incurred. In no case will LMPFA recapture any amount that would result, on any particular business day of the Fund, in the class’ total annual fund operating expenses exceeding the expense cap or any other lower limit then in effect.
| Western Asset Intermediate-Term Municipals Fund 2022 Annual Report |
|
69 |
|
Notes to financial statements (cont’d)
Pursuant to these arrangements, at March 31, 2022, the Fund had remaining fee waivers and/or expense reimbursements subject to recapture by LMPFA and respective dates of expiration as follows:
| Class I | ||||
| Expires March 31, 2023 | $ | 326,689 | ||
| Expires March 31, 2024 | 329,159 | |||
| Total fee waivers/expense reimbursements subject to recapture | $ | 655,848 | ||
For the year ended March 31, 2022, LMPFA did not recapture any fees.
Franklin Distributors, LLC (known as Legg Mason Investor Services, LLC prior to July 7, 2021) (“Franklin Distributors”) serves as the Fund’s sole and exclusive distributor. Franklin Distributors is an indirect, wholly-owned broker-dealer subsidiary of Franklin Resources.
There is a maximum initial sales charge of 2.25% for Class A shares. In certain cases, Class A shares have a 0.50% contingent deferred sales charge (“CDSC”), which applies if redemption occurs within 18 months from purchase payment. This CDSC only applies to those purchases of Class A shares, which, when combined with current holdings of other shares of funds sold by Franklin Distributors, equal or exceed $250,000 in the aggregate. These purchases do not incur an initial sales charge.
For the year ended March 31, 2022, sales charges retained by and CDSCs paid to Franklin Distributors and its affiliates, if any, were as follows:
| Class A | ||||
| Sales charges | $ | (7,650) | ||
| CDSCs | 23,365 | |||
All officers and one Trustee of the Trust are employees of Franklin Resources or its affiliates and do not receive compensation from the Trust.
The Fund is permitted to purchase or sell securities, typically short-term variable rate demand obligations, from or to certain other affiliated funds or portfolios under specified conditions outlined in procedures adopted by the Board of Trustees. The procedures have been designed to provide assurance that any purchase or sale of securities by the Fund from or to another fund or portfolio that is, or could be considered, an affiliate by virtue of having a common investment manager or subadviser (or affiliated investment manager or subadviser), common Trustees and/or common officers complies with Rule 17a-7 under the 1940 Act. Further, as defined under the procedures, each transaction is effected at the current market price. For the year ended March 31, 2022, such purchase and sale transactions (excluding accrued interest) were $586,593,796 and $263,375,000, respectively.
|
70 |
Western Asset Intermediate-Term Municipals Fund 2022 Annual Report |
3. Investments
During the year ended March 31, 2022, the aggregate cost of purchases and proceeds from sales of investments (excluding short-term investments) and U.S. Government & Agency Obligations were as follows:
| Investments | U.S. Government & Agency Obligations |
|||||||
| Purchases | $ | 415,742,263 | $ | 69,772 | ||||
| Sales | 392,754,957 | 2,558,922 | ||||||
At March 31, 2022, the aggregate cost of investments and the aggregate gross unrealized appreciation and depreciation of investments for federal income tax purposes were as follows:
| Cost | Gross Unrealized Appreciation |
Gross Unrealized Depreciation |
Net Unrealized Appreciation |
|||||||||||||
| Securities | $ | 2,840,131,738 | $ | 52,885,136 | $ | (43,522,834) | $ | 9,362,302 | ||||||||
4. Derivative instruments and hedging activities
During the year ended March 31, 2022, the Fund did not invest in derivative instruments.
5. Class specific expenses, waivers and/or expense reimbursements
The Fund has adopted a Rule 12b-1 shareholder services and distribution plan and under that plan the Fund pays service and/or distribution fees with respect to its Class A and Class C shares calculated at the annual rate of 0.15% and 0.75% of the average daily net assets of each class, respectively. Service and/or distribution fees are accrued daily and paid monthly.
For the year ended March 31, 2022, class specific expenses were as follows:
| Service and/or Distribution Fees |
Transfer Agent Fees |
|||||||
| Class A | $ | 1,092,557 | $ | 509,376 | ||||
| Class C | 1,110,252 | 92,558 | ||||||
| Class I | — | 1,235,375 | ||||||
| Class IS | — | 3,695 | ||||||
| Total | $ | 2,202,809 | $ | 1,841,004 | ||||
For the year ended March 31, 2022, waivers and/or expense reimbursements by class were as follows:
| Waivers/Expense Reimbursements |
||||
| Class A | — | |||
| Class C | — | |||
| Class I | $ | 329,159 | ||
| Class IS | — | |||
| Total | $ | 329,159 | ||
| Western Asset Intermediate-Term Municipals Fund 2022 Annual Report |
|
71 |
|
Notes to financial statements (cont’d)
6. Distributions to shareholders by class
| Year Ended March 31, 2022 |
Year Ended March 31, 2021 |
|||||||
| Net Investment Income: | ||||||||
| Class A | $ | 14,139,436 | $ | 16,057,770 | ||||
| Class C | 2,010,425 | 3,693,858 | ||||||
| Class I | 30,726,040 | 34,204,116 | ||||||
| Class IS | 11,442,013 | 8,247,746 | ||||||
| Total | $ | 58,317,914 | $ | 62,203,490 | ||||
7. Shares of beneficial interest
At March 31, 2022, the Trust had an unlimited number of shares of beneficial interest authorized with a par value of $0.00001 per share. The Fund has the ability to issue multiple classes of shares. Each class of shares represents an identical interest and has the same rights, except that each class bears certain direct expenses, including those specifically related to the distribution of its shares.
Transactions in shares of each class were as follows:
| Year Ended March 31, 2022 |
Year Ended March 31, 2021 |
|||||||||||||||
| Shares | Amount | Shares | Amount | |||||||||||||
| Class A | ||||||||||||||||
| Shares sold | 24,883,240 | $ | 162,308,326 | 21,670,364 | $ | 139,496,218 | ||||||||||
| Shares issued on reinvestment | 2,074,948 | 13,532,416 | 2,392,665 | 15,336,396 | ||||||||||||
| Shares repurchased | (20,265,370) | (131,948,229) | (18,543,877) | (118,585,256) | ||||||||||||
| Net increase | 6,692,818 | $ | 43,892,513 | 5,519,152 | $ | 36,247,358 | ||||||||||
| Class C | ||||||||||||||||
| Shares sold | 5,080,913 | $ | 33,544,596 | 5,454,888 | $ | 35,156,767 | ||||||||||
| Shares issued on reinvestment | 302,747 | 1,981,459 | 570,805 | 3,655,111 | ||||||||||||
| Shares repurchased | (12,616,900) | (82,620,219) | (17,233,412) | (110,740,232) | ||||||||||||
| Net decrease | (7,233,240) | $ | (47,094,164) | (11,207,719) | $ | (71,928,354) | ||||||||||
| Class I | ||||||||||||||||
| Shares sold | 63,514,624 | $ | 415,194,987 | 65,572,892 | $ | 420,871,607 | ||||||||||
| Shares issued on reinvestment | 4,318,739 | 28,171,112 | 5,049,710 | 32,368,039 | ||||||||||||
| Shares repurchased | (69,413,585) | (452,617,359) | (54,930,882) | (350,392,685) | ||||||||||||
| Net increase (decrease) | (1,580,222) | $ | (9,251,260) | 15,691,720 | $ | 102,846,961 | ||||||||||
| Class IS | ||||||||||||||||
| Shares sold | 65,512,879 | $ | 428,031,083 | 25,066,833 | $ | 160,593,715 | ||||||||||
| Shares issued on reinvestment | 1,737,163 | 11,296,718 | 1,236,133 | 7,938,689 | ||||||||||||
| Shares repurchased | (12,247,325) | (79,451,407) | (6,603,705) | (42,263,346) | ||||||||||||
| Net increase | 55,002,717 | $ | 359,876,394 | 19,699,261 | $ | 126,269,058 | ||||||||||
8. Redemption facility
The Fund and certain other participating funds within the Trust, together with other U.S. registered and foreign investment funds (collectively, the “Borrowers”) managed by LMPFA
| 72 | Western Asset Intermediate-Term Municipals Fund 2022 Annual Report |
or Franklin Resources, are borrowers in a joint syndicated senior unsecured credit facility totaling $2.675 billion (the “Global Credit Facility”). The Global Credit Facility provides a source of funds to the Borrowers for temporary and emergency purposes, including the ability to meet future unanticipated or unusually large redemption requests. Unless renewed, the Global Credit Facility will terminate on February 3, 2023.
Under the terms of the Global Credit Facility, the Fund shall, in addition to interest charged on any borrowings made by the Fund and other costs incurred by the Fund, pay its share of fees and expenses incurred in connection with the implementation and maintenance of the Global Credit Facility, based upon its relative share of the aggregate net assets of all the Borrowers, including an annual commitment fee of 0.15% based upon the unused portion of the Global Credit Facility. These fees are reflected in the Statement of Operations. The Fund did not utilize the Global Credit Facility during the year ended March 31, 2022.
9. Income tax information and distributions to shareholders
The tax character of distributions paid during the fiscal years ended March 31, was as follows:
| 2022 | 2021 | |||||||
| Distributions paid from: | ||||||||
| Tax-exempt income | $ | 58,215,162 | $ | 61,550,623 | ||||
| Ordinary income | 102,752 | 652,867 | ||||||
| Total distributions paid | $ | 58,317,914 | $ | 62,203,490 | ||||
As of March 31, 2022, the components of distributable earnings (loss) on a tax basis were as follows:
| Undistributed tax-exempt income — net | $ | 3,251,218 | ||
| Deferred capital losses* | (93,900,719) | |||
| Other book/tax temporary differences(a) | (16,251) | |||
| Unrealized appreciation (depreciation)(b) | 9,362,302 | |||
| Total distributable earnings (loss) — net | $ | (81,303,450) |
| * | These capital losses have been deferred in the current year as either short-term or long-term losses. The losses will be deemed to occur on the first day of the next taxable year in the same character as they were originally deferred and will be available to offset future taxable capital gains. |
| (a) | Other book/tax temporary differences are attributable to book/tax differences in the timing of the deductibility of various expenses. |
| (b) | The difference between book-basis and tax-basis unrealized appreciation (depreciation) is attributable to the tax deferral of losses on wash sales, the difference between book and tax accretion methods for market discount on fixed income securities and book tax differences in the treatment of partnership investments. |
10. Recent accounting pronouncement
In March 2020, the Financial Accounting Standards Board (FASB) issued Accounting Standards Update (ASU) No. 2020-04, Reference Rate Reform (Topic 848) – Facilitation of the Effects of Reference Rate Reform on Financial Reporting. In January 2021, the FASB issued ASU No. 2021-01, with further amendments to Topic 848. The amendments in the ASUs provide optional temporary accounting recognition and financial reporting relief from the effect of certain types of contract modifications due to the planned discontinuation of the LIBOR and other interbank-offered based reference rates as of the end of 2021
| Western Asset Intermediate-Term Municipals Fund 2022 Annual Report |
|
73 |
|
Notes to financial statements (cont’d)
and 2023. The ASUs are effective for certain reference rate-related contract modifications that occur during the period March 12, 2020 through December 31, 2022. Management has reviewed the requirements and believes the adoption of these ASUs will not have a material impact on the financial statements.
11. Other matters
The outbreak of the respiratory illness COVID-19 (commonly referred to as “coronavirus”) has continued to rapidly spread around the world, causing considerable uncertainty for the global economy and financial markets. The ultimate economic fallout from the pandemic, and the long-term impact on economies, markets, industries and individual issuers, are not known. The COVID-19 pandemic could adversely affect the value and liquidity of the Fund’s investments, impair the Fund’s ability to satisfy redemption requests, and negatively impact the Fund’s performance. In addition, the outbreak of COVID-19, and measures taken to mitigate its effects, could result in disruptions to the services provided to the Fund by its service providers.
* * *
The Fund’s investments, payment obligations, and financing terms may be based on floating rates, such as the London Interbank Offered Rate, or “LIBOR,” which is the offered rate for short-term Eurodollar deposits between major international banks. On March 5, 2021, the ICE Benchmark Administration, the administrator of LIBOR, stated that it will cease the publication of the overnight and one-, three-, six- and twelve-month USD LIBOR settings immediately following the LIBOR publication on Friday, June 30, 2023. All other LIBOR settings, including the one-week and two-month USD LIBOR settings, have ceased publication as of January 1, 2022. There remains uncertainty regarding the nature of any replacement rate and the impact of the transition from LIBOR on the Fund’s transactions and the financial markets generally. As such, the potential effect of a transition away from LIBOR on the Fund or the Fund’s investments cannot yet be determined.
* * *
On February 24, 2022, Russia engaged in military actions in the sovereign territory of Ukraine. The current political and financial uncertainty surrounding Russia and Ukraine may increase market volatility and the economic risk of investing in securities in these countries and may also cause uncertainty for the global economy and broader financial markets. The ultimate fallout and long-term impact from these events are not known. The Fund will continue to assess the impact on valuations and liquidity and will take any potential actions needed in accordance with procedures approved by the Board of Trustees.
| 74 | Western Asset Intermediate-Term Municipals Fund 2022 Annual Report |
Report of independent registered public accounting firm
To the Board of Trustees of Legg Mason Partners Income Trust and
Shareholders of Western Asset
Intermediate-Term Municipals Fund
Opinion on the Financial Statements
We have audited the accompanying statement of assets and liabilities, including the schedule of investments, of Western Asset Intermediate-Term Municipals Fund (one of the funds constituting Legg Mason Partners Income Trust, referred to hereafter as the “Fund”) as of March 31, 2022, the related statement of operations for the year ended March 31, 2022, the statement of changes in net assets for each of the two years in the period ended March 31, 2022, including the related notes, and the financial highlights for each of the periods indicated therein (collectively referred to as the “financial statements”). In our opinion, the financial statements present fairly, in all material respects, the financial position of the Fund as of March 31, 2022, the results of its operations for the year then ended, the changes in its net assets for each of the two years in the period ended March 31, 2022 and the financial highlights for each of the periods indicated therein in conformity with accounting principles generally accepted in the United States of America.
Basis for Opinion
These financial statements are the responsibility of the Fund’s management. Our responsibility is to express an opinion on the Fund’s financial statements based on our audits. We are a public accounting firm registered with the Public Company Accounting Oversight Board (United States) (PCAOB) and are required to be independent with respect to the Fund in accordance with the U.S. federal securities laws and the applicable rules and regulations of the Securities and Exchange Commission and the PCAOB.
We conducted our audits of these financial statements in accordance with the standards of the PCAOB. Those standards require that we plan and perform the audit to obtain reasonable assurance about whether the financial statements are free of material misstatement, whether due to error or fraud.
Our audits included performing procedures to assess the risks of material misstatement of the financial statements, whether due to error or fraud, and performing procedures that respond to those risks. Such procedures included examining, on a test basis, evidence regarding the amounts and disclosures in the financial statements. Our audits also included evaluating the accounting principles used and significant estimates made by management, as well as evaluating the overall presentation of the financial statements. Our procedures included confirmation of securities owned as of March 31, 2022 by correspondence with the custodian and brokers; when replies were not received from brokers, we performed other auditing procedures. We believe that our audits provide a reasonable basis for our opinion.
/s/PricewaterhouseCoopers LLP
Baltimore, Maryland
May 19, 2022
We have served as the auditor of one or more investment companies in the Franklin Templeton Group of Funds since 1948.
| Western Asset Intermediate-Term Municipals Fund 2022 Annual Report |
75 |
Statement regarding liquidity risk management program (unaudited)
Each Fund has adopted and implemented a written Liquidity Risk Management Program (the “LRMP”) as required by Rule 22e-4 under the Investment Company Act of 1940 (the “Liquidity Rule”). The LRMP is designed to assess and manage each Fund’s liquidity risk, which is defined as the risk that the Fund could not meet requests to redeem shares issued by the Fund without significant dilution of remaining investors’ interests in the Fund. In accordance with the Liquidity Rule, the LRMP includes policies and procedures that provide for: (1) assessment, management, and review (no less frequently than annually) of each Fund’s liquidity risk; (2) classification of each Fund’s portfolio holdings into one of four liquidity categories (Highly Liquid, Moderately Liquid, Less Liquid, and Illiquid); (3) for Funds that do not primarily hold assets that are Highly Liquid, establishing and maintaining a minimum percentage of the Fund’s net assets in Highly Liquid investments (called a “Highly Liquid Investment Minimum” or “HLIM”); and (4) prohibiting the Fund’s acquisition of Illiquid investments that would result in the Fund holding more than 15% of its net assets in Illiquid assets. The LRMP also requires reporting to the Securities and Exchange Commission (“SEC”) (on a non-public basis) and to the Board if the Fund’s holdings of Illiquid assets exceed 15% of the Fund’s net assets. Funds with HLIMs must have procedures for addressing HLIM shortfalls, including reporting to the Board and, with respect to HLIM shortfalls lasting more than seven consecutive calendar days, reporting to the SEC (on a non-public basis).
The Director of Liquidity Risk within the Investment Risk Management Group (the “IRMG”) is the appointed Administrator of the LRMP. The IRMG maintains the Investment Liquidity Committee (the “ILC”) to provide oversight and administration of policies and procedures governing liquidity risk management for Franklin Templeton and Legg Mason products and portfolios. The ILC includes representatives from Franklin Templeton’s Risk, Trading, Global Compliance, Legal, Investment Compliance, Investment Operations, Valuation Committee, Product Management and Global Product Strategy.
In assessing and managing each Fund’s liquidity risk, the ILC considers, as relevant, a variety of factors, including the Fund’s investment strategy and the liquidity of its portfolio investments during both normal and reasonably foreseeable stressed conditions; its short and long-term cash flow projections; and its cash holdings and access to other funding sources including the Funds’ interfund lending facility and line of credit. Classification of the Fund’s portfolio holdings in the four liquidity categories is based on the number of days it is reasonably expected to take to convert the investment to cash (for Highly Liquid and Moderately Liquid holdings) or sell or dispose of the investment (for Less Liquid and Illiquid investments), in current market conditions without significantly changing the investment’s market value.
Each Fund primarily holds liquid assets that are defined under the Liquidity Rule as “Highly Liquid Investments,” and therefore is not required to establish an HLIM. Highly Liquid
|
76 |
Western Asset Intermediate-Term Municipals Fund |
Investments are defined as cash and any investment reasonably expected to be convertible to cash in current market conditions in three business days or less without the conversion to cash significantly changing the market value of the investment.
At meetings of the Funds’ Board of Trustees/Directors held in November 2021, the Program Administrator provided a written report to the Board addressing the adequacy and effectiveness of the program for the year ended December 31, 2020. The Program Administrator report concluded that (i.) the LRMP, as adopted and implemented, remains reasonably designed to assess and manage each Fund’s liquidity risk; (ii.) the LRMP, including the Highly Liquid Investment Minimum (“HLIM”) where applicable, was implemented and operated effectively to achieve the goal of assessing and managing each Fund’s liquidity risk; and (iii.) each Fund was able to meet requests for redemption without significant dilution of remaining investors’ interests in the Fund.
| Western Asset Intermediate-Term Municipals Fund |
77 |
Additional information (unaudited)
Information about Trustees and Officers
The business and affairs of Western Asset Intermediate-Term Municipals Fund (the “Fund”) are conducted by management under the supervision and subject to the direction of its Board of Trustees. The business address of each Trustee is c/o Jane Trust, Legg Mason, 100 International Drive, 11th Floor, Baltimore, Maryland 21202.
Information pertaining to the Trustees and officers of the Board is set forth below. The Statement of Additional Information includes additional information about Trustees and is available, without charge, upon request by calling the Fund at 877-6LM-FUND/656-3863.
| Independent Trustees† | ||
| Robert Abeles, Jr. | ||
| Year of birth | 1945 | |
| Position(s) with Fund | Trustee | |
| Term of office1 and length of time served2 | Since 2013 | |
| Principal occupation(s) during the past five years | Board Member, Great Public Schools Now (since 2018); Senior Vice President Emeritus (since 2016) and formerly, Senior Vice President, Finance and Chief Financial Officer (2009 to 2016) at University of Southern California; Board Member, Excellent Education Development (since 2012) | |
| Number of funds in fund complex overseen by Trustee3 | 51 | |
| Other Trusteeships held by Trustee during the past five years | None | |
| Jane F. Dasher | ||
| Year of birth | 1949 | |
| Position(s) with Fund | Trustee | |
| Term of office1 and length of time served2 | Since 1999 | |
| Principal occupation(s) during the past five years | Chief Financial Officer, Long Light Capital, LLC, formerly known as Korsant Partners, LLC (a family investment company) (since 1997) | |
| Number of funds in fund complex overseen by Trustee3 | 51 | |
| Other Trusteeships held by Trustee during the past five years | Director, Visual Kinematics, Inc. (since 2018) | |
| Anita L. DeFrantz | ||
| Year of birth | 1952 | |
| Position(s) with Fund | Trustee | |
| Term of office1 and length of time served2 | Since 1998 | |
| Principal occupation(s) during the past five years | President of Tubman Truth Corp. (since 2015); President Emeritus (since 2015) and formerly, President (1987 to 2015) and Director (1990 to 2015) of LA84 (formerly Amateur Athletic Foundation of Los Angeles); Member (since 1986), Member of the Executive Board (since 2013) and Vice President (since 2017) of the International Olympic Committee | |
| Number of funds in fund complex overseen by Trustee3 | 51 | |
| Other Trusteeships held by Trustee during the past five years | None | |
|
78 |
Western Asset Intermediate-Term Municipals Fund |
| Independent Trustees† (cont’d) | ||
| Susan B. Kerley | ||
| Year of birth | 1951 | |
| Position(s) with Fund | Trustee | |
| Term of office1 and length of time served2 | Since 1992 | |
| Principal occupation(s) during the past five years | Investment Consulting Partner, Strategic Management Advisors, LLC (investment consulting) (since 1990) | |
| Number of funds in fund complex overseen by Trustee3 | 51 | |
| Other Trusteeships held by Trustee during the past five years | Director and Trustee (since 1990) and Chairman (since 2017 and 2005 to 2012) of various series of MainStay Family of Funds (66 funds); formerly, Investment Company Institute (ICI) Board of Governors (2006 to 2014); ICI Executive Committee (2011 to 2014); Chairman of the Independent Directors Council (2012 to 2014) | |
| Michael Larson | ||
| Year of birth | 1959 | |
| Position(s) with Fund | Trustee | |
| Term of office1 and length of time served2 | Since 2004 | |
| Principal occupation(s) during the past five years | Chief Investment Officer for William H. Gates III (since 1994)4 | |
| Number of funds in fund complex overseen by Trustee3 | 51 | |
| Other Trusteeships held by Trustee during the past five years | Republic Services, Inc. (since 2009); Fomento Economico Mexicano, SAB (since 2011); Ecolab Inc. (since 2012); formerly, AutoNation, Inc. (2010 to 2018) | |
| Avedick B. Poladian | ||
| Year of birth | 1951 | |
| Position(s) with Fund | Trustee | |
| Term of office1 and length of time served2 | Since 2007 | |
| Principal occupation(s) during the past five years | Director and Advisor (since 2017) and former Executive Vice President and Chief Operating Officer (2002 to 2016) of Lowe Enterprises, Inc. (privately held real estate and hospitality firm); formerly, Partner, Arthur Andersen, LLP (1974 to 2002) | |
| Number of funds in fund complex overseen by Trustee3 | 51 | |
| Other Trusteeships held by Trustee during the past five years | Occidental Petroleum Corporation (since 2008); California Resources Corporation (2014 to 2021); and Public Storage (since 2010) | |
| Western Asset Intermediate-Term Municipals Fund |
79 |
Additional information (unaudited) (cont’d)
Information about Trustees and Officers
| Independent Trustees† (cont’d) | ||
| William E.B. Siart | ||
| Year of birth | 1946 | |
| Position(s) with Fund | Trustee and Chairman of the Board | |
| Term of office1 and length of time served2 | Since 1997 (Chairman of the Board since 2020) | |
| Principal occupation(s) during the past five years | Chairman of Excellent Education Development (since 2000); formerly, Chairman of Great Public Schools Now (2015 to 2020); Trustee of The Getty Trust (since 2005 to 2017); Chairman of Walt Disney Concert Hall, Inc. (1998 to 2006) | |
| Number of funds in fund complex overseen by Trustee3 | 51 | |
| Other Trusteeships held by Trustee during the past five years | Member of Board of United States Golf Association, Executive Committee Member (since 2017); Trustee, University of Southern California (since 1994) | |
| Jaynie Miller Studenmund | ||
| Year of birth | 1954 | |
| Position(s) with Fund | Trustee | |
| Term of office1 and length of time served2 | Since 2004 | |
| Principal occupation(s) during the past five years | Corporate Board Member and Advisor (since 2004); formerly, Chief Operating Officer of Overture Services, Inc. (publicly traded internet company that created search engine marketing) (2001 to 2004); President and Chief Operating Officer, PayMyBills (internet innovator in bill presentment/payment space) (1999 to 2001); Executive vice president for consumer and business banking for three national financial institutions (1984 to 1997) | |
| Number of funds in fund complex overseen by Trustee3 | 51 | |
| Other Trusteeships held by Trustee during the past five years | Director of Pacific Premier Bancorp Inc. and Pacific Premier Bank (since 2019); Director of EXL (operations management and analytics company) (since 2018); Director of CoreLogic, Inc. (information, analytics and business services company) (since 2012); formerly, Director of Pinnacle Entertainment, Inc. (gaming and hospitality company) (2012 to 2018); Director of LifeLock, Inc. (identity theft protection company) (2015 to 2017); Director of Orbitz Worldwide, Inc. (online travel company) (2007 to 2014) | |
| Peter J. Taylor | ||
| Year of birth | 1958 | |
| Position(s) with Fund | Trustee | |
| Term of office1 and length of time served2 | Since 2019 | |
| Principal occupation(s) during the past five years | President, ECMC Foundation (nonprofit organization) (since 2014); formerly, Executive Vice President and Chief Financial Officer for University of California system (2009 to 2014) | |
| Number of funds in fund complex overseen by Trustee3 | 51 | |
| Other Trusteeships held by Trustee during the past five years | Director of Pacific Mutual Holding Company5 (since 2016); Member of the Board of Trustees of California State University system (since 2015); Ralph M. Parson Foundation (since 2015), Kaiser Family Foundation (since 2012), and Edison International (since 2011) | |
|
80 |
Western Asset Intermediate-Term Municipals Fund |
| Interested Trustee | ||
| Ronald L. Olson6 | ||
| Year of birth | 1941 | |
| Position(s) with Fund | Trustee | |
| Term of office1 and length of time served2 | Since 2005 | |
| Principal occupation(s) during the past five years | Partner of Munger, Tolles & Olson LLP (law partnership) (since 1968) | |
| Number of funds in fund complex overseen by Trustee3 | 51 | |
| Other Trusteeships held by Trustee during the past five years | Berkshire Hathaway, Inc. (since 1997) | |
| Interested Trustee and Officer | ||
| Jane Trust, CFA7 | ||
| Year of birth | 1962 | |
| Position(s) with Fund | Trustee, President and Chief Executive Officer | |
| Term of office1 and length of time served2 | Since 2015 | |
| Principal occupation(s) during the past five years | Senior Vice President, Fund Board Management, Franklin Templeton (since 2020); Officer and/or Trustee/Director of 131 funds associated with LMPFA or its affiliates (since 2015); President and Chief Executive Officer of LMPFA (since 2015); formerly, Senior Managing Director (2018 to 2020) and Managing Director (2016 to 2018) of Legg Mason & Co., LLC (“Legg Mason & Co.”); Senior Vice President of LMPFA (2015) | |
| Number of funds in fund complex overseen by Trustee3 | 129 | |
| Other Trusteeships held by Trustee during the past five years | None | |
| Additional Officers | ||
| Ted P. Becker Franklin Templeton 620 Eighth Avenue, 47th Floor, New York, NY 10018 | ||
| Year of birth | 1951 | |
| Position(s) with Fund | Chief Compliance Officer | |
| Term of office1 and length of time served2 | Since 2007 | |
| Principal occupation(s) during the past five years | Vice President, Global Compliance of Franklin Templeton (since 2020); Chief Compliance Officer of LMPFA (since 2006); Chief Compliance Officer of certain funds associated with Legg Mason & Co. or its affiliates (since 2006); formerly, Director of Global Compliance at Legg Mason, Inc. (2006 to 2020); Managing Director of Compliance of Legg Mason & Co. (2005 to 2020) | |
| Western Asset Intermediate-Term Municipals Fund |
81 |
Additional information (unaudited) (cont’d)
Information about Trustees and Officers
| Additional Officers (cont’d) | ||
| Susan Kerr | ||
| Franklin Templeton 620 Eighth Avenue, 47th Floor, New York, NY 10018 | ||
| Year of birth | 1949 | |
| Position(s) with Fund | Chief Anti-Money Laundering Compliance Officer | |
| Term of office1 and length of time served2 | Since 2013 | |
| Principal occupation(s) during the past five years | Senior Compliance Analyst, Franklin Templeton (since 2020); Chief Anti-Money Laundering Compliance Officer of certain funds associated with Legg Mason & Co. or its affiliates (since 2013) and Anti-Money Laundering Compliance Officer (since 2012), Senior Compliance Officer (since 2011) and Assistant Vice President (since 2010) of Franklin Distributors, LLC; formerly, Assistant Vice President of Legg Mason & Co. (2010 to 2020) | |
| Marc A. De Oliveira | ||
| Franklin Templeton 100 First Stamford Place, 6th Floor, Stamford, CT 06902 | ||
| Year of birth | 1971 | |
| Position(s) with Fund | Secretary and Chief Legal Officer | |
| Term of office1 and length of time served2 | Since 2020 | |
| Principal occupation(s) during the past five years | Associate General Counsel of Franklin Templeton (since 2020); Assistant Secretary of certain funds associated with Legg Mason & Co. or its affiliates (since 2006); formerly, Managing Director (2016 to 2020) and Associate General Counsel of Legg Mason & Co. (2005 to 2020) | |
| Thomas C. Mandia | ||
| Franklin Templeton 100 First Stamford Place, 6th Floor, Stamford, CT 06902 | ||
| Year of birth | 1962 | |
| Position(s) with Fund | Senior Vice President | |
| Term of office1 and length of time served2 | Since 2020 | |
| Principal occupation(s) during the past five years | Senior Associate General Counsel of Franklin Templeton (since 2020); Secretary of LMPFA (since 2006); Assistant Secretary of certain funds associated with Legg Mason & Co. or its affiliates (since 2006); Secretary of LM Asset Services, LLC (“LMAS”) (since 2002) and Legg Mason Fund Asset Management, Inc. (“LMFAM”) (since 2013) (formerly registered investment advisers); formerly, Managing Director and Deputy General Counsel of Legg Mason & Co. (2005 to 2020) | |
|
82 |
Western Asset Intermediate-Term Municipals Fund |
| Additional Officers (cont’d) | ||
| Christopher Berarducci Franklin Templeton 620 Eighth Avenue, 47th Floor, New York, NY 10018 | ||
| Year of birth | 1974 | |
| Position(s) with Fund | Treasurer and Principal Financial Officer | |
| Term of office1 and length of time served2 | Since 2019 | |
| Principal occupation(s) during the past five years | Vice President, Fund Administration and Reporting, Franklin Templeton (since 2020); Treasurer (since 2010) and Principal Financial Officer (since 2019) of certain funds associated with Legg Mason & Co. or its affiliates; formerly, Managing Director (2020), Director (2015 to 2020), and Vice President (2011 to 2015) of Legg Mason & Co. | |
| Jeanne M. Kelly Franklin Templeton 620 Eighth Avenue, 47th Floor, New York, NY 10018 | ||
| Year of birth | 1951 | |
| Position(s) with Fund | Senior Vice President | |
| Term of office1 and length of time served2 | Since 2007 | |
| Principal occupation(s) during the past five years | U.S. Fund Board Team Manager, Franklin Templeton (since 2020); Senior Vice President of certain funds associated with Legg Mason & Co. or its affiliates (since 2007); Senior Vice President of LMPFA (since 2006); President and Chief Executive Officer of LMAS and LMFAM (since 2015); formerly, Managing Director of Legg Mason & Co. (2005 to 2020); Senior Vice President of LMFAM (2013 to 2015) | |
| † | Trustees who are not “interested persons” of the Fund within the meaning of Section 2(a)(19) of the Investment Company Act of 1940, as amended (the “1940 Act”). |
| 1 | Each Trustee and officer serves until his or her respective successor has been duly elected and qualified or until his or her earlier death, resignation, retirement or removal. |
| 2 | Indicates the earliest year in which the Trustee became a board member for a fund in the Legg Mason fund complex or the officer took such office. |
| 3 | Each board member also serves as a Director of Western Asset Investment Grade Income Fund Inc. and a Trustee of Western Asset Premier Bond Fund (closed-end investment companies), which are considered part of the same fund complex. Additionally, each board member serves as a Trustee of Western Asset Inflation-Linked Income Fund and Western Asset Inflation-Linked Opportunities & Income Fund, closed-end investment companies that are part of the same fund complex. |
| 4 | Mr. Larson is the chief investment officer for William H. Gates III and in that capacity oversees the investments of Mr. Gates and the investments of the Bill and Melinda Gates Foundation Trust (such combined investments are referred to as the “Accounts”). Since 1997, Western Asset has provided discretionary investment advice with respect to one or more Accounts. |
| 5 | Western Asset and its affiliates provide investment advisory services with respect to registered investment companies sponsored by an affiliate of Pacific Mutual Holding Company (“Pacific Holdings”). Affiliates of Pacific Holdings receive compensation from LMPFA or its affiliates for shareholder or distribution services provided with respect to registered investment companies for which Western Asset or its affiliates serve as investment adviser. |
| Western Asset Intermediate-Term Municipals Fund |
83 |
Additional information (unaudited) (cont’d)
Information about Trustees and Officers
| 6 | Mr. Olson is an “interested person” of the Fund, as defined in the 1940 Act, because his law firm has provided legal services to Western Asset. |
| 7 | Ms. Trust is an “interested person” of the Fund, as defined in the 1940 Act, because of her position with LMPFA and/or certain of its affiliates. |
|
84 |
Western Asset Intermediate-Term Municipals Fund |
Important tax information (unaudited)
By mid-February, tax information related to a shareholder’s proportionate share of distributions paid during the preceding calendar year will be received, if applicable. Please also refer to www.franklintempleton.com for per share tax information related to any distributions paid during the preceding calendar year. Shareholders are advised to consult with their tax advisors for further information on the treatment of these amounts on their tax returns.
The following tax information for the Fund is required to be furnished to shareholders with respect to income earned and distributions paid during its fiscal year.
The Fund hereby reports the following amounts, or if subsequently determined to be different, the maximum allowable amounts, for the fiscal year ended March 31, 2022:
| Pursuant to: | Amount Reported | |||||||
| Exempt-Interest Dividends Distributed | § | 852(b)(5)(A) | $58,215,162 | |||||
| Qualified Net Interest Income (QII) | § | 871(k)(1)(C) | $102,752 | |||||
| Section 163(j) Interest Earned | § | 163(j) | $119,595 | |||||
| Western Asset Intermediate-Term Municipals Fund |
85 |
Western Asset
Intermediate-Term Municipals Fund
Trustees
Robert Abeles, Jr.
Jane F. Dasher
Anita L. DeFrantz
Susan B. Kerley
Michael Larson
Ronald L. Olson
Avedick B. Poladian
William E.B. Siart
Chairman
Jaynie M. Studenmund
Peter J. Taylor
Jane Trust
Investment manager
Legg Mason Partners Fund Advisor, LLC
Subadviser
Western Asset Management Company, LLC
Distributor
Franklin Distributors, LLC†
Custodian
The Bank of New York Mellon
Transfer agent#
Franklin Templeton Investor Services, LLC
3344 Quality Drive
Rancho Cordova, CA 95670-7313
Independent registered public accounting firm
PricewaterhouseCoopers LLP
Baltimore, MD
| † | Effective July 7, 2021, Legg Mason Investor Services, LLC was renamed Franklin Distributors, LLC. |
| # | Effective February 22, 2022, Franklin Templeton Investor Services, LLC replaced BNY Mellon Investment Servicing (US) Inc. as Transfer Agent. |
Western Asset Intermediate-Term Municipals Fund
The Fund is a separate investment series of Legg Mason Partners Income Trust, a Maryland statutory trust.
Western Asset Intermediate-Term Municipals Fund
Legg Mason Funds
620 Eighth Avenue, 47th Floor
New York, NY 10018
The Fund files its complete schedule of portfolio holdings with the Securities and Exchange Commission (“SEC”) for the first and third quarters of each fiscal year as an exhibit to its reports on Form N-PORT. The Fund’s Forms N-PORT are available on the SEC’s website at www.sec.gov. To obtain information on Form N-PORT, shareholders can call the Fund at 877-6LM-FUND/656-3863.
Information on how the Fund voted proxies relating to portfolio securities during the prior 12-month period ended June 30th of each year and a description of the policies and procedures that the Fund uses to determine how to vote proxies related to portfolio transactions are available (1) without charge, upon request, by calling the Fund at 877-6LM-FUND/656- 3863, (2) at www.franklintempleton.com and (3) on the SEC’s website at www.sec.gov.
This report is submitted for the general information of the shareholders of Western Asset Intermediate-Term Municipals Fund. This report is not authorized for distribution to prospective investors in the Fund unless preceded or accompanied by a current prospectus.
Investors should consider the Fund’s investment objectives, risks, charges and expenses carefully before investing. The prospectus contains this and other important information about the Fund. Please read the prospectus carefully before investing.
www.franklintempleton.com
© 2022 Franklin Distributors, LLC, Member FINRA/SIPC. All rights reserved.
Legg Mason Funds Privacy and Security Notice
Your Privacy and the Security of Your Personal Information is Very Important to the Legg Mason Funds
This Privacy and Security Notice (the “Privacy Notice”) addresses the Legg Mason Funds’ privacy and data protection practices with respect to nonpublic personal information the Funds receive. The Legg Mason Funds include any funds sold by the Funds’ distributor, Franklin Distributors, LLC, as well as Legg Mason-sponsored closed-end funds. The provisions of this Privacy Notice apply to your information both while you are a shareholder and after you are no longer invested with the Funds.
The Type of Nonpublic Personal Information the Funds Collect About You
The Funds collect and maintain nonpublic personal information about you in connection with your shareholder account. Such information may include, but is not limited to:
| • | Personal information included on applications or other forms; |
| • | Account balances, transactions, and mutual fund holdings and positions; |
| • | Bank account information, legal documents, and identity verification documentation; |
| • | Online account access user IDs, passwords, security challenge question responses; and |
| • | Information received from consumer reporting agencies regarding credit history and creditworthiness (such as the amount of an individual’s total debt, payment history, etc.). |
How the Funds Use Nonpublic Personal Information About You
The Funds do not sell or share your nonpublic personal information with third parties or with affiliates for their marketing purposes, or with other financial institutions or affiliates for joint marketing purposes, unless you have authorized the Funds to do so. The Funds do not disclose any nonpublic personal information about you except as may be required to perform transactions or services you have authorized or as permitted or required by law.
The Funds may disclose information about you to:
| • | Employees, agents, and affiliates on a “need to know” basis to enable the Funds to conduct ordinary business, or to comply with obligations to government regulators; |
| • | Service providers, including the Funds’ affiliates, who assist the Funds as part of the ordinary course of business (such as printing, mailing services, or processing or servicing your account with us) or otherwise perform services on the Funds’ behalf, including companies that may perform statistical analysis, market research and marketing services solely for the Funds; |
| • | Permit access to transfer, whether in the United States or countries outside of the United States to such Funds’ employees, agents and affiliates and service providers as required to enable the Funds to conduct ordinary business, or to comply with obligations to government regulators; |
| • | The Funds’ representatives such as legal counsel, accountants and auditors to enable the Funds to conduct ordinary business, or to comply with obligations to government regulators; |
| • | Fiduciaries or representatives acting on your behalf, such as an IRA custodian or trustee of a grantor trust. |
| NOT PART OF THE ANNUAL REPORT |
Legg Mason Funds Privacy and Security Notice (cont’d)
Except as otherwise permitted by applicable law, companies acting on the Funds’ behalf, including those outside the United States, are contractually obligated to keep nonpublic personal information the Funds provide to them confidential and to use the information the Funds share only to provide the services the Funds ask them to perform. The Funds may disclose nonpublic personal information about you when necessary to enforce their rights or protect against fraud, or as permitted or required by applicable law, such as in connection with a law enforcement or regulatory request, subpoena, or similar legal process. In the event of a corporate action or in the event a Fund service provider changes, the Funds may be required to disclose your nonpublic personal information to third parties. While it is the Funds’ practice to obtain protections for disclosed information in these types of transactions, the Funds cannot guarantee their privacy policy will remain unchanged.
Keeping You Informed of the Funds’ Privacy and Security Practices
The Funds will notify you annually of their privacy policy as required by federal law. While the Funds reserve the right to modify this policy at any time they will notify you promptly if this privacy policy changes.
The Funds’ Security Practices
The Funds maintain appropriate physical, electronic and procedural safeguards designed to guard your nonpublic personal information. The Funds’ internal data security policies restrict access to your nonpublic personal information to authorized employees, who may use your nonpublic personal information for Fund business purposes only.
Although the Funds strive to protect your nonpublic personal information, they cannot ensure or warrant the security of any information you provide or transmit to them, and you do so at your own risk. In the event of a breach of the confidentiality or security of your nonpublic personal information, the Funds will attempt to notify you as necessary, so you can take appropriate protective steps. If you have consented to the Funds using electronic communications or electronic delivery of statements, they may notify you under such circumstances using the most current email address you have on record with them.
In order for the Funds to provide effective service to you, keeping your account information accurate is very important. If you believe that your account information is incomplete, not accurate or not current, if you have questions about the Funds’ privacy practices, or our use of your nonpublic personal information, write the Funds using the contact information on your account statements, email the Funds by clicking on the Contact Us section of the Funds’ website at www.franklintempleton.com, or contact the Fund at 877-6LM-FUND/656-3863.
Revised April 2018
Legg Mason California Consumer Privacy Act Policy
Although much of the personal information we collect is “nonpublic personal information” subject to federal law, residents of California may, in certain circumstances, have additional rights under the California Consumer Privacy Act (“CCPA”). For example, if you are a broker,
| NOT PART OF THE ANNUAL REPORT |
Legg Mason Funds Privacy and Security Notice (cont’d)
dealer, agent, fiduciary, or representative acting by or on behalf of, or for, the account of any other person(s) or household, or a financial advisor, or if you have otherwise provided personal information to us separate from the relationship we have with personal investors, the provisions of this Privacy Policy apply to your personal information (as defined by the CCPA).
| • | In addition to the provisions of the Legg Mason Funds Security and Privacy Notice, you may have the right to know the categories and specific pieces of personal information we have collected about you. |
| • | You also have the right to request the deletion of the personal information collected or maintained by the Funds. |
If you wish to exercise any of the rights you have in respect of your personal information, you should advise the Funds by contacting them as set forth below. The rights noted above are subject to our other legal and regulatory obligations and any exemptions under the CCPA. You may designate an authorized agent to make a rights request on your behalf, subject to the identification process described below. We do not discriminate based on requests for information related to our use of your personal information, and you have the right not to receive discriminatory treatment related to the exercise of your privacy rights.
We may request information from you in order to verify your identity or authority in making such a request. If you have appointed an authorized agent to make a request on your behalf, or you are an authorized agent making such a request (such as a power of attorney or other written permission), this process may include providing a password/passcode, a copy of government issued identification, affidavit or other applicable documentation, i.e. written permission. We may require you to verify your identity directly even when using an authorized agent, unless a power of attorney has been provided. We reserve the right to deny a request submitted by an agent if suitable and appropriate proof is not provided.
For the 12-month period prior to the date of this Privacy Policy, the Legg Mason Funds have not sold any of your personal information; nor do we have any plans to do so in the future.
Contact Information
Address: Data Privacy Officer, 100 International Dr., Baltimore, MD 21202
Email: [email protected]
Phone: 1-800-396-4748
Revised October 2020
| NOT PART OF THE ANNUAL REPORT |
www.franklintempleton.com
© 2022 Franklin Distributors, LLC, Member FINRA/SIPC. All rights reserved.
FD2305 5/22 SR22-4397
| ITEM 2. | CODE OF ETHICS. |
The registrant has adopted a code of ethics that applies to the registrant’s principal executive officer, principal financial officer, principal accounting officer or controller.
| ITEM 3. | AUDIT COMMITTEE FINANCIAL EXPERT. |
The Board of Trustees of the registrant has determined that Robert Abeles, Jr., possess the technical attributes identified in Instruction 2(b) of Item 3 to Form N-CSR to qualify an “audit committee financial experts,” and has designated Mr. Abeles, Jr. as the Audit Committee’s financial experts. Mr. Abeles, Jr. is an “independent” Trustees pursuant to paragraph (a) (2) of Item 3 to Form N-CSR.
| ITEM 4. | PRINCIPAL ACCOUNTANT FEES AND SERVICES. |
a) Audit-Related Fees. The aggregate fees billed in the last two fiscal years ending March 31, 2021 and March 31, 2022 (the “Reporting Periods”) for professional services rendered by the Registrant’s principal accountant (the “Auditor”) for the audit of the Registrant’s annual financial statements, or services that are normally provided by the Auditor in connection with the statutory and regulatory filings or engagements for the Reporting Periods, were $147,514 in March 31, 2021 and $147,514 in March 31, 2022.
b) Audit-Related Fees. The aggregate fees billed in the Reporting Period for assurance and related services by the Auditor that are reasonably related to the performance of the Registrant’s financial statements were $0 in March 31, 2021 and $0 in March 31, 2022.
(c) Tax Fees. The aggregate fees billed in the Reporting Periods for professional services rendered by the Auditor for tax compliance, tax advice and tax planning (“Tax Services”) were $0 in March 31, 2021 and $39,000 in March 31, 2022. These services consisted of (i) review or preparation of U.S. federal, state, local and excise tax returns; (ii) U.S. federal, state and local tax planning, advice and assistance regarding statutory, regulatory or administrative developments, and (iii) tax advice regarding tax qualification matters and/or treatment of various financial instruments held or proposed to be acquired or held.
There were no fees billed for tax services by the Auditors to service affiliates during the Reporting Periods that required pre-approval by the Audit Committee.
d) All Other Fees. The aggregate fees billed in the Reporting Periods for products and services provided by the Auditor, other than the services reported in paragraphs (a) through (c) for the Item 4 for the Legg Mason Partners Income Trust, were $0 in March 31, 2021 and $0 in March 31, 2022.
All Other Fees. There were no other non-audit services rendered by the Auditor to Legg Mason Partners Fund Advisors, LLC (“LMPFA”), and any entity controlling, controlled by or under common control with LMPFA that provided ongoing services to Legg Mason Partners Income Trust requiring pre-approval by the Audit Committee in the Reporting Period.
(e) Audit Committee’s pre–approval policies and procedures described in paragraph (c) (7) of Rule 2-01 of Regulation S-X.
(1) The Charter for the Audit Committee (the “Committee”) of the Board of each registered investment company (the “Fund”) advised by LMPFA or one of their affiliates (each, an “Adviser”) requires that the Committee shall approve (a) all audit and permissible non-audit
services to be provided to the Fund and (b) all permissible non-audit services to be provided by the Fund’s independent auditors to the Adviser and any Covered Service Providers if the engagement relates directly to the operations and financial reporting of the Fund. The Committee may implement policies and procedures by which such services are approved other than by the full Committee.
The Committee shall not approve non-audit services that the Committee believes may impair the independence of the auditors. As of the date of the approval of this Audit Committee Charter, permissible non-audit services include any professional services (including tax services), that are not prohibited services as described below, provided to the Fund by the independent auditors, other than those provided to the Fund in connection with an audit or a review of the financial statements of the Fund. Permissible non-audit services may not include: (i) bookkeeping or other services related to the accounting records or financial statements of the Fund; (ii) financial information systems design and implementation; (iii) appraisal or valuation services, fairness opinions or contribution-in-kind reports; (iv) actuarial services; (v) internal audit outsourcing services; (vi) management functions or human resources; (vii) broker or dealer, investment adviser or investment banking services; (viii) legal services and expert services unrelated to the audit; and (ix) any other service the Public Company Accounting Oversight Board determines, by regulation, is impermissible.
Pre-approval by the Committee of any permissible non-audit services is not required so long as: (i) the aggregate amount of all such permissible non-audit services provided to the Fund, the Adviser and any service providers controlling, controlled by or under common control with the Adviser that provide ongoing services to the Fund (“Covered Service Providers”) constitutes not more than 5% of the total amount of revenues paid to the independent auditors during the fiscal year in which the permissible non-audit services are provided to (a) the Fund, (b) the Adviser and (c) any entity controlling, controlled by or under common control with the Adviser that provides ongoing services to the Fund during the fiscal year in which the services are provided that would have to be approved by the Committee; (ii) the permissible non-audit services were not recognized by the Fund at the time of the engagement to be non-audit services; and (iii) such services are promptly brought to the attention of the Committee and approved by the Committee (or its delegate(s)) prior to the completion of the audit.
(2) For the Legg Mason Partners Income Trust, the percentage of fees that were approved by the audit committee, with respect to: Audit-Related Fees were 100% and 100% for March 31, 2021 and March 31, 2022; Tax Fees were 100% and 100% for March 31, 2021 and March 31, 2022; and Other Fees were 100% and 100% for March 31, 2021 and March 31, 2022.
(f) N/A
(g) Non-audit fees billed by the Auditor for services rendered to Legg Mason Partners Income Trust, LMPFA and any entity controlling, controlled by, or under common control with LMPFA that provides ongoing services to Legg Mason Partners Income Trust during the reporting period were $773,011 in March 31, 2021 and $343,489 in March 31, 2022.
(h) Yes. Legg Mason Partners Income Trust’s Audit Committee has considered whether the provision of non-audit services that were rendered to Service Affiliates, which were not pre-approved (not requiring pre-approval), is compatible with maintaining the Accountant’s independence. All services provided by the Auditor to the Legg Mason Partners Income Trust or to Service Affiliates, which were required to be pre-approved, were pre-approved as required.
| ITEM 5. | AUDIT COMMITTEE OF LISTED REGISTRANTS. |
| a) | The independent board members are acting as the registrant’s audit committee as specified in Section 3(a)(58)(B) of the Exchange Act. The Audit Committee consists of the following Board members: |
Robert Abeles, Jr.
Jane F. Dasher
Anita L. DeFrantz
Susan B. Kerley
Michael Larson
Ronald L. Olson
Avedick B. Poladian
William E.B. Siart
Jaynie M. Studenmund
Peter J. Taylor
b) Not applicable
| ITEM 6. | SCHEDULE OF INVESTMENTS. |
Included herein under Item 1.
| ITEM 7. | DISCLOSURE OF PROXY VOTING POLICIES AND PROCEDURES FOR CLOSED-END MANAGEMENT INVESTMENT COMPANIES. |
Not applicable.
| ITEM 8. | PORTFOLIO MANAGERS OF CLOSED-END MANAGEMENT INVESTMENT COMPANIES. |
Not applicable.
| ITEM 9. | PURCHASES OF EQUITY SECURITIES BY CLOSED-END MANAGEMENT INVESTMENT COMPANY AND AFFILIATED PURCHASERS. |
Not applicable.
| ITEM 10. | SUBMISSION OF MATTERS TO A VOTE OF SECURITY HOLDERS. |
Not applicable.
| ITEM 11. | CONTROLS AND PROCEDURES. |
| (a) | The registrant’s principal executive officer and principal financial officer have concluded that the registrant’s disclosure controls and procedures (as defined in Rule 30a- 3(c) under the Investment Company Act of 1940, as amended (the “1940 Act”)) are effective as of a date within 90 days of the filing date of this report that includes the disclosure required by this paragraph, based on their evaluation of the disclosure controls and procedures required by Rule 30a-3(b) under the 1940 Act and 15d-15(b) under the Securities Exchange Act of 1934. |
| (b) | There were no changes in the registrant’s internal control over financial reporting (as defined in Rule 30a-3(d) under the 1940 Act) that occurred during the second fiscal quarter of the period covered by this report that have materially affected, or are likely to materially affect the registrant’s internal control over financial reporting. |
| ITEM 12. | DISCLOSURE OF SECURITIES LENDING ACTIVITIES FOR CLOSED-END MANAGEMENT INVESTMENT COMPANIES. |
Not applicable.
| ITEM 13. | EXHIBITS. |
(a) (1) Code of Ethics attached hereto.
Exhibit 99.CODE ETH
(a) (2) Certifications pursuant to section 302 of the Sarbanes-Oxley Act of 2002 attached hereto.
Exhibit 99.CERT
(b) Certifications pursuant to Section 906 of the Sarbanes-Oxley Act of 2002 attached hereto.
Exhibit 99.906CERT
SIGNATURES
Pursuant to the requirements of the Securities Exchange Act of 1934 and the Investment Company Act of 1940, the registrant has duly caused this Report to be signed on its behalf by the undersigned, there unto duly authorized.
Legg Mason Partners Income Trust
| By: |
/s/ Jane Trust | |
| Jane Trust | ||
| Chief Executive Officer | ||
| Date: |
May 25, 2022 | |
Pursuant to the requirements of the Securities Exchange Act of 1934 and the Investment Company Act of 1940, this report has been signed below by the following persons on behalf of the registrant and in the capacities and on the dates indicated.
| By: |
/s/ Jane Trust | |
| Jane Trust | ||
| Chief Executive Officer | ||
| Date: |
May 25, 2022 | |
| By: | /s/ Christopher Berarducci | |
| Christopher Berarducci | ||
| Principal Financial Officer | ||
| Date: | May 25, 2022 | |
Code of Conduct for Principal Executive and Financial Officers (SOX)
Covered Officers and Purpose of the Code
The Funds’ code of ethics (the “Code”) for investment companies within the Legg Mason family of mutual funds (each a “Fund,” and collectively, the “Funds”) applies to each Fund’s Principal Executive Officer, Principal Financial Officer, and Controller (the “Covered Officers”) for the purpose of promoting:
| • | honest and ethical conduct, including ethical handling of actual or apparent conflicts of interest between personal and professional relationships; |
| • | full, fair, accurate, timely and understandable disclosure in reports and documents a registrant files with, or submits to, the Securities and Exchange Commission (“SEC”) and in other public communications made by the Funds; |
| • | compliance with applicable laws and governmental rules and regulations; |
| • | prompt internal reporting of Code violations to appropriate persons identified in the Code; and |
| • | accountability for adherence to the Code. |
Each Covered Officer should adhere to a high standard of business ethics and should be sensitive to situations that may give rise to actual as well as apparent conflicts of interest.
Covered Officers Should Ethically Handle Actual and Apparent Conflicts of Interest
A “conflict of interest” occurs when a Covered Officer’s private interest interferes with the interests of, or his or her service to, a Fund. For example, a conflict of interest would arise if a Covered Officer, or a member of his or her family, receives improper personal benefits as a result of his or her position with a Fund.
Certain conflicts of interest arise out of the relationships between Covered Officers and a Fund and already are subject to conflict of interest provisions in the Investment Company Act of 1940 (“Investment Company Act”) and the Investment Advisers Act of 1940 (“Investment Advisers Act”). For example, Covered Officers may not individually engage in certain transactions (such as the purchase or sale of securities or other property) with a Fund because of their status as “affiliated persons” of the Fund. The Funds’ and the investment advisers’ compliance programs and procedures are designed to prevent, or identify and correct, violations of these provisions. This Code does not, and is not intended to, repeat or replace these programs and procedures, and such conflicts fall outside of the parameters of this Code.
Although typically not presenting an opportunity for improper personal benefit, conflicts arise from, or as a result of, the contractual relationship between a Fund and an investment adviser of which Covered Officers are also officers or employees. As a result, this Code recognizes Covered Officers will, in the normal course of their duties (whether formally for a Fund or for the adviser, or for both), be involved in establishing policies and
implementing decisions that will have different effects on the adviser and the Funds. The participation of Covered Officers in such activities is inherent in the contractual relationship between a Fund and an adviser and is consistent with the performance by Covered Officers of their duties as officers of the Funds. Thus, if performed in conformity with the provisions of the Investment Company Act and the Investment Advisers Act, such activities will be deemed to have been handled ethically. In addition, it is recognized by the Funds’ Boards of Directors/Trustees (“Boards”) that Covered Officers may also be officers or employees of one or more other investment companies covered by this or other codes and that such service, by itself does not give rise to a conflict of interest.
Other conflicts of interest are covered by the Code, even if such conflicts of interest are not subject to provisions in the Investment Company Act and the Investment Advisers Act. The following list provides examples of conflicts of interest under the Code, but Covered Officers should keep in mind these examples are not exhaustive. The overarching principle is that the personal interest of a Covered Officer should not be placed improperly before the interest of a Fund.
Each Covered Officer must:
| • | not use his or her personal influence or personal relationships improperly to influence investment decisions or financial reporting by a Fund; |
| • | not cause a Fund to take action, or fail to take action, for the individual personal benefit of the Covered Officer rather than the benefit the Fund; and, |
| • | not use material non-public knowledge of portfolio transactions made or contemplated for the Trust to trade personally or cause others to trade personally in contemplation of the market effect of such transactions. |
There are some actual or potential conflict of interest situations that, if material, should always be discussed with the Chief Compliance Officer (“CCO”) or designate that has been appointed by the Board of the Funds. Examples of these include:
| • | service as a director on the board of any public company (other than the Funds or their investment advisers or any affiliated person thereof); |
| • | the receipt of any non-nominal gifts (i.e., in excess of $100); |
| • | the receipt of any entertainment from any company with which a Fund has current or prospective business dealings unless such entertainment is business-related, reasonable in cost, appropriate as to time and place, and not so frequent as to raise any question of impropriety; |
| • | any ownership interest in, or any consulting or employment relationship with, any of the Funds’ service providers (other than their investment advisers, or principal underwriter, or any affiliated person thereof); |
| • | a direct or indirect financial interest in commissions, transaction charges or spreads paid by a Fund for effecting portfolio transactions or for selling or redeeming shares other than an interest arising from the Covered Officer’s employment, such as compensation or equity ownership. |
Disclosure and Compliance
Each Covered Officer should:
| • | familiarize him or herself with the disclosure requirements generally applicable to the Funds; |
| • | not knowingly misrepresent, or cause others to misrepresent, facts about a Fund to others, whether within or outside the Fund, including to the Fund’s Directors/Trustees and auditors, and to governmental regulators and self-regulatory organizations; and |
| • | to the extent appropriate within his or her area of responsibility, consult with other officers and employees of the Funds and the advisers with the goal of promoting full, fair, accurate, timely and understandable disclosure in the reports and documents the Funds file with, or submit to, the SEC and in other public communications made by the Funds. |
It is the responsibility of each Covered Officer to promote compliance with the standards and restrictions imposed by applicable laws, rules and regulations.
Reporting and Accountability
Each Covered Officer must:
| • | upon adoption of the Code (or thereafter as applicable, upon becoming a Covered Officer), affirm in writing to the Board that he or she has received, read, and understands the Code; |
| • | annually thereafter affirm to the Board that he or she has complied with the requirements of the Code; |
| • | not retaliate against any other Covered Officer or any employee of the Funds or their advisers or any affiliated persons thereof or service providers of the Funds for reports of potential violations that are made in good faith; |
| • | notify the CCO promptly if he or she knows of any violation of this Code, of which failure to do so is itself a violation; and |
| • | report at least annually, if necessary, any employment position, including officer or directorships, held by the Covered Officer or any immediate family member of a Covered Officer with affiliated persons of or Service Providers to the Funds. |
The CCO is responsible for applying this Code to specific situations in which questions are presented and has the authority to interpret this Code in any particular situation. However, approvals or waivers sought by a Covered Officer will be considered by the Compliance Committee or Audit Committee, (the “Committee”) responsible for oversight of the Fund’s code of ethics under Rule 17j-1 under the Investment Company Act. If a Covered Officer seeking an approval or waiver sits on the Committee, the Covered Person shall recuse him or herself from any such deliberations. Any approval or waiver granted by the Committee will be reported promptly to the Chair of the Audit Committees of the Funds.
The Funds will follow these procedures in investigating and enforcing this Code:
| • | the CCO will take all appropriate action to investigate any potential violations reported to him, which actions may include the use of internal or external counsel, accountants or other personnel; |
| • | if, after such investigation, the CCO believes that no violation has occurred, the CCO is not required to take any further action; |
| • | any matter that the CCO believes is a violation will be reported to the Committee; |
| • | if the Committee concurs that a violation has occurred, it will inform the Board, which will consider appropriate action, which may include review of, and appropriate modifications to, applicable policies and procedures; notification to appropriate personnel of the investment adviser or its board; or a recommendation to dismiss the Covered Officer; |
| • | the Committee will be responsible for granting waivers, as appropriate; and, |
| • | any changes to or waivers of this Code will, to the extent required, be disclosed as provided by SEC rules. |
Other Policies and Procedures
This Code shall be the sole code of ethics adopted by the Funds for purposes of Section 406 of the Sarbanes-Oxley Act and the rules and forms applicable to registered investment companies thereunder. Insofar as other policies or procedures of the Funds, the Funds’ advisers, principal underwriter, or other service providers govern or purport to govern the behavior or activities of Covered Officers subject to this Code, they are superseded by this Code to the extent they overlap or conflict with the provisions of this Code. The Funds’ and their investment advisers’ and principal underwriter’s codes of
ethics under Rule 17j-1 under the Investment Company Act are separate requirements applying to Covered Officers and others, and are not part of this Code.
Confidentiality
All reports and records prepared or maintained pursuant to this Code will be considered confidential and shall be maintained and protected accordingly. Except as otherwise required by law or this Code, such matters shall not be disclosed to anyone other than the appropriate Board and Fund counsel, and the board of Directors/Trustees and fund counsel of any other investment company for whom a Covered Officer serves in a similar capacity.
Annual Report
No less than annually, the CCO shall provide the Board with a written report describing any issues having arisen since the prior year’s report.
Internal Use
This Code is intended solely for the internal use by the Funds and does not constitute an admission by or on behalf of any Fund, as to any fact, circumstance or legal consideration.
CERTIFICATIONS PURSUANT TO SECTION 302
EX-99.CERT
CERTIFICATIONS
I, Jane Trust, certify that:
| 1. | I have reviewed this report on Form N-CSR of Legg Mason Partners Income Trust – Western Asset Intermediate-Term Municipals Fund; |
| 2. | Based on my knowledge, this report does not contain any untrue statement of a material fact or omit to state a material fact necessary to make the statements made, in light of the circumstances under which such statements were made, not misleading with respect to the period covered by this report; |
| 3. | Based on my knowledge, the financial statements, and other financial information included in this report, fairly present in all material respects the financial condition, results of operations, changes in net assets, and cash flows (if the financial statements are required to include a statement of cash flows) of the registrant as of, and for, the periods presented in this report; |
| 4. | The registrant’s other certifying officers and I are responsible for establishing and maintaining disclosure controls and procedures (as defined in Rule 30a-3(c) under the Investment Company Act of 1940) and internal control over financial reporting (as defined in Rule 30a-3(d) under the Investment Company Act of 1940) for the registrant and have: |
| a) | Designed such disclosure controls and procedures, or caused such disclosure controls and procedures to be designed under our supervision, to ensure that material information relating to the registrant, including its consolidated subsidiaries, is made known to us by others within those entities, particularly during the period in which this report is being prepared; |
| b) | Designed such internal control over financial reporting, or caused such internal control over financial reporting to be designed under our supervision, to provide reasonable assurance regarding the reliability of financial reporting and the preparation of financial statements for external purposes in accordance with generally accepted accounting principles; |
| c) | Evaluated the effectiveness of the registrant’s disclosure controls and procedures and presented in this report our conclusions about the effectiveness of the disclosure controls and procedures, as of a date within 90 days prior to the filing date of this report based on such evaluation; and |
| d) | Disclosed in this report any change in the registrant’s internal control over financial reporting that occurred during the second fiscal quarter of the period covered by this report that has materially affected, or is reasonably likely to materially affect, the registrant’s internal control over financial reporting; and |
| 5. | The registrant’s other certifying officers and I have disclosed to the registrant’s auditors and the audit committee of the registrant’s board of directors (or persons performing the equivalent functions): |
| a) | All significant deficiencies and material weaknesses in the design or operation of internal control over financial reporting which are reasonably likely to adversely affect the registrant’s ability to record, process, summarize, and report financial information; and |
| b) | Any fraud, whether or not material, that involves management or other employees who have a significant role in the registrant’s internal control over financial reporting. |
| Date: | May 25, 2022 | /s/ Jane Trust | ||||
| Jane Trust | ||||||
| Chief Executive Officer |
CERTIFICATIONS
I, Christopher Berarducci, certify that:
| 1. | I have reviewed this report on Form N-CSR of Legg Mason Partners Income Trust – Western Asset Intermediate-Term Municipals Fund; |
| 2. | Based on my knowledge, this report does not contain any untrue statement of a material fact or omit to state a material fact necessary to make the statements made, in light of the circumstances under which such statements were made, not misleading with respect to the period covered by this report; |
| 3. | Based on my knowledge, the financial information included in this report, and the financial statements on which the financial information is based, fairly present in all material respects the financial condition, results of operations, changes in net assets, and cash flows (if the financial statements are required to include a statement of cash flows) of the registrant as of, and for, the periods presented in this report; |
| 4. | The registrant’s other certifying officers and I are responsible for establishing and maintaining disclosure controls and procedures (as defined in Rule 30a-3(c) under the Investment Company Act of 1940) and internal control over financial reporting (as defined in Rule 30a-3(d) under the Investment Company Act of 1940) for the registrant and have: |
| a) | Designed such disclosure controls and procedures, or caused such disclosure controls and procedures to be designed under our supervision, to ensure that material information relating to the registrant, including its consolidated subsidiaries, is made known to us by others within those entities, particularly during the period in which this report is being prepared; |
| b) | Designed such internal control over financial reporting, or caused such internal control over financial reporting to be designed under our supervision, to provide reasonable assurance regarding the reliability of financial reporting and the preparation of financial statements for external purposes in accordance with generally accepted accounting principles; |
| c) | Evaluated the effectiveness of the registrant’s disclosure controls and procedures and presented in this report our conclusions about the effectiveness of the disclosure controls and procedures, as of a date within 90 days prior to the filing date of this report based on such evaluation; and |
| d) | Disclosed in this report any change in the registrant’s internal control over financial reporting that occurred during the second fiscal quarter of the period covered by this report that has materially affected, or is reasonably likely to materially affect, the registrant’s internal control over financial reporting; and |
| 5. | The registrant’s other certifying officers and I have disclosed to the registrant’s auditors and the audit committee of the registrant’s board of directors (or persons performing the equivalent functions): |
| a) | All significant deficiencies and material weaknesses in the design or operation of internal control over financial reporting which are reasonably likely to adversely affect the registrant’s ability to record, process, summarize, and report financial information; and |
| b) | Any fraud, whether or not material, that involves management or other employees who have a significant role in the registrant’s internal control over financial reporting. |
| Date: | May 25, 2022 | /s/ Christopher Berarducci | ||||
| Christopher Berarducci | ||||||
| Principal Financial Officer |
CERTIFICATIONS PURSUANT TO SECTION 906
EX-99.906CERT
CERTIFICATION
Jane Trust, Chief Executive Officer, and Christopher Berarducci, Principal Financial Officer of Legg Mason Partners Income Trust – Western Asset Intermediate-Term Municipals Fund (the “Registrant”), each certify to the best of their knowledge that:
1. The Registrant’s periodic report on Form N-CSR for the period ended March 31, 2022 (the “Form N-CSR”) fully complies with the requirements of section 15(d) of the Securities Exchange Act of 1934, as amended; and
2. The information contained in the Form N-CSR fairly presents, in all material respects, the financial condition and results of operations of the Registrant.
| Chief Executive Officer | Principal Financial Officer | |||
| Legg Mason Partners Income Trust - | Legg Mason Partners Income Trust – | |||
| Western Asset Intermediate-Term Municipal Fund | Western Asset Intermediate-Term Municipal Fund | |||
| /s/ Jane Trust |
/s/ Christopher Berarducci | |||
| Jane Trust | Christopher Berarducci | |||
| Date: May 25, 2022 | Date: May 25, 2022 | |||
This certification is being furnished to the Securities and Exchange Commission solely pursuant to 18 U.S.C. § 1350 and is not being filed as part of the Form N-CSR with the Commission.
Serious News for Serious Traders! Try StreetInsider.com Premium Free!
You May Also Be Interested In
- ROSEN, A LEADING LAW FIRM, Encourages VinFast Auto Ltd. f/k/a Black Spade Acquisition Co. Investors to Secure Counsel Before Important Deadline in Securities Class Action – VFS
- Banco Itaú Chile Files Material Event Notice announcing Extraordinary General Shareholders’ Meeting Agreements
- Victory Sells Tahlo Lake Property in British Columbia
Create E-mail Alert Related Categories
SEC FilingsSign up for StreetInsider Free!
Receive full access to all new and archived articles, unlimited portfolio tracking, e-mail alerts, custom newswires and RSS feeds - and more!
