

Form N-CSR FundX Investment Trust For: Sep 30
 Tweet
Tweet Share
Share
SECURITIES AND EXCHANGE COMMISSION
Washington, D.C. 20549
(Exact name of registrant as specified in charter)
(Name and address of agent for service)
|
(a)
|
Annual Report
|
| Table of Contents |
| Annual Report 2021 | Fundxfunds.com | 1 |

| 1969 | FundX Investment Group (then called DAL) is a registered investment advisor (RIA). | ||
| 1976 | The firm starts publishing NoLoad FundX newsletter. | ||
| 2001 | The firm packages its most popular growth model as a mutual fund, introducing the FundX Upgrader Fund (FUNDX). | ||
| 2002 | Inception of three additional funds: FundX Aggressive Upgrader Fund (HOTFX), FundX Conservative Upgrader Fund (RELAX), and FundX Flexible Income Fund (INCMX). | ||
| 2017 | Inception of the FundX Sustainable Impact Fund (SRIFX), a fund that aims to help investors build wealth and a better world. |
|
Knowledgeable Portfolio Management We’ve been managing portfolios of noload mutual funds since 1969. We monitor thousands of mutual funds and ETFs and make timely portfolio changes.
A Strategy You Can Understand We developed the Upgrading strategy, which is designed to keep our portfolios invested in top-ranked funds. Upgrading ranks noload mutual funds and ETFs based on recent performance. We buy top performers and hold these funds only while they remain top ranked.
FundX Upgrader Funds The FundX Upgrader Funds are a series of mutual funds that invest in underlying mutual funds and exchange traded funds (ETFs) based on our Upgrading strategy. The Funds offer various levels of potential risk and reward.
A Portfolio that Responds to Market Changes Market trends rotate between large-cap and small-cap stocks, growth and value styles of investing, and geographic regions. Our Upgrading strategy aligns the FundX Upgrader Fund portfolios with these trends. The FundX Upgrader Funds have the flexibility to invest both domestically and globally in the sectors, regions and strategies that have strong recent returns. |
| 2 |  |
Annual Report 2021 |
Dear Fellow Shareholders,
US and global stocks markets brought in above-average returns for the trailing year and all of the FundX Funds posted gains.
Stocks remained resilient for most of the last 12 months, rising fairly steadily through the vaccine rollout, changing stock market trends, rising inflation, supply chain delays, and the emergence of the Covid-19 Delta variant. Stocks ended the Annual Report period on a volatile note as a widespread stock market decline in September 2021 resulted in third quarter losses for most market indexes and sectors.
The S&P 500 gained 30.00% for the Annual Report period, and global stocks, as measured by the Morningstar Global Market Large-Mid-Cap Index, were up 27.52%.
Stock market rotations & reversals
Market trends typically rotate between large- and small-cap stocks, growth and value styles, and foreign and US markets. These trends usually last years, but there can be shorter cycles and the Annual Report period saw significant rotations between large-caps and small-caps and growth and value stocks.
Markets had begun to shift away from US large-cap growth and technology stocks in late 2020 and toward smaller-cap and value stocks that tend to do well during economic recoveries. This trend continued through most of the first quarter of 2021, but then it reversed in mid-March as large-cap growth and tech bounced back and then stayed in favor through most of August. Smaller-caps and value stocks did better in September when markets pulled back.
Revolving trends like this are challenging for our investment approach, which is designed to capitalize on sustained cycles that typically last years, not months. The equity FundX Upgrader Funds, including the Upgrader Fund (FUNDX), Aggressive Upgrader Fund (HOTFX), and Sustainable Impact Fund (SRIFX), all brought in double-digit gains, but lagged the benchmarks for the trailing 12 months.
Navigating a low-yield environment
Our Flexible Income strategy was a bright spot over the trailing 12 months. The FundX Flexible Income Fund (INCMX) had one of its strongest periods of outperformance, up 8.63%, while the Bloomberg US Aggregate Bond Index lost -0.90% for the year ending September 30, 2021.
Bonds struggled as interest rates remained at historically low levels, inflation picked up, and the Federal Reserve announced it expected to reduce its monthly bond purchases starting in late 2021. But as usual, some areas of the bond market did better than others (namely high-yield and strategic bond funds) and that’s where we’re invested.
FundX joins One Capital Management
FundX is joining One Capital Management (OCM), a Southern California-based wealth management firm that shares our values and our commitment to putting investors first. On September 1st, the FundX Funds board and shareholders approved a new investment advisory agreement with OCM. There is no change in the day-to-day management of the Funds’ investment portfolios. My team and I continue to manage the funds using the same active investment approach we’ve used for decades.
Thank you for your investment in the FundX Funds. It is a privilege to help investors like you navigate today’s ever-changing markets and work toward your lifelong investment goals.

Janet Brown
Portfolio Manager
| Annual Report 2021 | Fundxfunds.com | 3 |
Past performance does not guarantee future results.
The information provided in this letter represents the opinion of the author and is not intended to be a forecast of future events, a guarantee of future results, nor investment advice.
Mutual fund investing involves risk. Principal loss is possible. The FundX Upgrader Funds (“Funds”) are considered “funds of funds” and an investor will indirectly bear the principal risks and its share of the fees and expenses of the underlying funds. Shareholders will pay higher expenses than they would if they invested directly in the underlying funds. The Funds employ an “Upgrading” strategy whereby investment decisions are based on near-term performance, however, the Funds may be exposed to the risk of buying underlying funds immediately following a sudden, brief surge in performance that may be followed by a subsequent drop in market value. The Funds invest in underlying funds and these underlying funds may invest in securities of small companies, which involve greater volatility than investing in larger, more established companies, or they may invest in foreign securities, which involve greater volatility and political, economic and currency risks and differences in accounting methods; these risks are greater for investments in emerging markets. The underlying funds may invest in debt securities, which typically decrease in value when interest rates rise; this risk is usually greater for longer-term debt securities. Lower-rated and non-rated securities present a greater risk of loss to principal and interest than higher rated securities. While the Upgrader Funds are diversified, the underlying funds may invest in a limited number of issuers and therefore may be considered non-diversified.The underlying funds may engage in short sales; an underlying fund’s investment performance may suffer if it is required to close out a short position earlier than intended. Some underlying funds may borrow money for leveraging and will incur interest expense. Some underlying funds may use derivatives,which involve risks different from, and in certain cases, greater than the risks presented by more traditional investments. ETFs are subject to additional risks that do not apply to conventional mutual funds, including the risks that the market price of an ETF’s shares may trade at a discount to its net asset value, an active secondary trading market may not develop or be maintained, or trading may be halted by the exchange in which they trade, which may impact a Fund’s ability to sell its shares. The underlying funds may invest in asset-backed and mortgage-backed securities, which involve additional risks such as credit risk, prepayment risk, possible illiquidity and default, and increased susceptibility to adverse economic developments. The underlying funds, particularly some ETFs, may use investment techniques considered to be aggressive, including using futures contracts, options on futures contracts, securities and indices, forward contracts, swap agreements and similar instruments.
Sector weighting and fund holdings are subject to change at any time and mention of them should not be construed as recommendations to buy or sell any security. Please refer to the Schedule of Investments in this report for further sector and holdings information.
Duration is an approximate measure of a bond’s price sensitivity to changes in interest rates.
References to other funds should not be interpreted as an offer of these securities.
Defensive funds typically invest in areas of the market that may hold up better in market declines, such as gold, real estate, utilities, and consumer staples. These funds also may invest in dividend-paying stocks, higher-quality stocks, or low-volatility stocks.
The S&P 500 Index is a broad based unmanaged Index of 500 U.S. stocks, which is widely recognized as representative of the U.S. equity market. The Morningstar Global Market Large-Mid Cap Index measures the performance of developed and emerging countries across the world, targeting the top 90% of stocks by market capitalization. The Bloomberg Barclays Aggregate Bond Index is a market-capitalization-weighted index of investment-grade fixed-rate debt issues, including government, corporate, asset-backed, and mortgage-backed securities, with maturities of at least one year. You cannot invest directly in an index.
While the funds are noload, management fees and expenses still apply. Diversification does not assure a profit or protect against a loss in a declining market. Please refer to prospectus for further details.
Any new investment in a FundX Upgrader Fund must be preceded or accompanied by a prospectus.
The FundX Upgrader Funds are distributed by Quasar Distributors, LLC.
| 4 | |
Annual Report 2021 |

The Upgrader Fund (FUNDX) is designed to be a core equity holding. Investors in FUNDX own a portfolio of diversified stock funds that are actively managed to navigate changing markets and capitalize on global market trends.


| Annual Report 2021 | Fundxfunds.com | 5 |

FUNDX was underweight value and small-cap during the last quarter of 2020 when these areas were rising, and inversely, FUNDX had a heavy allocation to value, small- and mid-caps as the trends reversed in the first half of 2021. This was a drag on performance.
What contributed positively to the fund’s performance?
The large-cap growth focused funds like Invesco Summit (ASMYX), Brown Advisory Sustainable Growth (BAFWX), Fidelity Blue Chip Growth (FBGRX) and Fidelity Advisor Growth (FAGCX) had a positive impact on FUNDX. The large-cap value funds that opportunistically captured the value trend like Ariel fund (ARAIX) and Fidelity Convertible Securities (FCCVX) also contributed to the fund’s performance.
Market trends build and develop over time, and there are often short-term reversals along the way. The Upgrading strategy aims to make portfolio changes gradually in an effort to capitalize on enduring trends. As a result, the equity approach may lag during transitions, but it typically pulls ahead over time. We believe our systematic approach is an advantage over longer periods.
| 6 | |
Annual Report 2021 |
| FUNDX |  |
Upgrader Fund Growth Fund |
| FundX Upgrader Fund: Performance Summary |
Annualized Returns as of September 30, 2021
| As of 9/30/21 | 1 Year | 3 Year | 5 Year | 10 Year |
| FundX Upgrader Fund | 19.61% | 12.51% | 14.01% | 13.13% |
| Morningstar Global Market Large-Mid Cap Index | 27.52% | 12.50% | 13.16% | 11.97% |
| S&P 500 Index | 30.00% | 15.99% | 16.90% | 16.63% |
FundX Upgrader Fund Growth of $10,000 vs Morningstar Global Market Large-Mid Cap Index and S&P 500 Index

While the chart compares a mutual fund to an index, there are important differences between mutual funds and indexes. Market indexes are unmanaged and do not have expenses. The fund, on the other hand, is actively managed and seeks to meet a specific objective other than tracking the index, such as limiting risk or rotating among various sectors or investment styles. The fund also provides a wide range of services to shareholders, and it has transaction and other operational costs.
This chart illustrates the performance of a hypothetical $10,000 investment, including reinvested dividends and distributions, and is not intended to imply any future performance. The returns shown do not reflect the deduction of taxes that a shareholder would pay on fund distributions or the redemption of fund shares. The returns reflect fee waivers in effect. In the absence of such waivers, total return would be reduced.
The performance data quoted above represents past performance; past performance does not guarantee future results. The investment return and principal value of an investment will fluctuate so that an investor’s shares, when redeemed, may be worth more or less than their original cost. Current performance of the funds may be lower or higher than the performance quoted. Performance data current to the most recent month end may be obtained by visiting www.fundxfunds.com.
The Morningstar Global Market Large-Mid Cap Index measures the performance of developed and emerging countries across the world, targeting the top 90% of stocks by market capitalization. The S&P 500 Index is a broad based unmanaged index of 500 U.S. stocks, which is widely recognized as representative of the U.S. equity market. The figures above reflect all dividends reinvested but do not reflect any deductions for fees, expenses, or taxes. One cannot invest directly in an index.
| Annual Report 2021 | Fundxfunds.com | 7 |
| FUNDX | |
Upgrader Fund Growth Fund |
0.3% Short-Term Investments,
Net of Other Liabilities

| # | Annualized seven-day yield as of September 30, 2021. | |
| The accompanying notes are an integral part of these financial statements. |
| 8 | |
Annual Report 2021 |
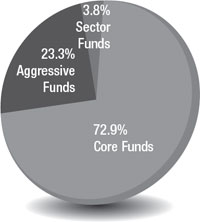
The Aggressive Upgrader Fund (HOTFX) focuses on concentrated stock funds, including sector and country-specific funds and ETFs, which typically have above-average risk and higher potential volatility. HOTFX is actively managed in an attempt to capitalize on sector rotations and global market trends.
| Annual Report 2021 | Fundxfunds.com | 9 |

What contributed positively to the fund’s performance?
Technology positions contributed to HOTFX’s gains. VanEck Semiconductor (SMH), one of the few tech positions we held throughout the Annual Report period, was the best performing position, strongly outperforming the Morningstar Global Market Large-Mid-Cap Index and the S&P 500 for the year. Fidelity Select Semiconductor (FSELX), another longtime position that we bought in 2019 and sold in April 2021, also added value.
| 10 | |
Annual Report 2021 |
| HOTFX | |
Aggressive Upgrader Fund Aggressive Growth Fund |
| FundX Aggressive Upgrader Fund: Performance Summary |
Annualized Returns as of September 30, 2021
| As of 9/30/21 | 1 Year | 3 Year | 5 Year | 10 Year |
| FundX Aggressive Upgrader Fund | 11.22% | 9.17% | 10.84% | 11.27% |
| Morningstar Global Market Large-Mid Cap Index | 27.52% | 12.50% | 13.16% | 11.97% |
| S&P 500 Index | 30.00% | 15.99% | 16.90% | 16.63% |
FundX Aggressive Upgrader Fund Growth of $10,000 vs Morningstar Global Market Large-Mid Cap Index and S&P 500 Index

While the chart compares a mutual fund to an index, there are important differences between mutual funds and indexes. Market indexes are unmanaged and do not have expenses. The fund, on the other hand, is actively managed and seeks to meet a specific objective other than tracking the index, such as limiting risk or rotating among various sectors or investment styles. The fund also provides a wide range of services to shareholders, and it has transaction and other operational costs.
This chart illustrates the performance of a hypothetical $10,000 investment, including reinvested dividends and distributions, and is not intended to imply any future performance. The returns shown do not reflect the deduction of taxes that a shareholder would pay on fund distributions or the redemption of fund shares. The returns reflect fee waivers in effect. In the absence of such waivers, total return would be reduced.
The performance data quoted above represents past performance; past performance does not guarantee future results. The investment return and principal value of an investment will fluctuate so that an investor’s shares, when redeemed, may be worth more or less than their original cost. Current performance of the funds may be lower or higher than the performance quoted. Performance data current to the most recent month end may be obtained by visiting www.fundxfunds.com.
The Morningstar Global Market Large-Mid Cap Index measures the performance of developed and emerging countries across the world, targeting the top 90% of stocks by market capitalization. The S&P 500 Index is a broad based unmanaged index of 500 U.S. stocks, which is widely recognized as ?representative of the U.S. equity market. The figures above reflect all dividends reinvested but do not reflect any deductions for fees, expenses, or taxes. One cannot invest directly in an index.
| Annual Report 2021 | Fundxfunds.com | 11 |
| HOTFX | |
Aggressive Upgrader Fund Aggressive Growth Fund |
0.4% Short-Term Investments,
Net of Other Liabilities

| SCHEDULE OF INVESTMENTS AT SEPTEMBER 30, 2021 |
| Shares | Investment Companies: 99.6% | Value | ||||||
| Aggressive Funds: | ||||||||
| 20,170 | American Century Ultra Fund - Class I | $ | 1,829,405 | |||||
| 30,008 | Fidelity Advisor Series I - Fidelity Advisor Value Strategies | 1,523,181 | ||||||
| 5,300 | Invesco QQQ Trust Series 1 | 1,897,188 | ||||||
| 14,600 | iShares Russell 2000 Value ETF | 2,339,358 | ||||||
| 22,900 | iShares S&P Small-Cap 600 Value ETF | 2,305,343 | ||||||
| 74,020 | JPMorgan Small Cap Value Fund - Class I | 2,488,563 | ||||||
| 21,129 | Kinetics Paradigm Fund - Institutional Class | 1,520,227 | ||||||
| 69,478 | Oakmark International Small Cap Fund - Advisor Class | 1,386,775 | ||||||
| 41,542 | Oakmark Select Fund - Advisor Class | 2,584,746 | ||||||
| 43,910 | TCW Select Equities Fund - Class I | 1,841,160 | ||||||
| Total Aggressive Funds 54.0% | 19,715,946 | |||||||
| Sector Funds: | ||||||||
| 87,681 | Fidelity Consumer Finance Portfolio | 2,064,884 | ||||||
| 40,900 | Invesco Water Resources ETF | 2,238,048 | ||||||
| 155,340 | PIMCO RealEstateRealReturn Strategy Fund - Institutional Class | 1,368,544 | ||||||
| 27,500 | SPDR S&P Homebuilders ETF | 1,973,400 | ||||||
| 45,000 | SPDR S&P Regional Banking ETF | 3,048,750 | ||||||
| 25,400 | SPDR S&P Retail ETF | 2,294,128 | ||||||
| 14,300 | VanEck Vectors Semiconductor ETF | 3,664,661 | ||||||
| Total Sector Funds 45.6% | 16,652,415 | |||||||
| Total Investment Companies | ||||||||
| (Cost $35,682,688) | 36,368,361 | |||||||
| 12 | |
Annual Report 2021 |
| HOTFX | |
Aggressive Upgrader Fund Aggressive Growth Fund |
| SCHEDULE OF INVESTMENTS AT SEPTEMBER 30, 2021 |
| Shares | Value | ||||||||
| Short-Term Investments: 0.4% | |||||||||
| 169,392 | Fidelity Investments Money Market Government Portfolio - Institutional Class, 0.01% # | $ | 169,392 | ||||||
| Total Short-Term Investments | |||||||||
| (Cost $169,392) | 169,392 | ||||||||
| Total Investments: 100.0% | |||||||||
| (Cost $35,852,080) | 36,537,753 | ||||||||
| Liabilities in Excess of Other Assets: 0.0% | (14,987 | ) | |||||||
| Net Assets: 100.0% | $ | 36,522,766 | |||||||
| # | Annualized seven-day yield as of September 30, 2021. | ||||||||
| The accompanying notes are an integral part of these financial statements. | |||||||||
| Annual Report 2021 | Fundxfunds.com | 13 |
The Conservative Upgrader Fund (RELAX) is an active balanced fund that can invest in core stock funds, balanced funds, and bond funds. It typically owns core stock funds for growth, and includes bonds and total-return funds, such as balanced and low volatility equity funds, as a way to buffer stock market volatility.
RELAX is designed for investors who seek the growth potential of a stock fund combined with the lower volatility of a fixed income fund.
|
Janet Brown
Marty DeVault
Sean McKeon |
How did the markets change during the Annual Report period? US and global stock market indexes were fairly stable during the trailing 12 months, however, there were significant rotations between large- and small-cap stocks and growth and value sectors.
Markets shifted decisively away from large-cap growth and technology stocks in September 2020 through mid-March and toward smaller-cap and value stocks. Large-cap growth and tech then regained market favor from mid-March through most of August, and smaller-cap and value stocks held up better in the September 2021 pullback.
Bonds sank as interest rates remained at record lows (aside from a brief increase in the first quarter) and inflation increased. Lower-quality bonds, such as high yields, remained in favor during the year, while higher-quality bonds, like Treasuries, were barely positive.
How did the Fund try to respond to these changes? RELAX kept a consistent allocation to stock, bond, and balanced funds during the year, but we made some significant changes to the funds in each category, particularly on the equity portion. We diversified RELAX’s 30% stake in equities, reducing its large-cap growth positions in favor of mid-cap and value funds, such as Ariel (ARGFX), Fidelity Value (FDVLX), and Parnassus Endeavor (PFPWX).
We also added two value-oriented balanced funds: Oakmark Equity And Income (OAYBX) and Dodge and Cox Balanced (DODBX).
In fixed income, we sold higher-quality intermediate-term bond funds in the first half of the Annual Report period and steadily increased our exposure to lower quality funds, like Thompson Bond (THOPX) and Ivy High Income (IVHIX).
How did the fund perform? For the year ending September 30, 2021, RELAX gained 15.83% compared to 27.52% for the Morningstar Global Market Large-Mid-Cap Index, and -0.90% for the Bloomberg US Aggregate Bond Index. |
| 14 | |
Annual Report 2021 |

What detracted from the fund’s performance?
Many of RELAX’s equity positions, which contributed to the fund’s gains in 2020, lagged in 2021. Growth funds detracted from RELAX’s returns in the first quarter of 2021, while the fund’s mid-cap and value positions lagged in the second and third quarters as large caps rallied.
SPDR Bloomberg Barclays Convertible Securities ETF (CWB), which we owned briefly in the first quarter, and FirstTrust Rising Dividend Achievers (RDVY), which we added in June 2021, were the fund’s weakest positions.
What contributed positively to the fund’s performance?
RELAX’s allocations to balanced and fixed income funds were the biggest contributors to the fund’s gains. The majority of RELAX’s balanced fund positions outpaced a 60/40 balanced index, and high-yield and strategic bond fund positions, such as Fidelity Capital and Income (FAGIX) and Osterweis Strategic Income (OSTIX), had double-digit gains for the year, while the bond market was down.
Fidelity Real Estate Income (FRIFX) and Permanent Portfolio (PRPFX) were some of the best performing positions, outpacing the bond market as well as a balanced 60/40 index for the year. These funds are part of a select group of low-volatility equity funds that are incorporated into RELAX’s fixed income allocation.
| Annual Report 2021 | Fundxfunds.com | 15 |
| RELAX | |
Conservative Upgrader Fund Balanced Fund |
| FundX Conservative Upgrader Fund: Performance Summary |
Annualized Returns as of September 30, 2021
| As of 9/30/21 | 1 Year | 3 Year | 5 Year | 10 Year |
| FundX Conservative Upgrader Fund | 15.83% | 8.07% | 9.32% | 9.06% |
| Morningstar Global Market Large-Mid Cap Index | 27.52% | 12.50% | 13.16% | 11.97% |
| S&P 500 Index | 30.00% | 15.99% | 16.90% | 16.63% |
| Balanced Index (60% S&P 500 / 40% Bloomberg U.S. Aggregate Bond) | 16.92% | 12.10% | 11.43% | 11.24% |
| Bloomberg U.S. Aggregate Bond Index | -0.90% | 5.36% | 2.94% | 3.01% |
FundX Conservative Upgrader Fund Growth of $10,000 vs Morningstar Global Market Large-Mid Cap Index, S&P 500 Index, Balanced Index and Barclays Aggregate Bond Index

While the chart compares a mutual fund to an index, there are important differences between mutual funds and indexes. Market indexes are unmanaged and do not have expenses. The fund, on the other hand, is actively managed and seeks to meet a specific objective other than tracking the index, such as limiting risk or rotating among various sectors or investment styles. The fund also provides a wide range of services to shareholders, and it has transaction and other operational costs.
This chart illustrates the performance of a hypothetical $10,000 investment, including reinvested dividends and distributions, and is not intended to imply any future performance. The returns shown do not reflect the deduction of taxes that a shareholder would pay on fund distributions or the redemption of fund shares. The returns reflect fee waivers in effect. In the absence of such waivers, total return would be reduced.
The performance data quoted above represents past performance; past performance does not guarantee future results. The investment return and principal value of an investment will fluctuate so that an investor’s shares, when redeemed, may be worth more or less than their original cost. Current performance of the funds may be lower or higher than the performance quoted. Performance data current to the most recent month end may be obtained by visiting www.fundxfunds.com.
The Morningstar Global Market Large-Mid Cap Index measures the performance of developed and emerging countries across the world, targeting the top 90% of stocks by market capitalization. The S&P 500 Index is a broad based unmanaged index of 500 U.S. stocks, which is widely recognized as ?representative of the U.S. equity market. The Bloomberg U.S. Aggregate Bond Index is a market-capitalization-weighted index of investment-grade fixed-rate debt issues, including government, corporate, asset-backed, and mortgage-backed securities, with maturities of at least one year. The figures above reflect all dividends reinvested but do not reflect any deductions for fees, expenses, or taxes. One cannot invest directly in an index.
| 16 | |
Annual Report 2021 |
| RELAX | |
Conservative Upgrader Fund Balanced Fund |
0.3% Short-Term Investments,
Net of Other Liabilities

| SCHEDULE OF INVESTMENTS AT SEPTEMBER 30, 2021 |
| Shares | Investment Companies: 99.7% | Value | ||||||
| Bond Funds: | ||||||||
| 32,349 | Columbia Strategic Income Fund - Class I2 | $ | 795,471 | |||||
| 124,827 | Delaware Ivy High Income Fund - Class I | 890,014 | ||||||
| 79,929 | Fidelity Advisor High Income Advantage Fund - Class I | 962,345 | ||||||
| 164,991 | Fidelity Capital & Income Fund | 1,869,352 | ||||||
| 68,841 | Loomis Sayles Bond Fund - Institutional Class | 941,739 | ||||||
| 153,011 | Metropolitan West High Yield Bond Fund - Class I | 1,641,806 | ||||||
| 157,544 | Osterweis Strategic Income Fund | 1,816,478 | ||||||
| 15,000 | SPDR Bloomberg Barclays High Yield Bond ETF | 1,640,400 | ||||||
| 146,121 | Thompson Bond Fund | 1,614,634 | ||||||
| Total Bond Funds 13.6% | 12,172,239 | |||||||
| Core Funds: | ||||||||
| 33,670 | Ariel Fund - Institutional Class | 2,873,401 | ||||||
| 10,433 | Fidelity Advisor Growth Opportunities Fund - Class I | 1,805,810 | ||||||
| 11,644 | Fidelity Blue Chip Growth Fund | 2,027,312 | ||||||
| 179,702 | Fidelity Value Fund | 2,688,337 | ||||||
| 22,000 | First Trust Rising Dividend Achievers ETF | 1,044,340 | ||||||
| 18,500 | Invesco BuyBack Achievers ETF | 1,667,960 | ||||||
| 36,600 | Invesco S&P 500 Pure Value ETF | 2,774,646 | ||||||
| 27,000 | iShares S&P Mid-Cap 400 Value ETF | 2,782,080 | ||||||
| 25,202 | Oakmark Fund - Advisor Class | 2,912,853 | ||||||
| 47,874 | Parnassus Endeavor Fund - Institutional Class | 2,793,470 | ||||||
| 53,204 | Transamerica Capital Growth - Class I | 3,203,385 | ||||||
| Total Core Funds 29.7% | 26,573,594 | |||||||
| Annual Report 2021 | Fundxfunds.com | 17 |
| RELAX | |
Conservative Upgrader Fund Balanced Fund |
| SCHEDULE OF INVESTMENTS AT SEPTEMBER 30, 2021 |
| Shares | Investment Companies: 99.7% | Value | |||||||
| Total Return Funds: | |||||||||
| 50,560 | Columbia Balanced Fund - Class I2 | $ | 2,667,022 | ||||||
| 43,324 | Dodge & Cox Balanced Fund | 4,967,097 | |||||||
| 199,937 | Fidelity Advisory Balanced Fund - Class I | 5,876,138 | |||||||
| 207,693 | Fidelity Asset Manager 70% Fund | 5,904,708 | |||||||
| 184,438 | Fidelity Puritan Fund | 5,308,135 | |||||||
| 524,580 | Fidelity Real Estate Income Fund | 7,045,117 | |||||||
| 146,183 | FPA Crescent Fund - Investor Class | 5,787,385 | |||||||
| 126,389 | Oakmark Equity and Income Fund - Advisor Class | 4,547,482 | |||||||
| 39,345 | Permanent Portfolio - Class I | 1,929,090 | |||||||
| 125,702 | T. Rowe Price Capital Appreciation Fund - Class I | 4,803,067 | |||||||
| 24,332 | Vanguard Wellesley Income Fund - Admiral Class | 1,727,316 | |||||||
| Total Total Return Funds 56.4% | 50,562,557 | ||||||||
| Total Investment Companies | |||||||||
| (Cost $82,997,130) | 89,308,390 | ||||||||
| Short-Term Investments: 0.5% | |||||||||
| 469,103 | Fidelity Investments Money Market Government Portfolio - Institutional Class, 0.01% # | 469,103 | |||||||
| Total Short-Term Investments | |||||||||
| (Cost $469,103) | 469,103 | ||||||||
| Total Investments: 100.2% | |||||||||
| (Cost $83,466,233) | 89,777,493 | ||||||||
| Liabilities in Excess of Other Assets: (0.2)% | (150,459 | ) | |||||||
| Net Assets: 100.0% | $ | 89,627,034 | |||||||
| # | Annualized seven-day yield as of September 30, 2021. | ||||||||
| The accompanying notes are an integral part of these financial statements. | |||||||||
| 18 | |
Annual Report 2021 |

The Flexible Income Fund (INCMX) is primarily a bond portfolio, utilizing funds and ETFs rather than individual issues, and it may also invest a portion of its portfolio in total-return or alternative funds. Some investors use the fund as a standalone portfolio designed to deliver relatively low volatility returns over time. It is often used by investors as a lower-risk component of a balanced portfolio that would also include equity funds.
|
Janet Brown
Marty DeVault
Sean McKeon
|
How did the market change during the Annual Report period? Interest rates took a mostly upwards journey during this 12-month period, as the Covid-19 recovery brought inflation pressure. The benchmark 10-year Treasury rose from 0.69% at the start of the period to a peak of 1.74% six months later – a gain of over 150%. Yields retreated for several months in mid-2021, but never reached those low starting levels again before resuming their upward march in August. Bond prices move inversely to yields, so most bond funds lost value through September 30. Higher-quality bond funds, such as US Treasury funds, are more sensitive to interest rate moves, so they suffered more acutely than other areas of the debt market. Lower-quality debt, such as high-yield bonds and bank loans, remained in favor during the year.
How did the Fund try to respond to these changes? We sold higher-quality intermediate-term bond funds in the first half of the Annual Report period and steadily increased our exposure to lower quality funds like Thompson Bond (THOPX) and Ivy High Income (IVHIX). Our allocation to strategic funds rose from 14.9% to 32.7%, while high-yield bond funds increased from 22.7% to 37.0% of the portfolio.
How did the fund perform? For the year ending September 30, 2021, INCMX gained 8.63% compared to -0.90% for the Bloomberg US Aggregate Bond Index.
What detracted from the fund’s performance? Ironically, two of our losing holdings were short-lived positions in broad market index funds, Vanguard Total Bond Market ETF (BND) and iShares Core Aggregate Bond ETF (AGG). Both had negative returns for the time we held them.
What contributed positively to the fund’s performance? The weighting to high-yield funds worked favorably for a couple of reasons. The extra yield offered by bonds of lower credit quality buffered the downward pressure from a rising interest rate environment. Also, as investors sought alternatives to low-yielding government bonds and money-market instruments, they turned to high-yield bonds, thereby increasing prices.
Another star player was Fidelity Real Estate Income (FRIFX), which was a small (under 5%) position when we purchased it in September 2020. It gained more than 20% from the start of the reporting period through early June, when we added more to the position. As of September 30, 2021, FRIFX makes up 9.6% of the fund. |
| Annual Report 2021 | Fundxfunds.com | 19 |
| INCMX | |
Flexible Income Fund Fixed Income |
| FundX Flexible Income Fund: Performance Summary |
Annualized Returns as of September 30, 2021
| As of 9/30/21 | 1 Year | 3 Year | 5 Year | 10 Year |
| FundX Flexible Income Fund | 8.63% | 3.21% | 3.13% | 3.60% |
| Bloomberg U.S. Aggregate Bond Index | -0.90% | 5.36% | 2.94% | 3.01% |
| BofA Merrill Lynch 3-Month U.S. Treasury Bill Index |
0.07% | 1.18% | 1.16% | 0.63% |
FundX Flexible Income Fund Growth of $10,000 vs Barclays Aggregate Bond Index and BofA Merrill Lynch 3-Month U.S. Treasury Bill Index

While the chart compares a mutual fund to an index, there are important differences between mutual funds and indexes. Market indexes are unmanaged and do not have expenses. The fund, on the other hand, is actively managed and seeks to meet a specific objective other than tracking the index, such as limiting risk or rotating among various sectors or investment styles. The fund also provides a wide range of services to shareholders, and it has transaction and other operational costs.
This chart illustrates the performance of a hypothetical $10,000 investment, including reinvested dividends and distributions, and is not intended to imply any future performance. The returns shown do not reflect the deduction of taxes that a shareholder would pay on fund distributions or the redemption of fund shares. The returns reflect fee waivers in effect. In the absence of such waivers, total return would be reduced.
The performance data quoted above represents past performance; past performance does not guarantee future results. The investment return and principal value of an investment will fluctuate so that an investor’s shares, when redeemed, may be worth more or less than their original cost. Current performance of the funds may be lower or higher than the performance quoted. Performance data current to the most recent month end may be obtained by visiting www.fundxfunds.com.
The Bloomberg U.S. Aggregate Bond Index is a market-capitalization-weighted index of investment-grade fixed-rate debt issues, including government, corporate, asset-backed, and mortgage-backed securities, with maturities of at least one year. The BofA Merrill Lynch 3-Month U.S. Treasury Bill Index is an unmanaged market index of U.S. Treasury securities maturing in 90 days that assumes reinvestment of all income. The figures above reflect all dividends reinvested but do not reflect any deductions for fees, expenses, or taxes. One cannot invest directly in an index.
| 20 | |
Annual Report 2021 |
| INCMX | |
Flexible Income Fund Fixed Income |
0.9% Short-Term Investments,
Inclusive of Other Assets

| Annual Report 2021 | Fundxfunds.com | 21 |

The Sustainable Impact Fund (SRIFX) integrates environmental, social, and governance (ESG) criteria into our longtime momentum-based investment approach. SRIFX invests primarily in core diversified stock funds that have strong ESG ratings and strong recent returns. It also may have limited exposure to more aggressive stock funds that meet our sustainability and performance standards.
|
Janet Brown
Marty DeVault
Sean McKeon
|
How did the market change during the Annual Report period? The trailing 12 months included significant market rotations between large- and small-cap stocks and growth and value sectors. Markets shifted decisively away from large-cap growth and technology stocks starting in the fourth quarter of 2020. But this rotation stalled in mid-March 2021, and large-cap growth and tech regained market favor. Large-caps led for most of the second and third quarters, while smaller-cap and value stocks held up better during the September 2021 pullback.
How did the Fund try to respond to these changes? As markets changed in the first half of the Annual Report period, we diversified SRIFX’s portfolio, adding positions in small-cap, mid-cap, and value funds that had stronger momentum, including Parnassus Endeavor (PFPWX), Nuveen ESG Small Cap ETF (NUSC), Shelton Green Alpha (NEXTX), and Ariel (ARAIX).
Large-cap sustainable funds like Calvert US Large-Cap Value Responsible Index Fund (CFJIX) and Fidelity Environment and Alternative Energy Fund (FSLEX) were added in the second quarter.
How did the fund perform? For the year ending September 30, 2021, SRIFX gained 11.56% compared to 27.52% for the Morningstar Global Market Large-Mid-Cap Index and 30.00% for the S&P 500 Index.
What detracted from the fund’s performance? SRIFX had significant exposure to small- and mid-cap value funds, which lagged in the second half of the Annual Report period as large-cap growth rallied.
Clean energy investments showed promise in early 2021, but soon lost ground and the fund’s small positions in more aggressive funds like First Trust NASDAQ Clean Edge Green Energy ETF (QCLN) and New Alternatives Fund (NALFX) were among its weakest holdings.
What contributed positively to the fund’s performance? SRIFX’s best performing position was Parnassus Endeavor (PFPWX), a large-cap sustainable value fund that handily outperformed the S&P 500 and Morningstar Global Market Large-Mid-Cap Index from the time we first added it to the portfolio in December 2020 through September 30, 2021. We made multiple purchases of PFPWX, in January, February, March and May.
Parnassus is a longtime sustainable fund company. Its Endeavor Fund invests in ESG companies, avoids fossil fuel investments, and also encourages positive change by engaging with company management and voting shareholder-driven proxies. |
| 22 | |
Annual Report 2021 |
| SRIFX | |
Sustainable Impact Fund Global Growth and Impact Fund |
| FundX Sustainable Impact Fund: Performance Summary |
Annualized Returns as of September 30, 2021
| As of 9/30/21 | 1 Year | 3 Year | Since Inception (3/31/17) |
| FundX Sustainable Impact Fund | 11.56% | 11.12% | 13.51% |
| Morningstar Global Market Large-Mid Cap Index | 27.52% | 12.50% | 12.74% |
| S&P 500 Index | 30.00% | 15.99% | 16.41% |
FundX Sustainable Impact Fund Growth of $10,000 vs Morningstar Global Market Large-Mid Cap Index and S&P 500 Index

While the chart compares a mutual fund to an index, there are important differences between mutual funds and indexes. Market indexes are unmanaged and do not have expenses. The fund, on the other hand, is actively managed and seeks to meet a specific objective other than tracking the index, such as limiting risk or rotating among various sectors or investment styles. The fund also provides a wide range of services to shareholders, and it has transaction and other operational costs.
This chart illustrates the performance of a hypothetical $10,000 investment, including reinvested dividends and distributions, and is not intended to imply any future performance. The returns shown do not reflect the deduction of taxes that a shareholder would pay on fund distributions or the redemption of fund shares. The returns reflect fee waivers in effect. In the absence of such waivers, total return would be reduced.
The performance data quoted above represents past performance; past performance does not guarantee future results. The investment return and principal value of an investment will fluctuate so that an investor’s shares, when redeemed, may be worth more or less than their original cost. Current performance of the funds may be lower or higher than the performance quoted. Performance data current to the most recent month end may be obtained by visiting www.fundxfunds.com.
The Morningstar Global Market Large-Mid Cap Index measures the performance of developed and emerging countries across the world, targeting the top 90% of stocks by market capitalization. The S&P 500 Index is a broad based unmanaged index of 500 U.S. stocks, which is widely recognized as representative of the U.S. equity market. The figures above reflect all dividends reinvested but do not reflect any deductions for fees, expenses, or taxes. One cannot invest directly in an index.
| Annual Report 2021 | Fundxfunds.com | 23 |
| SRIFX | |
Sustainable Impact Fund Global Growth and Impact Fund |
0.0% Short-Term Investments,
Net of Other Liabilities
| 24 | |
Annual Report 2021 |
| SRIFX | |
Sustainable Impact Fund Global Growth and Impact Fund |
| SCHEDULE OF INVESTMENTS AT SEPTEMBER 30, 2021 | |||||||||
| Shares | Value | ||||||||
| Short-Term Investments: 0.2% | |||||||||
| 39,157 | Fidelity Investments Money Market Government Portfolio - Institutional Class, 0.01% # | $ | 39,157 | ||||||
| Total Short-Term Investments | |||||||||
| (Cost $39,157) | 39,157 | ||||||||
| Total Investments: 100.2% | |||||||||
| (Cost $25,343,332) | 25,536,773 | ||||||||
| Liabilities in Excess of Other Assets: (0.2)% | (44,061 | ) | |||||||
| Net Assets: 100.0% | $ | 25,492,712 | |||||||
| * | Non-income producing. | ||||||||
| # | Annualized seven-day yield as of September 30, 2021. | ||||||||
| The accompanying notes are an integral part of these financial statements. | |||||||||
| Annual Report 2021 | Fundxfunds.com | 25 |
The accompanying notes are an integral part of these financial statements.
| 26 | |
Annual Report 2021 |
| STATEMENT OF ASSETS AND LIABILITIES AT SEPTEMBER 30, 2021 | ||
| FundX Flexible Income Fund |
FundX Sustainable Impact Fund |
|
| Assets | ||
| Investments in securities, at value (identified cost $84,294,872, $25,304,175) (See Note 2) | $89,378,585 | $25,497,616 |
| Investments in short-term securities, at value (identified cost $607,954, $39,157) (See Note 2) | 607,954 | 39,157 |
| Total investments, at value (identified cost $84,902,826, $25,343,332) (See Note 2) | 89,986,539 | 25,536,773 |
| Cash | — | 2,840 |
| Receivables: | ||
| Fund shares sold | 193,555 | 1,992 |
| Dividends and interest | 59,804 | — |
| Prepaid expenses and other assets | 4,951 | 6,033 |
| Total assets | 90,244,849 | 25,547,638 |
| Liabilities | ||
| Payables: | ||
| Fund shares redeemed | 4,943 | 7,188 |
| Investment advisory fees, net | 51,923 | 18,797 |
| Administration and accounting fees | 13,405 | 5,347 |
| Audit fees | 24,500 | 16,400 |
| Custody fees | 850 | 400 |
| Transfer agent fees | 8,698 | 2,394 |
| Trustee fees | 6,362 | 1,883 |
| Other accrued expenses | 6,474 | 2,517 |
| Total liablities | 117,155 | 54,926 |
| Net Assets | $90,127,694 | $25,492,712 |
| Net assets applicable to shares outstanding | $90,127,694 | $25,492,712 |
| Shares outstanding; unlimited number of shares authorized without par value | 3,151,247 | 705,402 |
| Net asset value, offering and redemption price per share | $28.60 | $36.14 |
| Components of Net Assets | ||
| Paid-in capital | $88,784,059 | $18,467,817 |
| Total distributable earnings | 1,343,635 | 7,024,895 |
| Net assets | $90,127,694 | $25,492,712 |
The accompanying notes are an integral part of these financial statements.
| Annual Report 2021 | Fundxfunds.com | 27 |
The accompanying notes are an integral part of these financial statements.
| 28 | |
Annual Report 2021 |
| STATEMENT OF OPERATIONS For The Fiscal Year Ended September 31, 2021 | ||
| FundX Flexible Income Fund |
FundX Sustainable Impact Fund |
|
| INVESTMENT INCOME | ||
| Dividends | $2,708,053 | $66,110 |
| Interest | 45 | 13 |
| Total investment income | 2,708,098 | 66,123 |
| EXPENSES | ||
| Investment advisory fees | 611,718 | 252,290 |
| Transfer agent fees | 47,211 | 13,372 |
| Administration and accounting fees | 78,827 | 31,859 |
| Reports to shareholders | 6,396 | 3,899 |
| Custody fees | 4,938 | 2,175 |
| Audit fees | 26,500 | 16,400 |
| Registration fees | 20,046 | 21,440 |
| Trustee fees | 24,929 | 7,442 |
| Miscellaneous expenses | 9,302 | 7,129 |
| Interest expense (Note 6) | 367 | 8 |
| Legal fees | 33,737 | 9,650 |
| Insurance expense | 5,808 | 1,508 |
| Total expenses | 869,779 | 367,172 |
| Less: fees waived | (4,268) | (26,573) |
| Less: expenses paid indirectly (Note 3) | (23,041) | (5,809) |
| Net expenses | 842,470 | 334,790 |
| Net investment gain (loss) | 1,865,628 | (268,667) |
| REALIZED & UNREALIZED GAIN (LOSS) ON INVESTMENTS | ||
| Net realized gain on investments | 759,560 | 6,831,066 |
| Capital gain distributions from regulated investment companies | 981,243 | 620,284 |
| Change in net unrealized appreciation / depreciation on investments | 3,554,164 | (4,691,188) |
| Net realized and unrealized gain on investments | 5,294,967 | 2,760,162 |
| Net increase in net assets resulting from operations | $7,160,595 | $2,491,495 |
The accompanying notes are an integral part of these financial statements.
| Annual Report 2021 | Fundxfunds.com | 29 |
| FUNDX | |
Upgrader Fund Growth Fund |
(a) Summary of capital share transactions is as follows:
| Year Ended September 30, 2021 | Year Ended September 30, 2020 | |||
| Shares | Paid-in Capital | Shares | Paid-in Capital | |
| Shares sold | 145,057 | $11,186,887 | 202,413 | $12,090,726 |
| Shares issued in reinvestment of distributions | 12,666 | 936,917 | 281,242 | 17,023,561 |
| Shares redeemed | (400,388) | (30,664,557) | (752,575) | (43,490,751) |
| Net change in shares outstanding | (242,665) | $(18,540,753) | (268,920) | $(14,376,464) |
The accompanying notes are an integral part of these financial statements.
| 30 | |
Annual Report 2021 |
| HOTFX | |
Aggressive Upgrader Fund Aggressive Growth Fund |
| STATEMENTS OF CHANGES IN NET ASSETS | ||
| Year Ended September 30, 2021 |
Year Ended September 30, 2020 |
|
| INCREASE (DECREASE) IN NET ASSETS FROM: | ||
| OPERATIONS | ||
| Net investment loss | $(129,909) | $(170,243) |
| Net realized gain on investments | 9,365,244 | 377,270 |
| Capital gain distributions from regulated investment companies | 1,330,549 | 427,693 |
| Change in net unrealized appreciation / depreciation on investments | (6,567,162) | 5,619,953 |
| Net increase in net assets resulting from operations | 3,998,722 | 6,254,673 |
| DISTRIBUTIONS TO SHAREHOLDERS | ||
| Net dividends and distributions to shareholders | (530,656) | (1,279,285) |
| Total distributions to shareholders | (530,656) | (1,279,285) |
| CAPITAL SHARE TRANSACTIONS | ||
| Net change in net assets derived from net change in outstanding shares (a) | (2,048,680) | (5,669,600) |
| Total change in net assets | 1,419,386 | (694,212) |
| NET ASSETS: | ||
| Beginning of year | 35,103,380 | 35,797,592 |
| End of year | $36,522,766 | $35,103,380 |
(a) Summary of capital share transactions is as follows:
| Year Ended September 30, 2021 | Year Ended September 30, 2020 | |||
| Shares | Paid-in Capital | Shares | Paid-in Capital | |
| Shares sold | 21,753 | $1,720,885 | 10,452 | $613,521 |
| Shares issued in reinvestment of distributions | 6,922 | 527,803 | 20,752 | 1,273,140 |
| Shares redeemed | (55,090) | (4,297,368) | (126,898) | (7,556,261) |
| Net change in shares outstanding | (26,415) | $(2,048,680) | (95,694) | $(5,669,600) |
The accompanying notes are an integral part of these financial statements.
| Annual Report 2021 | Fundxfunds.com | 31 |
| RELAX | |
Conservative Upgrader Fund Balanced Growth Fund |
| STATEMENTS OF CHANGES IN NET ASSETS | ||
| Year Ended September 30, 2021 |
Year Ended September 30, 2020 |
|
| INCREASE IN NET ASSETS FROM: | ||
| OPERATIONS | ||
| Net investment income (loss) | $(111,443) | $420,378 |
| Net realized gain (loss) on investments | 11,804,378 | (1,325,978) |
| Capital gain distributions from regulated investment companies | 2,500,652 | 2,136,408 |
| Change in net unrealized appreciation / depreciation of investments | (1,411,978) | 2,587,579 |
| Net increase in net assets resulting from operations | 12,781,609 | 3,818,387 |
| DISTRIBUTIONS TO SHAREHOLDERS | ||
| Net dividends and distributions to shareholders | (359,435) | (3,230,437) |
| Total distributions to shareholders | (359,435) | (3,230,437) |
| CAPITAL SHARE TRANSACTIONS | ||
| Net change in net assets derived from net change in outstanding shares (a) | (6,206,249) | (16,444,606) |
| Total change in net assets | 6,215,925 | (15,856,656) |
| NET ASSETS: | ||
| Beginning of year | 83,411,109 | 99,267,765 |
| End of year | $89,627,034 | $83,411,109 |
(a) Summary of capital share transactions is as follows:
| Year Ended September 30, 2021 | Year Ended September 30, 2020 | |||
| Shares | Paid-in Capital | Shares | Paid-in Capital | |
| Shares sold | 137,379 | 6,434,066 | 236,507 | 9,335,370 |
| Shares issued in reinvestment of distributions | 7,955 | 355,090 | 78,857 | 3,204,732 |
| Shares redeemed | (283,463) | (12,995,405) | (757,049) | (28,984,921) |
| Other transactions ^ | — | — | — | 213 |
| Net change in shares outstanding | (138,129) | $(6,206,249) | (441,685) | $(16,444,606) |
^ Reimbursement from U.S. Bank Global Fund Services due to shareholder activity.
The accompanying notes are an integral part of these financial statements.
| 32 | |
Annual Report 2021 |
| INCMX | |
Flexible Income Fund Fixed Income |
| STATEMENTS OF CHANGES IN NET ASSETS | ||
| Year Ended September 30, 2021 |
Year Ended September 30, 2020 |
|
| INCREASE (DECREASE) IN NET ASSETS FROM: | ||
| OPERATIONS | ||
| Net investment income | $1,865,628 | $1,637,643 |
| Net realized income (loss) on investments | 759,560 | (2,763,248) |
| Capital gain distributions from regulated investment companies | 981,243 | 143,647 |
| Change in net unrealized appreciation / depreciation of investments | 3,554,164 | (1,583,042) |
| Net increase (decrease) in net assets resulting from operations | 7,160,595 | (2,565,000) |
| DISTRIBUTIONS TO SHAREHOLDERS | ||
| Net dividends and distributions to shareholders | (1,751,962) | (1,989,481) |
| Total distributions to shareholders | (1,751,962) | (1,989,481) |
| CAPITAL SHARE TRANSACTIONS | ||
| Net change in net assets derived from net change in outstanding shares (a) | (574,441) | (7,585,784) |
| Total change in net assets | 4,834,192 | (12,140,265) |
| NET ASSETS: | ||
| Beginning of year | 85,293,502 | 97,433,767 |
| End of year | $90,127,694 | $85,293,502 |
(a) Summary of capital share transactions is as follows:
| Year Ended September 30, 2021 | Year Ended September 30, 2020 | |||
| Shares | Paid-in Capital | Shares | Paid-in Capital | |
| Shares sold | 621,537 | $17,335,366 | 389,876 | $10,704,459 |
| Shares issued in reinvestment of distributions | 63,513 | 1,747,885 | 71,168 | 1,983,442 |
| Shares redeemed | (702,589) | (19,657,942) | (755,866) | (20,273,685) |
| Other transactions ^ | — | 250 | — | — |
| Net change in shares outstanding | (17,539) | $(574,441) | (294,822) | $(7,585,784) |
^ Reimbursement from U.S. Bank Global Fund Services due to shareholder activity.
The accompanying notes are an integral part of these financial statements.
| Annual Report 2021 | Fundxfunds.com | 33 |
| SRIFX | |
Sustainable Impact Fund Global Growth and Impact Fund |
| STATEMENTS OF CHANGES IN NET ASSETS | ||
| Year Ended September 30, 2021 |
Year Ended September 30, 2020 |
|
| INCREASE IN NET ASSETS FROM: | ||
| OPERATIONS | ||
| Net investment loss | $(268,667) | $(151,827) |
| Net realized gain on investments | 6,831,066 | 418,983 |
| Capital gain distributions from regulated investment companies | 620,284 | 412,588 |
| Change in net unrealized appreciation / depreciation on investments | (4,691,188) | 3,151,139 |
| Net increase in net assets resulting from operations | 2,491,495 | 3,830,883 |
| DISTRIBUTIONS TO SHAREHOLDERS | ||
| Net dividends and distributions to shareholders | (640,625) | (49,211) |
| Total distributions to shareholders | (640,625) | (49,211) |
| CAPITAL SHARE TRANSACTIONS | ||
| Net change in net assets derived from net change in outstanding shares (a) | 1,773,427 | (2,179,632) |
| Total change in net assets | 3,624,297 | 1,602,040 |
| NET ASSETS: | ||
| Beginning of year | 21,868,415 | 20,266,375 |
| End of year | $25,492,712 | $21,868,415 |
(a) Summary of capital share transactions is as follows:
| Year Ended September 30, 2021 | Year Ended September 30, 2020 | |||
| Shares | Paid-in Capital | Shares | Paid-in Capital | |
| Shares sold | 67,309 | $2,481,143 | 81,382 | $2,137,462 |
| Shares issued in reinvestment of distributions | 17,819 | 640,625 | 1,658 | 49,211 |
| Shares redeemed | (36,988) | (1,348,341) | (154,834) | (4,366,305) |
| Net change in shares outstanding | 48,140 | $1,773,427 | (71,794) | $(2,179,632) |
The accompanying notes are an integral part of these financial statements.
| 34 | |
Annual Report 2021 |
| FUNDX | |
Upgrader Fund Growth Fund |
| (1) | Recognition of net investment income by the Fund is affected by the timing of the declaration of dividends by the underlying investment companies in which the Fund invests. |
| (2) | Does not include expenses of investment companies in which the Fund invests. |
| (3) | Including credits for expenses paid indirectly, the ratio of expenses to average net assets would have been 1.24%, 1.26%, 1.25%, 1.21% and 1.28%, for the years ended September 30, 2021, September 30, 2020, September 30, 2019, September 30, 2018 and September 30, 2017, respectively. (Note 3) |
| (4) | Including credits for expenses paid indirectly, the ratio of net investment income (loss) to average net assets would have been (0.76)%, (0.47)%, (0.34)%, (0.55)% and 0.22%, for the years ended September 30, 2021, September 30, 2020, September 30, 2019, September 30, 2018 and September 30, 2017, respectively. (Note 3) |
| (5) | Calculated using the average shares outstanding method. |
| (6) | Includes interest expense of $56 or 0.00%, $2,872 or 0.00%, $1,069 or 0.00%, $1,117 or 0.00% and $737 or 0.00% of average net assets for the years ended September 30, 2021, September 30, 2020, September 30, 2019, September 30, 2018 and September 30,2017, respectively. |
The accompanying notes are an integral part of these financial statements.
| Annual Report 2021 | Fundxfunds.com | 35 |
| HOTFX | |
Aggressive Upgrader Fund Aggressive Growth Fund |
| FINANCIAL HIGHLIGHTS For a capital share outstanding throughout each year | |||||
| Year Ended September 30, | |||||
| 2021 | 2020 | 2019 | 2018 | 2017 | |
| Net asset value, beginning of year | $68.77 | $59.06 | $73.48 | $62.16 | $57.31 |
| INCOME FROM INVESTMENT OPERATIONS: | |||||
| Net investment loss (1) | (0.26) (5) | (0.31) (5) | (0.29) (5) | (0.55) (5) | (0.03) (5) |
| Net realized and unrealized gain (loss) on investments | 7.99 | 12.24 | (3.79) | 11.87 | 5.04 |
| Total from investment operations | 7.73 | 11.93 | (4.08) | 11.32 | 5.01 |
| LESS DISTRIBUTIONS: | |||||
| From net investment income | — | — | — | — | (0.16) |
| From net realized gain | (1.05) | (2.22) | (10.34) | — | — |
| Total distributions | (1.05) | (2.22) | (10.34) | — | (0.16) |
| Net asset value, end of year | $75.45 | $68.77 | $59.06 | $73.48 | $62.16 |
| Total return | 11.22% | 20.66% | (3.05)% | 18.21% | 8.77% |
| RATIOS/SUPPLEMENTAL DATA: | |||||
| Net assets, end of year (millions) | $36.5 | $35.1 | $35.8 | $44.9 | $43.4 |
| RATIO OF EXPENSES TO AVERAGE NET ASSETS (2): | |||||
| Before fees waived and expenses absorbed | 1.40% (6) | 1.48% (6) | 1.44% (6) | 1.42% (6) | 1.45% (6) |
| After fees waived and expenses absorbed (3) | 1.35% (6) | 1.35% (6) | 1.35% (6) | 1.35% (6) | 1.35% (6) |
| RATIO OF NET INVESTMENT LOSS | |||||
| TO AVERAGE NET ASSETS (2): | |||||
| Before fees waived and expenses absorbed | (0.40)% (6) | (0.65)% (6) | (0.59)% (6) | (0.90)% (6) | (0.15)% (6) |
| After fees waived and expenses absorbed (4) | (0.35)% (6) | (0.52)% (6) | (0.50)% (6) | (0.83)% (6) | (0.05)% (6) |
| Portfolio turnover rate | 184% | 159% | 187% | 144% | 186% |
| (1) | Recognition of net investment income by the Fund is affected by the timing of the declaration of dividends by the underlying investment companies in which the Fund invests. |
| (2) | Does not include expenses of investment companies in which the Fund invests. |
| (3) | Including credits for expenses paid indirectly, the ratio of expenses to average net assets would have been 1.34%, 1.33%, 1.34%, 1.33% and 1.34%, for the years ended September 30, 2021, September 30, 2020, September 30, 2019, September 30, 2018 and September 30, 2017, respectively. (Note 3) |
| (4) | Including credits for expenses paid indirectly, the ratio of net investment income (loss) to average net assets would have been (0.33)%, (0.50)%, (0.49)%, (0.81)% and (0.05)%, for the years ended September 30, 2021, September 30, 2020, September 30, 2019, September 30, 2018, and September 30, 2017, respectively. (Note 3) |
| (5) | Calculated using the average shares outstanding method. |
| (6) | Includes interest expense of $100 or 0.00%, $1,013 or 0.00%, $600 or 0.00%, $428 or 0.00% and $1,864 or 0.00% of average net assets for the years ended Septeember 30, 2021, September 30, 2020 September 30, 2019, September 30, 2018 and September 30, 2017, respectively. |
The accompanying notes are an integral part of these financial statements.
| 36 | |
Annual Report 2021 |
| RELAX | |
Conservative Upgrader Fund Balanced Fund |
| FINANCIAL HIGHLIGHTS For a capital share outstanding throughout each year | |||||
| Year Ended September 30, | |||||
| 2021 | 2020 | 2019 (7) | 2018 | 2017 | |
| Net asset value, beginning of year | $41.43 | $40.43 | $41.40 | $40.41 | $36.87 |
| INCOME FROM INVESTMENT OPERATIONS: | |||||
| Net investment income (loss) (1) | (0.06) (5) | 0.19 (5) | 0.27 (5) | 0.26 (5) | 0.51 (5) |
| Net realized and unrealized gain on investments | 6.60 | 2.20 | 0.63 | 4.01 | 3.57 |
| Total from investment operations | 6.54 | 2.39 | 0.90 | 4.27 | 4.08 |
| LESS DISTRIBUTIONS: | |||||
| From net investment income | (0.18) | (0.46) | (0.16) | (0.52) | (0.54) |
| From net realized gain | — | (0.93) | (1.71) | (2.76) | — |
| Total distributions | (0.18) | (1.39) | (1.87) | (3.28) | (0.54) |
| Net asset value, end of year | $47.79 | $41.43 | $40.43 | $41.40 | $40.41 |
| Total return | 15.83% | 5.99% | 2.84% | 11.22% | 11.19% |
| RATIOS/SUPPLEMENTAL DATA: | |||||
| Net assets, end of year (millions) | $89.6 | $83.4 | $99.3 | $60.1 | $57.6 |
| RATIO OF EXPENSES TO AVERAGE NET ASSETS (2): | |||||
| Before fees recaptured/waived and expenses absorbed | 1.31% (6) | 1.33% (6) | 1.35% (6) | 1.35% (6) | 1.40% (6) |
| After fees recaptured/waived and expenses absorbed (3) | 1.31% (6) | 1.35% (6) | 1.35% (6) | 1.35% (6) | 1.35% (6) |
| RATIO OF NET INVESTMENT INCOME (LOSS) | |||||
| TO AVERAGE NET ASSETS (2): | |||||
| Before fees waived and expenses absorbed | (0.16)% (6) | 0.48% (6) | 0.66% (6) | 0.61% (6) | 1.25% (6) |
| After fees waived and expenses absorbed (4) | (0.16)% (6) | 0.46% (6) | 0.66% (6) | 0.61% (6) | 1.30% (6) |
| Portfolio turnover rate | 84% | 172% | 151% | 92% | 129% |
| (1) | Recognition of net investment income by the Fund is affected by the timing of the declaration of dividends by the underlying investment companies in which the Fund invests. |
| (2) | Does not include expenses of investment companies in which the Fund invests. |
| (3) | Including credits for expenses paid indirectly, the ratio of expenses to average net assets would have been 1.28%, 1.33%, 1.32%, 1.31% and 1.32%, for the years ended September 30, 2021, September 30, 2020, September 30, 2019, September 30, 2018 and September 30, 2017, respectively. (Note 3) |
| (4) | Including credits for expenses paid indirectly, the ratio of net investment income to average net assets would have been (0.13)%, 0.48%, 0.69%, 0.65% and 1.33%, for the years ended September 30, 2021, September 30, 2020, September 30, 2019, September 30, 2018 and September 30, 2017, respectively. (Note 3) |
| (5) | Calculated using the average shares outstanding method. |
| (6) | Includes interest expense of $152 or 0.00%, $3,077 or 0.00%, $1,536 or 0.00%, $734 or 0.00% and $366 or 0.00% of average net assets for the years ended September 30, 2021, September 30, 2020, September 30, 2019, September 30, 2018 and September 30, 2017, respectively. |
| (7) | On July 26, 2019, shares of the FundX Tactical Upgrader Fund were reorganized into shares of the FundX Conservative Upgrader Fund. Activity after July 26, 2019 reflects the Funds’ combined operations. |
The accompanying notes are an integral part of these financial statements.
| Annual Report 2021 | Fundxfunds.com | 37 |
| INCMX | |
Flexible Income Fund Fixed Income |
| FINANCIAL HIGHLIGHTS For a capital share outstanding throughout each year | |||||
| Year Ended September 30, | |||||
| 2021 | 2020 | 2019 | 2018 | 2017 | |
| Net asset value, beginning of year | $26.92 | $28.13 | $28.50 | $29.16 | $28.61 |
| INCOME FROM INVESTMENT OPERATIONS: | |||||
| Net investment income (1) | 0.60 (5) | 0.49 (5) | 0.60 (5) | 0.84 (5) | 0.97 (5) |
| Net realized and unrealized gain (loss) on investments | 1.70 | (1.12) | 0.35 | (0.48) | 0.33 |
| Total from investment operations | 2.30 | (0.63) | 0.95 | 0.36 | 1.30 |
| LESS DISTRIBUTIONS: | |||||
| From net investment income | (0.62) | (0.58) | (1.32) | (1.02) | (0.75) |
| From net realized gain | — | — | — | — | — |
| Total distributions | (0.62) | (0.58) | (1.32) | (1.02) | (0.75) |
| Net asset value, end of year | $28.60 | $26.92 | $28.13 | $28.50 | $29.16 |
| Total return | 8.63% | (2.32)% | 3.66% | 1.25% | 4.74% |
| RATIOS/SUPPLEMENTAL DATA: | |||||
| Net assets, end of year (millions) | $90.1 | $85.3 | $97.4 | $99.9 | $98.1 |
| RATIO OF EXPENSES TO AVERAGE NET ASSETS (2): | |||||
| Before fees waived and expenses absorbed | 1.00% (6) | 1.01% (6) | 1.01% (6) | 0.98% (6) | 1.03% (6) |
| After fees waived and expenses absorbed (3) | 0.99% (6) | 0.99% (6) | 1.00% (6) | 0.99% (6) | 0.99% (6) |
| RATIO OF NET INVESTMENT INCOME | |||||
| TO AVERAGE NET ASSETS (2): | |||||
| Before fees recaptured/waived and expenses absorbed | 2.10% (6) | 1.75% (6) | 2.14% (6) | 2.95% (6) | 3.35% (6) |
| After fees recaptured/waived and expenses absorbed (4) | 2.11% (6) | 1.77% (6) | 2.15% (6) | 2.94% (6) | 3.39% (6) |
| Portfolio turnover rate | 73% | 262% | 180% | 105% | 82% |
| (1) | Recognition of net investment income by the Fund is affected by the timing of the declaration of dividends by the underlying investment companies in which the Fund invests. |
| (2) | Does not include expenses of investment companies in which the Fund invests. |
| (3) | Including credits for expenses paid indirectly, the ratio of expenses to average net assets would have been 0.96%, 0.98%, 0.97%, 0.98% and 0.96%, for the years ended September 30, 2021, September 30, 2020, September 30, 2019, September 30, 2018 and September 30, 2017, respectively. (Note 3) |
| (4) | Including credits for expenses paid indirectly, the ratio of net investment income to average net assets would have been 2.13%, 1.78%, 2.18%, 2.95% and 3.41%, for the years ended September 30, 2021, September 30, 2020, September 30,2019, September 30, 2018 and September 30, 2017, respectively. (Note 3) |
| (5) | Calculated using the average shares outstanding method. |
| (6) | Includes interest expense of $367 or 0.00%, $1,916 or 0.00%, $10,082 or 0.01%, $1,173 or 0.00% and $999 or 0.00% of average net assets for the years ended September 30, 2021, September 30, 2020, September 30, 2019, September 30, 2018 and September 30, 2017, respectively. |
The accompanying notes are an integral part of these financial statements.
| 38 | |
Annual Report 2021 |
| SRIFX | |
Sustainable Impact Fund Global Growth and Impact Fund |
| FINANCIAL HIGHLIGHTS For a capital share outstanding throughout the period/year | |||||
| Year Ended September 30, | March 31, 2017(*) through |
||||
| 2021 | 2020 | 2019 | 2018 | September 30, 2017 |
|
| Net asset value, beginning of period/year | $33.27 | $27.80 | $31.67 | $27.52 | $25.00 |
| INCOME FROM INVESTMENT OPERATIONS: | |||||
| Net investment loss (1) | (0.39) (6) | (0.23) (6) | (0.15) (6) | (0.18) (6) | (0.13) (6) |
| Net realized and unrealized gain on investments | 4.23 | 5.77 | 0.17 | 4.84 | 2.65 |
| Total from investment operations | 3.84 | 5.54 | 0.02 | 4.66 | 2.52 |
| LESS DISTRIBUTIONS: | |||||
| From net investment income | — | — | — | (0.40) | — |
| From net realized gain | (0.97) | (0.07) | (3.89) | (0.11) | — |
| Total distributions | (0.97) | (0.07) | (3.89) | (0.51) | — |
| Net asset value, end of period/year | $36.14 | $33.27 | $27.80 | $31.67 | $27.52 |
| Total return | 11.56% | 20.01% | 2.49% | 17.12% | 10.08% ^ |
| RATIOS/SUPPLEMENTAL DATA: | |||||
| Net assets, end of period/year (millions) | $25.5 | $21.9 | $20.3 | $19.7 | $10.8 |
| RATIO OF EXPENSES TO AVERAGE NET ASSETS (2): | |||||
| Before fees waived and expenses absorbed | 1.45% (4) | 1.52% (4) | 1.52% (4) | 1.55% (4) | 2.25% (4) + |
| After fees waived and expenses absorbed | 1.35% (3) (4) | 1.35% (3) (4) | 1.36% (3) (4) | 1.35% (4) | 1.35% (4) + |
| RATIO OF NET INVESTMENT LOSS | |||||
| TO AVERAGE NET ASSETS (2): | |||||
| Before fees waived and expenses absorbed | (1.19)% (4) | (0.96)% (4) | (0.72)% (4) | (0.81)% (4) | (1.85)% (4) + |
| After fees waived and expenses absorbed | (1.09)% (4) (5) | (0.79)% (4) (5) | (0.56)% (4) (5) | (0.61)% (4) | (0.95)% (4) + |
| Portfolio turnover rate | 154% | 156% | 190% | 161% | 27% ^ |
| * | The FundX Sustainable Impact Fund was incepted March 31, 2017. |
| (1) | Recognition of net investment income by the Fund is affected by the timing of the declaration of dividends by the underlying investment companies in which the Fund invests. |
| (2) | Does not include expenses of investment companies in which the Fund invests. |
| (3) | Including credits for expenses paid indirectly, the ratio of expenses to average net assets would have been 1.33%, 1.34% and 1.35% for the period/years ended Septeember 30, 2021, September 30, 2020 and September 30, 2019. (Note 3) |
| (4) | Includes interest expense of $8 or 0.00% or $587 or 0.01%, $2,387 or 0.01%, $32 or 0.00% and $0 or 0.00% of average net assets for the period/years ended September 30, 2021, September 30, 2020, September 30, 2019, September 30, 2018 and September 30, 2017, respectively. |
| (5) | Including credit for expenses paid indirectly, the ratio of net investment loss to average net assets would have been (1.06)%, (0.78)% and (0.55)% for the period/years ended September 31, 2021, September 30, 2020 and September 30, 2019. (Note 3) |
| (6) | Calculated using the average shares outstanding method. |
| ^ | Not Annualized. |
| + | Annualized. |
The accompanying notes are an integral part of these financial statements.
| Annual Report 2021 | Fundxfunds.com | 39 |
| NOTES TO THE FINANCIAL STATEMENTS SEPTEMBER 30, 2021 |
NOTE 1 – ORGANIZATION
FundX Investment Trust (the “Trust”) was organized as a Delaware business trust on March 12, 2014, and is registered under the Investment Company Act of 1940 (the “1940 Act”) as an open-end management investment company. The Funds comprising the Trust consist of FundX Upgrader Fund (“Upgrader Fund”), FundX Aggressive Upgrader Fund (“Aggressive Fund”), FundX Conservative Upgrader Fund (“Conservative Fund”), FundX Flexible Income Fund (“Flexible Income Fund”), and FundX Sustainable Impact Fund (“Sustainable Impact Fund”), collectively, the “Funds”. Effective March 31, 2017, the Trust launched the Sustainable Impact Fund. The Funds follow the investment company accounting and reporting guidance of the Financial Accounting Standards Board (FASB) Accounting Standard Codification Topic 946 “Financial Services – Investment Companies.” The Funds were organized to serve as Successor Funds to certain predecessor mutual funds that were previously part of another investment company, Professionally Managed Portfolios, which were also advised by the FundX Investment Group, LLC (the “Advisor”) and were merged with and into the Successor Funds as part of a reorganization transaction that became effective on August 4, 2014, except for the Sustainable Impact Fund.
The Upgrader Fund commenced operations on November 1, 2001. The Aggressive Fund, Conservative Fund and Flexible Income Fund commenced operations on July 1, 2002. The Sustainable Impact Fund commenced operations on March 31, 2017.
The investment objective of the Upgrader Fund and the Aggressive Fund is to maximize capital appreciation over the long term without regard to income. The investment objective of the Conservative Fund is to obtain capital appreciation over the long term while at times providing a low level of current income to reduce portfolio volatility. The investment objective of the Flexible Income Fund is to generate total return, which is capital appreciation plus current income. The investment objective of the Sustainable Impact Fund is to obtain long-term capital appreciation.
NOTE 2 – SIGNIFICANT ACCOUNTING POLICIES
The following is a summary of significant accounting policies consistently followed by the Funds. These policies are in conformity with accounting principles generally accepted in the United States of America (“U.S. GAAP”).
A. Security Valuation. Investments in open-end mutual funds are valued at their respective net asset values on the valuation date. Security valuations for the Funds’ investments in investment companies are furnished by an independent pricing service that has been approved by the Funds’ board of directors. All equity securities that are traded on a national securities exchange, except those listed on the NASDAQ Global Market® (“NASDAQ”), are valued at the last reported sale price on the exchange on which the security is principally traded. Securities traded on NASDAQ will be valued at the NASDAQ Official Closing Price (“NOCP”). If, on a particular day, an exchange-traded or NASDAQ security does not trade, then the mean between the most recent quoted bid and asked prices will be used. All equity securities that are not traded on a listed exchange are valued at the last sale price in the over-the-counter market. If a non-exchange traded security does not trade on a particular day, then the mean between the last quoted closing bid and asked price will be used.
Short-term securities that have maturities of less than 60 days, at time of purchase, are valued at amortized cost, which when combined with accrued interest, approximates market value.
Exchange traded options are valued at the composite price, using the National Best Bid and Offer quotes (“NBBO”). NBBO consists of the highest bid price and lowest ask price across any of the exchanges on which an option is quoted, thus providing a view across the entire U.S. options marketplace. Composite option pricing calculates the mean of the highest bid price and lowest ask price across the exchanges where the option is traded.
Securities for which quotations are not readily available are valued at their respective fair values as determined in good faith or under the direction of the Board of Trustees. When a security is “fair valued,” consideration is given to the facts and circumstances relevant to the particular situation, including a review of various factors set forth in the pricing procedures adopted by the Funds’ Board of Trustees. Fair value pricing is an inherently subjective process, and no single standard exists for determining fair value. Different funds could reasonably arrive at different values for the same security. The use of fair value pricing by a fund may cause the net asset value of its shares to differ significantly from the net asset value that would be calculated without regard to such considerations. As of September 30, 2021 the Funds did not hold fair valued securities.
The Funds may utilize various methods to measure the fair value of some of their investments. U.S. GAAP establishes a hierarchy that prioritizes inputs to valuations methods. The three levels of inputs are:
| Level 1 – | Unadjusted quoted prices in active markets for identical assets or liabilities that the Funds have the ability to access. |
| Level 2 – | Observable inputs other than quoted prices included in Level 1 that are observable for the asset or liability, either directly or indirectly. These inputs may include quoted prices for the identical instrument on an inactive market, prices for similar instruments, interest rates, prepayment speeds, credit risk, yield curves, default rates and similar data. |
| Level 3 – | Unobservable inputs for the asset or liability, to the extent relevant observable inputs are not available; representing the Funds’ own assumptions about the assumptions a market participant would use in valuing the asset or liability, and would be based on the best information available. |
The availability of observable inputs can vary from security to security and is affected by a wide variety of factors, including, for example, the type of security whether the security is new and not yet established in the marketplace, the liquidity of markets, and other characteristics particular to the security. To the extent that valuation is based on models or inputs that are less observable or unobservable in the market, the determination of fair value requires more judgment. Accordingly, the degree of judgment exercised in determining fair value is greatest for instruments categorized in Level 3.
| 40 | |
Annual Report 2021 |
| NOTES TO THE FINANCIAL STATEMENTS SEPTEMBER 30, 2021, continued |
The inputs used to measure fair value may fall into different levels of the fair value hierarchy. In such cases, for disclosure purposes, the level in the fair value hierarchy within which the fair value measurement falls in its entirety, is determined based on the lowest level input that is significant to the fair value measurement in its entirety.
The following is a summary of the inputs used to value the Funds’ investments as of September 30, 2021:
| FUNDX UPGRADER FUND | Level 1 | Level 2 | Level 3 | Total | ||||||
| Investment Companies | $231,613,832 | $ — | $ — | $231,613,832 | ||||||
| Short-Term Investments | 849,893 | — | — | 849,893 | ||||||
| Total Investments in Securities | $232,463,725 | $ — | $ — | $232,463,725 | ||||||
| FUNDX AGGRESSIVE UPGRADER FUND | Level 1 | Level 2 | Level 3 | Total | ||||||
| Investment Companies | $36,368,361 | $ — | $ — | $36,368,361 | ||||||
| Short-Term Investments | 169,392 | — | — | 169,392 | ||||||
| Total Investments in Securities | $36,537,753 | $ — | $ — | $36,537,753 | ||||||
| FUNDX CONSERVATIVE UPGRADER FUND | Level 1 | Level 2 | Level 3 | Total | ||||||
| Investment Companies | $89,308,390 | $ — | $ — | $89,308,390 | ||||||
| Short-Term Investments | 469,103 | — | — | 469,103 | ||||||
| Total Investments in Securities | $89,777,493 | $ — | $ — | $89,777,493 | ||||||
| FUNDX FLEXIBLE INCOME FUND | Level 1 | Level 2 | Level 3 | Total | ||||||
| Investment Companies | $89,378,585 | $ — | $— | $89,378,585 | ||||||
| Short-Term Investments | 607,954 | — | — | 607,954 | ||||||
| Total Investments in Securities | $89,986,539 | $ — | $ — | $89,986,539 | ||||||
| FUNDX SUSTAINABLE IMPACT FUND | Level 1 | Level 2 | Level 3 | Total | ||||||
| Investment Companies | $25,497,616 | $ — | $ — | $25,497,616 | ||||||
| Short-Term Investments | 39,157 | — | — | 39,157 | ||||||
| Total Investments in Securities | $25,536,773 | $ — | $ — | $25,536,773 | ||||||
See schedule of investments for breakout of investment company types.
B. Federal Income Taxes. The Funds have elected to be taxed as “regulated investment companies” and intend to distribute substantially all taxable income to their shareholders and otherwise comply with the provisions of the Internal Revenue Code applicable to regulated investment companies. Therefore, no provision for federal income taxes or excise taxes has been made.
To avoid imposition of the excise tax applicable to regulated investment companies, each Fund intends to declare each year as dividends, in each calendar year, at least 98% of its net investment income (earned during the calendar year) and at least 98.2% of its net realized capital gains (earned during the twelve months ended October 31) plus undistributed amounts, if any, from prior years.
Net capital losses incurred after October 31 and late year losses incurred after December 31 and within the taxable year are deemed to arise on the first business day of each Fund’s next taxable year.
For fiscal year ended September 30, 2021, the Sustainable Impact Fund had late year losses of $11,084. No Fund had any post October losses.
At September 30, 2021, the following Capital Loss Carryover were available:
| Infinite Short-Term | Total | |||
| FLEXIBLE INCOME FUND | $4,954,610 | $4,954,610 |
As of September 30, 2021, there were no Capital Loss Carryover available to offset future gains for the Upgrader Fund, Aggressive Fund, Conservative Fund, and Sustainable Impact Fund.
| Annual Report 2021 | Fundxfunds.com | 41 |
| NOTES TO THE FINANCIAL STATEMENTS SEPTEMBER 30, 2021, continued |
For fiscal year ended September 30, 2021, the following Funds have utilized Capital Loss Carryover in the following amount:
| CONSERVATIVE UPGRADER FUND | $754,431 |
| FLEXIBLE INCOME FUND | $1,530,382 |
The Funds recognize the tax benefits of uncertain tax positions only where the position is “more likely than not” to be sustained assuming examination by tax authorities. Management has analyzed the Funds’ tax positions, and has concluded that no liability for unrecognized tax benefits should be recorded related to uncertain tax positions taken on returns filed for open tax years 2018-2020, or expected to be taken in the Funds’ 2021 tax returns. The Funds identify their major tax jurisdictions as U.S. Federal and California State; however the Funds are not aware of any tax positions for which it is reasonably possible that the total amounts of unrecognized tax benefits will change materially in the next twelve months.
C. Securities Transactions and Investment Income. Investment securities transactions are accounted for on the trade date. Gains and losses realized on sales of securities are determined on an identified cost basis. Discounts/premiums on debt securities purchased are accreted/amortized over the life of the respective securities using the effective interest method. Dividend income is recorded on the ex-dividend date. Interest income is recorded on an accrual basis.
D. Distributions to Shareholders. Distributions to shareholders from net investment income and net realized gains on securities for the Funds normally are declared and paid on an annual basis. Distributions are recorded on the ex-dividend date.
E. Use of Estimates. The preparation of financial statements in conformity with U.S. GAAP requires management to make estimates and assumptions that affect the reported amounts of assets and liabilities at the date of the financial statements and the reported amounts of revenue and expenses during the reporting period. Actual results could differ from those estimates.
F. Share Valuation. The net asset value (“NAV”) per share of each Fund is calculated by dividing the sum of the value of the securities held by each Fund, plus cash and other assets, minus all liabilities by the total number of shares outstanding for each Fund, rounded to the nearest cent. The Funds’ shares will not be priced on the days on which the New York Stock Exchange (“NYSE”) is closed for trading. The offering and redemption price per share for each Fund is equal to each Fund’s net asset value per share.
G. Guarantees and Indemnifications. In the normal course of business, the Funds enter into contracts with service providers that contain general indemnification clauses. The Funds’ maximum exposure under these arrangements is unknown as this would involve future claims that may be made against the Funds that have not yet occurred. However, based on experience, the Funds expect the risk of loss to be remote.
H. Reclassification of Capital Accounts. Accounting principles generally accepted in the United States of America require that certain components of net assets relating to permanent difference be reclassified between financial and tax reporting. These reclassifications have no effect on net assets or net asset value per share. For the fiscal year ended September 30, 2021, the following adjustments were made:
| Distributable Earnings |
Paid-In Capital | ||||||
| UPGRADER FUND | (3,773,820) | 3,773,820 | |||||
| AGGRESSIVE FUND | (749,196) | 749,196 | |||||
| CONSERVATIVE FUND | (801,096) | 801,096 | |||||
| SUSTAINABLE IMPACT FUND | (180,939) | 180,939 | |||||
The permanent differences primarily relate to ETF and mutual fund dividend reclassifications, and use of equalization.
I. Subsequent Events. In preparing these financial statements, the Funds have evaluated events and transactions for potential recognition or disclosure through the date these financial statements were issued.
J. COVID-19 Pandemic. The global outbreak of COVID-19 (commonly referred to as “coronavirus”) has disrupted economic markets and the prolonged economic impact is uncertain. The ultimate economic fallout from the pandemic, and the long-term impact on economies, markets, industries and individual issuers, are not known. The operational and financial performance of the issuers of securities in which the Funds invest depends on future developments, including the duration and spread of the outbreak, and such uncertainty may in turn adversely affect the value and liquidity of the Funds’ investments, impair the Funds’ ability to satisfy redemption requests, and negatively impact the Funds’ performance.
NOTE 3 – COMMITMENTS AND OTHER RELATED PARTY TRANSACTIONS
FundX Investment Group, LLC (the “Advisor”) provides the Funds with investment management services under an Investment Advisory Agreement (the “Agreement”). Under the Agreement, the Advisor furnishes all investment advice, office space, certain administrative services and most of the personnel needed by the Funds. As compensation for its services, the Advisor receives a monthly fee at the annual rate of 1.00% on the first $500 million of average daily net assets, 0.90% on net assets of $500 million to $750 million, 0.80% on net assets of $750 million to $1 billion and 0.70% on net assets exceeding $1 billion for the Upgrader Fund, the Aggressive Fund, the Conservative Fund, and the Sustainable Impact Fund. For the Flexible Income Fund, the Advisor receives a monthly fee at an annual rate of 0.70% based upon the average daily net assets of the Fund. For the year ended September 30, 2021, the Upgrader Fund, Aggressive Fund, Conservative Fund, Flexible Income Fund, and Sustainable Impact Fund incurred $2,356,459, $389,315, $884,758, $611,718 and $252,290 in investment advisory fees, respectively.
| 42 | |
Annual Report 2021 |
| NOTES TO THE FINANCIAL STATEMENTS SEPTEMBER 30, 2021, continued |
The Advisor has contractually agreed to limit the Funds’ total operating expenses by reducing all or a portion of their fees and reimbursing the Funds’ expenses so that their ratio of expenses to average net assets will not exceed the following:
| UPGRADER FUND | 1.35% | FLEXIBLE INCOME FUND | 0.99% | ||
| AGGRESSIVE FUND | 1.35% | SUSTAINABLE IMPACT FUND | 1.35% | ||
| CONSERVATIVE FUND | 1.35% |
The contract is in effect through January 31, 2023 and may be terminated at any time by the Board of Trustees upon sixty days written notice to the Advisor. The Advisor is permitted to seek reimbursement from the Funds, subject to limitations, for fees waived and/or Fund expenses it pays over the following thirty six months after such payment. The Funds must pay their current ordinary operating expenses before the Advisor is entitled to any reimbursement of fees and/or expenses. Any such reimbursement is also contingent upon Board of Trustees review and approval prior to the time the reimbursement is initiated. For the year ended September 30, 2021, the Advisor waived $0, $20,334, $0, $4,268 and $26,573 in fees for the Upgrader Fund, Aggressive Fund, Conservative Fund, Flexible Income Fund and Sustainable Impact Fund, respectively. For the year ended September 30, 2021, the Advisor recaptured fees of $174 from the Conservative Fund. The shareholders approved the new investment advisory agreement between FundX Investment Trust, on behalf of the Funds, and One Capital Management, LLC on September 1, 2021, with no changes to the Funds’ allowable expenses.
At September 30, 2021, the remaining cumulative unreimbursed amount paid and/or waived by the Advisor on behalf of the Aggressive Fund, Flexible Income and Sustainable Impact Fund that may be recouped was $102,979, $31,952, and $90,553 respectively. The Advisor may recapture portions of the above amounts no later than the dates as stated below:
| September | |||||||||
| 2022 | 2023 | 2024 | Total | ||||||
| AGGRESSIVE FUND | $33,362 | $42,876 | $26,741 | $102,979 | |||||
| FLEXIBLE INCOME FUND | 3,781 | 17,938 | 10,233 | 31,952 | |||||
| SUSTAINABLE IMPACT FUND | 29,665 | 34,315 | 26,573 | 90,553 | |||||
U.S. Bancorp Fund Services, LLC, dba U.S. Bank Global Fund Services (“Fund Services”), an indirect wholly owned subsidiary of U.S. Bancorp, serves as the Funds’ Administrator (“Administrator”) and, in that capacity, performs various administrative and accounting services for the Funds. Fund Services also serves as the Funds’ fund accountant, transfer agent, dividend disbursing agent and registrar. The Administrator prepares various federal and state regulatory filings, reports and returns for the Funds; prepares reports and materials to be supplied to the Trustees; monitors the activities of the Funds’ custodian, transfer agent and accountants; coordinates the preparation and payment of the Funds’ expenses and reviews the Funds’ expense accruals. As compensation for its services, the Administrator is entitled to a monthly fee at an annual rate based upon the average daily net assets of the Funds. Fees paid by the Funds for Administration services for the year ended September 30, 2021 are disclosed in the Statements of Operations.
Quasar Distributors, LLC (the “Distributor”) serves as principal underwriter for shares of the Funds, and acts as each Fund’s Distributor in a continuous public offering of each Fund’s shares. U.S. Bank, N.A. (“U.S. Bank”) serves as the Funds’ custodian (the “Custodian”). The Custodian is an affiliate of the Administrator.
U.S. Bank receives fees from the underlying funds (“Underlying Funds”) in which the Funds invest for servicing these same shareholder accounts of the underlying Funds by third parties. Fund Services and the Funds have agreed that Fund Services will reduce its fees for fund administration, fund accounting, fund transfer agency and fund custodial services in an amount equal to 70% of the fees received by U.S. Bank. For the year ended September 30, 2021, this expense reduction, in aggregate, equaled $38,384, $4,107, $29,283, $23,041 and $5,809 for the Upgrader Fund, Aggressive Fund, Conservative Fund, Flexible Income Fund and Sustainable Impact Fund, respectively. These expense reductions are reflected on the Statement of Operations as “expenses paid indirectly.”
NOTE 4 – PURCHASES AND SALES OF SECURITIES
The cost of purchases and proceeds from the sales of securities, excluding short-term investments, for the year ended September 30, 2021 are as follows:
| Purchases | Sales | ||||
| UPGRADER FUND | $241,488,956 | $254,901,951 | |||
| AGGRESSIVE FUND | 70,553,853 | 71,752,699 | |||
| CONSERVATIVE FUND | 73,126,645 | 77,429,096 | |||
| FLEXIBLE INCOME FUND | 63,659,606 | 63,216,262 | |||
| SUSTAINABLE IMPACT FUND | 39,720,633 | 38,193,559 |
| Annual Report 2021 | Fundxfunds.com | 43 |
| NOTES TO THE FINANCIAL STATEMENTS SEPTEMBER 30, 2021, continued |
NOTE 5 – DISTRIBUTIONS TO SHAREHOLDERS
The tax character of distributions paid during the year ended September 30, 2021 and the year ended September 30, 2020 were as follows:
| Year Ended September 30, 2021 | Year Ended September 30, 2020 | ||||||||
| Ordinary Income | Long-Term Capital Gain* | Ordinary Income | Long-Term Capital Gain* | ||||||
| UPGRADER FUND | $— | $950,917 | $— | $17,353,173 | |||||
| AGGRESSIVE FUND | — | 530,656 | — | 1,279,285 | |||||
| CONSERVATIVE FUND | 359,435 | — | 1,063,644 | 2,166,793 | |||||
| FLEXIBLE INCOME FUND | 1,751,962 | — | 1,989,481 | — | |||||
| SUSTAINABLE IMPACT FUND | — | 640,625 | 38,803 | 10,408 | |||||
* Designated as long-term capital gain divided, pursuant to Internal Revenue Code Section 852(b)(3), the amount necessary to reduce the earnings and profits of the Fund related to net capital gain to zero for the tax year ended September 30, 2021.
As of September 30, 2021, components of distributable earnings on a tax basis were as follows:
| FUNDX UPGRADER FUND | FUNDX AGGRESSIVE UPGRADER FUND |
FUNDX CONSERVATIVE UPGRADER FUND |
||||||||
| Cost of investments | $215,808,353 | $35,852,080 | $83,466,233 | |||||||
| Gross tax unrealized appreciation | 18,755,406 | 1,871,937 | 6,821,354 | |||||||
| Gross tax unrealized depreciation | (2,100,034) | (1,186,264) | (510,094) | |||||||
| Net tax unrealized appreciation | $16,655,372 | 685,673 | $6,311,260 | |||||||
| Undistributed ordinary income | 2,648,803 | 969,047 | 1,456,594 | |||||||
| Undistributed long-term capital gain | 58,309,251 | 8,656,769 | 10,977,227 | |||||||
| Total distributable earnings | $60,958,054 | $9,625,816 | $12,433,821 | |||||||
| Other accumulated loss | — | — | — | |||||||
| Total accumulated gain/(loss) | $77,613,426 | $10,311,489 | $18,745,081 | |||||||
| FUNDX FLEXIBLE INCOME FUND |
FUNDX SUSTAINABLE IMPACT FUND |
||||||
| Cost of investments | $84,902,826 | $25,343,332 | |||||
| Gross tax unrealized appreciation | 5,220,607 | 763,133 | |||||
| Gross tax unrealized depreciation | (136,894) | (569,692) | |||||
| Net tax unrealized appreciation | $5,083,713 | $193,441 | |||||
| Undistributed ordinary income | 1,214,532 | — | |||||
| Undistributed long-term capital gain | — | 6,842,538 | |||||
| Total distributable earnings | $1,214,532 | $6,842,538 | |||||
| Other accumulated loss | (4,954,610) | (11,084) | |||||
| Total accumulated gain/(loss) | $1,343,635 | $7,024,895 | |||||
Differences between book-basis and tax-basis unrealized appreciation is attributable to wash sale deferrals.
| 44 | |
Annual Report 2021 |
| NOTES TO THE FINANCIAL STATEMENTS SEPTEMBER 30, 2021, continued |
NOTE 6 – CREDIT FACILITY
U.S. Bank N.A. had made available a $50 million unsecured line of credit pursuant to a Loan and Security Agreement for the Funds in aggregate to be used temporarily for extraordinary or emergency purposes, including the financing of redemptions. For the year ended September 30, 2021 the average interest rate on the credit facility was the prime rate for each of the Funds. Advances were not collateralized by a first lien against the Funds’ assets. During the year ended September 30, 2021 the Funds had the following:
| Outstanding Daily Average Balance for the Period | Maximum Amounts Outstanding for the Period | Interest Expense for the Period | Average Interest Rate | Outstanding Balance at September 30, 2021 | ||||||||||||
| UPGRADER FUND | $2,532 | $374,000 | $56 | 3.25% | $ — | |||||||||||
| AGGRESSIVE FUND | 2,986 | 697,000 | 100 | 3.25% | — | |||||||||||
| CONSERVATIVE FUND | 4,529 | 628,000 | 152 | 3.25% | — | |||||||||||
| FLEXIBLE INCOME FUND | 4,334 | 230,000 | 367 | 3.25% | — | |||||||||||
| SUSTAINABLE IMPACT FUND | 227 | 74,000 | 8 | 3.25% | — | |||||||||||
NOTE 7 – RULE 12D1-4
In October 2020, the SEC adopted new Rule 12d1-4 under the 1940 Act and other regulatory changes which are expected to be effective on or about January 19, 2022. Those changes are intended to streamline and enhance the regulatory framework for investments by one fund into another fund or ‘fund-of-funds arrangements.’ These regulatory changes may limit a Fund’s ability to pursue its principal investment strategies by investing in other investment companies or pooled investment vehicles or to invest in those investment companies or pooled investment vehicles it believes are most desirable. Management is currently assessing the potential impact of the new rule on the Funds’ financial statements.
| Annual Report 2021 | Fundxfunds.com | 45 |
To the Shareholders and Board of Trustees of
FundX Investment Trust
Opinion on the Financial Statements
We have audited the accompanying statements of assets and liabilities of FundX Upgrader Fund, FundX Aggressive Upgrader Fund, FundX Conservative Upgrader Fund, FundX Flexible Income Fund, and FundX Sustainable Impact Fund (the “Funds”), each a series of FundX Investment Trust (the “Trust”), including the schedules of investments, as of September 30, 2021, the related statements of operations, the statements of changes in net assets and the financial highlights for each of the periods indicated in the table below, and the related notes (collectively referred to as the “financial statements”). In our opinion, the financial statements present fairly, in all material respects, the financial position of the Funds as of September 30, 2021, the results of their operations, the changes in their net assets, and their financial highlights for the periods indicated in the table below, in conformity with accounting principles generally accepted in the United States of America.
|
Individual Funds constituting |
Statement of operations |
Statements of changes in net assets |
Financial highlights |
|
FundX Upgrader Fund, FundX Aggressive Upgrader Fund, FundX Conservative Upgrader Fund, FundX Flexible Income Fund |
For the year ended September 30, 2021 |
For each of the two years in the period ended September 30, 2021 |
For each of the five years in the period ended September 30, 2021 |
|
FundX Sustainable Impact Fund |
For the year ended September 30, 2021 |
For each of the two years in the period ended September 30, 2021 |
For each of the four years in the period ended September 30, 2021 and for the period March 31, 2017 (commencement of operations) through September 30, 2017 |
Basis for Opinion
These financial statements are the responsibility of the Funds’ management. Our responsibility is to express an opinion on the Funds’ financial statements based on our audits. We are a public accounting firm registered with the Public Company Accounting Oversight Board (United States) (“PCAOB”) and are required to be independent with respect to the Funds in accordance with the U.S. federal securities laws and the applicable rules and regulations of the Securities and Exchange Commission and the PCAOB. We have served as the auditor of one or more of the funds in the Trust since 2002.
We conducted our audits in accordance with the standards of the PCAOB. Those standards require that we plan and perform the audits to obtain reasonable assurance about whether the financial statements are free of material misstatement, whether due to error or fraud. The Funds are not required to have, nor were we engaged to perform, an audit of the Funds’ internal control over financial reporting. As part of our audits we are required to obtain an understanding of internal control over financial reporting, but not for the purpose of expressing an opinion on the effectiveness of the Funds’ internal control over financial reporting. Accordingly, we express no such opinion.
Our audits included performing procedures to assess the risks of material misstatement of the financial statements, whether due to error or fraud, and performing procedures that respond to those risks. Such procedures included examining, on a test basis, evidence regarding the amounts and disclosures in the financial statements. Our audits also included evaluating the accounting principles used and significant estimates made by management, as well as evaluating the overall presentation of the financial statements. Our procedures included confirmation of securities owned as of September 30, 2021 by correspondence with the custodian. We believe that our audits provide a reasonable basis for our opinion.
|
|
|
|
|
|
TAIT, WELLER & BAKER LLP |
|

Philadelphia, Pennsylvania
November 19, 2021
|
46 |
|
Annual Report 2021 |
As a shareholder of the FundX Upgrader Funds (the “Funds”), you incur two types of costs: (1) transaction costs and (2) ongoing costs, including investment advisory fees and other Fund expenses. In addition to the costs discussed, the FundX Upgrader Funds also incur aquired fund fees and expenses that are not contemplated in the table below. This example is intended to help you understand your ongoing costs (in dollars) of investing in the Funds and to compare these costs with the ongoing costs of investing in other mutual funds. The example is based on an investment of $1,000 invested at the beginning of the period and held for the entire period.
ACTUAL EXPENSES
The first line of the tables below provides information about actual account values based on actual returns and actual expenses. Although the Funds charge no sales load or other transaction fees, you will be assessed fees for outgoing wire transfers, returned checks and stop payment orders at prevailing rates charged by U.S. Bancorp Fund Services, LLC, the Funds’ transfer agent. If you request that a redemption be made by wire transfer, currently, the Funds’ transfer agent charges a $15.00 fee. Investment Retirement Accounts (“IRA”) will be charged a $15.00 annual maintenance fee. To the extent a Fund invests in shares of other investment companies as part of its investment strategy, you will indirectly bear your proportionate share of any fees and expenses charged by the underlying funds in which the Fund invests in addition to the expenses of the Fund. Actual expenses of the underlying funds may vary. These expenses are not included in the examples below. The examples below include, but are not limited to, investment advisory, shareholder servicing, fund accounting, custody and transfer agent fees. However, the examples below do not include portfolio trading commissions and related expenses, interest expense or dividends on short positions taken by a Fund and other extraordinary expenses as determined under generally accepted accounting principles. You may use the information in this line, together with the amount you invested, to estimate the expenses that you paid over the period. Simply divide your account value by $1,000 (for example, an $8,600 account value divided by $1,000=8.6). Then, multiply the result by the number in the first line under the heading entitled “Expenses Paid During the Period” to estimate the expenses you paid on your account during this period.
HYPOTHETICAL EXAMPLE FOR COMPARISON PURPOSES
The second line of the tables below provides information about hypothetical account values based on a hypothetical return and hypothetical expenses based on a Fund’s actual expense ratio and an assumed rate of return of 5% per year before expenses, which is not the Fund’s actual return. The hypothetical account values and expenses may not be used to estimate the actual ending account balance or expenses you paid for the period. You may use this information to compare the ongoing costs of investing in the Funds and other funds. To do so, compare this 5% hypothetical example with the 5% hypothetical examples that appear in the shareholder reports of the other funds. Please note that the expenses shown in the tables are meant to highlight your ongoing costs only and do not reflect any transactional costs, such as sales charges (loads), redemption fees or exchange fees. Therefore, the second line of the tables are useful in comparing ongoing costs only and will not help you determine the relative total costs of owning different funds. In addition, if these transactional costs were included, your costs would have been higher.
|
|
Beginning Account |
Ending Account |
Expenses Paid |
|
FUNDX UPGRADER FUND |
|
||
|
Actual |
$1,000.00 |
$1,036.10 |
$6.29 |
|
Hypothetical (5% annual return before expenses) |
$1,000.00 |
$1,018.89 |
$6.24 |
|
FUNDX AGGRESSIVE UPGRADER FUND |
|
||
|
Actual |
$1,000.00 |
$974.60 |
$6.63 |
|
Hypothetical (5% annual return before expenses) |
$1,000.00 |
$1,018.35 |
$6.78 |
|
FUNDX CONSERVATIVE UPGRADER FUND |
|
||
|
Actual |
$1,000.00 |
$1,039.60 |
$6.48 |
|
Hypothetical (5% annual return before expenses) |
$1,000.00 |
$1,018.72 |
$6.41 |
|
FUNDX FLEXIBLE INCOME FUND |
|
||
|
Actual |
$1,000.00 |
$1,029.10 |
$4.86 |
|
Hypothetical (5% annual return before expenses) |
$1,000.00 |
$1,020.28 |
$4.84 |
|
FUNDX SUSTAINABLE IMPACT FUND |
|
||
|
Actual |
$1,000.00 |
$1,002.50 |
$6.66 |
|
Hypothetical (5% annual return before expenses) |
$1,000.00 |
$1,018.42 |
$6.71 |
* The calculations are based on expenses incurred during the most recent six-month period. The annualized six-month expense ratios for FundX Upgrader Fund, FundX Aggressive Upgrader Fund, FundX Conservative Upgrader Fund, FundX Flexible Income Fund, and FundX Sustainable Impact Fund were 1.23%, 1.34%, 1.27%, 0.96% and 1.33%, respectively. The dollar amounts shown as expenses paid during the period are equal to the annualized six-month expense ratio multiplied by the average account value during the period, multiplied by 183/365 to reflect the one-half year period.
|
Annual Report 2021 |
Fundxfunds.com |
47 |
The Board is responsible for the overall management of the Trust, including general supervision and review of the investment activities of the Fund. The Board, in turn, elects the officers of the Trust, who are responsible for administering the day-to-day operations of the Trust and its separate series. The current trustees and officers of the Trust, their dates of birth, positions with the Trust, terms of office with the Trust and length of time served, their principal occupations for the past five years and other directorships are set forth in the table below.
|
Name, Address & Age |
Position with the Trust |
Term of Office and Length of Time Served |
Principal Occupation During Past Five Years |
Number of Portfolios in Fund Complex Overseen by Trustees |
Other Directorships Held During the Past 5 Years |
|
Independent Trustees of the Trust (1) |
|||||
|
Jan Gullett |
Trustee |
Indefinite term; Since April 2014 |
Retired, formerly President & Founder, AVANTX, Inc. (a technology firm focused on research and development using dynamic evolution for algorithm based trading signals), 2006-2016. |
5 |
Director, Balco, Inc., (2018-2020). |
|
Gregg B. Keeling |
Lead Independent Trustee |
Indefinite term; Since April 2014 |
Retired; Certified Public Accountant; Acting President of Meridian Fund, Inc. (SEC registered investment company), 2012-2013; CFO of Meridian Fund, Inc. 1999-2013; CCO of Meridian Fund, Inc. and Aster Investment Management Company, Inc. (SEC registered investment adviser) 2004-2013; Vice President of Operations, Aster Investment Management Company, Inc., 1999-2013. |
5 |
None |
|
Kimun Lee |
Trustee |
Indefinite term; Since April 2014 |
Investment Adviser and Principal, Resources Consolidated (Consulting Services) (1980-Present). |
5 |
Director, Board of Firsthand Technology Value Fund, (One Portfolio) (2010-Present). Trustee, Firsthand Funds (two portfolios) (2013-Present). Director of iShares Delaware Trust Sponsor, LLC, an operator that sponsors iShares Gold Trust, iShares Silver Trust, iShares S&P GSCI Commodity-Indexed Trust, and iShares Gold Trust Micro (2009-Present). |
|
Interested Trustees and Officers of the Trust |
|||||
|
Janet Brown |
Chairperson and Interested Trustee |
Indefinite Term; Since March 2014 |
President, FundX Investment Group, LLC since 1978. |
5 |
None |
|
48 |
|
Annual Report 2021 |
|
TRUSTEES AND EXECUTIVE OFFICERS (UNAUDITED), continued |
|
Interested Trustees and Officers of the Trust |
|||||
|
Name, Address & Age |
Position with the Trust |
Term of Office and Length of Time Served |
Principal Occupation During Past Five Years |
Number of Portfolios in Fund Complex Overseen by Trustees |
Other Directorships Held During the Past 5 Years |
|
Jeff Smith (born 1975) |
President |
Indefinite Term; Since March 2018 |
Managing Partner, FundX Investment Group, LLC since 2001. |
N/A |
N/A |
|
Sean McKeon |
Chief Compliance Officer
Treasurer |
Indefinite Term; Since August 2015
Indefinite Term; Since April 2014 |
Portfolio Manager, FundX Investment Group, LLC since 1990. |
N/A |
N/A |
|
William McDonell |
Secretary |
Indefinite Term; Since March 2018 |
Compliance Manager, FundX Investment Group, LLC and FundX Investment Trust, 2016-present; Chief Compliance Officer, Atherton Lane Advisers LLC and Deep Blue Capital Management, L.P., 2008-2016. |
N/A |
N/A |
|
Annual Report 2021 |
Fundxfunds.com |
49 |
| BOARD APPROVAL OF INVESTMENT ADVISORY AGREEMENT |
At a Special Board Meeting held on June 23, 2021 (the “Meeting”), the Fund’s Board of Trustees (the “Board”), by a unanimous vote, including a separate vote of those trustees who are not “interested persons” (as defined in the Investment Company Act of 1940), considered and approved the current investment management agreement (“Current Advisory Agreement”) between the FundX Investment Group, LLC (the “Current Advisor”) and FundX Investment Trust (the “Trust”), on behalf of the FundX Upgrader Fund, FundX Flexible Income Fund, FundX Conservative Upgrader Fund, FundX Aggressive Upgrader Fund, and FundX Sustainable Impact Fund (the “Funds”), for renewal and continuation for an additional term of up to one year through August 4, 2022, or until the Current Advisory Agreement automatically terminates upon the completion of the purchase agreement (the “Transaction”) for a controlling interest in the Current Advisor by One Capital Management, LLC (“OCM”).
In light of the anticipated change of control of the Current Advisor, the Board also considered and approved by a unanimous vote, including a separate vote of those trustees who are not “interested persons”, a new investment advisory agreement (the “New Advisory Agreement”) on behalf of the Funds, as required by Section 15 of the 1940 Act, between the Trust and OCM. The New Advisory Agreement was submitted to and approved by shareholders of the Funds on September 1, 2021.
Upon completion of the change in control, the New Advisory Agreement will remain in effect for a period of two (2) years, unless sooner terminated.
In connection with their deliberations related to both the Current Advisory Agreement and the New Advisory Agreement, the Board (with the advice from independent legal counsel) requested, and both the Current Advisor and OCM provided, all relevant information deemed to be reasonably necessary to ensure that the Board and the Independent Trustees could gain a sufficiently detailed understanding of the services currently provided by the Current Advisor as well as services to be provided by OCM.
The Board considered a variety of factors in connection with its review of both the Current Advisory Agreement and the New Advisory Agreement, also taking into account information provided by the Current Advisor during the course of the year and by OCM as part of the investment management agreement consideration and review process. The following summarizes key factors considered:
The Board noted and duly considered that there are no material differences between the New Advisory Agreement and the Current Advisory Agreement. Additionally, the Board noted that under the terms of the New Advisory Agreement, there will be no change in the day-to-day management of the Funds’ investment portfolios as a result of the change in control, nor will there be any material differences in the investment advisor’s duties or obligations. Also, it was noted that under the terms of the Transaction, key personnel in leadership roles of the Current Advisor are expected remain unchanged after the change in control. The Board noted that its approval of the Current Advisory Agreement was necessary to maintain continuity of services to the Funds during the proxy period, through the date of change in control.
The Board received and reviewed extensive information and documentation from both the Current Advisor and OCM relating to the Transaction and other relevant matters. Factors relating to continuity of investment personnel of the Current Advisor with OCM, historical performance of the Current Advisor, and the resources of OCM, were considered. The Board reviewed detailed information about the Transaction, the structure, operations, organization, personnel, and financial capabilities of OCM and the financial terms of the Transaction. The Board reviewed and discussed the structure of the Transaction with representatives of both the Current Advisor and OCM. Additionally, information and analysis previously provided by the Current Advisor over the course of their service to the Funds was considered in evaluating the New Advisory Agreement. The Board considered such information carefully in conjunction with the other detailed information it received from the Current Advisor in the process of conducting its annual consideration and approval of the continuance of the Current Advisory Agreement. In preparation for the Meeting, the Board was provided with, and the Board reviewed and considered, extensive information regarding the Funds and the Current Advisor, detailing the services provided by the Current Advisor to each of the Funds under the Current Advisory Agreement. The Board in particular noted and considered that there are no material differences between the terms of the New Advisory Agreement and the terms of the Current Advisory Agreement.
In its deliberations, the Board did not identify any single factor or piece of information as all important, controlling, or determinative of its decision to approve the Current Advisory Agreement and the New Advisory Agreement, rather the Board based its determination on the total mix of information available to it, and each Trustee may have attributed different weights to the various factors and information.
| • | In considering the nature, extent, and quality of the services to be provided by the Current Advisor and OCM, the Board considered information it believed necessary to assess the stability and viability of OCM subsequent to the Transaction and to assess the ongoing nature and quality of services to be provided to the Funds both by the Current Advisor preceding the transaction and by OCM following the Transaction. The Board reviewed details of the anticipated equity structure of OCM as a result of the Transaction generally and with respect to the identity and business of the entities and individuals that were expected to become employees of OCM as a result of the Transaction, including the financial resources of those entities and their ability to assist in growing OCM’s business and/or in servicing the Funds. In this regard, the Board considered information about how OCM’s management and operations would be structured following the Transaction, including in particular how the Transaction might affect OCM’s performance or delivery of services under the New Advisory Agreement. The Board considered information addressing the projected benefits to OCM expected to result from the Transaction and information describing how the Transaction may be expected to affect OCM’s business, including key personnel. |
| 50 | |
Annual Report 2021 |
| BOARD APPROVAL OF INVESTMENT ADVISORY AGREEMENT, continued |
In addition, the Board took note of its comprehensive review of the Current Advisor, both at earlier meetings and this Meeting, in connection with the annual approval of the Current Agreement. The Board considered the Current Advisor’s and OCM’s specific responsibilities in all aspects of the day-to-day management of the Funds, as well as the qualifications, experience and responsibilities of the portfolio managers and other key personnel involved in the day-to-day activities of the Funds. The Board reviewed the services that the Current Advisor provides and that OCM would provide to the Funds, noting to what degree those services extend beyond portfolio management. The Trustees also considered the structure of the compliance policies and procedures of the Current Advisor and OCM, including information regarding compliance programs, chief compliance officers, and compliance records and disaster recovery/business continuity plans. The Board also considered the existing relationship between the Current Advisor and the Trust as well as the Board’s knowledge of the Current Advisor’s operations and noted that during the course of the prior year it had met with the Current Advisor to discuss various operational topics, including compliance and investment management processes and methodologies. The Board concluded that the Current Advisor, and by extension as a result of the Transaction, OCM, may be reasonably expected to have sufficient quality and depth of personnel, resources, investment methods and compliance policies and procedures to perform their duties under the New Advisory Agreement, and that, in the Board’s view, the nature, overall quality, and extent of the management services to be provided to the Funds may be expected to continue to be satisfactory.
Based on its review, within the context of its full deliberations, the Board concluded that the Current Advisor and OCM following the Transaction may be reasonably expected to continue to provide the same type and quality of services to the Funds, in particular noting the following:
| • | In assessing the quality of the portfolio management and other services provided by the Current Advisor and to be delivered by OCM, the Board reviewed the performance of the Funds on both an absolute basis and in comparison, to their peer groups and relevant benchmark indices. The Board considered that the Funds had performed in-line relative to their peer groups medians/averages for the one-year and three-year periods as of March 31, 2021. |
| • | Noting that the fees under the New Advisory Agreement are the same as the fees under the Current Agreement, the Board considered its comprehensive review of the cost of the Current Advisor’s services, and the structure and level of advisory fees payable by the Funds, including a comparison of those fees to fees charged by a peer group of funds prepared by Broadridge. The Board considered that though the fees charged by each Fund were above their respective peer group medians/averages, they were still reasonable. The Independent Trustees also considered the fees charged to the Funds in relation to the fees charged to the Current Advisor’s and OCM’s private accounts. They noted that the fees charged to the Funds are not in excess of fees charged to the Current Advisor’s or OCM’s private account clients. The management fees for the Funds were deemed to be reasonable when considered in relation to the additional work the investment advisor is required to perform for Fund shareholder accounts, versus private accounts, in particular with respect to added regulatory compliance burdens, expanded disclosure requirements, record keeping and reporting. |
| • | In considering economies of scale the Board considered the Current Advisor’s assertion that, based on the asset size of the Funds, economies of scale had not yet been achieved. The Board also considered OCM’s commitment to maintain its cap on each Fund’s expenses for a two-year period after the date of the Transaction. The Board further concluded that they would have the opportunity to periodically reexamine whether economies of scale have been achieved. |
| • | The Board took note of its comprehensive review of the profitability of the Current Advisor in its capacity managing the Funds. The Board also considered the assumptions and representations as to OCM’s financial condition, profitability and operations following the Transaction. In assessing both the Current Advisor’s and OCM’s profitability, the Trustees reviewed financial information that was provided and considered both the direct and indirect benefits that may be expected to accrue from managing the Funds. The Board concluded that the Current Advisor’s and OCM’s profits from managing the Funds would not be excessive and after a review of the relevant financial information provided, concluded that the Current Advisor and OCM appeared to have adequate capitalization and may reasonably be expected to maintain adequate profit levels to support the Funds. |
The Board concluded that the investment advisory fees charged by the Current Advisor and fees to be charged by OCM are reasonable and acceptable, based on their consideration and review of the services to be performed and the fees for investment advisory services, in light of overall expense ratios and investment performance of comparable peer group funds.
The Board considered the Funds’ portfolio turnover and brokerage commissions, including “soft dollar” arrangements, and concluded that the Current Advisor and OCM would not unduly benefit from such arrangements or receive other “fall out” benefits related to Fund portfolio trading.
In making their decisions, the Board did not identify any one single factor as being controlling; rather the Board examined, weighted and balanced a combination of factors deemed relevant by the Board.
Based on their evaluation of all the material factors summarized above and assisted by the advice of independent legal counsel to the Independent Trustees, the Board, including the Independent Trustees, concluded that the approval of the renewal and continuation of the Current Advisory Agreement and the approval of the New Advisory Agreement is in the best interests of each Fund and its shareholders.
| Annual Report 2021 | Fundxfunds.com | 51 |
The Funds have adopted and implemented a written liquidity risk management program (the “Program”) as required by Rule 22e-4 under the Investment Company Act 1940. The Program is designed to assess and manage each Fund’s liquidity risk, taking into consideration the Fund’s investment strategy and the liquidity of its portfolio investments during normal and reasonably foreseeable stressed conditions; its short and long-term cash flow projections; and its cash holdings and access to other funding sources. The Funds’ Board of Trustees approved the appointment of the Fund’s Adviser, FundX Investment Group, LLC as the Funds’ liquidity risk management program administrator, which is responsible for the Program’s administration and oversight and for reporting to the Board on at least an annual basis regarding the Program’s operation and effectiveness. The Adviser has formed a Liquidity Risk Management Committee (the “LRMC”) to manage the day-to-day administration of the Program. The LRMC consists of representatives from Adviser’s operations, compliance and information technology departments.
At the Funds’ Board Meeting in August 2021, the LRMC presented its annual assessment of the Program (“Report”) using data collected through June 30, 2021. The purpose of the Report was to address the operation of the Program, to assess its continued adequacy and effectiveness of implementation, and any material changes to the Program. The Report concluded that (i) the Funds did not experience significant liquidity challenges during the covered period (July 1, 2020 – June 30, 2021); (ii) the Fund’s investment strategy is appropriate for the Upgrader Funds; and (iii) the Program is reasonably designed to assess and manage the liquidity risk of the Funds.
|
52 |
|
Annual Report 2021 |
|
VOTING RESULTS OF SPECIAL MEETING OF SHAREHOLDERS (UNAUDITED) |
A special meeting of shareholders (the “Special Meeting”) of the FundX Investment Trust (the “Trust”), and each of its series (each a “Fund,” and collectively, the “Funds”), was held on September 1, 2021. At the Special Meeting, shareholders voted on a proposal to approve a new advisory agreement between One Capital Management, LLC (“OCM”), the new advisor to the Funds, and the Trust. Further details regarding the proposal and the Special Meeting are contained in a definitive proxy statement filed with the SEC on July 8, 2021.
At the Special Meeting held on September 1, 2021, a new advisory agreement between OCM and the Trust was approved by shareholders of the Funds as follows:
|
|
Votes For |
Votes Against |
Abstained |
Broker Non-Votes |
|
UPGRADER FUND |
1,540,966 |
12,251 |
10,264 |
N/A |
|
AGGRESSIVE FUND |
251,951 |
1,429 |
849 |
N/A |
|
CONSERVATIVE FUND |
1,049,972 |
4,489 |
5,688 |
N/A |
|
FLEXIBLE INCOME FUND |
2,391,389 |
12,494 |
418 |
N/A |
|
SUSTAINABLE IMPACT FUND |
609,561 |
0 |
2,045 |
N/A |
|
Annual Report 2021 |
Fundxfunds.com |
53 |
A description of the policies and procedures that the Funds use to determine how to vote proxies relating to portfolio securities is available without charge upon request by calling toll-free at (866) 455-FUND [3863] and by accessing the Funds’ website at www.fundxfunds.com. Furthermore, you can obtain the description on the SEC’s website at www.sec.gov. Information regarding how the Funds voted proxies relating to portfolio securities during the 12-month period ended June 30 is available without charge, by calling toll-free at (866) 455-FUND [3863]. In addition, you can obtain the Funds’ proxy voting records on the SEC’s website at www.sec.gov.
|
INFORMATION ABOUT THE PORTFOLIO HOLDINGS (UNAUDITED) |
The Funds’ Semiannual and Annual Reports include a complete schedule of portfolio holdings for the second and fourth quarters of each fiscal year.
The Funds file their complete schedule of portfolio investments with the SEC for the first and third quarters of each fiscal year on Form N-PORT, and for periods prior to March 31, 2020, on Form N-Q. The Funds’ Form NQ or Part F of Form N-PORT are available on the SEC website at http://www.sec.gov and maybe reviewed and copied at the SEC’s Public Reference Room in Washington, D.C. Information on the operation of the Public Reference Room may be obtained by calling 1-800-SEC-0330.
|
FEDERAL TAX INFORMATION (UNAUDITED) |
For the fiscal year ended September 30, 2021, certain dividends paid by the Funds may qualify as “qualified dividends” which are generally subject to a maximum tax rate of 20%, as provided for by the Jobs and Growth Tax Relief Reconciliation Act of 2003. The percentage of dividends declared from ordinary income designated as qualified dividend income was as follows:
|
UPGRADER |
0.0% |
|
AGGRESSIVE UPGRADER |
0.0% |
|
CONSERVATIVE UPGRADER |
46.77% |
|
FLEXIBLE INCOME |
5.33% |
|
SUSTAINABLE IMPACT |
0.0% |
For corporate shareholders, the percent of ordinary income distributions qualifying for the corporate dividends received deduction for the fiscal year ended September 30, 2021 was as follows:
|
UPGRADER |
0.0% |
|
AGGRESSIVE UPGRADER |
0.0% |
|
CONSERVATIVE UPGRADER |
33.29% |
|
FLEXIBLE INCOME |
4.27% |
|
SUSTAINABLE IMPACT |
0.0% |
The Percentage of taxable ordinary income distributions that are designated as short-term capital gain distributions under Internal Revenue Section 871(k)(2)(c) for each Fund were as follows (unaudited).
|
UPGRADER |
0.0% |
|
AGGRESSIVE UPGRADER |
0.0% |
|
CONSERVATIVE UPGRADER |
0.0% |
|
FLEXIBLE INCOME |
0.0% |
|
SUSTAINABLE IMPACT |
0.0% |
|
54 |
|
Annual Report 2021 |
|
HOUSEHOLDING (UNAUDITED) |
In an effort to conserve resources, the Funds intend to reduce the number of duplicate Prospectuses and Annual and Semi-Annual Reports you receive by sending only one copy of each to addresses where we reasonably believe two or more accounts are from the same family. If you would like to discontinue householding for your accounts, please call toll-free (866) 455-FUND [3863] to request individual copies of these documents. We will begin sending individual copies thirty days after receiving your request to stop householding. This policy does not apply to account statements.
|
INFORMATION ABOUT THE FUNDS’ TRUSTEES (UNAUDITED) |
The Statement of Additional Information (“SAI”) includes additional information about the Funds’ Trustees and is available without charge, upon request, by calling (866) 455-FUND [3863].Furthermore, you can obtain the SAI on the SEC’s website at www.sec.gov or the Funds’ website at www.fundxfunds.com.
|
PRIVACY NOTICE |
The Funds collect non-public information about you from the following sources:
|
● |
Information we receive about you on applications or other forms; |
|
● |
Information you give us orally; and |
|
● |
Information about your transactions with us or others. |
We do not disclose any non-public personal information about our shareholders or former shareholders without the shareholder’s authorization, except as permitted by law or in response to inquiries from governmental authorities. We may share information with affiliated and unaffiliated third parties with whom we have contracts for servicing the Funds. We will provide unaffiliated third parties with only the information necessary to carry out their assigned responsibilities. We maintain physical, electronic and procedural safeguards to guard your non-public personal information and require third parties to treat your non-public personal information with the same high degree of confidentiality.
In the event that you hold shares of a Fund through a financial intermediary, including, but not limited to, a broker-dealer, bank, or trust company, the privacy policy of your financial intermediary would govern how your non-public personal information would be shared by those entities with unaffiliated third parties.
|
Annual Report 2021 |
Fundxfunds.com |
55 |
[THIS PAGE INTENTIONALLY LEFT BLANK]
[THIS PAGE INTENTIONALLY LEFT BLANK]


|
Fund |
Symbol |
CUSIP |
|
FundX Upgrader Fund |
FUNDX |
360876106 |
|
FundX Aggressive Upgrader Fund |
HOTFX |
360876403 |
|
FundX Conservative Upgrader Fund |
RELAX |
360876304 |
|
FundX Flexible Income Fund |
INCMX |
360876205 |
|
FundX Sustainable Impact Fund |
SRIFX |
360876700 |
|
This report is intended for the shareholders of the Fund and may not be used as sales literature unless preceded or accompanied by a current prospectus. |
||
|
|
Contact Us: |
For more about our funds and strategies: 800-763-8639 For account information: 866-455-FUND www.fundxfunds.com |
|
Advisor FundX Investment Group, LLC San Francisco, CA 94104 |
Distributor Milwaukee, WI 53202
|
Transfer Agent U.S.Bancorp Fund Services, LLC |
|
Custodian Milwaukee, WI 53212 |
Independent Registered 1818 Market Street Suite 2400 Philadelphia, PA 19103 |
Legal Counsel |
|
(b)
|
Not applicable.
|
|
FYE 09/30/2021
|
FYE 09/30/2020
|
|
|
Audit Fees
|
$99,000
|
$99,000
|
|
Audit-Related Fees
|
$0
|
$0
|
|
Tax Fees
|
$13,500
|
$13,500
|
|
All Other Fees
|
$0
|
$0
|
|
FYE 09/30/2021
|
FYE 09/30/2020
|
|
|
Audit-Related Fees
|
0%
|
0%
|
|
Tax Fees
|
0%
|
0%
|
|
All Other Fees
|
0%
|
0%
|
|
Non-Audit Related Fees
|
FYE 09/30/2021
|
FYE 09/30/2020
|
|
Registrant
|
None
|
None
|
|
Registrant’s Investment Adviser
|
None
|
None
|
|
(a)
|
Not applicable to registrants who are not listed issuers (as defined in Rule 10A-3 under the Securities Exchange Act of 1934).
|
|
(b)
|
Not applicable.
|
|
(a)
|
Schedule of Investments is included as part of the report to shareholders filed under Item 1 of this Form.
|
|
(b)
|
Not applicable.
|
|
(a)
|
The Registrant’s President/Chief Executive Officer and Treasurer/Chief Financial Officer have reviewed the Registrant’s disclosure controls and procedures (as defined in Rule 30a-3(c) under the Investment Company Act of 1940 (the “Act”))
as of a date within 90 days of the filing of this report, as required by Rule 30a-3(b) under the Act and Rules 13a-15(b) or 15d‑15(b) under the Securities Exchange Act of 1934. Based on their review, such officers have concluded that the
disclosure controls and procedures are effective in ensuring that information required to be disclosed in this report is appropriately recorded, processed, summarized and reported and made known to them by others within the Registrant and by
the Registrant’s service provider.
|
|
(b)
|
There were no changes in the Registrant’s internal control over financial reporting (as defined in Rule 30a-3(d) under the Act) that occurred during the period covered by this report that has materially affected, or is reasonably likely to
materially affect, the Registrant’s internal control over financial reporting.
|
|
1.
|
I have reviewed this report on Form N-CSR of FundX Investment Trust;
|
|
2.
|
Based on my knowledge, this report does not contain any untrue statement of a material fact or omit to state a material fact necessary to make the statements made, in light of the circumstances under which such statements were made,
not misleading with respect to the period covered by this report;
|
|
3.
|
Based on my knowledge, the financial statements, and other financial information included in this report, fairly present in all material respects the financial condition, results of operations, changes in net assets, and cash flows (if
the financial statements are required to include a statement of cash flows) of the registrant as of, and for, the periods presented in this report;
|
|
4.
|
The registrant’s other certifying officer(s) and I are responsible for establishing and maintaining disclosure controls and procedures (as defined in Rule 30a-3(c) under the Investment Company Act of 1940) and internal control over
financial reporting (as defined in Rule 30a-3(d) under the Investment Company Act of 1940) for the registrant and have:
|
|
(a)
|
Designed such disclosure controls and procedures, or caused such disclosure controls and procedures to be designed under our supervision, to ensure that material information relating to the registrant, including its consolidated
subsidiaries, is made known to us by others within those entities, particularly during the period in which this report is being prepared;
|
|
(b)
|
Designed such internal control over financial reporting, or caused such internal control over financial reporting to be designed under our supervision, to provide reasonable assurance regarding the reliability of financial reporting
and the preparation of financial statements for external purposes in accordance with generally accepted accounting principles;
|
|
(c)
|
Evaluated the effectiveness of the registrant’s disclosure controls and procedures and presented in this report our conclusions about the effectiveness of the disclosure controls and procedures, as of a date within 6 months prior to
the filing date of this report based on such evaluation; and
|
|
(d)
|
Disclosed in this report any change in the registrant’s internal control over financial reporting that occurred during the period covered by this report that has materially affected, or is reasonably likely to materially affect, the
registrant’s internal control over financial reporting; and
|
|
5.
|
The registrant’s other certifying officer(s) and I have disclosed to the registrant’s auditors and the audit committee of the registrant’s board of directors (or persons performing the equivalent functions):
|
|
(a)
|
All significant deficiencies and material weaknesses in the design or operation of internal control over financial reporting which are reasonably likely to adversely affect the registrant’s ability to record, process, summarize, and
report financial information; and
|
|
(b)
|
Any fraud, whether or not material, that involves management or other employees who have a significant role in the registrant’s internal control over financial reporting.
|
|
Date: November 28, 2021
|
/s/ Jeff Smith
Jeff Smith President/Principal Executive Officer |
|
1.
|
I have reviewed this report on Form N-CSR of FundX Investment Trust;
|
|
2.
|
Based on my knowledge, this report does not contain any untrue statement of a material fact or omit to state a material fact necessary to make the statements made, in light of the circumstances under which such statements were made,
not misleading with respect to the period covered by this report;
|
|
3.
|
Based on my knowledge, the financial statements, and other financial information included in this report, fairly present in all material respects the financial condition, results of operations, changes in net assets, and cash flows (if
the financial statements are required to include a statement of cash flows) of the registrant as of, and for, the periods presented in this report;
|
|
4.
|
The registrant’s other certifying officer(s) and I are responsible for establishing and maintaining disclosure controls and procedures (as defined in Rule 30a-3(c) under the Investment Company Act of 1940) and internal control over
financial reporting (as defined in Rule 30a-3(d) under the Investment Company Act of 1940) for the registrant and have:
|
|
(a)
|
Designed such disclosure controls and procedures, or caused such disclosure controls and procedures to be designed under our supervision, to ensure that material information relating to the registrant, including its consolidated
subsidiaries, is made known to us by others within those entities, particularly during the period in which this report is being prepared;
|
|
(b)
|
Designed such internal control over financial reporting, or caused such internal control over financial reporting to be designed under our supervision, to provide reasonable assurance regarding the reliability of financial reporting
and the preparation of financial statements for external purposes in accordance with generally accepted accounting principles;
|
|
(c)
|
Evaluated the effectiveness of the registrant’s disclosure controls and procedures and presented in this report our conclusions about the effectiveness of the disclosure controls and procedures, as of a date within 6 months prior to
the filing date of this report based on such evaluation; and
|
|
(d)
|
Disclosed in this report any change in the registrant’s internal control over financial reporting that occurred during the period covered by this report that has materially affected, or is reasonably likely to materially affect, the
registrant’s internal control over financial reporting; and
|
|
5.
|
The registrant’s other certifying officer(s) and I have disclosed to the registrant’s auditors and the audit committee of the registrant’s board of directors (or persons performing the equivalent functions):
|
|
(a)
|
All significant deficiencies and material weaknesses in the design or operation of internal control over financial reporting which are reasonably likely to adversely affect the registrant’s ability to record, process, summarize, and
report financial information; and
|
|
(b)
|
Any fraud, whether or not material, that involves management or other employees who have a significant role in the registrant’s internal control over financial reporting.
|
|
Date: November 28, 2021
|
/s/ Sean McKeon
Sean McKeon Treasurer/Principal Financial Officer |
|
/s/ Jeff Smith
Jeff Smith
President/Principal Executive Officer, FundX Investment Trust
|
/s/ Sean McKeon
Sean McKeon
Treasurer/Principal Financial Officer, FundX Investment Trust
|
|
Dated: November 28, 2021
|
Serious News for Serious Traders! Try StreetInsider.com Premium Free!
You May Also Be Interested In
- Valstybės investicinis kapitalas UAB audited Annual information for the year 2023
- CIDARA Therapeutics ALERT: Bragar Eagel & Squire, P.C. is Investigating Cidara Therapeutics, Inc. on Behalf of Cidara Therapeutics Stockholders and Encourages Investors to Contact the Firm
- Ankur Daga, CEO of Angara, Wins Gold Stevie(R) Award for Best Entrepreneur - Retail in 2024 American Business Awards(R)
Create E-mail Alert Related Categories
SEC FilingsSign up for StreetInsider Free!
Receive full access to all new and archived articles, unlimited portfolio tracking, e-mail alerts, custom newswires and RSS feeds - and more!
