

Form N-CSR FIDELITY INCOME FUND For: Jul 31
 Tweet
Tweet Share
ShareUNITED STATES
SECURITIES AND EXCHANGE COMMISSION
Washington, D.C. 20549
FORM N-CSR
CERTIFIED SHAREHOLDER REPORT OF REGISTERED
MANAGEMENT INVESTMENT COMPANIES
Investment Company Act file number 811-04085
Fidelity Income Fund
(Exact name of registrant as specified in charter)
245 Summer St., Boston, Massachusetts 02210
(Address of principal executive offices) (Zip code)
Cynthia Lo Bessette, Secretary
245 Summer St.
Boston, Massachusetts 02210
(Name and address of agent for service)
Registrant's telephone number, including area code:
617-563-7000
Date of fiscal year end: | July 31 |
Date of reporting period: | July 31, 2021 |
Item 1.
Reports to Stockholders
Fidelity® GNMA Fund
July 31, 2021

Contents
To view a fund's proxy voting guidelines and proxy voting record for the 12-month period ended June 30, visit http://www.fidelity.com/proxyvotingresults or visit the Securities and Exchange Commission's (SEC) web site at http://www.sec.gov.
You may also call 1-800-544-8544 to request a free copy of the proxy voting guidelines.
Standard & Poor's, S&P and S&P 500 are registered service marks of The McGraw-Hill Companies, Inc. and have been licensed for use by Fidelity Distributors Corporation.
Other third-party marks appearing herein are the property of their respective owners.
All other marks appearing herein are registered or unregistered trademarks or service marks of FMR LLC or an affiliated company. © 2021 FMR LLC. All rights reserved.
This report and the financial statements contained herein are submitted for the general information of the shareholders of the Fund. This report is not authorized for distribution to prospective investors in the Fund unless preceded or accompanied by an effective prospectus.
A fund files its complete schedule of portfolio holdings with the SEC for the first and third quarters of each fiscal year on Form N-PORT. Forms N-PORT are available on the SEC’s web site at http://www.sec.gov. A fund's Forms N-PORT may be reviewed and copied at the SEC’s Public Reference Room in Washington, DC. Information regarding the operation of the SEC's Public Reference Room may be obtained by calling 1-800-SEC-0330.
For a complete list of a fund's portfolio holdings, view the most recent holdings listing, semiannual report, or annual report on Fidelity's web site at http://www.fidelity.com, http://www.institutional.fidelity.com, or http://www.401k.com, as applicable.
NOT FDIC INSURED •MAY LOSE VALUE •NO BANK GUARANTEE
Neither the Fund nor Fidelity Distributors Corporation is a bank.
Note to Shareholders:
Early in 2020, the outbreak and spread of a new coronavirus emerged as a public health emergency that had a major influence on financial markets, primarily based on its impact on the global economy and the outlook for corporate earnings. The virus causes a respiratory disease known as COVID-19. On March 11, 2020 the World Health Organization declared the COVID-19 outbreak a pandemic, citing sustained risk of further global spread.
In the weeks following, as the crisis worsened, we witnessed an escalating human tragedy with wide-scale social and economic consequences from coronavirus-containment measures. The outbreak of COVID-19 prompted a number of measures to limit the spread, including travel and border restrictions, quarantines, and restrictions on large gatherings. In turn, these resulted in lower consumer activity, diminished demand for a wide range of products and services, disruption in manufacturing and supply chains, and – given the wide variability in outcomes regarding the outbreak – significant market uncertainty and volatility. Amid the turmoil, global governments and central banks took unprecedented action to help support consumers, businesses, and the broader economies, and to limit disruption to financial systems.
The situation continues to unfold, and the extent and duration of its impact on financial markets and the economy remain highly uncertain. Extreme events such as the coronavirus crisis are “exogenous shocks” that can have significant adverse effects on mutual funds and their investments. Although multiple asset classes may be affected by market disruption, the duration and impact may not be the same for all types of assets.
Fidelity is committed to helping you stay informed amid news about COVID-19 and during increased market volatility, and we’re taking extra steps to be responsive to customer needs. We encourage you to visit our websites, where we offer ongoing updates, commentary, and analysis on the markets and our funds.
Performance: The Bottom Line
Average annual total return reflects the change in the value of an investment, assuming reinvestment of distributions from dividend income and capital gains (the profits earned upon the sale of securities that have grown in value, if any) and assuming a constant rate of performance each year. The hypothetical investment and the average annual total returns do not reflect the deduction of taxes that a shareholder would pay on fund distributions or the redemption of fund shares. During periods of reimbursement by Fidelity, a fund’s total return will be greater than it would be had the reimbursement not occurred. How a fund did yesterday is no guarantee of how it will do tomorrow.
Average Annual Total Returns
| For the periods ended July 31, 2021 | Past 1 year | Past 5 years | Past 10 years |
| Fidelity® GNMA Fund | 0.27% | 2.06% | 2.43% |
$10,000 Over 10 Years
Let's say hypothetically that $10,000 was invested in Fidelity® GNMA Fund on July 31, 2011.
The chart shows how the value of your investment would have changed, and also shows how the Bloomberg GNMA Index performed over the same period.

| Period Ending Values | ||
|
| $12,718 | Fidelity® GNMA Fund |
|
| $12,649 | Bloomberg GNMA Index |
Effective August 24, 2021, all Bloomberg Barclays Indices were re-branded as Bloomberg Indices.
Management's Discussion of Fund Performance
Market Recap: U.S. taxable investment-grade bonds posted a modest decline for the 12 months ending July 31, 2021, hampered mostly by their poor performance in the first quarter of 2021. The Bloomberg U.S. Aggregate Bond Index returned -0.70% for the period. In February 2021, bond yields rose notably because a $1.9 trillion COVID-relief bill offered hopes for a broad economic recovery. But this led to rising inflation expectations and higher bond yields, which persisted through the end of April. Many investors preferred the potential for higher returns in riskier markets as the worst economic fears related to the spread of COVID-19 retreated. Bond yields fell significantly from May through the end of July in response to weaker-than-expected economic data. Bonds were further boosted by growing risks from the delta variant of the coronavirus and assurances by the U.S. Federal Reserve that a tapering of monetary support remained a ways off. Within the Bloomberg index, corporate bonds rose 1.42% for the 12 months, significantly topping the -3.01% return of U.S. Treasuries. Mortgage-backed securities, meanwhile, posted a gain of 0.03%, outpacing Treasuries and the broader taxable bond market. Outside the index, U.S. corporate high-yield bonds added 10.62% and Treasury Inflation-Protected Securities (TIPS) rose 6.90%. Comments from Co-Portfolio Managers Franco Castagliuolo and Sean Corcoran: For the fiscal year, the fund returned 0.27%, outpacing, net of fees, the -0.41% return of the benchmark, the Bloomberg GNMA Index. In managing the fund, we attempted to exploit market inefficiencies and identify attractively valued securities in accordance with our longer-term strategy. In doing so, we added value through security selection among conventional 30-year GNMA securities. Specifically, it helped to overweight bonds with coupons above 3%. They outpaced bonds with coupons of 2.5% and below, in which the fund was underweight. Security selection among higher-coupon bonds also aided performance. Here, our focus on bonds with some resistance to prepayment helped, as they outpaced GNMAs with similar coupons that proved more vulnerable to being prepaid as mortgage rates remained low and the housing market strengthened. Sector allocation also boosted the fund’s relative return. Non-benchmark exposure to GNMAs backed by reverse mortgages, which are not included in the index, contributed relative to the GNMA index. In contrast, yield-curve positioning detracted from relative performance, particularly the fund’s overweighting in longer-term securities. The fund’s small out-of-index exposure to conventional mortgages, meaning those that are not offered or secured by a government entity, also detracted.The views expressed above reflect those of the portfolio manager(s) only through the end of the period as stated on the cover of this report and do not necessarily represent the views of Fidelity or any other person in the Fidelity organization. Any such views are subject to change at any time based upon market or other conditions and Fidelity disclaims any responsibility to update such views. These views may not be relied on as investment advice and, because investment decisions for a Fidelity fund are based on numerous factors, may not be relied on as an indication of trading intent on behalf of any Fidelity fund.
Investment Summary (Unaudited)
Coupon Distribution as of July 31, 2021
| % of fund's investments | |
| 0.01 - 0.99% | 7.0 |
| 1 - 1.99% | 0.1 |
| 2 - 2.99% | 21.3 |
| 3 - 3.99% | 38.3 |
| 4 - 4.99% | 8.2 |
| 5 - 5.99% | 3.4 |
| 6 - 6.99% | 0.8 |
| 7 - 7.99% | 0.4 |
| 8% and above | 0.7 |
Coupon distribution shows the range of stated interest rates on the fund's investments, excluding short-term investments.
Asset Allocation (% of fund's net assets)
| As of July 31, 2021*,**,*** | ||
| Mortgage Securities | 104.2% | |
| CMOs and Other Mortgage Related Securities | 19.1% | |
| U.S. Treasury Obligations | 0.1% | |
| Short-Term Investments and Net Other Assets (Liabilities)† | (23.4)% | |

* GNMA Securities - 103.8%
** Futures and Swaps - 19.4%
*** Written options - (5.0)%
† Short-Term Investments and Net Other Assets (Liabilities) are not included in the pie chart
Percentages in the above tables are adjusted for the effect of TBA Sale Commitments.
Schedule of Investments July 31, 2021
Showing Percentage of Net Assets
| U.S. Government and Government Agency Obligations - 0.1% | |||
| Principal Amount (000s) | Value (000s) | ||
| U.S. Treasury Obligations - 0.1% | |||
| U.S. Treasury Notes 1.25% 6/30/28 | |||
| (Cost $4,885) | 4,888 | 4,971 | |
| U.S. Government Agency - Mortgage Securities - 104.2% | |||
| Fannie Mae - 0.1% | |||
| 12 month U.S. LIBOR + 1.460% 2.016% 1/1/35 (a)(b) | 42 | 44 | |
| 12 month U.S. LIBOR + 1.480% 2.083% 7/1/34 (a)(b) | 12 | 13 | |
| 12 month U.S. LIBOR + 1.530% 1.91% 3/1/36 (a)(b) | 43 | 45 | |
| 12 month U.S. LIBOR + 1.620% 2.036% 3/1/33 (a)(b) | 55 | 57 | |
| 12 month U.S. LIBOR + 1.630% 2.269% 5/1/35 (a)(b) | 133 | 139 | |
| 12 month U.S. LIBOR + 1.640% 2.096% 6/1/47 (a)(b) | 91 | 97 | |
| 12 month U.S. LIBOR + 1.670% 2.077% 11/1/36 (a)(b) | 72 | 75 | |
| 12 month U.S. LIBOR + 1.710% 2.377% 8/1/35 (a)(b) | 125 | 132 | |
| 12 month U.S. LIBOR + 1.890% 2.2% 8/1/35 (a)(b) | 90 | 95 | |
| 6 month U.S. LIBOR + 1.510% 1.76% 2/1/33 (a)(b) | 9 | 9 | |
| 6 month U.S. LIBOR + 1.530% 1.785% 12/1/34 (a)(b) | 21 | 22 | |
| 6 month U.S. LIBOR + 1.530% 1.785% 3/1/35 (a)(b) | 25 | 26 | |
| 6 month U.S. LIBOR + 1.550% 1.8% 9/1/33 (a)(b) | 174 | 181 | |
| 6 month U.S. LIBOR + 1.550% 1.8% 10/1/33 (a)(b) | 8 | 9 | |
| 6 month U.S. LIBOR + 1.560% 1.815% 7/1/35 (a)(b) | 14 | 15 | |
| U.S. TREASURY 1 YEAR INDEX + 2.180% 2.328% 7/1/36 (a)(b) | 51 | 54 | |
| U.S. TREASURY 1 YEAR INDEX + 2.280% 2.417% 10/1/33 (a)(b) | 23 | 25 | |
| U.S. TREASURY 1 YEAR INDEX + 2.460% 2.585% 9/1/34 (a)(b) | 225 | 237 | |
| U.S. TREASURY 1 YEAR INDEX + 2.460% 2.602% 7/1/34 (a)(b) | 309 | 325 | |
| 3% 2/1/33 to 3/1/33 | 3,095 | 3,273 | |
| 8.5% 12/1/27 | 20 | 23 | |
| 9.5% 9/1/30 | 9 | 11 | |
| 4,907 | |||
| Freddie Mac - 0.3% | |||
| 12 month U.S. LIBOR + 1.510% 2.015% 11/1/35 (a)(b) | 37 | 39 | |
| 12 month U.S. LIBOR + 1.600% 1.85% 7/1/35 (a)(b) | 46 | 49 | |
| 12 month U.S. LIBOR + 1.860% 2.114% 4/1/36 (a)(b) | 57 | 60 | |
| 12 month U.S. LIBOR + 1.860% 2.529% 8/1/34 (a)(b) | 78 | 82 | |
| 12 month U.S. LIBOR + 1.960% 2.211% 6/1/33 (a)(b) | 317 | 334 | |
| 12 month U.S. LIBOR + 2.030% 2.567% 3/1/33 (a)(b) | 2 | 2 | |
| 6 month U.S. LIBOR + 1.580% 1.83% 12/1/35 (a)(b) | 6 | 6 | |
| 6 month U.S. LIBOR + 1.880% 2.135% 10/1/36 (a)(b) | 177 | 185 | |
| 6 month U.S. LIBOR + 1.990% 2.247% 10/1/35 (a)(b) | 73 | 76 | |
| U.S. TREASURY 1 YEAR INDEX + 2.030% 2.158% 6/1/33 (a)(b) | 142 | 150 | |
| U.S. TREASURY 1 YEAR INDEX + 2.230% 2.382% 12/1/35 (a)(b) | 650 | 688 | |
| U.S. TREASURY 1 YEAR INDEX + 2.260% 2.389% 6/1/33 (a)(b) | 235 | 247 | |
| U.S. TREASURY 1 YEAR INDEX + 2.430% 2.566% 3/1/35 (a)(b) | 505 | 532 | |
| 3% 2/1/34 to 4/1/34 | 8,702 | 9,177 | |
| 11,627 | |||
| Ginnie Mae - 103.8% | |||
| 3% 5/15/27 to 5/20/51 | 771,043 | 812,419 | |
| 3.7% 10/15/42 | 5,148 | 5,607 | |
| 4% 5/15/44 | 1,318 | 1,454 | |
| 4.5% 7/15/33 to 10/20/41 | 80,925 | 91,541 | |
| 4.75% 7/15/40 | 559 | 640 | |
| 4.875% 9/15/39 to 12/15/39 | 4,318 | 4,950 | |
| 5.09% 4/15/36 to 11/15/36 | 3,822 | 4,334 | |
| 5.15% 2/15/36 to 4/15/36 | 359 | 407 | |
| 5.2% 7/15/36 | 57 | 65 | |
| 5.25% 4/15/36 to 4/15/37 | 353 | 401 | |
| 5.39% 5/15/36 | 80 | 92 | |
| 5.45% 2/15/37 | 516 | 594 | |
| 5.5% 7/20/24 to 2/20/42 | 5,488 | 6,303 | |
| 5.6% 11/15/36 | 205 | 237 | |
| 5.65% 4/15/37 | 55 | 61 | |
| 5.85% 1/15/37 | 58 | 68 | |
| 6.45% 1/15/32 to 8/15/32 | 181 | 209 | |
| 6.5% 7/15/23 to 1/15/39 | 4,659 | 5,405 | |
| 7% to 7% 4/15/22 to 9/20/34 | 9,136 | 10,475 | |
| 7.25% 9/15/27 | 28 | 31 | |
| 7.5% to 7.5% 2/15/22 to 9/20/32 | 3,412 | 3,890 | |
| 8% 12/15/21 to 9/15/31 | 859 | 971 | |
| 8.5% 12/15/21 to 2/15/31 | 124 | 148 | |
| 9% 12/15/21 to 5/15/30 | 6 | 6 | |
| 2% 8/1/51 (c) | 29,750 | 30,471 | |
| 2% 8/1/51 (c) | 64,450 | 66,011 | |
| 2% 8/1/51 (c) | 64,700 | 66,267 | |
| 2% 8/1/51 (c) | 67,700 | 69,340 | |
| 2% 8/1/51 (c) | 47,400 | 48,548 | |
| 2% 8/1/51 (c) | 54,000 | 55,308 | |
| 2% 8/1/51 (c) | 45,550 | 46,653 | |
| 2% 8/1/51 (c) | 33,650 | 34,465 | |
| 2% 8/1/51 (c) | 45,300 | 46,397 | |
| 2% 9/1/51 (c) | 99,800 | 102,042 | |
| 2.25% 5/20/50 | 2,991 | 3,088 | |
| 2.375% 5/20/50 | 1,738 | 1,801 | |
| 2.5% 3/15/28 to 4/20/51 | 413,849 | 431,163 | |
| 2.5% 8/1/51 (c) | 57,650 | 59,945 | |
| 2.5% 8/1/51 (c) | 70,100 | 72,891 | |
| 2.5% 8/1/51 (c) | 38,200 | 39,721 | |
| 2.5% 8/1/51 (c) | 32,450 | 33,742 | |
| 2.5% 8/1/51 (c) | 32,550 | 33,846 | |
| 2.5% 8/1/51 (c) | 32,550 | 33,846 | |
| 2.625% 5/20/50 | 5,539 | 5,771 | |
| 2.75% 5/20/50 | 2,056 | 2,145 | |
| 3% 8/1/51 (c) | 67,900 | 71,053 | |
| 3% 8/1/51 (c) | 29,100 | 30,451 | |
| 3% 8/1/51 (c) | 49,450 | 51,747 | |
| 3% 8/1/51 (c) | 29,600 | 30,975 | |
| 3% 8/1/51 (c) | 42,700 | 44,683 | |
| 3% 8/1/51 (c) | 41,750 | 43,689 | |
| 3% 8/1/51 (c) | 29,800 | 31,184 | |
| 3% 8/1/51 (c) | 14,800 | 15,487 | |
| 3% 9/1/51 (c) | 52,150 | 54,488 | |
| 3% 9/1/51 (c) | 51,850 | 54,175 | |
| 3% 9/1/51 (c) | 31,100 | 32,495 | |
| 3% 9/1/51 (c) | 40,150 | 41,950 | |
| 3.25% 2/20/41 to 7/20/46 | 1,721 | 1,799 | |
| 3.375% 5/20/50 | 1,039 | 1,091 | |
| 3.5% to 3.5% 9/15/26 to 11/20/50 (d)(e) | 513,788 | 553,168 | |
| 3.5% 8/1/51 (c) | 4,100 | 4,307 | |
| 3.5% 8/1/51 (c) | 6,850 | 7,196 | |
| 3.5% 8/1/51 (c) | 12,700 | 13,341 | |
| 3.5% 8/1/51 (c) | 21,200 | 22,270 | |
| 3.5% 8/1/51 (c) | 25,900 | 27,208 | |
| 3.5% 8/1/51 (c) | 58,000 | 60,928 | |
| 3.5% 8/1/51 (c) | 59,750 | 62,767 | |
| 3.5% 8/1/51 (c) | 56,350 | 59,195 | |
| 3.5% 8/1/51 (c) | 5,550 | 5,830 | |
| 3.5% 8/1/51 (c) | 22,300 | 23,426 | |
| 3.5% 8/1/51 (c) | 22,300 | 23,426 | |
| 3.5% 8/1/51 (c) | 5,550 | 5,830 | |
| 3.5% 8/1/51 (c) | 33,500 | 35,191 | |
| 3.5% 9/1/51 (c) | 2,400 | 2,522 | |
| 3.5% 9/1/51 (c) | 16,000 | 16,811 | |
| 3.74% 7/20/42 to 8/20/42 | 683 | 742 | |
| 3.75% 10/20/41 to 7/20/47 | 21,562 | 23,160 | |
| 4% 2/20/33 to 1/20/50 | 291,500 | 317,990 | |
| 4.25% 1/20/46 | 477 | 517 | |
| 5% 6/20/29 to 7/20/48 | 65,423 | 73,644 | |
| 5.35% 4/20/29 to 12/20/30 | 5,821 | 6,398 | |
| 5.75% 9/20/39 to 9/20/40 | 9,116 | 10,507 | |
| 6% to 6% 12/15/23 to 3/15/39 | 8,292 | 9,517 | |
| 7.395% 6/20/25 to 2/20/27 | 179 | 197 | |
| 4,105,124 | |||
| TOTAL U.S. GOVERNMENT AGENCY - MORTGAGE SECURITIES | |||
| (Cost $4,052,860) | 4,121,658 | ||
| Collateralized Mortgage Obligations - 16.1% | |||
| U.S. Government Agency - 16.1% | |||
| Fannie Mae: | |||
| planned amortization class Series G93-32 Class PJ, 6.75% 9/25/23 | $373 | $393 | |
| Series 2016-3 Class IP, 4% 2/25/46 (f) | 25,715 | 3,628 | |
| Series 2016-78 Class IO, 3.5% 11/25/46 (f) | 6,241 | 814 | |
| Series 2017-74 Class SH, 6.200% - 1 month U.S. LIBOR 6.1108% 10/25/47 (a)(f)(g) | 22,095 | 3,776 | |
| Fannie Mae Stripped Mortgage-Backed Securities: | |||
| Series 331 Class 12, 6.5% 2/25/33 (a)(f) | 142 | 28 | |
| Series 339 Class 5, 5.5% 7/25/33 (f) | 179 | 32 | |
| Series 343 Class 16, 5.5% 5/25/34 (f) | 157 | 25 | |
| Freddie Mac: | |||
| planned amortization class: | |||
| Series 2220 Class PD, 8% 3/15/30 | 390 | 460 | |
| Series 40 Class K, 6.5% 8/17/24 | 41 | 44 | |
| sequential payer Series 2204 Class N, 7.5% 12/20/29 | 696 | 813 | |
| Series 2018-4763 Class SC, 6.200% - 1 month U.S. LIBOR 6.1069% 8/15/47 (a)(f)(g) | 10,613 | 1,497 | |
| Ginnie Mae Series 2011-93 Class SA, 6.660% - 1 month U.S. LIBOR 6.5764% 7/20/41 (a)(f)(g) | 10,009 | 2,284 | |
| Ginnie Mae guaranteed REMIC pass-thru certificates: | |||
| floater: | |||
| Series 2007-37 Class TS, 6.690% - 1 month U.S. LIBOR 6.5989% 6/16/37 (a)(f)(g) | 884 | 195 | |
| Series 2008-51 Class FE, 1 month U.S. LIBOR + 0.750% 0.8411% 6/16/38 (a)(b) | 201 | 206 | |
| Series 2008-57 Class AF, 1 month U.S. LIBOR + 0.580% 0.6636% 7/20/38 (a)(b) | 583 | 593 | |
| Series 2010-130 Class KF, 1 month U.S. LIBOR + 0.650% 0.7411% 10/16/40 (a)(b) | 1,177 | 1,199 | |
| Series 2010-H03 Class FA, 1 month U.S. LIBOR + 0.550% 0.6461% 3/20/60 (a)(b)(h) | 12,362 | 12,419 | |
| Series 2010-H17 Class FA, 1 month U.S. LIBOR + 0.330% 0.4261% 7/20/60 (a)(b)(h) | 8,808 | 8,811 | |
| Series 2010-H18 Class AF, 1 month U.S. LIBOR + 0.300% 0.3888% 9/20/60 (a)(b)(h) | 10,480 | 10,476 | |
| Series 2010-H19 Class FG, 1 month U.S. LIBOR + 0.300% 0.3888% 8/20/60 (a)(b)(h) | 10,216 | 10,212 | |
| Series 2010-H27 Class FA, 1 month U.S. LIBOR + 0.380% 0.4688% 12/20/60 (a)(b)(h) | 3,606 | 3,611 | |
| Series 2011-H05 Class FA, 1 month U.S. LIBOR + 0.500% 0.5888% 12/20/60 (a)(b)(h) | 4,504 | 4,521 | |
| Series 2011-H07 Class FA, 1 month U.S. LIBOR + 0.500% 0.5888% 2/20/61 (a)(b)(h) | 1,345 | 1,349 | |
| Series 2011-H12 Class FA, 1 month U.S. LIBOR + 0.490% 0.5788% 2/20/61 (a)(b)(h) | 8,457 | 8,481 | |
| Series 2011-H13 Class FA, 1 month U.S. LIBOR + 0.500% 0.5888% 4/20/61 (a)(b)(h) | 3,786 | 3,801 | |
| Series 2011-H14: | |||
| Class FB, 1 month U.S. LIBOR + 0.500% 0.5888% 5/20/61 (a)(b)(h) | 5,551 | 5,573 | |
| Class FC, 1 month U.S. LIBOR + 0.500% 0.5888% 5/20/61 (a)(b)(h) | 4,485 | 4,502 | |
| Series 2011-H17 Class FA, 1 month U.S. LIBOR + 0.530% 0.6188% 6/20/61 (a)(b)(h) | 5,562 | 5,586 | |
| Series 2011-H21 Class FA, 1 month U.S. LIBOR + 0.600% 0.7% 10/20/61 (a)(b)(h) | 6,129 | 6,166 | |
| Series 2012-48 Class FA, 1 month U.S. LIBOR + 0.350% 0.4411% 4/16/42 (a)(b) | 417 | 420 | |
| Series 2012-76 Class GF 1 month U.S. LIBOR + 0.300% 0.3911% 6/16/42 (a)(b) | 479 | 481 | |
| Series 2012-H01 Class FA, 1 month U.S. LIBOR + 0.700% 0.7888% 11/20/61 (a)(b)(h) | 5,993 | 6,041 | |
| Series 2012-H03 Class FA, 1 month U.S. LIBOR + 0.700% 0.7888% 1/20/62 (a)(b)(h) | 4,102 | 4,133 | |
| Series 2012-H06 Class FA, 1 month U.S. LIBOR + 0.630% 0.7188% 1/20/62 (a)(b)(h) | 5,787 | 5,825 | |
| Series 2012-H07 Class FA, 1 month U.S. LIBOR + 0.630% 0.7188% 3/20/62 (a)(b)(h) | 3,775 | 3,796 | |
| Series 2012-H21 Class DF, 1 month U.S. LIBOR + 0.650% 0.7388% 5/20/61 (a)(b)(h) | 37 | 37 | |
| Series 2012-H26, Class CA, 1 month U.S. LIBOR + 0.530% 0.6188% 7/20/60 (a)(b)(h) | 94 | 94 | |
| Series 2015-H13 Class FL, 1 month U.S. LIBOR + 0.280% 0.3688% 5/20/63 (a)(b)(h) | 68 | 68 | |
| Series 2015-H19 Class FA, 1 month U.S. LIBOR + 0.200% 0.2888% 4/20/63 (a)(b)(h) | 52 | 52 | |
| Series 2016-12 Class FA, 1 month U.S. LIBOR + 0.350% 0.4336% 1/20/46 (a)(b) | 1,270 | 1,276 | |
| Series 2019-143 Class CF, 1 month U.S. LIBOR + 0.450% 0.5336% 11/20/49 (a)(b) | 42,927 | 43,324 | |
| Series 2019-42 Class FK, 1 month U.S. LIBOR + 0.450% 0.5336% 4/20/49 (a)(b) | 8,034 | 8,118 | |
| Series 2019-45 Class KF, 1 month U.S. LIBOR + 0.500% 0.5836% 4/20/49 (a)(b) | 30,807 | 31,163 | |
| floater planned amortization class: | |||
| Series 2020-18 Class GF, 1 month U.S. LIBOR + 0.450% 0.5336% 2/20/50 (a)(b) | 18,098 | 18,266 | |
| Series 2020-76 Class KF, 1 month U.S. LIBOR + 0.400% 0.4836% 5/20/50 (a)(b) | 44,781 | 45,075 | |
| planned amortization class: | |||
| Series 2003-74 Class PZ, 5.5% 8/20/33 | 3,971 | 4,512 | |
| Series 2004-19 Class DP, 5.5% 3/20/34 | 6 | 6 | |
| Series 2005-24 Class TC, 5.5% 3/20/35 | 2,631 | 2,956 | |
| Series 2005-57 Class PB, 5.5% 7/20/35 | 4,050 | 4,657 | |
| Series 2006-50 Class JC, 5% 6/20/36 | 1,085 | 1,153 | |
| Series 2010-117 Class E, 3% 10/20/39 | 1,294 | 1,300 | |
| Series 2010-158 Class MS, 10.000% - 1 month U.S. LIBOR 9.8327% 12/20/40 (a)(g) | 3,291 | 3,930 | |
| Series 2010-160 Class MX, 4.5% 8/20/39 | 384 | 385 | |
| Series 2011-136 Class WI, 4.5% 5/20/40 (f) | 428 | 28 | |
| Series 2015-24 Class PI, 3.5% 2/20/45 (f) | 12,518 | 1,672 | |
| Series 2016-69 Class WA, 3% 2/20/46 | 1,554 | 1,653 | |
| Series 2017-134 Class BA, 2.5% 11/20/46 | 712 | 741 | |
| Series 2017-139 Class K, 3% 8/20/47 | 26,389 | 27,329 | |
| Series 2017-153 Class GA, 3% 9/20/47 | 4,595 | 4,867 | |
| Series 2017-182 Class KA, 3% 10/20/47 | 3,778 | 4,000 | |
| Series 2018-13 Class Q, 3% 4/20/47 | 5,247 | 5,417 | |
| sequential payer: | |||
| Series 2003-75 Class ZA, 5.5% 9/20/33 | 1,170 | 1,338 | |
| Series 2004-24 Class ZM, 5% 4/20/34 | 2,510 | 2,806 | |
| Series 2004-46 Class BZ, 6% 6/20/34 | 1,487 | 1,739 | |
| Series 2004-86 Class G, 6% 10/20/34 | 6,273 | 7,625 | |
| Series 2005-26 Class ZA, 5.5% 1/20/35 | 11,155 | 12,617 | |
| Series 2005-47 Class ZY, 6% 6/20/35 | 7,903 | 9,102 | |
| Series 2005-6 Class EX, 5.5% 11/20/34 | 1,001 | 1,195 | |
| Series 2005-82 Class JV, 5% 6/20/35 | 2,161 | 2,448 | |
| Series 2006-2 Class Z, 5.5% 1/20/36 | 4,968 | 5,703 | |
| Series 2010-160 Class DY, 4% 12/20/40 | 21,756 | 23,638 | |
| Series 2010-168 Class BG, 4% 4/20/40 | 8,727 | 9,432 | |
| Series 2010-170 Class B, 4% 12/20/40 | 3,493 | 3,796 | |
| Series 2011-21 Class SB, 9.500% - 1 month U.S. LIBOR 9.3177% 2/16/41 (a)(g) | 7,929 | 9,304 | |
| Series 2011-29 Class BV, 5% 5/20/40 | 4,984 | 5,018 | |
| Series 2011-72 Class SE, 7.420% - 1 month U.S. LIBOR 7.2924% 5/16/41 (a)(g) | 14,204 | 16,078 | |
| Series 2017-139 Class BA, 3% 9/20/47 | 7,819 | 8,380 | |
| Series 2018-H12 Class HA, 3.25% 8/20/68 (h) | 19,925 | 21,082 | |
| Series 2004-32: | |||
| Class GS, 6.500% - 1 month U.S. LIBOR 6.4089% 5/16/34 (a)(f)(g) | 280 | 54 | |
| Class SG, 6.500% - 1 month U.S. LIBOR 6.4164% 3/20/33 (a)(f)(g) | 3,983 | 679 | |
| Series 2004-59 Class SC, 7.200% - 1 month U.S. LIBOR 7.1089% 8/16/34 (a)(f)(g) | 1,637 | 368 | |
| Series 2004-73 Class AL, 7.200% - 1 month U.S. LIBOR 7.1089% 8/17/34 (a)(f)(g) | 502 | 114 | |
| Series 2005-13 Class SA, 6.800% - 1 month U.S. LIBOR 6.7164% 2/20/35 (a)(f)(g) | 2,855 | 589 | |
| Series 2005-6 Class EY, 5.5% 11/20/33 | 1,016 | 1,192 | |
| Series 2005-82 Class NS, 6.300% - 1 month U.S. LIBOR 6.2164% 7/20/34 (a)(f)(g) | 2,910 | 594 | |
| Series 2006-13 Class DS, 11.100% - 1 month U.S. LIBOR 10.9746% 3/20/36 (a)(g) | 2,880 | 3,664 | |
| Series 2007-35 Class SC, 40.200% - 1 month U.S. LIBOR 39.6532% 6/16/37 (a)(g) | 764 | 1,377 | |
| Series 2009-13 Class E, 4.5% 3/16/39 | 2,466 | 2,755 | |
| Series 2009-42 Class AY, 5% 6/16/37 | 1,653 | 1,856 | |
| Series 2010-14 Class SN, 5.950% - 1 month U.S. LIBOR 5.8589% 2/16/40 (a)(f)(g) | 2,085 | 352 | |
| Series 2010-H10 Class FA, 1 month U.S. LIBOR + 0.330% 0.4261% 5/20/60 (a)(b)(h) | 5,515 | 5,517 | |
| Series 2011-52 Class HI, 7% 4/16/41 (f) | 412 | 79 | |
| Series 2011-54 Class SA, 6.000% - 1 month U.S. LIBOR 5.9164% 4/20/41 (a)(f)(g) | 4,764 | 879 | |
| Series 2012-103 Class IL, 3% 8/20/27 (f) | 14,224 | 796 | |
| Series 2012-75 Class SA, 6.050% - 1 month U.S. LIBOR 5.9664% 6/20/42 (a)(f)(g) | 8,940 | 1,902 | |
| Series 2012-76 Class GS, 6.700% - 1 month U.S. LIBOR 6.6089% 6/16/42 (a)(f)(g) | 1,453 | 306 | |
| Series 2013-124 Class ES, 8.667% - 1 month U.S. LIBOR 8.5552% 4/20/39 (a)(g) | 234 | 242 | |
| Series 2013-149 Class MA, 2.5% 5/20/40 | 21,694 | 22,353 | |
| Series 2013-182 Class IQ, 4.5% 12/16/43 (f) | 4,223 | 640 | |
| Series 2013-39 Class GS, 9.500% - 1 month U.S. LIBOR 9.3327% 3/20/41 (a)(g) | 19,006 | 22,401 | |
| Series 2014-133 Class IB, 5% 9/20/44 (f) | 4,095 | 716 | |
| Series 2014-146 Class EI, 5% 10/20/44 (f) | 7,761 | 1,342 | |
| Series 2014-154 Class IO, 5% 10/20/44 (f) | 1,583 | 269 | |
| Series 2014-158 Class ID, 5% 10/20/44 (f) | 6,826 | 1,255 | |
| Series 2014-178 Class IO, 5% 11/20/44 (f) | 9,728 | 1,696 | |
| Series 2014-2 Class BA, 3% 1/20/44 | 5,110 | 5,431 | |
| Series 2014-21 Class HA, 3% 2/20/44 | 1,933 | 2,053 | |
| Series 2014-25 Class HC, 3% 2/20/44 | 3,249 | 3,450 | |
| Series 2014-5 Class A, 3% 1/20/44 | 2,868 | 3,030 | |
| Series 2015-117 Class KI, 5% 8/20/45 (f) | 9,463 | 1,642 | |
| Series 2015-14 Class IO, 5% 10/20/44 (f) | 10,822 | 1,891 | |
| Series 2015-79 Class IC, 5% 5/20/45 (f) | 5,099 | 860 | |
| Series 2015-H21: | |||
| Class HZ, 4.2415% 6/20/63 (a)(h) | 1,229 | 1,320 | |
| Class JZ, 4.243% 6/20/65 (a)(h) | 606 | 641 | |
| Series 2016-146 Class AL, 5.8163% 5/20/40 (a) | 3,021 | 3,554 | |
| Series 2016-17 Class A, 3% 2/16/46 | 19,455 | 20,606 | |
| Series 2016-171 Class BI, 5% 10/20/44 (f) | 9,467 | 1,666 | |
| Series 2017-186 Class HK, 3% 11/16/45 | 9,562 | 10,165 | |
| Series 2017-75 Class PT, 5.7427% 4/20/47 (a) | 12,159 | 14,283 | |
| Series 2017-H06 Class FA, U.S. TREASURY 1 YEAR INDEX + 0.350% 0.39% 8/20/66 (a)(b)(h) | 16,709 | 16,556 | |
| 636,706 | |||
| TOTAL COLLATERALIZED MORTGAGE OBLIGATIONS | |||
| (Cost $627,585) | 636,706 | ||
| Commercial Mortgage Securities - 3.0% | |||
| Freddie Mac floater: | |||
| Series 2021-F108 Class A/S, U.S. 30-Day Avg. Secured Overnight Fin. Rate (SOFR) Indx + 0.250% 0.2773% 2/25/31 (a)(b) | 22,500 | 22,532 | |
| Series 2021-F109 Class A/S, U.S. 30-Day Avg. Secured Overnight Fin. Rate (SOFR) Indx + 0.240% 0.29% 3/25/31 (a)(b) | 27,500 | 27,525 | |
| Series 2021-F110 Class A/S, U.S. 30-Day Avg. Secured Overnight Fin. Rate (SOFR) Indx + 0.240% 0.29% 3/25/31 (a)(b) | 17,900 | 17,916 | |
| Series 2021-F111 Class A/S, U.S. 30-Day Avg. Secured Overnight Fin. Rate (SOFR) Indx + 0.240% 0.29% 3/25/31 (a)(b) | 9,400 | 9,408 | |
| Series 2021-F112 Class A/S, U.S. 30-Day Avg. Secured Overnight Fin. Rate (SOFR) Indx + 0.250% 0.28% 4/25/31 (a)(b) | 18,100 | 18,100 | |
| Series 2021-F113 Class A/S, U.S. 30-Day Avg. Secured Overnight Fin. Rate (SOFR) Indx + 0.220% 0.28% 5/25/28 (a)(b) | 23,625 | 23,655 | |
| Ginnie Mae guaranteed Multi-family REMIC pass-thru securities sequential payer Series 2001-58 Class X, 0.4902% 9/16/41 (a)(f) | 348 | 0 | |
| Ginnie Mae guaranteed REMIC pass-thru certificates: | |||
| sequential payer Series 2002-81 Class IO, 0.9982% 9/16/42 (a)(f) | 1,624 | 4 | |
| Series 2002-62 Class IO, 1.0823% 8/16/42 (a)(f) | 1,575 | 3 | |
| TOTAL COMMERCIAL MORTGAGE SECURITIES | |||
| (Cost $124,212) | 119,143 | ||
| Shares | Value (000s) | ||
| Money Market Funds - 20.2% | |||
| Fidelity Cash Central Fund 0.06% (i) | |||
| (Cost $800,226) | 800,066,343 | 800,226 |
| Purchased Swaptions - 0.0%(j) | ||||
| Expiration Date | Notional Amount (000s) | Value (000s) | ||
| Put Options - 0.0% | ||||
| Option on an interest rate swap with JPMorgan Chase Bank, N.A. to pay semi-annually a fixed rate of 2.313% and receive quarterly a floating rate based on 3-month LIBOR, expiring June 2029 | 6/6/24 | 19,900 | $214 | |
| Call Options - 0.0% | ||||
| Option on an interest rate swap with JPMorgan Chase Bank, N.A. to receive semi-annually a fixed rate of 2.313% and pay quarterly a floating rate based on 3-month LIBOR, expiring June 2029 | 6/6/24 | 19,900 | 1,002 | |
| TOTAL PURCHASED SWAPTIONS | ||||
| (Cost $1,158) | 1,216 | |||
| TOTAL INVESTMENT IN SECURITIES - 143.6% | ||||
| (Cost $5,610,926) | 5,683,920 | |||
| NET OTHER ASSETS (LIABILITIES) - (43.6)% | (1,726,325) | |||
| NET ASSETS - 100% | $3,957,595 |
| TBA Sale Commitments | ||
| Principal Amount (000s) | Value (000s) | |
| Ginnie Mae | ||
| 2% 8/1/51 | $(99,800) | $(102,217) |
| 3% 8/1/51 | (52,150) | (54,572) |
| 3% 8/1/51 | (51,850) | (54,258) |
| 3% 8/1/51 | (31,100) | (32,544) |
| 3% 8/1/51 | (40,150) | (42,015) |
| 3.5% 8/1/51 | (15,400) | (16,178) |
| 3.5% 8/1/51 | (6,500) | (6,828) |
| 3.5% 8/1/51 | (2,400) | (2,521) |
| 3.5% 8/1/51 | (16,000) | (16,808) |
| TOTAL TBA SALE COMMITMENTS | ||
| (Proceeds $327,179) | $(327,941) |
| Written Swaptions | |||
| Expiration Date | Notional Amount | Value (000s) | |
| Put Swaptions | |||
| Option on an interest rate swap with Morgan Stanley Capital Services LLC to pay semi-annually a fixed rate of 1.57% and receive quarterly a floating rate based on 3-month LIBOR, expiring February 2022 | 2/16/22 | 96,900 | $(1,189) |
| Call Swaptions | |||
| Option on an interest rate swap with Morgan Stanley Capital Services LLC to receive semi-annually a fixed rate of 1.57% and pay quarterly a floating rate based on 3-month LIBOR, expiring February 2022 | 2/16/22 | 96,900 | (3,188) |
| TOTAL WRITTEN SWAPTIONS | $(4,377) |
For the period, the average monthly notional amount at value for written swaptions in the aggregate was $276,083,000.
| Futures Contracts | |||||
| Number of contracts | Expiration Date | Notional Amount (000s) | Value (000s) | Unrealized Appreciation/(Depreciation) (000s) | |
| Purchased | |||||
| Treasury Contracts | |||||
| CBOT Long Term U.S. Treasury Bond Contracts (United States) | 226 | Sept. 2021 | $37,226 | $1,958 | $1,958 |
| Sold | |||||
| Treasury Contracts | |||||
| CBOT 10-Year U.S. Treasury Note Contracts (United States) | 1,543 | Sept. 2021 | 207,461 | (1,664) | (1,664) |
| CBOT 2-Year U.S. Treasury Note Contracts (United States) | 1,795 | Sept. 2021 | 396,078 | (43) | (43) |
| CBOT 5-Year U.S. Treasury Note Contracts (United States) | 50 | Sept. 2021 | 6,222 | (42) | (42) |
| TOTAL SOLD | (1,749) | ||||
| TOTAL FUTURES CONTRACTS | $209 |
The notional amount of futures purchased as a percentage of Net Assets is 0.9%
The notional amount of futures sold as a percentage of Net Assets is 15.4%
For the period, the average monthly notional amount at value for futures contracts in the aggregate was $652,034,000.
Swaps
| Payment Received | Payment Frequency | Payment Paid | Payment Frequency | Clearinghouse / Counterparty(1) | Maturity Date | Notional Amount (000s) | Value (000s) | Upfront Premium Received/(Paid) (000s)(2) | Unrealized Appreciation/(Depreciation) (000s) |
| Interest Rate Swaps | |||||||||
| 0.25% | Semi - annual | 3-month LIBOR(3) | Quarterly | LCH | Sep. 2023 | $105,673 | $130 | $0 | $130 |
| 0.5% | Semi - annual | 3-month LIBOR(3) | Quarterly | LCH | Sep. 2026 | 59,390 | 705 | 0 | 705 |
| 1% | Semi - annual | 3-month LIBOR(3) | Quarterly | LCH | Sep. 2031 | 22,788 | 36 | 0 | 36 |
| 1.25% | Semi - annual | 3-month LIBOR(3) | Quarterly | LCH | Sep. 2051 | 4,704 | 346 | 0 | 346 |
| TOTAL INTEREST RATE SWAPS | $1,217 | $0 | $1,217 | ||||||
(1) Swaps with LCH Clearnet Group (LCH) are centrally cleared over-the-counter (OTC) swaps.
(2) Any premiums for centrally cleared over-the-counter (OTC) swaps are recorded periodically throughout the term of the swap to variation margin and included in unrealized appreciation (depreciation).
(3) Represents floating rate.
For the period, the average monthly notional amount for swaps in the aggregate was $187,152,000.
Values shown as $0 in the Schedule of Investments may reflect amounts less than $500.
Percentages shown as 0.0% in the Schedule of Investments may reflect amounts less than 0.05%.
Legend
(a) Coupon rates for floating and adjustable rate securities reflect the rates in effect at period end.
(b) Coupon is indexed to a floating interest rate which may be multiplied by a specified factor and/or subject to caps or floors.
(c) Security or a portion of the security purchased on a delayed delivery or when-issued basis.
(d) Security or a portion of the security was pledged to cover margin requirements for futures contracts. At period end, the value of securities pledged amounted to $2,905,000.
(e) Security or a portion of the security was pledged to cover margin requirements for centrally cleared OTC swaps. At period end, the value of securities pledged amounted to $4,002,000.
(f) Security represents right to receive monthly interest payments on an underlying pool of mortgages or assets. Principal shown is the outstanding par amount of the pool as of the end of the period.
(g) Coupon is inversely indexed to a floating interest rate multiplied by a specified factor. The price may be considerably more volatile than the price of a comparable fixed rate security.
(h) Represents an investment in an underlying pool of reverse mortgages which typically do not require regular principal and interest payments as repayment is deferred until a maturity event.
(i) Affiliated fund that is generally available only to investment companies and other accounts managed by Fidelity Investments. The rate quoted is the annualized seven-day yield of the fund at period end. A complete unaudited listing of the fund's holdings as of its most recent quarter end is available upon request. In addition, each Fidelity Central Fund's financial statements, which are not covered by the Fund's Report of Independent Registered Public Accounting Firm, are available on the SEC's website or upon request.
(j) For the period, the average monthly notional amount for purchased swaptions was $175,367,000.
Affiliated Central Funds
Information regarding fiscal year to date income earned by the Fund from investments in Fidelity Central Funds is as follows:
| Fund | Income earned |
| (Amounts in thousands) | |
| Fidelity Cash Central Fund | $587 |
| Fidelity Securities Lending Cash Central Fund | 0 |
| Total | $587 |
Amounts in the income column in the above table include any capital gain distributions from underlying funds, which are presented in the corresponding line-item in the Statement of Operations, if applicable. Amount for Fidelity Securities Lending Cash Central Fund represents the income earned on investing cash collateral, less rebates paid to borrowers and any lending agent fees associated with the loan, plus any premium payments received for lending certain types of securities.
Fiscal year to date information regarding the Fund's investments in Fidelity Central Funds, including the ownership percentage, is presented below.
| Fund (Amounts in thousands) | Value, beginning of period | Purchases | Sales Proceeds | Realized Gain/Loss | Change in Unrealized appreciation (depreciation) | Value, end of period | % ownership, end of period |
| Fidelity Cash Central Fund 0.06% | $663,977 | $1,969,741 | $1,833,423 | $(11) | $(58) | $800,226 | 1.2% |
| Fidelity Securities Lending Cash Central Fund 0.06% | -- | 12,137 | 12,137 | -- | -- | -- | 0.0% |
| Total | $663,977 | $1,981,878 | $1,845,560 | $(11) | $(58) | $800,226 |
Investment Valuation
The following is a summary of the inputs used, as of July 31, 2021, involving the Fund's assets and liabilities carried at fair value. The inputs or methodology used for valuing securities may not be an indication of the risk associated with investing in those securities. For more information on valuation inputs, and their aggregation into the levels used below, please refer to the Investment Valuation section in the accompanying Notes to Financial Statements.
| Valuation Inputs at Reporting Date: | ||||
| Description | Total | Level 1 | Level 2 | Level 3 |
| (Amounts in thousands) | ||||
| Investments in Securities: | ||||
| U.S. Government and Government Agency Obligations | $4,971 | $-- | $4,971 | $-- |
| U.S. Government Agency - Mortgage Securities | 4,121,658 | -- | 4,121,658 | -- |
| Collateralized Mortgage Obligations | 636,706 | -- | 636,706 | -- |
| Commercial Mortgage Securities | 119,143 | -- | 119,143 | -- |
| Money Market Funds | 800,226 | 800,226 | -- | -- |
| Purchased Swaptions | 1,216 | -- | 1,216 | -- |
| Total Investments in Securities: | $5,683,920 | $800,226 | $4,883,694 | $-- |
| Derivative Instruments: | ||||
| Assets | ||||
| Futures Contracts | $1,958 | $1,958 | $-- | $-- |
| Swaps | 1,217 | -- | 1,217 | -- |
| Total Assets | $3,175 | $1,958 | $1,217 | $-- |
| Liabilities | ||||
| Futures Contracts | $(1,749) | $(1,749) | $-- | $-- |
| Written Swaptions | (4,377) | -- | (4,377) | -- |
| Total Liabilities | $(6,126) | $(1,749) | $(4,377) | $-- |
| Total Derivative Instruments: | $(2,951) | $209 | $(3,160) | $-- |
| Other Financial Instruments: | ||||
| TBA Sale Commitments | $(327,941) | $-- | $(327,941) | $-- |
| Total Other Financial Instruments: | $(327,941) | $-- | $(327,941) | $-- |
Value of Derivative Instruments
The following table is a summary of the Fund's value of derivative instruments by primary risk exposure as of July 31, 2021. For additional information on derivative instruments, please refer to the Derivative Instruments section in the accompanying Notes to Financial Statements.
| Primary Risk Exposure / Derivative Type | Value | |
| Asset | Liability | |
| (Amounts in thousands) | ||
| Interest Rate Risk | ||
| Futures Contracts(a) | $1,958 | $(1,749) |
| Purchased Swaptions(b) | 1,216 | 0 |
| Swaps(c) | 1,217 | 0 |
| Written Swaptions(d) | 0 | (4,377) |
| Total Interest Rate Risk | 4,391 | (6,126) |
| Total Value of Derivatives | $4,391 | $(6,126) |
(a) Reflects gross cumulative appreciation (depreciation) on futures contracts as presented in the Schedule of Investments. In the Statement of Assets and Liabilities, the period end daily variation margin is included in receivable or payable for daily variation margin on futures contracts, and the net cumulative appreciation (depreciation) is included in Total accumulated earnings (loss).
(b) Gross value is included in the Statement of Assets and Liabilities in the investments, at value line-item.
(c) For centrally cleared over-the-counter (OTC) swaps, reflects gross cumulative appreciation (depreciation) as presented in the Schedule of Investments. In the Statement of Assets and Liabilities, the period end daily variation margin for centrally cleared OTC swaps is included in receivable or payable for daily variation margin on centrally cleared OTC swaps, and the net cumulative appreciation (depreciation) for centrally cleared OTC swaps is included in Total accumulated earnings (loss).
(d) Gross value is presented in the Statement of Assets and Liabilities in the written options, at value line-item.
See accompanying notes which are an integral part of the financial statements.
Financial Statements
Statement of Assets and Liabilities
| Amounts in thousands (except per-share amount) | July 31, 2021 | |
| Assets | ||
| Investment in securities, at value — See accompanying schedule: Unaffiliated issuers (cost $4,810,700) | $4,883,694 | |
| Fidelity Central Funds (cost $800,226) | 800,226 | |
| Total Investment in Securities (cost $5,610,926) | $5,683,920 | |
| Receivable for investments sold | 30 | |
| Receivable for premium on written options | 5,155 | |
| Receivable for TBA sale commitments | 327,179 | |
| Receivable for fund shares sold | 619 | |
| Interest receivable | 7,872 | |
| Distributions receivable from Fidelity Central Funds | 45 | |
| Receivable for daily variation margin on centrally cleared OTC swaps | 250 | |
| Other receivables | 38 | |
| Total assets | 6,025,108 | |
| Liabilities | ||
| Payable for investments purchased | ||
| Regular delivery | $24,168 | |
| Delayed delivery | 1,706,176 | |
| TBA sale commitments, at value | 327,941 | |
| Payable for fund shares redeemed | 2,918 | |
| Distributions payable | 89 | |
| Accrued management fee | 985 | |
| Payable for daily variation margin on futures contracts | 314 | |
| Written options, at value (premium receivable $5,155) | 4,377 | |
| Other affiliated payables | 506 | |
| Other payables and accrued expenses | 39 | |
| Total liabilities | 2,067,513 | |
| Net Assets | $3,957,595 | |
| Net Assets consist of: | ||
| Paid in capital | $3,894,400 | |
| Total accumulated earnings (loss) | 63,195 | |
| Net Assets | $3,957,595 | |
| Net Asset Value, offering price and redemption price per share ($3,957,595 ÷ 337,295 shares) | $11.73 |
See accompanying notes which are an integral part of the financial statements.
Statement of Operations
| Amounts in thousands | Year ended July 31, 2021 | |
| Investment Income | ||
| Interest | $53,513 | |
| Income from Fidelity Central Funds | 587 | |
| Total income | 54,100 | |
| Expenses | ||
| Management fee | $12,648 | |
| Transfer agent fees | 4,240 | |
| Fund wide operations fee | 2,178 | |
| Independent trustees' fees and expenses | 12 | |
| Miscellaneous | 1 | |
| Total expenses | 19,079 | |
| Net investment income (loss) | 35,021 | |
| Realized and Unrealized Gain (Loss) | ||
| Net realized gain (loss) on: | ||
| Investment securities: | ||
| Unaffiliated issuers | 22,934 | |
| Fidelity Central Funds | (11) | |
| Futures contracts | 16,668 | |
| Swaps | (1,040) | |
| Written options | (1,178) | |
| Total net realized gain (loss) | 37,373 | |
| Change in net unrealized appreciation (depreciation) on: | ||
| Investment securities: | ||
| Unaffiliated issuers | (68,139) | |
| Fidelity Central Funds | (58) | |
| Futures contracts | 6,938 | |
| Swaps | (1,697) | |
| Written options | 4,819 | |
| Delayed delivery commitments | (533) | |
| Total change in net unrealized appreciation (depreciation) | (58,670) | |
| Net gain (loss) | (21,297) | |
| Net increase (decrease) in net assets resulting from operations | $13,724 |
See accompanying notes which are an integral part of the financial statements.
Statement of Changes in Net Assets
| Amounts in thousands | Year ended July 31, 2021 | Year ended July 31, 2020 |
| Increase (Decrease) in Net Assets | ||
| Operations | ||
| Net investment income (loss) | $35,021 | $83,129 |
| Net realized gain (loss) | 37,373 | 20,117 |
| Change in net unrealized appreciation (depreciation) | (58,670) | 88,656 |
| Net increase (decrease) in net assets resulting from operations | 13,724 | 191,902 |
| Distributions to shareholders | (37,284) | (89,664) |
| Share transactions | ||
| Proceeds from sales of shares | 765,072 | 1,123,989 |
| Reinvestment of distributions | 33,374 | 80,217 |
| Cost of shares redeemed | (1,120,159) | (1,175,971) |
| Net increase (decrease) in net assets resulting from share transactions | (321,713) | 28,235 |
| Total increase (decrease) in net assets | (345,273) | 130,473 |
| Net Assets | ||
| Beginning of period | 4,302,868 | 4,172,395 |
| End of period | $3,957,595 | $4,302,868 |
| Other Information | ||
| Shares | ||
| Sold | 64,991 | 96,351 |
| Issued in reinvestment of distributions | 2,834 | 6,888 |
| Redeemed | (95,273) | (100,992) |
| Net increase (decrease) | (27,448) | 2,247 |
See accompanying notes which are an integral part of the financial statements.
Financial Highlights
Fidelity GNMA Fund
| Years ended July 31, | 2021 | 2020 | 2019 | 2018 | 2017 |
| Selected Per–Share Data | |||||
| Net asset value, beginning of period | $11.80 | $11.51 | $11.12 | $11.45 | $11.70 |
| Income from Investment Operations | |||||
| Net investment income (loss)A | .097 | .229 | .292 | .257 | .235 |
| Net realized and unrealized gain (loss) | (.065) | .307 | .371 | (.337) | (.215) |
| Total from investment operations | .032 | .536 | .663 | (.080) | .020 |
| Distributions from net investment income | (.093)B | (.246) | (.273) | (.250) | (.224) |
| Distributions from net realized gain | (.009)B | – | – | – | (.041) |
| Distributions from tax return of capital | – | – | – | – | (.005) |
| Total distributions | (.102) | (.246) | (.273) | (.250) | (.270) |
| Net asset value, end of period | $11.73 | $11.80 | $11.51 | $11.12 | $11.45 |
| Total ReturnC | .27% | 4.71% | 6.04% | (.71)% | .19% |
| Ratios to Average Net AssetsD,E | |||||
| Expenses before reductions | .45% | .45% | .45% | .45% | .45% |
| Expenses net of fee waivers, if any | .45% | .45% | .45% | .45% | .45% |
| Expenses net of all reductions | .45% | .45% | .45% | .45% | .45% |
| Net investment income (loss) | .83% | 1.96% | 2.60% | 2.28% | 2.04% |
| Supplemental Data | |||||
| Net assets, end of period (in millions) | $3,958 | $4,303 | $4,172 | $4,321 | $5,216 |
| Portfolio turnover rateF | 593% | 561% | 420% | 252% | 270% |
A Calculated based on average shares outstanding during the period.
B The amounts shown reflect certain reclassifications related to book to tax differences that were made in the year shown.
C Total returns would have been lower if certain expenses had not been reduced during the applicable periods shown.
D Fees and expenses of any underlying mutual funds or exchange-traded funds (ETFs) are not included in the Fund's expense ratio. The Fund indirectly bears its proportionate share of these expenses. For additional expense information related to investments in Fidelity Central Funds, please refer to the "Investments in Fidelity Central Funds" note found in the Notes to Financial Statements section of the most recent Annual or Semi-Annual report.
E Expense ratios reflect operating expenses of the class. Expenses before reductions do not reflect amounts reimbursed, waived, or reduced through arrangements with the investment advisor, brokerage services, or other offset arrangements, if applicable, and do not represent the amount paid by the class during periods when reimbursements, waivers or reductions occur.
F Amount does not include the portfolio activity of any underlying mutual funds or exchange-traded funds (ETFs).
See accompanying notes which are an integral part of the financial statements.
Notes to Financial Statements
For the period ended July 31, 2021
(Amounts in thousands except percentages)
1. Organization.
Fidelity GNMA Fund (the Fund) is a fund of Fidelity Income Fund (the Trust) and is authorized to issue an unlimited number of shares. Share transactions on the Statement of Changes in Net Assets may contain exchanges between affiliated funds. The Trust is registered under the Investment Company Act of 1940, as amended (the 1940 Act), as an open-end management investment company organized as a Massachusetts business trust.
2. Investments in Fidelity Central Funds.
Funds may invest in Fidelity Central Funds, which are open-end investment companies generally available only to other investment companies and accounts managed by the investment adviser and its affiliates. The Schedule of Investments lists any Fidelity Central Funds held as an investment as of period end, but does not include the underlying holdings of each Fidelity Central Fund. An investing fund indirectly bears its proportionate share of the expenses of the underlying Fidelity Central Funds.
Based on its investment objective, each Fidelity Central Fund may invest or participate in various investment vehicles or strategies that are similar to those of the investing fund. These strategies are consistent with the investment objectives of the investing fund and may involve certain economic risks which may cause a decline in value of each of the Fidelity Central Funds and thus a decline in the value of the investing fund.
| Fidelity Central Fund | Investment Manager | Investment Objective | Investment Practices | Expense Ratio(a) |
| Fidelity Money Market Central Funds | Fidelity Management & Research Company LLC (FMR) | Each fund seeks to obtain a high level of current income consistent with the preservation of capital and liquidity. | Short-term Investments | Less than .005% to .01% |
(a) Expenses expressed as a percentage of average net assets and are as of each underlying Central Fund's most recent annual or semi-annual shareholder report.
A complete unaudited list of holdings for each Fidelity Central Fund is available upon request or at the Securities and Exchange Commission website at www.sec.gov. In addition, the financial statements of the Fidelity Central Funds which contain the significant accounting policies (including investment valuation policies) of those funds, and are not covered by the Report of Independent Registered Public Accounting Firm, are available on the Securities and Exchange Commission website or upon request.
3. Significant Accounting Policies.
The Fund is an investment company and applies the accounting and reporting guidance of the Financial Accounting Standards Board (FASB) Accounting Standards Codification Topic 946 Financial Services - Investment Companies. The financial statements have been prepared in conformity with accounting principles generally accepted in the United States of America (GAAP), which require management to make certain estimates and assumptions at the date of the financial statements. Actual results could differ from those estimates. Subsequent events, if any, through the date that the financial statements were issued have been evaluated in the preparation of the financial statements. The Fund's Schedule of Investments lists any underlying mutual funds or exchange-traded funds (ETFs) but does not include the underlying holdings of these funds. The following summarizes the significant accounting policies of the Fund:
Investment Valuation. Investments are valued as of 4:00 p.m. Eastern time on the last calendar day of the period. The Board of Trustees (the Board) has delegated the day to day responsibility for the valuation of the Fund's investments to the Fair Value Committee (the Committee) established by the Fund's investment adviser. In accordance with valuation policies and procedures approved by the Board, the Fund attempts to obtain prices from one or more third party pricing vendors or brokers to value its investments. When current market prices, quotations or currency exchange rates are not readily available or reliable, investments will be fair valued in good faith by the Committee, in accordance with procedures adopted by the Board. Factors used in determining fair value vary by investment type and may include market or investment specific events, changes in interest rates and credit quality. The frequency with which these procedures are used cannot be predicted and they may be utilized to a significant extent. The Committee oversees the Fund's valuation policies and procedures and reports to the Board on the Committee's activities and fair value determinations. The Board monitors the appropriateness of the procedures used in valuing the Fund's investments and ratifies the fair value determinations of the Committee.
The Fund categorizes the inputs to valuation techniques used to value its investments into a disclosure hierarchy consisting of three levels as shown below:
- Level 1 – quoted prices in active markets for identical investments
- Level 2 – other significant observable inputs (including quoted prices for similar investments, interest rates, prepayment speeds, etc.)
- Level 3 – unobservable inputs (including the Fund's own assumptions based on the best information available)
Valuation techniques used to value the Fund's investments by major category are as follows:
Debt securities, including restricted securities, are valued based on evaluated prices received from third party pricing vendors or from brokers who make markets in such securities. U.S. government and government agency obligations are valued by pricing vendors who utilize matrix pricing which considers yield or price of bonds of comparable quality, coupon, maturity and type or by broker-supplied prices. Collateralized mortgage obligations, commercial mortgage securities and U.S. government agency mortgage securities are valued by pricing vendors who utilize matrix pricing which considers prepayment speed assumptions, attributes of the collateral, yield or price of bonds of comparable quality, coupon, maturity and type or by broker-supplied prices. Swaps are marked-to-market daily based on valuations from third party pricing vendors, registered derivatives clearing organizations (clearinghouses) or broker-supplied valuations. These pricing sources may utilize inputs such as interest rate curves, credit spread curves, default possibilities and recovery rates. When independent prices are unavailable or unreliable, debt securities and swaps may be valued utilizing pricing methodologies which consider similar factors that would be used by third party pricing vendors. Debt securities and swaps are generally categorized as Level 2 in the hierarchy but may be Level 3 depending on the circumstances.
Futures contracts are valued at the settlement price established each day by the board of trade or exchange on which they are traded and are categorized as Level 1 in the hierarchy. Options traded over-the-counter are valued using vendor or broker-supplied valuations and are categorized as Level 2 in the hierarchy. Investments in open-end mutual funds, including the Fidelity Central Funds, are valued at their closing net asset value (NAV) each business day and are categorized as Level 1 in the hierarchy.
Changes in valuation techniques may result in transfers in or out of an assigned level within the disclosure hierarchy. The aggregate value of investments by input level as of July 31, 2021 is included at the end of the Fund's Schedule of Investments.
Investment Transactions and Income. For financial reporting purposes, the Fund's investment holdings and NAV include trades executed through the end of the last business day of the period. The NAV per share for processing shareholder transactions is calculated as of the close of business of the New York Stock Exchange (NYSE), normally 4:00 p.m. Eastern time and includes trades executed through the end of the prior business day. Gains and losses on securities sold are determined on the basis of identified cost. Income and capital gain distributions from Fidelity Central Funds, if any, are recorded on the ex-dividend date. Interest income is accrued as earned and includes coupon interest and amortization of premium and accretion of discount on debt securities as applicable.
Expenses. Expenses directly attributable to a fund are charged to that fund. Expenses attributable to more than one fund are allocated among the respective funds on the basis of relative net assets or other appropriate methods. Expenses included in the accompanying financial statements reflect the expenses of that fund and do not include any expenses associated with any underlying mutual funds or exchange-traded funds. Although not included in a fund's expenses, a fund indirectly bears its proportionate share of these expenses through the net asset value of each underlying mutual fund or exchange-traded fund. Expense estimates are accrued in the period to which they relate and adjustments are made when actual amounts are known.
Deferred Trustee Compensation. Under a Deferred Compensation Plan (the Plan) for certain Funds, certain independent Trustees have elected to defer receipt of a portion of their annual compensation. Deferred amounts are invested in affiliated mutual funds, are marked-to-market and remain in a fund until distributed in accordance with the Plan. The investment of deferred amounts and the offsetting payable to the Trustees presented below are included in the accompanying Statement of Assets and Liabilities in other receivables and other payables and accrued expenses, as applicable.
| Fidelity GNMA Fund | $37 |
Income Tax Information and Distributions to Shareholders. Each year, the Fund intends to qualify as a regulated investment company under Subchapter M of the Internal Revenue Code, including distributing substantially all of its taxable income and realized gains. As a result, no provision for U.S. Federal income taxes is required. As of July 31, 2021, the Fund did not have any unrecognized tax benefits in the financial statements; nor is the Fund aware of any tax positions for which it is reasonably possible that the total amounts of unrecognized tax benefits will significantly change in the next twelve months. The Fund files a U.S. federal tax return, in addition to state and local tax returns as required. The Fund's federal income tax returns are subject to examination by the Internal Revenue Service (IRS) for a period of three fiscal years after they are filed. State and local tax returns may be subject to examination for an additional fiscal year depending on the jurisdiction.
Distributions are declared and recorded daily and paid monthly from net investment income. Distributions from realized gains, if any, are declared and recorded on the ex-dividend date. Income and capital gain distributions are determined in accordance with income tax regulations, which may differ from GAAP. These differences resulted in distribution reclassification.
Capital accounts within the financial statements are adjusted for permanent book-tax differences. These adjustments have no impact on net assets or the results of operations. Capital accounts are not adjusted for temporary book-tax differences which will reverse in a subsequent period.
Book-tax differences are primarily due to futures contracts, swaps, market discount, deferred Trustees compensation, capital loss carryforwards and losses deferred due to wash sales and futures contracts.
As of period end, the cost and unrealized appreciation (depreciation) in securities, and derivatives if applicable, for federal income tax purposes were as follows:
| Gross unrealized appreciation | $83,839 |
| Gross unrealized depreciation | (24,152) |
| Net unrealized appreciation (depreciation) | $59,687 |
| Tax Cost | $5,620,311 |
The tax-based components of distributable earnings as of period end were as follows:
| Undistributed ordinary income | $3,594 |
| Net unrealized appreciation (depreciation) on securities and other investments | $59,600 |
The tax character of distributions paid was as follows:
| July 31, 2021 | July 31, 2020 | |
| Ordinary Income | $37,284 | $ 89,664 |
Delayed Delivery Transactions and When-Issued Securities. During the period, certain Funds transacted in securities on a delayed delivery or when-issued basis. Payment and delivery may take place after the customary settlement period for that security. The price of the underlying securities and the date when the securities will be delivered and paid for are fixed at the time the transaction is negotiated. Securities purchased on a delayed delivery or when-issued basis are identified as such in the Schedule of Investments. Compensation for interest forgone in the purchase of a delayed delivery or when-issued debt security may be received. With respect to purchase commitments, each applicable Fund identifies securities as segregated in its records with a value at least equal to the amount of the commitment. Payables and receivables associated with the purchases and sales of delayed delivery securities having the same coupon, settlement date and broker are offset. Delayed delivery or when-issued securities that have been purchased from and sold to different brokers are reflected as both payables and receivables in the Statement of Assets and Liabilities under the caption "Delayed delivery", as applicable. Losses may arise due to changes in the value of the underlying securities or if the counterparty does not perform under the contract's terms, or if the issuer does not issue the securities due to political, economic, or other factors.
To-Be-Announced (TBA) Securities and Mortgage Dollar Rolls. TBA securities involve buying or selling mortgage-backed securities (MBS) on a forward commitment basis. A TBA transaction typically does not designate the actual security to be delivered and only includes an approximate principal amount; however delivered securities must meet specified terms defined by industry guidelines, including issuer, rate and current principal amount outstanding on underlying mortgage pools. Funds may enter into a TBA transaction with the intent to take possession of or deliver the underlying MBS, or a fund may elect to extend the settlement by entering into either a mortgage or reverse mortgage dollar roll. Mortgage dollar rolls are transactions where a fund sells TBA securities and simultaneously agrees to repurchase MBS on a later date at a lower price and with the same counterparty. Reverse mortgage dollar rolls involve the purchase and simultaneous agreement to sell TBA securities on a later date at a lower price. Transactions in mortgage dollar rolls and reverse mortgage dollar rolls are accounted for as purchases and sales and may result in an increase to a fund's portfolio turnover rate.
Purchases and sales of TBA securities involve risks similar to those discussed above for delayed delivery and when-issued securities. Also, if the counterparty in a mortgage dollar roll or a reverse mortgage dollar roll transaction files for bankruptcy or becomes insolvent, a fund's right to repurchase or sell securities may be limited. Additionally, when a fund sells TBA securities without already owning or having the right to obtain the deliverable securities (an uncovered forward commitment to sell), it incurs a risk of loss because it could have to purchase the securities at a price that is higher than the price at which it sold them. A fund may be unable to purchase the deliverable securities if the corresponding market is illiquid.
TBA securities subject to a forward commitment to sell at period end are included at the end of the Schedule of Investments under the caption "TBA Sale Commitments." The proceeds and value of these commitments are reflected in the Statement of Assets and Liabilities as "Receivable for TBA sale commitments" and "TBA sale commitments, at value," respectively.
4. Derivative Instruments.
Risk Exposures and the Use of Derivative Instruments. The Fund's investment objective allows the Fund to enter into various types of derivative contracts, including futures contracts, options and swaps. Derivatives are investments whose value is primarily derived from underlying assets, indices or reference rates and may be transacted on an exchange or over-the-counter (OTC). Derivatives may involve a future commitment to buy or sell a specified asset based on specified terms, to exchange future cash flows at periodic intervals based on a notional principal amount, or for one party to make one or more payments upon the occurrence of specified events in exchange for periodic payments from the other party.
The Fund used derivatives to increase returns, to gain exposure to certain types of assets and to manage exposure to certain risks as defined below. The success of any strategy involving derivatives depends on analysis of numerous economic factors, and if the strategies for investment do not work as intended, the Fund may not achieve its objectives.
The Fund's use of derivatives increased or decreased its exposure to the following risk:
| Interest Rate Risk | Interest rate risk relates to the fluctuations in the value of interest-bearing securities due to changes in the prevailing levels of market interest rates. |
The Fund is also exposed to additional risks from investing in derivatives, such as liquidity risk and counterparty credit risk. Liquidity risk is the risk that the Fund will be unable to close out the derivative in the open market in a timely manner. Counterparty credit risk is the risk that the counterparty will not be able to fulfill its obligation to the Fund. Derivative counterparty credit risk is managed through formal evaluation of the creditworthiness of all potential counterparties. On certain OTC derivatives such as options, the Fund attempts to reduce its exposure to counterparty credit risk by entering into an International Swaps and Derivatives Association, Inc. (ISDA) Master Agreement with each of its counterparties. The ISDA Master Agreement gives the Fund the right to terminate all transactions traded under such agreement upon the deterioration in the credit quality of the counterparty beyond specified levels. The ISDA Master Agreement gives each party the right, upon an event of default by the other party or a termination of the agreement, to close out all transactions traded under such agreement and to net amounts owed under each transaction to one net payable by one party to the other. To mitigate counterparty credit risk on bi-lateral OTC derivatives, the Fund receives collateral in the form of cash or securities once the Fund's net unrealized appreciation on outstanding derivative contracts under an ISDA Master Agreement exceeds certain applicable thresholds, subject to certain minimum transfer provisions. The collateral received is held in segregated accounts with the Fund's custodian bank in accordance with the collateral agreements entered into between the Fund, the counterparty and the Fund's custodian bank. The Fund could experience delays and costs in gaining access to the collateral even though it is held by the Fund's custodian bank. The Fund's maximum risk of loss from counterparty credit risk related to bi-lateral OTC derivatives is generally the aggregate unrealized appreciation and unpaid counterparty payments in excess of any collateral pledged by the counterparty to the Fund. For OTC written options with upfront premiums received, the Fund is obligated to perform and therefore does not have counterparty risk. For OTC written options with premiums to be received at a future date, the maximum risk of loss from counterparty credit risk is the amount of the premium in excess of any collateral pledged by the counterparty. The Fund may be required to pledge collateral for the benefit of the counterparties on bi-lateral OTC derivatives in an amount not less than each counterparty's unrealized appreciation on outstanding derivative contracts, subject to certain minimum transfer provisions, and any such pledged collateral is identified in the Schedule of Investments. Exchange-traded futures contracts are not covered by the ISDA Master Agreement; however counterparty credit risk related to exchange-traded futures contracts may be mitigated by the protection provided by the exchange on which they trade. Counterparty credit risk related to centrally cleared OTC swaps may be mitigated by the protection provided by the clearinghouse.
Investing in derivatives may involve greater risks than investing in the underlying assets directly and, to varying degrees, may involve risk of loss in excess of any initial investment and collateral received and amounts recognized in the Statement of Assets and Liabilities. In addition, there may be the risk that the change in value of the derivative contract does not correspond to the change in value of the underlying instrument.
Net Realized Gain (Loss) and Change in Net Unrealized Appreciation (Depreciation) on Derivatives. The table below, which reflects the impacts of derivatives on the financial performance of the Fund, summarizes the net realized gain (loss) and change in net unrealized appreciation (depreciation) for derivatives during the period as presented in the Statement of Operations.
| Primary Risk Exposure / Derivative Type | Net Realized Gain (Loss) | Change in Net Unrealized Appreciation (Depreciation) |
| Interest Rate Risk | ||
| Futures Contracts | $16,668 | $6,938 |
| Purchased Options | (887) | (1,575) |
| Swaps | (1,040) | (1,697) |
| Written Options | (1,178) | 4,819 |
| Totals | $13,563 | $8,485 |
A summary of the value of derivatives by primary risk exposure as of period end is included at the end of the Schedule of Investments.
Futures Contracts. A futures contract is an agreement between two parties to buy or sell a specified underlying instrument for a fixed price at a specified future date. The Fund used futures contracts to manage its exposure to the bond market and fluctuations in interest rates.
Upon entering into a futures contract, a fund is required to deposit either cash or securities (initial margin) with a clearing broker in an amount equal to a certain percentage of the face value of the contract. Futures contracts are marked-to-market daily and subsequent daily payments (variation margin) are made or received by a fund depending on the daily fluctuations in the value of the futures contracts and are recorded as unrealized appreciation or (depreciation). This receivable and/or payable, if any, is included in daily variation margin on futures contracts in the Statement of Assets and Liabilities. Realized gain or (loss) is recorded upon the expiration or closing of a futures contract. The net realized gain (loss) and change in net unrealized appreciation (depreciation) on futures contracts during the period is presented in the Statement of Operations.
Any open futures contracts at period end are presented in the Schedule of Investments under the caption "Futures Contracts". The notional amount at value reflects each contract's exposure to the underlying instrument or index at period end. Securities deposited to meet initial margin requirements are identified in the Schedule of Investments.
Options. Options give the purchaser the right, but not the obligation, to buy (call) or sell (put) an underlying security or financial instrument at an agreed exercise or strike price between or on certain dates. Options obligate the seller (writer) to buy (put) or sell (call) an underlying instrument at the exercise or strike price or cash settle an underlying derivative instrument if the holder exercises the option on or before the expiration date. The Fund uses OTC options, such as swaptions, which are options where the underlying instrument is a swap, to manage its exposure to fluctuations in interest rates.
Upon entering into an options contract, a fund will pay or receive a premium. Premiums paid on purchased options are reflected as cost of investments and premiums received on written options are reflected as a liability on the Statement of Assets and Liabilities. Certain options may be purchased or written with premiums to be paid or received on a future date. Options are valued daily and any unrealized appreciation (depreciation) is reflected on the Statement of Assets and Liabilities. When an option is exercised, the cost or proceeds of the underlying instrument purchased or sold is adjusted by the amount of the premium. When an option is closed the Fund will realize a gain or loss depending on whether the proceeds or amount paid for the closing sale transaction is greater or less than the premium received or paid. When an option expires, gains and losses are realized to the extent of premiums received and paid, respectively. The net realized and unrealized gains (losses) on purchased options are included in the Statement of Operations in net realized gain (loss) and change in net unrealized appreciation (depreciation) on investment securities. The net realized gain (loss) and change in net unrealized appreciation (depreciation) on written options are presented in the Statement of Operations.
Any open options at period end are presented in the Schedule of Investments under the captions "Purchased Options," "Purchased Swaptions," "Written Options" and "Written Swaptions," as applicable.
Writing puts and buying calls tend to increase exposure to the underlying instrument while buying puts and writing calls tend to decrease exposure to the underlying instrument. For purchased options, risk of loss is limited to the premium paid, and for written options, risk of loss is the change in value in excess of the premium received.
Swaps. A swap is a contract between two parties to exchange future cash flows at periodic intervals based on a notional principal amount. A centrally cleared OTC swap is a transaction executed between a fund and a dealer counterparty, then cleared by a futures commission merchant (FCM) through a clearinghouse. Once cleared, the clearinghouse serves as a central counterparty, with whom a fund exchanges cash flows for the life of the transaction, similar to transactions in futures contracts.
Centrally cleared OTC swaps require a fund to deposit either cash or securities (initial margin) with the FCM, at the instruction of and for the benefit of the clearinghouse. Securities deposited to meet initial margin requirements are identified in the Schedule of Investments. Centrally cleared OTC swaps are marked-to-market daily and subsequent payments (variation margin) are made or received depending on the daily fluctuations in the value of the swaps and are recorded as unrealized appreciation or (depreciation). These daily payments, if any, are included in receivable or payable for daily variation margin on centrally cleared OTC swaps in the Statement of Assets and Liabilities. Any premiums for centrally cleared OTC swaps are recorded periodically throughout the term of the swap to variation margin and included in unrealized appreciation (depreciation) in the Statement of Assets and Liabilities. Any premiums are recognized as realized gain (loss) upon termination or maturity of the swap.
Payments are exchanged at specified intervals, accrued daily commencing with the effective date of the contract and recorded as realized gain or (loss). Some swaps may be terminated prior to the effective date and realize a gain or loss upon termination. The net realized gain (loss) and change in net unrealized appreciation (depreciation) on swaps during the period is presented in the Statement of Operations.
Any open swaps at period end are included in the Schedule of Investments under the caption "Swaps".
Interest Rate Swaps. Interest rate swaps are agreements between counterparties to exchange cash flows, one based on a fixed rate, and the other on a floating rate. The Fund entered into interest rate swaps to manage its exposure to interest rate changes. Changes in interest rates can have an effect on both the value of bond holdings as well as the amount of interest income earned. In general, the value of bonds can fall when interest rates rise and can rise when interest rates fall.
5. Purchases and Sales of Investments.
Purchases and sales of securities, other than short-term securities, U.S. government securities and in-kind transactions, as applicable, are noted in the table below.
| Purchases ($) | Sales ($) | |
| Fidelity GNMA Fund | 3,199,063 | 3,222,770 |
6. Fees and Other Transactions with Affiliates.
Management Fee. Fidelity Management & Research Company LLC (the investment adviser) and its affiliates provide the Fund with investment management related services for which the Fund pays a monthly management fee. The management fee is the sum of an individual fund fee rate that is based on an annual rate of .20% of the Fund's average net assets and an annualized group fee rate that averaged .10% during the period. The group fee rate is based upon the monthly average net assets of a group of registered investment companies with which the investment adviser has management contracts. The group fee rate decreases as assets under management increase and increases as assets under management decrease. For the reporting period, the total annual management fee rate was .30% of the Fund's average net assets.
Transfer Agent Fees. Fidelity Investments Institutional Operations Company LLC (FIIOC), an affiliate of the investment adviser, is the Fund's transfer, dividend disbursing and shareholder servicing agent. FIIOC receives an asset-based fee of .10% of the Fund's average net assets. FIIOC pays for typesetting, printing and mailing of shareholder reports, except proxy statements.
Fund Wide Operations Fee. Pursuant to the Fund Wide Operations and Expense Agreement (FWOE), the investment adviser has agreed to provide for fund-level expenses (which may not include transfer agent, the compensation of the independent Trustees, interest, taxes or extraordinary expenses, as applicable) in return for a FWOE fee equal to .35% of fund-level average net assets less the total amount of the management fee. The FWOE paid by a fund is reduced by an amount equal to the fees and expenses paid to the independent Trustees. For the period, the FWOE fees were equivalent to the following annual rate expressed as a percentage of average net assets:
| Fidelity GNMA Fund | .05% |
Interfund Trades. Funds may purchase from or sell securities to other Fidelity Funds under procedures adopted by the Board. The procedures have been designed to ensure these interfund trades are executed in accordance with Rule 17a-7 of the 1940 Act. Any interfund trades are included within the respective purchases and sales amounts shown in the Purchases and Sales of Investments note.
7. Committed Line of Credit.
Certain Funds participate with other funds managed by the investment adviser or an affiliate in a $4.25 billion credit facility (the "line of credit") to be utilized for temporary or emergency purposes to fund shareholder redemptions or for other short-term liquidity purposes. The participating funds have agreed to pay commitment fees on their pro-rata portion of the line of credit, which are reflected in Miscellaneous expenses on the Statement of Operations, and are listed below. Effective during January 2021, commitment fees are borne by the investment adviser. During the period, there were no borrowings on this line of credit.
| Amount | |
| Fidelity GNMA Fund | $2 |
8. Security Lending.
Funds lend portfolio securities from time to time in order to earn additional income. Lending agents are used, including National Financial Services (NFS), an affiliate of the investment adviser. Pursuant to a securities lending agreement, NFS will receive a fee, which is capped at 9.9% of a fund's daily lending revenue, for its services as lending agent. A fund may lend securities to certain qualified borrowers, including NFS. On the settlement date of the loan, a fund receives collateral (in the form of U.S. Treasury obligations, letters of credit and/or cash) against the loaned securities and maintains collateral in an amount not less than 100% of the market value of the loaned securities during the period of the loan. The market value of the loaned securities is determined at the close of business of a fund and any additional required collateral is delivered to a fund on the next business day. A fund or borrower may terminate the loan at any time, and if the borrower defaults on its obligation to return the securities loaned because of insolvency or other reasons, a fund may apply collateral received from the borrower against the obligation. A fund may experience delays and costs in recovering the securities loaned. Any cash collateral received is invested in the Fidelity Securities Lending Cash Central Fund. Any loaned securities are identified as such in the Schedule of Investments, and the value of loaned securities and cash collateral at period end, as applicable, are presented in the Statement of Assets and Liabilities. Security lending income represents the income earned on investing cash collateral, less rebates paid to borrowers and any lending agent fees associated with the loan, plus any premium payments received for lending certain types of securities. Security lending income is presented in the Statement of Operations as a component of income from Fidelity Central Funds. Affiliated security lending activity, if any, was as follows:
| Total Security Lending Fees Paid to NFS | Security Lending Income From Securities Loaned to NFS | Value of Securities Loaned to NFS at Period End | |
| Fidelity GNMA Fund | $–(a) | $– | $– |
(a) Amount represents less than five hundred dollars.
9. Other.
Fund's organizational documents provide former and current trustees and officers with a limited indemnification against liabilities arising in connection with the performance of their duties to the fund. In the normal course of business, the fund may also enter into contracts that provide general indemnifications. The fund's maximum exposure under these arrangements is unknown as this would be dependent on future claims that may be made against the fund. The risk of material loss from such claims is considered remote.
10. Coronavirus (COVID-19) Pandemic.
An outbreak of COVID-19 first detected in China during December 2019 has since spread globally and was declared a pandemic by the World Health Organization during March 2020. Developments that disrupt global economies and financial markets, such as the COVID-19 pandemic, may magnify factors that affect the Fund's performance.
Report of Independent Registered Public Accounting Firm
To the Board of Trustees of Fidelity Income Fund and Shareholders of Fidelity GNMA Fund
Opinion on the Financial Statements
We have audited the accompanying statement of assets and liabilities, including the schedule of investments, of Fidelity GNMA Fund (one of the funds constituting Fidelity Income Fund, referred to hereafter as the “Fund”) as of July 31, 2021, the related statement of operations for the year ended July 31, 2021, the statement of changes in net assets for each of the two years in the period ended July 31, 2021, including the related notes, and the financial highlights for each of the five years in the period ended July 31, 2021 (collectively referred to as the “financial statements”). In our opinion, the financial statements present fairly, in all material respects, the financial position of the Fund as of July 31, 2021, the results of its operations for the year then ended, the changes in its net assets for each of the two years in the period ended July 31, 2021 and the financial highlights for each of the five years in the period ended July 31, 2021 in conformity with accounting principles generally accepted in the United States of America.
Basis for Opinion
These financial statements are the responsibility of the Fund’s management. Our responsibility is to express an opinion on the Fund’s financial statements based on our audits. We are a public accounting firm registered with the Public Company Accounting Oversight Board (United States) (PCAOB) and are required to be independent with respect to the Fund in accordance with the U.S. federal securities laws and the applicable rules and regulations of the Securities and Exchange Commission and the PCAOB.
We conducted our audits of these financial statements in accordance with the standards of the PCAOB. Those standards require that we plan and perform the audit to obtain reasonable assurance about whether the financial statements are free of material misstatement, whether due to error or fraud.
Our audits included performing procedures to assess the risks of material misstatement of the financial statements, whether due to error or fraud, and performing procedures that respond to those risks. Such procedures included examining, on a test basis, evidence regarding the amounts and disclosures in the financial statements. Our audits also included evaluating the accounting principles used and significant estimates made by management, as well as evaluating the overall presentation of the financial statements. Our procedures included confirmation of securities owned as of July 31, 2021 by correspondence with the custodian and brokers; when replies were not received from brokers, we performed other auditing procedures. We believe that our audits provide a reasonable basis for our opinion.
/s/ PricewaterhouseCoopers LLP
Boston, Massachusetts
September 10, 2021
We have served as the auditor of one or more investment companies in the Fidelity group of funds since 1932.
Trustees and Officers
The Trustees, Members of the Advisory Board (if any), and officers of the trust and fund, as applicable, are listed below. The Board of Trustees governs the fund and is responsible for protecting the interests of shareholders. The Trustees are experienced executives who meet periodically throughout the year to oversee the fund's activities, review contractual arrangements with companies that provide services to the fund, oversee management of the risks associated with such activities and contractual arrangements, and review the fund's performance. Each of the Trustees oversees 283 funds.
The Trustees hold office without limit in time except that (a) any Trustee may resign; (b) any Trustee may be removed by written instrument, signed by at least two-thirds of the number of Trustees prior to such removal; (c) any Trustee who requests to be retired or who has become incapacitated by illness or injury may be retired by written instrument signed by a majority of the other Trustees; and (d) any Trustee may be removed at any special meeting of shareholders by a two-thirds vote of the outstanding voting securities of the trust. Each Trustee who is not an interested person (as defined in the 1940 Act) of the trust and the fund is referred to herein as an Independent Trustee. Each Independent Trustee shall retire not later than the last day of the calendar year in which his or her 75th birthday occurs. The Independent Trustees may waive this mandatory retirement age policy with respect to individual Trustees. Officers and Advisory Board Members hold office without limit in time, except that any officer or Advisory Board Member may resign or may be removed by a vote of a majority of the Trustees at any regular meeting or any special meeting of the Trustees. Except as indicated, each individual has held the office shown or other offices in the same company for the past five years.
The fund’s Statement of Additional Information (SAI) includes more information about the Trustees. To request a free copy, call Fidelity at 1-800-544-8544.
Experience, Skills, Attributes, and Qualifications of the Trustees. The Governance and Nominating Committee has adopted a statement of policy that describes the experience, qualifications, attributes, and skills that are necessary and desirable for potential Independent Trustee candidates (Statement of Policy). The Board believes that each Trustee satisfied at the time he or she was initially elected or appointed a Trustee, and continues to satisfy, the standards contemplated by the Statement of Policy. The Governance and Nominating Committee also engages professional search firms to help identify potential Independent Trustee candidates who have the experience, qualifications, attributes, and skills consistent with the Statement of Policy. From time to time, additional criteria based on the composition and skills of the current Independent Trustees, as well as experience or skills that may be appropriate in light of future changes to board composition, business conditions, and regulatory or other developments, have also been considered by the professional search firms and the Governance and Nominating Committee. In addition, the Board takes into account the Trustees' commitment and participation in Board and committee meetings, as well as their leadership of standing and ad hoc committees throughout their tenure.
In determining that a particular Trustee was and continues to be qualified to serve as a Trustee, the Board has considered a variety of criteria, none of which, in isolation, was controlling. The Board believes that, collectively, the Trustees have balanced and diverse experience, qualifications, attributes, and skills, which allow the Board to operate effectively in governing the fund and protecting the interests of shareholders. Information about the specific experience, skills, attributes, and qualifications of each Trustee, which in each case led to the Board's conclusion that the Trustee should serve (or continue to serve) as a trustee of the fund, is provided below.
Board Structure and Oversight Function. Abigail P. Johnson is an interested person and currently serves as Chairman. The Trustees have determined that an interested Chairman is appropriate and benefits shareholders because an interested Chairman has a personal and professional stake in the quality and continuity of services provided to the fund. Independent Trustees exercise their informed business judgment to appoint an individual of their choosing to serve as Chairman, regardless of whether the Trustee happens to be independent or a member of management. The Independent Trustees have determined that they can act independently and effectively without having an Independent Trustee serve as Chairman and that a key structural component for assuring that they are in a position to do so is for the Independent Trustees to constitute a substantial majority for the Board. The Independent Trustees also regularly meet in executive session. Arthur E. Johnson serves as Chairman of the Independent Trustees and as such (i) acts as a liaison between the Independent Trustees and management with respect to matters important to the Independent Trustees and (ii) with management prepares agendas for Board meetings.
Fidelity® funds are overseen by different Boards of Trustees. The fund's Board oversees Fidelity's investment-grade bond, money market, asset allocation and certain equity funds, and other Boards oversee Fidelity's high income and other equity funds. The asset allocation funds may invest in Fidelity® funds that are overseen by such other Boards. The use of separate Boards, each with its own committee structure, allows the Trustees of each group of Fidelity® funds to focus on the unique issues of the funds they oversee, including common research, investment, and operational issues. On occasion, the separate Boards establish joint committees to address issues of overlapping consequences for the Fidelity® funds overseen by each Board.
The Trustees operate using a system of committees to facilitate the timely and efficient consideration of all matters of importance to the Trustees, the fund, and fund shareholders and to facilitate compliance with legal and regulatory requirements and oversight of the fund's activities and associated risks. The Board, acting through its committees, has charged FMR and its affiliates with (i) identifying events or circumstances the occurrence of which could have demonstrably adverse effects on the fund's business and/or reputation; (ii) implementing processes and controls to lessen the possibility that such events or circumstances occur or to mitigate the effects of such events or circumstances if they do occur; and (iii) creating and maintaining a system designed to evaluate continuously business and market conditions in order to facilitate the identification and implementation processes described in (i) and (ii) above. Because the day-to-day operations and activities of the fund are carried out by or through FMR, its affiliates, and other service providers, the fund's exposure to risks is mitigated but not eliminated by the processes overseen by the Trustees. While each of the Board's committees has responsibility for overseeing different aspects of the fund's activities, oversight is exercised primarily through the Operations and Audit Committees. In addition, an ad hoc Board committee of Independent Trustees has worked with FMR to enhance the Board's oversight of investment and financial risks, legal and regulatory risks, technology risks, and operational risks, including the development of additional risk reporting to the Board. Appropriate personnel, including but not limited to the fund's Chief Compliance Officer (CCO), FMR's internal auditor, the independent accountants, the fund's Treasurer and portfolio management personnel, make periodic reports to the Board's committees, as appropriate, including an annual review of Fidelity's risk management program for the Fidelity® funds. The responsibilities of each standing committee, including their oversight responsibilities, are described further under "Standing Committees of the Trustees."
Interested Trustees*:
Correspondence intended for a Trustee who is an interested person may be sent to Fidelity Investments, 245 Summer Street, Boston, Massachusetts 02210.
Name, Year of Birth; Principal Occupations and Other Relevant Experience+
Abigail P. Johnson (1961)
Year of Election or Appointment: 2009
Trustee
Chairman of the Board of Trustees
Ms. Johnson also serves as Trustee of other Fidelity® funds. Ms. Johnson serves as Chairman (2016-present), Chief Executive Officer (2014-present), and Director (2007-present) of FMR LLC (diversified financial services company), President of Fidelity Financial Services (2012-present) and President of Personal, Workplace and Institutional Services (2005-present). Ms. Johnson is Chairman and Director of Fidelity Management & Research Company LLC (investment adviser firm, 2011-present). Previously, Ms. Johnson served as Chairman and Director of FMR Co., Inc. (investment adviser firm, 2011-2019), Vice Chairman (2007-2016) and President (2013-2016) of FMR LLC, President and a Director of Fidelity Management & Research Company (2001-2005), a Trustee of other investment companies advised by Fidelity Management & Research Company, Fidelity Investments Money Management, Inc. (investment adviser firm), and FMR Co., Inc. (2001-2005), Senior Vice President of the Fidelity® funds (2001-2005), and managed a number of Fidelity® funds. Ms. Abigail P. Johnson and Mr. Arthur E. Johnson are not related.
Jennifer Toolin McAuliffe (1959)
Year of Election or Appointment: 2016
Trustee
Ms. McAuliffe also serves as Trustee of other Fidelity® funds and as Trustee of Fidelity Charitable (2020-present). Previously, Ms. McAuliffe served as Co-Head of Fixed Income of Fidelity Investments Limited (now known as FIL Limited (FIL)) (diversified financial services company), Director of Research for FIL’s credit and quantitative teams in London, Hong Kong and Tokyo and Director of Research for taxable and municipal bonds at Fidelity Investments Money Management, Inc. Ms. McAuliffe previously served as a member of the Advisory Board of certain Fidelity® funds (2016). Ms. McAuliffe was previously a lawyer at Ropes & Gray LLP and currently serves as director or trustee of several not-for-profit entities.
* Determined to be an “Interested Trustee” by virtue of, among other things, his or her affiliation with the trust or various entities under common control with FMR.
+ The information includes the Trustee's principal occupation during the last five years and other information relating to the experience, attributes, and skills relevant to the Trustee's qualifications to serve as a Trustee, which led to the conclusion that the Trustee should serve as a Trustee for the fund.
Independent Trustees:
Correspondence intended for an Independent Trustee may be sent to Fidelity Investments, P.O. Box 55235, Boston, Massachusetts 02205-5235.
Name, Year of Birth; Principal Occupations and Other Relevant Experience+
Elizabeth S. Acton (1951)
Year of Election or Appointment: 2013
Trustee
Ms. Acton also serves as Trustee of other Fidelity® funds. Prior to her retirement, Ms. Acton served as Executive Vice President, Finance (2011-2012), Executive Vice President, Chief Financial Officer (2002-2011) and Treasurer (2004-2005) of Comerica Incorporated (financial services). Prior to joining Comerica, Ms. Acton held a variety of positions at Ford Motor Company (1983-2002), including Vice President and Treasurer (2000-2002) and Executive Vice President and Chief Financial Officer of Ford Motor Credit Company (1998-2000). Ms. Acton currently serves as a member of the Board and Audit and Finance Committees of Beazer Homes USA, Inc. (homebuilding, 2012-present). Ms. Acton previously served as a member of the Advisory Board of certain Fidelity® funds (2013-2016).
Ann E. Dunwoody (1953)
Year of Election or Appointment: 2018
Trustee
General Dunwoody also serves as Trustee of other Fidelity® funds. General Dunwoody (United States Army, Retired) was the first woman in U.S. military history to achieve the rank of four-star general and prior to her retirement in 2012 held a variety of positions within the U.S. Army, including Commanding General, U.S. Army Material Command (2008-2012). General Dunwoody currently serves as President of First to Four LLC (leadership and mentoring services, 2012-present), a member of the Board and Nomination and Corporate Governance Committees of Kforce Inc. (professional staffing services, 2016-present) and a member of the Board of Automattic Inc. (software engineering, 2018-present). Previously, General Dunwoody served as a member of the Advisory Board and Nominating and Corporate Governance Committee of L3 Technologies, Inc. (communication, electronic, sensor and aerospace systems, 2013-2019) and a member of the Board and Audit and Sustainability and Corporate Responsibility Committees of Republic Services, Inc. (waste collection, disposal and recycling, 2013-2016). Ms. Dunwoody also serves on several boards for non-profit organizations, including as a member of the Board, Chair of the Nomination and Governance Committee and a member of the Audit Committee of Logistics Management Institute (consulting non-profit, 2012-present), a member of the Council of Trustees for the Association of the United States Army (advocacy non-profit, 2013-present), a member of the Board of Florida Institute of Technology (2015-present) and a member of the Board of ThanksUSA (military family education non-profit, 2014-present). General Dunwoody previously served as a member of the Advisory Board of certain Fidelity® funds (2018).
John Engler (1948)
Year of Election or Appointment: 2014
Trustee
Mr. Engler also serves as Trustee of other Fidelity® funds. Previously, Mr. Engler served as Governor of Michigan (1991-2003), President of the Business Roundtable (2011-2017) and interim President of Michigan State University (2018-2019). Mr. Engler currently serves as a member of the Board of Stride, Inc. (formerly K12 Inc.) (technology-based education company, 2012-present). Previously, Mr. Engler served as a member of the Board of Universal Forest Products (manufacturer and distributor of wood and wood-alternative products, 2003-2019) and Trustee of The Munder Funds (2003-2014). Mr. Engler previously served as a member of the Advisory Board of certain Fidelity® funds (2014-2016).
Robert F. Gartland (1951)
Year of Election or Appointment: 2010
Trustee
Mr. Gartland also serves as Trustee of other Fidelity® funds. Prior to his retirement, Mr. Gartland held a variety of positions at Morgan Stanley (financial services, 1979-2007), including Managing Director (1987-2007) and Chase Manhattan Bank (1975-1978). Mr. Gartland previously served as Chairman and an investor in Gartland & Mellina Group Corp. (consulting, 2009-2019), as a member of the Board of National Securities Clearing Corporation (1993-1996) and as Chairman of TradeWeb (2003-2004).
Arthur E. Johnson (1947)
Year of Election or Appointment: 2008
Trustee
Chairman of the Independent Trustees
Mr. Johnson also serves as Trustee of other Fidelity® funds. Prior to his retirement, Mr. Johnson served as Senior Vice President of Corporate Strategic Development of Lockheed Martin Corporation (defense contractor, 1999-2009). Mr. Johnson currently serves as a member of the Board of Booz Allen Hamilton (management consulting, 2011-present). Mr. Johnson previously served as a member of the Board of Eaton Corporation plc (diversified power management, 2009-2019) and a member of the Board of AGL Resources, Inc. (holding company, 2002-2016). Mr. Johnson previously served as Vice Chairman (2015-2018) of the Independent Trustees of certain Fidelity® funds. Mr. Arthur E. Johnson is not related to Ms. Abigail P. Johnson.
Michael E. Kenneally (1954)
Year of Election or Appointment: 2009
Trustee
Vice Chairman of the Independent Trustees
Mr. Kenneally also serves as Trustee of other Fidelity® funds. Prior to his retirement, Mr. Kenneally served as Chairman and Global Chief Executive Officer of Credit Suisse Asset Management and as Executive Vice President and Chief Investment Officer for Bank of America Corporation, where he was responsible for the bank’s money-management products. Previously at Bank of America, Mr. Kenneally managed the principal investment research functions and also spent more than a decade as portfolio manager for various equity and fixed-income funds and institutional accounts. He began his career as a research analyst in 1983 and was awarded the Chartered Financial Analyst (CFA) designation in 1991.
Marie L. Knowles (1946)
Year of Election or Appointment: 2001
Trustee
Ms. Knowles also serves as Trustee of other Fidelity® funds. Prior to her retirement, Ms. Knowles held several positions at Atlantic Richfield Company (diversified energy), including Executive Vice President and Chief Financial Officer (1996-2000), Senior Vice President (1993-1996) and President of ARCO Transportation Company (pipeline and tanker operations, 1993-1996). Ms. Knowles currently serves as a member of the Board of McKesson Corporation (healthcare service, since 2002), a member of the Board of the Santa Catalina Island Company (real estate, 2009-present), a member of the Investment Company Institute Board of Governors and a member of the Governing Council of the Independent Directors Council (2014-present). Ms. Knowles also serves as a member of the Advisory Board for the School of Engineering of the University of Southern California. Ms. Knowles previously served as Chairman (2015-2018) and Vice Chairman (2012-2015) of the Independent Trustees of certain Fidelity® funds.
Mark A. Murray (1954)
Year of Election or Appointment: 2016
Trustee
Mr. Murray also serves as Trustee of other Fidelity® funds. Previously, Mr. Murray served as Co-Chief Executive Officer (2013-2016), President (2006-2013) and Vice Chairman (2013-2020) of Meijer, Inc. Mr. Murray serves as a member of the Board (2009-present) and Public Policy and Responsibility Committee (2009-present) and Chair of the Nuclear Review Committee (2019-present) of DTE Energy Company (diversified energy company). Mr. Murray previously served as a member of the Board of Spectrum Health (not-for-profit health system, 2015-2019) and as a member of the Board and Audit Committee and Chairman of the Nominating and Corporate Governance Committee of Universal Forest Products, Inc. (manufacturer and distributor of wood and wood-alternative products, 2004-2016). Mr. Murray also serves as a member of the Board of many community and professional organizations. Mr. Murray previously served as a member of the Advisory Board of certain Fidelity® funds (2016).
+ The information includes the Trustee's principal occupation during the last five years and other information relating to the experience, attributes, and skills relevant to the Trustee's qualifications to serve as a Trustee, which led to the conclusion that the Trustee should serve as a Trustee for the fund.
Advisory Board Members and Officers:
Correspondence intended for an officer may be sent to Fidelity Investments, 245 Summer Street, Boston, Massachusetts 02210. Officers appear below in alphabetical order.
Name, Year of Birth; Principal Occupation
Robert W. Helm (1957)
Year of Election or Appointment: 2021
Member of the Advisory Board
Mr. Helm also serves as a Member of the Advisory Board of other Fidelity® funds. Mr. Helm was formerly Deputy Chairman (2003-2020), partner (1991-2020) and an associate (1984-1991) of Dechert LLP (formerly Dechert Price & Rhoads). Mr. Helm currently serves on boards and committees of several not-for-profit organizations.
Craig S. Brown (1977)
Year of Election or Appointment: 2019
Assistant Treasurer
Mr. Brown also serves as an officer of other funds. Mr. Brown serves as Assistant Treasurer of FIMM, LLC (2021-present) and is an employee of Fidelity Investments (2013-present).
John J. Burke III (1964)
Year of Election or Appointment: 2018
Chief Financial Officer
Mr. Burke also serves as Chief Financial Officer of other funds. Mr. Burke serves as Head of Investment Operations for Fidelity Fund and Investment Operations (2018-present) and is an employee of Fidelity Investments (1998-present). Previously Mr. Burke served as head of Asset Management Investment Operations (2012-2018).
David J. Carter (1973)
Year of Election or Appointment: 2020
Assistant Secretary
Mr. Carter also serves as Assistant Secretary of other funds. Mr. Carter serves as Vice President, Associate General Counsel (2010-present) and is an employee of Fidelity Investments (2005-present).
Jonathan Davis (1968)
Year of Election or Appointment: 2010
Assistant Treasurer
Mr. Davis also serves as an officer of other funds. Mr. Davis serves as Assistant Treasurer of FIMM, LLC (2021-present) and FMR Capital, Inc. (2017-present) and is an employee of Fidelity Investments. Previously, Mr. Davis served as Vice President and Associate General Counsel of FMR LLC (diversified financial services company, 2003-2010).
Laura M. Del Prato (1964)
Year of Election or Appointment: 2018
President and Treasurer
Ms. Del Prato also serves as an officer of other funds. Ms. Del Prato serves as Assistant Treasurer of FIMM, LLC (2021-present) and is an employee of Fidelity Investments (2017-present). Previously, Ms. Del Prato served as President and Treasurer of The North Carolina Capital Management Trust: Cash Portfolio and Term Portfolio (2018-2020). Prior to joining Fidelity Investments, Ms. Del Prato served as a Managing Director and Treasurer of the JPMorgan Mutual Funds (2014-2017). Prior to JPMorgan, Ms. Del Prato served as a partner at Cohen Fund Audit Services (accounting firm, 2012-2013) and KPMG LLP (accounting firm, 2004-2012).
Colm A. Hogan (1973)
Year of Election or Appointment: 2016
Assistant Treasurer
Mr. Hogan also serves as an officer of other funds. Mr. Hogan serves as Assistant Treasurer of FIMM, LLC (2021-present) and FMR Capital, Inc. (2017-present) and is an employee of Fidelity Investments (2005-present). Previously, Mr. Hogan served as Deputy Treasurer of certain Fidelity® funds (2016-2020) and Assistant Treasurer of certain Fidelity® funds (2016-2018).
Cynthia Lo Bessette (1969)
Year of Election or Appointment: 2019
Secretary and Chief Legal Officer (CLO)
Ms. Lo Bessette also serves as an officer of other funds. Ms. Lo Bessette serves as CLO, Secretary, and Senior Vice President of Fidelity Management & Research Company LLC (investment adviser firm, 2019-present); and CLO of Fidelity Management & Research (Hong Kong) Limited, FMR Investment Management (UK) Limited, and Fidelity Management & Research (Japan) Limited (investment adviser firms, 2019-present). She is a Senior Vice President and Deputy General Counsel of FMR LLC (diversified financial services company, 2019-present), and is an employee of Fidelity Investments. Previously, Ms. Lo Bessette served as CLO, Secretary, and Senior Vice President of FMR Co., Inc. (investment adviser firm, 2019); Secretary of Fidelity SelectCo, LLC and Fidelity Investments Money Management, Inc. (investment adviser firms, 2019). Prior to joining Fidelity Investments, Ms. Lo Bessette was Executive Vice President, General Counsel (2016-2019) and Senior Vice President, Deputy General Counsel (2015-2016) of OppenheimerFunds (investment management company) and Deputy Chief Legal Officer (2013-2015) of Jennison Associates LLC (investment adviser firm).
Chris Maher (1972)
Year of Election or Appointment: 2013
Assistant Treasurer
Mr. Maher also serves as an officer of other funds. Mr. Maher serves as Assistant Treasurer of FIMM, LLC (2021-present) and FMR Capital, Inc. (2017-present), and is an employee of Fidelity Investments (2008-present). Previously, Mr. Maher served as Assistant Treasurer of certain funds (2013-2020); Vice President of Asset Management Compliance (2013), Vice President of the Program Management Group of FMR (investment adviser firm, 2010-2013), and Vice President of Valuation Oversight (2008-2010).
Jamie Pagliocco (1964)
Year of Election or Appointment: 2020
Vice President
Mr. Pagliocco also serves as Vice President of other funds. Mr. Pagliocco serves as President of Fixed Income (2020-present), and is an employee of Fidelity Investments (2001-present). Previously, Mr. Pagliocco served as Co-Chief Investment Officer – Bond (2017-2020), Global Head of Bond Trading (2016-2019), and as a portfolio manager.
Kenneth B. Robins (1969)
Year of Election or Appointment: 2020
Chief Compliance Officer
Mr. Robins also serves as an officer of other funds. Mr. Robins serves as Compliance Officer of Fidelity Management & Research Company LLC (investment adviser firm, 2016-present) and is an employee of Fidelity Investments (2004-present). Previously, Mr. Robins served as Compliance Officer of FMR Co., Inc. (investment adviser firm, 2016-2019), as Executive Vice President of Fidelity Investments Money Management, Inc. (investment adviser firm, 2013-2016) and served in other fund officer roles.
Brett Segaloff (1972)
Year of Election or Appointment: 2021
Anti-Money Laundering (AML) Officer
Mr. Segaloff also serves as an AML Officer of other funds and other related entities. He is Director, Anti-Money Laundering (2007-present) of FMR LLC (diversified financial services company) and is an employee of Fidelity Investments (1996-present).
Stacie M. Smith (1974)
Year of Election or Appointment: 2013
Assistant Treasurer
Ms. Smith also serves as an officer of other funds. Ms. Smith serves as Assistant Treasurer of FIMM, LLC (2021-present) and FMR Capital, Inc. (2017-present), is an employee of Fidelity Investments (2009-present), and has served in other fund officer roles. Prior to joining Fidelity Investments, Ms. Smith served as Senior Audit Manager of Ernst & Young LLP (accounting firm, 1996-2009). Previously, Ms. Smith served as Assistant Treasurer (2013-2019) and Deputy Treasurer (2013-2016) of certain Fidelity® funds.
Marc L. Spector (1972)
Year of Election or Appointment: 2016
Deputy Treasurer
Mr. Spector also serves as an officer of other funds. Mr. Spector serves as Assistant Treasurer of FIMM, LLC (2021-present) and FMR Capital, Inc. (2017-present) and is an employee of Fidelity Investments (2016-present). Prior to joining Fidelity Investments, Mr. Spector served as Director at the Siegfried Group (accounting firm, 2013-2016), and prior to Siegfried Group as audit senior manager at Deloitte & Touche LLP (accounting firm, 2005-2013).
Jim Wegmann (1979)
Year of Election or Appointment: 2019
Assistant Treasurer
Mr. Wegmann also serves as an officer of other funds. Mr. Wegmann serves as Assistant Treasurer of FIMM, LLC (2021-present) and is an employee of Fidelity Investments (2011-present).
Shareholder Expense Example
As a shareholder, you incur two types of costs: (1) transaction costs, which may include sales charges (loads) on purchase payments or redemption proceeds, as applicable and (2) ongoing costs, which generally include management fees, distribution and/or service (12b-1) fees and other Fund expenses. This Example is intended to help you understand your ongoing costs (in dollars) of investing in a fund and to compare these costs with the ongoing costs of investing in other mutual funds.
The Example is based on an investment of $1,000 invested at the beginning of the period and held for the entire period (February 1, 2021 to July 31, 2021).
Actual Expenses
The first line of the accompanying table provides information about actual account values and actual expenses. You may use the information in this line, together with the amount you invested, to estimate the expenses that you paid over the period. Simply divide your account value by $1,000.00 (for example, an $8,600 account value divided by $1,000.00 = 8.6), then multiply the result by the number in the first line for a class/Fund under the heading entitled "Expenses Paid During Period" to estimate the expenses you paid on your account during this period. If any fund is a shareholder of any underlying mutual funds or exchange-traded funds (ETFs) (the Underlying Funds), such fund indirectly bears its proportional share of the expenses of the Underlying Funds in addition to the direct expenses incurred presented in the table. These fees and expenses are not included in the annualized expense ratio used to calculate the expense estimate in the table below.
Hypothetical Example for Comparison Purposes
The second line of the accompanying table provides information about hypothetical account values and hypothetical expenses based on the actual expense ratio and an assumed rate of return of 5% per year before expenses, which is not the actual return. The hypothetical account values and expenses may not be used to estimate the actual ending account balance or expenses you paid for the period. You may use this information to compare the ongoing costs of investing in the Fund and other funds. To do so, compare this 5% hypothetical example with the 5% hypothetical examples that appear in the shareholder reports of the other funds. If any fund is a shareholder of any Underlying Funds, such fund indirectly bears its proportional share of the expenses of the Underlying Funds in addition to the direct expenses as presented in the table. These fees and expenses are not included in the annualized expense ratio used to calculate the expense estimate in the table below.
Please note that the expenses shown in the table are meant to highlight your ongoing costs only and do not reflect any transaction costs. Therefore, the second line of the table is useful in comparing ongoing costs only, and will not help you determine the relative total costs of owning different funds.
| Annualized Expense Ratio-A | Beginning Account Value February 1, 2021 | Ending Account Value July 31, 2021 | Expenses Paid During Period-B February 1, 2021 to July 31, 2021 |
|
| Fidelity GNMA Fund | .45% | |||
| Actual | $1,000.00 | $997.90 | $2.23 | |
| Hypothetical-C | $1,000.00 | $1,022.56 | $2.26 |
A Annualized expense ratio reflects expenses net of applicable fee waivers.
B Expenses are equal to the annualized expense ratio, multiplied by the average account value over the period, multiplied by 181/ 365 (to reflect the one-half year period). The fees and expenses of any Underlying Funds are not included in each annualized expense ratio.
C 5% return per year before expenses
Distributions (Unaudited)
The Board of Trustees of Fidelity GNMA Fund voted to pay on September 13, 2021, to shareholders of record at the opening of business on September 10, 2021, a distribution of $0.012 per share derived from capital gains realized from sales of portfolio securities.
A total of 0.35% of the dividends distributed during the fiscal year was derived from interest on U.S. Government securities which is generally exempt from state income tax.
The fund designates $62,198,366 of distributions paid in the calendar year 2020 as qualifying to be taxed as interest-related dividends for nonresident alien shareholders.
The fund designates $68,731,064 of distributions paid in the calendar year 2020 as qualifying to be taxed as section 163(j) interest dividends.
The fund will notify shareholders in January 2022 of amounts for use in preparing 2021 income tax returns.
Liquidity Risk Management Program
The Securities and Exchange Commission adopted Rule 22e-4 under the Investment Company Act of 1940 (the Liquidity Rule) to promote effective liquidity risk management throughout the open-end investment company industry, thereby reducing the risk that funds will be unable to meet their redemption obligations and mitigating dilution of the interests of fund shareholders.
The Fund has adopted and implemented a liquidity risk management program pursuant to the Liquidity Rule (the Program) effective December 1, 2018. The Program is reasonably designed to assess and manage the Fund’s liquidity risk and to comply with the requirements of the Liquidity Rule. The Fund’s Board of Trustees (the Board) has designated the Fund’s investment adviser as administrator of the Program. The Fidelity advisers have established a Liquidity Risk Management Committee (the LRM Committee) to manage the Program for each of the Fidelity Funds. The LRM Committee monitors the adequacy and effectiveness of implementation of the Program and on a periodic basis assesses each Fund’s liquidity risk based on a variety of factors including (1) the Fund’s investment strategy, (2) portfolio liquidity and cash flow projections during normal and reasonably foreseeable stressed conditions, (3) shareholder redemptions, (4) borrowings and other funding sources and (5) in the case of exchange-traded funds, certain additional factors including the effect of the Fund’s prices and spreads, market participants, and basket compositions on the overall liquidity of the Fund’s portfolio, as applicable.
In accordance with the Program, each of the Fund’s portfolio investments is classified into one of four liquidity categories described below based on a determination of a reasonable expectation for how long it would take to convert the investment to cash (or sell or dispose of the investment) without significantly changing its market value.
- Highly liquid investments – cash or convertible to cash within three business days or less
- Moderately liquid investments – convertible to cash in three to seven calendar days
- Less liquid investments – can be sold or disposed of, but not settled, within seven calendar days
- Illiquid investments – cannot be sold or disposed of within seven calendar days
Liquidity classification determinations take into account a variety of factors including various market, trading and investment-specific considerations, as well as market depth, and generally utilize analysis from a third-party liquidity metrics service.
The Liquidity Rule places a 15% limit on a fund’s illiquid investments and requires funds that do not primarily hold assets that are highly liquid investments to determine and maintain a minimum percentage of the fund’s net assets to be invested in highly liquid investments (highly liquid investment minimum or HLIM). The Program includes provisions reasonably designed to comply with the 15% limit on illiquid investments and for determining, periodically reviewing and complying with the HLIM requirement as applicable.
At a recent meeting of the Fund’s Board of Trustees, the LRM Committee provided a written report to the Board pertaining to the operation, adequacy, and effectiveness of implementation of the Program for the annual period from December 1, 2019 through November 30, 2020. The report concluded that the Program has been implemented and is operating effectively and is reasonably designed to assess and manage the Fund’s liquidity risk.
![]()
MOG-ANN-0921
1.930526.110
Fidelity Managed Retirement Income Fund℠
Fidelity Managed Retirement 2010 Fund℠
Fidelity Managed Retirement 2015 Fund℠
Fidelity Managed Retirement 2020 Fund℠
Fidelity Managed Retirement 2025 Fund℠
Fidelity Managed Retirement 2030 Fund℠
July 31, 2021
Includes Fidelity and Fidelity Advisor share classes
Contents
To view a fund's proxy voting guidelines and proxy voting record for the 12-month period ended June 30, visit http://www.fidelity.com/proxyvotingresults or visit the Securities and Exchange Commission's (SEC) web site at http://www.sec.gov.
You may also call 1-800-544-8544 if you’re an individual investing directly with Fidelity, call 1-800-835-5092 if you’re a plan sponsor or participant with Fidelity as your recordkeeper or call 1-877-208-0098 on institutional accounts or if you’re an advisor or invest through one to request a free copy of the proxy voting guidelines.
Standard & Poor's, S&P and S&P 500 are registered service marks of The McGraw-Hill Companies, Inc. and have been licensed for use by Fidelity Distributors Corporation.
Other third-party marks appearing herein are the property of their respective owners.
All other marks appearing herein are registered or unregistered trademarks or service marks of FMR LLC or an affiliated company. © 2021 FMR LLC. All rights reserved.
This report and the financial statements contained herein are submitted for the general information of the shareholders of the Funds. This report is not authorized for distribution to prospective investors in the Funds unless preceded or accompanied by an effective prospectus.
A fund files its complete schedule of portfolio holdings with the SEC for the first and third quarters of each fiscal year on Form N-PORT. Forms N-PORT are available on the SEC’s web site at http://www.sec.gov. A fund's Forms N-PORT may be reviewed and copied at the SEC’s Public Reference Room in Washington, DC. Information regarding the operation of the SEC's Public Reference Room may be obtained by calling 1-800-SEC-0330.
For a complete list of a fund's portfolio holdings, view the most recent holdings listing, semiannual report, or annual report on Fidelity's web site at http://www.fidelity.com, http://www.institutional.fidelity.com, or http://www.401k.com, as applicable.
NOT FDIC INSURED •MAY LOSE VALUE •NO BANK GUARANTEE
Neither the Funds nor Fidelity Distributors Corporation is a bank.
Note to Shareholders:
Early in 2020, the outbreak and spread of a new coronavirus emerged as a public health emergency that had a major influence on financial markets, primarily based on its impact on the global economy and the outlook for corporate earnings. The virus causes a respiratory disease known as COVID-19. On March 11, 2020 the World Health Organization declared the COVID-19 outbreak a pandemic, citing sustained risk of further global spread.
In the weeks following, as the crisis worsened, we witnessed an escalating human tragedy with wide-scale social and economic consequences from coronavirus-containment measures. The outbreak of COVID-19 prompted a number of measures to limit the spread, including travel and border restrictions, quarantines, and restrictions on large gatherings. In turn, these resulted in lower consumer activity, diminished demand for a wide range of products and services, disruption in manufacturing and supply chains, and – given the wide variability in outcomes regarding the outbreak – significant market uncertainty and volatility. Amid the turmoil, global governments and central banks took unprecedented action to help support consumers, businesses, and the broader economies, and to limit disruption to financial systems.
The situation continues to unfold, and the extent and duration of its impact on financial markets and the economy remain highly uncertain. Extreme events such as the coronavirus crisis are “exogenous shocks” that can have significant adverse effects on mutual funds and their investments. Although multiple asset classes may be affected by market disruption, the duration and impact may not be the same for all types of assets.
Fidelity is committed to helping you stay informed amid news about COVID-19 and during increased market volatility, and we’re taking extra steps to be responsive to customer needs. We encourage you to visit our websites, where we offer ongoing updates, commentary, and analysis on the markets and our funds.
Fidelity Managed Retirement Income Fund℠
Performance: The Bottom Line
Average annual total return reflects the change in the value of an investment, assuming reinvestment of distributions from dividend income and capital gains (the profits earned upon the sale of securities that have grown in value, if any) and assuming a constant rate of performance each year. The hypothetical investment and the average annual total returns do not reflect the deduction of taxes that a shareholder would pay on fund distributions or the redemption of fund shares. During periods of reimbursement by Fidelity, a fund’s total return will be greater than it would be had the reimbursement not occurred. How a fund did yesterday is no guarantee of how it will do tomorrow.
Average Annual Total Returns
| For the periods ended July 31, 2021 | Past 1 year | Past 5 years | Past 10 years |
| Class A (incl. 5.75% sales charge) | 1.04% | 3.94% | 4.55% |
| Fidelity Managed Retirement Income Fund℠ | 7.48% | 5.44% | 5.44% |
| Class K | 7.59% | 5.48% | 5.46% |
| Class K6 | 7.69% | 5.52% | 5.48% |
| Class I | 7.48% | 5.44% | 5.44% |
| Class Z6 | 7.69% | 5.53% | 5.48% |
The initial offering of Class K, Class K6 and Class Z6 took place on August 1, 2019. Returns prior to August 1, 2019 are those of Fidelity Managed Retirement Income Fund, Fidelity Managed Retirement Income Fund and Class I, respectively, and have not been restated to reflect current expenses.
$10,000 Over 10 Years
Let's say hypothetically that $10,000 was invested in Fidelity Managed Retirement Income Fund℠, a class of the fund, on July 31, 2011.
The chart shows how the value of your investment would have changed, and also shows how the Bloomberg U.S. Aggregate Bond Index performed over the same period.

| Period Ending Values | ||
|
| $16,978 | Fidelity Managed Retirement Income Fund℠ |
|
| $13,897 | Bloomberg U.S. Aggregate Bond Index |
Effective August 24, 2021, all Bloomberg Barclays Indices were re-branded as Bloomberg Indices.
Fidelity Managed Retirement 2010 Fund℠
Performance: The Bottom Line
Average annual total return reflects the change in the value of an investment, assuming reinvestment of distributions from dividend income and capital gains (the profits earned upon the sale of securities that have grown in value, if any) and assuming a constant rate of performance each year. The hypothetical investment and the average annual total returns do not reflect the deduction of taxes that a shareholder would pay on fund distributions or the redemption of fund shares. During periods of reimbursement by Fidelity, a fund’s total return will be greater than it would be had the reimbursement not occurred. How a fund did yesterday is no guarantee of how it will do tomorrow.
Average Annual Total Returns
| For the periods ended July 31, 2021 | Past 1 year | Past 5 years | Past 10 years |
| Class A (incl. 5.75% sales charge) | 3.16% | 5.37% | 5.86% |
| Fidelity Managed Retirement 2010 Fund℠ | 9.73% | 6.89% | 6.75% |
| Class K | 9.83% | 6.93% | 6.77% |
| Class K6 | 9.94% | 6.97% | 6.80% |
| Class I | 9.72% | 6.89% | 6.75% |
| Class Z6 | 9.94% | 6.97% | 6.80% |
The initial offering of Class K, Class K6 and Class Z6 took place on August 1, 2019. Returns prior to August 1, 2019 are those of Fidelity Managed Retirement 2010 Fund, Fidelity Managed Retirement 2010 Fund and Class I, respectively, and have not been restated to reflect current expenses.
$10,000 Over 10 Years
Let's say hypothetically that $10,000 was invested in Fidelity Managed Retirement 2010 Fund℠, a class of the fund, on July 31, 2011.
The chart shows how the value of your investment would have changed, and also shows how the Bloomberg U.S. Aggregate Bond Index performed over the same period.

| Period Ending Values | ||
|
| $19,225 | Fidelity Managed Retirement 2010 Fund℠ |
|
| $13,897 | Bloomberg U.S. Aggregate Bond Index |
Effective August 24, 2021, all Bloomberg Barclays Indices were re-branded as Bloomberg Indices.
Fidelity Managed Retirement 2015 Fund℠
Performance: The Bottom Line
Average annual total return reflects the change in the value of an investment, assuming reinvestment of distributions from dividend income and capital gains (the profits earned upon the sale of securities that have grown in value, if any) and assuming a constant rate of performance each year. The hypothetical investment and the average annual total returns do not reflect the deduction of taxes that a shareholder would pay on fund distributions or the redemption of fund shares. During periods of reimbursement by Fidelity, a fund’s total return will be greater than it would be had the reimbursement not occurred. How a fund did yesterday is no guarantee of how it will do tomorrow.
Average Annual Total Returns
| For the periods ended July 31, 2021 | Past 1 year | Past 5 years | Past 10 years |
| Class A (incl. 5.75% sales charge) | 5.85% | 6.29% | 6.44% |
| Fidelity Managed Retirement 2015 Fund℠ | 12.60% | 7.83% | 7.34% |
| Class K | 12.71% | 7.87% | 7.36% |
| Class K6 | 12.82% | 7.91% | 7.38% |
| Class I | 12.59% | 7.83% | 7.34% |
| Class Z6 | 12.81% | 7.92% | 7.39% |
The initial offering of Class K, Class K6 and Class Z6 took place on August 1, 2019. Returns prior to August 1, 2019 are those of Fidelity Managed Retirement 2015 Fund, Fidelity Managed Retirement 2015 Fund and Class I, respectively, and have not been restated to reflect current expenses.
$10,000 Over 10 Years
Let's say hypothetically that $10,000 was invested in Fidelity Managed Retirement 2015 Fund℠, a class of the fund, on July 31, 2011.
The chart shows how the value of your investment would have changed, and also shows how the Bloomberg U.S. Aggregate Bond Index performed over the same period.
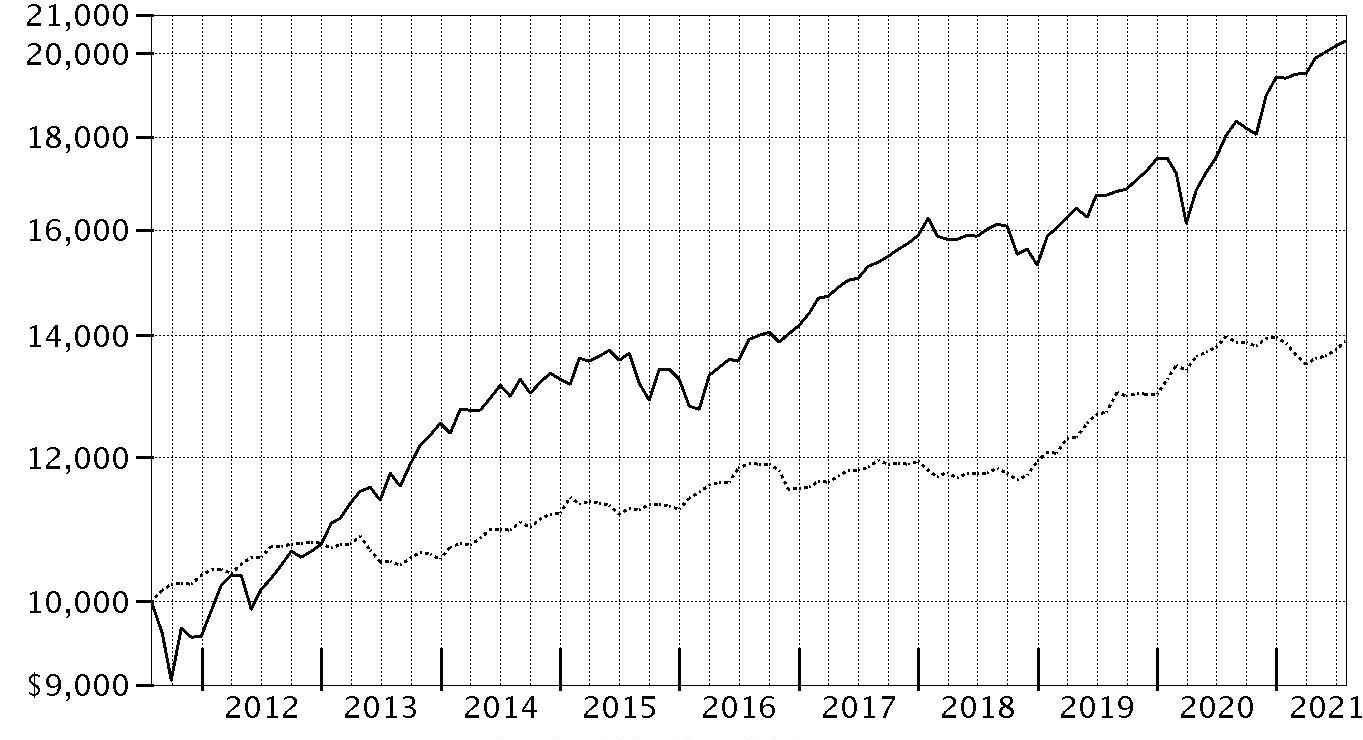
| Period Ending Values | ||
|
| $20,312 | Fidelity Managed Retirement 2015 Fund℠ |
|
| $13,897 | Bloomberg U.S. Aggregate Bond Index |
Effective August 24, 2021, all Bloomberg Barclays Indices were re-branded as Bloomberg Indices.
Fidelity Managed Retirement 2020 Fund℠
Performance: The Bottom Line
Average annual total return reflects the change in the value of an investment, assuming reinvestment of distributions from dividend income and capital gains (the profits earned upon the sale of securities that have grown in value, if any) and assuming a constant rate of performance each year. The hypothetical investment and the average annual total returns do not reflect the deduction of taxes that a shareholder would pay on fund distributions or the redemption of fund shares. During periods of reimbursement by Fidelity, a fund’s total return will be greater than it would be had the reimbursement not occurred. How a fund did yesterday is no guarantee of how it will do tomorrow.
Average Annual Total Returns
| For the periods ended July 31, 2021 | Past 1 year | Past 5 years | Past 10 years |
| Class A (incl. 5.75% sales charge) | 8.53% | 7.14% | 6.97% |
| Fidelity Managed Retirement 2020 Fund℠ | 15.44% | 8.69% | 7.87% |
| Class K | 15.53% | 8.73% | 7.90% |
| Class K6 | 15.65% | 8.77% | 7.92% |
| Class I | 15.44% | 8.69% | 7.87% |
| Class Z6 | 15.66% | 8.77% | 7.92% |
The initial offering of Class K, Class K6 and Class Z6 took place on August 1, 2019. Returns prior to August 1, 2019 are those of Fidelity Managed Retirement 2020 Fund, Fidelity Managed Retirement 2020 Fund and Class I, respectively, and have not been restated to reflect current expenses.
$10,000 Over 10 Years
Let's say hypothetically that $10,000 was invested in Fidelity Managed Retirement 2020 Fund℠, a class of the fund, on July 31, 2011.
The chart shows how the value of your investment would have changed, and also shows how the Bloomberg U.S. Aggregate Bond Index performed over the same period.

| Period Ending Values | ||
|
| $21,340 | Fidelity Managed Retirement 2020 Fund℠ |
|
| $13,897 | Bloomberg U.S. Aggregate Bond Index |
Effective August 24, 2021, all Bloomberg Barclays Indices were re-branded as Bloomberg Indices.
Fidelity Managed Retirement 2025 Fund℠
Performance: The Bottom Line
Average annual total return reflects the change in the value of an investment, assuming reinvestment of distributions from dividend income and capital gains (the profits earned upon the sale of securities that have grown in value, if any) and assuming a constant rate of performance each year. The hypothetical investment and the average annual total returns do not reflect the deduction of taxes that a shareholder would pay on fund distributions or the redemption of fund shares. During periods of reimbursement by Fidelity, a fund’s total return will be greater than it would be had the reimbursement not occurred. How a fund did yesterday is no guarantee of how it will do tomorrow.
Average Annual Total Returns
| For the periods ended July 31, 2021 | Past 1 year | Past 5 years | Past 10 years |
| Class A (incl. 5.75% sales charge) | 10.74% | 7.81% | 7.48% |
| Fidelity Managed Retirement 2025 Fund℠ | 17.79% | 9.37% | 8.39% |
| Class K | 17.90% | 9.41% | 8.42% |
| Class K6 | 18.03% | 9.46% | 8.44% |
| Class I | 17.78% | 9.37% | 8.39% |
| Class Z6 | 18.01% | 9.46% | 8.44% |
The initial offering of Class K, Class K6 and Class Z6 took place on August 1, 2019. Returns prior to August 1, 2019 are those of Fidelity Managed Retirement 2025 Fund, Fidelity Managed Retirement 2025 Fund and Class I, respectively, and have not been restated to reflect current expenses.
$10,000 Over 10 Years
Let's say hypothetically that $10,000 was invested in Fidelity Managed Retirement 2025 Fund℠, a class of the fund, on July 31, 2011.
The chart shows how the value of your investment would have changed, and also shows how the Bloomberg U.S. Aggregate Bond Index and the S&P 500 Index performed over the same period.

| Period Ending Values | ||
|
| $22,388 | Fidelity Managed Retirement 2025 Fund℠ |
|
| $13,897 | Bloomberg U.S. Aggregate Bond Index |
|
| $41,689 | S&P 500 |
Effective August 1, 2020, the fund's benchmark changed from the S&P 500® Index to the Bloomberg U.S. Aggregate Bond Index.
Effective August 24, 2021, all Bloomberg Barclays Indices were re-branded as Bloomberg Indices.
Fidelity Managed Retirement 2030 Fund℠
Performance: The Bottom Line
Average annual total return reflects the change in the value of an investment, assuming reinvestment of distributions from dividend income and capital gains (the profits earned upon the sale of securities that have grown in value, if any) and assuming a constant rate of performance each year. The hypothetical investment and the average annual total returns do not reflect the deduction of taxes that a shareholder would pay on fund distributions or the redemption of fund shares. During periods of reimbursement by Fidelity, a fund’s total return will be greater than it would be had the reimbursement not occurred. How a fund did yesterday is no guarantee of how it will do tomorrow.
Average Annual Total Returns
| For the periods ended July 31, 2021 | Past 1 year | Life of fundA |
| Class A (incl. 5.75% sales charge) | 11.42% | 11.17% |
| Fidelity Managed Retirement 2030 Fund℠ | 19.57% | 14.83% |
| Class K | 19.69% | 14.95% |
| Class K6 | 19.73% | 15.07% |
| Class I | 19.62% | 14.86% |
| Class Z6 | 19.80% | 15.10% |
A From August 16, 2019
$10,000 Over Life of Fund
Let's say hypothetically that $10,000 was invested in Fidelity Managed Retirement 2030 Fund℠, a class of the fund, on August 16, 2019, when the fund started.
The chart shows how the value of your investment would have changed, and also shows how the S&P 500® Index performed over the same period.
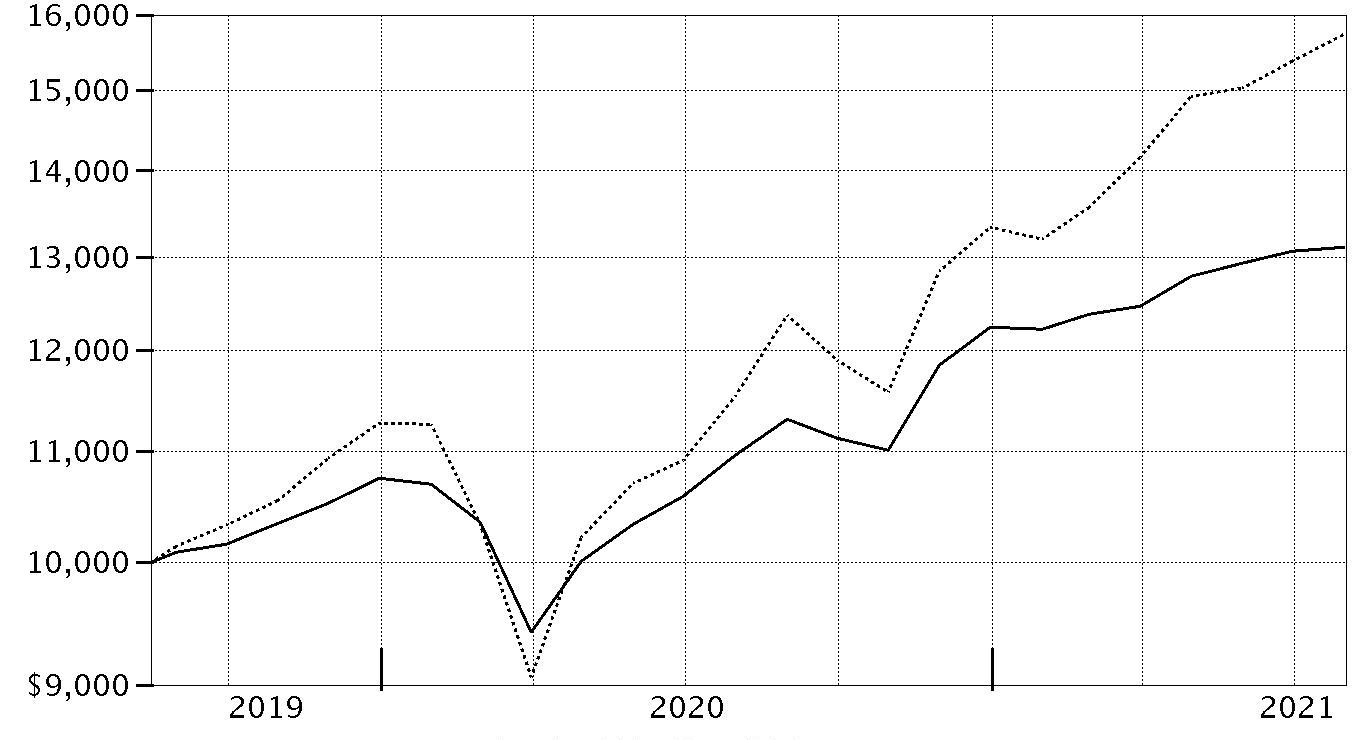
| Period Ending Values | ||
|
| $13,111 | Fidelity Managed Retirement 2030 Fund℠ |
|
| $15,736 | S&P 500® Index |
Management's Discussion of Fund Performance
Market Recap: For the 12 months ending July 31, 2021, global financial markets were influenced by a number of factors, including the broader reopening of local, state, regional and international businesses, an improved outlook for global economic growth, fiscal and monetary stimulus from U.S. and foreign governments, and the widespread distribution of COVID-19 vaccines. This backdrop was highly supportive of global equities, but proved to be a headwind for investment-grade bonds.The MSCI ACWI (All Country World Index) ex USA Index gained 27.96% for the past year, gaining until a modest decline in the final two months amid a spike in COVID-19 cases based on the highly contagious delta variant of the coronavirus. By region, Canada (+38%) led the way, followed by Europe ex U.K. (+34%) and the U.K. (+31%). Conversely, emerging markets (+21%) and Japan (+26%) trailed the broader index, and Asia Pacific ex Japan (+28%) performed about in line. Looking at sectors, materials (+43%), information technology (+41%) and industrials (+39%) fared best. In contrast, notable “laggards” included utilities and communication services (+11% each).The Dow Jones U.S. Total Stock Market Index gained 38.93% the past 12 months. Among sectors, financials (+56%) was the top performer. Energy (+49%), industrials (+47%), materials and communication services (+45% each) also stood out. In contrast, the defensive-oriented utilities (+13%) and consumer staples (+19%) sectors lagged most. Small-cap stocks, as measured by the Russell 2000® Index (+51.97%), handily topped the large-cap-oriented S&P 500® index (+36.45%). From a style standpoint, value stocks outpaced growth among all market capitalizations. Commodities, as measured by the Bloomberg Barclays Commodity Index Total Return, rose 40.28% for the 12 months.Within fixed income, U.S. taxable investment-grade bonds returned -0.70%, according to the Bloomberg Barclays U.S. Aggregate Bond Index. Within the index, corporate bonds rose 1.21%, topping the -3.01% return of U.S. Treasuries. Mortgage-backed securities, meanwhile, gained 0.03%, outpacing Treasuries and the broader taxable bond market. Outside the index, U.S. corporate high-yield bonds (+10.75%), leveraged loans (+10.04%), Treasury Inflation-Protected Securities (+6.90%) and emerging-markets debt (+3.57%). Comments from Co-Portfolio Managers Andrew Dierdorf and Brett Sumsion: For the fiscal year, returns for the share classes of Fidelity® Managed Retirement Funds (excluding sales charges, if applicable) ranged from about 7.5% to 20%, with performance trending higher among the Funds for investors with a longer retirement horizon. Funds for investors with a greater number years to invest in retirement – those with more exposure to equities and lower allocations to fixed-income and short-term securities – fared better than those that invest in a greater percentage of fixed-income and short-term debt, and less equity exposure. Each Fidelity Managed Retirement Fund topped its Composite index the past 12 months, primarily due to outperformance among the underlying investment portfolios. Specifically, an investment in Fidelity® Series Investment Grade Bond Fund gained 1.92% for the 12 months, outpacing the -0.70% result of its benchmark, the Bloomberg Barclays U.S. Aggregate Bond Index. The Funds also benefited from strong performance among underlying U.S. equity and non-U.S. equity funds. In the former asset class, Fidelity® Series Blue Chip Growth Fund (+46.97%) outperformed the 36.68% advance of its benchmark, the Russell 1000® Growth Index. In non-U.S. equities, Fidelity® Series Emerging Markets Fund (+24.58%) surpassed the 20.66% result of the MSCI Emerging Markets Index. Active asset allocation decisions also provided a boost to the Funds’ relative performance this period. In particular, underweighting investment-grade bonds, a non-Composite allocation to commodities and an overweighting in non-U.S. equities notably contributed to the Funds’ relative results. Conversely, underweighting U.S. equities notably detracted.The views expressed above reflect those of the portfolio manager(s) only through the end of the period as stated on the cover of this report and do not necessarily represent the views of Fidelity or any other person in the Fidelity organization. Any such views are subject to change at any time based upon market or other conditions and Fidelity disclaims any responsibility to update such views. These views may not be relied on as investment advice and, because investment decisions for a Fidelity fund are based on numerous factors, may not be relied on as an indication of trading intent on behalf of any Fidelity fund.
Note to Shareholders: In May, the FIAA Board approved Fidelity’s request to modify the glide paths and strategic asset allocations for Fidelity’s target date funds and related composite benchmark changes.Fidelity Managed Retirement Income Fund℠
Investment Summary (Unaudited)
The information in the following tables is based on the direct investments of the Fund.Top Holdings as of July 31, 2021
| % of fund's net assets | |
| Fidelity Series Treasury Bill Index Fund | 13.7 |
| Fidelity Series Inflation-Protected Bond Index Fund | 12.0 |
| Fidelity Series Investment Grade Bond Fund | 11.6 |
| Fidelity Series Government Bond Index Fund | 10.6 |
| Fidelity Series Corporate Bond Fund | 8.4 |
| Fidelity Series Investment Grade Securitized Fund | 8.0 |
| Fidelity Series Emerging Markets Opportunities Fund | 5.4 |
| Fidelity Series Government Money Market Fund 0.07% | 4.9 |
| Fidelity Series Short-Term Credit Fund | 4.2 |
| Fidelity Series Long-Term Treasury Bond Index Fund | 3.0 |
| 81.8 |
Asset Allocation (% of fund's net assets)
| Period end | ||
| Domestic Equity Funds | 9.1% | |
| International Equity Funds | 12.5% | |
| Bond Funds | 55.6% | |
| Short-Term Funds | 22.8% | |

Domestic Equity Funds category includes Fidelity Series Commodity Strategy Fund which invests in commodity-related investments.
Fidelity Managed Retirement Income Fund℠
Schedule of Investments July 31, 2021
Showing Percentage of Net Assets
| Domestic Equity Funds - 9.1% | |||
| Shares | Value | ||
| Fidelity Series Blue Chip Growth Fund (a) | 15,802 | $305,614 | |
| Fidelity Series Commodity Strategy Fund (a) | 104,113 | 588,241 | |
| Fidelity Series Large Cap Growth Index Fund (a) | 10,730 | 194,958 | |
| Fidelity Series Large Cap Stock Fund (a) | 10,856 | 214,616 | |
| Fidelity Series Large Cap Value Index Fund (a) | 26,664 | 415,427 | |
| Fidelity Series Small Cap Opportunities Fund (a) | 5,702 | 103,098 | |
| Fidelity Series Value Discovery Fund (a) | 8,986 | 152,669 | |
| TOTAL DOMESTIC EQUITY FUNDS | |||
| (Cost $1,550,064) | 1,974,623 | ||
| International Equity Funds - 12.5% | |||
| Fidelity Series Canada Fund (a) | 10,222 | 143,413 | |
| Fidelity Series Emerging Markets Fund (a) | 11,397 | 127,986 | |
| Fidelity Series Emerging Markets Opportunities Fund (a) | 47,049 | 1,175,276 | |
| Fidelity Series International Growth Fund (a) | 16,972 | 341,984 | |
| Fidelity Series International Index Fund (a) | 11,450 | 141,976 | |
| Fidelity Series International Small Cap Fund (a) | 5,159 | 119,991 | |
| Fidelity Series International Value Fund (a) | 30,149 | 339,171 | |
| Fidelity Series Overseas Fund (a) | 24,142 | 342,812 | |
| TOTAL INTERNATIONAL EQUITY FUNDS | |||
| (Cost $2,152,788) | 2,732,609 | ||
| Bond Funds - 55.6% | |||
| Fidelity Series Corporate Bond Fund (a) | 162,143 | 1,830,594 | |
| Fidelity Series Emerging Markets Debt Fund (a) | 12,755 | 119,000 | |
| Fidelity Series Emerging Markets Debt Local Currency Fund (a) | 3,747 | 38,669 | |
| Fidelity Series Floating Rate High Income Fund (a) | 2,505 | 23,067 | |
| Fidelity Series Government Bond Index Fund (a) | 214,888 | 2,312,193 | |
| Fidelity Series High Income Fund (a) | 14,310 | 137,235 | |
| Fidelity Series Inflation-Protected Bond Index Fund (a) | 232,940 | 2,615,921 | |
| Fidelity Series International Credit Fund (a) | 882 | 8,972 | |
| Fidelity Series Investment Grade Bond Fund (a) | 213,063 | 2,522,667 | |
| Fidelity Series Investment Grade Securitized Fund (a) | 167,014 | 1,740,283 | |
| Fidelity Series Long-Term Treasury Bond Index Fund (a) | 75,877 | 657,097 | |
| Fidelity Series Real Estate Income Fund (a) | 7,037 | 82,828 | |
| TOTAL BOND FUNDS | |||
| (Cost $11,524,806) | 12,088,526 | ||
| Short-Term Funds - 22.8% | |||
| Fidelity Series Government Money Market Fund 0.07% (a)(b) | 1,067,298 | 1,067,298 | |
| Fidelity Series Short-Term Credit Fund (a) | 89,916 | 915,344 | |
| Fidelity Series Treasury Bill Index Fund (a) | 297,314 | 2,973,135 | |
| TOTAL SHORT-TERM FUNDS | |||
| (Cost $4,942,776) | 4,955,777 | ||
| TOTAL INVESTMENT IN SECURITIES - 100.0% | |||
| (Cost $20,170,434) | 21,751,535 | ||
| NET OTHER ASSETS (LIABILITIES) - 0.0% | (506) | ||
| NET ASSETS - 100% | $21,751,029 |
Legend
(a) Affiliated Fund
(b) The rate quoted is the annualized seven-day yield of the fund at period end.
Affiliated Underlying Funds
Fiscal year to date information regarding the Fund's investments in affiliated Underlying Funds is presented below. Exchanges between classes of the same affiliated Underlying Funds may occur. If an underlying Fund changes its name, the name presented below is the name in effect at period end.
| Affiliate | Value, beginning of period | Purchases | Sales Proceeds | Dividend Income | Realized Gain (loss) | Change in Unrealized appreciation (depreciation) | Value, end of period |
| Fidelity Series Blue Chip Growth Fund | $217,859 | $240,327 | $172,508 | $79,089 | $4,784 | $15,152 | $305,614 |
| Fidelity Series Canada Fund | 74,503 | 74,081 | 34,980 | 1,800 | 779 | 29,030 | 143,413 |
| Fidelity Series Commodity Strategy Fund | 384,476 | 275,772 | 229,614 | 1,895 | 6,972 | 150,635 | 588,241 |
| Fidelity Series Corporate Bond Fund | 1,347,592 | 807,318 | 307,981 | 57,258 | (404) | (15,931) | 1,830,594 |
| Fidelity Series Emerging Markets Debt Fund | 102,922 | 48,772 | 34,432 | 4,904 | (1,566) | 3,304 | 119,000 |
| Fidelity Series Emerging Markets Debt Local Currency Fund | -- | 43,790 | 5,497 | 474 | 54 | 322 | 38,669 |
| Fidelity Series Emerging Markets Fund | 107,769 | 66,698 | 69,322 | 1,770 | 3,233 | 19,608 | 127,986 |
| Fidelity Series Emerging Markets Opportunities Fund | 983,193 | 651,436 | 667,541 | 33,998 | 43,548 | 164,640 | 1,175,276 |
| Fidelity Series Floating Rate High Income Fund | 21,209 | 10,482 | 9,767 | 940 | (175) | 1,318 | 23,067 |
| Fidelity Series Government Bond Index Fund | 1,594,418 | 1,083,461 | 274,960 | 48,121 | (2,613) | (88,113) | 2,312,193 |
| Fidelity Series Government Money Market Fund 0.07% | 885,768 | 1,563,075 | 1,381,545 | 1,389 | -- | -- | 1,067,298 |
| Fidelity Series High Income Fund | 112,680 | 57,946 | 38,893 | 6,494 | 98 | 5,404 | 137,235 |
| Fidelity Series Inflation-Protected Bond Index Fund | 1,843,704 | 994,763 | 356,755 | 25,718 | 654 | 133,555 | 2,615,921 |
| Fidelity Series International Credit Fund | 8,567 | 587 | -- | 587 | -- | (182) | 8,972 |
| Fidelity Series International Growth Fund | 197,477 | 206,310 | 92,802 | 31,913 | 1,468 | 29,531 | 341,984 |
| Fidelity Series International Index Fund | 81,082 | 73,207 | 35,152 | 1,779 | 948 | 21,891 | 141,976 |
| Fidelity Series International Small Cap Fund | 66,266 | 51,895 | 25,476 | 681 | 827 | 26,479 | 119,991 |
| Fidelity Series International Value Fund | 196,856 | 188,962 | 109,006 | 6,239 | 1,677 | 60,682 | 339,171 |
| Fidelity Series Investment Grade Bond Fund | 1,778,370 | 1,149,990 | 334,288 | 117,306 | (2,032) | (69,373) | 2,522,667 |
| Fidelity Series Investment Grade Securitized Fund | 1,202,552 | 784,051 | 217,101 | 38,172 | (714) | (28,505) | 1,740,283 |
| Fidelity Series Large Cap Growth Index Fund | 149,519 | 112,062 | 116,292 | 3,019 | 3,869 | 45,800 | 194,958 |
| Fidelity Series Large Cap Stock Fund | 152,816 | 120,357 | 117,103 | 9,289 | 6,918 | 51,628 | 214,616 |
| Fidelity Series Large Cap Value Index Fund | 289,412 | 230,125 | 212,298 | 7,034 | 10,114 | 98,074 | 415,427 |
| Fidelity Series Long-Term Treasury Bond Index Fund | 355,344 | 481,314 | 109,278 | 41,318 | (7,319) | (62,964) | 657,097 |
| Fidelity Series Overseas Fund | 197,866 | 173,258 | 92,447 | 2,550 | 3,015 | 61,120 | 342,812 |
| Fidelity Series Real Estate Income Fund | 64,573 | 35,143 | 29,143 | 3,637 | (242) | 12,497 | 82,828 |
| Fidelity Series Short-Term Credit Fund | 644,612 | 336,248 | 60,681 | 13,423 | 273 | (5,108) | 915,344 |
| Fidelity Series Small Cap Opportunities Fund | 72,999 | 49,002 | 49,046 | 1,770 | 5,792 | 24,351 | 103,098 |
| Fidelity Series Treasury Bill Index Fund | 2,130,496 | 1,079,601 | 234,833 | 3,115 | (451) | (1,678) | 2,973,135 |
| Fidelity Series Value Discovery Fund | 103,258 | 81,953 | 75,469 | 2,689 | 3,561 | 39,366 | 152,669 |
| $15,368,158 | $11,071,986 | $5,494,210 | $548,371 | $83,068 | $722,533 | $21,751,535 |
Amounts in the income column in the above table include any capital gain distributions from underlying funds, which are presented in the corresponding line-item in the Statement of Operations, if applicable.
Investment Valuation
The following is a summary of the inputs used, as of July 31, 2021, involving the Fund's assets and liabilities carried at fair value. The inputs or methodology used for valuing securities may not be an indication of the risk associated with investing in those securities. For more information on valuation inputs, and their aggregation into the levels used below, please refer to the Investment Valuation section in the accompanying Notes to Financial Statements.
| Valuation Inputs at Reporting Date: | ||||
| Description | Total | Level 1 | Level 2 | Level 3 |
| Investments in Securities: | ||||
| Domestic Equity Funds | $1,974,623 | $1,974,623 | $-- | $-- |
| International Equity Funds | 2,732,609 | 2,732,609 | -- | -- |
| Bond Funds | 12,088,526 | 12,088,526 | -- | -- |
| Short-Term Funds | 4,955,777 | 4,955,777 | -- | -- |
| Total Investments in Securities: | $21,751,535 | $21,751,535 | $-- | $-- |
See accompanying notes which are an integral part of the financial statements.
Fidelity Managed Retirement Income Fund℠
Financial Statements
Statement of Assets and Liabilities
| July 31, 2021 | ||
| Assets | ||
| Investment in securities, at value — See accompanying schedule: | ||
| Affiliated issuers (cost $20,170,434) | $21,751,535 | |
| Total Investment in Securities (cost $20,170,434) | $21,751,535 | |
| Cash | 14 | |
| Receivable for investments sold | 114,525 | |
| Receivable for fund shares sold | 800 | |
| Total assets | 21,866,874 | |
| Liabilities | ||
| Payable for investments purchased | $106,712 | |
| Payable for fund shares redeemed | 1,197 | |
| Accrued management fee | 7,789 | |
| Distribution and service plan fees payable | 147 | |
| Total liabilities | 115,845 | |
| Net Assets | $21,751,029 | |
| Net Assets consist of: | ||
| Paid in capital | $20,069,021 | |
| Total accumulated earnings (loss) | 1,682,008 | |
| Net Assets | $21,751,029 | |
| Net Asset Value and Maximum Offering Price | ||
| Class A: | ||
| Net Asset Value and redemption price per share ($716,441 ÷ 11,278.45 shares)(a) | $63.52 | |
| Maximum offering price per share (100/94.25 of $63.52) | $67.40 | |
| Fidelity Managed Retirement Income: | ||
| Net Asset Value, offering price and redemption price per share ($19,995,143 ÷ 314,782.00 shares) | $63.52 | |
| Class K: | ||
| Net Asset Value, offering price and redemption price per share ($115,217 ÷ 1,813.33 shares) | $63.54 | |
| Class K6: | ||
| Net Asset Value, offering price and redemption price per share ($538,758 ÷ 8,477.13 shares) | $63.55 | |
| Class I: | ||
| Net Asset Value, offering price and redemption price per share ($270,023 ÷ 4,246.82 shares) | $63.58 | |
| Class Z6: | ||
| Net Asset Value, offering price and redemption price per share ($115,447 ÷ 1,817.52 shares) | $63.52 |
(a) Redemption price per share is equal to net asset value less any applicable contingent deferred sales charge.
See accompanying notes which are an integral part of the financial statements.
Statement of Operations
| Year ended July 31, 2021 | ||
| Investment Income | ||
| Dividends: | ||
| Affiliated issuers | $215,356 | |
| Expenses | ||
| Management fee | $79,797 | |
| Distribution and service plan fees | 1,334 | |
| Independent trustees' fees and expenses | 49 | |
| Total expenses | 81,180 | |
| Net investment income (loss) | 134,176 | |
| Realized and Unrealized Gain (Loss) | ||
| Net realized gain (loss) on: | ||
| Investment securities: | ||
| Affiliated issuers | 83,068 | |
| Capital gain distributions from underlying funds: | ||
| Affiliated issuers | 333,015 | |
| Total net realized gain (loss) | 416,083 | |
| Change in net unrealized appreciation (depreciation) on: | ||
| Investment securities: | ||
| Affiliated issuers | 722,533 | |
| Total change in net unrealized appreciation (depreciation) | 722,533 | |
| Net gain (loss) | 1,138,616 | |
| Net increase (decrease) in net assets resulting from operations | $1,272,792 |
See accompanying notes which are an integral part of the financial statements.
Statement of Changes in Net Assets
| Year ended July 31, 2021 | Year ended July 31, 2020 | |
| Increase (Decrease) in Net Assets | ||
| Operations | ||
| Net investment income (loss) | $134,176 | $117,013 |
| Net realized gain (loss) | 416,083 | 40,718 |
| Change in net unrealized appreciation (depreciation) | 722,533 | 417,240 |
| Net increase (decrease) in net assets resulting from operations | 1,272,792 | 574,971 |
| Distributions to shareholders | (380,031) | (179,542) |
| Share transactions - net increase (decrease) | 5,492,802 | 8,637,532 |
| Total increase (decrease) in net assets | 6,385,563 | 9,032,961 |
| Net Assets | ||
| Beginning of period | 15,365,466 | 6,332,505 |
| End of period | $21,751,029 | $15,365,466 |
See accompanying notes which are an integral part of the financial statements.
Financial Highlights
Fidelity Managed Retirement Income Fund Class A
| Years ended July 31, | 2021 | 2020 | 2019 | 2018 | 2017 |
| Selected Per–Share Data | |||||
| Net asset value, beginning of period | $60.44 | $57.74 | $57.55 | $61.00 | $59.02 |
| Income from Investment Operations | |||||
| Net investment income (loss)A | .309 | .684 | 1.029 | .884 | .756 |
| Net realized and unrealized gain (loss) | 4.009 | 3.226 | 1.594 | .494 | 2.008 |
| Total from investment operations | 4.318 | 3.910 | 2.623 | 1.378 | 2.764 |
| Distributions from net investment income | (.329) | (.776) | (1.047) | (.853) | (.717) |
| Distributions from net realized gain | (.909) | (.434) | (1.386) | (3.975) | (.067) |
| Total distributions | (1.238) | (1.210) | (2.433) | (4.828) | (.784) |
| Net asset value, end of period | $63.52 | $60.44 | $57.74 | $57.55 | $61.00 |
| Total ReturnB,C | 7.21% | 6.86% | 4.78% | 2.35% | 4.73% |
| Ratios to Average Net AssetsD,E,F | |||||
| Expenses before reductions | .70% | .70% | .71% | .71%G | .32% |
| Expenses net of fee waivers, if any | .70% | .70% | .71% | .71%G | .32% |
| Expenses net of all reductions | .70% | .70% | .71% | .71%G | .32% |
| Net investment income (loss) | .50% | 1.18% | 1.83% | 1.51% | 1.27% |
| Supplemental Data | |||||
| Net assets, end of period (000 omitted) | $716 | $453 | $177 | $147 | $287 |
| Portfolio turnover rateF | 31% | 62%H | 68% | 19% | 111% |
A Calculated based on average shares outstanding during the period.
B Total returns would have been lower if certain expenses had not been reduced during the applicable periods shown.
C Total returns do not include the effect of the sales charges.
D Fees and expenses of any underlying mutual funds or exchange-traded funds (ETFs) are not included in the Fund's expense ratio. The Fund indirectly bears its proportionate share of these expenses.
E Expense ratios reflect operating expenses of the class. Expenses before reductions do not reflect amounts reimbursed, waived, or reduced through arrangements with the investment adviser, brokerage services, or other offset arrangements, if applicable, and do not represent the amount paid by the class during periods when reimbursements, waivers or reductions occur.
F Amount does not include the portfolio activity of any underlying mutual funds or exchange-traded funds (ETFs).
G On certain classes, the size and fluctuation of net assets and expense amounts may cause ratios to differ from contractual rates.
H The portfolio turnover rate does not include the assets acquired in the merger.
See accompanying notes which are an integral part of the financial statements.
Fidelity Managed Retirement Income Fund
| Years ended July 31, | 2021 | 2020 | 2019 | 2018 | 2017 |
| Selected Per–Share Data | |||||
| Net asset value, beginning of period | $60.42 | $57.73 | $57.54 | $61.00 | $59.01 |
| Income from Investment Operations | |||||
| Net investment income (loss)A | .464 | .829 | 1.170 | 1.024 | .905 |
| Net realized and unrealized gain (loss) | 4.011 | 3.220 | 1.589 | .512 | 2.003 |
| Total from investment operations | 4.475 | 4.049 | 2.759 | 1.536 | 2.908 |
| Distributions from net investment income | (.466) | (.925) | (1.183) | (1.021) | (.851) |
| Distributions from net realized gain | (.909) | (.434) | (1.386) | (3.975) | (.067) |
| Total distributions | (1.375) | (1.359) | (2.569) | (4.996) | (.918) |
| Net asset value, end of period | $63.52 | $60.42 | $57.73 | $57.54 | $61.00 |
| Total ReturnB | 7.48% | 7.12% | 5.04% | 2.63% | 4.98% |
| Ratios to Average Net AssetsC,D,E | |||||
| Expenses before reductions | .45% | .45% | .46% | .47% | .07% |
| Expenses net of fee waivers, if any | .45% | .45% | .46% | .47% | .07% |
| Expenses net of all reductions | .45% | .45% | .46% | .46% | .07% |
| Net investment income (loss) | .75% | 1.43% | 2.08% | 1.76% | 1.52% |
| Supplemental Data | |||||
| Net assets, end of period (000 omitted) | $19,995 | $13,965 | $6,060 | $6,734 | $10,828 |
| Portfolio turnover rateE | 31% | 62%F | 68% | 19% | 111% |
A Calculated based on average shares outstanding during the period.
B Total returns would have been lower if certain expenses had not been reduced during the applicable periods shown.
C Fees and expenses of any underlying mutual funds or exchange-traded funds (ETFs) are not included in the Fund's expense ratio. The Fund indirectly bears its proportionate share of these expenses.
D Expense ratios reflect operating expenses of the class. Expenses before reductions do not reflect amounts reimbursed, waived, or reduced through arrangements with the investment adviser, brokerage services, or other offset arrangements, if applicable, and do not represent the amount paid by the class during periods when reimbursements, waivers or reductions occur.
E Amount does not include the portfolio activity of any underlying mutual funds or exchange-traded funds (ETFs).
F The portfolio turnover rate does not include the assets acquired in the merger.
See accompanying notes which are an integral part of the financial statements.
Fidelity Managed Retirement Income Fund Class K
| Years ended July 31, | 2021 | 2020 A |
| Selected Per–Share Data | ||
| Net asset value, beginning of period | $60.43 | $57.81 |
| Income from Investment Operations | ||
| Net investment income (loss)B | .526 | .889 |
| Net realized and unrealized gain (loss) | 4.010 | 3.146 |
| Total from investment operations | 4.536 | 4.035 |
| Distributions from net investment income | (.517) | (.981) |
| Distributions from net realized gain | (.909) | (.434) |
| Total distributions | (1.426) | (1.415) |
| Net asset value, end of period | $63.54 | $60.43 |
| Total Return | 7.59% | 7.09%C |
| Ratios to Average Net AssetsD,E,F | ||
| Expenses before reductions | .35% | .35% |
| Expenses net of fee waivers, if any | .35% | .35% |
| Expenses net of all reductions | .35% | .35% |
| Net investment income (loss) | .85% | 1.53% |
| Supplemental Data | ||
| Net assets, end of period (000 omitted) | $115 | $107 |
| Portfolio turnover rateF | 31% | 62%G |
A For the period August 1, 2019 (commencement of sale of shares) to July 31, 2020.
B Calculated based on average shares outstanding during the period.
C Total returns for periods of less than one year are not annualized.
D Fees and expenses of any underlying mutual funds or exchange-traded funds (ETFs) are not included in the Fund's expense ratio. The Fund indirectly bears its proportionate share of these expenses.
E Expense ratios reflect operating expenses of the class. Expenses before reductions do not reflect amounts reimbursed, waived, or reduced through arrangements with the investment adviser, brokerage services, or other offset arrangements, if applicable, and do not represent the amount paid by the class during periods when reimbursements, waivers or reductions occur.
F Amount does not include the portfolio activity of any underlying mutual funds or exchange-traded funds (ETFs).
G The portfolio turnover rate does not include the assets acquired in the merger.
See accompanying notes which are an integral part of the financial statements.
Fidelity Managed Retirement Income Fund Class K6
| Years ended July 31, | 2021 | 2020 A |
| Selected Per–Share Data | ||
| Net asset value, beginning of period | $60.42 | $57.81 |
| Income from Investment Operations | ||
| Net investment income (loss)B | .588 | .941 |
| Net realized and unrealized gain (loss) | 4.005 | 3.151 |
| Total from investment operations | 4.593 | 4.092 |
| Distributions from net investment income | (.554) | (1.048) |
| Distributions from net realized gain | (.909) | (.434) |
| Total distributions | (1.463) | (1.482) |
| Net asset value, end of period | $63.55 | $60.42 |
| Total Return | 7.69% | 7.20%C |
| Ratios to Average Net AssetsD,E,F | ||
| Expenses before reductions | .25% | .25% |
| Expenses net of fee waivers, if any | .25% | .25% |
| Expenses net of all reductions | .25% | .25% |
| Net investment income (loss) | .95% | 1.62% |
| Supplemental Data | ||
| Net assets, end of period (000 omitted) | $539 | $434 |
| Portfolio turnover rateF | 31% | 62%G |
A For the period August 1, 2019 (commencement of sale of shares) to July 31, 2020.
B Calculated based on average shares outstanding during the period.
C Total returns for periods of less than one year are not annualized.
D Fees and expenses of any underlying mutual funds or exchange-traded funds (ETFs) are not included in the Fund's expense ratio. The Fund indirectly bears its proportionate share of these expenses.
E Expense ratios reflect operating expenses of the class. Expenses before reductions do not reflect amounts reimbursed, waived, or reduced through arrangements with the investment adviser, brokerage services, or other offset arrangements, if applicable, and do not represent the amount paid by the class during periods when reimbursements, waivers or reductions occur.
F Amount does not include the portfolio activity of any underlying mutual funds or exchange-traded funds (ETFs).
G The portfolio turnover rate does not include the assets acquired in the merger.
See accompanying notes which are an integral part of the financial statements.
Fidelity Managed Retirement Income Fund Class I
| Years ended July 31, | 2021 | 2020 | 2019 | 2018 | 2017 |
| Selected Per–Share Data | |||||
| Net asset value, beginning of period | $60.48 | $57.71 | $57.52 | $60.99 | $58.99 |
| Income from Investment Operations | |||||
| Net investment income (loss)A | .464 | .828 | 1.167 | 1.025 | .906 |
| Net realized and unrealized gain (loss) | 4.011 | 3.233 | 1.593 | .500 | 2.013 |
| Total from investment operations | 4.475 | 4.061 | 2.760 | 1.525 | 2.919 |
| Distributions from net investment income | (.466) | (.857) | (1.184) | (1.020) | (.852) |
| Distributions from net realized gain | (.909) | (.434) | (1.386) | (3.975) | (.067) |
| Total distributions | (1.375) | (1.291) | (2.570) | (4.995) | (.919) |
| Net asset value, end of period | $63.58 | $60.48 | $57.71 | $57.52 | $60.99 |
| Total ReturnB | 7.48% | 7.14% | 5.04% | 2.62% | 5.01% |
| Ratios to Average Net AssetsC,D,E | |||||
| Expenses before reductions | .45% | .45% | .46% | .46%F | .07% |
| Expenses net of fee waivers, if any | .45% | .45% | .46% | .46%F | .07% |
| Expenses net of all reductions | .45% | .45% | .46% | .46%F | .07% |
| Net investment income (loss) | .75% | 1.43% | 2.08% | 1.76% | 1.52% |
| Supplemental Data | |||||
| Net assets, end of period (000 omitted) | $270 | $300 | $96 | $61 | $94 |
| Portfolio turnover rateE | 31% | 62%G | 68% | 19% | 111% |
A Calculated based on average shares outstanding during the period.
B Total returns would have been lower if certain expenses had not been reduced during the applicable periods shown.
C Fees and expenses of any underlying mutual funds or exchange-traded funds (ETFs) are not included in the Fund's expense ratio. The Fund indirectly bears its proportionate share of these expenses.
D Expense ratios reflect operating expenses of the class. Expenses before reductions do not reflect amounts reimbursed, waived, or reduced through arrangements with the investment adviser, brokerage services, or other offset arrangements, if applicable, and do not represent the amount paid by the class during periods when reimbursements, waivers or reductions occur.
E Amount does not include the portfolio activity of any underlying mutual funds or exchange-traded funds (ETFs).
F On certain classes, the size and fluctuation of net assets and expense amounts may cause ratios to differ from contractual rates.
G The portfolio turnover rate does not include the assets acquired in the merger.
See accompanying notes which are an integral part of the financial statements.
Fidelity Managed Retirement Income Fund Class Z6
| Years ended July 31, | 2021 | 2020 A |
| Selected Per–Share Data | ||
| Net asset value, beginning of period | $60.41 | $57.79 |
| Income from Investment Operations | ||
| Net investment income (loss)B | .588 | .947 |
| Net realized and unrealized gain (loss) | 4.008 | 3.145 |
| Total from investment operations | 4.596 | 4.092 |
| Distributions from net investment income | (.577) | (1.038) |
| Distributions from net realized gain | (.909) | (.434) |
| Total distributions | (1.486) | (1.472) |
| Net asset value, end of period | $63.52 | $60.41 |
| Total Return | 7.69% | 7.20%C |
| Ratios to Average Net AssetsD,E,F | ||
| Expenses before reductions | .25% | .25% |
| Expenses net of fee waivers, if any | .25% | .25% |
| Expenses net of all reductions | .25% | .25% |
| Net investment income (loss) | .95% | 1.62% |
| Supplemental Data | ||
| Net assets, end of period (000 omitted) | $115 | $107 |
| Portfolio turnover rateF | 31% | 62%G |
A For the period August 1, 2019 (commencement of sale of shares) to July 31, 2020.
B Calculated based on average shares outstanding during the period.
C Total returns for periods of less than one year are not annualized.
D Fees and expenses of any underlying mutual funds or exchange-traded funds (ETFs) are not included in the Fund's expense ratio. The Fund indirectly bears its proportionate share of these expenses.
E Expense ratios reflect operating expenses of the class. Expenses before reductions do not reflect amounts reimbursed, waived, or reduced through arrangements with the investment adviser, brokerage services, or other offset arrangements, if applicable, and do not represent the amount paid by the class during periods when reimbursements, waivers or reductions occur.
F Amount does not include the portfolio activity of any underlying mutual funds or exchange-traded funds (ETFs).
G The portfolio turnover rate does not include the assets acquired in the merger.
See accompanying notes which are an integral part of the financial statements.
Fidelity Managed Retirement 2010 Fund℠
Investment Summary (Unaudited)
The information in the following tables is based on the direct investments of the Fund.Top Holdings as of July 31, 2021
| % of fund's net assets | |
| Fidelity Series Treasury Bill Index Fund | 12.0 |
| Fidelity Series Investment Grade Bond Fund | 11.1 |
| Fidelity Series Inflation-Protected Bond Index Fund | 11.1 |
| Fidelity Series Government Bond Index Fund | 10.1 |
| Fidelity Series Corporate Bond Fund | 8.0 |
| Fidelity Series Investment Grade Securitized Fund | 7.6 |
| Fidelity Series Emerging Markets Opportunities Fund | 6.0 |
| Fidelity Series Government Money Market Fund 0.07% | 4.3 |
| Fidelity Series Short-Term Credit Fund | 3.7 |
| Fidelity Series Long-Term Treasury Bond Index Fund | 3.0 |
| 76.9 |
Asset Allocation (% of fund's net assets)
| Period end | ||
| Domestic Equity Funds | 12.4% | |
| International Equity Funds | 14.8% | |
| Bond Funds | 52.8% | |
| Short-Term Funds | 20.0% | |

Domestic Equity Funds category includes Fidelity Series Commodity Strategy Fund which invests in commodity-related investments.
Fidelity Managed Retirement 2010 Fund℠
Schedule of Investments July 31, 2021
Showing Percentage of Net Assets
| Domestic Equity Funds - 12.4% | |||
| Shares | Value | ||
| Fidelity Series Blue Chip Growth Fund (a) | 8,534 | $165,049 | |
| Fidelity Series Commodity Strategy Fund (a) | 36,911 | 208,548 | |
| Fidelity Series Large Cap Growth Index Fund (a) | 5,795 | 105,291 | |
| Fidelity Series Large Cap Stock Fund (a) | 5,863 | 115,906 | |
| Fidelity Series Large Cap Value Index Fund (a) | 14,401 | 224,375 | |
| Fidelity Series Small Cap Opportunities Fund (a) | 3,080 | 55,682 | |
| Fidelity Series Value Discovery Fund (a) | 4,853 | 82,452 | |
| TOTAL DOMESTIC EQUITY FUNDS | |||
| (Cost $703,461) | 957,303 | ||
| International Equity Funds - 14.8% | |||
| Fidelity Series Canada Fund (a) | 4,484 | 62,904 | |
| Fidelity Series Emerging Markets Fund (a) | 4,423 | 49,667 | |
| Fidelity Series Emerging Markets Opportunities Fund (a) | 18,499 | 462,107 | |
| Fidelity Series International Growth Fund (a) | 7,452 | 150,155 | |
| Fidelity Series International Index Fund (a) | 5,022 | 62,272 | |
| Fidelity Series International Small Cap Fund (a) | 2,267 | 52,722 | |
| Fidelity Series International Value Fund (a) | 13,237 | 148,917 | |
| Fidelity Series Overseas Fund (a) | 10,600 | 150,520 | |
| TOTAL INTERNATIONAL EQUITY FUNDS | |||
| (Cost $864,970) | 1,139,264 | ||
| Bond Funds - 52.8% | |||
| Fidelity Series Corporate Bond Fund (a) | 54,818 | 618,891 | |
| Fidelity Series Emerging Markets Debt Fund (a) | 4,490 | 41,887 | |
| Fidelity Series Emerging Markets Debt Local Currency Fund (a) | 1,314 | 13,557 | |
| Fidelity Series Floating Rate High Income Fund (a) | 875 | 8,062 | |
| Fidelity Series Government Bond Index Fund (a) | 72,627 | 781,464 | |
| Fidelity Series High Income Fund (a) | 5,075 | 48,672 | |
| Fidelity Series Inflation-Protected Bond Index Fund (a) | 75,838 | 851,662 | |
| Fidelity Series International Credit Fund (a) | 607 | 6,175 | |
| Fidelity Series Investment Grade Bond Fund (a) | 72,032 | 852,859 | |
| Fidelity Series Investment Grade Securitized Fund (a) | 56,461 | 588,327 | |
| Fidelity Series Long-Term Treasury Bond Index Fund (a) | 26,901 | 232,966 | |
| Fidelity Series Real Estate Income Fund (a) | 2,495 | 29,365 | |
| TOTAL BOND FUNDS | |||
| (Cost $3,785,549) | 4,073,887 | ||
| Short-Term Funds - 20.0% | |||
| Fidelity Series Government Money Market Fund 0.07% (a)(b) | 331,584 | 331,584 | |
| Fidelity Series Short-Term Credit Fund (a) | 27,894 | 283,966 | |
| Fidelity Series Treasury Bill Index Fund (a) | 92,326 | 923,262 | |
| TOTAL SHORT-TERM FUNDS | |||
| (Cost $1,533,587) | 1,538,812 | ||
| TOTAL INVESTMENT IN SECURITIES - 100.0% | |||
| (Cost $6,887,567) | 7,709,266 | ||
| NET OTHER ASSETS (LIABILITIES) - 0.0% | (167) | ||
| NET ASSETS - 100% | $7,709,099 |
Legend
(a) Affiliated Fund
(b) The rate quoted is the annualized seven-day yield of the fund at period end.
Affiliated Underlying Funds
Fiscal year to date information regarding the Fund's investments in affiliated Underlying Funds is presented below. Exchanges between classes of the same affiliated Underlying Funds may occur. If an underlying Fund changes its name, the name presented below is the name in effect at period end.
| Affiliate | Value, beginning of period | Purchases | Sales Proceeds | Dividend Income | Realized Gain (loss) | Change in Unrealized appreciation (depreciation) | Value, end of period |
| Fidelity Series Blue Chip Growth Fund | $187,832 | $112,595 | $146,771 | $62,180 | $5,648 | $5,745 | $165,049 |
| Fidelity Series Canada Fund | 52,774 | 21,551 | 29,470 | 1,133 | 2,768 | 15,281 | 62,904 |
| Fidelity Series Commodity Strategy Fund | 197,167 | 62,382 | 121,024 | 916 | (3,535) | 73,558 | 208,548 |
| Fidelity Series Corporate Bond Fund | 649,552 | 186,020 | 205,106 | 24,201 | (597) | (10,978) | 618,891 |
| Fidelity Series Emerging Markets Debt Fund | 52,451 | 8,677 | 20,080 | 2,140 | (1,715) | 2,554 | 41,887 |
| Fidelity Series Emerging Markets Debt Local Currency Fund | -- | 17,170 | 3,866 | 217 | 47 | 206 | 13,557 |
| Fidelity Series Emerging Markets Fund | 62,004 | 11,720 | 37,180 | 924 | 3,813 | 9,310 | 49,667 |
| Fidelity Series Emerging Markets Opportunities Fund | 565,776 | 144,203 | 365,597 | 17,639 | 60,075 | 57,650 | 462,107 |
| Fidelity Series Floating Rate High Income Fund | 10,459 | 1,636 | 4,559 | 401 | (131) | 657 | 8,062 |
| Fidelity Series Government Bond Index Fund | 768,214 | 267,726 | 210,358 | 20,873 | (3,600) | (40,518) | 781,464 |
| Fidelity Series Government Money Market Fund 0.07% | 53,058 | 819,971 | 541,445 | 204 | -- | -- | 331,584 |
| Fidelity Series High Income Fund | 55,302 | 9,539 | 18,453 | 2,772 | (383) | 2,667 | 48,672 |
| Fidelity Series Inflation-Protected Bond Index Fund | 847,006 | 193,358 | 239,154 | 10,847 | 5,245 | 45,207 | 851,662 |
| Fidelity Series International Credit Fund | 5,896 | 405 | -- | 404 | -- | (126) | 6,175 |
| Fidelity Series International Growth Fund | 139,876 | 71,726 | 78,747 | 20,093 | 6,788 | 10,512 | 150,155 |
| Fidelity Series International Index Fund | 57,430 | 19,995 | 29,486 | 1,120 | 3,192 | 11,141 | 62,272 |
| Fidelity Series International Small Cap Fund | 46,937 | 11,913 | 22,660 | 437 | 3,011 | 13,521 | 52,722 |
| Fidelity Series International Value Fund | 139,434 | 56,455 | 86,416 | 3,928 | 36 | 39,408 | 148,917 |
| Fidelity Series Investment Grade Bond Fund | 857,060 | 282,095 | 250,345 | 51,276 | (2,249) | (33,702) | 852,859 |
| Fidelity Series Investment Grade Securitized Fund | 579,334 | 187,733 | 164,619 | 16,946 | (859) | (13,262) | 588,327 |
| Fidelity Series Large Cap Growth Index Fund | 128,909 | 37,088 | 96,119 | 2,164 | 12,644 | 22,769 | 105,291 |
| Fidelity Series Large Cap Stock Fund | 131,752 | 41,649 | 100,037 | 7,656 | 10,277 | 32,265 | 115,906 |
| Fidelity Series Large Cap Value Index Fund | 249,520 | 77,313 | 182,144 | 5,310 | 21,176 | 58,510 | 224,375 |
| Fidelity Series Long-Term Treasury Bond Index Fund | 182,310 | 154,594 | 66,945 | 18,717 | (3,664) | (33,329) | 232,966 |
| Fidelity Series Overseas Fund | 140,153 | 49,311 | 76,449 | 1,606 | 10,900 | 26,605 | 150,520 |
| Fidelity Series Real Estate Income Fund | 31,209 | 5,645 | 12,760 | 1,601 | (186) | 5,457 | 29,365 |
| Fidelity Series Short-Term Credit Fund | 349,334 | 91,022 | 153,900 | 6,401 | 2,019 | (4,509) | 283,966 |
| Fidelity Series Small Cap Opportunities Fund | 62,936 | 13,818 | 43,969 | 1,366 | 10,819 | 12,078 | 55,682 |
| Fidelity Series Treasury Bill Index Fund | 1,188,717 | 292,514 | 556,781 | 1,580 | 162 | (1,350) | 923,262 |
| Fidelity Series Value Discovery Fund | 89,027 | 27,583 | 66,089 | 2,032 | 5,465 | 26,466 | 82,452 |
| $7,881,429 | $3,277,407 | $3,930,529 | $287,084 | $147,166 | $333,793 | $7,709,266 |
Amounts in the income column in the above table include any capital gain distributions from underlying funds, which are presented in the corresponding line-item in the Statement of Operations, if applicable.
Investment Valuation
The following is a summary of the inputs used, as of July 31, 2021, involving the Fund's assets and liabilities carried at fair value. The inputs or methodology used for valuing securities may not be an indication of the risk associated with investing in those securities. For more information on valuation inputs, and their aggregation into the levels used below, please refer to the Investment Valuation section in the accompanying Notes to Financial Statements.
| Valuation Inputs at Reporting Date: | ||||
| Description | Total | Level 1 | Level 2 | Level 3 |
| Investments in Securities: | ||||
| Domestic Equity Funds | $957,303 | $957,303 | $-- | $-- |
| International Equity Funds | 1,139,264 | 1,139,264 | -- | -- |
| Bond Funds | 4,073,887 | 4,073,887 | -- | -- |
| Short-Term Funds | 1,538,812 | 1,538,812 | -- | -- |
| Total Investments in Securities: | $7,709,266 | $7,709,266 | $-- | $-- |
See accompanying notes which are an integral part of the financial statements.
Fidelity Managed Retirement 2010 Fund℠
Financial Statements
Statement of Assets and Liabilities
| July 31, 2021 | ||
| Assets | ||
| Investment in securities, at value — See accompanying schedule: | ||
| Affiliated issuers (cost $6,887,567) | $7,709,266 | |
| Total Investment in Securities (cost $6,887,567) | $7,709,266 | |
| Cash | 56 | |
| Receivable for investments sold | 42,479 | |
| Total assets | 7,751,801 | |
| Liabilities | ||
| Payable for investments purchased | $39,433 | |
| Payable for fund shares redeemed | 300 | |
| Accrued management fee | 2,887 | |
| Distribution and service plan fees payable | 82 | |
| Total liabilities | 42,702 | |
| Net Assets | $7,709,099 | |
| Net Assets consist of: | ||
| Paid in capital | $6,733,899 | |
| Total accumulated earnings (loss) | 975,200 | |
| Net Assets | $7,709,099 | |
| Net Asset Value and Maximum Offering Price | ||
| Class A: | ||
| Net Asset Value and redemption price per share ($394,166 ÷ 6,316.00 shares)(a) | $62.41 | |
| Maximum offering price per share (100/94.25 of $62.41) | $66.22 | |
| Fidelity Managed Retirement 2010: | ||
| Net Asset Value, offering price and redemption price per share ($6,727,705 ÷ 107,688.00 shares) | $62.47 | |
| Class K: | ||
| Net Asset Value, offering price and redemption price per share ($118,102 ÷ 1,891.00 shares) | $62.45 | |
| Class K6: | ||
| Net Asset Value, offering price and redemption price per share ($173,580 ÷ 2,779.00 shares) | $62.46 | |
| Class I: | ||
| Net Asset Value, offering price and redemption price per share ($112,516 ÷ 1,801.37 shares) | $62.46 | |
| Class Z6: | ||
| Net Asset Value, offering price and redemption price per share ($183,030 ÷ 2,930.88 shares) | $62.45 |
(a) Redemption price per share is equal to net asset value less any applicable contingent deferred sales charge.
See accompanying notes which are an integral part of the financial statements.
Statement of Operations
| Year ended July 31, 2021 | ||
| Investment Income | ||
| Dividends: | ||
| Affiliated issuers | $101,464 | |
| Expenses | ||
| Management fee | $35,815 | |
| Distribution and service plan fees | 689 | |
| Independent trustees' fees and expenses | 23 | |
| Total expenses | 36,527 | |
| Net investment income (loss) | 64,937 | |
| Realized and Unrealized Gain (Loss) | ||
| Net realized gain (loss) on: | ||
| Investment securities: | ||
| Affiliated issuers | 147,166 | |
| Capital gain distributions from underlying funds: | ||
| Affiliated issuers | 185,620 | |
| Total net realized gain (loss) | 332,786 | |
| Change in net unrealized appreciation (depreciation) on: | ||
| Investment securities: | ||
| Affiliated issuers | 333,793 | |
| Total change in net unrealized appreciation (depreciation) | 333,793 | |
| Net gain (loss) | 666,579 | |
| Net increase (decrease) in net assets resulting from operations | $731,516 |
See accompanying notes which are an integral part of the financial statements.
Statement of Changes in Net Assets
| Year ended July 31, 2021 | Year ended July 31, 2020 | |
| Increase (Decrease) in Net Assets | ||
| Operations | ||
| Net investment income (loss) | $64,937 | $149,437 |
| Net realized gain (loss) | 332,786 | 148,649 |
| Change in net unrealized appreciation (depreciation) | 333,793 | 290,801 |
| Net increase (decrease) in net assets resulting from operations | 731,516 | 588,887 |
| Distributions to shareholders | (260,185) | (280,214) |
| Share transactions - net increase (decrease) | (643,530) | (1,830,376) |
| Total increase (decrease) in net assets | (172,199) | (1,521,703) |
| Net Assets | ||
| Beginning of period | 7,881,298 | 9,403,001 |
| End of period | $7,709,099 | $7,881,298 |
See accompanying notes which are an integral part of the financial statements.
Financial Highlights
Fidelity Managed Retirement 2010 Fund Class A
| Years ended July 31, | 2021 | 2020 | 2019 | 2018 | 2017 |
| Selected Per–Share Data | |||||
| Net asset value, beginning of period | $58.79 | $56.34 | $56.78 | $63.87 | $60.07 |
| Income from Investment Operations | |||||
| Net investment income (loss)A | .342 | .777 | .979 | .808 | .789 |
| Net realized and unrealized gain (loss) | 5.126 | 3.204 | 1.401 | 1.278 | 4.240 |
| Total from investment operations | 5.468 | 3.981 | 2.380 | 2.086 | 5.029 |
| Distributions from net investment income | (.379) | (.812) | (1.001) | (.794) | (.754) |
| Distributions from net realized gain | (1.469) | (.719) | (1.819) | (8.382) | (.475) |
| Total distributions | (1.848) | (1.531) | (2.820) | (9.176) | (1.229) |
| Net asset value, end of period | $62.41 | $58.79 | $56.34 | $56.78 | $63.87 |
| Total ReturnB,C | 9.46% | 7.19% | 4.47% | 3.60% | 8.51% |
| Ratios to Average Net AssetsD,E,F | |||||
| Expenses before reductions | .71% | .71% | .75% | .78% | .33% |
| Expenses net of fee waivers, if any | .71% | .71% | .75% | .78% | .33% |
| Expenses net of all reductions | .71% | .71% | .75% | .78% | .33% |
| Net investment income (loss) | .56% | 1.37% | 1.78% | 1.40% | 1.29% |
| Supplemental Data | |||||
| Net assets, end of period (000 omitted) | $394 | $188 | $202 | $133 | $136 |
| Portfolio turnover rateF | 41% | 45% | 62% | 21% | 117% |
A Calculated based on average shares outstanding during the period.
B Total returns would have been lower if certain expenses had not been reduced during the applicable periods shown.
C Total returns do not include the effect of the sales charges.
D Fees and expenses of any underlying mutual funds or exchange-traded funds (ETFs) are not included in the Fund's expense ratio. The Fund indirectly bears its proportionate share of these expenses.
E Expense ratios reflect operating expenses of the class. Expenses before reductions do not reflect amounts reimbursed, waived, or reduced through arrangements with the investment adviser, brokerage services, or other offset arrangements, if applicable, and do not represent the amount paid by the class during periods when reimbursements, waivers or reductions occur.
F Amount does not include the portfolio activity of any underlying mutual funds or exchange-traded funds (ETFs).
See accompanying notes which are an integral part of the financial statements.
Fidelity Managed Retirement 2010 Fund
| Years ended July 31, | 2021 | 2020 | 2019 | 2018 | 2017 |
| Selected Per–Share Data | |||||
| Net asset value, beginning of period | $58.82 | $56.37 | $56.80 | $63.88 | $60.07 |
| Income from Investment Operations | |||||
| Net investment income (loss)A | .493 | .920 | 1.113 | .955 | .942 |
| Net realized and unrealized gain (loss) | 5.129 | 3.204 | 1.402 | 1.280 | 4.236 |
| Total from investment operations | 5.622 | 4.124 | 2.515 | 2.235 | 5.178 |
| Distributions from net investment income | (.503) | (.955) | (1.126) | (.933) | (.893) |
| Distributions from net realized gain | (1.469) | (.719) | (1.819) | (8.382) | (.475) |
| Total distributions | (1.972) | (1.674) | (2.945) | (9.315) | (1.368) |
| Net asset value, end of period | $62.47 | $58.82 | $56.37 | $56.80 | $63.88 |
| Total ReturnB | 9.73% | 7.46% | 4.73% | 3.87% | 8.78% |
| Ratios to Average Net AssetsC,D,E | |||||
| Expenses before reductions | .46% | .46% | .50% | .53% | .08% |
| Expenses net of fee waivers, if any | .46% | .46% | .50% | .53% | .08% |
| Expenses net of all reductions | .46% | .46% | .50% | .53% | .08% |
| Net investment income (loss) | .81% | 1.62% | 2.02% | 1.65% | 1.54% |
| Supplemental Data | |||||
| Net assets, end of period (000 omitted) | $6,728 | $7,144 | $9,091 | $9,054 | $11,140 |
| Portfolio turnover rateE | 41% | 45% | 62% | 21% | 117% |
A Calculated based on average shares outstanding during the period.
B Total returns would have been lower if certain expenses had not been reduced during the applicable periods shown.
C Fees and expenses of any underlying mutual funds or exchange-traded funds (ETFs) are not included in the Fund's expense ratio. The Fund indirectly bears its proportionate share of these expenses.
D Expense ratios reflect operating expenses of the class. Expenses before reductions do not reflect amounts reimbursed, waived, or reduced through arrangements with the investment adviser, brokerage services, or other offset arrangements, if applicable, and do not represent the amount paid by the class during periods when reimbursements, waivers or reductions occur.
E Amount does not include the portfolio activity of any underlying mutual funds or exchange-traded funds (ETFs).
See accompanying notes which are an integral part of the financial statements.
Fidelity Managed Retirement 2010 Fund Class K
| Years ended July 31, | 2021 | 2020 A |
| Selected Per–Share Data | ||
| Net asset value, beginning of period | $58.81 | $56.39 |
| Income from Investment Operations | ||
| Net investment income (loss)B | .554 | .976 |
| Net realized and unrealized gain (loss) | 5.122 | 3.182 |
| Total from investment operations | 5.676 | 4.158 |
| Distributions from net investment income | (.567) | (1.019) |
| Distributions from net realized gain | (1.469) | (.719) |
| Total distributions | (2.036) | (1.738) |
| Net asset value, end of period | $62.45 | $58.81 |
| Total ReturnC | 9.83% | 7.52%D |
| Ratios to Average Net AssetsE,F,G | ||
| Expenses before reductions | .36% | .36% |
| Expenses net of fee waivers, if any | .36% | .36% |
| Expenses net of all reductions | .36% | .36% |
| Net investment income (loss) | .91% | 1.72% |
| Supplemental Data | ||
| Net assets, end of period (000 omitted) | $118 | $108 |
| Portfolio turnover rateG | 41% | 45% |
A For the period August 1, 2019 (commencement of sale of shares) to July 31, 2020.
B Calculated based on average shares outstanding during the period.
C Total returns would have been lower if certain expenses had not been reduced during the applicable periods shown.
D Total returns for periods of less than one year are not annualized.
E Fees and expenses of any underlying mutual funds or exchange-traded funds (ETFs) are not included in the Fund's expense ratio. The Fund indirectly bears its proportionate share of these expenses.
F Expense ratios reflect operating expenses of the class. Expenses before reductions do not reflect amounts reimbursed, waived, or reduced through arrangements with the investment adviser, brokerage services, or other offset arrangements, if applicable, and do not represent the amount paid by the class during periods when reimbursements, waivers or reductions occur.
G Amount does not include the portfolio activity of any underlying mutual funds or exchange-traded funds (ETFs).
See accompanying notes which are an integral part of the financial statements.
Fidelity Managed Retirement 2010 Fund Class K6
| Years ended July 31, | 2021 | 2020 A |
| Selected Per–Share Data | ||
| Net asset value, beginning of period | $58.82 | $56.39 |
| Income from Investment Operations | ||
| Net investment income (loss)B | .615 | 1.029 |
| Net realized and unrealized gain (loss) | 5.120 | 3.191 |
| Total from investment operations | 5.735 | 4.220 |
| Distributions from net investment income | (.626) | (1.071) |
| Distributions from net realized gain | (1.469) | (.719) |
| Total distributions | (2.095) | (1.790) |
| Net asset value, end of period | $62.46 | $58.82 |
| Total ReturnC | 9.94% | 7.64%D |
| Ratios to Average Net AssetsE,F,G | ||
| Expenses before reductions | .26% | .26% |
| Expenses net of fee waivers, if any | .26% | .26% |
| Expenses net of all reductions | .26% | .26% |
| Net investment income (loss) | 1.01% | 1.82% |
| Supplemental Data | ||
| Net assets, end of period (000 omitted) | $174 | $160 |
| Portfolio turnover rateG | 41% | 45% |
A For the period August 1, 2019 (commencement of sale of shares) to July 31, 2020.
B Calculated based on average shares outstanding during the period.
C Total returns would have been lower if certain expenses had not been reduced during the applicable periods shown.
D Total returns for periods of less than one year are not annualized.
E Fees and expenses of any underlying mutual funds or exchange-traded funds (ETFs) are not included in the Fund's expense ratio. The Fund indirectly bears its proportionate share of these expenses.
F Expense ratios reflect operating expenses of the class. Expenses before reductions do not reflect amounts reimbursed, waived, or reduced through arrangements with the investment adviser, brokerage services, or other offset arrangements, if applicable, and do not represent the amount paid by the class during periods when reimbursements, waivers or reductions occur.
G Amount does not include the portfolio activity of any underlying mutual funds or exchange-traded funds (ETFs).
See accompanying notes which are an integral part of the financial statements.
Fidelity Managed Retirement 2010 Fund Class I
| Years ended July 31, | 2021 | 2020 | 2019 | 2018 | 2017 |
| Selected Per–Share Data | |||||
| Net asset value, beginning of period | $58.82 | $56.36 | $56.79 | $63.88 | $60.07 |
| Income from Investment Operations | |||||
| Net investment income (loss)A | .493 | .919 | 1.105 | .950 | .942 |
| Net realized and unrealized gain (loss) | 5.120 | 3.213 | 1.414 | 1.280 | 4.238 |
| Total from investment operations | 5.613 | 4.132 | 2.519 | 2.230 | 5.180 |
| Distributions from net investment income | (.504) | (.953) | (1.130) | (.938) | (.895) |
| Distributions from net realized gain | (1.469) | (.719) | (1.819) | (8.382) | (.475) |
| Total distributions | (1.973) | (1.672) | (2.949) | (9.320) | (1.370) |
| Net asset value, end of period | $62.46 | $58.82 | $56.36 | $56.79 | $63.88 |
| Total ReturnB | 9.72% | 7.47% | 4.74% | 3.86% | 8.78% |
| Ratios to Average Net AssetsC,D,E | |||||
| Expenses before reductions | .46% | .46% | .50% | .53% | .08% |
| Expenses net of fee waivers, if any | .46% | .46% | .50% | .53% | .08% |
| Expenses net of all reductions | .46% | .46% | .50% | .53% | .08% |
| Net investment income (loss) | .81% | 1.62% | 2.03% | 1.65% | 1.54% |
| Supplemental Data | |||||
| Net assets, end of period (000 omitted) | $113 | $113 | $110 | $35 | $33 |
| Portfolio turnover rateE | 41% | 45% | 62% | 21% | 117% |
A Calculated based on average shares outstanding during the period.
B Total returns would have been lower if certain expenses had not been reduced during the applicable periods shown.
C Fees and expenses of any underlying mutual funds or exchange-traded funds (ETFs) are not included in the Fund's expense ratio. The Fund indirectly bears its proportionate share of these expenses.
D Expense ratios reflect operating expenses of the class. Expenses before reductions do not reflect amounts reimbursed, waived, or reduced through arrangements with the investment adviser, brokerage services, or other offset arrangements, if applicable, and do not represent the amount paid by the class during periods when reimbursements, waivers or reductions occur.
E Amount does not include the portfolio activity of any underlying mutual funds or exchange-traded funds (ETFs).
See accompanying notes which are an integral part of the financial statements.
Fidelity Managed Retirement 2010 Fund Class Z6
| Years ended July 31, | 2021 | 2020 A |
| Selected Per–Share Data | ||
| Net asset value, beginning of period | $58.81 | $56.38 |
| Income from Investment Operations | ||
| Net investment income (loss)B | .614 | 1.029 |
| Net realized and unrealized gain (loss) | 5.122 | 3.191 |
| Total from investment operations | 5.736 | 4.220 |
| Distributions from net investment income | (.627) | (1.071) |
| Distributions from net realized gain | (1.469) | (.719) |
| Total distributions | (2.096) | (1.790) |
| Net asset value, end of period | $62.45 | $58.81 |
| Total ReturnC | 9.94% | 7.64%D |
| Ratios to Average Net AssetsE,F,G | ||
| Expenses before reductions | .26% | .26% |
| Expenses net of fee waivers, if any | .26% | .26% |
| Expenses net of all reductions | .26% | .26% |
| Net investment income (loss) | 1.01% | 1.82% |
| Supplemental Data | ||
| Net assets, end of period (000 omitted) | $183 | $169 |
| Portfolio turnover rateG | 41% | 45% |
A For the period August 1, 2019 (commencement of sale of shares) to July 31, 2020.
B Calculated based on average shares outstanding during the period.
C Total returns would have been lower if certain expenses had not been reduced during the applicable periods shown.
D Total returns for periods of less than one year are not annualized.
E Fees and expenses of any underlying mutual funds or exchange-traded funds (ETFs) are not included in the Fund's expense ratio. The Fund indirectly bears its proportionate share of these expenses.
F Expense ratios reflect operating expenses of the class. Expenses before reductions do not reflect amounts reimbursed, waived, or reduced through arrangements with the investment adviser, brokerage services, or other offset arrangements, if applicable, and do not represent the amount paid by the class during periods when reimbursements, waivers or reductions occur.
G Amount does not include the portfolio activity of any underlying mutual funds or exchange-traded funds (ETFs).
See accompanying notes which are an integral part of the financial statements.
Fidelity Managed Retirement 2015 Fund℠
Investment Summary (Unaudited)
The information in the following tables is based on the direct investments of the Fund.Top Holdings as of July 31, 2021
| % of fund's net assets | |
| Fidelity Series Investment Grade Bond Fund | 10.2 |
| Fidelity Series Inflation-Protected Bond Index Fund | 9.7 |
| Fidelity Series Treasury Bill Index Fund | 9.5 |
| Fidelity Series Government Bond Index Fund | 9.3 |
| Fidelity Series Corporate Bond Fund | 7.4 |
| Fidelity Series Investment Grade Securitized Fund | 7.1 |
| Fidelity Series Emerging Markets Opportunities Fund | 6.9 |
| Fidelity Series Large Cap Value Index Fund | 4.4 |
| Fidelity Series Government Money Market Fund 0.07% | 3.4 |
| Fidelity Series Blue Chip Growth Fund | 3.2 |
| 71.1 |
Asset Allocation (% of fund's net assets)
| Period end | ||
| Domestic Equity Funds | 17.4% | |
| International Equity Funds | 18.1% | |
| Bond Funds | 48.6% | |
| Short-Term Funds | 15.9% | |

Domestic Equity Funds category includes Fidelity Series Commodity Strategy Fund which invests in commodity-related investments.
Fidelity Managed Retirement 2015 Fund℠
Schedule of Investments July 31, 2021
Showing Percentage of Net Assets
| Domestic Equity Funds - 17.4% | |||
| Shares | Value | ||
| Fidelity Series Blue Chip Growth Fund (a) | 14,950 | $289,125 | |
| Fidelity Series Commodity Strategy Fund (a) | 42,738 | 241,470 | |
| Fidelity Series Large Cap Growth Index Fund (a) | 10,151 | 184,445 | |
| Fidelity Series Large Cap Stock Fund (a) | 10,270 | 203,037 | |
| Fidelity Series Large Cap Value Index Fund (a) | 25,227 | 393,040 | |
| Fidelity Series Small Cap Opportunities Fund (a) | 5,395 | 97,537 | |
| Fidelity Series Value Discovery Fund (a) | 8,501 | 144,435 | |
| TOTAL DOMESTIC EQUITY FUNDS | |||
| (Cost $1,150,643) | 1,553,089 | ||
| International Equity Funds - 18.1% | |||
| Fidelity Series Canada Fund (a) | 6,708 | 94,119 | |
| Fidelity Series Emerging Markets Fund (a) | 6,026 | 67,670 | |
| Fidelity Series Emerging Markets Opportunities Fund (a) | 24,540 | 613,000 | |
| Fidelity Series International Growth Fund (a) | 11,125 | 224,175 | |
| Fidelity Series International Index Fund (a) | 7,514 | 93,177 | |
| Fidelity Series International Small Cap Fund (a) | 3,379 | 78,585 | |
| Fidelity Series International Value Fund (a) | 19,763 | 222,330 | |
| Fidelity Series Overseas Fund (a) | 15,825 | 224,717 | |
| TOTAL INTERNATIONAL EQUITY FUNDS | |||
| (Cost $1,226,392) | 1,617,773 | ||
| Bond Funds - 48.6% | |||
| Fidelity Series Corporate Bond Fund (a) | 58,633 | 661,972 | |
| Fidelity Series Emerging Markets Debt Fund (a) | 5,242 | 48,903 | |
| Fidelity Series Emerging Markets Debt Local Currency Fund (a) | 1,552 | 16,020 | |
| Fidelity Series Floating Rate High Income Fund (a) | 1,020 | 9,394 | |
| Fidelity Series Government Bond Index Fund (a) | 77,493 | 833,826 | |
| Fidelity Series High Income Fund (a) | 5,877 | 56,358 | |
| Fidelity Series Inflation-Protected Bond Index Fund (a) | 76,897 | 863,559 | |
| Fidelity Series International Credit Fund (a) | 264 | 2,685 | |
| Fidelity Series Investment Grade Bond Fund (a) | 77,041 | 912,167 | |
| Fidelity Series Investment Grade Securitized Fund (a) | 60,345 | 628,793 | |
| Fidelity Series Long-Term Treasury Bond Index Fund (a) | 31,150 | 269,756 | |
| Fidelity Series Real Estate Income Fund (a) | 2,889 | 34,002 | |
| TOTAL BOND FUNDS | |||
| (Cost $4,135,046) | 4,337,435 | ||
| Short-Term Funds - 15.9% | |||
| Fidelity Series Government Money Market Fund 0.07% (a)(b) | 304,584 | 304,584 | |
| Fidelity Series Short-Term Credit Fund (a) | 25,647 | 261,084 | |
| Fidelity Series Treasury Bill Index Fund (a) | 84,877 | 848,774 | |
| TOTAL SHORT-TERM FUNDS | |||
| (Cost $1,410,683) | 1,414,442 | ||
| TOTAL INVESTMENT IN SECURITIES - 100.0% | |||
| (Cost $7,922,764) | 8,922,739 | ||
| NET OTHER ASSETS (LIABILITIES) - 0.0% | (450) | ||
| NET ASSETS - 100% | $8,922,289 |
Legend
(a) Affiliated Fund
(b) The rate quoted is the annualized seven-day yield of the fund at period end.
Affiliated Underlying Funds
Fiscal year to date information regarding the Fund's investments in affiliated Underlying Funds is presented below. Exchanges between classes of the same affiliated Underlying Funds may occur. If an underlying Fund changes its name, the name presented below is the name in effect at period end.
| Affiliate | Value, beginning of period | Purchases | Sales Proceeds | Dividend Income | Realized Gain (loss) | Change in Unrealized appreciation (depreciation) | Value, end of period |
| Fidelity Series Blue Chip Growth Fund | $236,160 | $174,781 | $139,617 | $87,022 | $2,755 | $15,046 | $289,125 |
| Fidelity Series Canada Fund | 59,736 | 36,541 | 25,591 | 1,443 | 830 | 22,603 | 94,119 |
| Fidelity Series Commodity Strategy Fund | 169,680 | 90,939 | 89,413 | 864 | 842 | 69,422 | 241,470 |
| Fidelity Series Corporate Bond Fund | 515,219 | 274,606 | 120,867 | 21,914 | (938) | (6,048) | 661,972 |
| Fidelity Series Emerging Markets Debt Fund | 44,112 | 16,767 | 12,725 | 2,123 | (489) | 1,238 | 48,903 |
| Fidelity Series Emerging Markets Debt Local Currency Fund | -- | 18,090 | 2,308 | 216 | (2) | 240 | 16,020 |
| Fidelity Series Emerging Markets Fund | 59,972 | 26,709 | 32,117 | 1,006 | 1,818 | 11,288 | 67,670 |
| Fidelity Series Emerging Markets Opportunities Fund | 546,722 | 243,060 | 294,784 | 19,149 | 24,020 | 93,982 | 613,000 |
| Fidelity Series Floating Rate High Income Fund | 9,293 | 3,396 | 3,801 | 407 | (75) | 581 | 9,394 |
| Fidelity Series Government Bond Index Fund | 609,378 | 370,193 | 109,982 | 18,477 | (2,025) | (33,738) | 833,826 |
| Fidelity Series Government Money Market Fund 0.07% | 153,729 | 547,715 | 396,860 | 342 | -- | -- | 304,584 |
| Fidelity Series High Income Fund | 48,442 | 18,805 | 13,230 | 2,793 | (65) | 2,406 | 56,358 |
| Fidelity Series Inflation-Protected Bond Index Fund | 640,264 | 293,198 | 116,156 | 9,252 | 186 | 46,067 | 863,559 |
| Fidelity Series International Credit Fund | 2,563 | 167 | -- | 176 | 10 | (55) | 2,685 |
| Fidelity Series International Growth Fund | 158,331 | 108,141 | 65,891 | 25,604 | 958 | 22,636 | 224,175 |
| Fidelity Series International Index Fund | 65,010 | 35,918 | 25,903 | 1,428 | 828 | 17,324 | 93,177 |
| Fidelity Series International Small Cap Fund | 53,133 | 24,221 | 20,242 | 556 | 1,120 | 20,353 | 78,585 |
| Fidelity Series International Value Fund | 157,835 | 94,471 | 79,551 | 5,007 | 229 | 49,346 | 222,330 |
| Fidelity Series Investment Grade Bond Fund | 679,797 | 399,287 | 138,553 | 45,133 | (2,234) | (26,130) | 912,167 |
| Fidelity Series Investment Grade Securitized Fund | 459,586 | 270,316 | 89,465 | 14,761 | (896) | (10,748) | 628,793 |
| Fidelity Series Large Cap Growth Index Fund | 162,050 | 61,552 | 91,224 | 3,231 | 7,039 | 45,028 | 184,445 |
| Fidelity Series Large Cap Stock Fund | 165,650 | 76,147 | 100,462 | 10,057 | 6,978 | 54,724 | 203,037 |
| Fidelity Series Large Cap Value Index Fund | 313,704 | 143,270 | 178,218 | 7,594 | 10,808 | 103,476 | 393,040 |
| Fidelity Series Long-Term Treasury Bond Index Fund | 156,874 | 188,352 | 43,601 | 18,069 | (3,864) | (28,005) | 269,756 |
| Fidelity Series Overseas Fund | 158,643 | 84,615 | 68,021 | 2,046 | 2,823 | 46,657 | 224,717 |
| Fidelity Series Real Estate Income Fund | 27,974 | 11,109 | 10,458 | 1,602 | (62) | 5,439 | 34,002 |
| Fidelity Series Short-Term Credit Fund | 211,091 | 79,161 | 27,573 | 4,282 | 154 | (1,749) | 261,084 |
| Fidelity Series Small Cap Opportunities Fund | 79,129 | 32,567 | 46,279 | 1,932 | 5,942 | 26,178 | 97,537 |
| Fidelity Series Treasury Bill Index Fund | 724,826 | 255,729 | 131,058 | 1,020 | (325) | (398) | 848,774 |
| Fidelity Series Value Discovery Fund | 111,933 | 50,665 | 63,839 | 2,907 | 3,903 | 41,773 | 144,435 |
| $6,780,836 | $4,030,488 | $2,537,789 | $310,413 | $60,268 | $588,936 | $8,922,739 |
Amounts in the income column in the above table include any capital gain distributions from underlying funds, which are presented in the corresponding line-item in the Statement of Operations, if applicable.
Investment Valuation
The following is a summary of the inputs used, as of July 31, 2021, involving the Fund's assets and liabilities carried at fair value. The inputs or methodology used for valuing securities may not be an indication of the risk associated with investing in those securities. For more information on valuation inputs, and their aggregation into the levels used below, please refer to the Investment Valuation section in the accompanying Notes to Financial Statements.
| Valuation Inputs at Reporting Date: | ||||
| Description | Total | Level 1 | Level 2 | Level 3 |
| Investments in Securities: | ||||
| Domestic Equity Funds | $1,553,089 | $1,553,089 | $-- | $-- |
| International Equity Funds | 1,617,773 | 1,617,773 | -- | -- |
| Bond Funds | 4,337,435 | 4,337,435 | -- | -- |
| Short-Term Funds | 1,414,442 | 1,414,442 | -- | -- |
| Total Investments in Securities: | $8,922,739 | $8,922,739 | $-- | $-- |
See accompanying notes which are an integral part of the financial statements.
Fidelity Managed Retirement 2015 Fund℠
Financial Statements
Statement of Assets and Liabilities
| July 31, 2021 | ||
| Assets | ||
| Investment in securities, at value — See accompanying schedule: | ||
| Affiliated issuers (cost $7,922,764) | $8,922,739 | |
| Total Investment in Securities (cost $7,922,764) | $8,922,739 | |
| Cash | 5 | |
| Receivable for investments sold | 54,994 | |
| Receivable for fund shares sold | 2,000 | |
| Total assets | 8,979,738 | |
| Liabilities | ||
| Payable for investments purchased | $48,766 | |
| Payable for fund shares redeemed | 4,973 | |
| Accrued management fee | 3,406 | |
| Distribution and service plan fees payable | 304 | |
| Total liabilities | 57,449 | |
| Net Assets | $8,922,289 | |
| Net Assets consist of: | ||
| Paid in capital | $7,829,528 | |
| Total accumulated earnings (loss) | 1,092,761 | |
| Net Assets | $8,922,289 | |
| Net Asset Value and Maximum Offering Price | ||
| Class A: | ||
| Net Asset Value and redemption price per share ($1,460,982 ÷ 24,143.16 shares)(a) | $60.51 | |
| Maximum offering price per share (100/94.25 of $60.51) | $64.20 | |
| Fidelity Managed Retirement 2015: | ||
| Net Asset Value, offering price and redemption price per share ($6,735,916 ÷ 111,229.00 shares) | $60.56 | |
| Class K: | ||
| Net Asset Value, offering price and redemption price per share ($121,706 ÷ 2,010.00 shares) | $60.55 | |
| Class K6: | ||
| Net Asset Value, offering price and redemption price per share ($203,962 ÷ 3,367.84 shares) | $60.56 | |
| Class I: | ||
| Net Asset Value, offering price and redemption price per share ($277,773 ÷ 4,585.68 shares) | $60.57 | |
| Class Z6: | ||
| Net Asset Value, offering price and redemption price per share ($121,950 ÷ 2,013.00 shares) | $60.58 |
(a) Redemption price per share is equal to net asset value less any applicable contingent deferred sales charge.
See accompanying notes which are an integral part of the financial statements.
Statement of Operations
| Year ended July 31, 2021 | ||
| Investment Income | ||
| Dividends: | ||
| Affiliated issuers | $104,006 | |
| Expenses | ||
| Management fee | $37,086 | |
| Distribution and service plan fees | 3,677 | |
| Independent trustees' fees and expenses | 22 | |
| Total expenses | 40,785 | |
| Net investment income (loss) | 63,221 | |
| Realized and Unrealized Gain (Loss) | ||
| Net realized gain (loss) on: | ||
| Investment securities: | ||
| Affiliated issuers | 60,268 | |
| Capital gain distributions from underlying funds: | ||
| Affiliated issuers | 206,407 | |
| Total net realized gain (loss) | 266,675 | |
| Change in net unrealized appreciation (depreciation) on: | ||
| Investment securities: | ||
| Affiliated issuers | 588,936 | |
| Total change in net unrealized appreciation (depreciation) | 588,936 | |
| Net gain (loss) | 855,611 | |
| Net increase (decrease) in net assets resulting from operations | $918,832 |
See accompanying notes which are an integral part of the financial statements.
Statement of Changes in Net Assets
| Year ended July 31, 2021 | Year ended July 31, 2020 | |
| Increase (Decrease) in Net Assets | ||
| Operations | ||
| Net investment income (loss) | $63,221 | $92,974 |
| Net realized gain (loss) | 266,675 | 87,217 |
| Change in net unrealized appreciation (depreciation) | 588,936 | 298,575 |
| Net increase (decrease) in net assets resulting from operations | 918,832 | 478,766 |
| Distributions to shareholders | (244,092) | (177,176) |
| Share transactions - net increase (decrease) | 1,466,878 | 1,860,533 |
| Total increase (decrease) in net assets | 2,141,618 | 2,162,123 |
| Net Assets | ||
| Beginning of period | 6,780,671 | 4,618,548 |
| End of period | $8,922,289 | $6,780,671 |
See accompanying notes which are an integral part of the financial statements.
Financial Highlights
Fidelity Managed Retirement 2015 Fund Class A
| Years ended July 31, | 2021 | 2020 | 2019 | 2018 | 2017 |
| Selected Per–Share Data | |||||
| Net asset value, beginning of period | $55.51 | $53.13 | $53.98 | $64.42 | $59.82 |
| Income from Investment Operations | |||||
| Net investment income (loss)A | .335 | .690 | .887 | .739 | .798 |
| Net realized and unrealized gain (loss) | 6.385 | 3.244 | 1.236 | 1.737 | 4.786 |
| Total from investment operations | 6.720 | 3.934 | 2.123 | 2.476 | 5.584 |
| Distributions from net investment income | (.369) | (.769) | (.884) | (.726) | (.755) |
| Distributions from net realized gain | (1.351) | (.785) | (2.089) | (12.190) | (.229) |
| Total distributions | (1.720) | (1.554) | (2.973) | (12.916) | (.984) |
| Net asset value, end of period | $60.51 | $55.51 | $53.13 | $53.98 | $64.42 |
| Total ReturnB,C | 12.31% | 7.54% | 4.26% | 4.46% | 9.45% |
| Ratios to Average Net AssetsD,E,F | |||||
| Expenses before reductions | .72% | .72% | .78% | .83% | .33% |
| Expenses net of fee waivers, if any | .72% | .72% | .78% | .83% | .33% |
| Expenses net of all reductions | .72% | .72% | .78% | .82% | .33% |
| Net investment income (loss) | .58% | 1.30% | 1.71% | 1.34% | 1.30% |
| Supplemental Data | |||||
| Net assets, end of period (000 omitted) | $1,461 | $1,024 | $244 | $246 | $289 |
| Portfolio turnover rateF | 32% | 61% | 67% | 20% | 106% |
A Calculated based on average shares outstanding during the period.
B Total returns would have been lower if certain expenses had not been reduced during the applicable periods shown.
C Total returns do not include the effect of the sales charges.
D Fees and expenses of any underlying mutual funds or exchange-traded funds (ETFs) are not included in the Fund's expense ratio. The Fund indirectly bears its proportionate share of these expenses.
E Expense ratios reflect operating expenses of the class. Expenses before reductions do not reflect amounts reimbursed, waived, or reduced through arrangements with the investment adviser, brokerage services, or other offset arrangements, if applicable, and do not represent the amount paid by the class during periods when reimbursements, waivers or reductions occur.
F Amount does not include the portfolio activity of any underlying mutual funds or exchange-traded funds (ETFs).
See accompanying notes which are an integral part of the financial statements.
Fidelity Managed Retirement 2015 Fund
| Years ended July 31, | 2021 | 2020 | 2019 | 2018 | 2017 |
| Selected Per–Share Data | |||||
| Net asset value, beginning of period | $55.53 | $53.11 | $53.97 | $64.41 | $59.81 |
| Income from Investment Operations | |||||
| Net investment income (loss)A | .481 | .825 | 1.017 | .879 | .950 |
| Net realized and unrealized gain (loss) | 6.395 | 3.250 | 1.226 | 1.740 | 4.778 |
| Total from investment operations | 6.876 | 4.075 | 2.243 | 2.619 | 5.728 |
| Distributions from net investment income | (.495) | (.870) | (1.014) | (.869) | (.899) |
| Distributions from net realized gain | (1.351) | (.785) | (2.089) | (12.190) | (.229) |
| Total distributions | (1.846) | (1.655) | (3.103) | (13.059) | (1.128) |
| Net asset value, end of period | $60.56 | $55.53 | $53.11 | $53.97 | $64.41 |
| Total ReturnB | 12.60% | 7.83% | 4.50% | 4.73% | 9.71% |
| Ratios to Average Net AssetsC,D,E | |||||
| Expenses before reductions | .47% | .47% | .53% | .58% | .08% |
| Expenses net of fee waivers, if any | .47% | .47% | .53% | .58% | .08% |
| Expenses net of all reductions | .47% | .47% | .53% | .57% | .08% |
| Net investment income (loss) | .83% | 1.55% | 1.96% | 1.59% | 1.55% |
| Supplemental Data | |||||
| Net assets, end of period (000 omitted) | $6,736 | $5,155 | $4,087 | $3,714 | $4,885 |
| Portfolio turnover rateE | 32% | 61% | 67% | 20% | 106% |
A Calculated based on average shares outstanding during the period.
B Total returns would have been lower if certain expenses had not been reduced during the applicable periods shown.
C Fees and expenses of any underlying mutual funds or exchange-traded funds (ETFs) are not included in the Fund's expense ratio. The Fund indirectly bears its proportionate share of these expenses.
D Expense ratios reflect operating expenses of the class. Expenses before reductions do not reflect amounts reimbursed, waived, or reduced through arrangements with the investment adviser, brokerage services, or other offset arrangements, if applicable, and do not represent the amount paid by the class during periods when reimbursements, waivers or reductions occur.
E Amount does not include the portfolio activity of any underlying mutual funds or exchange-traded funds (ETFs).
See accompanying notes which are an integral part of the financial statements.
Fidelity Managed Retirement 2015 Fund Class K
| Years ended July 31, | 2021 | 2020 A |
| Selected Per–Share Data | ||
| Net asset value, beginning of period | $55.52 | $53.08 |
| Income from Investment Operations | ||
| Net investment income (loss)B | .539 | .879 |
| Net realized and unrealized gain (loss) | 6.392 | 3.270 |
| Total from investment operations | 6.931 | 4.149 |
| Distributions from net investment income | (.550) | (.924) |
| Distributions from net realized gain | (1.351) | (.785) |
| Total distributions | (1.901) | (1.709) |
| Net asset value, end of period | $60.55 | $55.52 |
| Total Return | 12.71% | 7.98%C |
| Ratios to Average Net AssetsD,E,F | ||
| Expenses before reductions | .37% | .37% |
| Expenses net of fee waivers, if any | .37% | .37% |
| Expenses net of all reductions | .37% | .37% |
| Net investment income (loss) | .93% | 1.65% |
| Supplemental Data | ||
| Net assets, end of period (000 omitted) | $122 | $108 |
| Portfolio turnover rateF | 32% | 61% |
A For the period August 1, 2019 (commencement of sale of shares) to July 31, 2020.
B Calculated based on average shares outstanding during the period.
C Total returns for periods of less than one year are not annualized.
D Fees and expenses of any underlying mutual funds or exchange-traded funds (ETFs) are not included in the Fund's expense ratio. The Fund indirectly bears its proportionate share of these expenses.
E Expense ratios reflect operating expenses of the class. Expenses before reductions do not reflect amounts reimbursed, waived, or reduced through arrangements with the investment adviser, brokerage services, or other offset arrangements, if applicable, and do not represent the amount paid by the class during periods when reimbursements, waivers or reductions occur.
F Amount does not include the portfolio activity of any underlying mutual funds or exchange-traded funds (ETFs).
See accompanying notes which are an integral part of the financial statements.
Fidelity Managed Retirement 2015 Fund Class K6
| Years ended July 31, | 2021 | 2020 A |
| Selected Per–Share Data | ||
| Net asset value, beginning of period | $55.53 | $53.08 |
| Income from Investment Operations | ||
| Net investment income (loss)B | .597 | .932 |
| Net realized and unrealized gain (loss) | 6.391 | 3.274 |
| Total from investment operations | 6.988 | 4.206 |
| Distributions from net investment income | (.607) | (.971) |
| Distributions from net realized gain | (1.351) | (.785) |
| Total distributions | (1.958) | (1.756) |
| Net asset value, end of period | $60.56 | $55.53 |
| Total Return | 12.82% | 8.09%C |
| Ratios to Average Net AssetsD,E,F | ||
| Expenses before reductions | .27% | .27% |
| Expenses net of fee waivers, if any | .27% | .27% |
| Expenses net of all reductions | .27% | .27% |
| Net investment income (loss) | 1.03% | 1.75% |
| Supplemental Data | ||
| Net assets, end of period (000 omitted) | $204 | $112 |
| Portfolio turnover rateF | 32% | 61% |
A For the period August 1, 2019 (commencement of sale of shares) to July 31, 2020.
B Calculated based on average shares outstanding during the period.
C Total returns for periods of less than one year are not annualized.
D Fees and expenses of any underlying mutual funds or exchange-traded funds (ETFs) are not included in the Fund's expense ratio. The Fund indirectly bears its proportionate share of these expenses.
E Expense ratios reflect operating expenses of the class. Expenses before reductions do not reflect amounts reimbursed, waived, or reduced through arrangements with the investment adviser, brokerage services, or other offset arrangements, if applicable, and do not represent the amount paid by the class during periods when reimbursements, waivers or reductions occur.
F Amount does not include the portfolio activity of any underlying mutual funds or exchange-traded funds (ETFs).
See accompanying notes which are an integral part of the financial statements.
Fidelity Managed Retirement 2015 Fund Class I
| Years ended July 31, | 2021 | 2020 | 2019 | 2018 | 2017 |
| Selected Per–Share Data | |||||
| Net asset value, beginning of period | $55.54 | $53.12 | $53.98 | $64.42 | $59.81 |
| Income from Investment Operations | |||||
| Net investment income (loss)A | .481 | .827 | 1.015 | .877 | .951 |
| Net realized and unrealized gain (loss) | 6.390 | 3.242 | 1.227 | 1.742 | 4.788 |
| Total from investment operations | 6.871 | 4.069 | 2.242 | 2.619 | 5.739 |
| Distributions from net investment income | (.490) | (.864) | (1.013) | (.869) | (.900) |
| Distributions from net realized gain | (1.351) | (.785) | (2.089) | (12.190) | (.229) |
| Total distributions | (1.841) | (1.649) | (3.102) | (13.059) | (1.129) |
| Net asset value, end of period | $60.57 | $55.54 | $53.12 | $53.98 | $64.42 |
| Total ReturnB | 12.59% | 7.81% | 4.50% | 4.73% | 9.73% |
| Ratios to Average Net AssetsC,D,E | |||||
| Expenses before reductions | .47% | .47% | .53% | .58% | .08% |
| Expenses net of fee waivers, if any | .47% | .47% | .53% | .58% | .08% |
| Expenses net of all reductions | .47% | .47% | .53% | .57% | .08% |
| Net investment income (loss) | .83% | 1.55% | 1.97% | 1.59% | 1.55% |
| Supplemental Data | |||||
| Net assets, end of period (000 omitted) | $278 | $274 | $287 | $185 | $252 |
| Portfolio turnover rateE | 32% | 61% | 67% | 20% | 106% |
A Calculated based on average shares outstanding during the period.
B Total returns would have been lower if certain expenses had not been reduced during the applicable periods shown.
C Fees and expenses of any underlying mutual funds or exchange-traded funds (ETFs) are not included in the Fund's expense ratio. The Fund indirectly bears its proportionate share of these expenses.
D Expense ratios reflect operating expenses of the class. Expenses before reductions do not reflect amounts reimbursed, waived, or reduced through arrangements with the investment adviser, brokerage services, or other offset arrangements, if applicable, and do not represent the amount paid by the class during periods when reimbursements, waivers or reductions occur.
E Amount does not include the portfolio activity of any underlying mutual funds or exchange-traded funds (ETFs).
See accompanying notes which are an integral part of the financial statements.
Fidelity Managed Retirement 2015 Fund Class Z6
| Years ended July 31, | 2021 | 2020 A |
| Selected Per–Share Data | ||
| Net asset value, beginning of period | $55.55 | $53.09 |
| Income from Investment Operations | ||
| Net investment income (loss)B | .597 | .932 |
| Net realized and unrealized gain (loss) | 6.390 | 3.276 |
| Total from investment operations | 6.987 | 4.208 |
| Distributions from net investment income | (.606) | (.963) |
| Distributions from net realized gain | (1.351) | (.785) |
| Total distributions | (1.957) | (1.748) |
| Net asset value, end of period | $60.58 | $55.55 |
| Total Return | 12.81% | 8.09%C |
| Ratios to Average Net AssetsD,E,F | ||
| Expenses before reductions | .27% | .27% |
| Expenses net of fee waivers, if any | .27% | .27% |
| Expenses net of all reductions | .27% | .27% |
| Net investment income (loss) | 1.03% | 1.75% |
| Supplemental Data | ||
| Net assets, end of period (000 omitted) | $122 | $108 |
| Portfolio turnover rateF | 32% | 61% |
A For the period August 1, 2019 (commencement of sale of shares) to July 31, 2020.
B Calculated based on average shares outstanding during the period.
C Total returns for periods of less than one year are not annualized.
D Fees and expenses of any underlying mutual funds or exchange-traded funds (ETFs) are not included in the Fund's expense ratio. The Fund indirectly bears its proportionate share of these expenses.
E Expense ratios reflect operating expenses of the class. Expenses before reductions do not reflect amounts reimbursed, waived, or reduced through arrangements with the investment adviser, brokerage services, or other offset arrangements, if applicable, and do not represent the amount paid by the class during periods when reimbursements, waivers or reductions occur.
F Amount does not include the portfolio activity of any underlying mutual funds or exchange-traded funds (ETFs).
See accompanying notes which are an integral part of the financial statements.
Fidelity Managed Retirement 2020 Fund℠
Investment Summary (Unaudited)
The information in the following tables is based on the direct investments of the Fund.Top Holdings as of July 31, 2021
| % of fund's net assets | |
| Fidelity Series Investment Grade Bond Fund | 9.4 |
| Fidelity Series Government Bond Index Fund | 8.6 |
| Fidelity Series Inflation-Protected Bond Index Fund | 8.6 |
| Fidelity Series Emerging Markets Opportunities Fund | 7.7 |
| Fidelity Series Treasury Bill Index Fund | 7.0 |
| Fidelity Series Corporate Bond Fund | 6.8 |
| Fidelity Series Investment Grade Securitized Fund | 6.5 |
| Fidelity Series Large Cap Value Index Fund | 5.8 |
| Fidelity Series Blue Chip Growth Fund | 4.3 |
| Fidelity Series Overseas Fund | 3.1 |
| 67.8 |
Asset Allocation (% of fund's net assets)
| Period end | ||
| Domestic Equity Funds | 22.2% | |
| International Equity Funds | 21.3% | |
| Bond Funds | 44.8% | |
| Short-Term Funds | 11.7% | |

Domestic Equity Funds category includes Fidelity Series Commodity Strategy Fund which invests in commodity-related investments.
Fidelity Managed Retirement 2020 Fund℠
Schedule of Investments July 31, 2021
Showing Percentage of Net Assets
| Domestic Equity Funds - 22.2% | |||
| Shares | Value | ||
| Fidelity Series Blue Chip Growth Fund (a) | 29,599 | $572,453 | |
| Fidelity Series Commodity Strategy Fund (a) | 63,911 | 361,100 | |
| Fidelity Series Large Cap Growth Index Fund (a) | 20,098 | 365,184 | |
| Fidelity Series Large Cap Stock Fund (a) | 20,335 | 402,019 | |
| Fidelity Series Large Cap Value Index Fund (a) | 49,943 | 778,109 | |
| Fidelity Series Small Cap Opportunities Fund(a) | 10,681 | 193,119 | |
| Fidelity Series Value Discovery Fund (a) | 16,832 | 285,980 | |
| TOTAL DOMESTIC EQUITY FUNDS | |||
| (Cost $2,343,056) | 2,957,964 | ||
| International Equity Funds - 21.3% | |||
| Fidelity Series Canada Fund (a) | 12,180 | 170,880 | |
| Fidelity Series Emerging Markets Fund (a) | 10,131 | 113,777 | |
| Fidelity Series Emerging Markets Opportunities Fund (a) | 41,198 | 1,029,116 | |
| Fidelity Series International Growth Fund (a) | 20,189 | 406,816 | |
| Fidelity Series International Index Fund (a) | 13,642 | 169,158 | |
| Fidelity Series International Small Cap Fund (a) | 6,131 | 142,609 | |
| Fidelity Series International Value Fund (a) | 35,865 | 403,483 | |
| Fidelity Series Overseas Fund (a) | 28,717 | 407,786 | |
| TOTAL INTERNATIONAL EQUITY FUNDS | |||
| (Cost $2,318,461) | 2,843,625 | ||
| Bond Funds - 44.8% | |||
| Fidelity Series Corporate Bond Fund (a) | 80,579 | 909,734 | |
| Fidelity Series Emerging Markets Debt Fund (a) | 7,842 | 73,167 | |
| Fidelity Series Emerging Markets Debt Local Currency Fund (a) | 2,346 | 24,215 | |
| Fidelity Series Floating Rate High Income Fund (a) | 1,559 | 14,358 | |
| Fidelity Series Government Bond Index Fund (a) | 106,781 | 1,148,964 | |
| Fidelity Series High Income Fund (a) | 8,787 | 84,265 | |
| Fidelity Series Inflation-Protected Bond Index Fund (a) | 101,996 | 1,145,419 | |
| Fidelity Series International Credit Fund (a) | 212 | 2,151 | |
| Fidelity Series Investment Grade Bond Fund (a) | 105,884 | 1,253,672 | |
| Fidelity Series Investment Grade Securitized Fund (a) | 82,979 | 864,637 | |
| Fidelity Series Long-Term Treasury Bond Index Fund (a) | 46,575 | 403,340 | |
| Fidelity Series Real Estate Income Fund (a) | 4,320 | 50,843 | |
| TOTAL BOND FUNDS | |||
| (Cost $5,765,022) | 5,974,765 | ||
| Short-Term Funds - 11.7% | |||
| Fidelity Series Government Money Market Fund 0.07% (a)(b) | 335,922 | 335,922 | |
| Fidelity Series Short-Term Credit Fund (a) | 28,298 | 288,074 | |
| Fidelity Series Treasury Bill Index Fund (a) | 93,608 | 936,079 | |
| TOTAL SHORT-TERM FUNDS | |||
| (Cost $1,557,038) | 1,560,075 | ||
| TOTAL INVESTMENT IN SECURITIES - 100.0% | |||
| (Cost $11,983,577) | 13,336,429 | ||
| NET OTHER ASSETS (LIABILITIES) - 0.0% | (329) | ||
| NET ASSETS - 100% | $13,336,100 |
Legend
(a) Affiliated Fund
(b) The rate quoted is the annualized seven-day yield of the fund at period end.
Affiliated Underlying Funds
Fiscal year to date information regarding the Fund's investments in affiliated Underlying Funds is presented below. Exchanges between classes of the same affiliated Underlying Funds may occur. If an underlying Fund changes its name, the name presented below is the name in effect at period end.
| Affiliate | Value, beginning of period | Purchases | Sales Proceeds | Dividend Income | Realized Gain (loss) | Change in Unrealized appreciation (depreciation) | Value, end of period |
| Fidelity Series Blue Chip Growth Fund | $325,836 | $418,915 | $212,966 | $117,259 | $8,786 | $31,882 | $572,453 |
| Fidelity Series Canada Fund | 77,816 | 99,349 | 40,590 | 1,972 | 713 | 33,592 | 170,880 |
| Fidelity Series Commodity Strategy Fund | 179,785 | 216,655 | 120,442 | 857 | 2,073 | 83,029 | 361,100 |
| Fidelity Series Corporate Bond Fund | 502,160 | 559,810 | 149,885 | 23,109 | (1,501) | (850) | 909,734 |
| Fidelity Series Emerging Markets Debt Fund | 45,785 | 41,385 | 15,015 | 2,491 | (346) | 1,358 | 73,167 |
| Fidelity Series Emerging Markets Debt Local Currency Fund | -- | 27,061 | 3,100 | 249 | (26) | 280 | 24,215 |
| Fidelity Series Emerging Markets Fund | 70,263 | 71,544 | 42,099 | 1,237 | 648 | 13,421 | 113,777 |
| Fidelity Series Emerging Markets Opportunities Fund | 639,855 | 652,506 | 392,400 | 23,496 | 6,604 | 122,551 | 1,029,116 |
| Fidelity Series Floating Rate High Income Fund | 9,929 | 8,647 | 4,768 | 481 | (70) | 620 | 14,358 |
| Fidelity Series Government Bond Index Fund | 593,945 | 735,772 | 148,953 | 18,697 | (3,045) | (28,755) | 1,148,964 |
| Fidelity Series Government Money Market Fund 0.07% | 165,306 | 627,174 | 456,558 | 344 | -- | -- | 335,922 |
| Fidelity Series High Income Fund | 51,577 | 46,623 | 16,800 | 3,302 | 82 | 2,783 | 84,265 |
| Fidelity Series Inflation-Protected Bond Index Fund | 600,085 | 645,927 | 154,164 | 9,199 | (383) | 53,954 | 1,145,419 |
| Fidelity Series International Credit Fund | 2,054 | 141 | -- | 141 | -- | (44) | 2,151 |
| Fidelity Series International Growth Fund | 206,264 | 279,889 | 117,197 | 34,999 | 1,482 | 36,378 | 406,816 |
| Fidelity Series International Index Fund | 84,693 | 100,347 | 41,656 | 1,951 | 665 | 25,109 | 169,158 |
| Fidelity Series International Small Cap Fund | 69,217 | 70,069 | 27,649 | 759 | 540 | 30,432 | 142,609 |
| Fidelity Series International Value Fund | 205,621 | 256,347 | 127,950 | 6,845 | 719 | 68,746 | 403,483 |
| Fidelity Series Investment Grade Bond Fund | 662,565 | 792,076 | 178,204 | 45,200 | (2,844) | (19,921) | 1,253,672 |
| Fidelity Series Investment Grade Securitized Fund | 447,961 | 547,882 | 121,026 | 14,467 | (1,042) | (9,138) | 864,637 |
| Fidelity Series Large Cap Growth Index Fund | 223,559 | 197,524 | 138,547 | 4,949 | 3,825 | 78,823 | 365,184 |
| Fidelity Series Large Cap Stock Fund | 228,550 | 241,509 | 161,805 | 14,179 | 5,653 | 88,112 | 402,019 |
| Fidelity Series Large Cap Value Index Fund | 432,809 | 451,704 | 278,792 | 11,042 | 7,402 | 164,986 | 778,109 |
| Fidelity Series Long-Term Treasury Bond Index Fund | 166,208 | 321,763 | 54,229 | 20,373 | (4,728) | (25,674) | 403,340 |
| Fidelity Series Overseas Fund | 206,669 | 242,399 | 115,119 | 2,796 | 1,653 | 72,184 | 407,786 |
| Fidelity Series Real Estate Income Fund | 30,431 | 27,606 | 13,791 | 1,733 | (96) | 6,693 | 50,843 |
| Fidelity Series Short-Term Credit Fund | 149,594 | 154,287 | 14,666 | 3,394 | 126 | (1,267) | 288,074 |
| Fidelity Series Small Cap Opportunities Fund | 109,176 | 107,917 | 70,197 | 2,713 | 2,352 | 43,871 | 193,119 |
| Fidelity Series Treasury Bill Index Fund | 541,023 | 454,723 | 59,126 | 803 | (152) | (389) | 936,079 |
| Fidelity Series Value Discovery Fund | 154,438 | 161,972 | 98,942 | 4,228 | 2,835 | 65,677 | 285,980 |
| $7,183,174 | $8,559,523 | $3,376,636 | $373,265 | $31,925 | $938,443 | $13,336,429 |
Amounts in the income column in the above table include any capital gain distributions from underlying funds, which are presented in the corresponding line-item in the Statement of Operations, if applicable.
Investment Valuation
The following is a summary of the inputs used, as of July 31, 2021, involving the Fund's assets and liabilities carried at fair value. The inputs or methodology used for valuing securities may not be an indication of the risk associated with investing in those securities. For more information on valuation inputs, and their aggregation into the levels used below, please refer to the Investment Valuation section in the accompanying Notes to Financial Statements.
| Valuation Inputs at Reporting Date: | ||||
| Description | Total | Level 1 | Level 2 | Level 3 |
| Investments in Securities: | ||||
| Domestic Equity Funds | $2,957,964 | $2,957,964 | $-- | $-- |
| International Equity Funds | 2,843,625 | 2,843,625 | -- | -- |
| Bond Funds | 5,974,765 | 5,974,765 | -- | -- |
| Short-Term Funds | 1,560,075 | 1,560,075 | -- | -- |
| Total Investments in Securities: | $13,336,429 | $13,336,429 | $-- | $-- |
See accompanying notes which are an integral part of the financial statements.
Fidelity Managed Retirement 2020 Fund℠
Financial Statements
Statement of Assets and Liabilities
| July 31, 2021 | ||
| Assets | ||
| Investment in securities, at value — See accompanying schedule: | ||
| Affiliated issuers (cost $11,983,577) | $13,336,429 | |
| Total Investment in Securities (cost $11,983,577) | $13,336,429 | |
| Cash | 40 | |
| Receivable for investments sold | 76,572 | |
| Receivable for fund shares sold | 12,000 | |
| Total assets | 13,425,041 | |
| Liabilities | ||
| Payable for investments purchased | $83,919 | |
| Accrued management fee | 4,884 | |
| Distribution and service plan fees payable | 138 | |
| Total liabilities | 88,941 | |
| Net Assets | $13,336,100 | |
| Net Assets consist of: | ||
| Paid in capital | $11,935,450 | |
| Total accumulated earnings (loss) | 1,400,650 | |
| Net Assets | $13,336,100 | |
| Net Asset Value and Maximum Offering Price | ||
| Class A: | ||
| Net Asset Value and redemption price per share ($678,304 ÷ 11,337.19 shares)(a) | $59.83 | |
| Maximum offering price per share (100/94.25 of $59.83) | $63.48 | |
| Fidelity Managed Retirement 2020: | ||
| Net Asset Value, offering price and redemption price per share ($11,459,690 ÷ 191,255.00 shares) | $59.92 | |
| Class K: | ||
| Net Asset Value, offering price and redemption price per share ($125,145 ÷ 2,088.03 shares) | $59.93 | |
| Class K6: | ||
| Net Asset Value, offering price and redemption price per share ($627,575 ÷ 10,471.00 shares) | $59.93 | |
| Class I: | ||
| Net Asset Value, offering price and redemption price per share ($319,991 ÷ 5,338.00 shares) | $59.95 | |
| Class Z6: | ||
| Net Asset Value, offering price and redemption price per share ($125,395 ÷ 2,092.00 shares) | $59.94 |
(a) Redemption price per share is equal to net asset value less any applicable contingent deferred sales charge.
See accompanying notes which are an integral part of the financial statements.
Statement of Operations
| Year ended July 31, 2021 | ||
| Investment Income | ||
| Dividends: | ||
| Affiliated issuers | $123,815 | |
| Expenses | ||
| Management fee | $43,687 | |
| Distribution and service plan fees | 1,202 | |
| Independent trustees' fees and expenses | 25 | |
| Total expenses | 44,914 | |
| Net investment income (loss) | 78,901 | |
| Realized and Unrealized Gain (Loss) | ||
| Net realized gain (loss) on: | ||
| Investment securities: | ||
| Affiliated issuers | 31,925 | |
| Capital gain distributions from underlying funds: | ||
| Affiliated issuers | 249,450 | |
| Total net realized gain (loss) | 281,375 | |
| Change in net unrealized appreciation (depreciation) on: | ||
| Investment securities: | ||
| Affiliated issuers | 938,443 | |
| Total change in net unrealized appreciation (depreciation) | 938,443 | |
| Net gain (loss) | 1,219,818 | |
| Net increase (decrease) in net assets resulting from operations | $1,298,719 |
See accompanying notes which are an integral part of the financial statements.
Statement of Changes in Net Assets
| Year ended July 31, 2021 | Year ended July 31, 2020 | |
| Increase (Decrease) in Net Assets | ||
| Operations | ||
| Net investment income (loss) | $78,901 | $89,508 |
| Net realized gain (loss) | 281,375 | 100,547 |
| Change in net unrealized appreciation (depreciation) | 938,443 | 293,610 |
| Net increase (decrease) in net assets resulting from operations | 1,298,719 | 483,665 |
| Distributions to shareholders | (302,488) | (168,253) |
| Share transactions - net increase (decrease) | 5,156,666 | 2,253,621 |
| Total increase (decrease) in net assets | 6,152,897 | 2,569,033 |
| Net Assets | ||
| Beginning of period | 7,183,203 | 4,614,170 |
| End of period | $13,336,100 | $7,183,203 |
See accompanying notes which are an integral part of the financial statements.
Financial Highlights
Fidelity Managed Retirement 2020 Fund Class A
| Years ended July 31, | 2021 | 2020 | 2019 | 2018 | 2017 |
| Selected Per–Share Data | |||||
| Net asset value, beginning of period | $53.77 | $51.34 | $52.52 | $62.67 | $57.92 |
| Income from Investment Operations | |||||
| Net investment income (loss)A | .327 | .639 | .783 | .676 | .776 |
| Net realized and unrealized gain (loss) | 7.664 | 3.282 | 1.134 | 2.152 | 5.041 |
| Total from investment operations | 7.991 | 3.921 | 1.917 | 2.828 | 5.817 |
| Distributions from net investment income | (.409) | (.754) | (.822) | (.685) | (.706) |
| Distributions from net realized gain | (1.522) | (.737) | (2.275) | (12.293) | (.361) |
| Total distributions | (1.931) | (1.491) | (3.097) | (12.978) | (1.067) |
| Net asset value, end of period | $59.83 | $53.77 | $51.34 | $52.52 | $62.67 |
| Total ReturnB,C | 15.15% | 7.76% | 4.02% | 5.29% | 10.19% |
| Ratios to Average Net AssetsD,E,F | |||||
| Expenses before reductions | .72% | .72% | .81%G | .87% | .34% |
| Expenses net of fee waivers, if any | .72% | .72% | .81%G | .87% | .34% |
| Expenses net of all reductions | .72% | .72% | .81%G | .87% | .34% |
| Net investment income (loss) | .57% | 1.26% | 1.57% | 1.26% | 1.29% |
| Supplemental Data | |||||
| Net assets, end of period (000 omitted) | $678 | $155 | $20 | $17 | $17 |
| Portfolio turnover rateF | 35% | 69% | 86% | 19% | 115% |
A Calculated based on average shares outstanding during the period.
B Total returns would have been lower if certain expenses had not been reduced during the applicable periods shown.
C Total returns do not include the effect of the sales charges.
D Fees and expenses of any underlying mutual funds or exchange-traded funds (ETFs) are not included in the Fund's expense ratio. The Fund indirectly bears its proportionate share of these expenses.
E Expense ratios reflect operating expenses of the class. Expenses before reductions do not reflect amounts reimbursed, waived, or reduced through arrangements with the investment adviser, brokerage services, or other offset arrangements, if applicable, and do not represent the amount paid by the class during periods when reimbursements, waivers or reductions occur.
F Amount does not include the portfolio activity of any underlying mutual funds or exchange-traded funds (ETFs).
G On certain classes, the size and fluctuation of net assets and expense amounts may cause ratios to differ from contractual rates.
See accompanying notes which are an integral part of the financial statements.
Fidelity Managed Retirement 2020 Fund
| Years ended July 31, | 2021 | 2020 | 2019 | 2018 | 2017 |
| Selected Per–Share Data | |||||
| Net asset value, beginning of period | $53.81 | $51.35 | $52.53 | $62.67 | $57.92 |
| Income from Investment Operations | |||||
| Net investment income (loss)A | .470 | .777 | .916 | .818 | .909 |
| Net realized and unrealized gain (loss) | 7.671 | 3.281 | 1.125 | 2.145 | 5.058 |
| Total from investment operations | 8.141 | 4.058 | 2.041 | 2.963 | 5.967 |
| Distributions from net investment income | (.509) | (.861) | (.946) | (.810) | (.856) |
| Distributions from net realized gain | (1.522) | (.737) | (2.275) | (12.293) | (.361) |
| Total distributions | (2.031) | (1.598) | (3.221) | (13.103) | (1.217) |
| Net asset value, end of period | $59.92 | $53.81 | $51.35 | $52.53 | $62.67 |
| Total ReturnB | 15.44% | 8.04% | 4.28% | 5.56% | 10.47% |
| Ratios to Average Net AssetsC,D,E | |||||
| Expenses before reductions | .47% | .47% | .55% | .62% | .10% |
| Expenses net of fee waivers, if any | .47% | .47% | .55% | .62% | .10% |
| Expenses net of all reductions | .47% | .47% | .55% | .61% | .10% |
| Net investment income (loss) | .82% | 1.51% | 1.83% | 1.52% | 1.53% |
| Supplemental Data | |||||
| Net assets, end of period (000 omitted) | $11,460 | $6,193 | $4,303 | $3,139 | $4,314 |
| Portfolio turnover rateE | 35% | 69% | 86% | 19% | 115% |
A Calculated based on average shares outstanding during the period.
B Total returns would have been lower if certain expenses had not been reduced during the applicable periods shown.
C Fees and expenses of any underlying mutual funds or exchange-traded funds (ETFs) are not included in the Fund's expense ratio. The Fund indirectly bears its proportionate share of these expenses.
D Expense ratios reflect operating expenses of the class. Expenses before reductions do not reflect amounts reimbursed, waived, or reduced through arrangements with the investment adviser, brokerage services, or other offset arrangements, if applicable, and do not represent the amount paid by the class during periods when reimbursements, waivers or reductions occur.
E Amount does not include the portfolio activity of any underlying mutual funds or exchange-traded funds (ETFs).
See accompanying notes which are an integral part of the financial statements.
Fidelity Managed Retirement 2020 Fund Class K
| Years ended July 31, | 2021 | 2020 A |
| Selected Per–Share Data | ||
| Net asset value, beginning of period | $53.82 | $51.28 |
| Income from Investment Operations | ||
| Net investment income (loss)B | .526 | .829 |
| Net realized and unrealized gain (loss) | 7.661 | 3.357 |
| Total from investment operations | 8.187 | 4.186 |
| Distributions from net investment income | (.555) | (.909) |
| Distributions from net realized gain | (1.522) | (.737) |
| Total distributions | (2.077) | (1.646) |
| Net asset value, end of period | $59.93 | $53.82 |
| Total ReturnC | 15.53% | 8.31%D |
| Ratios to Average Net AssetsE,F,G | ||
| Expenses before reductions | .37% | .37% |
| Expenses net of fee waivers, if any | .37% | .37% |
| Expenses net of all reductions | .37% | .37% |
| Net investment income (loss) | .92% | 1.61% |
| Supplemental Data | ||
| Net assets, end of period (000 omitted) | $125 | $108 |
| Portfolio turnover rateG | 35% | 69% |
A For the period August 1, 2019 (commencement of sale of shares) to July 31, 2020.
B Calculated based on average shares outstanding during the period.
C Total returns would have been lower if certain expenses had not been reduced during the applicable periods shown.
D Total returns for periods of less than one year are not annualized.
E Fees and expenses of any underlying mutual funds or exchange-traded funds (ETFs) are not included in the Fund's expense ratio. The Fund indirectly bears its proportionate share of these expenses.
F Expense ratios reflect operating expenses of the class. Expenses before reductions do not reflect amounts reimbursed, waived, or reduced through arrangements with the investment adviser, brokerage services, or other offset arrangements, if applicable, and do not represent the amount paid by the class during periods when reimbursements, waivers or reductions occur.
G Amount does not include the portfolio activity of any underlying mutual funds or exchange-traded funds (ETFs).
See accompanying notes which are an integral part of the financial statements.
Fidelity Managed Retirement 2020 Fund Class K6
| Years ended July 31, | 2021 | 2020 A |
| Selected Per–Share Data | ||
| Net asset value, beginning of period | $53.82 | $51.28 |
| Income from Investment Operations | ||
| Net investment income (loss)B | .584 | .869 |
| Net realized and unrealized gain (loss) | 7.661 | 3.369 |
| Total from investment operations | 8.245 | 4.238 |
| Distributions from net investment income | (.613) | (.961) |
| Distributions from net realized gain | (1.522) | (.737) |
| Total distributions | (2.135) | (1.698) |
| Net asset value, end of period | $59.93 | $53.82 |
| Total ReturnC | 15.65% | 8.42%D |
| Ratios to Average Net AssetsE,F,G | ||
| Expenses before reductions | .27% | .27% |
| Expenses net of fee waivers, if any | .27% | .27% |
| Expenses net of all reductions | .27% | .27% |
| Net investment income (loss) | 1.02% | 1.71% |
| Supplemental Data | ||
| Net assets, end of period (000 omitted) | $628 | $406 |
| Portfolio turnover rateG | 35% | 69% |
A For the period August 1, 2019 (commencement of sale of shares) to July 31, 2020.
B Calculated based on average shares outstanding during the period.
C Total returns would have been lower if certain expenses had not been reduced during the applicable periods shown.
D Total returns for periods of less than one year are not annualized.
E Fees and expenses of any underlying mutual funds or exchange-traded funds (ETFs) are not included in the Fund's expense ratio. The Fund indirectly bears its proportionate share of these expenses.
F Expense ratios reflect operating expenses of the class. Expenses before reductions do not reflect amounts reimbursed, waived, or reduced through arrangements with the investment adviser, brokerage services, or other offset arrangements, if applicable, and do not represent the amount paid by the class during periods when reimbursements, waivers or reductions occur.
G Amount does not include the portfolio activity of any underlying mutual funds or exchange-traded funds (ETFs).
See accompanying notes which are an integral part of the financial statements.
Fidelity Managed Retirement 2020 Fund Class I
| Years ended July 31, | 2021 | 2020 | 2019 | 2018 | 2017 |
| Selected Per–Share Data | |||||
| Net asset value, beginning of period | $53.83 | $51.35 | $52.53 | $62.67 | $57.92 |
| Income from Investment Operations | |||||
| Net investment income (loss)A | .470 | .779 | .890 | .812 | .909 |
| Net realized and unrealized gain (loss) | 7.673 | 3.282 | 1.148 | 2.161 | 5.048 |
| Total from investment operations | 8.143 | 4.061 | 2.038 | 2.973 | 5.957 |
| Distributions from net investment income | (.501) | (.844) | (.943) | (.820) | (.846) |
| Distributions from net realized gain | (1.522) | (.737) | (2.275) | (12.293) | (.361) |
| Total distributions | (2.023) | (1.581) | (3.218) | (13.113) | (1.207) |
| Net asset value, end of period | $59.95 | $53.83 | $51.35 | $52.53 | $62.67 |
| Total ReturnB | 15.44% | 8.05% | 4.27% | 5.58% | 10.45% |
| Ratios to Average Net AssetsC,D,E | |||||
| Expenses before reductions | .47% | .47% | .55% | .62% | .10% |
| Expenses net of fee waivers, if any | .47% | .47% | .55% | .62% | .10% |
| Expenses net of all reductions | .47% | .47% | .55% | .61% | .10% |
| Net investment income (loss) | .82% | 1.51% | 1.83% | 1.52% | 1.53% |
| Supplemental Data | |||||
| Net assets, end of period (000 omitted) | $320 | $212 | $291 | $28 | $26 |
| Portfolio turnover rateE | 35% | 69% | 86% | 19% | 115% |
A Calculated based on average shares outstanding during the period.
B Total returns would have been lower if certain expenses had not been reduced during the applicable periods shown.
C Fees and expenses of any underlying mutual funds or exchange-traded funds (ETFs) are not included in the Fund's expense ratio. The Fund indirectly bears its proportionate share of these expenses.
D Expense ratios reflect operating expenses of the class. Expenses before reductions do not reflect amounts reimbursed, waived, or reduced through arrangements with the investment adviser, brokerage services, or other offset arrangements, if applicable, and do not represent the amount paid by the class during periods when reimbursements, waivers or reductions occur.
E Amount does not include the portfolio activity of any underlying mutual funds or exchange-traded funds (ETFs).
See accompanying notes which are an integral part of the financial statements.
Fidelity Managed Retirement 2020 Fund Class Z6
| Years ended July 31, | 2021 | 2020 A |
| Selected Per–Share Data | ||
| Net asset value, beginning of period | $53.82 | $51.28 |
| Income from Investment Operations | ||
| Net investment income (loss)B | .583 | .881 |
| Net realized and unrealized gain (loss) | 7.669 | 3.352 |
| Total from investment operations | 8.252 | 4.233 |
| Distributions from net investment income | (.610) | (.956) |
| Distributions from net realized gain | (1.522) | (.737) |
| Total distributions | (2.132) | (1.693) |
| Net asset value, end of period | $59.94 | $53.82 |
| Total ReturnC | 15.66% | 8.41%D |
| Ratios to Average Net AssetsE,F,G | ||
| Expenses before reductions | .27% | .27% |
| Expenses net of fee waivers, if any | .27% | .27% |
| Expenses net of all reductions | .27% | .27% |
| Net investment income (loss) | 1.02% | 1.71% |
| Supplemental Data | ||
| Net assets, end of period (000 omitted) | $125 | $108 |
| Portfolio turnover rateG | 35% | 69% |
A For the period August 1, 2019 (commencement of sale of shares) to July 31, 2020.
B Calculated based on average shares outstanding during the period.
C Total returns would have been lower if certain expenses had not been reduced during the applicable periods shown.
D Total returns for periods of less than one year are not annualized.
E Fees and expenses of any underlying mutual funds or exchange-traded funds (ETFs) are not included in the Fund's expense ratio. The Fund indirectly bears its proportionate share of these expenses.
F Expense ratios reflect operating expenses of the class. Expenses before reductions do not reflect amounts reimbursed, waived, or reduced through arrangements with the investment adviser, brokerage services, or other offset arrangements, if applicable, and do not represent the amount paid by the class during periods when reimbursements, waivers or reductions occur.
G Amount does not include the portfolio activity of any underlying mutual funds or exchange-traded funds (ETFs).
See accompanying notes which are an integral part of the financial statements.
Fidelity Managed Retirement 2025 Fund℠
Investment Summary (Unaudited)
The information in the following tables is based on the direct investments of the Fund.Top Holdings as of July 31, 2021
| % of fund's net assets | |
| Fidelity Series Investment Grade Bond Fund | 8.8 |
| Fidelity Series Emerging Markets Opportunities Fund | 8.5 |
| Fidelity Series Government Bond Index Fund | 8.0 |
| Fidelity Series Inflation-Protected Bond Index Fund | 7.5 |
| Fidelity Series Large Cap Value Index Fund | 7.1 |
| Fidelity Series Corporate Bond Fund | 6.4 |
| Fidelity Series Investment Grade Securitized Fund | 6.0 |
| Fidelity Series Blue Chip Growth Fund | 5.2 |
| Fidelity Series Treasury Bill Index Fund | 4.8 |
| Fidelity Series Large Cap Stock Fund | 3.6 |
| 65.9 |
Asset Allocation (% of fund's net assets)
| Period end | ||
| Domestic Equity Funds | 26.3% | |
| International Equity Funds | 24.1% | |
| Bond Funds | 41.6% | |
| Short-Term Funds | 8.0% | |

Domestic Equity Funds category includes Fidelity Series Commodity Strategy Fund which invests in commodity-related investments.
Fidelity Managed Retirement 2025 Fund℠
Schedule of Investments July 31, 2021
Showing Percentage of Net Assets
| Domestic Equity Funds - 26.3% | |||
| Shares | Value | ||
| Fidelity Series Blue Chip Growth Fund (a) | 159,682 | $3,088,256 | |
| Fidelity Series Commodity Strategy Fund (a) | 284,582 | 1,607,889 | |
| Fidelity Series Large Cap Growth Index Fund (a) | 108,427 | 1,970,127 | |
| Fidelity Series Large Cap Stock Fund (a) | 109,698 | 2,168,720 | |
| Fidelity Series Large Cap Value Index Fund (a) | 269,450 | 4,198,036 | |
| Fidelity Series Small Cap Opportunities Fund (a) | 57,623 | 1,041,815 | |
| Fidelity Series Value Discovery Fund (a) | 90,803 | 1,542,742 | |
| TOTAL DOMESTIC EQUITY FUNDS | |||
| (Cost $12,201,876) | 15,617,585 | ||
| International Equity Funds - 24.1% | |||
| Fidelity Series Canada Fund (a) | 62,419 | 875,741 | |
| Fidelity Series Emerging Markets Fund (a) | 49,336 | 554,044 | |
| Fidelity Series Emerging Markets Opportunities Fund (a) | 200,819 | 5,016,459 | |
| Fidelity Series International Growth Fund (a) | 103,498 | 2,085,485 | |
| Fidelity Series International Index Fund (a) | 69,918 | 866,979 | |
| Fidelity Series International Small Cap Fund (a) | 31,427 | 730,992 | |
| Fidelity Series International Value Fund (a) | 183,856 | 2,068,383 | |
| Fidelity Series Overseas Fund (a) | 147,219 | 2,090,511 | |
| TOTAL INTERNATIONAL EQUITY FUNDS | |||
| (Cost $11,639,014) | 14,288,594 | ||
| Bond Funds - 41.6% | |||
| Fidelity Series Corporate Bond Fund (a) | 333,885 | 3,769,558 | |
| Fidelity Series Emerging Markets Debt Fund (a) | 34,859 | 325,232 | |
| Fidelity Series Emerging Markets Debt Local Currency Fund (a) | 10,376 | 107,076 | |
| Fidelity Series Floating Rate High Income Fund (a) | 6,847 | 63,058 | |
| Fidelity Series Government Bond Index Fund (a) | 442,491 | 4,761,207 | |
| Fidelity Series High Income Fund (a) | 39,130 | 375,256 | |
| Fidelity Series Inflation-Protected Bond Index Fund (a) | 397,426 | 4,463,097 | |
| Fidelity Series International Credit Fund (a) | 1,411 | 14,348 | |
| Fidelity Series Investment Grade Bond Fund (a) | 438,738 | 5,194,657 | |
| Fidelity Series Investment Grade Securitized Fund (a) | 343,908 | 3,583,516 | |
| Fidelity Series Long-Term Treasury Bond Index Fund (a) | 207,409 | 1,796,166 | |
| Fidelity Series Real Estate Income Fund (a) | 19,236 | 226,409 | |
| TOTAL BOND FUNDS | |||
| (Cost $23,857,008) | 24,679,580 | ||
| Short-Term Funds - 8.0% | |||
| Fidelity Series Government Money Market Fund 0.07% (a)(b) | 1,030,062 | 1,030,062 | |
| Fidelity Series Short-Term Credit Fund (a) | 86,737 | 882,979 | |
| Fidelity Series Treasury Bill Index Fund (a) | 286,896 | 2,868,961 | |
| TOTAL SHORT-TERM FUNDS | |||
| (Cost $4,773,731) | 4,782,002 | ||
| TOTAL INVESTMENT IN SECURITIES - 100.0% | |||
| (Cost $52,471,629) | 59,367,761 | ||
| NET OTHER ASSETS (LIABILITIES) - 0.0% | (1,117) | ||
| NET ASSETS - 100% | $59,366,644 |
Legend
(a) Affiliated Fund
(b) The rate quoted is the annualized seven-day yield of the fund at period end.
Affiliated Underlying Funds
Fiscal year to date information regarding the Fund's investments in affiliated Underlying Funds is presented below. Exchanges between classes of the same affiliated Underlying Funds may occur. If an underlying Fund changes its name, the name presented below is the name in effect at period end.
| Affiliate | Value, beginning of period | Purchases | Sales Proceeds | Dividend Income | Realized Gain (loss) | Change in Unrealized appreciation (depreciation) | Value, end of period |
| Fidelity Series Blue Chip Growth Fund | $1,731,467 | $2,163,729 | $1,039,447 | $671,318 | $32,915 | $199,592 | $3,088,256 |
| Fidelity Series Canada Fund | 401,127 | 432,541 | 147,756 | 11,344 | 1,313 | 188,516 | 875,741 |
| Fidelity Series Commodity Strategy Fund | 807,064 | 843,446 | 449,471 | 4,032 | 11,234 | 395,616 | 1,607,889 |
| Fidelity Series Corporate Bond Fund | 2,114,210 | 2,141,341 | 473,908 | 101,600 | (2,025) | (10,060) | 3,769,558 |
| Fidelity Series Emerging Markets Debt Fund | 202,977 | 162,131 | 44,459 | 11,715 | (1,034) | 5,617 | 325,232 |
| Fidelity Series Emerging Markets Debt Local Currency Fund | -- | 113,300 | 7,423 | 1,181 | (15) | 1,214 | 107,076 |
| Fidelity Series Emerging Markets Fund | 338,879 | 298,626 | 157,483 | 6,684 | 3,184 | 70,838 | 554,044 |
| Fidelity Series Emerging Markets Opportunities Fund | 3,084,268 | 2,774,163 | 1,508,712 | 126,496 | 22,058 | 644,682 | 5,016,459 |
| Fidelity Series Floating Rate High Income Fund | 44,057 | 33,937 | 17,520 | 2,259 | (269) | 2,853 | 63,058 |
| Fidelity Series Government Bond Index Fund | 2,500,644 | 2,826,486 | 424,069 | 81,507 | (6,366) | (135,488) | 4,761,207 |
| Fidelity Series Government Money Market Fund 0.07% | 375,792 | 2,019,115 | 1,364,845 | 1,110 | -- | -- | 1,030,062 |
| Fidelity Series High Income Fund | 229,634 | 185,579 | 53,428 | 15,601 | 231 | 13,240 | 375,256 |
| Fidelity Series Inflation-Protected Bond Index Fund | 2,381,863 | 2,254,187 | 394,631 | 39,852 | (154) | 221,832 | 4,463,097 |
| Fidelity Series International Credit Fund | 13,700 | 940 | -- | 939 | -- | (292) | 14,348 |
| Fidelity Series International Growth Fund | 1,063,076 | 1,284,211 | 462,010 | 201,344 | (4,256) | 204,464 | 2,085,485 |
| Fidelity Series International Index Fund | 436,593 | 442,083 | 153,257 | 11,225 | 889 | 140,671 | 866,979 |
| Fidelity Series International Small Cap Fund | 356,831 | 295,290 | 90,881 | 4,353 | 3,452 | 166,300 | 730,992 |
| Fidelity Series International Value Fund | 1,059,854 | 1,143,152 | 516,208 | 39,391 | 4,739 | 376,846 | 2,068,383 |
| Fidelity Series Investment Grade Bond Fund | 2,789,531 | 3,050,457 | 546,742 | 196,093 | (5,961) | (92,628) | 5,194,657 |
| Fidelity Series Investment Grade Securitized Fund | 1,886,018 | 2,097,518 | 356,284 | 62,935 | (2,450) | (41,286) | 3,583,516 |
| Fidelity Series Large Cap Growth Index Fund | 1,187,938 | 1,000,492 | 688,920 | 29,034 | 18,986 | 451,631 | 1,970,127 |
| Fidelity Series Large Cap Stock Fund | 1,214,524 | 1,091,640 | 675,830 | 79,586 | 19,784 | 518,602 | 2,168,720 |
| Fidelity Series Large Cap Value Index Fund | 2,299,823 | 2,037,143 | 1,120,543 | 65,656 | 18,318 | 963,295 | 4,198,036 |
| Fidelity Series Long-Term Treasury Bond Index Fund | 746,022 | 1,409,932 | 211,466 | 99,206 | (19,669) | (128,653) | 1,796,166 |
| Fidelity Series Overseas Fund | 1,065,166 | 1,072,383 | 452,659 | 16,080 | 5,612 | 400,009 | 2,090,511 |
| Fidelity Series Real Estate Income Fund | 132,690 | 106,676 | 43,832 | 8,235 | (17) | 30,892 | 226,409 |
| Fidelity Series Short-Term Credit Fund | 467,298 | 434,446 | 14,983 | 10,878 | (34) | (3,748) | 882,979 |
| Fidelity Series Small Cap Opportunities Fund | 580,227 | 487,968 | 293,939 | 15,892 | 10,122 | 257,437 | 1,041,815 |
| Fidelity Series Treasury Bill Index Fund | 1,881,686 | 1,094,241 | 105,085 | 2,763 | (160) | (1,721) | 2,868,961 |
| Fidelity Series Value Discovery Fund | 820,735 | 726,407 | 394,673 | 25,141 | 9,962 | 380,311 | 1,542,742 |
| $32,213,694 | $34,023,560 | $12,210,464 | $1,943,450 | $120,389 | $5,220,582 | $59,367,761 |
Amounts in the income column in the above table include any capital gain distributions from underlying funds, which are presented in the corresponding line-item in the Statement of Operations, if applicable.
Investment Valuation
The following is a summary of the inputs used, as of July 31, 2021, involving the Fund's assets and liabilities carried at fair value. The inputs or methodology used for valuing securities may not be an indication of the risk associated with investing in those securities. For more information on valuation inputs, and their aggregation into the levels used below, please refer to the Investment Valuation section in the accompanying Notes to Financial Statements.
| Valuation Inputs at Reporting Date: | ||||
| Description | Total | Level 1 | Level 2 | Level 3 |
| Investments in Securities: | ||||
| Domestic Equity Funds | $15,617,585 | $15,617,585 | $-- | $-- |
| International Equity Funds | 14,288,594 | 14,288,594 | -- | -- |
| Bond Funds | 24,679,580 | 24,679,580 | -- | -- |
| Short-Term Funds | 4,782,002 | 4,782,002 | -- | -- |
| Total Investments in Securities: | $59,367,761 | $59,367,761 | $-- | $-- |
See accompanying notes which are an integral part of the financial statements.
Fidelity Managed Retirement 2025 Fund℠
Financial Statements
Statement of Assets and Liabilities
| July 31, 2021 | ||
| Assets | ||
| Investment in securities, at value — See accompanying schedule: | ||
| Affiliated issuers (cost $52,471,629) | $59,367,761 | |
| Total Investment in Securities (cost $52,471,629) | $59,367,761 | |
| Cash | 380 | |
| Receivable for investments sold | 349,771 | |
| Receivable for fund shares sold | 33,575 | |
| Total assets | 59,751,487 | |
| Liabilities | ||
| Payable for investments purchased | $360,576 | |
| Payable for fund shares redeemed | 752 | |
| Accrued management fee | 23,127 | |
| Distribution and service plan fees payable | 388 | |
| Total liabilities | 384,843 | |
| Net Assets | $59,366,644 | |
| Net Assets consist of: | ||
| Paid in capital | $52,059,577 | |
| Total accumulated earnings (loss) | 7,307,067 | |
| Net Assets | $59,366,644 | |
| Net Asset Value and Maximum Offering Price | ||
| Class A: | ||
| Net Asset Value and redemption price per share ($1,866,754 ÷ 29,776.33 shares)(a) | $62.69 | |
| Maximum offering price per share (100/94.25 of $62.69) | $66.51 | |
| Fidelity Managed Retirement 2025: | ||
| Net Asset Value, offering price and redemption price per share ($55,127,373 ÷ 877,864.00 shares) | $62.80 | |
| Class K: | ||
| Net Asset Value, offering price and redemption price per share ($128,074 ÷ 2,038.78 shares) | $62.82 | |
| Class K6: | ||
| Net Asset Value, offering price and redemption price per share ($1,350,886 ÷ 21,509.00 shares) | $62.81 | |
| Class I: | ||
| Net Asset Value, offering price and redemption price per share ($765,228 ÷ 12,159.84 shares) | $62.93 | |
| Class Z6: | ||
| Net Asset Value, offering price and redemption price per share ($128,329 ÷ 2,040.00 shares) | $62.91 |
(a) Redemption price per share is equal to net asset value less any applicable contingent deferred sales charge.
See accompanying notes which are an integral part of the financial statements.
Statement of Operations
| Year ended July 31, 2021 | ||
| Investment Income | ||
| Dividends: | ||
| Affiliated issuers | $618,939 | |
| Expenses | ||
| Management fee | $216,349 | |
| Distribution and service plan fees | 3,364 | |
| Independent trustees' fees and expenses | 119 | |
| Total expenses | 219,832 | |
| Net investment income (loss) | 399,107 | |
| Realized and Unrealized Gain (Loss) | ||
| Net realized gain (loss) on: | ||
| Investment securities: | ||
| Affiliated issuers | 120,389 | |
| Capital gain distributions from underlying funds: | ||
| Affiliated issuers | 1,324,511 | |
| Total net realized gain (loss) | 1,444,900 | |
| Change in net unrealized appreciation (depreciation) on: | ||
| Investment securities: | ||
| Affiliated issuers | 5,220,582 | |
| Total change in net unrealized appreciation (depreciation) | 5,220,582 | |
| Net gain (loss) | 6,665,482 | |
| Net increase (decrease) in net assets resulting from operations | $7,064,589 |
See accompanying notes which are an integral part of the financial statements.
Statement of Changes in Net Assets
| Year ended July 31, 2021 | Year ended July 31, 2020 | |
| Increase (Decrease) in Net Assets | ||
| Operations | ||
| Net investment income (loss) | $399,107 | $434,664 |
| Net realized gain (loss) | 1,444,900 | 441,979 |
| Change in net unrealized appreciation (depreciation) | 5,220,582 | 1,160,042 |
| Net increase (decrease) in net assets resulting from operations | 7,064,589 | 2,036,685 |
| Distributions to shareholders | (1,411,503) | (985,376) |
| Share transactions - net increase (decrease) | 21,499,635 | 9,798,272 |
| Total increase (decrease) in net assets | 27,152,721 | 10,849,581 |
| Net Assets | ||
| Beginning of period | 32,213,923 | 21,364,342 |
| End of period | $59,366,644 | $32,213,923 |
See accompanying notes which are an integral part of the financial statements.
Financial Highlights
Fidelity Managed Retirement 2025 Fund Class A
| Years ended July 31, | 2021 | 2020 | 2019 | 2018 | 2017 |
| Selected Per–Share Data | |||||
| Net asset value, beginning of period | $55.13 | $52.89 | $54.27 | $64.30 | $59.20 |
| Income from Investment Operations | |||||
| Net investment income (loss)A | .377 | .692 | .818 | .678 | .800 |
| Net realized and unrealized gain (loss) | 9.095 | 3.455 | 1.072 | 2.470 | 5.517 |
| Total from investment operations | 9.472 | 4.147 | 1.890 | 3.148 | 6.317 |
| Distributions from net investment income | (.446) | (.756) | (.820) | (.654) | (.749) |
| Distributions from net realized gain | (1.466) | (1.151) | (2.450) | (12.524) | (.468) |
| Total distributions | (1.912) | (1.907) | (3.270) | (13.178) | (1.217) |
| Net asset value, end of period | $62.69 | $55.13 | $52.89 | $54.27 | $64.30 |
| Total ReturnB,C | 17.50% | 8.01% | 3.87% | 5.74% | 10.85% |
| Ratios to Average Net AssetsD,E,F | |||||
| Expenses before reductions | .73% | .73% | .84% | .91% | .35% |
| Expenses net of fee waivers, if any | .73% | .73% | .84% | .91% | .35% |
| Expenses net of all reductions | .73% | .73% | .84% | .91% | .35% |
| Net investment income (loss) | .63% | 1.32% | 1.59% | 1.23% | 1.31% |
| Supplemental Data | |||||
| Net assets, end of period (000 omitted) | $1,867 | $993 | $556 | $577 | $592 |
| Portfolio turnover rateF | 27% | 67% | 48% | 19% | 108% |
A Calculated based on average shares outstanding during the period.
B Total returns would have been lower if certain expenses had not been reduced during the applicable periods shown.
C Total returns do not include the effect of the sales charges.
D Fees and expenses of any underlying mutual funds or exchange-traded funds (ETFs) are not included in the Fund's expense ratio. The Fund indirectly bears its proportionate share of these expenses.
E Expense ratios reflect operating expenses of the class. Expenses before reductions do not reflect amounts reimbursed, waived, or reduced through arrangements with the investment adviser, brokerage services, or other offset arrangements, if applicable, and do not represent the amount paid by the class during periods when reimbursements, waivers or reductions occur.
F Amount does not include the portfolio activity of any underlying mutual funds or exchange-traded funds (ETFs).
See accompanying notes which are an integral part of the financial statements.
Fidelity Managed Retirement 2025 Fund
| Years ended July 31, | 2021 | 2020 | 2019 | 2018 | 2017 |
| Selected Per–Share Data | |||||
| Net asset value, beginning of period | $55.19 | $52.92 | $54.31 | $64.34 | $59.22 |
| Income from Investment Operations | |||||
| Net investment income (loss)A | .525 | .825 | .950 | .820 | .951 |
| Net realized and unrealized gain (loss) | 9.109 | 3.466 | 1.062 | 2.468 | 5.523 |
| Total from investment operations | 9.634 | 4.291 | 2.012 | 3.288 | 6.474 |
| Distributions from net investment income | (.558) | (.870) | (.952) | (.794) | (.886) |
| Distributions from net realized gain | (1.466) | (1.151) | (2.450) | (12.524) | (.468) |
| Total distributions | (2.024) | (2.021) | (3.402) | (13.318) | (1.354) |
| Net asset value, end of period | $62.80 | $55.19 | $52.92 | $54.31 | $64.34 |
| Total ReturnB | 17.79% | 8.30% | 4.11% | 6.01% | 11.13% |
| Ratios to Average Net AssetsC,D,E | |||||
| Expenses before reductions | .48% | .48% | .59% | .66% | .10% |
| Expenses net of fee waivers, if any | .48% | .48% | .59% | .66% | .10% |
| Expenses net of all reductions | .48% | .48% | .59% | .66% | .10% |
| Net investment income (loss) | .88% | 1.57% | 1.84% | 1.48% | 1.56% |
| Supplemental Data | |||||
| Net assets, end of period (000 omitted) | $55,127 | $30,093 | $20,130 | $16,953 | $22,122 |
| Portfolio turnover rateE | 27% | 67% | 48% | 19% | 108% |
A Calculated based on average shares outstanding during the period.
B Total returns would have been lower if certain expenses had not been reduced during the applicable periods shown.
C Fees and expenses of any underlying mutual funds or exchange-traded funds (ETFs) are not included in the Fund's expense ratio. The Fund indirectly bears its proportionate share of these expenses.
D Expense ratios reflect operating expenses of the class. Expenses before reductions do not reflect amounts reimbursed, waived, or reduced through arrangements with the investment adviser, brokerage services, or other offset arrangements, if applicable, and do not represent the amount paid by the class during periods when reimbursements, waivers or reductions occur.
E Amount does not include the portfolio activity of any underlying mutual funds or exchange-traded funds (ETFs).
See accompanying notes which are an integral part of the financial statements.
Fidelity Managed Retirement 2025 Fund Class K
| Years ended July 31, | 2021 | 2020 A |
| Selected Per–Share Data | ||
| Net asset value, beginning of period | $55.20 | $52.82 |
| Income from Investment Operations | ||
| Net investment income (loss)B | .582 | .879 |
| Net realized and unrealized gain (loss) | 9.109 | 3.572 |
| Total from investment operations | 9.691 | 4.451 |
| Distributions from net investment income | (.605) | (.920) |
| Distributions from net realized gain | (1.466) | (1.151) |
| Total distributions | (2.071) | (2.071) |
| Net asset value, end of period | $62.82 | $55.20 |
| Total ReturnC | 17.90% | 8.63%D |
| Ratios to Average Net AssetsE,F,G | ||
| Expenses before reductions | .38% | .38% |
| Expenses net of fee waivers, if any | .38% | .38% |
| Expenses net of all reductions | .38% | .38% |
| Net investment income (loss) | .98% | 1.67% |
| Supplemental Data | ||
| Net assets, end of period (000 omitted) | $128 | $109 |
| Portfolio turnover rateG | 27% | 67% |
A For the period August 1, 2019 (commencement of sale of shares) to July 31, 2020.
B Calculated based on average shares outstanding during the period.
C Total returns would have been lower if certain expenses had not been reduced during the applicable periods shown.
D Total returns for periods of less than one year are not annualized.
E Fees and expenses of any underlying mutual funds or exchange-traded funds (ETFs) are not included in the Fund's expense ratio. The Fund indirectly bears its proportionate share of these expenses.
F Expense ratios reflect operating expenses of the class. Expenses before reductions do not reflect amounts reimbursed, waived, or reduced through arrangements with the investment adviser, brokerage services, or other offset arrangements, if applicable, and do not represent the amount paid by the class during periods when reimbursements, waivers or reductions occur.
G Amount does not include the portfolio activity of any underlying mutual funds or exchange-traded funds (ETFs).
See accompanying notes which are an integral part of the financial statements.
Fidelity Managed Retirement 2025 Fund Class K6
| Years ended July 31, | 2021 | 2020 A |
| Selected Per–Share Data | ||
| Net asset value, beginning of period | $55.20 | $52.82 |
| Income from Investment Operations | ||
| Net investment income (loss)B | .648 | .932 |
| Net realized and unrealized gain (loss) | 9.105 | 3.567 |
| Total from investment operations | 9.753 | 4.499 |
| Distributions from net investment income | (.677) | (.968) |
| Distributions from net realized gain | (1.466) | (1.151) |
| Total distributions | (2.143) | (2.119) |
| Net asset value, end of period | $62.81 | $55.20 |
| Total ReturnC | 18.03% | 8.73%D |
| Ratios to Average Net AssetsE,F,G | ||
| Expenses before reductions | .28% | .28% |
| Expenses net of fee waivers, if any | .28% | .28% |
| Expenses net of all reductions | .28% | .28% |
| Net investment income (loss) | 1.08% | 1.77% |
| Supplemental Data | ||
| Net assets, end of period (000 omitted) | $1,351 | $412 |
| Portfolio turnover rateG | 27% | 67% |
A For the period August 1, 2019 (commencement of sale of shares) to July 31, 2020.
B Calculated based on average shares outstanding during the period.
C Total returns would have been lower if certain expenses had not been reduced during the applicable periods shown.
D Total returns for periods of less than one year are not annualized.
E Fees and expenses of any underlying mutual funds or exchange-traded funds (ETFs) are not included in the Fund's expense ratio. The Fund indirectly bears its proportionate share of these expenses.
F Expense ratios reflect operating expenses of the class. Expenses before reductions do not reflect amounts reimbursed, waived, or reduced through arrangements with the investment adviser, brokerage services, or other offset arrangements, if applicable, and do not represent the amount paid by the class during periods when reimbursements, waivers or reductions occur.
G Amount does not include the portfolio activity of any underlying mutual funds or exchange-traded funds (ETFs).
See accompanying notes which are an integral part of the financial statements.
Fidelity Managed Retirement 2025 Fund Class I
| Years ended July 31, | 2021 | 2020 | 2019 | 2018 | 2017 |
| Selected Per–Share Data | |||||
| Net asset value, beginning of period | $55.30 | $53.00 | $54.38 | $64.33 | $59.21 |
| Income from Investment Operations | |||||
| Net investment income (loss)A | .525 | .831 | .906 | .835 | .953 |
| Net realized and unrealized gain (loss) | 9.122 | 3.463 | 1.114 | 2.466 | 5.521 |
| Total from investment operations | 9.647 | 4.294 | 2.020 | 3.301 | 6.474 |
| Distributions from net investment income | (.551) | (.843) | (.950) | (.727) | (.886) |
| Distributions from net realized gain | (1.466) | (1.151) | (2.450) | (12.524) | (.468) |
| Total distributions | (2.017) | (1.994) | (3.400) | (13.251) | (1.354) |
| Net asset value, end of period | $62.93 | $55.30 | $53.00 | $54.38 | $64.33 |
| Total ReturnB | 17.78% | 8.29% | 4.12% | 6.03% | 11.14% |
| Ratios to Average Net AssetsC,D,E | |||||
| Expenses before reductions | .48% | .48% | .57%F | .66% | .10% |
| Expenses net of fee waivers, if any | .48% | .48% | .57%F | .66% | .10% |
| Expenses net of all reductions | .48% | .48% | .57%F | .65% | .10% |
| Net investment income (loss) | .88% | 1.57% | 1.87% | 1.49% | 1.56% |
| Supplemental Data | |||||
| Net assets, end of period (000 omitted) | $765 | $498 | $678 | $28 | $79 |
| Portfolio turnover rateE | 27% | 67% | 48% | 19% | 108% |
A Calculated based on average shares outstanding during the period.
B Total returns would have been lower if certain expenses had not been reduced during the applicable periods shown.
C Fees and expenses of any underlying mutual funds or exchange-traded funds (ETFs) are not included in the Fund's expense ratio. The Fund indirectly bears its proportionate share of these expenses.
D Expense ratios reflect operating expenses of the class. Expenses before reductions do not reflect amounts reimbursed, waived, or reduced through arrangements with the investment adviser, brokerage services, or other offset arrangements, if applicable, and do not represent the amount paid by the class during periods when reimbursements, waivers or reductions occur.
E Amount does not include the portfolio activity of any underlying mutual funds or exchange-traded funds (ETFs).
F On certain classes, the size and fluctuation of net assets and expense amounts may cause ratios to differ from contractual rates.
See accompanying notes which are an integral part of the financial statements.
Fidelity Managed Retirement 2025 Fund Class Z6
| Years ended July 31, | 2021 | 2020 A |
| Selected Per–Share Data | ||
| Net asset value, beginning of period | $55.28 | $52.89 |
| Income from Investment Operations | ||
| Net investment income (loss)B | .643 | .933 |
| Net realized and unrealized gain (loss) | 9.116 | 3.577 |
| Total from investment operations | 9.759 | 4.510 |
| Distributions from net investment income | (.663) | (.969) |
| Distributions from net realized gain | (1.466) | (1.151) |
| Total distributions | (2.129) | (2.120) |
| Net asset value, end of period | $62.91 | $55.28 |
| Total ReturnC | 18.01% | 8.74%D |
| Ratios to Average Net AssetsE,F,G | ||
| Expenses before reductions | .28% | .28% |
| Expenses net of fee waivers, if any | .28% | .28% |
| Expenses net of all reductions | .28% | .28% |
| Net investment income (loss) | 1.08% | 1.77% |
| Supplemental Data | ||
| Net assets, end of period (000 omitted) | $128 | $109 |
| Portfolio turnover rateG | 27% | 67% |
A For the period August 1, 2019 (commencement of sale of shares) to July 31, 2020.
B Calculated based on average shares outstanding during the period.
C Total returns would have been lower if certain expenses had not been reduced during the applicable periods shown.
D Total returns for periods of less than one year are not annualized.
E Fees and expenses of any underlying mutual funds or exchange-traded funds (ETFs) are not included in the Fund's expense ratio. The Fund indirectly bears its proportionate share of these expenses.
F Expense ratios reflect operating expenses of the class. Expenses before reductions do not reflect amounts reimbursed, waived, or reduced through arrangements with the investment adviser, brokerage services, or other offset arrangements, if applicable, and do not represent the amount paid by the class during periods when reimbursements, waivers or reductions occur.
G Amount does not include the portfolio activity of any underlying mutual funds or exchange-traded funds (ETFs).
See accompanying notes which are an integral part of the financial statements.
Fidelity Managed Retirement 2030 Fund℠
Investment Summary (Unaudited)
The information in the following tables is based on the direct investments of the Fund.Top Holdings as of July 31, 2021
| % of fund's net assets | |
| Fidelity Series Emerging Markets Opportunities Fund | 9.0 |
| Fidelity Series Investment Grade Bond Fund | 8.5 |
| Fidelity Series Large Cap Value Index Fund | 7.9 |
| Fidelity Series Government Bond Index Fund | 7.7 |
| Fidelity Series Inflation-Protected Bond Index Fund | 7.0 |
| Fidelity Series Corporate Bond Fund | 6.1 |
| Fidelity Series Blue Chip Growth Fund | 5.9 |
| Fidelity Series Investment Grade Securitized Fund | 5.8 |
| Fidelity Series Large Cap Stock Fund | 4.1 |
| Fidelity Series Overseas Fund | 3.9 |
| 65.9 |
Asset Allocation (% of fund's net assets)
| Period end | ||
| Domestic Equity Funds | 29.2% | |
| International Equity Funds | 26.0% | |
| Bond Funds | 40.0% | |
| Short-Term Funds | 4.8% | |

Domestic Equity Funds category includes Fidelity Series Commodity Strategy Fund which invests in commodity-related investments.
Fidelity Managed Retirement 2030 Fund℠
Schedule of Investments July 31, 2021
Showing Percentage of Net Assets
| Domestic Equity Funds - 29.2% | |||
| Shares | Value | ||
| Fidelity Series Blue Chip Growth Fund (a) | 96,317 | $1,862,770 | |
| Fidelity Series Commodity Strategy Fund (a) | 152,878 | 863,759 | |
| Fidelity Series Large Cap Growth Index Fund (a) | 65,393 | 1,188,199 | |
| Fidelity Series Large Cap Stock Fund (a) | 66,164 | 1,308,066 | |
| Fidelity Series Large Cap Value Index Fund (a) | 162,476 | 2,531,380 | |
| Fidelity Series Small Cap Opportunities Fund (a) | 34,749 | 628,267 | |
| Fidelity Series Value Discovery Fund (a) | 54,760 | 930,373 | |
| TOTAL DOMESTIC EQUITY FUNDS | |||
| (Cost $7,801,383) | 9,312,814 | ||
| International Equity Funds - 26.0% | |||
| Fidelity Series Canada Fund (a) | 36,654 | 514,259 | |
| Fidelity Series Emerging Markets Fund (a) | 28,135 | 315,957 | |
| Fidelity Series Emerging Markets Opportunities Fund (a) | 114,376 | 2,857,102 | |
| Fidelity Series International Growth Fund (a) | 60,754 | 1,224,201 | |
| Fidelity Series International Index Fund (a) | 41,055 | 509,083 | |
| Fidelity Series International Small Cap Fund (a) | 18,445 | 429,024 | |
| Fidelity Series International Value Fund (a) | 107,949 | 1,214,424 | |
| Fidelity Series Overseas Fund (a) | 86,413 | 1,227,072 | |
| TOTAL INTERNATIONAL EQUITY FUNDS | |||
| (Cost $7,398,633) | 8,291,122 | ||
| Bond Funds - 40.0% | |||
| Fidelity Series Corporate Bond Fund (a) | 172,845 | 1,951,420 | |
| Fidelity Series Emerging Markets Debt Fund (a) | 18,732 | 174,766 | |
| Fidelity Series Emerging Markets Debt Local Currency Fund (a) | 5,620 | 57,998 | |
| Fidelity Series Floating Rate High Income Fund (a) | 3,718 | 34,247 | |
| Fidelity Series Government Bond Index Fund (a) | 228,992 | 2,463,957 | |
| Fidelity Series High Income Fund (a) | 21,009 | 201,479 | |
| Fidelity Series Inflation-Protected Bond Index Fund (a) | 197,157 | 2,214,074 | |
| Fidelity Series International Credit Fund (a) | 554 | 5,637 | |
| Fidelity Series Investment Grade Bond Fund (a) | 227,132 | 2,689,245 | |
| Fidelity Series Investment Grade Securitized Fund (a) | 178,055 | 1,855,329 | |
| Fidelity Series Long-Term Treasury Bond Index Fund (a) | 111,357 | 964,351 | |
| Fidelity Series Real Estate Income Fund (a) | 10,329 | 121,569 | |
| TOTAL BOND FUNDS | |||
| (Cost $12,569,196) | 12,734,072 | ||
| Short-Term Funds - 4.8% | |||
| Fidelity Series Government Money Market Fund 0.07% (a)(b) | 330,211 | 330,211 | |
| Fidelity Series Short-Term Credit Fund (a) | 27,845 | 283,464 | |
| Fidelity Series Treasury Bill Index Fund (a) | 92,068 | 920,675 | |
| TOTAL SHORT-TERM FUNDS | |||
| (Cost $1,534,202) | 1,534,350 | ||
| TOTAL INVESTMENT IN SECURITIES - 100.0% | |||
| (Cost $29,303,414) | 31,872,358 | ||
| NET OTHER ASSETS (LIABILITIES) - 0.0% | (505) | ||
| NET ASSETS - 100% | $31,871,853 |
Legend
(a) Affiliated Fund
(b) The rate quoted is the annualized seven-day yield of the fund at period end.
Affiliated Underlying Funds
Fiscal year to date information regarding the Fund's investments in affiliated Underlying Funds is presented below. Exchanges between classes of the same affiliated Underlying Funds may occur. If an underlying Fund changes its name, the name presented below is the name in effect at period end.
| Affiliate | Value, beginning of period | Purchases | Sales Proceeds | Dividend Income | Realized Gain (loss) | Change in Unrealized appreciation (depreciation) | Value, end of period |
| Fidelity Series Blue Chip Growth Fund | $366,396 | $1,959,296 | $598,757 | $230,940 | $(17,195) | $153,030 | $1,862,770 |
| Fidelity Series Canada Fund | 83,339 | 455,165 | 112,658 | 4,084 | 5,152 | 83,261 | 514,259 |
| Fidelity Series Commodity Strategy Fund | 152,479 | 810,410 | 270,167 | 1,184 | 13,422 | 157,615 | 863,759 |
| Fidelity Series Corporate Bond Fund | 385,687 | 1,975,683 | 413,461 | 38,642 | (8,398) | 11,909 | 1,951,420 |
| Fidelity Series Emerging Markets Debt Fund | 38,055 | 173,489 | 37,697 | 4,826 | (299) | 1,218 | 174,766 |
| Fidelity Series Emerging Markets Debt Local Currency Fund | -- | 67,283 | 9,228 | 473 | (212) | 155 | 57,998 |
| Fidelity Series Emerging Markets Fund | 67,536 | 337,233 | 102,569 | 2,283 | (2,084) | 15,841 | 315,957 |
| Fidelity Series Emerging Markets Opportunities Fund | 613,874 | 3,046,615 | 946,688 | 43,564 | (15,083) | 158,384 | 2,857,102 |
| Fidelity Series Floating Rate High Income Fund | 8,612 | 36,480 | 11,699 | 942 | 31 | 823 | 34,247 |
| Fidelity Series Government Bond Index Fund | 456,266 | 2,500,127 | 452,251 | 28,757 | (16,329) | (23,856) | 2,463,957 |
| Fidelity Series Government Money Market Fund 0.07% | 110,006 | 1,190,912 | 970,707 | 493 | -- | -- | 330,211 |
| Fidelity Series High Income Fund | 44,143 | 198,291 | 46,540 | 6,484 | 226 | 5,359 | 201,479 |
| Fidelity Series Inflation-Protected Bond Index Fund | 414,686 | 2,107,642 | 405,011 | 12,480 | 2,461 | 94,296 | 2,214,074 |
| Fidelity Series International Credit Fund | 3,022 | 2,846 | 113 | 369 | 2 | (120) | 5,637 |
| Fidelity Series International Growth Fund | 220,906 | 1,220,690 | 321,134 | 72,423 | (676) | 104,415 | 1,224,201 |
| Fidelity Series International Index Fund | 90,712 | 474,312 | 114,145 | 4,039 | 1,261 | 56,943 | 509,083 |
| Fidelity Series International Small Cap Fund | 74,135 | 373,280 | 92,332 | 1,549 | 1,980 | 71,961 | 429,024 |
| Fidelity Series International Value Fund | 220,236 | 1,162,823 | 325,575 | 14,171 | 12,914 | 144,026 | 1,214,424 |
| Fidelity Series Investment Grade Bond Fund | 508,924 | 2,721,224 | 517,403 | 68,298 | (15,073) | (8,427) | 2,689,245 |
| Fidelity Series Investment Grade Securitized Fund | 344,137 | 1,881,308 | 357,362 | 21,023 | (6,110) | (6,644) | 1,855,329 |
| Fidelity Series Large Cap Growth Index Fund | 251,357 | 1,109,825 | 389,483 | 12,046 | 1,684 | 214,816 | 1,188,199 |
| Fidelity Series Large Cap Stock Fund | 256,997 | 1,226,626 | 427,016 | 24,328 | 15,609 | 235,850 | 1,308,066 |
| Fidelity Series Large Cap Value Index Fund | 486,669 | 2,353,379 | 761,059 | 24,707 | 21,568 | 430,823 | 2,531,380 |
| Fidelity Series Long-Term Treasury Bond Index Fund | 140,647 | 1,019,670 | 156,921 | 35,270 | (23,815) | (15,230) | 964,351 |
| Fidelity Series Overseas Fund | 221,336 | 1,133,726 | 312,626 | 5,784 | 6,530 | 178,106 | 1,227,072 |
| Fidelity Series Real Estate Income Fund | 26,004 | 115,441 | 33,365 | 2,786 | 236 | 13,253 | 121,569 |
| Fidelity Series Short-Term Credit Fund | 39,547 | 280,104 | 35,654 | 1,906 | (53) | (480) | 283,464 |
| Fidelity Series Small Cap Opportunities Fund | 122,766 | 587,482 | 186,112 | 5,665 | 1,966 | 102,165 | 628,267 |
| Fidelity Series Treasury Bill Index Fund | 168,040 | 891,932 | 139,129 | 372 | (132) | (36) | 920,675 |
| Fidelity Series Value Discovery Fund | 173,663 | 856,106 | 278,214 | 9,466 | 14,646 | 164,172 | 930,373 |
| $6,090,177 | $32,269,400 | $8,825,076 | $679,354 | $(5,771) | $2,343,628 | $31,872,358 |
Amounts in the income column in the above table include any capital gain distributions from underlying funds, which are presented in the corresponding line-item in the Statement of Operations, if applicable.
Investment Valuation
The following is a summary of the inputs used, as of July 31, 2021, involving the Fund's assets and liabilities carried at fair value. The inputs or methodology used for valuing securities may not be an indication of the risk associated with investing in those securities. For more information on valuation inputs, and their aggregation into the levels used below, please refer to the Investment Valuation section in the accompanying Notes to Financial Statements.
| Valuation Inputs at Reporting Date: | ||||
| Description | Total | Level 1 | Level 2 | Level 3 |
| Investments in Securities: | ||||
| Domestic Equity Funds | $9,312,814 | $9,312,814 | $-- | $-- |
| International Equity Funds | 8,291,122 | 8,291,122 | -- | -- |
| Bond Funds | 12,734,072 | 12,734,072 | -- | -- |
| Short-Term Funds | 1,534,350 | 1,534,350 | -- | -- |
| Total Investments in Securities: | $31,872,358 | $31,872,358 | $-- | $-- |
See accompanying notes which are an integral part of the financial statements.
Fidelity Managed Retirement 2030 Fund℠
Financial Statements
Statement of Assets and Liabilities
| July 31, 2021 | ||
| Assets | ||
| Investment in securities, at value — See accompanying schedule: | ||
| Affiliated issuers (cost $29,303,414) | $31,872,358 | |
| Total Investment in Securities (cost $29,303,414) | $31,872,358 | |
| Cash | 178 | |
| Receivable for investments sold | 8,693 | |
| Receivable for fund shares sold | 808,621 | |
| Total assets | 32,689,850 | |
| Liabilities | ||
| Payable for investments purchased | $806,139 | |
| Accrued management fee | 11,737 | |
| Distribution and service plan fees payable | 121 | |
| Total liabilities | 817,997 | |
| Net Assets | $31,871,853 | |
| Net Assets consist of: | ||
| Paid in capital | $29,217,490 | |
| Total accumulated earnings (loss) | 2,654,363 | |
| Net Assets | $31,871,853 | |
| Net Asset Value and Maximum Offering Price | ||
| Class A: | ||
| Net Asset Value and redemption price per share ($595,455 ÷ 47,611.00 shares)(a) | $12.51 | |
| Maximum offering price per share (100/94.25 of $12.51) | $13.27 | |
| Fidelity Managed Retirement 2030 Fund: | ||
| Net Asset Value, offering price and redemption price per share ($28,957,511 ÷ 2,313,891.00 shares) | $12.51 | |
| Class K: | ||
| Net Asset Value, offering price and redemption price per share ($219,035 ÷ 17,474.00 shares) | $12.53 | |
| Class K6: | ||
| Net Asset Value, offering price and redemption price per share ($1,459,021 ÷ 116,417.00 shares) | $12.53 | |
| Class I: | ||
| Net Asset Value, offering price and redemption price per share ($421,030 ÷ 33,608.00 shares) | $12.53 | |
| Class Z6: | ||
| Net Asset Value, offering price and redemption price per share ($219,801 ÷ 17,532.00 shares) | $12.54 |
(a) Redemption price per share is equal to net asset value less any applicable contingent deferred sales charge.
See accompanying notes which are an integral part of the financial statements.
Statement of Operations
| Year ended July 31, 2021 | ||
| Investment Income | ||
| Dividends: | ||
| Affiliated issuers | $231,673 | |
| Expenses | ||
| Management fee | $89,345 | |
| Distribution and service plan fees | 1,200 | |
| Independent trustees' fees and expenses | 45 | |
| Total expenses | 90,590 | |
| Net investment income (loss) | 141,083 | |
| Realized and Unrealized Gain (Loss) | ||
| Net realized gain (loss) on: | ||
| Investment securities: | ||
| Affiliated issuers | (5,771) | |
| Capital gain distributions from underlying funds: | ||
| Affiliated issuers | 447,681 | |
| Total net realized gain (loss) | 441,910 | |
| Change in net unrealized appreciation (depreciation) on: | ||
| Investment securities: | ||
| Affiliated issuers | 2,343,628 | |
| Total change in net unrealized appreciation (depreciation) | 2,343,628 | |
| Net gain (loss) | 2,785,538 | |
| Net increase (decrease) in net assets resulting from operations | $2,926,621 |
See accompanying notes which are an integral part of the financial statements.
Statement of Changes in Net Assets
| Year ended July 31, 2021 | For the period August 16, 2019 (commencement of operations) to July 31, 2020 |
|
| Increase (Decrease) in Net Assets | ||
| Operations | ||
| Net investment income (loss) | $141,083 | $40,909 |
| Net realized gain (loss) | 441,910 | (18,750) |
| Change in net unrealized appreciation (depreciation) | 2,343,628 | 225,316 |
| Net increase (decrease) in net assets resulting from operations | 2,926,621 | 247,475 |
| Distributions to shareholders | (408,896) | (50,061) |
| Share transactions - net increase (decrease) | 23,263,836 | 5,892,878 |
| Total increase (decrease) in net assets | 25,781,561 | 6,090,292 |
| Net Assets | ||
| Beginning of period | 6,090,292 | – |
| End of period | $31,871,853 | $6,090,292 |
See accompanying notes which are an integral part of the financial statements.
Financial Highlights
Fidelity Managed Retirement 2030 Fund Class A
| Years ended July 31, | 2021 | 2020 A |
| Selected Per–Share Data | ||
| Net asset value, beginning of period | $10.78 | $10.00 |
| Income from Investment Operations | ||
| Net investment income (loss)B | .056 | .104 |
| Net realized and unrealized gain (loss) | 1.993 | .837 |
| Total from investment operations | 2.049 | .941 |
| Distributions from net investment income | (.089) | (.121) |
| Distributions from net realized gain | (.230) | (.040) |
| Total distributions | (.319) | (.161) |
| Net asset value, end of period | $12.51 | $10.78 |
| Total ReturnC,D | 19.28% | 9.46% |
| Ratios to Average Net AssetsE,F,G | ||
| Expenses before reductions | .73% | .73%H |
| Expenses net of fee waivers, if any | .73% | .73%H |
| Expenses net of all reductions | .73% | .73%H |
| Net investment income (loss) | .47% | 1.06%H |
| Supplemental Data | ||
| Net assets, end of period (000 omitted) | $595 | $300 |
| Portfolio turnover rateG | 46% | 117%H |
A For the period August 16, 2019 (commencement of operations) to July 31, 2020.
B Calculated based on average shares outstanding during the period.
C Total returns for periods of less than one year are not annualized.
D Total returns do not include the effect of the sales charges.
E Fees and expenses of any underlying mutual funds or exchange-traded funds (ETFs) are not included in the Fund's expense ratio. The Fund indirectly bears its proportionate share of these expenses.
F Expense ratios reflect operating expenses of the class. Expenses before reductions do not reflect amounts reimbursed, waived, or reduced through arrangements with the investment adviser, brokerage services, or other offset arrangements, if applicable, and do not represent the amount paid by the class during periods when reimbursements, waivers or reductions occur.
G Amount does not include the portfolio activity of any underlying mutual funds or exchange-traded funds (ETFs).
H Annualized
See accompanying notes which are an integral part of the financial statements.
Fidelity Managed Retirement 2030 Fund
| Years ended July 31, | 2021 | 2020 A |
| Selected Per–Share Data | ||
| Net asset value, beginning of period | $10.77 | $10.00 |
| Income from Investment Operations | ||
| Net investment income (loss)B | .086 | .127 |
| Net realized and unrealized gain (loss) | 1.990 | .832 |
| Total from investment operations | 2.076 | .959 |
| Distributions from net investment income | (.106) | (.149) |
| Distributions from net realized gain | (.230) | (.040) |
| Total distributions | (.336) | (.189) |
| Net asset value, end of period | $12.51 | $10.77 |
| Total ReturnC | 19.57% | 9.66% |
| Ratios to Average Net AssetsD,E,F | ||
| Expenses before reductions | .48% | .48%G |
| Expenses net of fee waivers, if any | .48% | .48%G |
| Expenses net of all reductions | .48% | .48%G |
| Net investment income (loss) | .73% | 1.31%G |
| Supplemental Data | ||
| Net assets, end of period (000 omitted) | $28,958 | $4,986 |
| Portfolio turnover rateF | 46% | 117%G |
A For the period August 16, 2019 (commencement of operations) to July 31, 2020.
B Calculated based on average shares outstanding during the period.
C Total returns for periods of less than one year are not annualized.
D Fees and expenses of any underlying mutual funds or exchange-traded funds (ETFs) are not included in the Fund's expense ratio. The Fund indirectly bears its proportionate share of these expenses.
E Expense ratios reflect operating expenses of the class. Expenses before reductions do not reflect amounts reimbursed, waived, or reduced through arrangements with the investment adviser, brokerage services, or other offset arrangements, if applicable, and do not represent the amount paid by the class during periods when reimbursements, waivers or reductions occur.
F Amount does not include the portfolio activity of any underlying mutual funds or exchange-traded funds (ETFs).
G Annualized
See accompanying notes which are an integral part of the financial statements.
Fidelity Managed Retirement 2030 Fund Class K
| Years ended July 31, | 2021 | 2020 A |
| Selected Per–Share Data | ||
| Net asset value, beginning of period | $10.78 | $10.00 |
| Income from Investment Operations | ||
| Net investment income (loss)B | .097 | .138 |
| Net realized and unrealized gain (loss) | 1.994 | .832 |
| Total from investment operations | 2.091 | .970 |
| Distributions from net investment income | (.111) | (.150) |
| Distributions from net realized gain | (.230) | (.040) |
| Total distributions | (.341) | (.190) |
| Net asset value, end of period | $12.53 | $10.78 |
| Total ReturnC | 19.69% | 9.77% |
| Ratios to Average Net AssetsD,E,F | ||
| Expenses before reductions | .38% | .38%G |
| Expenses net of fee waivers, if any | .38% | .38%G |
| Expenses net of all reductions | .38% | .38%G |
| Net investment income (loss) | .83% | 1.41%G |
| Supplemental Data | ||
| Net assets, end of period (000 omitted) | $219 | $183 |
| Portfolio turnover rateF | 46% | 117%G |
A For the period August 16, 2019 (commencement of operations) to July 31, 2020.
B Calculated based on average shares outstanding during the period.
C Total returns for periods of less than one year are not annualized.
D Fees and expenses of any underlying mutual funds or exchange-traded funds (ETFs) are not included in the Fund's expense ratio. The Fund indirectly bears its proportionate share of these expenses.
E Expense ratios reflect operating expenses of the class. Expenses before reductions do not reflect amounts reimbursed, waived, or reduced through arrangements with the investment adviser, brokerage services, or other offset arrangements, if applicable, and do not represent the amount paid by the class during periods when reimbursements, waivers or reductions occur.
F Amount does not include the portfolio activity of any underlying mutual funds or exchange-traded funds (ETFs).
G Annualized
See accompanying notes which are an integral part of the financial statements.
Fidelity Managed Retirement 2030 Fund Class K6
| Years ended July 31, | 2021 | 2020 A |
| Selected Per–Share Data | ||
| Net asset value, beginning of period | $10.79 | $10.00 |
| Income from Investment Operations | ||
| Net investment income (loss)B | .111 | .148 |
| Net realized and unrealized gain (loss) | 1.985 | .840 |
| Total from investment operations | 2.096 | .988 |
| Distributions from net investment income | (.126) | (.158) |
| Distributions from net realized gain | (.230) | (.040) |
| Total distributions | (.356) | (.198) |
| Net asset value, end of period | $12.53 | $10.79 |
| Total ReturnC | 19.73% | 9.95% |
| Ratios to Average Net AssetsD,E,F | ||
| Expenses before reductions | .28% | .28%G |
| Expenses net of fee waivers, if any | .28% | .28%G |
| Expenses net of all reductions | .28% | .28%G |
| Net investment income (loss) | .93% | 1.51%G |
| Supplemental Data | ||
| Net assets, end of period (000 omitted) | $1,459 | $183 |
| Portfolio turnover rateF | 46% | 117%G |
A For the period August 16, 2019 (commencement of operations) to July 31, 2020.
B Calculated based on average shares outstanding during the period.
C Total returns for periods of less than one year are not annualized.
D Fees and expenses of any underlying mutual funds or exchange-traded funds (ETFs) are not included in the Fund's expense ratio. The Fund indirectly bears its proportionate share of these expenses.
E Expense ratios reflect operating expenses of the class. Expenses before reductions do not reflect amounts reimbursed, waived, or reduced through arrangements with the investment adviser, brokerage services, or other offset arrangements, if applicable, and do not represent the amount paid by the class during periods when reimbursements, waivers or reductions occur.
F Amount does not include the portfolio activity of any underlying mutual funds or exchange-traded funds (ETFs).
G Annualized
See accompanying notes which are an integral part of the financial statements.
Fidelity Managed Retirement 2030 Fund Class I
| Years ended July 31, | 2021 | 2020 A |
| Selected Per–Share Data | ||
| Net asset value, beginning of period | $10.78 | $10.00 |
| Income from Investment Operations | ||
| Net investment income (loss)B | .086 | .128 |
| Net realized and unrealized gain (loss) | 1.998 | .833 |
| Total from investment operations | 2.084 | .961 |
| Distributions from net investment income | (.104) | (.141) |
| Distributions from net realized gain | (.230) | (.040) |
| Total distributions | (.334) | (.181) |
| Net asset value, end of period | $12.53 | $10.78 |
| Total ReturnC | 19.62% | 9.67% |
| Ratios to Average Net AssetsD,E,F | ||
| Expenses before reductions | .48% | .48%G |
| Expenses net of fee waivers, if any | .48% | .48%G |
| Expenses net of all reductions | .48% | .48%G |
| Net investment income (loss) | .73% | 1.31%G |
| Supplemental Data | ||
| Net assets, end of period (000 omitted) | $421 | $254 |
| Portfolio turnover rateF | 46% | 117%G |
A For the period August 16, 2019 (commencement of operations) to July 31, 2020.
B Calculated based on average shares outstanding during the period.
C Total returns for periods of less than one year are not annualized.
D Fees and expenses of any underlying mutual funds or exchange-traded funds (ETFs) are not included in the Fund's expense ratio. The Fund indirectly bears its proportionate share of these expenses.
E Expense ratios reflect operating expenses of the class. Expenses before reductions do not reflect amounts reimbursed, waived, or reduced through arrangements with the investment adviser, brokerage services, or other offset arrangements, if applicable, and do not represent the amount paid by the class during periods when reimbursements, waivers or reductions occur.
F Amount does not include the portfolio activity of any underlying mutual funds or exchange-traded funds (ETFs).
G Annualized
See accompanying notes which are an integral part of the financial statements.
Fidelity Managed Retirement 2030 Fund Class Z6
| Years ended July 31, | 2021 | 2020 A |
| Selected Per–Share Data | ||
| Net asset value, beginning of period | $10.79 | $10.00 |
| Income from Investment Operations | ||
| Net investment income (loss)B | .109 | .148 |
| Net realized and unrealized gain (loss) | 1.994 | .840 |
| Total from investment operations | 2.103 | .988 |
| Distributions from net investment income | (.123) | (.158) |
| Distributions from net realized gain | (.230) | (.040) |
| Total distributions | (.353) | (.198) |
| Net asset value, end of period | $12.54 | $10.79 |
| Total ReturnC | 19.80% | 9.95% |
| Ratios to Average Net AssetsD,E,F | ||
| Expenses before reductions | .28% | .28%G |
| Expenses net of fee waivers, if any | .28% | .28%G |
| Expenses net of all reductions | .28% | .28%G |
| Net investment income (loss) | .93% | 1.51%G |
| Supplemental Data | ||
| Net assets, end of period (000 omitted) | $220 | $183 |
| Portfolio turnover rateF | 46% | 117%G |
A For the period August 16, 2019 (commencement of operations) to July 31, 2020.
B Calculated based on average shares outstanding during the period.
C Total returns for periods of less than one year are not annualized.
D Fees and expenses of any underlying mutual funds or exchange-traded funds (ETFs) are not included in the Fund's expense ratio. The Fund indirectly bears its proportionate share of these expenses.
E Expense ratios reflect operating expenses of the class. Expenses before reductions do not reflect amounts reimbursed, waived, or reduced through arrangements with the investment adviser, brokerage services, or other offset arrangements, if applicable, and do not represent the amount paid by the class during periods when reimbursements, waivers or reductions occur.
F Amount does not include the portfolio activity of any underlying mutual funds or exchange-traded funds (ETFs).
G Annualized
See accompanying notes which are an integral part of the financial statements.
Notes to Financial Statements
For the period ended July 31, 2021
1. Organization.
Fidelity Managed Retirement Income Fund, Fidelity Managed Retirement 2010 Fund, Fidelity Managed Retirement 2015 Fund, Fidelity Managed Retirement 2020 Fund, Fidelity Managed Retirement 2025 Fund and Fidelity Managed Retirement 2030 Fund (the Funds) are funds of Fidelity Income Fund (the Trust). The Trust is registered under the Investment Company Act of 1940, as amended (the 1940 Act), as an open-end management investment company organized as a Massachusetts business trust. Each Fund is authorized to issue an unlimited number of shares.
Each Fund offers the following classes of shares: Class A, Fidelity Managed Retirement shares, Class K, Class K6, Class I and Class Z6. Each class has equal rights as to assets and voting privileges, except for matters affecting a single class. Class K, Class K6 and Class Z6 of each Fund, with the exception of Fidelity Managed Retirement 2030 Fund, commenced sale of shares on August 1, 2019.
2. Significant Accounting Policies.
Each Fund is an investment company and applies the accounting and reporting guidance of the Financial Accounting Standards Board (FASB) Accounting Standards Codification Topic 946 Financial Services - Investment Companies. The financial statements have been prepared in conformity with accounting principles generally accepted in the United States of America (GAAP), which require management to make certain estimates and assumptions at the date of the financial statements. Actual results could differ from those estimates. Subsequent events, if any, through the date that the financial statements were issued have been evaluated in the preparation of the financial statements. Each Fund's Schedule of Investments lists any underlying mutual funds or exchange-traded funds (ETFs) but does not include the underlying holdings of these funds. The following summarizes the significant accounting policies of each Fund:
Investment Valuation. Investments are valued as of 4:00 p.m. Eastern time on the last calendar day of the period. Each Fund categorizes the inputs to valuation techniques used to value its investments into a disclosure hierarchy consisting of three levels as shown below:
- Level 1 – quoted prices in active markets for identical investments
- Level 2 – other significant observable inputs (including quoted prices for similar investments, interest rates, prepayment speeds, etc.)
- Level 3 – unobservable inputs (including the Fund's own assumptions based on the best information available)
Valuation techniques used to value each Fund's investments by major category are as follows. Investments in open-end mutual funds are valued at their closing net asset value (NAV) each business day and are categorized as Level 1 in the hierarchy. The aggregate value of investments by input level as of July 31, 2021 is included at the end of each Fund's Schedule of Investments.
Investment Transactions and Income. For financial reporting purposes, the Funds' investment holdings and NAV include trades executed through the end of the last business day of the period. The NAV per share for processing shareholder transactions is calculated as of the close of business of the New York Stock Exchange (NYSE), normally 4:00 p.m. Eastern time and includes trades executed through the end of the prior business day. Gains and losses on securities sold are determined on the basis of identified cost. Income and capital gain distributions from any underlying mutual funds or exchange-traded funds (ETFs) are recorded on the ex-dividend date.
Class Allocations and Expenses. Investment income, realized and unrealized capital gains and losses, common expenses of a fund, and certain fund-level expense reductions, if any, are allocated daily on a pro-rata basis to each class based on the relative net assets of each class to the total net assets of a fund. Each class differs with respect to transfer agent and distribution and service plan fees incurred, as applicable. Certain expense reductions may also differ by class, if applicable. For the reporting period, the allocated portion of income and expenses to each class as a percent of its average net assets may vary due to the timing of recording these transactions in relation to fluctuating net assets of the classes. Expenses directly attributable to a fund are charged to that fund. Expenses attributable to more than one fund are allocated among the respective funds on the basis of relative net assets or other appropriate methods. Expenses included in the accompanying financial statements reflect the expenses of that fund and do not include any expenses associated with any underlying mutual funds or exchange-traded funds. Although not included in a fund's expenses, a fund indirectly bears its proportionate share of these expenses through the net asset value of each underlying mutual fund or exchange-traded fund. Expense estimates are accrued in the period to which they relate and adjustments are made when actual amounts are known.
Income Tax Information and Distributions to Shareholders. Each year, each Fund intends to qualify as a regulated investment company under Subchapter M of the Internal Revenue Code, including distributing substantially all of its taxable income and realized gains. As a result, no provision for U.S. Federal income taxes is required. As of July 31, 2021, each Fund did not have any unrecognized tax benefits in the financial statements; nor is each Fund aware of any tax positions for which it is reasonably possible that the total amounts of unrecognized tax benefits will significantly change in the next twelve months. Each Fund files a U.S. federal tax return, in addition to state and local tax returns as required. Each Fund's federal income tax returns are subject to examination by the Internal Revenue Service (IRS) for a period of three fiscal years after they are filed. State and local tax returns may be subject to examination for an additional fiscal year depending on the jurisdiction.
Distributions are declared and recorded on the ex-dividend date. Income and capital gain distributions are declared separately for each class. Income and capital gain distributions are determined in accordance with income tax regulations, which may differ from GAAP. In addition, the Funds claimed a portion of the payment made to redeeming shareholders as a distribution for income tax purposes.
Capital accounts within the financial statements are adjusted for permanent book-tax differences. These adjustments have no impact on net assets or the results of operations. Capital accounts are not adjusted for temporary book-tax differences which will reverse in a subsequent period.
Book-tax differences are primarily due to the short-term gain distributions from the underlying mutual funds or exchange-traded funds (ETFs) and losses deferred due to wash sales.
As of period end, the cost and unrealized appreciation (depreciation) in securities, and derivatives if applicable, for federal income tax purposes were as follows for each Fund:
| Tax cost | Gross unrealized appreciation | Gross unrealized depreciation | Net unrealized appreciation (depreciation) | |
| Fidelity Managed Retirement Income Fund | $20,228,802 | $1,587,532 | (64,799) | $1,522,733 |
| Fidelity Managed Retirement 2010 Fund | 6,918,459 | 801,849 | (11,042) | 790,807 |
| Fidelity Managed Retirement 2015 Fund | 7,962,552 | 982,701 | (22,514) | 960,187 |
| Fidelity Managed Retirement 2020 Fund | 12,042,978 | 1,340,859 | (47,408) | 1,293,451 |
| Fidelity Managed Retirement 2025 Fund | 52,650,962 | 6,909,572 | (192,773) | 6,716,799 |
| Fidelity Managed Retirement 2030 Fund | 29,449,349 | 2,661,859 | (238,850) | 2,423,009 |
The tax-based components of distributable earnings as of period end were as follows for each Fund:
| Undistributed ordinary income | Undistributed long-term capital gain | Net unrealized appreciation (depreciation) on securities and other investments | |
| Fidelity Managed Retirement Income Fund | $8,792 | $150,481 | $1,522,733 |
| Fidelity Managed Retirement 2010 Fund | 9,205 | 175,187 | 790,807 |
| Fidelity Managed Retirement 2015 Fund | 4,495 | 128,076 | 960,187 |
| Fidelity Managed Retirement 2020 Fund | 2,632 | 104,566 | 1,293,451 |
| Fidelity Managed Retirement 2025 Fund | 8,487 | 581,781 | 6,716,799 |
| Fidelity Managed Retirement 2030 Fund | 19,390 | 211,964 | 2,423,009 |
Due to large subscriptions in a prior period, Fidelity Managed Retirement 2030 Fund is subject to an annual limit on its use of some of its unrealized capital losses to offset capital gains in future periods. If those capital losses are realized and the limitation prevents the Fund from using any of those capital losses in a future period, those capital losses will be available to offset capital gains in subsequent periods.
The tax character of distributions paid was as follows:
| July 31, 2021 | |||
| Ordinary Income | Long-term Capital Gains | Total | |
| Fidelity Managed Retirement Income Fund | $258,619 | $121,412 | $380,031 |
| Fidelity Managed Retirement 2010 Fund | 129,803 | 130,382 | 260,185 |
| Fidelity Managed Retirement 2015 Fund | 116,991 | 127,101 | 244,092 |
| Fidelity Managed Retirement 2020 Fund | 138,667 | 163,821 | 302,488 |
| Fidelity Managed Retirement 2025 Fund | 681,952 | 729,551 | 1,411,503 |
| Fidelity Managed Retirement 2030 Fund | 245,571 | 163,325 | 408,896 |
| July 31, 2020 | |||
| Ordinary Income | Long-term Capital Gains | Total | |
| Fidelity Managed Retirement Income Fund | $147,702 | $31,840 | $179,542 |
| Fidelity Managed Retirement 2010 Fund | 186,222 | 93,992 | 280,214 |
| Fidelity Managed Retirement 2015 Fund | 113,805 | 63,371 | 177,176 |
| Fidelity Managed Retirement 2020 Fund | 108,340 | 59,913 | 168,253 |
| Fidelity Managed Retirement 2025 Fund | 526,842 | 458,534 | 985,376 |
| Fidelity Managed Retirement 2030 Fund(a) | 45,439 | 4,622 | 50,061 |
(a) For the period August 16, 2019 (commencement of operations) to July 31, 2020.
3. Purchases and Sales of Investments.
Purchases and sales of securities, other than short-term securities and in-kind transactions, as applicable, are noted in the table below.
| Purchases ($) | Sales ($) | |
| Fidelity Managed Retirement Income Fund | 11,071,986 | 5,494,210 |
| Fidelity Managed Retirement 2010 Fund | 3,277,407 | 3,930,529 |
| Fidelity Managed Retirement 2015 Fund | 4,030,488 | 2,537,789 |
| Fidelity Managed Retirement 2020 Fund | 8,559,523 | 3,376,636 |
| Fidelity Managed Retirement 2025 Fund | 34,023,560 | 12,210,464 |
| Fidelity Managed Retirement 2030 Fund | 32,269,400 | 8,825,076 |
4. Fees and Other Transactions with Affiliates.
Management Fee. Fidelity Management & Research Company LLC (the investment adviser) and its affiliates provide the Funds with investment management related services. Under the management contract, each Class of each Fund pays a monthly management fee that is set at an annual rate by referring to each Fund's horizon date indicated by its name, such that the management fee rate applicable to each Class of each Fund is reduced as the fund approaches, and then passes, its horizon date. In addition, the investment adviser pays all ordinary operating expenses of each Fund, except distribution and service plan fees, fees and expenses of the independent Trustees, and certain miscellaneous expenses such as proxy and shareholder meeting expenses.
For the reporting period, the total annual management fee rate for each Fund was as follows:
| Annual % of Class-Level Average Net Assets (Classes A, Retail and I) | Annual % of Class-Level Average Net Assets (Classes K, K6 and Z6) | |
| Fidelity Managed Retirement Income Fund | .45% | .35% |
| Fidelity Managed Retirement 2010 Fund | .46% | .36% |
| Fidelity Managed Retirement 2015 Fund | .47% | .37% |
| Fidelity Managed Retirement 2020 Fund | .47% | .37% |
| Fidelity Managed Retirement 2025 Fund | .48% | .38% |
| Fidelity Managed Retirement 2030 Fund | .48% | .38% |
Under the expense contract, the investment adviser pays class-level expenses for Classes K6 and Z6 of each Fund as necessary so that Classes K6 and Z6 total expenses do not exceed certain amounts of Classes K6 and Z6 average net assets on an annual basis with certain exceptions, as noted in the following table:
| Annual % of Class-Level Average Net Assets (Classes K6 and Z6) | |
| Fidelity Managed Retirement Income Fund | .25% |
| Fidelity Managed Retirement 2010 Fund | .26% |
| Fidelity Managed Retirement 2015 Fund | .27% |
| Fidelity Managed Retirement 2020 Fund | .27% |
| Fidelity Managed Retirement 2025 Fund | .28% |
| Fidelity Managed Retirement 2030 Fund | .28% |
Distribution and Service Plan Fees. In accordance with Rule 12b-1 of the 1940 Act, each Fund has adopted separate Distribution and Service Plans for each class of shares. Certain classes pay Fidelity Distributors Company LLC (FDC), an affiliate of the investment adviser, separate Distribution and Service Fees, each of which is based on an annual percentage of each class' average net assets. In addition, FDC may pay financial intermediaries for selling shares of each Fund and providing shareholder support services. For the period, the Distribution and Service Fee rates, total fees and amounts retained by FDC were as follows:
| Distribution Fee | Service Fee | Total Fees | Retained by FDC | |
| Fidelity Managed Retirement Income Fund | ||||
| Class A | -% | .25% | $1,334 | $– |
| Fidelity Managed Retirement 2010 Fund | ||||
| Class A | -% | .25% | $689 | $68 |
| Fidelity Managed Retirement 2015 Fund | ||||
| Class A | -% | .25% | $3,677 | $68 |
| Fidelity Managed Retirement 2020 Fund | ||||
| Class A | -% | .25% | $1,202 | $81 |
| Fidelity Managed Retirement 2025 Fund | ||||
| Class A | -% | .25% | $3,364 | $147 |
| Fidelity Managed Retirement 2030 Fund | ||||
| Class A | -% | .25% | $1,200 | $467 |
Sales Load. FDC may receive a front-end sales charge of up to 5.75% for selling each Fund's Class A shares, some of which is paid to financial intermediaries for selling shares of the Fund. Depending on the holding period, FDC may receive contingent deferred sales charges levied on Class A redemptions. The deferred sales charge is 1.00% for certain purchases of each Fund's Class A shares.
For the period, sales charge amounts retained by FDC were as follows:
| Retained by FDC | |
| Fidelity Managed Retirement Income Fund | |
| Class A | $989 |
| Fidelity Managed Retirement 2010 Fund | |
| Class A | $16 |
| Fidelity Managed Retirement 2015 Fund | |
| Class A | $15 |
| Fidelity Managed Retirement 2020 Fund | |
| Class A | $1,271 |
| Fidelity Managed Retirement 2025 Fund | |
| Class A | $520 |
| Fidelity Managed Retirement 2030 Fund | |
| Class A | $867 |
Interfund Trades. Funds may purchase from or sell securities to other Fidelity Funds under procedures adopted by the Board. The procedures have been designed to ensure these interfund trades are executed in accordance with Rule 17a-7 of the 1940 Act. Any interfund trades are included within the respective purchases and sales amounts shown in the Purchases and Sales of Investments note.
5. Distributions to Shareholders.
Distributions to shareholders of each class were as follows:
| Year ended July 31, 2021 | Year ended July 31, 2020(a),(b) |
|
| Fidelity Managed Retirement Income Fund | ||
| Distributions to shareholders | ||
| Class A | $10,504 | $5,373 |
| Fidelity Managed Retirement Income | 352,971 | 163,342 |
| Class K | 2,539 | 2,469 |
| Class K6 | 4,955 | 4,286 |
| Class I | 6,410 | 1,500 |
| Class Z6 | 2,652 | 2,572 |
| Total | $380,031 | $179,542 |
| Fidelity Managed Retirement 2010 Fund | ||
| Distributions to shareholders | ||
| Class A | $6,058 | $5,526 |
| Fidelity Managed Retirement 2010 | 234,660 | 261,431 |
| Class K | 3,757 | 3,116 |
| Class K6 | 5,835 | 3,473 |
| Class I | 3,803 | 3,147 |
| Class Z6 | 6,072 | 3,521 |
| Total | $260,185 | $280,214 |
| Fidelity Managed Retirement 2015 Fund | ||
| Distributions to shareholders | ||
| Class A | $45,286 | $16,767 |
| Fidelity Managed Retirement 2015 | 178,124 | 135,472 |
| Class K | 3,729 | 3,257 |
| Class K6 | 3,993 | 3,350 |
| Class I | 9,117 | 8,874 |
| Class Z6 | 3,843 | 9,456 |
| Total | $244,092 | $177,176 |
| Fidelity Managed Retirement 2020 Fund | ||
| Distributions to shareholders | ||
| Class A | $13,776 | $664 |
| Fidelity Managed Retirement 2020 | 255,190 | 151,037 |
| Class K | 4,221 | 3,242 |
| Class K6 | 17,161 | 4,294 |
| Class I | 7,801 | 5,679 |
| Class Z6 | 4,339 | 3,337 |
| Total | $302,488 | $168,253 |
| Fidelity Managed Retirement 2025 Fund | ||
| Distributions to shareholders | ||
| Class A | $35,921 | $27,382 |
| Fidelity Managed Retirement 2025 | 1,324,433 | 909,276 |
| Class K | 4,112 | 3,971 |
| Class K6 | 19,291 | 21,421 |
| Class I | 23,518 | 19,263 |
| Class Z6 | 4,228 | 4,063 |
| Total | $1,411,503 | $985,376 |
| Fidelity Managed Retirement 2030 Fund | ||
| Distributions to shareholders | ||
| Class A | $12,426 | $3,496 |
| Fidelity Managed Retirement 2030 Fund | 365,957 | 33,333 |
| Class K | 5,821 | 3,179 |
| Class K6 | 9,452 | 3,628 |
| Class I | 9,200 | 3,111 |
| Class Z6 | 6,040 | 3,314 |
| Total | $408,896 | $50,061 |
(a) Except for Fidelity Management Retirement 2030 Fund, prior fiscal year distributions for Class K, K6 and Z6 are for the period August 1, 2019 (commencement of sale of shares) to July 31, 2020.
(b) For Fidelity Management Retirement 2030 Fund, prior fiscal year distributions are for the period August 16, 2019 (commencement of operations) to July 31, 2020.
6. Share Transactions.
Share transactions for each class were as follows and may contain in-kind transactions, automatic conversions between classes or exchanges between affiliated funds:
| Shares | Shares | Dollars | Dollars | |
| Year ended July 31, 2021 | Year endedJuly 31, 2020(a),(b) | Year ended July 31, 2021 | Year endedJuly 31, 2020(a),(b) | |
| Fidelity Managed Retirement Income Fund | ||||
| Class A | ||||
| Shares sold | 5,531 | 2,961 | $345,159 | $172,135 |
| Issued in exchange for the shares of Fidelity Managed Retirement 2005 Fund | – | 3,783 | – | 227,013 |
| Reinvestment of distributions | 165 | 90 | 10,227 | 5,242 |
| Shares redeemed | (1,912) | (2,404) | (118,575) | (133,759) |
| Net increase (decrease) | 3,784 | 4,430 | $236,811 | $270,631 |
| Fidelity Managed Retirement Income | ||||
| Shares sold | 146,606 | 95,756 | $9,104,694 | $5,601,494 |
| Issued in exchange for the shares of Fidelity Managed Retirement 2005 Fund | – | 80,057 | – | 4,801,815 |
| Reinvestment of distributions | 5,234 | 2,153 | 323,348 | 125,471 |
| Shares redeemed | (68,177) | (51,814) | (4,216,915) | (2,986,202) |
| Net increase (decrease) | 83,663 | 126,152 | $5,211,127 | $7,542,578 |
| Class K | ||||
| Shares sold | – | 1,730 | $– | $100,006 |
| Issued in exchange for the shares of Fidelity Managed Retirement 2005 Fund | – | 1,773 | – | 106,390 |
| Reinvestment of distributions | 41 | 42 | 2,539 | 2,469 |
| Shares redeemed | – | (1,773) | – | (106,390) |
| Net increase (decrease) | 41 | 1,772 | $2,539 | $102,475 |
| Class K6 | ||||
| Shares sold | 6,670 | 7,492 | $416,363 | $434,829 |
| Issued in exchange for the shares of Fidelity Managed Retirement 2005 Fund | – | 1,825 | – | 109,422 |
| Reinvestment of distributions | 80 | 74 | 4,955 | 4,286 |
| Shares redeemed | (5,454) | (2,210) | (337,537) | (131,868) |
| Net increase (decrease) | 1,296 | 7,181 | $83,781 | $416,669 |
| Class I | ||||
| Shares sold | 7 | – | $439 | $– |
| Issued in exchange for the shares of Fidelity Managed Retirement 2005 Fund | – | 4,654 | – | 279,419 |
| Reinvestment of distributions | 96 | 26 | 5,951 | 1,500 |
| Shares redeemed | (814) | (1,382) | (50,498) | (78,322) |
| Net increase (decrease) | (711) | 3,298 | $(44,108) | $202,597 |
| Class Z6 | ||||
| Shares sold | – | 1,730 | $– | $100,010 |
| Issued in exchange for the shares of Fidelity Managed Retirement 2005 Fund | – | 1,776 | – | 106,492 |
| Reinvestment of distributions | 43 | 44 | 2,652 | 2,572 |
| Shares redeemed | – | (1,776) | – | (106,492) |
| Net increase (decrease) | 43 | 1,774 | $2,652 | $102,582 |
| Fidelity Managed Retirement 2010 Fund | ||||
| Class A | ||||
| Shares sold | 4,134 | 42 | $253,084 | $2,450 |
| Reinvestment of distributions | 101 | 97 | 6,058 | 5,526 |
| Shares redeemed | (1,114) | (527) | (67,611) | (28,489) |
| Net increase (decrease) | 3,121 | (388) | $191,531 | $(20,513) |
| Fidelity Managed Retirement 2010 | ||||
| Shares sold | 14,695 | 16,045 | $892,399 | $915,896 |
| Reinvestment of distributions | 3,616 | 3,708 | 216,594 | 210,481 |
| Shares redeemed | (32,074) | (59,561) | (1,947,586) | (3,354,700) |
| Net increase (decrease) | (13,763) | (39,808) | $(838,593) | $(2,228,323) |
| Class K | ||||
| Shares sold | – | 1,773 | $– | $100,000 |
| Reinvestment of distributions | 63 | 55 | 3,757 | 3,116 |
| Net increase (decrease) | 63 | 1,828 | $3,757 | $103,116 |
| Class K6 | ||||
| Shares sold | 80 | 2,669 | $4,768 | $151,341 |
| Reinvestment of distributions | 97 | 61 | 5,835 | 3,473 |
| Shares redeemed | (118) | (10) | (7,222) | (564) |
| Net increase (decrease) | 59 | 2,720 | $3,381 | $154,250 |
| Class I | ||||
| Shares sold | 10 | 3 | $604 | $183 |
| Reinvestment of distributions | 64 | 55 | 3,803 | 3,146 |
| Shares redeemed | (189) | (96) | (11,548) | (5,396) |
| Net increase (decrease) | (115) | (38) | $(7,141) | $(2,067) |
| Class Z6 | ||||
| Shares sold | – | 2,881 | $– | $163,800 |
| Reinvestment of distributions | 101 | 62 | 6,072 | 3,521 |
| Shares redeemed | (42) | (72) | (2,537) | (4,160) |
| Net increase (decrease) | 59 | 2,871 | $3,535 | $163,161 |
| Fidelity Managed Retirement 2015 Fund | ||||
| Class A | ||||
| Shares sold | 10,536 | 21,213 | $600,791 | $1,098,855 |
| Reinvestment of distributions | 791 | 313 | 45,286 | 16,767 |
| Shares redeemed | (5,631) | (7,675) | (331,345) | (406,811) |
| Net increase (decrease) | 5,696 | 13,851 | $314,732 | $708,811 |
| Fidelity Managed Retirement 2015 | ||||
| Shares sold | 33,610 | 34,327 | $1,960,758 | $1,833,919 |
| Reinvestment of distributions | 2,976 | 2,138 | 170,621 | 114,384 |
| Shares redeemed | (18,195) | (20,581) | (1,047,710) | (1,090,299) |
| Net increase (decrease) | 18,391 | 15,884 | $1,083,669 | $858,004 |
| Class K | ||||
| Shares sold | – | 1,884 | $– | $100,000 |
| Reinvestment of distributions | 65 | 61 | 3,729 | 3,256 |
| Net increase (decrease) | 65 | 1,945 | $3,729 | $103,256 |
| Class K6 | ||||
| Shares sold | 1,293 | 1,950 | $78,016 | $103,563 |
| Reinvestment of distributions | 70 | 63 | 3,993 | 3,350 |
| Shares redeemed | (7) | – | (433) | – |
| Net increase (decrease) | 1,356 | 2,013 | $81,576 | $106,913 |
| Class I | ||||
| Shares sold | – | 939 | $– | $49,440 |
| Reinvestment of distributions | 159 | 166 | 9,117 | 8,874 |
| Shares redeemed | (505) | (1,574) | (29,788) | (84,118) |
| Net increase (decrease) | (346) | (469) | $(20,671) | $(25,804) |
| Class Z6 | ||||
| Shares sold | – | 8,483 | $– | $456,007 |
| Reinvestment of distributions | 67 | 176 | 3,843 | 9,456 |
| Shares redeemed | – | (6,713) | – | (356,110) |
| Net increase (decrease) | 67 | 1,946 | $3,843 | $109,353 |
| Fidelity Managed Retirement 2020 Fund | ||||
| Class A | ||||
| Shares sold | 10,932 | 4,071 | $608,151 | $206,022 |
| Reinvestment of distributions | 245 | 13 | 13,776 | 664 |
| Shares redeemed | (2,731) | (1,579) | (156,774) | (81,863) |
| Net increase (decrease) | 8,446 | 2,505 | $465,153 | $124,823 |
| Fidelity Managed Retirement 2020 | ||||
| Shares sold | 105,228 | 59,096 | $6,094,459 | $3,008,096 |
| Reinvestment of distributions | 4,272 | 2,463 | 239,070 | 127,930 |
| Shares redeemed | (33,324) | (30,282) | (1,902,343) | (1,522,054) |
| Net increase (decrease) | 76,176 | 31,277 | $4,431,186 | $1,613,972 |
| Class K | ||||
| Shares sold | – | 1,950 | $– | $100,000 |
| Reinvestment of distributions | 76 | 62 | 4,221 | 3,242 |
| Net increase (decrease) | 76 | 2,012 | $4,221 | $103,242 |
| Class K6 | ||||
| Shares sold | 5,795 | 7,461 | $337,300 | $394,204 |
| Reinvestment of distributions | 307 | 83 | 17,161 | 4,294 |
| Shares redeemed | (3,175) | – | (184,426) | – |
| Net increase (decrease) | 2,927 | 7,544 | $170,035 | $398,498 |
| Class I | ||||
| Shares sold | 1,981 | 790 | $115,713 | $38,069 |
| Reinvestment of distributions | 138 | 106 | 7,714 | 5,509 |
| Shares redeemed | (727) | (2,618) | (41,695) | (133,829) |
| Net increase (decrease) | 1,392 | (1,722) | $81,732 | $(90,251) |
| Class Z6 | ||||
| Shares sold | – | 1,950 | $– | $100,000 |
| Reinvestment of distributions | 78 | 64 | 4,339 | 3,337 |
| Net increase (decrease) | 78 | 2,014 | $4,339 | $103,337 |
| Fidelity Managed Retirement 2025 Fund | ||||
| Class A | ||||
| Shares sold | 12,431 | 7,638 | $748,050 | $411,467 |
| Reinvestment of distributions | 620 | 513 | 35,921 | 27,382 |
| Shares redeemed | (1,287) | (661) | (76,603) | (35,093) |
| Net increase (decrease) | 11,764 | 7,490 | $707,368 | $403,756 |
| Fidelity Managed Retirement 2025 | ||||
| Shares sold | 475,267 | 303,562 | $28,268,373 | $16,048,520 |
| Reinvestment of distributions | 20,600 | 14,686 | 1,196,779 | 781,612 |
| Shares redeemed | (163,248) | (153,379) | (9,705,135) | (7,832,474) |
| Net increase (decrease) | 332,619 | 164,869 | $19,760,017 | $8,997,658 |
| Class K | ||||
| Shares sold | – | 1,893 | $– | $100,000 |
| Reinvestment of distributions | 71 | 75 | 4,112 | 3,971 |
| Net increase (decrease) | 71 | 1,968 | $4,112 | $103,971 |
| Class K6 | ||||
| Shares sold | 16,719 | 26,559 | $1,008,250 | $1,442,572 |
| Reinvestment of distributions | 331 | 399 | 19,291 | 21,421 |
| Shares redeemed | (3,013) | (19,486) | (180,096) | (1,068,818) |
| Net increase (decrease) | 14,037 | 7,472 | $847,445 | $395,175 |
| Class I | ||||
| Shares sold | 3,488 | 2,091 | $197,214 | $109,870 |
| Reinvestment of distributions | 404 | 342 | 23,518 | 18,184 |
| Shares redeemed | (736) | (6,216) | (44,267) | (334,404) |
| Net increase (decrease) | 3,156 | (3,783) | $176,465 | $(206,350) |
| Class Z6 | ||||
| Shares sold | – | 1,891 | $– | $100,000 |
| Reinvestment of distributions | 73 | 76 | 4,228 | 4,062 |
| Net increase (decrease) | 73 | 1,967 | $4,228 | $104,062 |
| Fidelity Managed Retirement 2030 Fund | ||||
| Class A | ||||
| Shares sold | 24,166 | 27,514 | $283,537 | $273,875 |
| Reinvestment of distributions | 1,075 | 333 | 12,426 | 3,496 |
| Shares redeemed | (5,477) | – | (66,712) | – |
| Net increase (decrease) | 19,764 | 27,847 | $229,251 | $277,371 |
| Fidelity Managed Retirement 2030 Fund | ||||
| Shares sold | 2,217,200 | 689,665 | $26,118,167 | $7,123,467 |
| Reinvestment of distributions | 30,435 | 3,188 | 351,921 | 33,308 |
| Shares redeemed | (396,523) | (230,074) | (4,697,849) | (2,289,429) |
| Net increase (decrease) | 1,851,112 | 462,779 | $21,772,239 | $4,867,346 |
| Class K | ||||
| Shares sold | – | 16,666 | $– | $166,660 |
| Reinvestment of distributions | 504 | 304 | 5,821 | 3,179 |
| Net increase (decrease) | 504 | 16,970 | $5,821 | $169,839 |
| Class K6 | ||||
| Shares sold | 307,312 | 18,661 | $3,681,147 | $186,852 |
| Reinvestment of distributions | 804 | 347 | 9,452 | 3,628 |
| Shares redeemed | (208,701) | (2,006) | (2,560,623) | (18,404) |
| Net increase (decrease) | 99,415 | 17,002 | $1,129,976 | $172,076 |
| Class I | ||||
| Shares sold | 12,748 | 23,316 | $153,079 | $233,650 |
| Reinvestment of distributions | 796 | 298 | 9,200 | 3,111 |
| Shares redeemed | (3,500) | (50) | (42,070) | (489) |
| Net increase (decrease) | 10,044 | 23,564 | $120,209 | $236,272 |
| Class Z6 | ||||
| Shares sold | 26 | 16,666 | $300 | $166,660 |
| Reinvestment of distributions | 523 | 317 | 6,040 | 3,314 |
| Net increase (decrease) | 549 | 16,983 | $6,340 | $169,974 |
(a) Except for Fidelity Management Retirement 2030 Fund, prior fiscal year share transactions for Class K, K6 and Z6 are for the period August 1, 2019 (commencement of sale of shares) to July 31, 2020.
(b) For Fidelity Management Retirement 2030 Fund, prior fiscal year share transactions are for the period August 16, 2019 (commencement of operations) to July 31, 2020.
7. Other.
Fund's organizational documents provide former and current trustees and officers with a limited indemnification against liabilities arising in connection with the performance of their duties to the fund. In the normal course of business, the fund may also enter into contracts that provide general indemnifications. The fund's maximum exposure under these arrangements is unknown as this would be dependent on future claims that may be made against the fund. The risk of material loss from such claims is considered remote.
8. Coronavirus (COVID-19) Pandemic.
An outbreak of COVID-19 first detected in China during December 2019 has since spread globally and was declared a pandemic by the World Health Organization during March 2020. Developments that disrupt global economies and financial markets, such as the COVID-19 pandemic, may magnify factors that affect the Funds' performance.
9. Prior Fiscal Year Merger Information.
On July 17, 2020, Fidelity Managed Retirement Income Fund acquired all of the assets and assumed all of the liabilities of Fidelity Managed Retirement 2005 Fund ("Target Fund") pursuant to an Agreement and Plan of Reorganization approved by the Board of Trustees ("The Board"). The acquisition was accomplished by an exchange of each class of Fidelity Managed Retirement Income Fund for corresponding shares then outstanding of the Target Fund at its respective net asset value on the acquisition date. The reorganization provides shareholders of the Target Fund access to a larger portfolio with a similar investment objective and lower expenses. The reorganization qualified as a tax-free reorganization for federal income tax purposes with no gain or loss recognized to the funds or their shareholders. The Target Fund's net assets of $5,630,551, including securities of $5,628,854 and unrealized appreciation of $318,951, was combined with the Fidelity Managed Retirement Income Fund net assets of $9,657,715 for total net assets after the acquisition of $15,288,266.
Pro forma results of operations of the combined entity for the entire period ended July 31, 2020, as though the acquisition had occurred as of the beginning of the year (rather than on the actual acquisition date), are as follows:
| Net investment income (loss) | $205,237 |
| Total net realized gain (loss) | 100,256 |
| Total change in net unrealized appreciation (depreciation) | 632,033 |
| Net increase (decrease) in net assets resulting from operations | $937,526 |
Because the combined investment portfolios have been managed as a single portfolio since the acquisition was completed, it is not practicable to separate the amounts of revenue and earnings of the acquired fund that has been included in Fidelity Managed Retirement Income Fund Statement of Operations since July 17, 2020.
Report of Independent Registered Public Accounting Firm
To the Board of Trustees of Fidelity Income Fund and the Shareholders of Fidelity Managed Retirement Income Fund, Fidelity Managed Retirement 2010 Fund, Fidelity Managed Retirement 2015 Fund, Fidelity Managed Retirement 2020 Fund, Fidelity Managed Retirement 2025 Fund and Fidelity Managed Retirement 2030 Fund
Opinion on the Financial Statements and Financial Highlights
We have audited the accompanying statements of assets and liabilities of Fidelity Managed Retirement Income Fund, Fidelity Managed Retirement 2010 Fund, Fidelity Managed Retirement 2015 Fund, Fidelity Managed Retirement 2020 Fund, Fidelity Managed Retirement 2025 Fund and Fidelity Managed Retirement 2030 Fund (the "Funds"), each a fund of Fidelity Income Fund, including the schedules of investments, as of July 31, 2021, the related statements of operations for the year then ended, the statements of changes in net assets for each of the two years in the period then ended, the financial highlights for each of the five years in the period then ended, except for the statement of changes in net assets, and the financial highlights for the Fidelity Managed Retirement 2030 Fund, which are for the year ended July 31, 2021, and for the period from August 16, 2019 (commencement of operations) through July 31, 2020; and the related notes. In our opinion, the financial statements and financial highlights present fairly, in all material respects, the financial position of the Funds as of July 31, 2021, and the results of their operations for the year then ended, the changes in their net assets for each of the two years in the period then ended, and the financial highlights for each of the five years in the period then ended (or for the period mentioned above), in conformity with accounting principles generally accepted in the United States of America.
Basis for Opinion
These financial statements and financial highlights are the responsibility of the Funds’ management. Our responsibility is to express an opinion on the Funds’ financial statements and financial highlights based on our audits. We are a public accounting firm registered with the Public Company Accounting Oversight Board (United States) (PCAOB) and are required to be independent with respect to the Funds in accordance with the U.S. federal securities laws and the applicable rules and regulations of the Securities and Exchange Commission and the PCAOB.
We conducted our audits in accordance with the standards of the PCAOB. Those standards require that we plan and perform the audit to obtain reasonable assurance about whether the financial statements and financial highlights are free of material misstatement, whether due to error or fraud. The Funds are not required to have, nor were we engaged to perform, an audit of their internal control over financial reporting. As part of our audits we are required to obtain an understanding of internal control over financial reporting but not for the purpose of expressing an opinion on the effectiveness of the Funds’ internal control over financial reporting. Accordingly, we express no such opinion.
Our audits included performing procedures to assess the risks of material misstatement of the financial statements and financial highlights, whether due to error or fraud, and performing procedures that respond to those risks. Such procedures included examining, on a test basis, evidence regarding the amounts and disclosures in the financial statements and financial highlights. Our audits also included evaluating the accounting principles used and significant estimates made by management, as well as evaluating the overall presentation of the financial statements and financial highlights. Our procedures included confirmation of securities owned as of July 31, 2021, by correspondence with the custodian and brokers; when replies were not received from brokers, we performed other auditing procedures. We believe that our audits provide a reasonable basis for our opinion.
/s/ Deloitte & Touche LLP
Boston, Massachusetts
September 10, 2021
We have served as the auditor of one or more of the Fidelity investment companies since 1999.
Trustees and Officers
The Trustees, Members of the Advisory Board (if any), and officers of the trust and funds, as applicable, are listed below. The Board of Trustees governs each fund and is responsible for protecting the interests of shareholders. The Trustees are experienced executives who meet periodically throughout the year to oversee each fund's activities, review contractual arrangements with companies that provide services to each fund, oversee management of the risks associated with such activities and contractual arrangements, and review each fund's performance. If the interests of a fund and an underlying Fidelity® fund were to diverge, a conflict of interest could arise and affect how the Trustees and Members of the Advisory Board fulfill their fiduciary duties to the affected funds. FMR has structured the funds to avoid these potential conflicts, although there may be situations where a conflict of interest is unavoidable. In such instances, FMR, the Trustees, and Members of the Advisory Board would take reasonable steps to minimize and, if possible, eliminate the conflict. Each of the Trustees oversees 283 funds.
The Trustees hold office without limit in time except that (a) any Trustee may resign; (b) any Trustee may be removed by written instrument, signed by at least two-thirds of the number of Trustees prior to such removal; (c) any Trustee who requests to be retired or who has become incapacitated by illness or injury may be retired by written instrument signed by a majority of the other Trustees; and (d) any Trustee may be removed at any special meeting of shareholders by a two-thirds vote of the outstanding voting securities of the trust. Each Trustee who is not an interested person (as defined in the 1940 Act) of the trust and the funds is referred to herein as an Independent Trustee. Each Independent Trustee shall retire not later than the last day of the calendar year in which his or her 75th birthday occurs. The Independent Trustees may waive this mandatory retirement age policy with respect to individual Trustees. Officers and Advisory Board Members hold office without limit in time, except that any officer or Advisory Board Member may resign or may be removed by a vote of a majority of the Trustees at any regular meeting or any special meeting of the Trustees. Except as indicated, each individual has held the office shown or other offices in the same company for the past five years.
Each fund's Statement of Additional Information (SAI) includes more information about the Trustees. To request a free copy, call Fidelity at 1-800-544-8544 if you’re an individual investing directly with Fidelity, call 1-800-835-5092 if you’re a plan sponsor or participant with Fidelity as your recordkeeper or call 1-877-208-0098 on institutional accounts or if you’re an advisor or invest through one.
Experience, Skills, Attributes, and Qualifications of the Trustees. The Governance and Nominating Committee has adopted a statement of policy that describes the experience, qualifications, attributes, and skills that are necessary and desirable for potential Independent Trustee candidates (Statement of Policy). The Board believes that each Trustee satisfied at the time he or she was initially elected or appointed a Trustee, and continues to satisfy, the standards contemplated by the Statement of Policy. The Governance and Nominating Committee also engages professional search firms to help identify potential Independent Trustee candidates who have the experience, qualifications, attributes, and skills consistent with the Statement of Policy. From time to time, additional criteria based on the composition and skills of the current Independent Trustees, as well as experience or skills that may be appropriate in light of future changes to board composition, business conditions, and regulatory or other developments, have also been considered by the professional search firms and the Governance and Nominating Committee. In addition, the Board takes into account the Trustees' commitment and participation in Board and committee meetings, as well as their leadership of standing and ad hoc committees throughout their tenure.
In determining that a particular Trustee was and continues to be qualified to serve as a Trustee, the Board has considered a variety of criteria, none of which, in isolation, was controlling. The Board believes that, collectively, the Trustees have balanced and diverse experience, qualifications, attributes, and skills, which allow the Board to operate effectively in governing each fund and protecting the interests of shareholders. Information about the specific experience, skills, attributes, and qualifications of each Trustee, which in each case led to the Board's conclusion that the Trustee should serve (or continue to serve) as a trustee of the funds, is provided below.
Board Structure and Oversight Function. Abigail P. Johnson is an interested person and currently serves as Chairman. The Trustees have determined that an interested Chairman is appropriate and benefits shareholders because an interested Chairman has a personal and professional stake in the quality and continuity of services provided to the funds. Independent Trustees exercise their informed business judgment to appoint an individual of their choosing to serve as Chairman, regardless of whether the Trustee happens to be independent or a member of management. The Independent Trustees have determined that they can act independently and effectively without having an Independent Trustee serve as Chairman and that a key structural component for assuring that they are in a position to do so is for the Independent Trustees to constitute a substantial majority for the Board. The Independent Trustees also regularly meet in executive session. Arthur E. Johnson serves as Chairman of the Independent Trustees and as such (i) acts as a liaison between the Independent Trustees and management with respect to matters important to the Independent Trustees and (ii) with management prepares agendas for Board meetings.
Fidelity® funds are overseen by different Boards of Trustees. The funds' Board oversees Fidelity's investment-grade bond, money market, asset allocation and certain equity funds, and other Boards oversee Fidelity's high income and other equity funds. The asset allocation funds may invest in Fidelity® funds that are overseen by such other Boards. The use of separate Boards, each with its own committee structure, allows the Trustees of each group of Fidelity® funds to focus on the unique issues of the funds they oversee, including common research, investment, and operational issues. On occasion, the separate Boards establish joint committees to address issues of overlapping consequences for the Fidelity® funds overseen by each Board.
The Trustees operate using a system of committees to facilitate the timely and efficient consideration of all matters of importance to the Trustees, each fund, and fund shareholders and to facilitate compliance with legal and regulatory requirements and oversight of the funds' activities and associated risks. The Board, acting through its committees, has charged FMR and its affiliates with (i) identifying events or circumstances the occurrence of which could have demonstrably adverse effects on the funds' business and/or reputation; (ii) implementing processes and controls to lessen the possibility that such events or circumstances occur or to mitigate the effects of such events or circumstances if they do occur; and (iii) creating and maintaining a system designed to evaluate continuously business and market conditions in order to facilitate the identification and implementation processes described in (i) and (ii) above. Because the day-to-day operations and activities of the funds are carried out by or through FMR, its affiliates, and other service providers, the funds' exposure to risks is mitigated but not eliminated by the processes overseen by the Trustees. While each of the Board's committees has responsibility for overseeing different aspects of the funds' activities, oversight is exercised primarily through the Operations and Audit Committees. In addition, an ad hoc Board committee of Independent Trustees has worked with FMR to enhance the Board's oversight of investment and financial risks, legal and regulatory risks, technology risks, and operational risks, including the development of additional risk reporting to the Board. Appropriate personnel, including but not limited to the funds' Chief Compliance Officer (CCO), FMR's internal auditor, the independent accountants, the funds' Treasurer and portfolio management personnel, make periodic reports to the Board's committees, as appropriate, including an annual review of Fidelity's risk management program for the Fidelity® funds. The responsibilities of each standing committee, including their oversight responsibilities, are described further under "Standing Committees of the Trustees."
Interested Trustees*:
Correspondence intended for a Trustee who is an interested person may be sent to Fidelity Investments, 245 Summer Street, Boston, Massachusetts 02210.
Name, Year of Birth; Principal Occupations and Other Relevant Experience+
Abigail P. Johnson (1961)
Year of Election or Appointment: 2009
Trustee
Chairman of the Board of Trustees
Ms. Johnson also serves as Trustee of other Fidelity® funds. Ms. Johnson serves as Chairman (2016-present), Chief Executive Officer (2014-present), and Director (2007-present) of FMR LLC (diversified financial services company), President of Fidelity Financial Services (2012-present) and President of Personal, Workplace and Institutional Services (2005-present). Ms. Johnson is Chairman and Director of Fidelity Management & Research Company LLC (investment adviser firm, 2011-present). Previously, Ms. Johnson served as Chairman and Director of FMR Co., Inc. (investment adviser firm, 2011-2019), Vice Chairman (2007-2016) and President (2013-2016) of FMR LLC, President and a Director of Fidelity Management & Research Company (2001-2005), a Trustee of other investment companies advised by Fidelity Management & Research Company, Fidelity Investments Money Management, Inc. (investment adviser firm), and FMR Co., Inc. (2001-2005), Senior Vice President of the Fidelity® funds (2001-2005), and managed a number of Fidelity® funds. Ms. Abigail P. Johnson and Mr. Arthur E. Johnson are not related.
Jennifer Toolin McAuliffe (1959)
Year of Election or Appointment: 2016
Trustee
Ms. McAuliffe also serves as Trustee of other Fidelity® funds and as Trustee of Fidelity Charitable (2020-present). Previously, Ms. McAuliffe served as Co-Head of Fixed Income of Fidelity Investments Limited (now known as FIL Limited (FIL)) (diversified financial services company), Director of Research for FIL’s credit and quantitative teams in London, Hong Kong and Tokyo and Director of Research for taxable and municipal bonds at Fidelity Investments Money Management, Inc. Ms. McAuliffe previously served as a member of the Advisory Board of certain Fidelity® funds (2016). Ms. McAuliffe was previously a lawyer at Ropes & Gray LLP and currently serves as director or trustee of several not-for-profit entities.
* Determined to be an “Interested Trustee” by virtue of, among other things, his or her affiliation with the trust or various entities under common control with FMR.
+ The information includes the Trustee's principal occupation during the last five years and other information relating to the experience, attributes, and skills relevant to the Trustee's qualifications to serve as a Trustee, which led to the conclusion that the Trustee should serve as a Trustee for each fund.
Independent Trustees:
Correspondence intended for an Independent Trustee may be sent to Fidelity Investments, P.O. Box 55235, Boston, Massachusetts 02205-5235.
Name, Year of Birth; Principal Occupations and Other Relevant Experience+
Elizabeth S. Acton (1951)
Year of Election or Appointment: 2013
Trustee
Ms. Acton also serves as Trustee of other Fidelity® funds. Prior to her retirement, Ms. Acton served as Executive Vice President, Finance (2011-2012), Executive Vice President, Chief Financial Officer (2002-2011) and Treasurer (2004-2005) of Comerica Incorporated (financial services). Prior to joining Comerica, Ms. Acton held a variety of positions at Ford Motor Company (1983-2002), including Vice President and Treasurer (2000-2002) and Executive Vice President and Chief Financial Officer of Ford Motor Credit Company (1998-2000). Ms. Acton currently serves as a member of the Board and Audit and Finance Committees of Beazer Homes USA, Inc. (homebuilding, 2012-present). Ms. Acton previously served as a member of the Advisory Board of certain Fidelity® funds (2013-2016).
Ann E. Dunwoody (1953)
Year of Election or Appointment: 2018
Trustee
General Dunwoody also serves as Trustee of other Fidelity® funds. General Dunwoody (United States Army, Retired) was the first woman in U.S. military history to achieve the rank of four-star general and prior to her retirement in 2012 held a variety of positions within the U.S. Army, including Commanding General, U.S. Army Material Command (2008-2012). General Dunwoody currently serves as President of First to Four LLC (leadership and mentoring services, 2012-present), a member of the Board and Nomination and Corporate Governance Committees of Kforce Inc. (professional staffing services, 2016-present) and a member of the Board of Automattic Inc. (software engineering, 2018-present). Previously, General Dunwoody served as a member of the Advisory Board and Nominating and Corporate Governance Committee of L3 Technologies, Inc. (communication, electronic, sensor and aerospace systems, 2013-2019) and a member of the Board and Audit and Sustainability and Corporate Responsibility Committees of Republic Services, Inc. (waste collection, disposal and recycling, 2013-2016). Ms. Dunwoody also serves on several boards for non-profit organizations, including as a member of the Board, Chair of the Nomination and Governance Committee and a member of the Audit Committee of Logistics Management Institute (consulting non-profit, 2012-present), a member of the Council of Trustees for the Association of the United States Army (advocacy non-profit, 2013-present), a member of the Board of Florida Institute of Technology (2015-present) and a member of the Board of ThanksUSA (military family education non-profit, 2014-present). General Dunwoody previously served as a member of the Advisory Board of certain Fidelity® funds (2018).
John Engler (1948)
Year of Election or Appointment: 2014
Trustee
Mr. Engler also serves as Trustee of other Fidelity® funds. Previously, Mr. Engler served as Governor of Michigan (1991-2003), President of the Business Roundtable (2011-2017) and interim President of Michigan State University (2018-2019). Mr. Engler currently serves as a member of the Board of Stride, Inc. (formerly K12 Inc.) (technology-based education company, 2012-present). Previously, Mr. Engler served as a member of the Board of Universal Forest Products (manufacturer and distributor of wood and wood-alternative products, 2003-2019) and Trustee of The Munder Funds (2003-2014). Mr. Engler previously served as a member of the Advisory Board of certain Fidelity® funds (2014-2016).
Robert F. Gartland (1951)
Year of Election or Appointment: 2010
Trustee
Mr. Gartland also serves as Trustee of other Fidelity® funds. Prior to his retirement, Mr. Gartland held a variety of positions at Morgan Stanley (financial services, 1979-2007), including Managing Director (1987-2007) and Chase Manhattan Bank (1975-1978). Mr. Gartland previously served as Chairman and an investor in Gartland & Mellina Group Corp. (consulting, 2009-2019), as a member of the Board of National Securities Clearing Corporation (1993-1996) and as Chairman of TradeWeb (2003-2004).
Arthur E. Johnson (1947)
Year of Election or Appointment: 2008
Trustee
Chairman of the Independent Trustees
Mr. Johnson also serves as Trustee of other Fidelity® funds. Prior to his retirement, Mr. Johnson served as Senior Vice President of Corporate Strategic Development of Lockheed Martin Corporation (defense contractor, 1999-2009). Mr. Johnson currently serves as a member of the Board of Booz Allen Hamilton (management consulting, 2011-present). Mr. Johnson previously served as a member of the Board of Eaton Corporation plc (diversified power management, 2009-2019) and a member of the Board of AGL Resources, Inc. (holding company, 2002-2016). Mr. Johnson previously served as Vice Chairman (2015-2018) of the Independent Trustees of certain Fidelity® funds. Mr. Arthur E. Johnson is not related to Ms. Abigail P. Johnson.
Michael E. Kenneally (1954)
Year of Election or Appointment: 2009
Trustee
Vice Chairman of the Independent Trustees
Mr. Kenneally also serves as Trustee of other Fidelity® funds. Prior to his retirement, Mr. Kenneally served as Chairman and Global Chief Executive Officer of Credit Suisse Asset Management and as Executive Vice President and Chief Investment Officer for Bank of America Corporation, where he was responsible for the bank’s money-management products. Previously at Bank of America, Mr. Kenneally managed the principal investment research functions and also spent more than a decade as portfolio manager for various equity and fixed-income funds and institutional accounts. He began his career as a research analyst in 1983 and was awarded the Chartered Financial Analyst (CFA) designation in 1991.
Marie L. Knowles (1946)
Year of Election or Appointment: 2001
Trustee
Ms. Knowles also serves as Trustee of other Fidelity® funds. Prior to her retirement, Ms. Knowles held several positions at Atlantic Richfield Company (diversified energy), including Executive Vice President and Chief Financial Officer (1996-2000), Senior Vice President (1993-1996) and President of ARCO Transportation Company (pipeline and tanker operations, 1993-1996). Ms. Knowles currently serves as a member of the Board of McKesson Corporation (healthcare service, since 2002), a member of the Board of the Santa Catalina Island Company (real estate, 2009-present), a member of the Investment Company Institute Board of Governors and a member of the Governing Council of the Independent Directors Council (2014-present). Ms. Knowles also serves as a member of the Advisory Board for the School of Engineering of the University of Southern California. Ms. Knowles previously served as Chairman (2015-2018) and Vice Chairman (2012-2015) of the Independent Trustees of certain Fidelity® funds.
Mark A. Murray (1954)
Year of Election or Appointment: 2016
Trustee
Mr. Murray also serves as Trustee of other Fidelity® funds. Previously, Mr. Murray served as Co-Chief Executive Officer (2013-2016), President (2006-2013) and Vice Chairman (2013-2020) of Meijer, Inc. Mr. Murray serves as a member of the Board (2009-present) and Public Policy and Responsibility Committee (2009-present) and Chair of the Nuclear Review Committee (2019-present) of DTE Energy Company (diversified energy company). Mr. Murray previously served as a member of the Board of Spectrum Health (not-for-profit health system, 2015-2019) and as a member of the Board and Audit Committee and Chairman of the Nominating and Corporate Governance Committee of Universal Forest Products, Inc. (manufacturer and distributor of wood and wood-alternative products, 2004-2016). Mr. Murray also serves as a member of the Board of many community and professional organizations. Mr. Murray previously served as a member of the Advisory Board of certain Fidelity® funds (2016).
+ The information includes the Trustee's principal occupation during the last five years and other information relating to the experience, attributes, and skills relevant to the Trustee's qualifications to serve as a Trustee, which led to the conclusion that the Trustee should serve as a Trustee for each fund.
Advisory Board Members and Officers:
Correspondence intended for an officer may be sent to Fidelity Investments, 245 Summer Street, Boston, Massachusetts 02210. Officers appear below in alphabetical order.
Name, Year of Birth; Principal Occupation
Robert W. Helm (1957)
Year of Election or Appointment: 2021
Member of the Advisory Board
Mr. Helm also serves as a Member of the Advisory Board of other Fidelity® funds. Mr. Helm was formerly Deputy Chairman (2003-2020), partner (1991-2020) and an associate (1984-1991) of Dechert LLP (formerly Dechert Price & Rhoads). Mr. Helm currently serves on boards and committees of several not-for-profit organizations.
Craig S. Brown (1977)
Year of Election or Appointment: 2019
Assistant Treasurer
Mr. Brown also serves as an officer of other funds. Mr. Brown serves as Assistant Treasurer of FIMM, LLC (2021-present) and is an employee of Fidelity Investments (2013-present).
John J. Burke III (1964)
Year of Election or Appointment: 2018
Chief Financial Officer
Mr. Burke also serves as Chief Financial Officer of other funds. Mr. Burke serves as Head of Investment Operations for Fidelity Fund and Investment Operations (2018-present) and is an employee of Fidelity Investments (1998-present). Previously Mr. Burke served as head of Asset Management Investment Operations (2012-2018).
David J. Carter (1973)
Year of Election or Appointment: 2020
Assistant Secretary
Mr. Carter also serves as Assistant Secretary of other funds. Mr. Carter serves as Vice President, Associate General Counsel (2010-present) and is an employee of Fidelity Investments (2005-present).
Jonathan Davis (1968)
Year of Election or Appointment: 2010
Assistant Treasurer
Mr. Davis also serves as an officer of other funds. Mr. Davis serves as Assistant Treasurer of FIMM, LLC (2021-present) and FMR Capital, Inc. (2017-present) and is an employee of Fidelity Investments. Previously, Mr. Davis served as Vice President and Associate General Counsel of FMR LLC (diversified financial services company, 2003-2010).
Laura M. Del Prato (1964)
Year of Election or Appointment: 2018
President and Treasurer
Ms. Del Prato also serves as an officer of other funds. Ms. Del Prato serves as Assistant Treasurer of FIMM, LLC (2021-present) and is an employee of Fidelity Investments (2017-present). Previously, Ms. Del Prato served as President and Treasurer of The North Carolina Capital Management Trust: Cash Portfolio and Term Portfolio (2018-2020). Prior to joining Fidelity Investments, Ms. Del Prato served as a Managing Director and Treasurer of the JPMorgan Mutual Funds (2014-2017). Prior to JPMorgan, Ms. Del Prato served as a partner at Cohen Fund Audit Services (accounting firm, 2012-2013) and KPMG LLP (accounting firm, 2004-2012).
Colm A. Hogan (1973)
Year of Election or Appointment: 2016
Assistant Treasurer
Mr. Hogan also serves as an officer of other funds. Mr. Hogan serves as Assistant Treasurer of FIMM, LLC (2021-present) and FMR Capital, Inc. (2017-present) and is an employee of Fidelity Investments (2005-present). Previously, Mr. Hogan served as Deputy Treasurer of certain Fidelity® funds (2016-2020) and Assistant Treasurer of certain Fidelity® funds (2016-2018).
Cynthia Lo Bessette (1969)
Year of Election or Appointment: 2019
Secretary and Chief Legal Officer (CLO)
Ms. Lo Bessette also serves as an officer of other funds. Ms. Lo Bessette serves as CLO, Secretary, and Senior Vice President of Fidelity Management & Research Company LLC (investment adviser firm, 2019-present); and CLO of Fidelity Management & Research (Hong Kong) Limited, FMR Investment Management (UK) Limited, and Fidelity Management & Research (Japan) Limited (investment adviser firms, 2019-present). She is a Senior Vice President and Deputy General Counsel of FMR LLC (diversified financial services company, 2019-present), and is an employee of Fidelity Investments. Previously, Ms. Lo Bessette served as CLO, Secretary, and Senior Vice President of FMR Co., Inc. (investment adviser firm, 2019); Secretary of Fidelity SelectCo, LLC and Fidelity Investments Money Management, Inc. (investment adviser firms, 2019). Prior to joining Fidelity Investments, Ms. Lo Bessette was Executive Vice President, General Counsel (2016-2019) and Senior Vice President, Deputy General Counsel (2015-2016) of OppenheimerFunds (investment management company) and Deputy Chief Legal Officer (2013-2015) of Jennison Associates LLC (investment adviser firm).
Chris Maher (1972)
Year of Election or Appointment: 2013
Assistant Treasurer
Mr. Maher also serves as an officer of other funds. Mr. Maher serves as Assistant Treasurer of FIMM, LLC (2021-present) and FMR Capital, Inc. (2017-present), and is an employee of Fidelity Investments (2008-present). Previously, Mr. Maher served as Assistant Treasurer of certain funds (2013-2020); Vice President of Asset Management Compliance (2013), Vice President of the Program Management Group of FMR (investment adviser firm, 2010-2013), and Vice President of Valuation Oversight (2008-2010).
Kenneth B. Robins (1969)
Year of Election or Appointment: 2020
Chief Compliance Officer
Mr. Robins also serves as an officer of other funds. Mr. Robins serves as Compliance Officer of Fidelity Management & Research Company LLC (investment adviser firm, 2016-present) and is an employee of Fidelity Investments (2004-present). Previously, Mr. Robins served as Compliance Officer of FMR Co., Inc. (investment adviser firm, 2016-2019), as Executive Vice President of Fidelity Investments Money Management, Inc. (investment adviser firm, 2013-2016) and served in other fund officer roles.
Brett Segaloff (1972)
Year of Election or Appointment: 2021
Anti-Money Laundering (AML) Officer
Mr. Segaloff also serves as an AML Officer of other funds and other related entities. He is Director, Anti-Money Laundering (2007-present) of FMR LLC (diversified financial services company) and is an employee of Fidelity Investments (1996-present).
Stacie M. Smith (1974)
Year of Election or Appointment: 2013
Assistant Treasurer
Ms. Smith also serves as an officer of other funds. Ms. Smith serves as Assistant Treasurer of FIMM, LLC (2021-present) and FMR Capital, Inc. (2017-present), is an employee of Fidelity Investments (2009-present), and has served in other fund officer roles. Prior to joining Fidelity Investments, Ms. Smith served as Senior Audit Manager of Ernst & Young LLP (accounting firm, 1996-2009). Previously, Ms. Smith served as Assistant Treasurer (2013-2019) and Deputy Treasurer (2013-2016) of certain Fidelity® funds.
Marc L. Spector (1972)
Year of Election or Appointment: 2016
Deputy Treasurer
Mr. Spector also serves as an officer of other funds. Mr. Spector serves as Assistant Treasurer of FIMM, LLC (2021-present) and FMR Capital, Inc. (2017-present) and is an employee of Fidelity Investments (2016-present). Prior to joining Fidelity Investments, Mr. Spector served as Director at the Siegfried Group (accounting firm, 2013-2016), and prior to Siegfried Group as audit senior manager at Deloitte & Touche LLP (accounting firm, 2005-2013).
Jim Wegmann (1979)
Year of Election or Appointment: 2019
Assistant Treasurer
Mr. Wegmann also serves as an officer of other funds. Mr. Wegmann serves as Assistant Treasurer of FIMM, LLC (2021-present) and is an employee of Fidelity Investments (2011-present).
Vadim Zlotnikov (1962)
Year of Election or Appointment: 2019
Vice President
Mr. Zlotnikov also serves as Vice President of other funds. Mr. Zlotnikov serves as President of FIAM (Fidelity Institutional Asset Management) and is an employee of Fidelity Investments (2018-present). Previously, Mr. Zlotnikov served as President and Chief Investment Officer of Global Asset Allocation (2018-2020). Prior to joining Fidelity Investments, Mr. Zlotnikov served as Co-Head of Multi-Asset Solutions, Chief Market Strategist, and CIO of Systematic Strategies with AllianceBernstein (investment adviser firm, 2002-2018).
Shareholder Expense Example
As a shareholder, you incur two types of costs: (1) transaction costs, which may include sales charges (loads) on purchase payments or redemption proceeds, as applicable and (2) ongoing costs, which generally include management fees, distribution and/or service (12b-1) fees and other Fund expenses. This Example is intended to help you understand your ongoing costs (in dollars) of investing in a fund and to compare these costs with the ongoing costs of investing in other mutual funds.
Actual Expenses
The first line of the accompanying table provides information about actual account values and actual expenses. You may use the information in this line, together with the amount you invested, to estimate the expenses that you paid over the period. Simply divide your account value by $1,000.00 (for example, an $8,600 account value divided by $1,000.00 = 8.6), then multiply the result by the number in the first line for a class/Fund under the heading entitled "Expenses Paid During Period" to estimate the expenses you paid on your account during this period. If any fund is a shareholder of any underlying mutual funds or exchange-traded funds (ETFs) (the Underlying Funds), such fund indirectly bears its proportional share of the expenses of the Underlying Funds in addition to the direct expenses incurred presented in the table. These fees and expenses are not included in the annualized expense ratio used to calculate the expense estimate in the table below.
Hypothetical Example for Comparison Purposes
The second line of the accompanying table provides information about hypothetical account values and hypothetical expenses based on the actual expense ratio and an assumed rate of return of 5% per year before expenses, which is not the actual return. The hypothetical account values and expenses may not be used to estimate the actual ending account balance or expenses you paid for the period. You may use this information to compare the ongoing costs of investing in the Fund and other funds. To do so, compare this 5% hypothetical example with the 5% hypothetical examples that appear in the shareholder reports of the other funds. If any fund is a shareholder of any Underlying Funds, such fund indirectly bears its proportional share of the expenses of the Underlying Funds in addition to the direct expenses as presented in the table. These fees and expenses are not included in the annualized expense ratio used to calculate the expense estimate in the table below.
Please note that the expenses shown in the table are meant to highlight your ongoing costs only and do not reflect any transaction costs. Therefore, the second line of the table is useful in comparing ongoing costs only, and will not help you determine the relative total costs of owning different funds. In addition, if these transactional costs were included, your costs would have been higher.
| Annualized Expense Ratio-A | Beginning Account Value February 1, 2021 | Ending Account Value July 31, 2021 | Expenses Paid During Period-B February 1, 2021 to July 31, 2021 |
|
| Fidelity Managed Retirement Income Fund | ||||
| Class A | .70% | |||
| Actual | $1,000.00 | $1,026.80 | $3.52 | |
| Hypothetical-C | $1,000.00 | $1,021.32 | $3.51 | |
| Fidelity Managed Retirement Income | .45% | |||
| Actual | $1,000.00 | $1,028.10 | $2.26 | |
| Hypothetical-C | $1,000.00 | $1,022.56 | $2.26 | |
| Class K | .35% | |||
| Actual | $1,000.00 | $1,028.70 | $1.76 | |
| Hypothetical-C | $1,000.00 | $1,023.06 | $1.76 | |
| Class K6 | .25% | |||
| Actual | $1,000.00 | $1,029.10 | $1.26 | |
| Hypothetical-C | $1,000.00 | $1,023.55 | $1.25 | |
| Class I | .45% | |||
| Actual | $1,000.00 | $1,028.20 | $2.26 | |
| Hypothetical-C | $1,000.00 | $1,022.56 | $2.26 | |
| Class Z6 | .25% | |||
| Actual | $1,000.00 | $1,029.20 | $1.26 | |
| Hypothetical-C | $1,000.00 | $1,023.55 | $1.25 | |
| Fidelity Managed Retirement 2010 Fund | ||||
| Class A | .71% | |||
| Actual | $1,000.00 | $1,034.90 | $3.58 | |
| Hypothetical-C | $1,000.00 | $1,021.27 | $3.56 | |
| Fidelity Managed Retirement 2010 | .46% | |||
| Actual | $1,000.00 | $1,036.20 | $2.32 | |
| Hypothetical-C | $1,000.00 | $1,022.51 | $2.31 | |
| Class K | .36% | |||
| Actual | $1,000.00 | $1,036.80 | $1.82 | |
| Hypothetical-C | $1,000.00 | $1,023.01 | $1.81 | |
| Class K6 | .26% | |||
| Actual | $1,000.00 | $1,037.20 | $1.31 | |
| Hypothetical-C | $1,000.00 | $1,023.51 | $1.30 | |
| Class I | .46% | |||
| Actual | $1,000.00 | $1,036.20 | $2.32 | |
| Hypothetical-C | $1,000.00 | $1,022.51 | $2.31 | |
| Class Z6 | .26% | |||
| Actual | $1,000.00 | $1,037.30 | $1.31 | |
| Hypothetical-C | $1,000.00 | $1,023.51 | $1.30 | |
| Fidelity Managed Retirement 2015 Fund | ||||
| Class A | .72% | |||
| Actual | $1,000.00 | $1,045.70 | $3.65 | |
| Hypothetical-C | $1,000.00 | $1,021.22 | $3.61 | |
| Fidelity Managed Retirement 2015 | .47% | |||
| Actual | $1,000.00 | $1,047.20 | $2.39 | |
| Hypothetical-C | $1,000.00 | $1,022.46 | $2.36 | |
| Class K | .37% | |||
| Actual | $1,000.00 | $1,047.70 | $1.88 | |
| Hypothetical-C | $1,000.00 | $1,022.96 | $1.86 | |
| Class K6 | .27% | |||
| Actual | $1,000.00 | $1,048.10 | $1.37 | |
| Hypothetical-C | $1,000.00 | $1,023.46 | $1.35 | |
| Class I | .47% | |||
| Actual | $1,000.00 | $1,047.10 | $2.39 | |
| Hypothetical-C | $1,000.00 | $1,022.46 | $2.36 | |
| Class Z6 | .27% | |||
| Actual | $1,000.00 | $1,048.10 | $1.37 | |
| Hypothetical-C | $1,000.00 | $1,023.46 | $1.35 | |
| Fidelity Managed Retirement 2020 Fund | ||||
| Class A | .72% | |||
| Actual | $1,000.00 | $1,056.50 | $3.67 | |
| Hypothetical-C | $1,000.00 | $1,021.22 | $3.61 | |
| Fidelity Managed Retirement 2020 | .47% | |||
| Actual | $1,000.00 | $1,058.00 | $2.40 | |
| Hypothetical-C | $1,000.00 | $1,022.46 | $2.36 | |
| Class K | .37% | |||
| Actual | $1,000.00 | $1,058.30 | $1.89 | |
| Hypothetical-C | $1,000.00 | $1,022.96 | $1.86 | |
| Class K6 | .27% | |||
| Actual | $1,000.00 | $1,058.80 | $1.38 | |
| Hypothetical-C | $1,000.00 | $1,023.46 | $1.35 | |
| Class I | .47% | |||
| Actual | $1,000.00 | $1,057.90 | $2.40 | |
| Hypothetical-C | $1,000.00 | $1,022.46 | $2.36 | |
| Class Z6 | .27% | |||
| Actual | $1,000.00 | $1,058.80 | $1.38 | |
| Hypothetical-C | $1,000.00 | $1,023.46 | $1.35 | |
| Fidelity Managed Retirement 2025 Fund | ||||
| Class A | .73% | |||
| Actual | $1,000.00 | $1,065.50 | $3.74 | |
| Hypothetical-C | $1,000.00 | $1,021.17 | $3.66 | |
| Fidelity Managed Retirement 2025 | .48% | |||
| Actual | $1,000.00 | $1,066.80 | $2.46 | |
| Hypothetical-C | $1,000.00 | $1,022.41 | $2.41 | |
| Class K | .38% | |||
| Actual | $1,000.00 | $1,067.40 | $1.95 | |
| Hypothetical-C | $1,000.00 | $1,022.91 | $1.91 | |
| Class K6 | .28% | |||
| Actual | $1,000.00 | $1,067.90 | $1.44 | |
| Hypothetical-C | $1,000.00 | $1,023.41 | $1.40 | |
| Class I | .48% | |||
| Actual | $1,000.00 | $1,066.70 | $2.46 | |
| Hypothetical-C | $1,000.00 | $1,022.41 | $2.41 | |
| Class Z6 | .28% | |||
| Actual | $1,000.00 | $1,067.80 | $1.44 | |
| Hypothetical-C | $1,000.00 | $1,023.41 | $1.40 | |
| Fidelity Managed Retirement 2030 Fund | ||||
| Class A | .73% | |||
| Actual | $1,000.00 | $1,072.00 | $3.75 | |
| Hypothetical-C | $1,000.00 | $1,021.17 | $3.66 | |
| Fidelity Managed Retirement 2030 Fund | .48% | |||
| Actual | $1,000.00 | $1,073.30 | $2.47 | |
| Hypothetical-C | $1,000.00 | $1,022.41 | $2.41 | |
| Class K | .38% | |||
| Actual | $1,000.00 | $1,073.60 | $1.95 | |
| Hypothetical-C | $1,000.00 | $1,022.91 | $1.91 | |
| Class K6 | .28% | |||
| Actual | $1,000.00 | $1,074.40 | $1.44 | |
| Hypothetical-C | $1,000.00 | $1,023.41 | $1.40 | |
| Class I | .48% | |||
| Actual | $1,000.00 | $1,073.30 | $2.47 | |
| Hypothetical-C | $1,000.00 | $1,022.41 | $2.41 | |
| Class Z6 | .28% | |||
| Actual | $1,000.00 | $1,074.90 | $1.44 | |
| Hypothetical-C | $1,000.00 | $1,023.41 | $1.40 |
A Annualized expense ratio reflects expenses net of applicable fee waivers.
B Expenses are equal to the annualized expense ratio, multiplied by the average account value over the period, multiplied by 181/ 365 (to reflect the one-half year period). The fees and expenses of any Underlying Funds are not included in each annualized expense ratio.
C 5% return per year before expenses
Distributions (Unaudited)
The Board of Trustees of each fund voted to pay to shareholders of record at the opening of business on record date, the following distributions per share derived from capital gains realized from sales of portfolio securities:
| Pay Date | Record Date | Capital Gains | |
| Fidelity Managed Retirement Income Fund | |||
| Class A | 09/13/21 | 09/10/21 | $0.429 |
| Fidelity Managed Retirement Income | 09/13/21 | 09/10/21 | $0.429 |
| Class K | 09/13/21 | 09/10/21 | $0.429 |
| Class K6 | 09/13/21 | 09/10/21 | $0.429 |
| Class I | 09/13/21 | 09/10/21 | $0.429 |
| Class Z6 | 09/13/21 | 09/10/21 | $0.429 |
| Fidelity Managed Retirement 2010 Fund | |||
| Class A | 09/13/21 | 09/10/21 | $1.465 |
| Fidelity Managed Retirement 2010 | 09/13/21 | 09/10/21 | $1.465 |
| Class K | 09/13/21 | 09/10/21 | $1.465 |
| Class K6 | 09/13/21 | 09/10/21 | $1.465 |
| Class I | 09/13/21 | 09/10/21 | $1.465 |
| Class Z6 | 09/13/21 | 09/10/21 | $1.465 |
| Fidelity Managed Retirement 2015 Fund | |||
| Class A | 09/13/21 | 09/10/21 | $0.881 |
| Fidelity Managed Retirement 2015 | 09/13/21 | 09/10/21 | $0.881 |
| Class K | 09/13/21 | 09/10/21 | $0.881 |
| Class K6 | 09/13/21 | 09/10/21 | $0.881 |
| Class I | 09/13/21 | 09/10/21 | $0.881 |
| Class Z6 | 09/13/21 | 09/10/21 | $0.881 |
| Fidelity Managed Retirement 2020 Fund | |||
| Class A | 09/13/21 | 09/10/21 | $0.468 |
| Fidelity Managed Retirement 2020 | 09/13/21 | 09/10/21 | $0.468 |
| Class K | 09/13/21 | 09/10/21 | $0.468 |
| Class K6 | 09/13/21 | 09/10/21 | $0.468 |
| Class I | 09/13/21 | 09/10/21 | $0.468 |
| Class Z6 | 09/13/21 | 09/10/21 | $0.468 |
| Fidelity Managed Retirement 2025 Fund | |||
| Class A | 09/13/21 | 09/10/21 | $0.594 |
| Fidelity Managed Retirement 2025 | 09/13/21 | 09/10/21 | $0.594 |
| Class K | 09/13/21 | 09/10/21 | $0.594 |
| Class K6 | 09/13/21 | 09/10/21 | $0.594 |
| Class I | 09/13/21 | 09/10/21 | $0.594 |
| Class Z6 | 09/13/21 | 09/10/21 | $0.594 |
| Fidelity Managed Retirement 2030 Fund | |||
| Class A | 09/13/21 | 09/10/21 | $0.084 |
| Fidelity Managed Retirement 2030 | 09/13/21 | 09/10/21 | $0.084 |
| Class K | 09/13/21 | 09/10/21 | $0.084 |
| Class K6 | 09/13/21 | 09/10/21 | $0.084 |
| Class I | 09/13/21 | 09/10/21 | $0.084 |
| Class Z6 | 09/13/21 | 09/10/21 | $0.084 |
The funds hereby designate as capital gain dividend the amounts noted below for the taxable year ended July 31, 2021, or, if subsequently determined to be different, the net capital gain of such year.
| Fidelity Managed Retirement Income Fund | $259,905 |
| Fidelity Managed Retirement 2010 Fund | $239,686 |
| Fidelity Managed Retirement 2015 Fund | $199,642 |
| Fidelity Managed Retirement 2020 Fund | $197,944 |
| Fidelity Managed Retirement 2025 Fund | $1,057,015 |
| Fidelity Managed Retirement 2030 Fund | $347,640 |
A percentage of the dividends distributed during the fiscal year for the following funds were derived from interest on U.S. Government securities which is generally exempt from state income tax
| Fidelity Managed Retirement Income Fund | 25.80% |
| Fidelity Managed Retirement 2010 Fund | 21.58% |
| Fidelity Managed Retirement 2015 Fund | 17.93% |
| Fidelity Managed Retirement 2020 Fund | 15.51% |
| Fidelity Managed Retirement 2025 Fund | 13.45% |
| Fidelity Managed Retirement 2030 Fund | 13.25% |
A percentage of the dividends distributed during the fiscal year for the following funds may be taken into account as a dividend for purposes of the maximum rate under section 1(h)(11) of the Internal Revenue Code.
| Class A | Retail Class | Class K | Class K6 | Class I | Class Z6 | |
| Fidelity Managed Retirement Income Fund | ||||||
| August 2020 | 5% | 4% | 4% | 3% | 3% | 3% |
| September 2020 | 59% | 18% | 14% | 12% | 19% | 12% |
| October 2020 | 23% | 18% | 16% | 15% | 18% | 15% |
| November 2020 | 29% | 18% | 16% | 15% | 18% | 14% |
| December 2020 | 18% | 18% | 18% | 18% | 18% | 17% |
| February 2021 | 6% | 3% | 2% | 2% | 3% | 2% |
| March 2021 | 6% | 3% | 2% | 2% | 3% | 2% |
| April 2021 | 5% | 3% | 2% | 2% | 3% | 2% |
| May 2021 | 11% | 3% | 2% | 2% | 3% | 2% |
| June 2021 | 7% | 3% | 2% | 1% | 3% | 2% |
| July 2021 | 5% | 3% | 2% | 2% | 3% | 2% |
| Fidelity Managed Retirement 2010 Fund | ||||||
| August 2020 | 0% | 0% | 0% | 0% | 0% | 0% |
| September 2020 | 31% | 20% | 17% | 15% | 20% | 15% |
| October 2020 | 32% | 23% | 20% | 19% | 23% | 19% |
| November 2020 | 46% | 23% | 19% | 16% | 23% | 16% |
| December 2020 | 24% | 23% | 23% | 22% | 23% | 22% |
| February 2021 | 5% | 5% | 4% | 3% | 5% | 3% |
| March 2021 | 26% | 5% | 3% | 3% | 5% | 3% |
| April 2021 | 80% | 5% | 4% | 3% | 5% | 3% |
| May 2021 | 5% | 5% | 4% | 3% | 5% | 3% |
| June 2021 | 10% | 5% | 3% | 3% | 4% | 2% |
| July 2021 | 30% | 5% | 4% | 3% | 5% | 3% |
| Fidelity Managed Retirement 2015 Fund | ||||||
| August 2020 | 0% | 0% | 0% | 0% | 0% | 0% |
| September 2020 | 28% | 27% | 24% | 21% | 27% | 21% |
| October 2020 | 39% | 30% | 27% | 25% | 31% | 25% |
| November 2020 | 78% | 28% | 21% | 18% | 26% | 18% |
| December 2020 | 32% | 31% | 31% | 30% | 31% | 30% |
| February 2021 | 28% | 5% | 4% | 3% | 5% | 3% |
| March 2021 | – | 6% | 4% | 3% | 6% | 3% |
| April 2021 | 17% | 5% | 4% | 3% | 5% | 3% |
| May 2021 | 78% | 5% | 4% | 3% | 5% | 3% |
| June 2021 | – | 6% | 4% | 3% | 7% | 3% |
| July 2021 | – | 6% | 4% | 3% | 6% | 3% |
| Fidelity Managed Retirement 2020 Fund | ||||||
| August 2020 | – | 0% | 0% | 0% | 0% | 0% |
| September 2020 | 38% | 33% | 29% | 27% | 33% | 27% |
| October 2020 | 31% | 37% | 32% | 29% | 37% | 29% |
| November 2020 | 100% | 37% | 28% | 23% | 40% | 22% |
| December 2020 | 37% | 36% | 35% | 35% | 36% | 35% |
| February 2021 | – | 2% | 2% | 1% | 3% | 1% |
| March 2021 | – | 2% | 2% | 1% | 3% | 1% |
| April 2021 | – | 2% | 2% | 2% | 2% | 2% |
| May 2021 | 2% | 2% | 2% | 1% | 3% | 1% |
| June 2021 | – | 2% | 1% | 1% | 3% | 1% |
| July 2021 | – | 2% | 2% | 1% | 2% | 1% |
| Fidelity Managed Retirement 2025 Fund | ||||||
| August 2020 | 0% | 0% | 0% | 0% | 0% | 0% |
| September 2020 | 52% | 38% | 34% | 30% | 37% | 31% |
| October 2020 | 57% | 40% | 36% | 33% | 40% | 33% |
| November 2020 | – | 41% | 32% | 20% | 41% | 22% |
| December 2020 | 42% | 40% | 40% | 40% | 41% | 40% |
| February 2021 | – | 0% | 0% | 0% | 0% | 0% |
| March 2021 | – | 0% | 0% | 0% | 0% | 0% |
| April 2021 | 0% | 0% | 0% | 0% | 0% | 0% |
| May 2021 | – | 0% | 0% | 0% | 0% | 0% |
| June 2021 | – | 0% | 0% | 0% | 0% | 0% |
| July 2021 | – | 0% | 0% | 0% | 0% | 0% |
| Fidelity Managed Retirement 2030 Fund | ||||||
| August 2020 | – | 0% | 0% | 0% | 0% | 0% |
| September 2020 | 10% | 10% | 10% | 10% | 10% | 10% |
| October 2020 | 59% | 42% | 42% | 37% | 49% | 37% |
| November 2020 | – | 44% | 30% | 22% | 44% | 22% |
| December 2020 | 43% | 42% | 42% | 42% | 42% | 42% |
| February 2021 | – | – | – | 29% | – | 87% |
| March 2021 | – | – | – | 30% | – | 59% |
| April 2021 | – | 35% | 23% | 18% | 35% | 18% |
| May 2021 | – | 35% | 23% | 18% | 35% | 18% |
| June 2021 | – | – | 46% | – | – | 23% |
| July 2021 | – | 37% | 19% | 8% | 19% | 13% |
A percentage of the dividends distributed during the fiscal year for the following funds qualify as a section 199A dividend:
| Class A | Retail Class | Class K | Class K6 | Class I | Class Z6 | |
| Fidelity Managed Retirement Income Fund | ||||||
| August 2020 | 1% | 1% | 1% | 1% | 1% | 1% |
| September 2020 | 3% | 1% | 1% | 1% | 1% | 1% |
| October 2020 | 2% | 1% | 1% | 1% | 1% | 1% |
| November 2020 | 2% | 1% | 1% | 1% | 1% | 1% |
| December 2020 | 1% | 1% | 1% | 1% | 1% | 1% |
| February 2021 | 3% | 1% | 1% | 1% | 1% | 1% |
| March 2021 | 3% | 1% | 1% | 1% | 1% | 1% |
| April 2021 | 2% | 1% | 1% | 1% | 1% | 1% |
| May 2021 | 5% | 1% | 1% | 1% | 1% | 1% |
| June 2021 | 3% | 1% | 1% | 1% | 2% | 1% |
| July 2021 | 2% | 1% | 1% | 1% | 1% | 1% |
| Fidelity Managed Retirement 2010 Fund | ||||||
| August 2020 | 0% | 0% | 0% | 0% | 0% | 0% |
| September 2020 | 2% | 1% | 1% | 1% | 1% | 1% |
| October 2020 | 2% | 1% | 1% | 1% | 1% | 1% |
| November 2020 | 2% | 1% | 1% | 1% | 1% | 1% |
| December 2020 | 1% | 1% | 1% | 1% | 1% | 1% |
| February 2021 | 0% | 0% | 0% | 0% | 0% | 0% |
| March 2021 | 0% | 0% | 0% | 0% | 0% | 0% |
| April 2021 | 0% | 0% | 0% | 0% | 0% | 0% |
| May 2021 | 0% | 0% | 0% | 0% | 0% | 0% |
| June 2021 | 0% | 0% | 0% | 0% | 0% | 0% |
| July 2021 | 0% | 0% | 0% | 0% | 0% | 0% |
| Fidelity Managed Retirement 2015 Fund | ||||||
| August 2020 | 0% | 0% | 0% | 0% | 0% | 0% |
| September 2020 | 2% | 1% | 1% | 1% | 1% | 1% |
| October 2020 | 2% | 2% | 1% | 1% | 2% | 1% |
| November 2020 | 3% | 2% | 1% | 1% | 1% | 1% |
| December 2020 | 2% | 2% | 2% | 2% | 2% | 2% |
| February 2021 | 0% | 0% | 0% | 0% | 0% | 0% |
| March 2021 | – | 0% | 0% | 0% | 0% | 0% |
| April 2021 | 0% | 0% | 0% | 0% | 0% | 0% |
| May 2021 | 0% | 0% | 0% | 0% | 0% | 0% |
| June 2021 | – | 0% | 0% | 0% | 0% | 0% |
| July 2021 | – | 0% | 0% | 0% | 0% | 0% |
| Fidelity Managed Retirement 2020 Fund | ||||||
| August 2020 | – | 0% | 0% | 0% | 0% | 0% |
| September 2020 | 2% | 2% | 2% | 1% | 2% | 1% |
| October 2020 | 2% | 2% | 2% | 2% | 2% | 2% |
| November 2020 | 0% | 2% | 2% | 1% | 2% | 1% |
| December 2020 | 2% | 2% | 2% | 2% | 2% | 2% |
| February 2021 | – | 0% | 0% | 0% | 0% | 0% |
| March 2021 | – | 0% | 0% | 0% | 0% | 0% |
| April 2021 | – | 0% | 0% | 0% | 0% | 0% |
| May 2021 | 0% | 0% | 0% | 0% | 0% | 0% |
| June 2021 | – | 0% | 0% | 0% | 0% | 0% |
| July 2021 | – | 0% | 0% | 0% | 0% | 0% |
| Fidelity Managed Retirement 2025 Fund | ||||||
| August 2020 | 0% | 0% | 0% | 0% | 0% | 0% |
| September 2020 | 2% | 2% | 2% | 2% | 2% | 2% |
| October 2020 | 2% | 2% | 2% | 2% | 2% | 2% |
| November 2020 | – | 2% | 2% | 1% | 2% | 1% |
| December 2020 | 2% | 2% | 2% | 2% | 2% | 2% |
| February 2021 | – | 0% | 0% | 0% | 0% | 0% |
| March 2021 | – | 0% | 0% | 0% | 0% | 0% |
| April 2021 | 0% | 0% | 0% | 0% | 0% | 0% |
| May 2021 | – | 0% | 0% | 0% | 0% | 0% |
| June 2021 | – | 0% | 0% | 0% | 0% | 0% |
| July 2021 | – | 0% | 0% | 0% | 0% | 0% |
| Fidelity Managed Retirement 2030 Fund | ||||||
| August 2020 | – | 0% | 0% | 0% | 0% | 0% |
| September 2020 | 1% | 1% | 1% | 1% | 1% | 1% |
| October 2020 | 3% | 2% | 2% | 2% | 2% | 2% |
| November 2020 | – | 2% | 2% | 1% | 2% | 1% |
| December 2020 | 2% | 2% | 2% | 2% | 2% | 2% |
| February 2021 | – | – | – | 0% | – | 0% |
| March 2021 | – | – | – | 0% | – | 0% |
| April 2021 | – | 0% | 0% | 0% | 0% | 0% |
| May 2021 | – | 0% | 0% | 0% | 0% | 0% |
| June 2021 | – | – | 0% | – | – | 0% |
| July 2021 | – | 0% | 0% | 0% | 0% | 0% |
The funds will notify shareholders in January 2022 of amounts for use in preparing 2021 income tax returns.
Liquidity Risk Management Program
The Securities and Exchange Commission adopted Rule 22e-4 under the Investment Company Act of 1940 (the Liquidity Rule) to promote effective liquidity risk management throughout the open-end investment company industry, thereby reducing the risk that funds will be unable to meet their redemption obligations and mitigating dilution of the interests of fund shareholders.
The Funds have adopted and implemented a liquidity risk management program pursuant to the Liquidity Rule (the Program) effective December 1, 2018. The Program is reasonably designed to assess and manage each Fund’s liquidity risk and to comply with the requirements of the Liquidity Rule. Each Fund’s Board of Trustees (the Board) has designated each Fund’s investment adviser as administrator of the Program. The Fidelity advisers have established a Liquidity Risk Management Committee (the LRM Committee) to manage the Program for each of the Fidelity Funds. The LRM Committee monitors the adequacy and effectiveness of implementation of the Program and on a periodic basis assesses each Fund’s liquidity risk based on a variety of factors including (1) the Fund’s investment strategy, (2) portfolio liquidity and cash flow projections during normal and reasonably foreseeable stressed conditions, (3) shareholder redemptions, (4) borrowings and other funding sources and (5) in the case of exchange-traded funds, certain additional factors including the effect of the Fund’s prices and spreads, market participants, and basket compositions on the overall liquidity of the Fund’s portfolio, as applicable.
In accordance with the Program, each of the Fund’s portfolio investments is classified into one of four liquidity categories described below based on a determination of a reasonable expectation for how long it would take to convert the investment to cash (or sell or dispose of the investment) without significantly changing its market value.
- Highly liquid investments – cash or convertible to cash within three business days or less
- Moderately liquid investments – convertible to cash in three to seven calendar days
- Less liquid investments – can be sold or disposed of, but not settled, within seven calendar days
- Illiquid investments – cannot be sold or disposed of within seven calendar days
Liquidity classification determinations take into account a variety of factors including various market, trading and investment-specific considerations, as well as market depth, and generally utilize analysis from a third-party liquidity metrics service.
The Liquidity Rule places a 15% limit on a fund’s illiquid investments and requires funds that do not primarily hold assets that are highly liquid investments to determine and maintain a minimum percentage of the fund’s net assets to be invested in highly liquid investments (highly liquid investment minimum or HLIM). The Program includes provisions reasonably designed to comply with the 15% limit on illiquid investments and for determining, periodically reviewing and complying with the HLIM requirement as applicable.
At a recent meeting of the Fund’s Board of Trustees, the LRM Committee provided a written report to the Board pertaining to the operation, adequacy, and effectiveness of implementation of the Program for the annual period from December 1, 2019 through November 30, 2020. The report concluded that the Program has been implemented and is operating effectively and is reasonably designed to assess and manage the Fund’s liquidity risk.
![]()
MRI-ANN-0921
1.9881729.104
Fidelity Simplicity RMD Income Fund℠
Fidelity Simplicity RMD 2010 Fund℠
Fidelity Simplicity RMD 2015 Fund℠
Fidelity Simplicity RMD 2020 Fund℠
Fidelity Simplicity RMD 2025 Fund℠
July 31, 2021
Contents
|
Fidelity Simplicity RMD Income Fund℠ | |
|
Fidelity Simplicity RMD 2010 Fund℠ | |
|
Fidelity Simplicity RMD 2015 Fund℠ | |
|
Fidelity Simplicity RMD 2020 Fund℠ | |
|
Fidelity Simplicity RMD 2025 Fund℠ | |
To view a fund's proxy voting guidelines and proxy voting record for the 12-month period ended June 30, visit http://www.fidelity.com/proxyvotingresults or visit the Securities and Exchange Commission's (SEC) web site at http://www.sec.gov.
You may also call 1-800-544-8544 to request a free copy of the proxy voting guidelines.
Standard & Poor's, S&P and S&P 500 are registered service marks of The McGraw-Hill Companies, Inc. and have been licensed for use by Fidelity Distributors Corporation.
Other third-party marks appearing herein are the property of their respective owners.
All other marks appearing herein are registered or unregistered trademarks or service marks of FMR LLC or an affiliated company. © 2021 FMR LLC. All rights reserved.
This report and the financial statements contained herein are submitted for the general information of the shareholders of the Funds. This report is not authorized for distribution to prospective investors in the Funds unless preceded or accompanied by an effective prospectus.
A fund files its complete schedule of portfolio holdings with the SEC for the first and third quarters of each fiscal year on Form N-PORT. Forms N-PORT are available on the SEC’s web site at http://www.sec.gov. A fund's Forms N-PORT may be reviewed and copied at the SEC’s Public Reference Room in Washington, DC. Information regarding the operation of the SEC's Public Reference Room may be obtained by calling 1-800-SEC-0330.
For a complete list of a fund's portfolio holdings, view the most recent holdings listing, semiannual report, or annual report on Fidelity's web site at http://www.fidelity.com, http://www.institutional.fidelity.com, or http://www.401k.com, as applicable.
NOT FDIC INSURED •MAY LOSE VALUE •NO BANK GUARANTEE
Neither the Funds nor Fidelity Distributors Corporation is a bank.
Note to Shareholders:
Early in 2020, the outbreak and spread of a new coronavirus emerged as a public health emergency that had a major influence on financial markets, primarily based on its impact on the global economy and the outlook for corporate earnings. The virus causes a respiratory disease known as COVID-19. On March 11, 2020 the World Health Organization declared the COVID-19 outbreak a pandemic, citing sustained risk of further global spread.
In the weeks following, as the crisis worsened, we witnessed an escalating human tragedy with wide-scale social and economic consequences from coronavirus-containment measures. The outbreak of COVID-19 prompted a number of measures to limit the spread, including travel and border restrictions, quarantines, and restrictions on large gatherings. In turn, these resulted in lower consumer activity, diminished demand for a wide range of products and services, disruption in manufacturing and supply chains, and – given the wide variability in outcomes regarding the outbreak – significant market uncertainty and volatility. Amid the turmoil, global governments and central banks took unprecedented action to help support consumers, businesses, and the broader economies, and to limit disruption to financial systems.
The situation continues to unfold, and the extent and duration of its impact on financial markets and the economy remain highly uncertain. Extreme events such as the coronavirus crisis are “exogenous shocks” that can have significant adverse effects on mutual funds and their investments. Although multiple asset classes may be affected by market disruption, the duration and impact may not be the same for all types of assets.
Fidelity is committed to helping you stay informed amid news about COVID-19 and during increased market volatility, and we’re taking extra steps to be responsive to customer needs. We encourage you to visit our websites, where we offer ongoing updates, commentary, and analysis on the markets and our funds.
Fidelity Simplicity RMD Income Fund℠
Performance: The Bottom Line
Average annual total return reflects the change in the value of an investment, assuming reinvestment of distributions from dividend income and capital gains (the profits earned upon the sale of securities that have grown in value, if any) and assuming a constant rate of performance each year. The hypothetical investment and the average annual total returns do not reflect the deduction of taxes that a shareholder would pay on fund distributions or the redemption of fund shares. During periods of reimbursement by Fidelity, a fund’s total return will be greater than it would be had the reimbursement not occurred. How a fund did yesterday is no guarantee of how it will do tomorrow.
Average Annual Total Returns
| Periods ended July 31, 2021 | Past 1 year | Past 5 years | Past 10 years |
| Fidelity Simplicity RMD Income Fund℠ | 8.26% | 5.85% | 5.88% |
$10,000 Over 10 Years
Let's say hypothetically that $10,000 was invested in Fidelity Simplicity RMD Income Fund℠ on July 31, 2011.
The chart shows how the value of your investment would have changed, and also shows how the Bloomberg U.S. Aggregate Bond Index performed over the same period.

| Period Ending Values | ||
|
| $17,714 | Fidelity Simplicity RMD Income Fund℠ |
|
| $13,897 | Bloomberg U.S. Aggregate Bond Index |
Effective August 24, 2021, all Bloomberg Barclays Indices were re-branded as Bloomberg Indices.
Fidelity Simplicity RMD 2010 Fund℠
Performance: The Bottom Line
Average annual total return reflects the change in the value of an investment, assuming reinvestment of distributions from dividend income and capital gains (the profits earned upon the sale of securities that have grown in value, if any) and assuming a constant rate of performance each year. The hypothetical investment and the average annual total returns do not reflect the deduction of taxes that a shareholder would pay on fund distributions or the redemption of fund shares. During periods of reimbursement by Fidelity, a fund’s total return will be greater than it would be had the reimbursement not occurred. How a fund did yesterday is no guarantee of how it will do tomorrow.
Average Annual Total Returns
| Periods ended July 31, 2021 | Past 1 year | Past 5 years | Past 10 years |
| Fidelity Simplicity RMD 2010 Fund℠ | 10.69% | 7.16% | 6.96% |
$10,000 Over 10 Years
Let's say hypothetically that $10,000 was invested in Fidelity Simplicity RMD 2010 Fund℠ on July 31, 2011.
The chart shows how the value of your investment would have changed, and also shows how the Bloomberg U.S. Aggregate Bond Index performed over the same period.
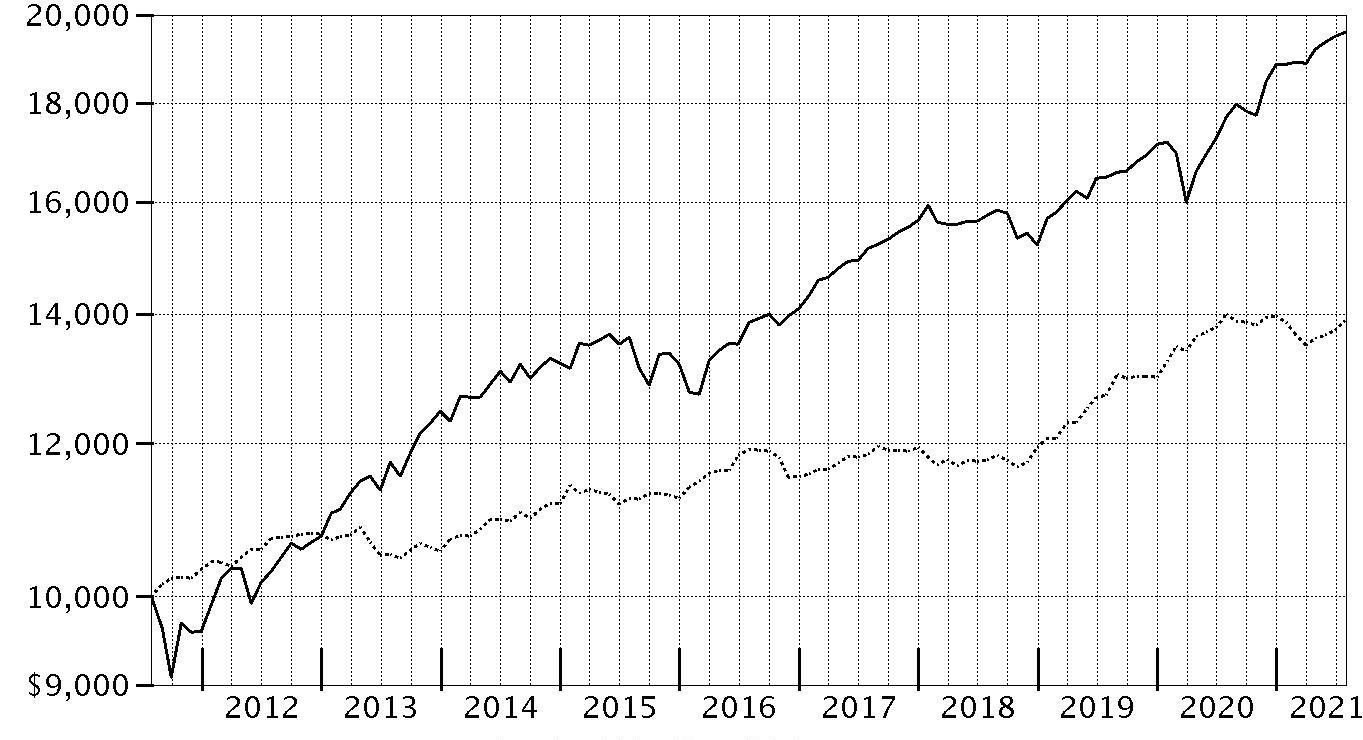
| Period Ending Values | ||
|
| $19,601 | Fidelity Simplicity RMD 2010 Fund℠ |
|
| $13,897 | Bloomberg U.S. Aggregate Bond Index |
Effective August 24, 2021, all Bloomberg Barclays Indices were re-branded as Bloomberg Indices.
Fidelity Simplicity RMD 2015 Fund℠
Performance: The Bottom Line
Average annual total return reflects the change in the value of an investment, assuming reinvestment of distributions from dividend income and capital gains (the profits earned upon the sale of securities that have grown in value, if any) and assuming a constant rate of performance each year. The hypothetical investment and the average annual total returns do not reflect the deduction of taxes that a shareholder would pay on fund distributions or the redemption of fund shares. During periods of reimbursement by Fidelity, a fund’s total return will be greater than it would be had the reimbursement not occurred. How a fund did yesterday is no guarantee of how it will do tomorrow.
Average Annual Total Returns
| Periods ended July 31, 2021 | Past 1 year | Past 5 years | Past 10 years |
| Fidelity Simplicity RMD 2015 Fund℠ | 13.92% | 8.15% | 7.55% |
$10,000 Over 10 Years
Let's say hypothetically that $10,000 was invested in Fidelity Simplicity RMD 2015 Fund℠ on July 31, 2011.
The chart shows how the value of your investment would have changed, and also shows how the Bloomberg U.S. Aggregate Bond Index performed over the same period.
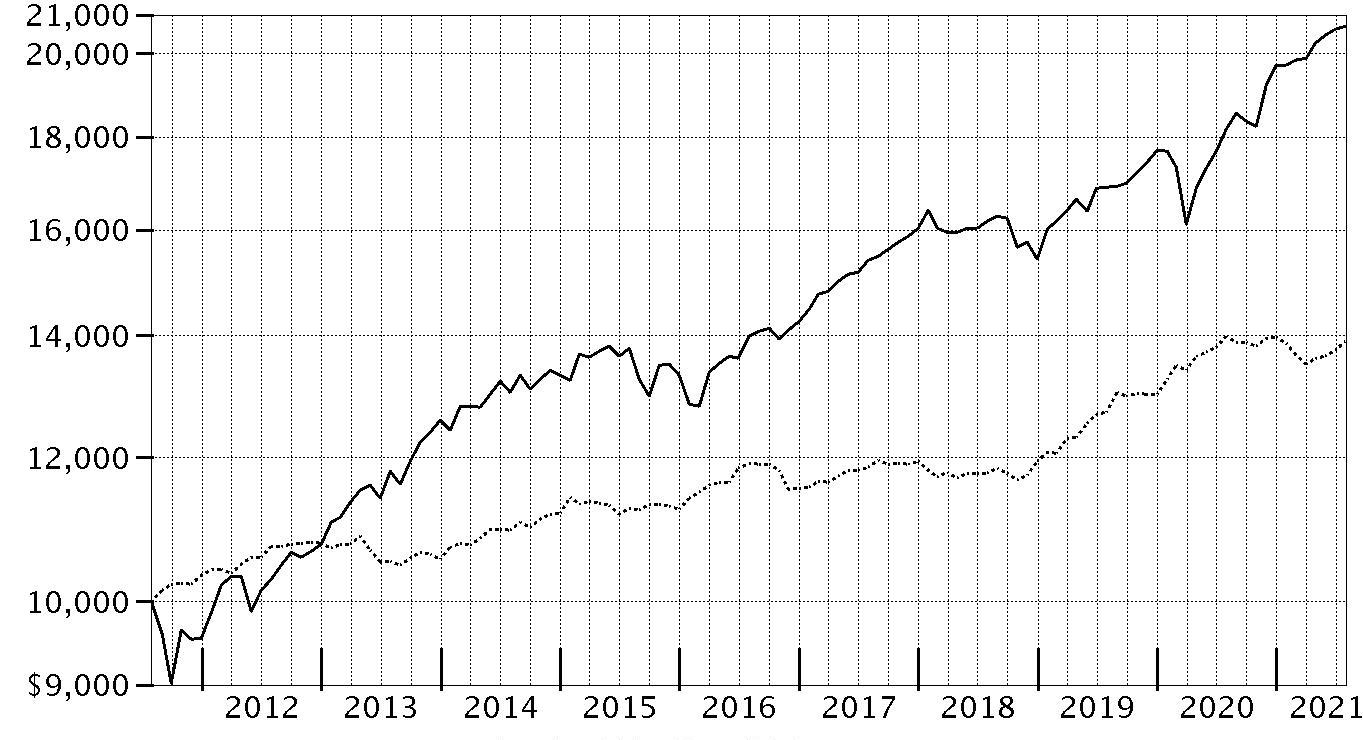
| Period Ending Values | ||
|
| $20,713 | Fidelity Simplicity RMD 2015 Fund℠ |
|
| $13,897 | Bloomberg U.S. Aggregate Bond Index |
Effective August 24, 2021, all Bloomberg Barclays Indices were re-branded as Bloomberg Indices.
Fidelity Simplicity RMD 2020 Fund℠
Performance: The Bottom Line
Average annual total return reflects the change in the value of an investment, assuming reinvestment of distributions from dividend income and capital gains (the profits earned upon the sale of securities that have grown in value, if any) and assuming a constant rate of performance each year. The hypothetical investment and the average annual total returns do not reflect the deduction of taxes that a shareholder would pay on fund distributions or the redemption of fund shares. During periods of reimbursement by Fidelity, a fund’s total return will be greater than it would be had the reimbursement not occurred. How a fund did yesterday is no guarantee of how it will do tomorrow.
Average Annual Total Returns
| For the periods ended July 31, 2021 | Past 1 year | Past 5 years | Past 10 years |
| Fidelity Simplicity RMD 2020 Fund℠ | 17.29% | 9.12% | 8.17% |
$10,000 Over 10 Years
Let's say hypothetically that $10,000 was invested in Fidelity Simplicity RMD 2020 Fund℠ on July 31, 2011.
The chart shows how the value of your investment would have changed, and also shows how the Bloomberg U.S. Aggregate Bond Index performed over the same period.
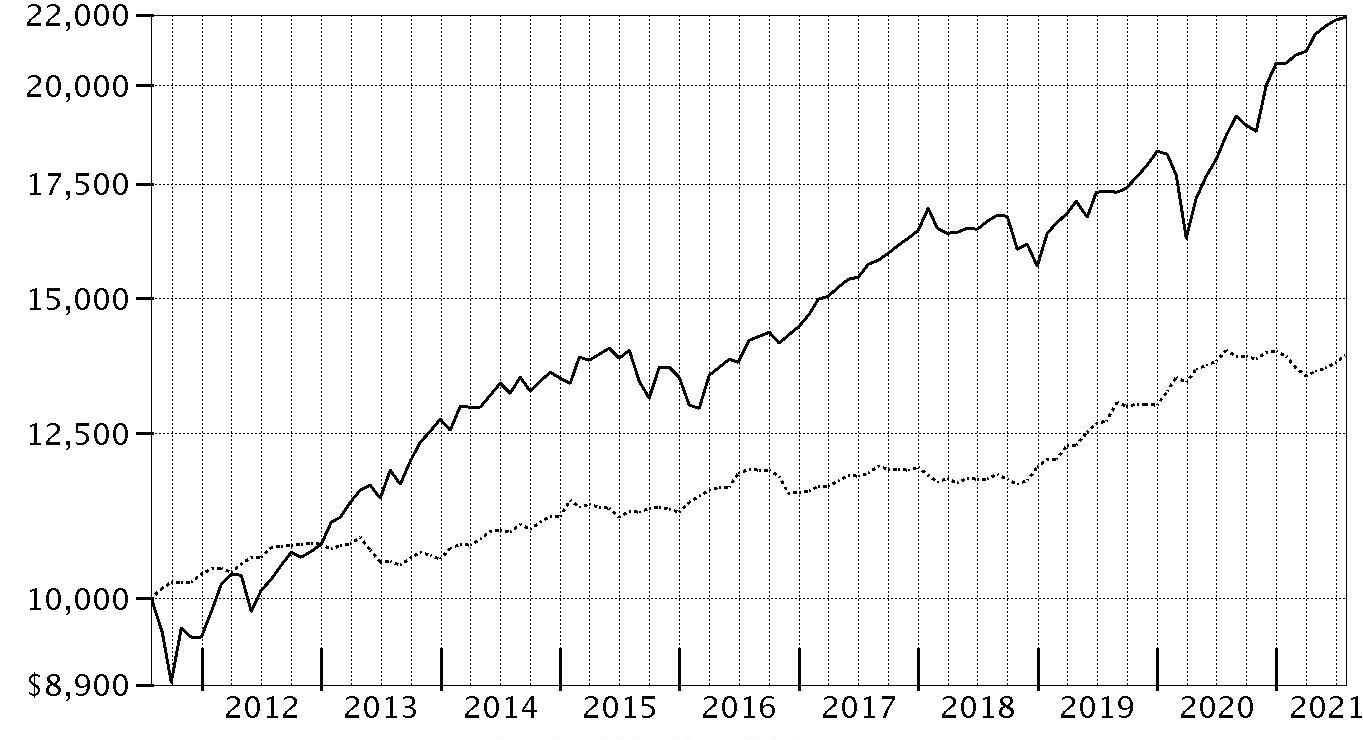
| Period Ending Values | ||
|
| $21,929 | Fidelity Simplicity RMD 2020 Fund℠ |
|
| $13,897 | Bloomberg U.S. Aggregate Bond Index |
Effective August 24, 2021, all Bloomberg Barclays Indices were re-branded as Bloomberg Indices.
Fidelity Simplicity RMD 2025 Fund℠
Performance: The Bottom Line
Average annual total return reflects the change in the value of an investment, assuming reinvestment of distributions from dividend income and capital gains (the profits earned upon the sale of securities that have grown in value, if any) and assuming a constant rate of performance each year. The hypothetical investment and the average annual total returns do not reflect the deduction of taxes that a shareholder would pay on fund distributions or the redemption of fund shares. During periods of reimbursement by Fidelity, a fund’s total return will be greater than it would be had the reimbursement not occurred. How a fund did yesterday is no guarantee of how it will do tomorrow.
Average Annual Total Returns
| For the periods ended July 31, 2021 | Past 1 year | Life of fundA |
| Fidelity Simplicity RMD 2025 Fund℠ | 20.21% | 15.04% |
A From August 16, 2019
$10,000 Over Life of Fund
Let's say hypothetically that $10,000 was invested in Fidelity Simplicity RMD 2025 Fund℠ on August 16, 2019, when the fund started.
The chart shows how the value of your investment would have changed, and also shows how the Bloomberg U.S. Aggregate Bond Index and the S&P 500 Index performed over the same period.
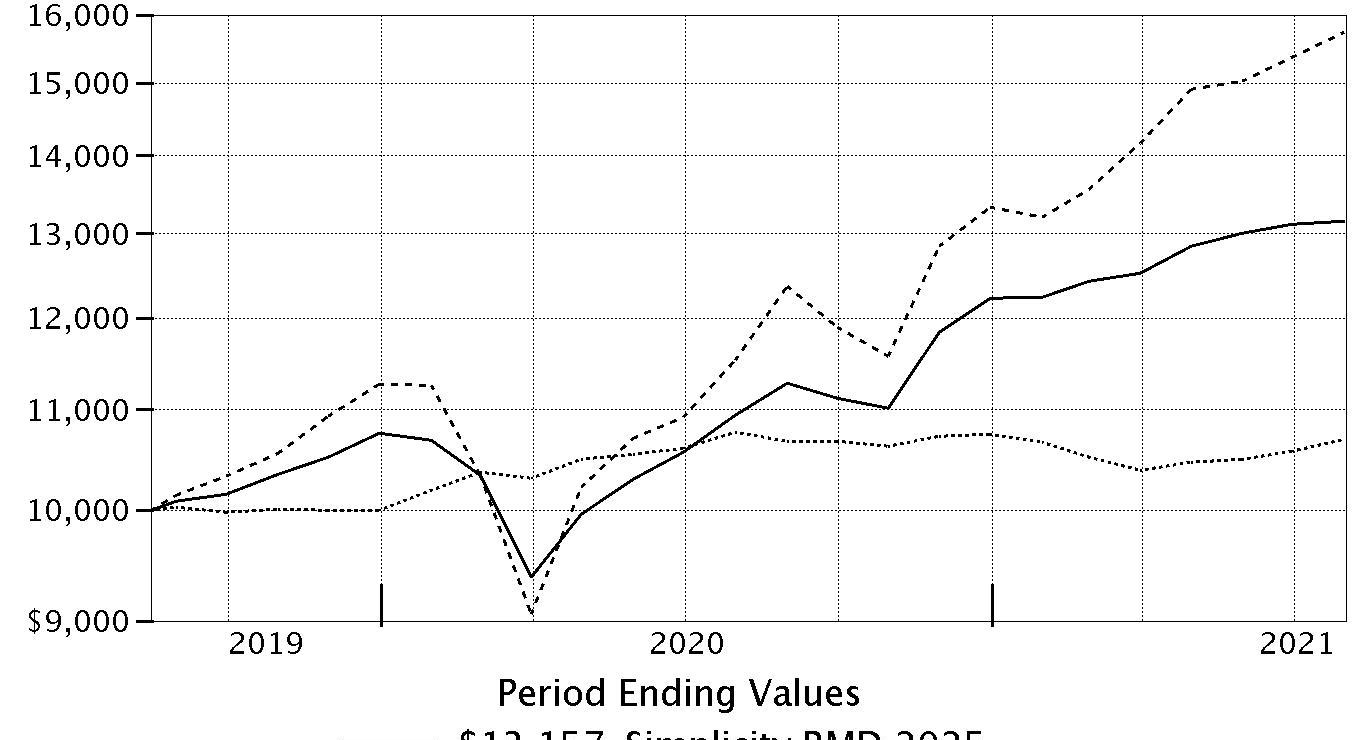
| Period Ending Values | ||
|
| $13,157 | Fidelity Simplicity RMD 2025 Fund℠ |
|
| $10,690 | Bloomberg U.S. Aggregate Bond Index |
|
| $15,736 | S&P 500 Index |
Effective August 1, 2020, the fund's benchmark changed from the S&P 500® Index to the Bloomberg U.S. Aggregate Bond Index.
Effective August 24, 2021, all Bloomberg Barclays Indices were re-branded as Bloomberg Indices.
Management's Discussion of Fund Performance
Market Recap: For the 12 months ending July 31, 2021, global financial markets were influenced by a number of factors, including the broader reopening of local, state, regional and international businesses, an improved outlook for global economic growth, fiscal and monetary stimulus from U.S. and foreign governments, and the widespread distribution of COVID-19 vaccines. This backdrop was highly supportive of global equities, but proved to be a headwind for investment-grade bonds.The MSCI ACWI (All Country World Index) ex USA Index gained 27.96% for the past year, gaining until a modest decline in the final two months amid a spike in COVID-19 cases based on the highly contagious delta variant of the coronavirus. By region, Canada (+38%) led the way, followed by Europe ex U.K. (+34%) and the U.K. (+31%). Conversely, emerging markets (+21%) and Japan (+26%) trailed the broader index, and Asia Pacific ex Japan (+28%) performed about in line. Looking at sectors, materials (+43%), information technology (+41%) and industrials (+39%) fared best. In contrast, notable “laggards” included utilities and communication services (+11% each).The Dow Jones U.S. Total Stock Market Index gained 38.93% the past 12 months. Among sectors, financials (+56%) was the top performer. Energy (+49%), industrials (+47%), materials and communication services (+45% each) also stood out. In contrast, the defensive-oriented utilities (+13%) and consumer staples (+19%) sectors lagged most. Small-cap stocks, as measured by the Russell 2000® Index (+51.97%), handily topped the large-cap-oriented S&P 500® index (+36.45%). From a style standpoint, value stocks outpaced growth among all market capitalizations. Commodities, as measured by the Bloomberg Commodity Index, rose 40.28% for the 12 months.Within fixed income, U.S. taxable investment-grade bonds returned -0.70%, according to the Bloomberg U.S. Aggregate Bond Index. Within the index, corporate bonds rose 1.21%, topping the -3.01% return of U.S. Treasuries. Mortgage-backed securities, meanwhile, gained 0.03%, outpacing Treasuries and the broader taxable bond market. Outside the index, U.S. corporate high-yield bonds (+10.75%), leveraged loans (+10.04%), Treasury Inflation-Protected Securities (+6.90%) and emerging-markets debt (+3.57%) gained. Comments from Co-Portfolio Managers Andrew Dierdorf and Brett Sumsion: For the fiscal year, returns for Fidelity Simplicity RMD Funds℠ ranged from about 8% to 20%, with performance trending higher among the Funds for investors with a longer retirement horizon. Funds for investors with a greater number years to invest in retirement – those with more exposure to equities and lower allocations to fixed-income and short-term securities – fared a bit better than those that invest in a greater percentage of fixed-income and short-term debt, and less equity exposure. Each Fidelity Simplicity RMD Fund outperformed its Composite index, primarily due to outperformance among the underlying investment portfolios. Specifically, an investment in Fidelity® Series Investment Grade Bond Fund gained 1.93% for the 12 months, topping the -0.70% of its benchmark, the Bloomberg U.S. Aggregate Bond Index. The Funds also benefited from strong performance among underlying U.S. equity and non-U.S. equity funds. In the former asset class, Fidelity® Series Intrinsic Opportunities Fund (+53.18%) outpaced the 38.73% advance of its benchmark, the Russell 3000® Index. In non-U.S. equities, Fidelity® Series Emerging Markets Fund (+24.58%) outperformed the 20.66% result of the MSCI Emerging Markets Index. Active asset allocation decisions also provided a boost to the Funds’ relative performance this period. In particular, underweighting investment-grade bonds, a non-Composite allocation to commodities and an overweighting in non-U.S. equities notably contributed to the Funds' relative results. Conversely, underweighting U.S. equities notably detracted.The views expressed above reflect those of the portfolio manager(s) only through the end of the period as stated on the cover of this report and do not necessarily represent the views of Fidelity or any other person in the Fidelity organization. Any such views are subject to change at any time based upon market or other conditions and Fidelity disclaims any responsibility to update such views. These views may not be relied on as investment advice and, because investment decisions for a Fidelity fund are based on numerous factors, may not be relied on as an indication of trading intent on behalf of any Fidelity fund.
Note to Shareholders: In May, the FIAA Board approved Fidelity’s request to modify the glide paths and strategic asset allocations for Fidelity’s target date funds and related composite benchmark changes.Fidelity Simplicity RMD Income Fund℠
Investment Summary (Unaudited)
The information in the following tables is based on the direct investments of the Fund.Top Holdings as of July 31, 2021
| % of fund's net assets | |
| Fidelity Series Investment Grade Bond Fund | 38.7 |
| Fidelity Series Government Money Market Fund 0.07% | 18.5 |
| Fidelity Series Inflation-Protected Bond Index Fund | 12.0 |
| Fidelity Series Emerging Markets Opportunities Fund | 5.4 |
| Fidelity Series Short-Term Credit Fund | 4.3 |
| Fidelity Series Long-Term Treasury Bond Index Fund | 3.0 |
| Fidelity Series Commodity Strategy Fund | 2.7 |
| Fidelity Series Overseas Fund | 1.8 |
| Fidelity Series International Growth Fund | 1.8 |
| Fidelity Series International Value Fund | 1.8 |
| 90.0 |
Asset Allocation (% of fund's net assets)
| Period end | ||
| Domestic Equity Funds | 9.0% | |
| International Equity Funds | 12.6% | |
| Bond Funds | 55.6% | |
| Short-Term Funds | 22.8% | |

Domestic Equity Funds category includes Fidelity Series Commodity Strategy Fund which invests in commodity-related investments.
Fidelity Simplicity RMD Income Fund℠
Schedule of Investments July 31, 2021
Showing Percentage of Net Assets
| Domestic Equity Funds - 9.0% | |||
| Shares | Value | ||
| Fidelity Series All-Sector Equity Fund (a) | 9,107 | $117,753 | |
| Fidelity Series Blue Chip Growth Fund (a) | 9,543 | 184,558 | |
| Fidelity Series Commodity Strategy Fund (a) | 221,246 | 1,250,041 | |
| Fidelity Series Growth Company Fund (a) | 17,631 | 468,461 | |
| Fidelity Series Intrinsic Opportunities Fund (a) | 21,566 | 483,299 | |
| Fidelity Series Large Cap Stock Fund (a) | 21,288 | 420,870 | |
| Fidelity Series Large Cap Value Index Fund (a) | 10,091 | 157,211 | |
| Fidelity Series Opportunistic Insights Fund (a) | 10,496 | 242,767 | |
| Fidelity Series Small Cap Discovery Fund (a) | 3,715 | 52,822 | |
| Fidelity Series Small Cap Opportunities Fund (a) | 9,688 | 175,153 | |
| Fidelity Series Stock Selector Large Cap Value Fund (a) | 23,511 | 358,776 | |
| Fidelity Series Value Discovery Fund (a) | 16,230 | 275,756 | |
| TOTAL DOMESTIC EQUITY FUNDS | |||
| (Cost $3,080,699) | 4,187,467 | ||
| International Equity Funds - 12.6% | |||
| Fidelity Series Canada Fund (a) | 21,711 | 304,600 | |
| Fidelity Series Emerging Markets Fund (a) | 24,242 | 272,236 | |
| Fidelity Series Emerging Markets Opportunities Fund (a) | 99,980 | 2,497,496 | |
| Fidelity Series International Growth Fund (a) | 41,100 | 828,159 | |
| Fidelity Series International Small Cap Fund (a) | 10,976 | 255,291 | |
| Fidelity Series International Value Fund (a) | 73,010 | 821,363 | |
| Fidelity Series Overseas Fund (a) | 58,462 | 830,166 | |
| TOTAL INTERNATIONAL EQUITY FUNDS | |||
| (Cost $4,443,820) | 5,809,311 | ||
| Bond Funds - 55.6% | |||
| Fidelity Series Emerging Markets Debt Fund (a) | 27,119 | 253,021 | |
| Fidelity Series Emerging Markets Debt Local Currency Fund (a) | 7,992 | 82,482 | |
| Fidelity Series Floating Rate High Income Fund (a) | 5,280 | 48,630 | |
| Fidelity Series High Income Fund (a) | 30,416 | 291,691 | |
| Fidelity Series Inflation-Protected Bond Index Fund (a) | 495,005 | 5,558,910 | |
| Fidelity Series International Credit Fund (a) | 1,797 | 18,276 | |
| Fidelity Series Investment Grade Bond Fund (a) | 1,509,290 | 17,869,997 | |
| Fidelity Series Long-Term Treasury Bond Index Fund (a) | 161,252 | 1,396,439 | |
| Fidelity Series Real Estate Income Fund (a) | 14,954 | 176,012 | |
| TOTAL BOND FUNDS | |||
| (Cost $24,257,879) | 25,695,458 | ||
| Short-Term Funds - 22.8% | |||
| Fidelity Series Government Money Market Fund 0.07% (a)(b) | 8,563,212 | 8,563,212 | |
| Fidelity Series Short-Term Credit Fund (a) | 193,373 | 1,968,540 | |
| TOTAL SHORT-TERM FUNDS | |||
| (Cost $10,496,482) | 10,531,752 | ||
| TOTAL INVESTMENT IN SECURITIES - 100.0% | |||
| (Cost $42,278,880) | 46,223,988 | ||
| NET OTHER ASSETS (LIABILITIES) - 0.0% | (636) | ||
| NET ASSETS - 100% | $46,223,352 |
Legend
(a) Affiliated Fund
(b) The rate quoted is the annualized seven-day yield of the fund at period end.
Affiliated Underlying Funds
Fiscal year to date information regarding the Fund's investments in affiliated Underlying Funds is presented below. Exchanges between classes of the same affiliated Underlying Funds may occur. If an underlying Fund changes its name, the name presented below is the name in effect at period end.
| Affiliate | Value, beginning of period | Purchases | Sales Proceeds | Dividend Income | Realized Gain (loss) | Change in Unrealized appreciation (depreciation) | Value, end of period |
| Fidelity Series All-Sector Equity Fund | $102,760 | $62,069 | $74,850 | $13,282 | $4,479 | $23,295 | $117,753 |
| Fidelity Series Blue Chip Growth Fund | 179,516 | 133,758 | 143,431 | 57,470 | 16,912 | (2,197) | 184,558 |
| Fidelity Series Canada Fund | 193,503 | 144,484 | 107,616 | 4,430 | 5,011 | 69,218 | 304,600 |
| Fidelity Series Commodity Strategy Fund | 998,565 | 513,735 | 650,776 | 4,708 | 8,636 | 379,881 | 1,250,041 |
| Fidelity Series Emerging Markets Debt Fund | 265,275 | 87,686 | 104,175 | 11,875 | (5,177) | 9,412 | 253,021 |
| Fidelity Series Emerging Markets Debt Local Currency Fund | -- | 103,410 | 21,740 | 1,193 | (80) | 892 | 82,482 |
| Fidelity Series Emerging Markets Fund | 279,906 | 127,860 | 196,305 | 4,357 | 13,934 | 46,841 | 272,236 |
| Fidelity Series Emerging Markets Opportunities Fund | 2,551,158 | 1,258,346 | 1,859,697 | 83,693 | 181,434 | 366,255 | 2,497,496 |
| Fidelity Series Floating Rate High Income Fund | 54,707 | 18,037 | 27,006 | 2,311 | (685) | 3,577 | 48,630 |
| Fidelity Series Government Money Market Fund 0.07% | 7,738,767 | 3,847,640 | 3,023,195 | 9,712 | -- | -- | 8,563,212 |
| Fidelity Series Growth Company Fund | 411,967 | 348,517 | 359,257 | 111,599 | 31,988 | 35,246 | 468,461 |
| Fidelity Series High Income Fund | 310,576 | 99,326 | 132,081 | 16,443 | (373) | 14,243 | 291,691 |
| Fidelity Series Inflation-Protected Bond Index Fund | 4,786,140 | 1,885,044 | 1,428,035 | 64,152 | 4,940 | 310,821 | 5,558,910 |
| Fidelity Series International Credit Fund | 17,451 | 1,197 | -- | 1,197 | -- | (372) | 18,276 |
| Fidelity Series International Growth Fund | 583,270 | 482,686 | 324,227 | 89,417 | 11,239 | 75,191 | 828,159 |
| Fidelity Series International Small Cap Fund | 172,322 | 97,720 | 81,419 | 1,682 | 4,090 | 62,578 | 255,291 |
| Fidelity Series International Value Fund | 581,476 | 432,787 | 372,275 | 17,480 | 545 | 178,830 | 821,363 |
| Fidelity Series Intrinsic Opportunities Fund | 417,759 | 258,887 | 377,692 | 19,294 | 28,074 | 156,271 | 483,299 |
| Fidelity Series Investment Grade Bond Fund | 15,391,989 | 7,450,808 | 4,336,612 | 965,393 | (33,688) | (602,500) | 17,869,997 |
| Fidelity Series Large Cap Stock Fund | 366,267 | 233,418 | 314,619 | 21,782 | 22,134 | 113,670 | 420,870 |
| Fidelity Series Large Cap Value Index Fund | 128,091 | 81,935 | 100,295 | 3,088 | 6,062 | 41,418 | 157,211 |
| Fidelity Series Long-Term Treasury Bond Index Fund | 922,882 | 1,036,800 | 375,352 | 100,810 | (26,545) | (161,346) | 1,396,439 |
| Fidelity Series Opportunistic Insights Fund | 211,581 | 159,888 | 160,234 | 35,552 | 7,231 | 24,301 | 242,767 |
| Fidelity Series Overseas Fund | 584,417 | 384,219 | 316,658 | 7,145 | 17,843 | 160,345 | 830,166 |
| Fidelity Series Real Estate Income Fund | 166,487 | 60,697 | 81,386 | 8,957 | (1,553) | 31,767 | 176,012 |
| Fidelity Series Short-Term Credit Fund | 1,767,894 | 630,135 | 415,652 | 35,807 | 737 | (14,574) | 1,968,540 |
| Fidelity Series Small Cap Discovery Fund | 45,460 | 24,208 | 34,030 | 6,383 | 2,621 | 14,563 | 52,822 |
| Fidelity Series Small Cap Opportunities Fund | 151,571 | 75,400 | 112,611 | 3,492 | 11,755 | 49,038 | 175,153 |
| Fidelity Series Stock Selector Large Cap Value Fund | 303,844 | 188,820 | 257,489 | 7,530 | 10,156 | 113,445 | 358,776 |
| Fidelity Series Value Discovery Fund | 230,711 | 144,188 | 191,486 | 5,638 | 11,800 | 80,543 | 275,756 |
| Total | $39,916,312 | $20,373,705 | $15,980,201 | $1,715,872 | $333,520 | $1,580,652 | $46,223,988 |
Amounts in the income column in the above table include any capital gain distributions from underlying funds, which are presented in the corresponding line-item in the Statement of Operations, if applicable.
Investment Valuation
The following is a summary of the inputs used, as of July 31, 2021, involving the Fund's assets and liabilities carried at fair value. The inputs or methodology used for valuing securities may not be an indication of the risk associated with investing in those securities. For more information on valuation inputs, and their aggregation into the levels used below, please refer to the Investment Valuation section in the accompanying Notes to Financial Statements.
| Valuation Inputs at Reporting Date: | ||||
| Description | Total | Level 1 | Level 2 | Level 3 |
| Investments in Securities: | ||||
| Domestic Equity Funds | $4,187,467 | $4,187,467 | $-- | $-- |
| International Equity Funds | 5,809,311 | 5,809,311 | -- | -- |
| Bond Funds | 25,695,458 | 25,695,458 | -- | -- |
| Short-Term Funds | 10,531,752 | 10,531,752 | -- | -- |
| Total Investments in Securities: | $46,223,988 | $46,223,988 | $-- | $-- |
See accompanying notes which are an integral part of the financial statements.
Fidelity Simplicity RMD Income Fund℠
Financial Statements
Statement of Assets and Liabilities
| July 31, 2021 | ||
| Assets | ||
| Investment in securities, at value — See accompanying schedule: | ||
| Affiliated issuers (cost $42,278,880) | $46,223,988 | |
| Total Investment in Securities (cost $42,278,880) | $46,223,988 | |
| Cash | 209 | |
| Receivable for investments sold | 223,524 | |
| Receivable for fund shares sold | 2,057 | |
| Total assets | 46,449,778 | |
| Liabilities | ||
| Payable for investments purchased | $207,270 | |
| Payable for fund shares redeemed | 1,449 | |
| Accrued management fee | 17,707 | |
| Total liabilities | 226,426 | |
| Net Assets | $46,223,352 | |
| Net Assets consist of: | ||
| Paid in capital | $41,852,601 | |
| Total accumulated earnings (loss) | 4,370,751 | |
| Net Assets | $46,223,352 | |
| Net Asset Value, offering price and redemption price per share ($46,223,352 ÷ 717,809 shares) | $64.40 |
See accompanying notes which are an integral part of the financial statements.
Statement of Operations
| Year ended July 31, 2021 | ||
| Investment Income | ||
| Dividends: | ||
| Affiliated issuers | $606,364 | |
| Expenses | ||
| Management fee | $203,619 | |
| Independent trustees' fees and expenses | 122 | |
| Total expenses | 203,741 | |
| Net investment income (loss) | 402,623 | |
| Realized and Unrealized Gain (Loss) | ||
| Net realized gain (loss) on: | ||
| Investment securities: | ||
| Affiliated issuers | 333,520 | |
| Capital gain distributions from underlying funds: | ||
| Affiliated issuers | 1,109,508 | |
| Total net realized gain (loss) | 1,443,028 | |
| Change in net unrealized appreciation (depreciation) on: | ||
| Investment securities: | ||
| Affiliated issuers | 1,580,652 | |
| Total change in net unrealized appreciation (depreciation) | 1,580,652 | |
| Net gain (loss) | 3,023,680 | |
| Net increase (decrease) in net assets resulting from operations | $3,426,303 |
See accompanying notes which are an integral part of the financial statements.
Statement of Changes in Net Assets
| Year ended July 31, 2021 | Year ended July 31, 2020 | |
| Increase (Decrease) in Net Assets | ||
| Operations | ||
| Net investment income (loss) | $402,623 | $375,404 |
| Net realized gain (loss) | 1,443,028 | 98,502 |
| Change in net unrealized appreciation (depreciation) | 1,580,652 | 1,161,284 |
| Net increase (decrease) in net assets resulting from operations | 3,426,303 | 1,635,190 |
| Distributions to shareholders | (1,169,928) | (594,132) |
| Share transactions | ||
| Proceeds from sales of shares | 15,818,752 | 7,404,737 |
| Issued in exchange for the shares of Fidelity Simplicity RMD 2005 Fund | -- | 15,422,197 |
| Reinvestment of distributions | 1,069,833 | 519,797 |
| Cost of shares redeemed | (12,829,668) | (5,624,620) |
| Net increase (decrease) in net assets resulting from share transactions | 4,058,917 | 17,722,111 |
| Total increase (decrease) in net assets | 6,315,292 | 18,763,169 |
| Net Assets | ||
| Beginning of period | 39,908,060 | 21,144,891 |
| End of period | $46,223,352 | $39,908,060 |
| Other Information | ||
| Shares | ||
| Sold | 251,018 | 125,402 |
| Issued in exchange for the shares of Fidelity Simplicity RMD 2005 Fund | -- | 254,282 |
| Issued in reinvestment of distributions | 17,107 | 8,825 |
| Redeemed | (203,399) | (96,736) |
| Net increase (decrease) | 64,726 | 291,773 |
See accompanying notes which are an integral part of the financial statements.
Financial Highlights
Fidelity Simplicity RMD Income Fund
| Years ended July 31, | 2021 | 2020 | 2019 | 2018 | 2017 |
| Selected Per–Share Data | |||||
| Net asset value, beginning of period | $61.11 | $58.52 | $57.61 | $61.22 | $58.62 |
| Income from Investment Operations | |||||
| Net investment income (loss)A | .572 | .950 | 1.164 | 1.013 | .923 |
| Net realized and unrealized gain (loss) | 4.418 | 3.181 | 1.632 | .513 | 2.703 |
| Total from investment operations | 4.990 | 4.131 | 2.796 | 1.526 | 3.626 |
| Distributions from net investment income | (.562) | (1.020) | (1.163) | (.986) | (.847) |
| Distributions from net realized gain | (1.138) | (.521) | (.723) | (4.150) | (.179) |
| Total distributions | (1.700) | (1.541) | (1.886) | (5.136) | (1.026) |
| Net asset value, end of period | $64.40 | $61.11 | $58.52 | $57.61 | $61.22 |
| Total ReturnB | 8.26% | 7.19% | 5.03% | 2.61% | 6.27% |
| Ratios to Average Net AssetsC,D | |||||
| Expenses before reductions | .46% | .46% | .46% | .47% | .08% |
| Expenses net of fee waivers, if any | .46% | .46% | .46% | .47% | .08% |
| Expenses net of all reductions | .46% | .46% | .46% | .46% | .08% |
| Net investment income (loss) | .91% | 1.62% | 2.04% | 1.74% | 1.56% |
| Supplemental Data | |||||
| Net assets, end of period (000 omitted) | $46,223 | $39,908 | $21,145 | $13,457 | $9,783 |
| Portfolio turnover rateE | 37% | 42%F | 38% | 46% | 128% |
A Calculated based on average shares outstanding during the period.
B Total returns would have been lower if certain expenses had not been reduced during the applicable periods shown.
C Fees and expenses of any underlying mutual funds or exchange-traded funds (ETFs) are not included in the Fund's expense ratio. The Fund indirectly bears its proportionate share of these expenses.
D Expense ratios reflect operating expenses of the class. Expenses before reductions do not reflect amounts reimbursed, waived, or reduced through arrangements with the investment advisor, brokerage services, or other offset arrangements, if applicable, and do not represent the amount paid by the class during periods when reimbursements, waivers or reductions occur.
E Amount does not include the portfolio activity of any underlying mutual funds or exchange-traded funds (ETFs).
F The portfolio turnover rate does not include the assets acquired in the merger.
See accompanying notes which are an integral part of the financial statements.
Fidelity Simplicity RMD 2010 Fund℠
Investment Summary (Unaudited)
The information in the following tables is based on the direct investments of the Fund.Top Holdings as of July 31, 2021
| % of fund's net assets | |
| Fidelity Series Investment Grade Bond Fund | 36.6 |
| Fidelity Series Government Money Market Fund 0.07% | 16.3 |
| Fidelity Series Inflation-Protected Bond Index Fund | 11.0 |
| Fidelity Series Emerging Markets Opportunities Fund | 6.0 |
| Fidelity Series Short-Term Credit Fund | 3.7 |
| Fidelity Series Long-Term Treasury Bond Index Fund | 3.0 |
| Fidelity Series Commodity Strategy Fund | 2.7 |
| Fidelity Series Overseas Fund | 2.3 |
| Fidelity Series International Growth Fund | 2.2 |
| Fidelity Series International Value Fund | 2.2 |
| 86.0 |
Asset Allocation (% of fund's net assets)
| Period end | ||
| Domestic Equity Funds | 12.6% | |
| International Equity Funds | 14.9% | |
| Bond Funds | 52.5% | |
| Short-Term Funds | 20.0% | |

Domestic Equity Funds category includes Fidelity Series Commodity Strategy Fund which invests in commodity-related investments.
Fidelity Simplicity RMD 2010 Fund℠
Schedule of Investments July 31, 2021
Showing Percentage of Net Assets
| Domestic Equity Funds - 12.6% | |||
| Shares | Value | ||
| Fidelity Series All-Sector Equity Fund (a) | 4,548 | $58,800 | |
| Fidelity Series Blue Chip Growth Fund (a) | 4,765 | 92,155 | |
| Fidelity Series Commodity Strategy Fund (a) | 70,992 | 401,107 | |
| Fidelity Series Growth Company Fund (a) | 8,804 | 233,911 | |
| Fidelity Series Intrinsic Opportunities Fund (a) | 10,769 | 241,327 | |
| Fidelity Series Large Cap Stock Fund (a) | 10,630 | 210,153 | |
| Fidelity Series Large Cap Value Index Fund (a) | 5,039 | 78,511 | |
| Fidelity Series Opportunistic Insights Fund (a) | 5,241 | 121,223 | |
| Fidelity Series Small Cap Discovery Fund (a) | 1,855 | 26,376 | |
| Fidelity Series Small Cap Opportunities Fund (a) | 4,838 | 87,463 | |
| Fidelity Series Stock Selector Large Cap Value Fund (a) | 11,740 | 179,155 | |
| Fidelity Series Value Discovery Fund (a) | 8,105 | 137,702 | |
| TOTAL DOMESTIC EQUITY FUNDS | |||
| (Cost $1,384,987) | 1,867,883 | ||
| International Equity Funds - 14.9% | |||
| Fidelity Series Canada Fund (a) | 8,759 | 122,883 | |
| Fidelity Series Emerging Markets Fund (a) | 8,786 | 98,670 | |
| Fidelity Series Emerging Markets Opportunities Fund (a) | 35,780 | 893,789 | |
| Fidelity Series International Growth Fund (a) | 16,558 | 333,648 | |
| Fidelity Series International Small Cap Fund (a) | 4,418 | 102,766 | |
| Fidelity Series International Value Fund (a) | 29,413 | 330,897 | |
| Fidelity Series Overseas Fund (a) | 23,553 | 334,458 | |
| TOTAL INTERNATIONAL EQUITY FUNDS | |||
| (Cost $1,712,829) | 2,217,111 | ||
| Bond Funds - 52.5% | |||
| Fidelity Series Emerging Markets Debt Fund (a) | 8,716 | 81,323 | |
| Fidelity Series Emerging Markets Debt Local Currency Fund (a) | 2,578 | 26,604 | |
| Fidelity Series Floating Rate High Income Fund (a) | 1,704 | 15,689 | |
| Fidelity Series High Income Fund (a) | 9,762 | 93,614 | |
| Fidelity Series Inflation-Protected Bond Index Fund (a) | 145,070 | 1,629,139 | |
| Fidelity Series International Credit Fund (a) | 389 | 3,954 | |
| Fidelity Series Investment Grade Bond Fund (a) | 458,110 | 5,424,018 | |
| Fidelity Series Long-Term Treasury Bond Index Fund (a) | 51,742 | 448,084 | |
| Fidelity Series Real Estate Income Fund (a) | 4,799 | 56,479 | |
| TOTAL BOND FUNDS | |||
| (Cost $7,375,063) | 7,778,904 | ||
| Short-Term Funds - 20.0% | |||
| Fidelity Series Government Money Market Fund 0.07% (a)(b) | 2,408,196 | 2,408,196 | |
| Fidelity Series Short-Term Credit Fund (a) | 54,402 | 553,816 | |
| TOTAL SHORT-TERM FUNDS | |||
| (Cost $2,953,506) | 2,962,012 | ||
| TOTAL INVESTMENT IN SECURITIES - 100.0% | |||
| (Cost $13,426,385) | 14,825,910 | ||
| NET OTHER ASSETS (LIABILITIES) - 0.0% | (262) | ||
| NET ASSETS - 100% | $14,825,648 |
Legend
(a) Affiliated Fund
(b) The rate quoted is the annualized seven-day yield of the fund at period end.
Affiliated Underlying Funds
Fiscal year to date information regarding the Fund's investments in affiliated Underlying Funds is presented below. Exchanges between classes of the same affiliated Underlying Funds may occur. If an underlying Fund changes its name, the name presented below is the name in effect at period end.
| Affiliate | Value, beginning of period | Purchases | Sales Proceeds | Dividend Income | Realized Gain (loss) | Change in Unrealized appreciation (depreciation) | Value, end of period |
| Fidelity Series All-Sector Equity Fund | $49,369 | $29,125 | $32,999 | $5,955 | $(168) | $13,473 | $58,800 |
| Fidelity Series Blue Chip Growth Fund | 86,241 | 63,309 | 64,423 | 27,327 | 7,186 | (158) | 92,155 |
| Fidelity Series Canada Fund | 75,778 | 56,647 | 38,469 | 1,692 | 1,395 | 27,532 | 122,883 |
| Fidelity Series Commodity Strategy Fund | 277,850 | 179,196 | 171,262 | 1,329 | 667 | 114,656 | 401,107 |
| Fidelity Series Emerging Markets Debt Fund | 72,849 | 29,595 | 22,500 | 3,408 | (1,021) | 2,400 | 81,323 |
| Fidelity Series Emerging Markets Debt Local Currency Fund | -- | 31,218 | 5,032 | 332 | 6 | 412 | 26,604 |
| Fidelity Series Emerging Markets Fund | 88,041 | 48,391 | 56,265 | 1,362 | 2,094 | 16,409 | 98,670 |
| Fidelity Series Emerging Markets Opportunities Fund | 803,191 | 466,510 | 544,134 | 26,040 | 30,434 | 137,788 | 893,789 |
| Fidelity Series Floating Rate High Income Fund | 15,140 | 6,138 | 6,383 | 649 | (121) | 915 | 15,689 |
| Fidelity Series Government Money Market Fund 0.07% | 1,785,497 | 1,227,993 | 605,294 | 2,256 | -- | -- | 2,408,196 |
| Fidelity Series Growth Company Fund | 197,907 | 157,097 | 154,569 | 51,644 | 18,033 | 15,443 | 233,911 |
| Fidelity Series High Income Fund | 82,140 | 34,905 | 27,341 | 4,539 | (120) | 4,030 | 93,614 |
| Fidelity Series Inflation-Protected Bond Index Fund | 1,184,604 | 617,528 | 260,403 | 15,904 | 631 | 86,779 | 1,629,139 |
| Fidelity Series International Credit Fund | 3,776 | 258 | -- | 259 | -- | (80) | 3,954 |
| Fidelity Series International Growth Fund | 228,396 | 192,909 | 123,056 | 34,168 | 4,738 | 30,661 | 333,648 |
| Fidelity Series International Small Cap Fund | 67,482 | 37,755 | 28,860 | 650 | 1,132 | 25,257 | 102,766 |
| Fidelity Series International Value Fund | 227,699 | 170,392 | 135,851 | 6,680 | 231 | 68,426 | 330,897 |
| Fidelity Series Intrinsic Opportunities Fund | 200,705 | 122,637 | 166,730 | 9,052 | 9,539 | 75,176 | 241,327 |
| Fidelity Series Investment Grade Bond Fund | 3,979,425 | 2,485,560 | 890,753 | 254,119 | (11,625) | (138,589) | 5,424,018 |
| Fidelity Series Large Cap Stock Fund | 175,956 | 111,977 | 140,342 | 10,351 | 6,716 | 55,846 | 210,153 |
| Fidelity Series Large Cap Value Index Fund | 61,534 | 36,135 | 41,159 | 1,427 | 1,983 | 20,018 | 78,511 |
| Fidelity Series Long-Term Treasury Bond Index Fund | 256,889 | 325,761 | 87,303 | 28,064 | (8,120) | (39,143) | 448,084 |
| Fidelity Series Opportunistic Insights Fund | 101,646 | 71,036 | 67,181 | 16,404 | 3,160 | 12,562 | 121,223 |
| Fidelity Series Overseas Fund | 228,853 | 156,387 | 120,723 | 2,730 | 4,864 | 65,077 | 334,458 |
| Fidelity Series Real Estate Income Fund | 45,370 | 20,634 | 18,203 | 2,434 | (81) | 8,759 | 56,479 |
| Fidelity Series Short-Term Credit Fund | 456,820 | 185,049 | 84,648 | 9,298 | 625 | (4,030) | 553,816 |
| Fidelity Series Small Cap Discovery Fund | 21,840 | 12,733 | 15,871 | 3,269 | 646 | 7,028 | 26,376 |
| Fidelity Series Small Cap Opportunities Fund | 72,816 | 36,679 | 50,313 | 1,637 | 4,829 | 23,452 | 87,463 |
| Fidelity Series Stock Selector Large Cap Value Fund | 145,966 | 86,601 | 110,593 | 3,476 | 3,915 | 53,266 | 179,155 |
| Fidelity Series Value Discovery Fund | 110,836 | 67,189 | 83,109 | 2,603 | 3,746 | 39,040 | 137,702 |
| Total | $11,104,616 | $7,067,344 | $4,153,769 | $529,058 | $85,314 | $722,405 | $14,825,910 |
Amounts in the income column in the above table include any capital gain distributions from underlying funds, which are presented in the corresponding line-item in the Statement of Operations, if applicable.
Investment Valuation
The following is a summary of the inputs used, as of July 31, 2021, involving the Fund's assets and liabilities carried at fair value. The inputs or methodology used for valuing securities may not be an indication of the risk associated with investing in those securities. For more information on valuation inputs, and their aggregation into the levels used below, please refer to the Investment Valuation section in the accompanying Notes to Financial Statements.
| Valuation Inputs at Reporting Date: | ||||
| Description | Total | Level 1 | Level 2 | Level 3 |
| Investments in Securities: | ||||
| Domestic Equity Funds | $1,867,883 | $1,867,883 | $-- | $-- |
| International Equity Funds | 2,217,111 | 2,217,111 | -- | -- |
| Bond Funds | 7,778,904 | 7,778,904 | -- | -- |
| Short-Term Funds | 2,962,012 | 2,962,012 | -- | -- |
| Total Investments in Securities: | $14,825,910 | $14,825,910 | $-- | $-- |
See accompanying notes which are an integral part of the financial statements.
Fidelity Simplicity RMD 2010 Fund℠
Financial Statements
Statement of Assets and Liabilities
| July 31, 2021 | ||
| Assets | ||
| Investment in securities, at value — See accompanying schedule: | ||
| Affiliated issuers (cost $13,426,385) | $14,825,910 | |
| Total Investment in Securities (cost $13,426,385) | $14,825,910 | |
| Cash | 32 | |
| Receivable for investments sold | 72,161 | |
| Receivable for fund shares sold | 20,000 | |
| Total assets | 14,918,103 | |
| Liabilities | ||
| Payable for investments purchased | $82,301 | |
| Payable for fund shares redeemed | 4,000 | |
| Accrued management fee | 6,154 | |
| Total liabilities | 92,455 | |
| Net Assets | $14,825,648 | |
| Net Assets consist of: | ||
| Paid in capital | $13,297,767 | |
| Total accumulated earnings (loss) | 1,527,881 | |
| Net Assets | $14,825,648 | |
| Net Asset Value, offering price and redemption price per share ($14,825,648 ÷ 247,573 shares) | $59.88 |
See accompanying notes which are an integral part of the financial statements.
Statement of Operations
| Year ended July 31, 2021 | ||
| Investment Income | ||
| Dividends: | ||
| Affiliated issuers | $176,885 | |
| Expenses | ||
| Management fee | $64,263 | |
| Independent trustees' fees and expenses | 35 | |
| Total expenses | 64,298 | |
| Net investment income (loss) | 112,587 | |
| Realized and Unrealized Gain (Loss) | ||
| Net realized gain (loss) on: | ||
| Investment securities: | ||
| Affiliated issuers | 85,314 | |
| Capital gain distributions from underlying funds: | ||
| Affiliated issuers | 352,173 | |
| Total net realized gain (loss) | 437,487 | |
| Change in net unrealized appreciation (depreciation) on: | ||
| Investment securities: | ||
| Affiliated issuers | 722,405 | |
| Total change in net unrealized appreciation (depreciation) | 722,405 | |
| Net gain (loss) | 1,159,892 | |
| Net increase (decrease) in net assets resulting from operations | $1,272,479 |
See accompanying notes which are an integral part of the financial statements.
Statement of Changes in Net Assets
| Year ended July 31, 2021 | Year ended July 31, 2020 | |
| Increase (Decrease) in Net Assets | ||
| Operations | ||
| Net investment income (loss) | $112,587 | $184,617 |
| Net realized gain (loss) | 437,487 | 75,102 |
| Change in net unrealized appreciation (depreciation) | 722,405 | 477,912 |
| Net increase (decrease) in net assets resulting from operations | 1,272,479 | 737,631 |
| Distributions to shareholders | (360,767) | (350,327) |
| Share transactions | ||
| Proceeds from sales of shares | 4,861,437 | 3,418,223 |
| Reinvestment of distributions | 329,623 | 314,199 |
| Cost of shares redeemed | (2,381,848) | (3,563,043) |
| Net increase (decrease) in net assets resulting from share transactions | 2,809,212 | 169,379 |
| Total increase (decrease) in net assets | 3,720,924 | 556,683 |
| Net Assets | ||
| Beginning of period | 11,104,724 | 10,548,041 |
| End of period | $14,825,648 | $11,104,724 |
| Other Information | ||
| Shares | ||
| Sold | 83,590 | 63,449 |
| Issued in reinvestment of distributions | 5,737 | 5,847 |
| Redeemed | (40,928) | (67,160) |
| Net increase (decrease) | 48,399 | 2,136 |
See accompanying notes which are an integral part of the financial statements.
Financial Highlights
Fidelity Simplicity RMD 2010 Fund
| Years ended July 31, | 2021 | 2020 | 2019 | 2018 | 2017 |
| Selected Per–Share Data | |||||
| Net asset value, beginning of period | $55.75 | $53.53 | $53.40 | $60.82 | $57.20 |
| Income from Investment Operations | |||||
| Net investment income (loss)A | .508 | .888 | 1.026 | .877 | .906 |
| Net realized and unrealized gain (loss) | 5.365 | 3.009 | 1.329 | 1.285 | 4.242 |
| Total from investment operations | 5.873 | 3.897 | 2.355 | 2.162 | 5.148 |
| Distributions from net investment income | (.533) | (.908) | (1.028) | (.850) | (.848) |
| Distributions from net realized gain | (1.210) | (.769) | (1.197) | (8.732) | (.680) |
| Total distributions | (1.743) | (1.677) | (2.225) | (9.582) | (1.528) |
| Net asset value, end of period | $59.88 | $55.75 | $53.53 | $53.40 | $60.82 |
| Total ReturnB | 10.69% | 7.44% | 4.66% | 3.98% | 9.20% |
| Ratios to Average Net AssetsC,D | |||||
| Expenses before reductions | .50% | .51% | .52% | .53% | .08% |
| Expenses net of fee waivers, if any | .50% | .51% | .52% | .53% | .08% |
| Expenses net of all reductions | .50% | .51% | .52% | .53% | .08% |
| Net investment income (loss) | .88% | 1.66% | 1.97% | 1.62% | 1.56% |
| Supplemental Data | |||||
| Net assets, end of period (000 omitted) | $14,826 | $11,105 | $10,548 | $6,867 | $5,933 |
| Portfolio turnover rateE | 32% | 51% | 32% | 44% | 128% |
A Calculated based on average shares outstanding during the period.
B Total returns would have been lower if certain expenses had not been reduced during the applicable periods shown.
C Fees and expenses of any underlying mutual funds or exchange-traded funds (ETFs) are not included in the Fund's expense ratio. The Fund indirectly bears its proportionate share of these expenses.
D Expense ratios reflect operating expenses of the class. Expenses before reductions do not reflect amounts reimbursed, waived, or reduced through arrangements with the investment advisor, brokerage services, or other offset arrangements, if applicable, and do not represent the amount paid by the class during periods when reimbursements, waivers or reductions occur.
E Amount does not include the portfolio activity of any underlying mutual funds or exchange-traded funds (ETFs).
See accompanying notes which are an integral part of the financial statements.
Fidelity Simplicity RMD 2015 Fund℠
Investment Summary (Unaudited)
The information in the following tables is based on the direct investments of the Fund.Top Holdings as of July 31, 2021
| % of fund's net assets | |
| Fidelity Series Investment Grade Bond Fund | 33.1 |
| Fidelity Series Government Money Market Fund 0.07% | 12.9 |
| Fidelity Series Inflation-Protected Bond Index Fund | 9.5 |
| Fidelity Series Emerging Markets Opportunities Fund | 7.0 |
| Fidelity Series Long-Term Treasury Bond Index Fund | 3.0 |
| Fidelity Series Short-Term Credit Fund | 3.0 |
| Fidelity Series Overseas Fund | 3.0 |
| Fidelity Series International Growth Fund | 2.9 |
| Fidelity Series International Value Fund | 2.9 |
| Fidelity Series Commodity Strategy Fund | 2.7 |
| 80.0 |
Asset Allocation (% of fund's net assets)
| Period end | ||
| Domestic Equity Funds | 18.1% | |
| International Equity Funds | 18.6% | |
| Bond Funds | 47.4% | |
| Short-Term Funds | 15.9% | |

Domestic Equity Funds category includes Fidelity Series Commodity Strategy Fund which invests in commodity-related investments.
Fidelity Simplicity RMD 2015 Fund℠
Schedule of Investments July 31, 2021
Showing Percentage of Net Assets
| Domestic Equity Funds - 18.1% | |||
| Shares | Value | ||
| Fidelity Series All-Sector Equity Fund (a) | 14,949 | $193,288 | |
| Fidelity Series Blue Chip Growth Fund (a) | 15,663 | 302,928 | |
| Fidelity Series Commodity Strategy Fund (a) | 150,337 | 849,404 | |
| Fidelity Series Growth Company Fund (a) | 28,940 | 768,927 | |
| Fidelity Series Intrinsic Opportunities Fund (a) | 35,399 | 793,290 | |
| Fidelity Series Large Cap Stock Fund (a) | 34,943 | 690,818 | |
| Fidelity Series Large Cap Value Index Fund (a) | 16,565 | 258,076 | |
| Fidelity Series Opportunistic Insights Fund (a) | 17,228 | 398,491 | |
| Fidelity Series Small Cap Discovery Fund (a) | 6,097 | 86,700 | |
| Fidelity Series Small Cap Opportunities Fund (a) | 15,902 | 287,500 | |
| Fidelity Series Stock Selector Large Cap Value Fund (a) | 38,592 | 588,915 | |
| Fidelity Series Value Discovery Fund (a) | 26,642 | 452,649 | |
| TOTAL DOMESTIC EQUITY FUNDS | |||
| (Cost $4,201,636) | 5,670,986 | ||
| International Equity Funds - 18.6% | |||
| Fidelity Series Canada Fund (a) | 24,345 | 341,561 | |
| Fidelity Series Emerging Markets Fund (a) | 21,615 | 242,737 | |
| Fidelity Series Emerging Markets Opportunities Fund (a) | 87,908 | 2,195,952 | |
| Fidelity Series International Growth Fund (a) | 46,004 | 926,988 | |
| Fidelity Series International Small Cap Fund (a) | 12,272 | 285,440 | |
| Fidelity Series International Value Fund (a) | 81,721 | 919,358 | |
| Fidelity Series Overseas Fund (a) | 65,439 | 929,231 | |
| TOTAL INTERNATIONAL EQUITY FUNDS | |||
| (Cost $4,509,694) | 5,841,267 | ||
| Bond Funds - 47.4% | |||
| Fidelity Series Emerging Markets Debt Fund (a) | 18,449 | 172,129 | |
| Fidelity Series Emerging Markets Debt Local Currency Fund (a) | 5,519 | 56,952 | |
| Fidelity Series Floating Rate High Income Fund (a) | 3,664 | 33,749 | |
| Fidelity Series High Income Fund (a) | 20,672 | 198,248 | |
| Fidelity Series Inflation-Protected Bond Index Fund (a) | 265,172 | 2,977,887 | |
| Fidelity Series International Credit Fund (a) | 515 | 5,238 | |
| Fidelity Series Investment Grade Bond Fund (a) | 876,278 | 10,375,135 | |
| Fidelity Series Long-Term Treasury Bond Index Fund (a) | 109,574 | 948,913 | |
| Fidelity Series Real Estate Income Fund (a) | 10,162 | 119,607 | |
| TOTAL BOND FUNDS | |||
| (Cost $14,186,923) | 14,887,858 | ||
| Short-Term Funds - 15.9% | |||
| Fidelity Series Government Money Market Fund 0.07% (a)(b) | 4,045,829 | 4,045,829 | |
| Fidelity Series Short-Term Credit Fund (a) | 91,406 | 930,515 | |
| TOTAL SHORT-TERM FUNDS | |||
| (Cost $4,962,230) | 4,976,344 | ||
| TOTAL INVESTMENT IN SECURITIES - 100.0% | |||
| (Cost $27,860,483) | 31,376,455 | ||
| NET OTHER ASSETS (LIABILITIES) - 0.0% | (673) | ||
| NET ASSETS - 100% | $31,375,782 |
Legend
(a) Affiliated Fund
(b) The rate quoted is the annualized seven-day yield of the fund at period end.
Affiliated Underlying Funds
Fiscal year to date information regarding the Fund's investments in affiliated Underlying Funds is presented below. Exchanges between classes of the same affiliated Underlying Funds may occur. If an underlying Fund changes its name, the name presented below is the name in effect at period end.
| Affiliate | Value, beginning of period | Purchases | Sales Proceeds | Dividend Income | Realized Gain (loss) | Change in Unrealized appreciation (depreciation) | Value, end of period |
| Fidelity Series All-Sector Equity Fund | $143,535 | $86,631 | $79,397 | $20,574 | $1,675 | $40,844 | $193,288 |
| Fidelity Series Blue Chip Growth Fund | 250,751 | 191,432 | 164,259 | 84,104 | 19,615 | 5,389 | 302,928 |
| Fidelity Series Canada Fund | 197,722 | 148,266 | 90,270 | 4,958 | 4,694 | 81,149 | 341,561 |
| Fidelity Series Commodity Strategy Fund | 539,433 | 374,251 | 309,050 | 2,626 | 7,485 | 237,285 | 849,404 |
| Fidelity Series Emerging Markets Debt Fund | 138,625 | 71,253 | 40,373 | 7,190 | (2,455) | 5,079 | 172,129 |
| Fidelity Series Emerging Markets Debt Local Currency Fund | -- | 64,932 | 8,765 | 733 | 30 | 755 | 56,952 |
| Fidelity Series Emerging Markets Fund | 194,066 | 105,553 | 100,254 | 3,393 | 4,141 | 39,231 | 242,737 |
| Fidelity Series Emerging Markets Opportunities Fund | 1,769,215 | 1,122,702 | 1,087,177 | 64,468 | 45,806 | 345,406 | 2,195,952 |
| Fidelity Series Floating Rate High Income Fund | 29,542 | 15,160 | 12,616 | 1,384 | (226) | 1,889 | 33,749 |
| Fidelity Series Government Money Market Fund 0.07% | 2,816,985 | 2,284,060 | 1,055,216 | 3,874 | -- | -- | 4,045,829 |
| Fidelity Series Growth Company Fund | 575,424 | 470,261 | 375,672 | 171,406 | 29,883 | 69,031 | 768,927 |
| Fidelity Series High Income Fund | 155,170 | 80,077 | 45,198 | 9,530 | (106) | 8,305 | 198,248 |
| Fidelity Series Inflation-Protected Bond Index Fund | 1,988,218 | 1,243,684 | 412,652 | 30,034 | 1,367 | 157,270 | 2,977,887 |
| Fidelity Series International Credit Fund | 5,002 | 342 | -- | 343 | -- | (106) | 5,238 |
| Fidelity Series International Growth Fund | 596,006 | 522,105 | 291,508 | 100,101 | 7,087 | 93,298 | 926,988 |
| Fidelity Series International Small Cap Fund | 176,079 | 99,179 | 65,669 | 1,917 | 2,866 | 72,985 | 285,440 |
| Fidelity Series International Value Fund | 594,145 | 465,313 | 343,666 | 19,575 | 2,843 | 200,723 | 919,358 |
| Fidelity Series Intrinsic Opportunities Fund | 583,593 | 379,284 | 450,455 | 28,802 | 37,137 | 243,731 | 793,290 |
| Fidelity Series Investment Grade Bond Fund | 6,950,369 | 5,222,198 | 1,510,022 | 475,900 | (20,405) | (267,005) | 10,375,135 |
| Fidelity Series Large Cap Stock Fund | 511,594 | 322,779 | 353,521 | 31,603 | 25,570 | 184,396 | 690,818 |
| Fidelity Series Large Cap Value Index Fund | 178,909 | 106,553 | 100,463 | 4,728 | 5,706 | 67,371 | 258,076 |
| Fidelity Series Long-Term Treasury Bond Index Fund | 498,715 | 713,632 | 158,847 | 60,738 | (13,736) | (90,851) | 948,913 |
| Fidelity Series Opportunistic Insights Fund | 295,536 | 211,128 | 158,148 | 54,278 | 7,922 | 42,053 | 398,491 |
| Fidelity Series Overseas Fund | 597,175 | 417,457 | 288,697 | 7,998 | 12,497 | 190,799 | 929,231 |
| Fidelity Series Real Estate Income Fund | 90,338 | 45,602 | 35,282 | 5,150 | (377) | 19,326 | 119,607 |
| Fidelity Series Short-Term Credit Fund | 647,615 | 370,315 | 82,069 | 14,189 | 386 | (5,732) | 930,515 |
| Fidelity Series Small Cap Discovery Fund | 63,508 | 38,458 | 41,117 | 10,529 | 4,006 | 21,845 | 86,700 |
| Fidelity Series Small Cap Opportunities Fund | 211,714 | 113,016 | 129,206 | 5,238 | 6,758 | 85,218 | 287,500 |
| Fidelity Series Stock Selector Large Cap Value Fund | 424,385 | 255,256 | 280,656 | 11,513 | 12,372 | 177,558 | 588,915 |
| Fidelity Series Value Discovery Fund | 322,262 | 194,196 | 205,486 | 8,623 | 12,778 | 128,899 | 452,649 |
| Total | $21,545,631 | $15,735,075 | $8,275,711 | $1,245,499 | $215,319 | $2,156,141 | $31,376,455 |
Amounts in the income column in the above table include any capital gain distributions from underlying funds, which are presented in the corresponding line-item in the Statement of Operations, if applicable.
Investment Valuation
The following is a summary of the inputs used, as of July 31, 2021, involving the Fund's assets and liabilities carried at fair value. The inputs or methodology used for valuing securities may not be an indication of the risk associated with investing in those securities. For more information on valuation inputs, and their aggregation into the levels used below, please refer to the Investment Valuation section in the accompanying Notes to Financial Statements.
| Valuation Inputs at Reporting Date: | ||||
| Description | Total | Level 1 | Level 2 | Level 3 |
| Investments in Securities: | ||||
| Domestic Equity Funds | $5,670,986 | $5,670,986 | $-- | $-- |
| International Equity Funds | 5,841,267 | 5,841,267 | -- | -- |
| Bond Funds | 14,887,858 | 14,887,858 | -- | -- |
| Short-Term Funds | 4,976,344 | 4,976,344 | -- | -- |
| Total Investments in Securities: | $31,376,455 | $31,376,455 | $-- | $-- |
See accompanying notes which are an integral part of the financial statements.
Fidelity Simplicity RMD 2015 Fund℠
Financial Statements
Statement of Assets and Liabilities
| July 31, 2021 | ||
| Assets | ||
| Investment in securities, at value — See accompanying schedule: | ||
| Affiliated issuers (cost $27,860,483) | $31,376,455 | |
| Total Investment in Securities (cost $27,860,483) | $31,376,455 | |
| Cash | 2 | |
| Receivable for investments sold | 176,598 | |
| Receivable for fund shares sold | 6,207 | |
| Total assets | 31,559,262 | |
| Liabilities | ||
| Payable for investments purchased | $168,905 | |
| Payable for fund shares redeemed | 273 | |
| Accrued management fee | 14,302 | |
| Total liabilities | 183,480 | |
| Net Assets | $31,375,782 | |
| Net Assets consist of: | ||
| Paid in capital | $27,443,117 | |
| Total accumulated earnings (loss) | 3,932,665 | |
| Net Assets | $31,375,782 | |
| Net Asset Value, offering price and redemption price per share ($31,375,782 ÷ 459,967 shares) | $68.21 |
See accompanying notes which are an integral part of the financial statements.
Statement of Operations
| Year ended July 31, 2021 | ||
| Investment Income | ||
| Dividends: | ||
| Affiliated issuers | $388,273 | |
| Expenses | ||
| Management fee | $150,939 | |
| Independent trustees' fees and expenses | 74 | |
| Total expenses | 151,013 | |
| Net investment income (loss) | 237,260 | |
| Realized and Unrealized Gain (Loss) | ||
| Net realized gain (loss) on: | ||
| Investment securities: | ||
| Affiliated issuers | 215,319 | |
| Capital gain distributions from underlying funds: | ||
| Affiliated issuers | 857,226 | |
| Total net realized gain (loss) | 1,072,545 | |
| Change in net unrealized appreciation (depreciation) on: | ||
| Investment securities: | ||
| Affiliated issuers | 2,156,141 | |
| Total change in net unrealized appreciation (depreciation) | 2,156,141 | |
| Net gain (loss) | 3,228,686 | |
| Net increase (decrease) in net assets resulting from operations | $3,465,946 |
See accompanying notes which are an integral part of the financial statements.
Statement of Changes in Net Assets
| Year ended July 31, 2021 | Year ended July 31, 2020 | |
| Increase (Decrease) in Net Assets | ||
| Operations | ||
| Net investment income (loss) | $237,260 | $334,541 |
| Net realized gain (loss) | 1,072,545 | 220,095 |
| Change in net unrealized appreciation (depreciation) | 2,156,141 | 995,027 |
| Net increase (decrease) in net assets resulting from operations | 3,465,946 | 1,549,663 |
| Distributions to shareholders | (798,812) | (743,628) |
| Share transactions | ||
| Proceeds from sales of shares | 10,741,128 | 5,195,147 |
| Reinvestment of distributions | 757,214 | 657,979 |
| Cost of shares redeemed | (4,335,415) | (6,035,894) |
| Net increase (decrease) in net assets resulting from share transactions | 7,162,927 | (182,768) |
| Total increase (decrease) in net assets | 9,830,061 | 623,267 |
| Net Assets | ||
| Beginning of period | 21,545,721 | 20,922,454 |
| End of period | $31,375,782 | $21,545,721 |
| Other Information | ||
| Shares | ||
| Sold | 165,271 | 87,822 |
| Issued in reinvestment of distributions | 11,765 | 11,051 |
| Redeemed | (65,729) | (102,387) |
| Net increase (decrease) | 111,307 | (3,514) |
See accompanying notes which are an integral part of the financial statements.
Financial Highlights
Fidelity Simplicity RMD 2015 Fund
| Years ended July 31, | 2021 | 2020 | 2019 | 2018 | 2017 |
| Selected Per–Share Data | |||||
| Net asset value, beginning of period | $61.80 | $59.41 | $59.14 | $64.98 | $60.62 |
| Income from Investment Operations | |||||
| Net investment income (loss)A | .565 | .947 | 1.093 | .869 | .950 |
| Net realized and unrealized gain (loss) | 7.894 | 3.526 | 1.336 | 2.076 | 5.023 |
| Total from investment operations | 8.459 | 4.473 | 2.429 | 2.945 | 5.973 |
| Distributions from net investment income | (.598) | (.987) | (1.092) | (.877) | (.906) |
| Distributions from net realized gain | (1.451) | (1.096) | (1.067) | (7.908) | (.707) |
| Total distributions | (2.049) | (2.083) | (2.159) | (8.785) | (1.613) |
| Net asset value, end of period | $68.21 | $61.80 | $59.41 | $59.14 | $64.98 |
| Total ReturnB | 13.92% | 7.71% | 4.36% | 5.00% | 10.08% |
| Ratios to Average Net AssetsC,D | |||||
| Expenses before reductions | .55% | .55% | .57% | .58% | .09% |
| Expenses net of fee waivers, if any | .55% | .55% | .57% | .58% | .09% |
| Expenses net of all reductions | .55% | .55% | .57% | .57% | .09% |
| Net investment income (loss) | .86% | 1.60% | 1.89% | 1.47% | 1.53% |
| Supplemental Data | |||||
| Net assets, end of period (000 omitted) | $31,376 | $21,546 | $20,922 | $13,754 | $7,287 |
| Portfolio turnover rateE | 30% | 48% | 28% | 44% | 115% |
A Calculated based on average shares outstanding during the period.
B Total returns would have been lower if certain expenses had not been reduced during the applicable periods shown.
C Fees and expenses of any underlying mutual funds or exchange-traded funds (ETFs) are not included in the Fund's expense ratio. The Fund indirectly bears its proportionate share of these expenses.
D Expense ratios reflect operating expenses of the class. Expenses before reductions do not reflect amounts reimbursed, waived, or reduced through arrangements with the investment advisor, brokerage services, or other offset arrangements, if applicable, and do not represent the amount paid by the class during periods when reimbursements, waivers or reductions occur.
E Amount does not include the portfolio activity of any underlying mutual funds or exchange-traded funds (ETFs).
See accompanying notes which are an integral part of the financial statements.
Fidelity Simplicity RMD 2020 Fund℠
Investment Summary (Unaudited)
The information in the following tables is based on the direct investments of the Fund.Top Holdings as of July 31, 2021
| % of fund's net assets | |
| Fidelity Series Investment Grade Bond Fund | 29.3 |
| Fidelity Series Government Money Market Fund 0.07% | 9.5 |
| Fidelity Series Inflation-Protected Bond Index Fund | 8.2 |
| Fidelity Series Emerging Markets Opportunities Fund | 8.0 |
| Fidelity Series Overseas Fund | 3.7 |
| Fidelity Series International Growth Fund | 3.7 |
| Fidelity Series International Value Fund | 3.6 |
| Fidelity Series Intrinsic Opportunities Fund | 3.4 |
| Fidelity Series Growth Company Fund | 3.3 |
| Fidelity Series Long-Term Treasury Bond Index Fund | 3.0 |
| 75.7 |
Asset Allocation (% of fund's net assets)
| Period end | ||
| Domestic Equity Funds | 23.6% | |
| International Equity Funds | 22.3% | |
| Bond Funds | 42.4% | |
| Short-Term Funds | 11.7% | |

Domestic Equity Funds category includes Fidelity Series Commodity Strategy Fund which invests in commodity-related investments.
Fidelity Simplicity RMD 2020 Fund℠
Schedule of Investments July 31, 2021
Showing Percentage of Net Assets
| Domestic Equity Funds - 23.6% | |||
| Shares | Value | ||
| Fidelity Series All-Sector Equity Fund (a) | 43,702 | $565,064 | |
| Fidelity Series Blue Chip Growth Fund (a) | 45,790 | 885,570 | |
| Fidelity Series Commodity Strategy Fund (a) | 324,162 | 1,831,514 | |
| Fidelity Series Growth Company Fund (a) | 84,603 | 2,247,905 | |
| Fidelity Series Intrinsic Opportunities Fund (a) | 103,486 | 2,319,118 | |
| Fidelity Series Large Cap Stock Fund (a) | 102,152 | 2,019,542 | |
| Fidelity Series Large Cap Value Index Fund (a) | 48,425 | 754,463 | |
| Fidelity Series Opportunistic Insights Fund (a) | 50,366 | 1,164,967 | |
| Fidelity Series Small Cap Discovery Fund (a) | 17,824 | 253,455 | |
| Fidelity Series Small Cap Opportunities Fund (a) | 46,487 | 840,478 | |
| Fidelity Series Stock Selector Large Cap Value Fund (a) | 112,820 | 1,721,639 | |
| Fidelity Series Value Discovery Fund (a) | 77,886 | 1,323,278 | |
| TOTAL DOMESTIC EQUITY FUNDS | |||
| (Cost $11,926,032) | 15,926,993 | ||
| International Equity Funds - 22.3% | |||
| Fidelity Series Canada Fund (a) | 65,021 | 912,246 | |
| Fidelity Series Emerging Markets Fund (a) | 53,039 | 595,625 | |
| Fidelity Series Emerging Markets Opportunities Fund (a) | 215,695 | 5,388,072 | |
| Fidelity Series International Growth Fund (a) | 122,863 | 2,475,681 | |
| Fidelity Series International Small Cap Fund (a) | 32,772 | 762,272 | |
| Fidelity Series International Value Fund (a) | 218,251 | 2,455,324 | |
| Fidelity Series Overseas Fund (a) | 174,765 | 2,481,665 | |
| TOTAL INTERNATIONAL EQUITY FUNDS | |||
| (Cost $11,703,257) | 15,070,885 | ||
| Bond Funds - 42.4% | |||
| Fidelity Series Emerging Markets Debt Fund (a) | 39,880 | 372,077 | |
| Fidelity Series Emerging Markets Debt Local Currency Fund (a) | 11,799 | 121,765 | |
| Fidelity Series Floating Rate High Income Fund (a) | 7,887 | 72,640 | |
| Fidelity Series High Income Fund (a) | 44,577 | 427,495 | |
| Fidelity Series Inflation-Protected Bond Index Fund (a) | 496,236 | 5,572,729 | |
| Fidelity Series International Credit Fund (a) | 1,191 | 12,108 | |
| Fidelity Series Investment Grade Bond Fund (a) | 1,673,829 | 19,818,139 | |
| Fidelity Series Long-Term Treasury Bond Index Fund (a) | 236,276 | 2,046,153 | |
| Fidelity Series Real Estate Income Fund (a) | 21,912 | 257,908 | |
| TOTAL BOND FUNDS | |||
| (Cost $27,288,631) | 28,701,014 | ||
| Short-Term Funds - 11.7% | |||
| Fidelity Series Government Money Market Fund 0.07% (a)(b) | 6,433,970 | 6,433,970 | |
| Fidelity Series Short-Term Credit Fund (a) | 145,339 | 1,479,554 | |
| TOTAL SHORT-TERM FUNDS | |||
| (Cost $7,890,110) | 7,913,524 | ||
| TOTAL INVESTMENT IN SECURITIES - 100.0% | |||
| (Cost $58,808,030) | 67,612,416 | ||
| NET OTHER ASSETS (LIABILITIES) - 0.0% | (1,402) | ||
| NET ASSETS - 100% | $67,611,014 |
Legend
(a) Affiliated Fund
(b) The rate quoted is the annualized seven-day yield of the fund at period end.
Affiliated Underlying Funds
Fiscal year to date information regarding the Fund's investments in affiliated Underlying Funds is presented below. Exchanges between classes of the same affiliated Underlying Funds may occur. If an underlying Fund changes its name, the name presented below is the name in effect at period end.
| Affiliate | Value, beginning of period | Purchases | Sales Proceeds | Dividend Income | Realized Gain (loss) | Change in Unrealized appreciation (depreciation) | Value, end of period |
| Fidelity Series All-Sector Equity Fund | $439,010 | $229,503 | $226,044 | $59,269 | $(1,525) | $124,120 | $565,064 |
| Fidelity Series Blue Chip Growth Fund | 766,761 | 558,475 | 505,736 | 251,438 | 52,838 | 13,232 | 885,570 |
| Fidelity Series Canada Fund | 569,293 | 352,872 | 239,023 | 13,546 | 4,851 | 224,253 | 912,246 |
| Fidelity Series Commodity Strategy Fund | 1,239,137 | 800,364 | 733,766 | 5,974 | 10,609 | 515,170 | 1,831,514 |
| Fidelity Series Emerging Markets Debt Fund | 311,907 | 137,479 | 82,820 | 15,460 | (1,191) | 6,702 | 372,077 |
| Fidelity Series Emerging Markets Debt Local Currency Fund | -- | 137,890 | 17,946 | 1,545 | (171) | 1,992 | 121,765 |
| Fidelity Series Emerging Markets Fund | 498,467 | 252,091 | 257,829 | 8,322 | 3,598 | 99,298 | 595,625 |
| Fidelity Series Emerging Markets Opportunities Fund | 4,540,532 | 2,354,533 | 2,427,826 | 156,911 | 43,286 | 877,547 | 5,388,072 |
| Fidelity Series Floating Rate High Income Fund | 67,440 | 27,957 | 26,321 | 2,983 | (329) | 3,893 | 72,640 |
| Fidelity Series Government Money Market Fund 0.07% | 4,814,731 | 3,640,405 | 2,021,166 | 6,263 | -- | -- | 6,433,970 |
| Fidelity Series Growth Company Fund | 1,759,299 | 1,328,720 | 1,136,327 | 489,725 | 96,382 | 199,831 | 2,247,905 |
| Fidelity Series High Income Fund | 352,851 | 153,452 | 96,221 | 20,549 | 457 | 16,956 | 427,495 |
| Fidelity Series Inflation-Protected Bond Index Fund | 3,939,180 | 2,216,679 | 881,289 | 56,546 | 1,946 | 296,213 | 5,572,729 |
| Fidelity Series International Credit Fund | 11,561 | 793 | -- | 794 | -- | (246) | 12,108 |
| Fidelity Series International Growth Fund | 1,715,032 | 1,334,300 | 843,938 | 273,513 | 15,295 | 254,992 | 2,475,681 |
| Fidelity Series International Small Cap Fund | 507,051 | 218,631 | 169,148 | 5,252 | 4,606 | 201,132 | 762,272 |
| Fidelity Series International Value Fund | 1,709,824 | 1,109,514 | 905,347 | 53,496 | (4,447) | 545,780 | 2,455,324 |
| Fidelity Series Intrinsic Opportunities Fund | 1,784,339 | 984,823 | 1,250,017 | 84,917 | 60,071 | 739,902 | 2,319,118 |
| Fidelity Series Investment Grade Bond Fund | 14,059,713 | 9,718,075 | 3,411,206 | 915,855 | (39,272) | (509,171) | 19,818,139 |
| Fidelity Series Large Cap Stock Fund | 1,564,150 | 851,771 | 990,754 | 94,551 | 49,896 | 544,479 | 2,019,542 |
| Fidelity Series Large Cap Value Index Fund | 547,133 | 277,315 | 277,850 | 13,731 | 11,459 | 196,406 | 754,463 |
| Fidelity Series Long-Term Treasury Bond Index Fund | 1,145,352 | 1,509,118 | 385,340 | 130,503 | (47,635) | (175,342) | 2,046,153 |
| Fidelity Series Opportunistic Insights Fund | 903,672 | 576,526 | 459,430 | 156,498 | 20,175 | 124,024 | 1,164,967 |
| Fidelity Series Overseas Fund | 1,718,410 | 1,031,652 | 814,943 | 21,849 | 19,576 | 526,970 | 2,481,665 |
| Fidelity Series Real Estate Income Fund | 203,622 | 84,319 | 70,244 | 11,098 | (12) | 40,223 | 257,908 |
| Fidelity Series Short-Term Credit Fund | 1,072,739 | 615,732 | 200,260 | 23,168 | 636 | (9,293) | 1,479,554 |
| Fidelity Series Small Cap Discovery Fund | 194,377 | 109,683 | 123,672 | 30,682 | 4,108 | 68,959 | 253,455 |
| Fidelity Series Small Cap Opportunities Fund | 647,437 | 313,168 | 382,478 | 15,418 | 15,709 | 246,642 | 840,478 |
| Fidelity Series Stock Selector Large Cap Value Fund | 1,297,543 | 666,096 | 782,954 | 33,414 | 37,573 | 503,381 | 1,721,639 |
| Fidelity Series Value Discovery Fund | 985,378 | 509,974 | 577,280 | 25,030 | 24,347 | 380,859 | 1,323,278 |
| Total | $49,365,941 | $32,101,910 | $20,297,175 | $2,978,300 | $382,836 | $6,058,904 | $67,612,416 |
Amounts in the income column in the above table include any capital gain distributions from underlying funds, which are presented in the corresponding line-item in the Statement of Operations, if applicable.
Investment Valuation
The following is a summary of the inputs used, as of July 31, 2021, involving the Fund's assets and liabilities carried at fair value. The inputs or methodology used for valuing securities may not be an indication of the risk associated with investing in those securities. For more information on valuation inputs, and their aggregation into the levels used below, please refer to the Investment Valuation section in the accompanying Notes to Financial Statements.
| Valuation Inputs at Reporting Date: | ||||
| Description | Total | Level 1 | Level 2 | Level 3 |
| Investments in Securities: | ||||
| Domestic Equity Funds | $15,926,993 | $15,926,993 | $-- | $-- |
| International Equity Funds | 15,070,885 | 15,070,885 | -- | -- |
| Bond Funds | 28,701,014 | 28,701,014 | -- | -- |
| Short-Term Funds | 7,913,524 | 7,913,524 | -- | -- |
| Total Investments in Securities: | $67,612,416 | $67,612,416 | $-- | $-- |
See accompanying notes which are an integral part of the financial statements.
Fidelity Simplicity RMD 2020 Fund℠
Financial Statements
Statement of Assets and Liabilities
| July 31, 2021 | ||
| Assets | ||
| Investment in securities, at value — See accompanying schedule: | ||
| Affiliated issuers (cost $58,808,030) | $67,612,416 | |
| Total Investment in Securities (cost $58,808,030) | $67,612,416 | |
| Cash | 187 | |
| Receivable for investments sold | 448,994 | |
| Receivable for fund shares sold | 30,664 | |
| Total assets | 68,092,261 | |
| Liabilities | ||
| Payable for investments purchased | $345,864 | |
| Payable for fund shares redeemed | 102,026 | |
| Accrued management fee | 33,357 | |
| Total liabilities | 481,247 | |
| Net Assets | $67,611,014 | |
| Net Assets consist of: | ||
| Paid in capital | $57,937,685 | |
| Total accumulated earnings (loss) | 9,673,329 | |
| Net Assets | $67,611,014 | |
| Net Asset Value, offering price and redemption price per share ($67,611,014 ÷ 955,139 shares) | $70.79 |
See accompanying notes which are an integral part of the financial statements.
Statement of Operations
| Year ended July 31, 2021 | ||
| Investment Income | ||
| Dividends: | ||
| Affiliated issuers | $870,295 | |
| Expenses | ||
| Management fee | $351,050 | |
| Independent trustees' fees and expenses | 162 | |
| Total expenses | 351,212 | |
| Net investment income (loss) | 519,083 | |
| Realized and Unrealized Gain (Loss) | ||
| Net realized gain (loss) on: | ||
| Investment securities: | ||
| Affiliated issuers | 382,836 | |
| Capital gain distributions from underlying funds: | ||
| Affiliated issuers | 2,108,005 | |
| Total net realized gain (loss) | 2,490,841 | |
| Change in net unrealized appreciation (depreciation) on: | ||
| Investment securities: | ||
| Affiliated issuers | 6,058,904 | |
| Total change in net unrealized appreciation (depreciation) | 6,058,904 | |
| Net gain (loss) | 8,549,745 | |
| Net increase (decrease) in net assets resulting from operations | $9,068,828 |
See accompanying notes which are an integral part of the financial statements.
Statement of Changes in Net Assets
| Year ended July 31, 2021 | Year ended July 31, 2020 | |
| Increase (Decrease) in Net Assets | ||
| Operations | ||
| Net investment income (loss) | $519,083 | $732,134 |
| Net realized gain (loss) | 2,490,841 | 398,279 |
| Change in net unrealized appreciation (depreciation) | 6,058,904 | 2,046,939 |
| Net increase (decrease) in net assets resulting from operations | 9,068,828 | 3,177,352 |
| Distributions to shareholders | (1,657,535) | (1,766,670) |
| Share transactions | ||
| Proceeds from sales of shares | 20,806,496 | 14,635,546 |
| Reinvestment of distributions | 1,593,342 | 1,672,437 |
| Cost of shares redeemed | (11,565,134) | (11,359,065) |
| Net increase (decrease) in net assets resulting from share transactions | 10,834,704 | 4,948,918 |
| Total increase (decrease) in net assets | 18,245,997 | 6,359,600 |
| Net Assets | ||
| Beginning of period | 49,365,017 | 43,005,417 |
| End of period | $67,611,014 | $49,365,017 |
| Other Information | ||
| Shares | ||
| Sold | 307,458 | 243,643 |
| Issued in reinvestment of distributions | 24,220 | 27,880 |
| Redeemed | (170,385) | (195,913) |
| Net increase (decrease) | 161,293 | 75,610 |
See accompanying notes which are an integral part of the financial statements.
Financial Highlights
Fidelity Simplicity RMD 2020 Fund
| Years ended July 31, | 2021 | 2020 | 2019 | 2018 | 2017 |
| Selected Per–Share Data | |||||
| Net asset value, beginning of period | $62.18 | $59.88 | $59.80 | $64.06 | $59.21 |
| Income from Investment Operations | |||||
| Net investment income (loss)A | .586 | .930 | 1.031 | .813 | .924 |
| Net realized and unrealized gain (loss) | 9.999 | 3.672 | 1.221 | 2.708 | 5.363 |
| Total from investment operations | 10.585 | 4.602 | 2.252 | 3.521 | 6.287 |
| Distributions from net investment income | (.617) | (.966) | (1.061) | (.810) | (.882) |
| Distributions from net realized gain | (1.358) | (1.336) | (1.111) | (6.971) | (.555) |
| Total distributions | (1.975) | (2.302) | (2.172) | (7.781) | (1.437) |
| Net asset value, end of period | $70.79 | $62.18 | $59.88 | $59.80 | $64.06 |
| Total ReturnB | 17.29% | 7.88% | 4.04% | 6.01% | 10.83% |
| Ratios to Average Net AssetsC,D | |||||
| Expenses before reductions | .59% | .60% | .61% | .62% | .10% |
| Expenses net of fee waivers, if any | .59% | .60% | .61% | .62% | .10% |
| Expenses net of all reductions | .59% | .60% | .61% | .62% | .10% |
| Net investment income (loss) | .87% | 1.57% | 1.78% | 1.37% | 1.52% |
| Supplemental Data | |||||
| Net assets, end of period (000 omitted) | $67,611 | $49,365 | $43,005 | $26,667 | $7,449 |
| Portfolio turnover rateE | 34% | 48% | 29% | 29% | 118% |
A Calculated based on average shares outstanding during the period.
B Total returns would have been lower if certain expenses had not been reduced during the applicable periods shown.
C Fees and expenses of any underlying mutual funds or exchange-traded funds (ETFs) are not included in the Fund's expense ratio. The Fund indirectly bears its proportionate share of these expenses.
D Expense ratios reflect operating expenses of the class. Expenses before reductions do not reflect amounts reimbursed, waived, or reduced through arrangements with the investment advisor, brokerage services, or other offset arrangements, if applicable, and do not represent the amount paid by the class during periods when reimbursements, waivers or reductions occur.
E Amount does not include the portfolio activity of any underlying mutual funds or exchange-traded funds (ETFs).
See accompanying notes which are an integral part of the financial statements.
Fidelity Simplicity RMD 2025 Fund℠
Investment Summary (Unaudited)
The information in the following tables is based on the direct investments of the Fund.Top Holdings as of July 31, 2021
| % of fund's net assets | |
| Fidelity Series Investment Grade Bond Fund | 25.8 |
| Fidelity Series Emerging Markets Opportunities Fund | 8.8 |
| Fidelity Series Inflation-Protected Bond Index Fund | 7.0 |
| Fidelity Series Government Money Market Fund 0.07% | 6.6 |
| Fidelity Series Overseas Fund | 4.3 |
| Fidelity Series International Growth Fund | 4.3 |
| Fidelity Series International Value Fund | 4.3 |
| Fidelity Series Intrinsic Opportunities Fund | 4.3 |
| Fidelity Series Growth Company Fund | 4.1 |
| Fidelity Series Large Cap Stock Fund | 3.7 |
| 73.2 |
Asset Allocation (% of fund's net assets)
| Period end | ||
| Domestic Equity Funds | 28.6% | |
| International Equity Funds | 25.6% | |
| Bond Funds | 37.7% | |
| Short-Term Funds | 8.1% | |

Domestic Equity Funds category includes Fidelity Series Commodity Strategy Fund which invests in commodity-related investments.
Fidelity Simplicity RMD 2025 Fund℠
Schedule of Investments July 31, 2021
Showing Percentage of Net Assets
| Domestic Equity Funds - 28.6% | |||
| Shares | Value | ||
| Fidelity Series All-Sector Equity Fund (a) | 9,145 | $118,241 | |
| Fidelity Series Blue Chip Growth Fund (a) | 9,581 | 185,299 | |
| Fidelity Series Commodity Strategy Fund (a) | 54,688 | 308,989 | |
| Fidelity Series Growth Company Fund (a) | 17,703 | 470,375 | |
| Fidelity Series Intrinsic Opportunities Fund (a) | 21,655 | 485,286 | |
| Fidelity Series Large Cap Stock Fund (a) | 21,376 | 422,597 | |
| Fidelity Series Large Cap Value Index Fund (a) | 10,131 | 157,847 | |
| Fidelity Series Opportunistic Insights Fund (a) | 10,539 | 243,775 | |
| Fidelity Series Small Cap Discovery Fund (a) | 3,729 | 53,030 | |
| Fidelity Series Small Cap Opportunities Fund (a) | 9,727 | 175,871 | |
| Fidelity Series Stock Selector Large Cap Value Fund (a) | 23,608 | 360,257 | |
| Fidelity Series Value Discovery Fund (a) | 16,298 | 276,896 | |
| TOTAL DOMESTIC EQUITY FUNDS | |||
| (Cost $2,566,062) | 3,258,463 | ||
| International Equity Funds - 25.6% | |||
| Fidelity Series Canada Fund (a) | 12,884 | 180,758 | |
| Fidelity Series Emerging Markets Fund (a) | 9,897 | 111,138 | |
| Fidelity Series Emerging Markets Opportunities Fund (a) | 40,426 | 1,009,838 | |
| Fidelity Series International Growth Fund (a) | 24,348 | 490,612 | |
| Fidelity Series International Small Cap Fund (a) | 6,495 | 151,078 | |
| Fidelity Series International Value Fund (a) | 43,253 | 486,595 | |
| Fidelity Series Overseas Fund (a) | 34,632 | 491,779 | |
| TOTAL INTERNATIONAL EQUITY FUNDS | |||
| (Cost $2,433,301) | 2,921,798 | ||
| Bond Funds - 37.7% | |||
| Fidelity Series Emerging Markets Debt Fund (a) | 6,717 | 62,672 | |
| Fidelity Series Emerging Markets Debt Local Currency Fund (a) | 1,967 | 20,297 | |
| Fidelity Series Floating Rate High Income Fund (a) | 1,308 | 12,051 | |
| Fidelity Series High Income Fund (a) | 7,521 | 72,122 | |
| Fidelity Series Inflation-Protected Bond Index Fund (a) | 71,179 | 799,344 | |
| Fidelity Series International Credit Fund (a) | 322 | 3,271 | |
| Fidelity Series Investment Grade Bond Fund (a) | 248,453 | 2,941,683 | |
| Fidelity Series Long-Term Treasury Bond Index Fund (a) | 39,880 | 345,359 | |
| Fidelity Series Real Estate Income Fund (a) | 3,697 | 43,508 | |
| TOTAL BOND FUNDS | |||
| (Cost $4,217,701) | 4,300,307 | ||
| Short-Term Funds - 8.1% | |||
| Fidelity Series Government Money Market Fund 0.07% (a)(b) | 747,026 | 747,026 | |
| Fidelity Series Short-Term Credit Fund (a) | 16,858 | 171,612 | |
| TOTAL SHORT-TERM FUNDS | |||
| (Cost $918,252) | 918,638 | ||
| TOTAL INVESTMENT IN SECURITIES - 100.0% | |||
| (Cost $10,135,316) | 11,399,206 | ||
| NET OTHER ASSETS (LIABILITIES) - 0.0% | (287) | ||
| NET ASSETS - 100% | $11,398,919 |
Legend
(a) Affiliated Fund
(b) The rate quoted is the annualized seven-day yield of the fund at period end.
Affiliated Underlying Funds
Fiscal year to date information regarding the Fund's investments in affiliated Underlying Funds is presented below. Exchanges between classes of the same affiliated Underlying Funds may occur. If an underlying Fund changes its name, the name presented below is the name in effect at period end.
| Affiliate | Value, beginning of period | Purchases | Sales Proceeds | Dividend Income | Realized Gain (loss) | Change in Unrealized appreciation (depreciation) | Value, end of period |
| Fidelity Series All-Sector Equity Fund | $61,221 | $100,405 | $64,579 | $9,451 | $1,047 | $20,147 | $118,241 |
| Fidelity Series Blue Chip Growth Fund | 106,955 | 188,620 | 124,174 | 37,843 | 3,028 | 10,870 | 185,299 |
| Fidelity Series Canada Fund | 76,813 | 141,829 | 75,780 | 1,949 | 1,090 | 36,806 | 180,758 |
| Fidelity Series Commodity Strategy Fund | 142,236 | 264,533 | 173,629 | 742 | 5,011 | 70,838 | 308,989 |
| Fidelity Series Emerging Markets Debt Fund | 35,262 | 51,597 | 24,847 | 2,165 | (135) | 795 | 62,672 |
| Fidelity Series Emerging Markets Debt Local Currency Fund | -- | 27,838 | 7,723 | 211 | (70) | 252 | 20,297 |
| Fidelity Series Emerging Markets Fund | 62,604 | 101,086 | 64,696 | 1,103 | (284) | 12,428 | 111,138 |
| Fidelity Series Emerging Markets Opportunities Fund | 569,057 | 897,717 | 570,755 | 20,947 | 1,218 | 112,601 | 1,009,838 |
| Fidelity Series Floating Rate High Income Fund | 8,016 | 10,491 | 6,918 | 422 | 5 | 457 | 12,051 |
| Fidelity Series Government Money Market Fund 0.07% | 420,175 | 782,254 | 455,403 | 632 | -- | -- | 747,026 |
| Fidelity Series Growth Company Fund | 245,453 | 469,140 | 296,720 | 77,642 | 4,909 | 47,593 | 470,375 |
| Fidelity Series High Income Fund | 41,387 | 58,937 | 30,703 | 2,908 | 109 | 2,392 | 72,122 |
| Fidelity Series Inflation-Protected Bond Index Fund | 388,532 | 654,142 | 283,050 | 6,263 | 1,095 | 38,625 | 799,344 |
| Fidelity Series International Credit Fund | 2,814 | 540 | 16 | 214 | 1 | (68) | 3,271 |
| Fidelity Series International Growth Fund | 231,563 | 442,997 | 235,359 | 39,359 | 2,684 | 48,727 | 490,612 |
| Fidelity Series International Small Cap Fund | 68,415 | 108,721 | 59,987 | 749 | 898 | 33,031 | 151,078 |
| Fidelity Series International Value Fund | 230,864 | 417,419 | 246,822 | 7,698 | 4,664 | 80,470 | 486,595 |
| Fidelity Series Intrinsic Opportunities Fund | 248,953 | 416,778 | 311,637 | 12,727 | 6,254 | 124,938 | 485,286 |
| Fidelity Series Investment Grade Bond Fund | 1,431,741 | 2,672,999 | 1,110,429 | 106,947 | (11,802) | (40,826) | 2,941,683 |
| Fidelity Series Large Cap Stock Fund | 218,217 | 354,512 | 250,976 | 13,572 | 4,082 | 96,762 | 422,597 |
| Fidelity Series Large Cap Value Index Fund | 76,307 | 127,587 | 81,233 | 2,061 | 1,058 | 34,128 | 157,847 |
| Fidelity Series Long-Term Treasury Bond Index Fund | 131,274 | 354,543 | 116,353 | 16,648 | (8,759) | (15,346) | 345,359 |
| Fidelity Series Opportunistic Insights Fund | 126,057 | 217,143 | 128,097 | 24,012 | 2,229 | 26,443 | 243,775 |
| Fidelity Series Overseas Fund | 232,016 | 401,142 | 233,783 | 3,145 | 3,753 | 88,651 | 491,779 |
| Fidelity Series Real Estate Income Fund | 24,351 | 34,655 | 21,367 | 1,426 | (114) | 5,983 | 43,508 |
| Fidelity Series Short-Term Credit Fund | 60,183 | 158,866 | 46,816 | 1,760 | 51 | (672) | 171,612 |
| Fidelity Series Small Cap Discovery Fund | 27,090 | 46,527 | 32,298 | 5,727 | 668 | 11,043 | 53,030 |
| Fidelity Series Small Cap Opportunities Fund | 90,305 | 144,898 | 100,551 | 2,308 | 1,699 | 39,520 | 175,871 |
| Fidelity Series Stock Selector Large Cap Value Fund | 181,013 | 294,833 | 206,792 | 5,018 | 3,600 | 87,603 | 360,257 |
| Fidelity Series Value Discovery Fund | 137,460 | 223,206 | 151,960 | 3,758 | 2,680 | 65,510 | 276,896 |
| Total | $5,676,334 | $10,165,955 | $5,513,453 | $409,407 | $30,669 | $1,039,701 | $11,399,206 |
Amounts in the income column in the above table include any capital gain distributions from underlying funds, which are presented in the corresponding line-item in the Statement of Operations, if applicable.
Investment Valuation
The following is a summary of the inputs used, as of July 31, 2021, involving the Fund's assets and liabilities carried at fair value. The inputs or methodology used for valuing securities may not be an indication of the risk associated with investing in those securities. For more information on valuation inputs, and their aggregation into the levels used below, please refer to the Investment Valuation section in the accompanying Notes to Financial Statements.
| Valuation Inputs at Reporting Date: | ||||
| Description | Total | Level 1 | Level 2 | Level 3 |
| Investments in Securities: | ||||
| Domestic Equity Funds | $3,258,463 | $3,258,463 | $-- | $-- |
| International Equity Funds | 2,921,798 | 2,921,798 | -- | -- |
| Bond Funds | 4,300,307 | 4,300,307 | -- | -- |
| Short-Term Funds | 918,638 | 918,638 | -- | -- |
| Total Investments in Securities: | $11,399,206 | $11,399,206 | $-- | $-- |
See accompanying notes which are an integral part of the financial statements.
Fidelity Simplicity RMD 2025 Fund℠
Financial Statements
Statement of Assets and Liabilities
| July 31, 2021 | ||
| Assets | ||
| Investment in securities, at value — See accompanying schedule: | ||
| Affiliated issuers (cost $10,135,316) | $11,399,206 | |
| Total Investment in Securities (cost $10,135,316) | $11,399,206 | |
| Receivable for investments sold | 67,496 | |
| Receivable for fund shares sold | 10,000 | |
| Total assets | 11,476,702 | |
| Liabilities | ||
| Payable for investments purchased | $70,950 | |
| Payable for fund shares redeemed | 804 | |
| Accrued management fee | 6,029 | |
| Total liabilities | 77,783 | |
| Net Assets | $11,398,919 | |
| Net Assets consist of: | ||
| Paid in capital | $9,960,808 | |
| Total accumulated earnings (loss) | 1,438,111 | |
| Net Assets | $11,398,919 | |
| Net Asset Value, offering price and redemption price per share ($11,398,919 ÷ 906,892 shares) | $12.57 |
See accompanying notes which are an integral part of the financial statements.
Statement of Operations
| Year ended July 31, 2021 | ||
| Investment Income | ||
| Dividends: | ||
| Affiliated issuers | $116,806 | |
| Expenses | ||
| Management fee | $53,524 | |
| Independent trustees' fees and expenses | 22 | |
| Total expenses | 53,546 | |
| Net investment income (loss) | 63,260 | |
| Realized and Unrealized Gain (Loss) | ||
| Net realized gain (loss) on: | ||
| Investment securities: | ||
| Affiliated issuers | 30,669 | |
| Capital gain distributions from underlying funds: | ||
| Affiliated issuers | 292,601 | |
| Total net realized gain (loss) | 323,270 | |
| Change in net unrealized appreciation (depreciation) on: | ||
| Investment securities: | ||
| Affiliated issuers | 1,039,701 | |
| Total change in net unrealized appreciation (depreciation) | 1,039,701 | |
| Net gain (loss) | 1,362,971 | |
| Net increase (decrease) in net assets resulting from operations | $1,426,231 |
See accompanying notes which are an integral part of the financial statements.
Statement of Changes in Net Assets
| Year ended July 31, 2021 | For the period August 16, 2019 (commencement of operations) to July 31, 2020 |
|
| Increase (Decrease) in Net Assets | ||
| Operations | ||
| Net investment income (loss) | $63,260 | $35,064 |
| Net realized gain (loss) | 323,270 | 6,715 |
| Change in net unrealized appreciation (depreciation) | 1,039,701 | 224,189 |
| Net increase (decrease) in net assets resulting from operations | 1,426,231 | 265,968 |
| Distributions to shareholders | (211,257) | (42,833) |
| Share transactions | ||
| Proceeds from sales of shares | 8,879,773 | 6,026,202 |
| Reinvestment of distributions | 200,392 | 42,481 |
| Cost of shares redeemed | (4,572,418) | (615,620) |
| Net increase (decrease) in net assets resulting from share transactions | 4,507,747 | 5,453,063 |
| Total increase (decrease) in net assets | 5,722,721 | 5,676,198 |
| Net Assets | ||
| Beginning of period | 5,676,198 | – |
| End of period | $11,398,919 | $5,676,198 |
| Other Information | ||
| Shares | ||
| Sold | 736,629 | 584,677 |
| Issued in reinvestment of distributions | 17,430 | 4,053 |
| Redeemed | (374,257) | (61,640) |
| Net increase (decrease) | 379,802 | 527,090 |
See accompanying notes which are an integral part of the financial statements.
Financial Highlights
Fidelity Simplicity RMD 2025 Fund
| Years ended July 31, | 2021 | 2020 A |
| Selected Per–Share Data | ||
| Net asset value, beginning of period | $10.77 | $10.00 |
| Income from Investment Operations | ||
| Net investment income (loss)B | .088 | .118 |
| Net realized and unrealized gain (loss) | 2.054 | .822 |
| Total from investment operations | 2.142 | .940 |
| Distributions from net investment income | (.106) | (.134) |
| Distributions from net realized gain | (.236) | (.036) |
| Total distributions | (.342) | (.170) |
| Net asset value, end of period | $12.57 | $10.77 |
| Total ReturnC | 20.21% | 9.45% |
| Ratios to Average Net AssetsD,E | ||
| Expenses before reductions | .63% | .64%F |
| Expenses net of fee waivers, if any | .63% | .64%F |
| Expenses net of all reductions | .63% | .64%F |
| Net investment income (loss) | .74% | 1.21%F |
| Supplemental Data | ||
| Net assets, end of period (000 omitted) | $11,399 | $5,676 |
| Portfolio turnover rateG | 66% | 54%F |
A For the period August 16, 2019 (commencement of operations) to July 31, 2020.
B Calculated based on average shares outstanding during the period.
C Total returns for periods of less than one year are not annualized.
D Fees and expenses of any underlying mutual funds or exchange-traded funds (ETFs) are not included in the Fund's expense ratio. The Fund indirectly bears its proportionate share of these expenses.
E Expense ratios reflect operating expenses of the class. Expenses before reductions do not reflect amounts reimbursed, waived, or reduced through arrangements with the investment advisor, brokerage services, or other offset arrangements, if applicable, and do not represent the amount paid by the class during periods when reimbursements, waivers or reductions occur.
F Annualized
G Amount does not include the portfolio activity of any underlying mutual funds or exchange-traded funds (ETFs).
See accompanying notes which are an integral part of the financial statements.
Notes to Financial Statements
For the period ended July 31, 2021
1. Organization.
Fidelity Simplicity RMD Income Fund, Fidelity Simplicity RMD 2010 Fund, Fidelity Simplicity RMD 2015 Fund, Fidelity Simplicity RMD 2020 Fund and Fidelity Simplicity RMD 2025 Fund (the Funds) are funds of Fidelity Income Fund (the Trust). The Trust is registered under the Investment Company Act of 1940, as amended (the 1940 Act), as an open-end management investment company organized as a Massachusetts business trust. Each Fund is authorized to issue an unlimited number of shares.
2. Significant Accounting Policies.
Each Fund is an investment company and applies the accounting and reporting guidance of the Financial Accounting Standards Board (FASB) Accounting Standards Codification Topic 946 Financial Services - Investment Companies. The financial statements have been prepared in conformity with accounting principles generally accepted in the United States of America (GAAP), which require management to make certain estimates and assumptions at the date of the financial statements. Actual results could differ from those estimates. Subsequent events, if any, through the date that the financial statements were issued have been evaluated in the preparation of the financial statements. Each Fund's Schedule of Investments lists any underlying mutual funds or exchange-traded funds (ETFs) but does not include the underlying holdings of these funds. The following summarizes the significant accounting policies of each Fund:
Investment Valuation. Investments are valued as of 4:00 p.m. Eastern time on the last calendar day of the period. Each Fund categorizes the inputs to valuation techniques used to value its investments into a disclosure hierarchy consisting of three levels as shown below:
- Level 1 – quoted prices in active markets for identical investments
- Level 2 – other significant observable inputs (including quoted prices for similar investments, interest rates, prepayment speeds, etc.)
- Level 3 – unobservable inputs (including the Fund's own assumptions based on the best information available)
Valuation techniques used to value each Fund's investments by major category are as follows. Investments in open-end mutual funds are valued at their closing net asset value (NAV) each business day and are categorized as Level 1 in the hierarchy. The aggregate value of investments by input level as of July 31, 2021 is included at the end of each Fund's Schedule of Investments.
Investment Transactions and Income. For financial reporting purposes, the Funds' investment holdings and NAV include trades executed through the end of the last business day of the period. The NAV per share for processing shareholder transactions is calculated as of the close of business of the New York Stock Exchange (NYSE), normally 4:00 p.m. Eastern time and includes trades executed through the end of the prior business day. Gains and losses on securities sold are determined on the basis of identified cost. Income and capital gain distributions from any underlying mutual funds or exchange-traded funds (ETFs) are recorded on the ex-dividend date.
Expenses. Expenses directly attributable to a fund are charged to that fund. Expenses attributable to more than one fund are allocated among the respective funds on the basis of relative net assets or other appropriate methods. Expenses included in the accompanying financial statements reflect the expenses of that fund and do not include any expenses associated with any underlying mutual funds or exchange-traded funds. Although not included in a fund's expenses, a fund indirectly bears its proportionate share of these expenses through the net asset value of each underlying mutual fund or exchange-traded fund. Expense estimates are accrued in the period to which they relate and adjustments are made when actual amounts are known.
Income Tax Information and Distributions to Shareholders. Each year, each Fund intends to qualify as a regulated investment company under Subchapter M of the Internal Revenue Code, including distributing substantially all of its taxable income and realized gains. As a result, no provision for U.S. Federal income taxes is required. As of July 31, 2021, each Fund did not have any unrecognized tax benefits in the financial statements; nor is each Fund aware of any tax positions for which it is reasonably possible that the total amounts of unrecognized tax benefits will significantly change in the next twelve months. Each Fund files a U.S. federal tax return, in addition to state and local tax returns as required. Each Fund's federal income tax returns are subject to examination by the Internal Revenue Service (IRS) for a period of three fiscal years after they are filed. State and local tax returns may be subject to examination for an additional fiscal year depending on the jurisdiction.
Distributions are declared and recorded on the ex-dividend date. Income and capital gain distributions are determined in accordance with income tax regulations, which may differ from GAAP. In addition, certain Funds claimed a portion of the payment made to redeeming shareholders as a distribution for income tax purposes.
Capital accounts within the financial statements are adjusted for permanent book-tax differences. These adjustments have no impact on net assets or the results of operations. Capital accounts are not adjusted for temporary book-tax differences which will reverse in a subsequent period.
Book-tax differences are primarily due to the short-term gain distributions from the underlying mutual funds or exchange-traded funds (ETFs) and losses deferred due to wash sales.
As of period end, the cost and unrealized appreciation (depreciation) in securities, and derivatives if applicable, for federal income tax purposes were as follows for each Fund:
| Tax cost | Gross unrealized appreciation | Gross unrealized depreciation | Net unrealized appreciation (depreciation) | |
| Fidelity Simplicity RMD Income Fund | $42,476,571 | $3,843,540 | $(96,123) | $3,747,417 |
| Fidelity Simplicity RMD 2010 Fund | 13,499,502 | 1,348,465 | (22,057) | 1,326,408 |
| Fidelity Simplicity RMD 2015 Fund | 28,012,611 | 3,443,126 | (79,282) | 3,363,844 |
| Fidelity Simplicity RMD 2020 Fund | 59,246,163 | 8,504,058 | (137,805) | 8,366,253 |
| Fidelity Simplicity RMD 2025 Fund | 10,192,575 | 1,266,274 | (59,643) | 1,206,631 |
The tax-based components of distributable earnings as of period end were as follows for each Fund:
| Undistributed ordinary income | Undistributed long-term capital gain | Net unrealized appreciation (depreciation) on securities and other investments | |
| Fidelity Simplicity RMD Income Fund | $30,428 | $592,907 | $3,747,417 |
| Fidelity Simplicity RMD 2010 Fund | 8,101 | 193,373 | 1,326,408 |
| Fidelity Simplicity RMD 2015 Fund | 42,298 | 526,524 | 3,363,844 |
| Fidelity Simplicity RMD 2020 Fund | 16,491 | 1,290,586 | 8,366,253 |
| Fidelity Simplicity RMD 2025 Fund | 45,755 | 185,724 | 1,206,631 |
Due to large subscriptions in a prior period, Fidelity Simplicity RMD 2025 Fund is subject to an annual limit on its use of some of its unrealized capital losses to offset capital gains in future periods. If those capital losses are realized and the limitation prevents the Fund from using any of those capital losses in a future period, those capital losses will be available to offset capital gains in subsequent periods.
The tax character of distributions paid was as follows:
| July 31, 2021 | |||
| Ordinary Income | Long-term Capital Gains | Total | |
| Fidelity Simplicity RMD Income Fund | $767,424 | $402,504 | $1,169,928 |
| Fidelity Simplicity RMD 2010 Fund | 211,207 | 149,560 | 360,767 |
| Fidelity Simplicity RMD 2015 Fund | 427,874 | 370,938 | 798,812 |
| Fidelity Simplicity RMD 2020 Fund | 896,639 | 760,896 | 1,657,535 |
| Fidelity Simplicity RMD 2025 Fund | 120,636 | 90,621 | 211,257 |
| July 31, 2020 | |||
| Ordinary Income | Long-term Capital Gains | Total | |
| Fidelity Simplicity RMD Income Fund | $434,455 | $159,677 | $594,132 |
| Fidelity Simplicity RMD 2010 Fund | 213,600 | 136,727 | 350,327 |
| Fidelity Simplicity RMD 2015 Fund | 385,762 | 357,866 | 743,628 |
| Fidelity Simplicity RMD 2020 Fund | 839,048 | 927,622 | 1,766,670 |
| Fidelity Simplicity RMD 2025 Fund(a) | 38,218 | 4,615 | 42,833 |
(a) For the period August 16, 2019 (commencement of operations) to July 31, 2020.
3. Purchases and Sales of Investments.
Purchases and sales of securities, other than short-term securities and in-kind transactions, as applicable, are noted in the table below.
| Purchases ($) | Sales ($) | |
| Fidelity Simplicity RMD Income Fund | 20,373,705 | 15,980,201 |
| Fidelity Simplicity RMD 2010 Fund | 7,067,344 | 4,153,769 |
| Fidelity Simplicity RMD 2015 Fund | 15,735,075 | 8,275,711 |
| Fidelity Simplicity RMD 2020 Fund | 32,101,910 | 20,297,175 |
| Fidelity Simplicity RMD 2025 Fund | 10,165,955 | 5,513,453 |
4. Fees and Other Transactions with Affiliates.
Management Fee. Fidelity Management & Research Company LLC (the investment adviser) and its affiliates provide the Funds with investment management related services. Under the management contract, each Fund pays a monthly management fee that is set at an annual rate by referring to each Fund's horizon date indicated by its name, such that the management fee rate applicable to each Fund is reduced as the fund approaches, and then passes, its horizon date. In addition, the investment adviser pays all ordinary operating expenses of each Fund, except fees and expenses of the independent Trustees, and certain miscellaneous expenses such as proxy and shareholder meeting expenses.
For the reporting period, the total annual management fee rate for each Fund was as follows:
| Fidelity Simplicity RMD Income Fund | .46% |
| Fidelity Simplicity RMD 2010 Fund | .50% |
| Fidelity Simplicity RMD 2015 Fund | .55% |
| Fidelity Simplicity RMD 2020 Fund | .59% |
| Fidelity Simplicity RMD 2025 Fund | .63% |
Interfund Trades. Funds may purchase from or sell securities to other Fidelity Funds under procedures adopted by the Board. The procedures have been designed to ensure these interfund trades are executed in accordance with Rule 17a-7 of the 1940 Act. Any interfund trades are included within the respective purchases and sales amounts shown in the Purchases and Sales of Investments note.
5. Other.
Fund's organizational documents provide former and current trustees and officers with a limited indemnification against liabilities arising in connection with the performance of their duties to the fund. In the normal course of business, the fund may also enter into contracts that provide general indemnifications. The fund's maximum exposure under these arrangements is unknown as this would be dependent on future claims that may be made against the fund. The risk of material loss from such claims is considered remote.
6. Coronavirus (COVID-19) Pandemic.
An outbreak of COVID-19 first detected in China during December 2019 has since spread globally and was declared a pandemic by the World Health Organization during March 2020. Developments that disrupt global economies and financial markets, such as the COVID-19 pandemic, may magnify factors that affect the Funds' performance.
7. Prior Fiscal Year Merger Information.
On July 17, 2020, Fidelity Simplicity RMD Income Fund acquired all of the assets and assumed all of the liabilities of Fidelity Simplicity RMD 2005 Fund ("Target Fund") pursuant to an Agreement and Plan of Reorganization approved by the Board of Trustees ("The Board"). The acquisition was accomplished by an exchange of shares of Fidelity Simplicity RMD Income Fund for shares then outstanding of the Target Fund at its respective net asset value on the acquisition date. The reorganization provides shareholders of the Target Fund access to a larger portfolio with a similar investment objective and lower expenses. The reorganization qualified as a tax-free reorganization for federal income tax purposes with no gain or loss recognized to the funds or their shareholders. The Target Fund's net assets of $15,422,197, including securities of $15,415,464 and unrealized appreciation of $834,383, was combined with Fidelity Simplicity RMD Income Fund's net assets of $24,003,631 for total net assets after the acquisition of $39,425,828.
Pro forma results of operations of the combined entity for the entire period ended July 31, 2020, as though the acquisition had occurred as of the beginning of the year (rather than on the actual acquisition date), are as follows:
| Net investment income (loss) | $653,031 |
| Total net realized gain (loss) | 231,952 |
| Total change in net unrealized appreciation (depreciation) | 1,712,194 |
| Net increase (decrease) in net assets resulting from operations | $2,597,177 |
Because the combined investment portfolios have been managed as a single portfolio since the acquisition was completed, it is not practicable to separate the amounts of revenue and earnings of the acquired fund that has been included in Fidelity Simplicity RMD Income Fund's Statement of Operations since July 17, 2020.
Report of Independent Registered Public Accounting Firm
To the Board of Trustees of Fidelity Income Fund and the Shareholders of Fidelity Simplicity RMD Income Fund, Fidelity Simplicity RMD 2010 Fund, Fidelity Simplicity RMD 2015 Fund, Fidelity Simplicity RMD 2020 Fund and Fidelity Simplicity RMD 2025 Fund
Opinion on the Financial Statements and Financial Highlights
We have audited the accompanying statements of assets and liabilities of Fidelity Simplicity RMD Income Fund, Fidelity Simplicity RMD 2010 Fund, Fidelity Simplicity RMD 2015 Fund, Fidelity Simplicity RMD 2020 Fund and Fidelity Simplicity RMD 2025 Fund (the "Funds"), each a fund of Fidelity Income Fund, including the schedules of investments, as of July 31, 2021, the related statements of operations for the year then ended, the statements of changes in net assets for each of the two years in the period then ended, the financial highlights for each of the five years in the period then ended, except for the statement of changes in net assets, and the financial highlights for the Fidelity Simplicity RMD 2025 Fund, which are for the year ended July 31, 2021, and for the period from August 16, 2019 (commencement of operations) through July 31, 2020; and the related notes. In our opinion, the financial statements and financial highlights present fairly, in all material respects, the financial position of each of the Funds as of July 31, 2021, and the results of their operations for the year then ended, the changes in their net assets for each of the two years in the period then ended, and the financial highlights for each of the five years in the period then ended (or for the period mentioned above), in conformity with accounting principles generally accepted in the United States of America.
Basis for Opinion
These financial statements and financial highlights are the responsibility of the Funds’ management. Our responsibility is to express an opinion on the Funds’ financial statements and financial highlights based on our audits. We are a public accounting firm registered with the Public Company Accounting Oversight Board (United States) (PCAOB) and are required to be independent with respect to the Funds in accordance with the U.S. federal securities laws and the applicable rules and regulations of the Securities and Exchange Commission and the PCAOB.
We conducted our audits in accordance with the standards of the PCAOB. Those standards require that we plan and perform the audit to obtain reasonable assurance about whether the financial statements and financial highlights are free of material misstatement, whether due to error or fraud. The Funds are not required to have, nor were we engaged to perform, an audit of their internal control over financial reporting. As part of our audits we are required to obtain an understanding of internal control over financial reporting but not for the purpose of expressing an opinion on the effectiveness of the Funds’ internal control over financial reporting. Accordingly, we express no such opinion.
Our audits included performing procedures to assess the risks of material misstatement of the financial statements and financial highlights, whether due to error or fraud, and performing procedures that respond to those risks. Such procedures included examining, on a test basis, evidence regarding the amounts and disclosures in the financial statements and financial highlights. Our audits also included evaluating the accounting principles used and significant estimates made by management, as well as evaluating the overall presentation of the financial statements and financial highlights. Our procedures included confirmation of securities owned as of July 31, 2021, by correspondence with the custodian and brokers; when replies were not received from brokers, we performed other auditing procedures. We believe that our audits provide a reasonable basis for our opinion.
/s/ Deloitte & Touche LLP
Boston, Massachusetts
September 10, 2021
We have served as the auditor of one or more of the Fidelity investment companies since 1999.
Trustees and Officers
The Trustees, Members of the Advisory Board (if any), and officers of the trust and funds, as applicable, are listed below. The Board of Trustees governs each fund and is responsible for protecting the interests of shareholders. The Trustees are experienced executives who meet periodically throughout the year to oversee each fund's activities, review contractual arrangements with companies that provide services to each fund, oversee management of the risks associated with such activities and contractual arrangements, and review each fund's performance. If the interests of a fund and an underlying Fidelity® fund were to diverge, a conflict of interest could arise and affect how the Trustees and Members of the Advisory Board fulfill their fiduciary duties to the affected funds. FMR has structured the funds to avoid these potential conflicts, although there may be situations where a conflict of interest is unavoidable. In such instances, FMR, the Trustees, and Members of the Advisory Board would take reasonable steps to minimize and, if possible, eliminate the conflict. Each of the Trustees oversees 283 funds.
The Trustees hold office without limit in time except that (a) any Trustee may resign; (b) any Trustee may be removed by written instrument, signed by at least two-thirds of the number of Trustees prior to such removal; (c) any Trustee who requests to be retired or who has become incapacitated by illness or injury may be retired by written instrument signed by a majority of the other Trustees; and (d) any Trustee may be removed at any special meeting of shareholders by a two-thirds vote of the outstanding voting securities of the trust. Each Trustee who is not an interested person (as defined in the 1940 Act) of the trust and the funds is referred to herein as an Independent Trustee. Each Independent Trustee shall retire not later than the last day of the calendar year in which his or her 75th birthday occurs. The Independent Trustees may waive this mandatory retirement age policy with respect to individual Trustees. Officers and Advisory Board Members hold office without limit in time, except that any officer or Advisory Board Member may resign or may be removed by a vote of a majority of the Trustees at any regular meeting or any special meeting of the Trustees. Except as indicated, each individual has held the office shown or other offices in the same company for the past five years.
Each fund’s Statement of Additional Information (SAI) includes more information about the Trustees. To request a free copy, call Fidelity at 1-800-544-8544.
Experience, Skills, Attributes, and Qualifications of the Trustees. The Governance and Nominating Committee has adopted a statement of policy that describes the experience, qualifications, attributes, and skills that are necessary and desirable for potential Independent Trustee candidates (Statement of Policy). The Board believes that each Trustee satisfied at the time he or she was initially elected or appointed a Trustee, and continues to satisfy, the standards contemplated by the Statement of Policy. The Governance and Nominating Committee also engages professional search firms to help identify potential Independent Trustee candidates who have the experience, qualifications, attributes, and skills consistent with the Statement of Policy. From time to time, additional criteria based on the composition and skills of the current Independent Trustees, as well as experience or skills that may be appropriate in light of future changes to board composition, business conditions, and regulatory or other developments, have also been considered by the professional search firms and the Governance and Nominating Committee. In addition, the Board takes into account the Trustees' commitment and participation in Board and committee meetings, as well as their leadership of standing and ad hoc committees throughout their tenure.
In determining that a particular Trustee was and continues to be qualified to serve as a Trustee, the Board has considered a variety of criteria, none of which, in isolation, was controlling. The Board believes that, collectively, the Trustees have balanced and diverse experience, qualifications, attributes, and skills, which allow the Board to operate effectively in governing each fund and protecting the interests of shareholders. Information about the specific experience, skills, attributes, and qualifications of each Trustee, which in each case led to the Board's conclusion that the Trustee should serve (or continue to serve) as a trustee of the funds, is provided below.
Board Structure and Oversight Function. Abigail P. Johnson is an interested person and currently serves as Chairman. The Trustees have determined that an interested Chairman is appropriate and benefits shareholders because an interested Chairman has a personal and professional stake in the quality and continuity of services provided to the funds. Independent Trustees exercise their informed business judgment to appoint an individual of their choosing to serve as Chairman, regardless of whether the Trustee happens to be independent or a member of management. The Independent Trustees have determined that they can act independently and effectively without having an Independent Trustee serve as Chairman and that a key structural component for assuring that they are in a position to do so is for the Independent Trustees to constitute a substantial majority for the Board. The Independent Trustees also regularly meet in executive session. Arthur E. Johnson serves as Chairman of the Independent Trustees and as such (i) acts as a liaison between the Independent Trustees and management with respect to matters important to the Independent Trustees and (ii) with management prepares agendas for Board meetings.
Fidelity® funds are overseen by different Boards of Trustees. The funds' Board oversees Fidelity's investment-grade bond, money market, asset allocation and certain equity funds, and other Boards oversee Fidelity's high income and other equity funds. The asset allocation funds may invest in Fidelity® funds that are overseen by such other Boards. The use of separate Boards, each with its own committee structure, allows the Trustees of each group of Fidelity® funds to focus on the unique issues of the funds they oversee, including common research, investment, and operational issues. On occasion, the separate Boards establish joint committees to address issues of overlapping consequences for the Fidelity® funds overseen by each Board.
The Trustees operate using a system of committees to facilitate the timely and efficient consideration of all matters of importance to the Trustees, each fund, and fund shareholders and to facilitate compliance with legal and regulatory requirements and oversight of the funds' activities and associated risks. The Board, acting through its committees, has charged FMR and its affiliates with (i) identifying events or circumstances the occurrence of which could have demonstrably adverse effects on the funds' business and/or reputation; (ii) implementing processes and controls to lessen the possibility that such events or circumstances occur or to mitigate the effects of such events or circumstances if they do occur; and (iii) creating and maintaining a system designed to evaluate continuously business and market conditions in order to facilitate the identification and implementation processes described in (i) and (ii) above. Because the day-to-day operations and activities of the funds are carried out by or through FMR, its affiliates, and other service providers, the funds' exposure to risks is mitigated but not eliminated by the processes overseen by the Trustees. While each of the Board's committees has responsibility for overseeing different aspects of the funds' activities, oversight is exercised primarily through the Operations and Audit Committees. In addition, an ad hoc Board committee of Independent Trustees has worked with FMR to enhance the Board's oversight of investment and financial risks, legal and regulatory risks, technology risks, and operational risks, including the development of additional risk reporting to the Board. Appropriate personnel, including but not limited to the funds' Chief Compliance Officer (CCO), FMR's internal auditor, the independent accountants, the funds' Treasurer and portfolio management personnel, make periodic reports to the Board's committees, as appropriate, including an annual review of Fidelity's risk management program for the Fidelity® funds. The responsibilities of each standing committee, including their oversight responsibilities, are described further under "Standing Committees of the Trustees."
Interested Trustees*:
Correspondence intended for a Trustee who is an interested person may be sent to Fidelity Investments, 245 Summer Street, Boston, Massachusetts 02210.
Name, Year of Birth; Principal Occupations and Other Relevant Experience+
Abigail P. Johnson (1961)
Year of Election or Appointment: 2009
Trustee
Chairman of the Board of Trustees
Ms. Johnson also serves as Trustee of other Fidelity® funds. Ms. Johnson serves as Chairman (2016-present), Chief Executive Officer (2014-present), and Director (2007-present) of FMR LLC (diversified financial services company), President of Fidelity Financial Services (2012-present) and President of Personal, Workplace and Institutional Services (2005-present). Ms. Johnson is Chairman and Director of Fidelity Management & Research Company LLC (investment adviser firm, 2011-present). Previously, Ms. Johnson served as Chairman and Director of FMR Co., Inc. (investment adviser firm, 2011-2019), Vice Chairman (2007-2016) and President (2013-2016) of FMR LLC, President and a Director of Fidelity Management & Research Company (2001-2005), a Trustee of other investment companies advised by Fidelity Management & Research Company, Fidelity Investments Money Management, Inc. (investment adviser firm), and FMR Co., Inc. (2001-2005), Senior Vice President of the Fidelity® funds (2001-2005), and managed a number of Fidelity® funds. Ms. Abigail P. Johnson and Mr. Arthur E. Johnson are not related.
Jennifer Toolin McAuliffe (1959)
Year of Election or Appointment: 2016
Trustee
Ms. McAuliffe also serves as Trustee of other Fidelity® funds and as Trustee of Fidelity Charitable (2020-present). Previously, Ms. McAuliffe served as Co-Head of Fixed Income of Fidelity Investments Limited (now known as FIL Limited (FIL)) (diversified financial services company), Director of Research for FIL’s credit and quantitative teams in London, Hong Kong and Tokyo and Director of Research for taxable and municipal bonds at Fidelity Investments Money Management, Inc. Ms. McAuliffe previously served as a member of the Advisory Board of certain Fidelity® funds (2016). Ms. McAuliffe was previously a lawyer at Ropes & Gray LLP and currently serves as director or trustee of several not-for-profit entities.
* Determined to be an “Interested Trustee” by virtue of, among other things, his or her affiliation with the trust or various entities under common control with FMR.
+ The information includes the Trustee's principal occupation during the last five years and other information relating to the experience, attributes, and skills relevant to the Trustee's qualifications to serve as a Trustee, which led to the conclusion that the Trustee should serve as a Trustee for each fund.
Independent Trustees:
Correspondence intended for an Independent Trustee may be sent to Fidelity Investments, P.O. Box 55235, Boston, Massachusetts 02205-5235.
Name, Year of Birth; Principal Occupations and Other Relevant Experience+
Elizabeth S. Acton (1951)
Year of Election or Appointment: 2013
Trustee
Ms. Acton also serves as Trustee of other Fidelity® funds. Prior to her retirement, Ms. Acton served as Executive Vice President, Finance (2011-2012), Executive Vice President, Chief Financial Officer (2002-2011) and Treasurer (2004-2005) of Comerica Incorporated (financial services). Prior to joining Comerica, Ms. Acton held a variety of positions at Ford Motor Company (1983-2002), including Vice President and Treasurer (2000-2002) and Executive Vice President and Chief Financial Officer of Ford Motor Credit Company (1998-2000). Ms. Acton currently serves as a member of the Board and Audit and Finance Committees of Beazer Homes USA, Inc. (homebuilding, 2012-present). Ms. Acton previously served as a member of the Advisory Board of certain Fidelity® funds (2013-2016).
Ann E. Dunwoody (1953)
Year of Election or Appointment: 2018
Trustee
General Dunwoody also serves as Trustee of other Fidelity® funds. General Dunwoody (United States Army, Retired) was the first woman in U.S. military history to achieve the rank of four-star general and prior to her retirement in 2012 held a variety of positions within the U.S. Army, including Commanding General, U.S. Army Material Command (2008-2012). General Dunwoody currently serves as President of First to Four LLC (leadership and mentoring services, 2012-present), a member of the Board and Nomination and Corporate Governance Committees of Kforce Inc. (professional staffing services, 2016-present) and a member of the Board of Automattic Inc. (software engineering, 2018-present). Previously, General Dunwoody served as a member of the Advisory Board and Nominating and Corporate Governance Committee of L3 Technologies, Inc. (communication, electronic, sensor and aerospace systems, 2013-2019) and a member of the Board and Audit and Sustainability and Corporate Responsibility Committees of Republic Services, Inc. (waste collection, disposal and recycling, 2013-2016). Ms. Dunwoody also serves on several boards for non-profit organizations, including as a member of the Board, Chair of the Nomination and Governance Committee and a member of the Audit Committee of Logistics Management Institute (consulting non-profit, 2012-present), a member of the Council of Trustees for the Association of the United States Army (advocacy non-profit, 2013-present), a member of the Board of Florida Institute of Technology (2015-present) and a member of the Board of ThanksUSA (military family education non-profit, 2014-present). General Dunwoody previously served as a member of the Advisory Board of certain Fidelity® funds (2018).
John Engler (1948)
Year of Election or Appointment: 2014
Trustee
Mr. Engler also serves as Trustee of other Fidelity® funds. Previously, Mr. Engler served as Governor of Michigan (1991-2003), President of the Business Roundtable (2011-2017) and interim President of Michigan State University (2018-2019). Mr. Engler currently serves as a member of the Board of Stride, Inc. (formerly K12 Inc.) (technology-based education company, 2012-present). Previously, Mr. Engler served as a member of the Board of Universal Forest Products (manufacturer and distributor of wood and wood-alternative products, 2003-2019) and Trustee of The Munder Funds (2003-2014). Mr. Engler previously served as a member of the Advisory Board of certain Fidelity® funds (2014-2016).
Robert F. Gartland (1951)
Year of Election or Appointment: 2010
Trustee
Mr. Gartland also serves as Trustee of other Fidelity® funds. Prior to his retirement, Mr. Gartland held a variety of positions at Morgan Stanley (financial services, 1979-2007), including Managing Director (1987-2007) and Chase Manhattan Bank (1975-1978). Mr. Gartland previously served as Chairman and an investor in Gartland & Mellina Group Corp. (consulting, 2009-2019), as a member of the Board of National Securities Clearing Corporation (1993-1996) and as Chairman of TradeWeb (2003-2004).
Arthur E. Johnson (1947)
Year of Election or Appointment: 2008
Trustee
Chairman of the Independent Trustees
Mr. Johnson also serves as Trustee of other Fidelity® funds. Prior to his retirement, Mr. Johnson served as Senior Vice President of Corporate Strategic Development of Lockheed Martin Corporation (defense contractor, 1999-2009). Mr. Johnson currently serves as a member of the Board of Booz Allen Hamilton (management consulting, 2011-present). Mr. Johnson previously served as a member of the Board of Eaton Corporation plc (diversified power management, 2009-2019) and a member of the Board of AGL Resources, Inc. (holding company, 2002-2016). Mr. Johnson previously served as Vice Chairman (2015-2018) of the Independent Trustees of certain Fidelity® funds. Mr. Arthur E. Johnson is not related to Ms. Abigail P. Johnson.
Michael E. Kenneally (1954)
Year of Election or Appointment: 2009
Trustee
Vice Chairman of the Independent Trustees
Mr. Kenneally also serves as Trustee of other Fidelity® funds. Prior to his retirement, Mr. Kenneally served as Chairman and Global Chief Executive Officer of Credit Suisse Asset Management and as Executive Vice President and Chief Investment Officer for Bank of America Corporation, where he was responsible for the bank’s money-management products. Previously at Bank of America, Mr. Kenneally managed the principal investment research functions and also spent more than a decade as portfolio manager for various equity and fixed-income funds and institutional accounts. He began his career as a research analyst in 1983 and was awarded the Chartered Financial Analyst (CFA) designation in 1991.
Marie L. Knowles (1946)
Year of Election or Appointment: 2001
Trustee
Ms. Knowles also serves as Trustee of other Fidelity® funds. Prior to her retirement, Ms. Knowles held several positions at Atlantic Richfield Company (diversified energy), including Executive Vice President and Chief Financial Officer (1996-2000), Senior Vice President (1993-1996) and President of ARCO Transportation Company (pipeline and tanker operations, 1993-1996). Ms. Knowles currently serves as a member of the Board of McKesson Corporation (healthcare service, since 2002), a member of the Board of the Santa Catalina Island Company (real estate, 2009-present), a member of the Investment Company Institute Board of Governors and a member of the Governing Council of the Independent Directors Council (2014-present). Ms. Knowles also serves as a member of the Advisory Board for the School of Engineering of the University of Southern California. Ms. Knowles previously served as Chairman (2015-2018) and Vice Chairman (2012-2015) of the Independent Trustees of certain Fidelity® funds.
Mark A. Murray (1954)
Year of Election or Appointment: 2016
Trustee
Mr. Murray also serves as Trustee of other Fidelity® funds. Previously, Mr. Murray served as Co-Chief Executive Officer (2013-2016), President (2006-2013) and Vice Chairman (2013-2020) of Meijer, Inc. Mr. Murray serves as a member of the Board (2009-present) and Public Policy and Responsibility Committee (2009-present) and Chair of the Nuclear Review Committee (2019-present) of DTE Energy Company (diversified energy company). Mr. Murray previously served as a member of the Board of Spectrum Health (not-for-profit health system, 2015-2019) and as a member of the Board and Audit Committee and Chairman of the Nominating and Corporate Governance Committee of Universal Forest Products, Inc. (manufacturer and distributor of wood and wood-alternative products, 2004-2016). Mr. Murray also serves as a member of the Board of many community and professional organizations. Mr. Murray previously served as a member of the Advisory Board of certain Fidelity® funds (2016).
+ The information includes the Trustee's principal occupation during the last five years and other information relating to the experience, attributes, and skills relevant to the Trustee's qualifications to serve as a Trustee, which led to the conclusion that the Trustee should serve as a Trustee for each fund.
Advisory Board Members and Officers:
Correspondence intended for an officer may be sent to Fidelity Investments, 245 Summer Street, Boston, Massachusetts 02210. Officers appear below in alphabetical order.
Name, Year of Birth; Principal Occupation
Robert W. Helm (1957)
Year of Election or Appointment: 2021
Member of the Advisory Board
Mr. Helm also serves as a Member of the Advisory Board of other Fidelity® funds. Mr. Helm was formerly Deputy Chairman (2003-2020), partner (1991-2020) and an associate (1984-1991) of Dechert LLP (formerly Dechert Price & Rhoads). Mr. Helm currently serves on boards and committees of several not-for-profit organizations.
Craig S. Brown (1977)
Year of Election or Appointment: 2019
Assistant Treasurer
Mr. Brown also serves as an officer of other funds. Mr. Brown serves as Assistant Treasurer of FIMM, LLC (2021-present) and is an employee of Fidelity Investments (2013-present).
John J. Burke III (1964)
Year of Election or Appointment: 2018
Chief Financial Officer
Mr. Burke also serves as Chief Financial Officer of other funds. Mr. Burke serves as Head of Investment Operations for Fidelity Fund and Investment Operations (2018-present) and is an employee of Fidelity Investments (1998-present). Previously Mr. Burke served as head of Asset Management Investment Operations (2012-2018).
David J. Carter (1973)
Year of Election or Appointment: 2020
Assistant Secretary
Mr. Carter also serves as Assistant Secretary of other funds. Mr. Carter serves as Vice President, Associate General Counsel (2010-present) and is an employee of Fidelity Investments (2005-present).
Jonathan Davis (1968)
Year of Election or Appointment: 2010
Assistant Treasurer
Mr. Davis also serves as an officer of other funds. Mr. Davis serves as Assistant Treasurer of FIMM, LLC (2021-present) and FMR Capital, Inc. (2017-present) and is an employee of Fidelity Investments. Previously, Mr. Davis served as Vice President and Associate General Counsel of FMR LLC (diversified financial services company, 2003-2010).
Laura M. Del Prato (1964)
Year of Election or Appointment: 2018
President and Treasurer
Ms. Del Prato also serves as an officer of other funds. Ms. Del Prato serves as Assistant Treasurer of FIMM, LLC (2021-present) and is an employee of Fidelity Investments (2017-present). Previously, Ms. Del Prato served as President and Treasurer of The North Carolina Capital Management Trust: Cash Portfolio and Term Portfolio (2018-2020). Prior to joining Fidelity Investments, Ms. Del Prato served as a Managing Director and Treasurer of the JPMorgan Mutual Funds (2014-2017). Prior to JPMorgan, Ms. Del Prato served as a partner at Cohen Fund Audit Services (accounting firm, 2012-2013) and KPMG LLP (accounting firm, 2004-2012).
Colm A. Hogan (1973)
Year of Election or Appointment: 2016
Assistant Treasurer
Mr. Hogan also serves as an officer of other funds. Mr. Hogan serves as Assistant Treasurer of FIMM, LLC (2021-present) and FMR Capital, Inc. (2017-present) and is an employee of Fidelity Investments (2005-present). Previously, Mr. Hogan served as Deputy Treasurer of certain Fidelity® funds (2016-2020) and Assistant Treasurer of certain Fidelity® funds (2016-2018).
Cynthia Lo Bessette (1969)
Year of Election or Appointment: 2019
Secretary and Chief Legal Officer (CLO)
Ms. Lo Bessette also serves as an officer of other funds. Ms. Lo Bessette serves as CLO, Secretary, and Senior Vice President of Fidelity Management & Research Company LLC (investment adviser firm, 2019-present); and CLO of Fidelity Management & Research (Hong Kong) Limited, FMR Investment Management (UK) Limited, and Fidelity Management & Research (Japan) Limited (investment adviser firms, 2019-present). She is a Senior Vice President and Deputy General Counsel of FMR LLC (diversified financial services company, 2019-present), and is an employee of Fidelity Investments. Previously, Ms. Lo Bessette served as CLO, Secretary, and Senior Vice President of FMR Co., Inc. (investment adviser firm, 2019); Secretary of Fidelity SelectCo, LLC and Fidelity Investments Money Management, Inc. (investment adviser firms, 2019). Prior to joining Fidelity Investments, Ms. Lo Bessette was Executive Vice President, General Counsel (2016-2019) and Senior Vice President, Deputy General Counsel (2015-2016) of OppenheimerFunds (investment management company) and Deputy Chief Legal Officer (2013-2015) of Jennison Associates LLC (investment adviser firm).
Chris Maher (1972)
Year of Election or Appointment: 2013
Assistant Treasurer
Mr. Maher also serves as an officer of other funds. Mr. Maher serves as Assistant Treasurer of FIMM, LLC (2021-present) and FMR Capital, Inc. (2017-present), and is an employee of Fidelity Investments (2008-present). Previously, Mr. Maher served as Assistant Treasurer of certain funds (2013-2020); Vice President of Asset Management Compliance (2013), Vice President of the Program Management Group of FMR (investment adviser firm, 2010-2013), and Vice President of Valuation Oversight (2008-2010).
Kenneth B. Robins (1969)
Year of Election or Appointment: 2020
Chief Compliance Officer
Mr. Robins also serves as an officer of other funds. Mr. Robins serves as Compliance Officer of Fidelity Management & Research Company LLC (investment adviser firm, 2016-present) and is an employee of Fidelity Investments (2004-present). Previously, Mr. Robins served as Compliance Officer of FMR Co., Inc. (investment adviser firm, 2016-2019), as Executive Vice President of Fidelity Investments Money Management, Inc. (investment adviser firm, 2013-2016) and served in other fund officer roles.
Brett Segaloff (1972)
Year of Election or Appointment: 2021
Anti-Money Laundering (AML) Officer
Mr. Segaloff also serves as an AML Officer of other funds and other related entities. He is Director, Anti-Money Laundering (2007-present) of FMR LLC (diversified financial services company) and is an employee of Fidelity Investments (1996-present).
Stacie M. Smith (1974)
Year of Election or Appointment: 2013
Assistant Treasurer
Ms. Smith also serves as an officer of other funds. Ms. Smith serves as Assistant Treasurer of FIMM, LLC (2021-present) and FMR Capital, Inc. (2017-present), is an employee of Fidelity Investments (2009-present), and has served in other fund officer roles. Prior to joining Fidelity Investments, Ms. Smith served as Senior Audit Manager of Ernst & Young LLP (accounting firm, 1996-2009). Previously, Ms. Smith served as Assistant Treasurer (2013-2019) and Deputy Treasurer (2013-2016) of certain Fidelity® funds.
Marc L. Spector (1972)
Year of Election or Appointment: 2016
Deputy Treasurer
Mr. Spector also serves as an officer of other funds. Mr. Spector serves as Assistant Treasurer of FIMM, LLC (2021-present) and FMR Capital, Inc. (2017-present) and is an employee of Fidelity Investments (2016-present). Prior to joining Fidelity Investments, Mr. Spector served as Director at the Siegfried Group (accounting firm, 2013-2016), and prior to Siegfried Group as audit senior manager at Deloitte & Touche LLP (accounting firm, 2005-2013).
Jim Wegmann (1979)
Year of Election or Appointment: 2019
Assistant Treasurer
Mr. Wegmann also serves as an officer of other funds. Mr. Wegmann serves as Assistant Treasurer of FIMM, LLC (2021-present) and is an employee of Fidelity Investments (2011-present).
Vadim Zlotnikov (1962)
Year of Election or Appointment: 2019
Vice President
Mr. Zlotnikov also serves as Vice President of other funds. Mr. Zlotnikov serves as President of FIAM (Fidelity Institutional Asset Management) and is an employee of Fidelity Investments (2018-present). Previously, Mr. Zlotnikov served as President and Chief Investment Officer of Global Asset Allocation (2018-2020). Prior to joining Fidelity Investments, Mr. Zlotnikov served as Co-Head of Multi-Asset Solutions, Chief Market Strategist, and CIO of Systematic Strategies with AllianceBernstein (investment adviser firm, 2002-2018).
Shareholder Expense Example
As a shareholder, you incur two types of costs: (1) transaction costs, which may include sales charges (loads) on purchase payments or redemption proceeds, as applicable and (2) ongoing costs, which generally include management fees, distribution and/or service (12b-1) fees and other Fund expenses. This Example is intended to help you understand your ongoing costs (in dollars) of investing in a fund and to compare these costs with the ongoing costs of investing in other mutual funds.
The Example is based on an investment of $1,000 invested at the beginning of the period and held for the entire period (February 1, 2021 to July 31, 2021).
Actual Expenses
The first line of the accompanying table provides information about actual account values and actual expenses. You may use the information in this line, together with the amount you invested, to estimate the expenses that you paid over the period. Simply divide your account value by $1,000.00 (for example, an $8,600 account value divided by $1,000.00 = 8.6), then multiply the result by the number in the first line for a class/Fund under the heading entitled "Expenses Paid During Period" to estimate the expenses you paid on your account during this period. If any fund is a shareholder of any underlying mutual funds or exchange-traded funds (ETFs) (the Underlying Funds), such fund indirectly bears its proportional share of the expenses of the Underlying Funds in addition to the direct expenses incurred presented in the table. These fees and expenses are not included in the annualized expense ratio used to calculate the expense estimate in the table below.
Hypothetical Example for Comparison Purposes
The second line of the accompanying table provides information about hypothetical account values and hypothetical expenses based on the actual expense ratio and an assumed rate of return of 5% per year before expenses, which is not the actual return. The hypothetical account values and expenses may not be used to estimate the actual ending account balance or expenses you paid for the period. You may use this information to compare the ongoing costs of investing in the Fund and other funds. To do so, compare this 5% hypothetical example with the 5% hypothetical examples that appear in the shareholder reports of the other funds. If any fund is a shareholder of any Underlying Funds, such fund indirectly bears its proportional share of the expenses of the Underlying Funds in addition to the direct expenses as presented in the table. These fees and expenses are not included in the annualized expense ratio used to calculate the expense estimate in the table below.
Please note that the expenses shown in the table are meant to highlight your ongoing costs only and do not reflect any transaction costs. Therefore, the second line of the table is useful in comparing ongoing costs only, and will not help you determine the relative total costs of owning different funds.
| Annualized Expense Ratio-A | Beginning Account Value February 1, 2021 | Ending Account Value July 31, 2021 | Expenses Paid During Period-B February 1, 2021 to July 31, 2021 |
|
| Fidelity Simplicity RMD Income Fund | .46% | |||
| Actual | $1,000.00 | $1,030.80 | $2.32 | |
| Hypothetical-C | $1,000.00 | $1,022.51 | $2.31 | |
| Fidelity Simplicity RMD 2010 Fund | .50% | |||
| Actual | $1,000.00 | $1,039.30 | $2.53 | |
| Hypothetical-C | $1,000.00 | $1,022.32 | $2.51 | |
| Fidelity Simplicity RMD 2015 Fund | .55% | |||
| Actual | $1,000.00 | $1,051.60 | $2.80 | |
| Hypothetical-C | $1,000.00 | $1,022.07 | $2.76 | |
| Fidelity Simplicity RMD 2020 Fund | .59% | |||
| Actual | $1,000.00 | $1,064.00 | $3.02 | |
| Hypothetical-C | $1,000.00 | $1,021.87 | $2.96 | |
| Fidelity Simplicity RMD 2025 Fund | .63% | |||
| Actual | $1,000.00 | $1,074.80 | $3.24 | |
| Hypothetical-C | $1,000.00 | $1,021.67 | $3.16 |
A Annualized expense ratio reflects expenses net of applicable fee waivers.
B Expenses are equal to the annualized expense ratio, multiplied by the average account value over the period, multiplied by 181/ 365 (to reflect the one-half year period). The fees and expenses of any Underlying Funds are not included in each annualized expense ratio.
C 5% return per year before expenses
Distributions (Unaudited)
The Board of Trustees of each fund voted to pay to shareholders of record at the opening of business on record date, the following distributions per share derived from capital gains realized from sales of portfolio securities:
| Pay Date | Record Date | Capital Gains | |
| Fidelity Simplicity RMD Income FundSM | 09/13/2021 | 9/10/2021 | $0.831 |
| Fidelity Simplicity RMD 2010 FundSM | 09/13/2021 | 9/10/2021 | $0.793 |
| Fidelity Simplicity RMD 2015 FundSM | 09/13/2021 | 9/10/2021 | $1.204 |
| Fidelity Simplicity RMD 2020 FundSM | 09/13/2021 | 9/10/2021 | $1.355 |
| Fidelity Simplicity RMD 2025 FundSM | 09/13/2021 | 9/10/2021 | $0.258 |
The funds hereby designate as capital gain dividend the amounts noted below for the taxable year ended July 31, 2021, or, if subsequently determined to be different, the net capital gain of such year.
| Fidelity Simplicity RMD Income FundSM | $1,051,220 |
| Fidelity Simplicity RMD 2010 FundSM | $307,531 |
| Fidelity Simplicity RMD 2015 FundSM | $773,600 |
| Fidelity Simplicity RMD 2020 FundSM | $1,877,424 |
| Fidelity Simplicity RMD 2025 FundSM | $244,342 |
A percentage of the dividends distributed during the fiscal year for the following funds were derived from interest on U.S. Government securities which is generally exempt from state income tax:
| Fidelity Simplicity RMD Income FundSM | 20.01% |
| Fidelity Simplicity RMD 2010 FundSM | 17.16% |
| Fidelity Simplicity RMD 2015 FundSM | 14.30% |
| Fidelity Simplicity RMD 2020 FundSM | 11.91% |
| Fidelity Simplicity RMD 2025 FundSM | 10.35% |
A percentage of the dividends distributed during the fiscal year for the following funds may be taken into account as a dividend for purposes of the maximum rate under section 1(h)(11) of the Internal Revenue Code.
| Fidelity Simplicity RMD Income FundSM | |
| August 2020 | 3% |
| September 2020 | 16% |
| October 2020 | 16% |
| November 2020 | 16% |
| December 2020 | 16% |
| February 2021 | 1% |
| March 2021 | 1% |
| April 2021 | 1% |
| May 2021 | 1% |
| June 2021 | 1% |
| July 2021 | 1% |
| Fidelity Simplicity RMD 2010 FundSM | |
| August 2020 | 0% |
| September 2020 | 19% |
| October 2020 | 22% |
| November 2020 | 22% |
| December 2020 | 22% |
| February 2021 | 2% |
| March 2021 | 2% |
| April 2021 | 2% |
| May 2021 | 2% |
| June 2021 | 2% |
| July 2021 | 2% |
| Fidelity Simplicity RMD 2015 FundSM | |
| August 2020 | 0% |
| September 2020 | 26% |
| October 2020 | 30% |
| November 2020 | 30% |
| December 2020 | 30% |
| February 2021 | 2% |
| March 2021 | 2% |
| April 2021 | 2% |
| May 2021 | 2% |
| June 2021 | 2% |
| July 2021 | 2% |
| Fidelity Simplicity RMD 2020 FundSM | |
| August 2020 | 0% |
| September 2020 | 32% |
| October 2020 | 38% |
| November 2020 | 38% |
| December 2020 | 38% |
| February 2021 | 0% |
| March 2021 | 0% |
| April 2021 | 0% |
| May 2021 | 0% |
| June 2021 | 0% |
| July 2021 | 0% |
| Fidelity Simplicity RMD 2025 FundSM | |
| August 2020 | 0% |
| September 9/04/2020 | 0% |
| September 9/11/2020 | 27% |
| October 2020 | 41% |
| November 2020 | 41% |
| December 2020 | 41% |
| February 2021 | 18% |
| March 2021 | 18% |
| April 2021 | 18% |
| May 2021 | 18% |
| June 2021 | 18% |
| July 2021 | – |
A percentage of the dividends distributed during the fiscal year for the following funds qualify as a section 199A dividend:
| Fidelity Simplicity RMD Income FundSM | |
| August 2020 | 1% |
| September 2020 | 1% |
| October 2020 | 1% |
| November 2020 | 1% |
| December 2020 | 1% |
| February 2021 | 0% |
| March 2021 | 0% |
| April 2021 | 0% |
| May 2021 | 0% |
| June 2021 | 0% |
| July 2021 | 0% |
| Fidelity Simplicity RMD 2010 FundSM | |
| August 2020 | 0% |
| September 2020 | 1% |
| October 2020 | 1% |
| November 2020 | 1% |
| December 2020 | 1% |
| February 2021 | 0% |
| March 2021 | 0% |
| April 2021 | 0% |
| May 2021 | 0% |
| June 2021 | 0% |
| July 2021 | 0% |
| Fidelity Simplicity RMD 2015 FundSM | |
| August 2020 | 0% |
| September 2020 | 1% |
| October 2020 | 1% |
| November 2020 | 1% |
| December 2020 | 1% |
| February 2021 | 0% |
| March 2021 | 0% |
| April 2021 | 0% |
| May 2021 | 0% |
| June 2021 | 0% |
| July 2021 | 0% |
| Fidelity Simplicity RMD 2020 FundSM | |
| August 2020 | 0% |
| September 2020 | 1% |
| October 2020 | 1% |
| November 2020 | 1% |
| December 2020 | 1% |
| February 2021 | 0% |
| March 2021 | 0% |
| April 2021 | 0% |
| May 2021 | 0% |
| June 2021 | 0% |
| July 2021 | 0% |
| Fidelity Simplicity RMD 2025 FundSM | |
| August 2020 | 0% |
| September 9/04/2020 | 0% |
| September 9/11/2020 | 1% |
| October 2020 | 1% |
| November 2020 | 1% |
| December 2020 | 1% |
| February 2021 | 5% |
| March 2021 | 5% |
| April 2021 | 5% |
| May 2021 | 5% |
| June 2021 | 5% |
| July 2021 | – |
The funds will notify shareholders in January 2022 of amounts for use in preparing 2021 income tax returns.
Liquidity Risk Management Program
The Securities and Exchange Commission adopted Rule 22e-4 under the Investment Company Act of 1940 (the Liquidity Rule) to promote effective liquidity risk management throughout the open-end investment company industry, thereby reducing the risk that funds will be unable to meet their redemption obligations and mitigating dilution of the interests of fund shareholders.
The Funds have adopted and implemented a liquidity risk management program pursuant to the Liquidity Rule (the Program) effective December 1, 2018. The Program is reasonably designed to assess and manage each Fund’s liquidity risk and to comply with the requirements of the Liquidity Rule. Each Fund’s Board of Trustees (the Board) has designated each Fund’s investment adviser as administrator of the Program. The Fidelity advisers have established a Liquidity Risk Management Committee (the LRM Committee) to manage the Program for each of the Fidelity Funds. The LRM Committee monitors the adequacy and effectiveness of implementation of the Program and on a periodic basis assesses each Fund’s liquidity risk based on a variety of factors including (1) the Fund’s investment strategy, (2) portfolio liquidity and cash flow projections during normal and reasonably foreseeable stressed conditions, (3) shareholder redemptions, (4) borrowings and other funding sources and (5) in the case of exchange-traded funds, certain additional factors including the effect of the Fund’s prices and spreads, market participants, and basket compositions on the overall liquidity of the Fund’s portfolio, as applicable.
In accordance with the Program, each of the Fund’s portfolio investments is classified into one of four liquidity categories described below based on a determination of a reasonable expectation for how long it would take to convert the investment to cash (or sell or dispose of the investment) without significantly changing its market value.
- Highly liquid investments – cash or convertible to cash within three business days or less
- Moderately liquid investments – convertible to cash in three to seven calendar days
- Less liquid investments – can be sold or disposed of, but not settled, within seven calendar days
- Illiquid investments – cannot be sold or disposed of within seven calendar days
Liquidity classification determinations take into account a variety of factors including various market, trading and investment-specific considerations, as well as market depth, and generally utilize analysis from a third-party liquidity metrics service.
The Liquidity Rule places a 15% limit on a fund’s illiquid investments and requires funds that do not primarily hold assets that are highly liquid investments to determine and maintain a minimum percentage of the fund’s net assets to be invested in highly liquid investments (highly liquid investment minimum or HLIM). The Program includes provisions reasonably designed to comply with the 15% limit on illiquid investments and for determining, periodically reviewing and complying with the HLIM requirement as applicable.
At a recent meeting of the Fund’s Board of Trustees, the LRM Committee provided a written report to the Board pertaining to the operation, adequacy, and effectiveness of implementation of the Program for the annual period from December 1, 2019 through November 30, 2020. The report concluded that the Program has been implemented and is operating effectively and is reasonably designed to assess and manage the Fund’s liquidity risk.
![]()
SRD-ANN-0921
1.9881721.104
Item 2.
Code of Ethics
As of the end of the period, July 31, 2021, Fidelity Income Fund (the trust) has adopted a code of ethics, as defined in Item 2 of Form N-CSR, that applies to its President and Treasurer and its Chief Financial Officer. A copy of the code of ethics is filed as an exhibit to this Form N-CSR.
Item 3.
Audit Committee Financial Expert
The Board of Trustees of the trust has determined that Elizabeth S. Acton is an audit committee financial expert, as defined in Item 3 of Form N-CSR. Ms. Acton is independent for purposes of Item 3 of Form N-CSR.
Item 4.
Principal Accountant Fees and Services
Fees and Services
The following table presents fees billed by Deloitte & Touche LLP, the member firms of Deloitte Touche Tohmatsu, and their respective affiliates (collectively, “Deloitte Entities”) in each of the last two fiscal years for services rendered to Fidelity Managed Retirement 2010 Fund, Fidelity Managed Retirement 2015 Fund, Fidelity Managed Retirement 2020 Fund, Fidelity Managed Retirement 2025 Fund, Fidelity Managed Retirement 2030 Fund, Fidelity Managed Retirement Income Fund, Fidelity Simplicity RMD 2010 Fund, Fidelity Simplicity RMD 2015 Fund, Fidelity Simplicity RMD 2020 Fund, Fidelity Simplicity RMD 2025 Fund and Fidelity Simplicity RMD Income Fund (the “Funds”):
Services Billed by Deloitte Entities
July 31, 2021 FeesA
| | Audit Fees | Audit-Related Fees | Tax Fees | All Other Fees |
| | | | | |
| Fidelity Managed Retirement 2010 Fund | $20,300 | $- | $6,900 | $600 |
| Fidelity Managed Retirement 2015 Fund | $20,300 | $- | $6,900 | $600 |
| Fidelity Managed Retirement 2020 Fund | $20,300 | $- | $6,900 | $600 |
| Fidelity Managed Retirement 2025 Fund | $20,300 | $- | $6,900 | $600 |
| Fidelity Managed Retirement 2030 Fund | $19,400 | $- | $8,000 | $500 |
| Fidelity Managed Retirement Income Fund | $20,300 | $- | $16,100 | $600 |
| Fidelity Simplicity RMD 2010 Fund | $14,400 | $- | $6,900 | $400 |
| Fidelity Simplicity RMD 2015 Fund | $14,400 | $- | $6,900 | $400 |
| Fidelity Simplicity RMD 2020 Fund | $14,400 | $- | $6,900 | $400 |
| Fidelity Simplicity RMD 2025 Fund | $16,100 | $- | $6,900 | $400 |
| Fidelity Simplicity RMD Income Fund | $14,400 | $- | $14,900 | $400 |
July 31, 2020 FeesA,B
| | Audit Fees | Audit-Related Fees | Tax Fees | All Other Fees |
| | | | | |
| Fidelity Managed Retirement 2010 Fund | $26,500 | $- | $6,900 | $500 |
| Fidelity Managed Retirement 2015 Fund | $26,500 | $- | $6,900 | $500 |
| Fidelity Managed Retirement 2020 Fund | $26,500 | $- | $6,900 | $500 |
| Fidelity Managed Retirement 2025 Fund | $26,500 | $- | $6,900 | $500 |
| Fidelity Managed Retirement 2030 Fund | $16,800 | $- | $6,900 | $400 |
| Fidelity Managed Retirement Income Fund | $26,500 | $- | $6,900 | $500 |
| Fidelity Simplicity RMD 2010 Fund | $15,200 | $- | $6,900 | $400 |
| Fidelity Simplicity RMD 2015 Fund | $15,200 | $- | $6,900 | $400 |
| Fidelity Simplicity RMD 2020 Fund | $15,200 | $- | $6,900 | $400 |
| Fidelity Simplicity RMD 2025 Fund | $13,800 | $- | $6,900 | $400 |
| Fidelity Simplicity RMD Income Fund | $15,200 | $- | $6,900 | $400 |
A Amounts may reflect rounding.
B Fidelity Managed Retirement 2030 Fund and Fidelity Simplicity RMD 2025 Fund commenced operations on August 16, 2019.
The following table presents fees billed by PricewaterhouseCoopers LLP (“PwC”) in each of the last two fiscal years for services rendered to Fidelity GNMA Fund (the “Fund”):
Services Billed by PwC
July 31, 2021 FeesA
| | Audit Fees | Audit-Related Fees | Tax Fees | All Other Fees |
| Fidelity GNMA Fund | $89,300 | $8,000 | $13,100 | $3,800 |
July 31, 2020 FeesA
| | Audit Fees | Audit-Related Fees | Tax Fees | All Other Fees |
| Fidelity GNMA Fund | $90,500 | $8,000 | $13,100 | $4,400 |
A Amounts may reflect rounding.
The following table(s) present(s) fees billed by Deloitte Entities that were required to be approved by the Audit Committee for services that relate directly to the operations and financial reporting of the Fund(s) and that are rendered on behalf of Fidelity Management & Research Company LLC ("FMR") and entities controlling, controlled by, or under common control with FMR (not including any sub-adviser whose role is primarily portfolio management and is subcontracted with or overseen by another investment adviser) that provide ongoing services to the Fund(s) (“Fund Service Providers”):
Services Billed by Deloitte Entities
| | July 31, 2021A | July 31, 2020A,B |
| Audit-Related Fees | $- | $- |
| Tax Fees | $- | $3,000 |
| All Other Fees | $- | $- |
A Amounts may reflect rounding.
B May include amounts billed prior to the Fidelity Managed Retirement 2030 Fund and Fidelity Simplicity RMD 2025 Funds’ commencement of operations.
Services Billed by PwC
| | July 31, 2021A | July 31, 2020A |
| Audit-Related Fees | $8,959,700 | $8,940,200 |
| Tax Fees | $11,200 | $20,800 |
| All Other Fees | $- | $- |
A Amounts may reflect rounding.
“Audit-Related Fees” represent fees billed for assurance and related services that are reasonably related to the performance of the fund audit or the review of the fund's financial statements and that are not reported under Audit Fees.
“Tax Fees” represent fees billed for tax compliance, tax advice or tax planning that relate directly to the operations and financial reporting of the fund.
“All Other Fees” represent fees billed for services provided to the fund or Fund Service Provider, a significant portion of which are assurance related, that relate directly to the operations and financial reporting of the fund, excluding those services that are reported under Audit Fees, Audit-Related Fees or Tax Fees.
Assurance services must be performed by an independent public accountant.
* * *
The aggregate non-audit fees billed by Deloitte Entities and PwC for services rendered to the Fund(s), FMR (not including any sub-adviser whose role is primarily portfolio management and is subcontracted with or overseen by another investment adviser), and any Fund Service Provider for each of the last two fiscal years of the Fund(s) are as follows:
| Billed By | July 31, 2021A | July 31, 2020A,B |
| Deloitte Entities | $621,300 | $600,100 |
| PwC | $14,298,500 | $14,267,700 |
| | | |
A Amounts may reflect rounding.
B May include amounts billed prior to the Fidelity Managed Retirement 2030 Fund and Fidelity Simplicity RMD 2025 Funds’ commencement of operations.
The trust's Audit Committee has considered non-audit services that were not pre-approved that were provided by Deloitte Entities to Fund Service Providers to be compatible with maintaining the independence of Deloitte Entities in its(their) audit of the Fund(s), taking into account representations from Deloitte Entities, in accordance with Public Company Accounting Oversight Board rules, regarding its independence from the Fund(s) and its(their) related entities and FMR’s review of the appropriateness and permissibility under applicable law of such non-audit services prior to their provision to the Fund(s) Service Providers.
Audit Committee Pre-Approval Policies and Procedures
The trust’s Audit Committee must pre-approve all audit and non-audit services provided by a fund’s independent registered public accounting firm relating to the operations or financial reporting of the fund. Prior to the commencement of any audit or non-audit services to a fund, the Audit Committee reviews the services to determine whether they are appropriate and permissible under applicable law.
The Audit Committee has adopted policies and procedures to, among other purposes, provide a framework for the Committee’s consideration of non-audit services by the audit firms that audit the Fidelity funds. The policies and procedures require that any non-audit service provided by a fund audit firm to a Fidelity fund and any non-audit service provided by a fund auditor to a Fund Service Provider that relates directly to the operations and financial reporting of a Fidelity fund (“Covered Service”) are subject to approval by the Audit Committee before such service is provided.
All Covered Services must be approved in advance of provision of the service either: (i) by formal resolution of the Audit Committee, or (ii) by oral or written approval of the service by the Chair of the Audit Committee (or if the Chair is unavailable, such other member of the Audit Committee as may be designated by the Chair to act in the Chair’s absence). The approval contemplated by (ii) above is permitted where the Treasurer determines that action on such an engagement is necessary before the next meeting of the Audit Committee.
Non-audit services provided by a fund audit firm to a Fund Service Provider that do not relate directly to the operations and financial reporting of a Fidelity fund are reported to the Audit Committee periodically.
Non-Audit Services Approved Pursuant to Rule 2-01(c)(7)(i)(C) and (ii) of Regulation S-X (“De Minimis Exception”)
There were no non-audit services approved or required to be approved by the Audit Committee pursuant to the De Minimis Exception during the Fund’s(s’) last two fiscal years relating to services provided to (i) the Fund(s) or (ii) any Fund Service Provider that relate directly to the operations and financial reporting of the Fund(s).
Item 5.
Audit Committee of Listed Registrants
Not applicable.
Item 6.
Investments
(a)
Not applicable.
(b)
Not applicable.
Item 7.
Disclosure of Proxy Voting Policies and Procedures for Closed-End Management Investment Companies
Not applicable.
Item 8.
Portfolio Managers of Closed-End Management Investment Companies
Not applicable.
Item 9.
Purchase of Equity Securities by Closed-End Management Investment Company and Affiliated Purchasers
Not applicable.
Item 10.
Submission of Matters to a Vote of Security Holders
There were no material changes to the procedures by which shareholders may recommend nominees to the trust’s Board of Trustees.
Item 11.
Controls and Procedures
(a)(i) The President and Treasurer and the Chief Financial Officer have concluded that the trust’s disclosure controls and procedures (as defined in Rule 30a-3(c) under the Investment Company Act) provide reasonable assurances that material information relating to the trust is made known to them by the appropriate persons, based on their evaluation of these controls and procedures as of a date within 90 days of the filing date of this report.
(a)(ii) There was no change in the trust’s internal control over financial reporting (as defined in Rule 30a-3(d) under the Investment Company Act) that occurred during the period covered by this report that has materially affected, or is reasonably likely to materially affect, the trust’s internal control over financial reporting.
Item 12.
Disclosure of Securities Lending Activities for Closed-End Management
Investment Companies
Not applicable.
Item 13.
Exhibits
| (a) | (1) | Code of Ethics pursuant to Item 2 of Form N-CSR is filed and attached hereto as EX-99.CODE ETH. |
| (a) | (2) | |
| (a) | (3) | Not applicable. |
| (b) | |
SIGNATURES
Pursuant to the requirements of the Securities Exchange Act of 1934 and the Investment Company Act of 1940, the registrant has duly caused this report to be signed on its behalf by the undersigned, thereunto duly authorized.
Fidelity Income Fund
| By: | /s/Laura M. Del Prato |
| | Laura M. Del Prato |
| | President and Treasurer |
| | |
| Date: | September 21, 2021 |
Pursuant to the requirements of the Securities Exchange Act of 1934 and the Investment Company Act of 1940, this report has been signed below by the following persons on behalf of the registrant and in the capacities and on the dates indicated.
| By: | /s/Laura M. Del Prato |
| | Laura M. Del Prato |
| | President and Treasurer |
| | |
| Date: | September 21, 2021 |
| By: | /s/John J. Burke III |
| | John J. Burke III |
| | Chief Financial Officer |
| | |
| Date: | September 21, 2021 |
Exhibit EX-99.CERT
I, Laura M. Del Prato, certify that:
1.
I have reviewed this report on Form N-CSR of Fidelity Income Fund;
2.
Based on my knowledge, this report does not contain any untrue statement of a material fact or omit to state a material fact necessary to make the statements made, in light of the circumstances under which such statements were made, not misleading with respect to the period covered by this report;
3.
Based on my knowledge, the financial statements, and other financial information included in this report, fairly present in all material respects the financial condition, results of operations, changes in net assets, and cash flows (if the financial statements are required to include a statement of cash flows) of the registrant as of, and for, the periods presented in this report;
4.
The registrant's other certifying officer(s) and I are responsible for establishing and maintaining disclosure controls and procedures (as defined in Rule 30a-3(c) under the Investment Company Act of 1940) and internal control over financial reporting (as defined in Rule 30a-3(d) under the Investment Company Act of 1940) for the registrant and have:
a.
Designed such disclosure controls and procedures, or caused such disclosure controls and procedures to be designed under our supervision, to ensure that material information relating to the registrant, including its consolidated subsidiaries, is made known to us by others within those entities, particularly during the period in which this report is being prepared;
b.
Designed such internal control over financial reporting, or caused such internal control over financial reporting to be designed under our supervision, to provide reasonable assurance regarding the reliability of financial reporting and the preparation of financial statements for external purposes in accordance with generally accepted accounting principles;
c.
Evaluated the effectiveness of the registrant's disclosure controls and procedures and presented in this report our conclusions about the effectiveness of the disclosure controls and procedures, as of a date within 90 days prior to the filing date of this report based upon such evaluation; and
d.
Disclosed in this report any change in the registrant’s internal control over financial reporting that occurred during the period covered by this report that has materially affected, or is reasonably likely to materially affect, the registrant’s internal control over financial reporting; and
5.
The registrant's other certifying officer(s) and I have disclosed to the registrant's auditors and the audit committee of the registrant's board of directors (or persons performing the equivalent functions):
a.
All significant deficiencies and material weaknesses in the design or operation of internal control over financial reporting which are reasonably likely to adversely affect the registrant's ability to record, process, summarize, and report financial information; and
b.
Any fraud, whether or not material, that involves management or other employees who have a significant role in the registrant's internal control over financial reporting.
Date:
September 21, 2021
/s/Laura M. Del Prato |
Laura M. Del Prato |
President and Treasurer |
I, John J. Burke III, certify that:
1.
I have reviewed this report on Form N-CSR of Fidelity Income Fund;
2.
Based on my knowledge, this report does not contain any untrue statement of a material fact or omit to state a material fact necessary to make the statements made, in light of the circumstances under which such statements were made, not misleading with respect to the period covered by this report;
3.
Based on my knowledge, the financial statements, and other financial information included in this report, fairly present in all material respects the financial condition, results of operations, changes in net assets, and cash flows (if the financial statements are required to include a statement of cash flows) of the registrant as of, and for, the periods presented in this report;
4.
The registrant's other certifying officer(s) and I are responsible for establishing and maintaining disclosure controls and procedures (as defined in Rule 30a-3(c) under the Investment Company Act of 1940) and internal control over financial reporting (as defined in Rule 30a-3(d) under the Investment Company Act of 1940) for the registrant and have:
a.
Designed such disclosure controls and procedures, or caused such disclosure controls and procedures to be designed under our supervision, to ensure that material information relating to the registrant, including its consolidated subsidiaries, is made known to us by others within those entities, particularly during the period in which this report is being prepared;
b.
Designed such internal control over financial reporting, or caused such internal control over financial reporting to be designed under our supervision, to provide reasonable assurance regarding the reliability of financial reporting and the preparation of financial statements for external purposes in accordance with generally accepted accounting principles;
c.
Evaluated the effectiveness of the registrant's disclosure controls and procedures and presented in this report our conclusions about the effectiveness of the disclosure controls and procedures, as of a date within 90 days prior to the filing date of this report based upon such evaluation; and
d.
Disclosed in this report any change in the registrant’s internal control over financial reporting that occurred during the period covered by this report that has materially affected, or is reasonably likely to materially affect, the registrant’s internal control over financial reporting; and
5.
The registrant's other certifying officer(s) and I have disclosed to the registrant's auditors and the audit committee of the registrant's board of directors (or persons performing the equivalent functions):
a.
All significant deficiencies and material weaknesses in the design or operation of internal control over financial reporting which are reasonably likely to adversely affect the registrant's ability to record, process, summarize, and report financial information; and
b.
Any fraud, whether or not material, that involves management or other employees who have a significant role in the registrant's internal control over financial reporting.
Date:
September 21, 2021
/s/John J. Burke III |
John J. Burke III |
Chief Financial Officer |
Exhibit EX-99.906CERT
Certification Pursuant to Section 906 of the Sarbanes-Oxley Act of 2002 (subsections (a) and (b) of section 1350, chapter 63 of title 18, United States Code)
In connection with the attached Report of Fidelity Income Fund (the “Trust”) on Form N-CSR to be filed with the Securities and Exchange Commission (the “Report”), each of the undersigned officers of the Trust does hereby certify that, to the best of such officer’s knowledge:
1.
The Report fully complies with the requirements of 13(a) or 15(d) of the Securities Exchange Act of 1934; and
2.
The information contained in the Report fairly presents, in all material respects, the financial condition and results of operations of the Trust as of, and for, the periods presented in the Report.
Dated: September 21, 2021
/s/Laura M. Del Prato |
Laura M. Del Prato |
President and Treasurer |
Dated: September 21, 2021
/s/John J. Burke III |
John J. Burke III |
Chief Financial Officer |
A signed original of this written statement required by Section 906, or other document authenticating, acknowledging, or otherwise adopting the signature that appears in typed form within the electronic version of this written statement required by Section 906, has been provided to the Trust and will be retained by the Trust and furnished to the Securities and Exchange Commission or its staff upon request.
EXHIBIT EX-99.CODE ETH
FIDELITY FUNDS’ CODE OF ETHICS FOR
PRESIDENT, TREASURER AND PRINCIPAL ACCOUNTING OFFICER
I. Purposes of the Code/Covered Officers
This document constitutes the Code of Ethics (Code) adopted by the Fidelity Funds (Funds) pursuant to the provisions of Rule 30b2-1(a) under the Investment Company Act of 1940), which Rule implements Sections 406 of the Sarbanes-Oxley Act of 2002 with respect to registered investment companies. The Code applies to the Fidelity Funds’ President and Treasurer, and Chief Financial Officer (Covered Officers). Fidelity’s Ethics Office, a part of Corporate Compliance Group within Core Compliance, administers the Code.
The purposes of the Code are to deter wrongdoing and to promote, on the part of the Covered Officers:
·
honest and ethical conduct, including the ethical handling of actual or apparent conflicts of interest between personal and professional relationships;
·
full, fair, accurate, timely and understandable disclosure in reports and documents that the Fidelity Funds submit to the Securities and Exchange Commission (SEC), and in other public communications by a Fidelity Fund;
·
compliance with applicable laws and governmental rules and regulations;
·
the prompt internal reporting to an appropriate person or persons identified in the Code of violations of the Code; and
·
accountability for adherence to the Code.
Each Covered Officer should adhere to a high standard of business ethics and should be sensitive to situations that may give rise to actual as well as apparent conflicts of interest.
II.
Covered Officers Should Handle Ethically
Actual and Apparent Conflicts of Interest
Overview. A “conflict of interest” occurs when a Covered Officer’s private interest interferes with the interests of, or his service to, the Fidelity Funds. For example, a conflict of interest would arise if a Covered Officer, or a member of his family, receives improper personal benefits as a result of his position with the Fidelity Funds.
Certain conflicts of interest arise out of the relationships between Covered Officers and the Fidelity Funds and already are subject to conflict of interest provisions in the Investment Company Act of 1940 (Investment Company Act) and the Investment Advisers Act of 1940 (Investment Advisers Act). For example, Covered Officers may not individually engage in certain transactions (such as the purchase or sale of securities or other property) with a Fidelity Fund because of their status as “affiliated persons” of the Fund. Separate compliance programs and procedures of the Fidelity Funds, Fidelity Management & Research Company (FMR) and the other Fidelity companies are designed to prevent, or identify and correct, violations of these provisions. This Code does not, and is not intended to, repeat or replace these programs and procedures, and such conflicts fall outside of the parameters of this Code.
Although typically not presenting an opportunity for improper personal benefit, conflicts arise from, or as a result of, the contractual relationship between the Fidelity Funds and FMR (or another Fidelity company) of which the Covered Officers are also officers or employees. As a result, this Code recognizes that the Covered Officers will, in the normal course of their duties (whether formally for the Fidelity Funds, FMR or another Fidelity company), be involved in establishing policies and implementing decisions that have different effects on the Fidelity Funds, FMR and other Fidelity companies. The participation of the Covered Officers in such activities is inherent in the contractual relationship between the Fidelity Funds and FMR (or another Fidelity company), and is consistent with the performance by the Covered Officers of their duties as officers of the Fidelity Funds. Thus, if performed in conformity with the provisions of the Investment Company Act and the Investment Advisers Act, such activities will be deemed to have been handled ethically. In addition, it is recognized by the Funds’ Board of Trustees (Board) that the Covered Officers also may be officers or employees of one or more other Fidelity Funds covered by this Code.
Other conflicts of interest are covered by the Code, even if such conflicts of interest are not subject to provisions in the Investment Company Act and the Investment Advisers Act. The following list provides examples of conflicts of interest under the Code, but Covered Officers should keep in mind that these examples are not exhaustive. The overarching principle is that the personal interest of a Covered Officer should not be placed improperly before the interest of a Fidelity Fund.
* * *
Each Covered Officer must:
·
not use his or her personal influence or personal relationships improperly to influence investment decisions or financial reporting by any Fidelity Fund whereby the Covered Officer would benefit personally to the detriment of any Fidelity Fund;
·
not cause a Fidelity Fund to take action, or fail to take action, for the individual personal benefit of the Covered Officer rather than the benefit of the Fidelity Fund;
·
not engage in any outside business activity, including serving as a director or trustee, that prevents the Covered Officer from devoting appropriate time and attention to the Covered Officer’s responsibilities with the Fidelity Funds;
·
not have a consulting or employment relationship with any of the Fidelity Funds’ service providers that are not affiliated with Fidelity; and
·
not retaliate against any employee or Covered Officer for reports of actual or potential misconduct, which are made in good faith.
With respect to other fact patterns, if a Covered Officer is in doubt, other potential conflict of interest situations should be described immediately to the Fidelity Ethics Office for resolution. Similarly, any questions a Covered Officer has generally regarding the application or interpretation of the Code should be directed to the Fidelity Ethics Office immediately.
III. Disclosure and Compliance
·
Each Covered Officer should familiarize himself with the disclosure requirements generally applicable to the Fidelity Funds.
·
Each Covered Officer should not knowingly misrepresent, or cause others to misrepresent, facts about any Fidelity Fund to others, whether within or outside Fidelity, including to the Board and auditors, and to governmental regulators and self-regulatory organizations;
·
Each Covered Officer should, to the extent appropriate within his area of responsibility, consult with other officers and employees of the Fidelity Funds, FMR and the Fidelity service providers, and with the Board’s Compliance Committee, with the goal of promoting full, fair, accurate, timely and understandable disclosure in the reports and documents the Fidelity Funds file with, or submit to, the SEC and in other public communications made by the Fidelity Funds; and
·
It is the responsibility of each Covered Officer to promote compliance with the standards and restrictions imposed by applicable laws, rules and regulations.
IV. Reporting and Accountability
Each Covered Officer must:
·
upon receipt of the Code, and annually thereafter, submit to the Fidelity Ethics Office an acknowledgement stating that he or she has received, read, and understands the Code; and
·
notify the Fidelity Ethics Office promptly if he or she knows of any violation of the Code. Failure to do so is itself a violation of this Code.
The Fidelity Ethics Office shall take all action it considers appropriate to investigate any actual or potential violations reported to it. Upon completion of the investigation, if necessary, the matter will be reviewed with senior management or other appropriate parties, and a determination will be made as to whether any action should be taken as detailed below. The Covered Officer will be informed of any action determined to be appropriate. The Fidelity Ethics Office will inform the Personal Trading Committee of all Code violations and actions taken in response. Without implied limitation, appropriate remedial, disciplinary or preventive action may include a written warning, a letter of censure, suspension, dismissal or, in the event of criminal or other serious violations of law, notification of the SEC or other appropriate law enforcement authorities. Additionally, other legal remedies may be pursued.
The policies and procedures described in the Code do not create any obligations to any person or entity other than the Fidelity Funds. The Code is intended solely for the internal use by the Fidelity Funds and does not constitute a promise, contract or an admission by or on behalf of any Fidelity Fund as to any fact, circumstance, or legal conclusion. The Fidelity Funds, the Fidelity companies and the Fidelity Chief Ethics Officer retain the discretion to decide whether the Code applies to a specific situation, and how it should be interpreted.
V. Oversight
Material violations of this Code will be reported promptly by FMR to the Board’s Compliance Committee. In addition, at least once each year, FMR will provide a written report to the Board, which describes any issues arising under the Code since the last report to the Board, including, but not limited to, information about material violations of the Code and action taken in response to the material violations.
VI. Other Policies and Procedures
This Code shall be the sole code of ethics adopted by the Fidelity Funds for purposes of Section 406 of the Sarbanes-Oxley Act and the rules and forms applicable to registered investment companies thereunder. Other Fidelity policies or procedures that cover the behavior or activities of Covered Officers are separate requirements applying to the Covered Officers (and others), and are not part of this Code.
VII. Amendments
Any material amendments or changes to this Code must be approved or ratified by a majority vote of the Board, including a majority of the Trustees who are not interested persons of the Fidelity Funds.
VIII. Records and Confidentiality
Records of any violation of the Code and of the actions taken as a result of such violations will be kept by the Fidelity Ethics Office. All reports and records prepared or maintained pursuant to this Code will be considered confidential and shall be maintained and protected accordingly. Except as otherwise required by law or this Code, such matters shall not be disclosed to anyone other than the Fidelity Ethics Office, the Personal Trading Committee, the Board, appropriate personnel at the relevant Fidelity company or companies and the legal counsel of any or all of the foregoing.
Serious News for Serious Traders! Try StreetInsider.com Premium Free!
You May Also Be Interested In
- HSBC Continental Europe: Post Stabilisation Notice
- Adevinta (ASA) publishes its 2023 Annual Report
- Flash News: OKX Wallet Now Supports Reading of Staked STONE
Create E-mail Alert Related Categories
SEC FilingsSign up for StreetInsider Free!
Receive full access to all new and archived articles, unlimited portfolio tracking, e-mail alerts, custom newswires and RSS feeds - and more!
