

Form N-CSR ARBITRAGE FUNDS For: May 31
 Tweet
Tweet Share
Share
UNITED STATES
SECURITIES AND EXCHANGE COMMISSION
Washington, D.C. 20549
FORM N-CSR
CERTIFIED SHAREHOLDER REPORT OF REGISTERED
MANAGEMENT INVESTMENT COMPANIES
Investment Company Act file number: 811-09815
the arbitrage funds
(exact name of registrant as specified in charter)
41 Madison Avenue, 42nd Floor, New York, NY 10010
(Address of principal executive offices) (Zip code)
John S. Orrico
Water Island Capital, LLC
41 Madison Avenue
42nd Floor
New York, NY 10010
(Name and address of agent for service)
Registrant’s telephone number, including area code: 800-295-4485
Date of fiscal year end: May 31
Date of reporting period: May 31, 2022
Item 1. Reports to Stockholders.

Annual Report
May 31, 2022
Arbitrage Fund
Water Island Event-Driven Fund
Water Island Credit Opportunities Fund

TABLE OF CONTENTS
|
Shareholder Letter |
1 |
||||||
|
Arbitrage Fund |
|||||||
|
Manager Commentary |
3 |
||||||
|
Portfolio Information |
5 |
||||||
|
Portfolio of Investments |
7 |
||||||
|
Water Island Event-Driven Fund |
|||||||
|
Manager Commentary |
21 |
||||||
|
Portfolio Information |
23 |
||||||
|
Portfolio of Investments |
25 |
||||||
|
Water Island Credit Opportunities Fund |
|||||||
|
Manager Commentary |
37 |
||||||
|
Portfolio Information |
39 |
||||||
|
Portfolio of Investments |
41 |
||||||
|
Statements of Assets and Liabilities |
50 |
||||||
|
Statements of Operations |
54 |
||||||
|
Statements of Changes in Net Assets |
58 |
||||||
|
Financial Highlights |
|||||||
|
Arbitrage Fund - Class R |
61 |
||||||
|
Arbitrage Fund - Class I |
62 |
||||||
|
Arbitrage Fund - Class C |
63 |
||||||
|
Arbitrage Fund - Class A |
64 |
||||||
|
Water Island Event-Driven Fund - Class R |
65 |
||||||
|
Water Island Event-Driven Fund - Class I |
66 |
||||||
|
Water Island Event-Driven Fund - Class A |
67 |
||||||
|
Water Island Credit Opportunities Fund - Class R |
68 |
||||||
|
Water Island Credit Opportunities Fund - Class I |
69 |
||||||
|
Water Island Credit Opportunities Fund - Class A |
70 |
||||||
|
Notes to Financial Statements |
71 |
||||||
|
Report of Independent Registered Public Accounting Firm |
95 |
||||||
|
Disclosure of Fund Expenses |
96 |
||||||
|
Additional Information |
99 |
||||||
|
Approval of Investment Advisory Agreements |
100 |
||||||
|
Liquidity Risk |
105 |
||||||
|
Trustees & Officers |
106 |
||||||
The Arbitrage Funds Shareholder Letter
May 31, 2022 (Unaudited)
Dear Fellow Shareholders,
As we near the midway point of calendar year 2022, we reflect on a difficult trailing 12-month period not just for broader capital markets but also for event-driven strategies. After reaching all-time highs at the start of 2022, the S&P 500 index – a popular proxy for the stock market – embarked on a downturn that has officially entered bear market territory as of this writing. The Bloomberg U.S. Aggregate Bond index, which is reflective of the broad investment grade bond market, was down nearly 9% for our fiscal year ended May 31, extending a drawdown that began in 2020 and is now the largest bond market drawdown in more than 40 years. There has been no shortage of pressures driving the volatility: a pandemic that has now entered its third year; malfunctioning supply chains; runaway inflation; rapidly rising interest rates; recession fears; domestic discord and imminent midterm elections in the US; and geopolitical tensions and the Russia/Ukraine conflict have all played a part.
More pertinent to our event-driven strategies, volatility began to spike at the start of the fiscal year in June 2021, when the Department of Justice (DOJ) sued to block the merger of insurance brokers Willis Towers Watson Plc and Aon – a large, widely held deal that had already acquired necessary regulatory approvals in all jurisdictions but the US. In the ensuing 11 months, competition regulation has remained at the forefront of merger arbitrage investors' minds, as the Biden administration takes an increasingly strict view of antitrust. The DOJ, Federal Trade Commission (FTC), Federal Communications Commission (FCC), and Committee on Foreign Investment in the United States (CFIUS) are just a handful of a stable of global regulators – including the pro-consumer European Commission and the unpredictable State Administration for Market Regulation in China – whose views often must be properly assessed to predict deal success, and with US regulators now straying from historical precedent at times, deal spreads have been experiencing atypical spikes in volatility.
Despite this volatility, we continue to expect the vast majority of pending mergers and acquisitions (M&A) to reach a successful conclusion (as over 90% of announced M&A has done, historically, according to Dealogic data). Thus, we believe these spread movements will be limited to mere mark-to-market losses, to be reversed once deals overcome their respective hurdles to completion and spreads narrow to zero. Moreover, with volatility extending throughout the credit and equity markets, we continue to believe merger arbitrage and other hard catalyst merger-related investments remain the appropriate area toward which to direct our focus. We intend to introduce select soft catalyst opportunities – which tend to be more sensitive to broader market moves – to the portfolio only with appropriate risk mitigation strategies in place.
Although we have begun to see some blips in the rapid pace of newly announced M&A which characterized deal flow for nearly two years straight (and set a record of more than $5 trillion in activity for calendar year 2021), we believe the pause to be momentary. Looking further ahead, we anticipate M&A will remain an important avenue for corporations to drive growth. We have no doubt dealmakers will adapt to model rising interest rates and high inflation into their valuations, fueling deal flow even if we enter a broader economic downturn. We also believe acquirers will continue to engage in M&A as a path to shore up weakened supply chains, diminished workforces, and inadequate technology infrastructure – common themes of the past year. Strategic acquirers in a position of strength can often find their best opportunities to deliver strong return on investment when valuations are dislocated, and deals with a strong strategic rationale can create long term value for shareholders. Lest we forget financial buyers, private equity (PE) acquisition activity – which now comprises nearly half of global deal value – should continue, as PE shops still have more than $2 trillion in dry powder on the books, waiting to be deployed.
Annual Report | May 31, 2022
1
The Arbitrage Funds Shareholder Letter (continued)
May 31, 2022 (Unaudited)
That said, while the total volume of recent deal flow based on number of deals announced is in line with pre-pandemic levels, we are beginning to see a shift in the composition of M&A activity. A drop in mega deals (i.e., transactions valued over $10 billion), which may become scarce in the current regulatory environment, has caused the total value of announced deals to decrease. This can be healthy for the strategy. A top-heavy M&A landscape can lead to crowded positions. An increase in smaller deals, however, reflects a broad opportunity set. We consider the mid cap space in particular to be a sweet spot, as deals of this size are large enough to build sizable positions but typically less susceptible to regulatory pressures.
As event-driven investors, our objective remains to generate returns sourced from the outcomes of idiosyncratic corporate events, rather than from the overall direction of broader credit or equity markets. We believe market volatility will remain heightened in the year ahead, but we are optimistic about the prospects for our strategies. Volatility can present opportunities to trade around positions and find attractive entry points. Furthermore, the risk-free interest rate is a fundamental building block of a deal spread, and rising interest rates have historically provided a tailwind to merger arbitrage returns. In this favorable environment, our goal, as always, remains to implement strong risk mitigation strategies as we seek to deliver non-correlated return streams with as little volatility as possible. We thank you for your continued support.
Sincerely,
The Investment Team
Water Island Capital
The discussion of market trends and companies throughout this commentary are not intended as advice to any person regarding the advisability of investing in any particular security. Some of our comments are based on current management expectations and are considered "forward-looking statements." Actual future results, however, may prove to be different from our expectations. Our views are a reflection of our best judgment at the time of the commentary and are subject to change any time based on market and other conditions, and we have no obligation to update them.
Glossary
Bloomberg U.S. Aggregate Bond Index: A market value-weighted index of investment grade fixed-rated debt issues, including government, corporate, asset-backed and mortgage-backed securities with a maturity of one year or more.
Convertible Bond: A type of bond that the holder can convert into a specified number of shares of common stock in the issuing company or cash of equal value.
Dry Powder: Cash reserves available to be deployed for investment.
Risk-Free Rate: The theoretical rate of return of an investment with zero risk (frequently represented by interest rates on short-term Treasury Bills in the United States).
Spread (also: "merger spread," "deal spread," or "merger arbitrage spread"): The difference between the price at which a target company's shares currently trade and the price an acquiring company has agreed to pay, which forms the rate of return in a merger arbitrage investment.
S&P 500 Index: An index of the publicly listed stocks of the largest US companies, commonly used as a representation of the performance of the broad domestic stock market.
www.arbitragefunds.com | 1-800-295-4485
2
Arbitrage Fund Manager Commentary
May 31, 2022 (Unaudited)
Arbitrage Fund | Tickers: ARBNX, ARBFX, ARBCX, ARGAX
The Fund's Goal and Main Investments
The Fund seeks to achieve capital growth by engaging in merger arbitrage. Merger arbitrage is a sub-set of a broader event-driven investment strategy, which seeks to profit from investing in securities that are involved in corporate events such as mergers and acquisitions. Typically, merger arbitrage is a low volatility strategy pursued by absolute-return-minded investors. At Water Island Capital, our goal is to capture a return stream with a low correlation to the overall markets.
Investment Strategy
The strategy's focus is to capture returns from corporate events, generate market neutral capital growth, preserve capital, generate consistent and positive returns, and achieve low correlation and low volatility. The Fund generally engages in active and frequent trading of portfolio securities to achieve its principal investment objective. In attempting to achieve its investment strategy, the Fund plans to invest at least 80% of its net assets in equity securities of companies (both U.S. and foreign) that are involved in publicly announced mergers, takeovers, tender offers, leveraged buyouts, spin-offs, liquidations, and other corporate reorganizations. The Fund's investment adviser uses investment strategies designed to minimize market exposure, including short selling along with purchasing and selling options. The most common merger arbitrage activity, and the approach generally used by the Fund, involves purchasing the shares of an announced acquisition target company at a discount to their expected value upon the acquisition's completion. That difference, or "spread," is the primary driver of returns for this investment strategy. There is no limit to the number of stocks the Fund can hold; however, the Fund typically invests in 40 to 80 deals at any given time. Each deal will have one, or perhaps two, equity positions (a long and short position in a stock-for-stock deal) and, in many cases, associated derivative positions for hedging purposes.
Fiscal Year Highlights
Arbitrage Fund Class I (ARBNX) returned -3.62% for the fiscal year ended May 31, 2022. Investments in Europe contributed to returns, while the Americas region was the primary detractor and Asia-Pacific detracted slightly. Health care and real estate were the top performing sectors, while financials and information technology detracted the most from returns.
The Fund may utilize derivatives for several purposes, primarily to implement position-level hedges, portfolio-level hedges, or currency hedges. During the fiscal year, the Fund's investments in derivative instruments contributed to returns. Derivative performance was in line with expectations given prevailing market conditions over the period.
The Fund's top performing deal for the period was our position in the merger of US-based semiconductor manufacturers Xilinx and Advanced Micro Devices. In October 2020, Xilinx agreed to be acquired by Advanced Micro Devices for $35.7 billion in stock. This transaction experienced ongoing volatility in the deal spread, in large part due to its lengthy timeline stemming from continued delays in receiving regulatory approval from China (a required condition to complete the deal, where antitrust reviews are a notoriously opaque process). The companies ultimately received approval from China in February 2022 and the merger subsequently closed successfully, leading to gains for the Fund.
The second-best performer was our position in RR Donnelley & Sons (RR Donnelley), a US-based provider of printing and related services to publishing, financial, merchandising, and other industries. In October 2021, the company reached an agreement with Chatham Asset Management (Chatham), a US-based investment advisory firm, whereby Chatham would acquire
Annual Report | May 31, 2022
3
Arbitrage Fund Manager Commentary (continued)
May 31, 2022 (Unaudited)
the remaining 85% stake of RR Donnelley it did not already own for $464 million in cash. RR Donnelley subsequently received competing bids from private equity firm Atlas Holdings and an undisclosed interloper, spurring Chatham to increase its offer no fewer than four times. The undisclosed interloper, later revealed to be Ireland-based business communications company Paragon Group, attempted to make one final bid but was unable to secure the financing required. RR Donnelley's board officially recommended Chatham's superior offer in February 2022 and shareholders accepted the deal, which closed just two days later as the lengthy timeline meant the waiting period for antitrust review had already passed. The bidding war and subsequent closure led to gains for the Fund.
Conversely, the top detractor in the portfolio for the period was our position in the failed merger Willis Towers Watson Plc (Willis Towers) and Aon. In March 2020, Willis Towers, a UK-based provider of insurance brokerage services, agreed to be acquired by Aon, a US-based peer, for $30.3 billion in stock. The companies had already agreed to remedies with competition regulators in all required jurisdictions but one – the United States – when, following a second request from US regulators, the Department of Justice (DOJ) sued to block the merger in June 2021. While many expected the companies to not only fight the DOJ in court, but ultimately emerge victorious, in July they announced their intent to instead abandon the planned merger. After the deal broke, the spread on this position traded through what we believed to be fair value on a standalone basis, as many event-driven investors sought to unwind their exposure at the same time. Rather than follow suit, we opted to maintain our exposure and take advantage of the volatility by trading around our position. In the aftermath of the deal break, multiple activist investors have initiated positions in Willis Towers and gained board seats, and we continue to unwind our exposure on strength as they seek to implement constructive changes at the company or even push for another sale.
The Fund's second-worst performer was our position in terminated acquisition of Momentive Global, Inc. (Momentive) by Zendesk, Inc. (Zendesk). In October 2021, Zendesk – a US-based developer of software for customer support and customer communications – agreed to acquire Momentive – a US-based developer of software for conducting web-based surveys – for $4.1 billion in stock, after an activist investor in Momentive pushed for a sale process. In January, however, yet another activist investor – this time at Zendesk – began to push Zendesk's board of directors and management to reject the acquisition, believing the company should instead be put up for sale itself. The very next month, Zendesk management rejected an offer from a private equity consortium that would have valued the company at $17 billion – yet Zendesk shareholders appear to have agreed with the activist, as they overwhelmingly rejected the Momentive deal mere days later. Subsequent share price volatility has led to mark-to-market losses for the Fund; however, we are maintaining our Momentive exposure as not only has its activist reemerged, but the proxy background of the Zendesk merger indicated there were at least two other interested parties who put forth bids for the company before Zendesk won the initial sale process. We believe there is more left to this story.
www.arbitragefunds.com | 1-800-295-4485
4
Arbitrage Fund Portfolio Information
May 31, 2022 (Unaudited)
Performance^ (annualized returns as of May 31, 2022)
|
One Year |
Five Year |
Ten Year |
Since Inception* |
||||||||||||||||
|
Arbitrage Fund, Class R |
-3.83 |
% |
2.13 |
% |
1.95 |
% |
3.71 |
% |
|||||||||||
|
Arbitrage Fund, Class I |
-3.62 |
% |
2.37 |
% |
2.20 |
% |
2.91 |
% |
|||||||||||
|
Arbitrage Fund, Class C** |
-5.46 |
%# |
1.36 |
% |
1.20 |
% |
1.20 |
% |
|||||||||||
|
Arbitrage Fund, Class A*** |
-6.41 |
% |
1.60 |
% |
N/A |
1.84 |
% |
||||||||||||
|
ICE BofA U.S. 3-Month Treasury Bill Index |
0.14 |
% |
1.12 |
% |
0.64 |
% |
1.48 |
% |
|||||||||||
Current performance may be higher or lower than performance quoted above. Any performance data quoted represents past performance and the investment return and principal value of an investment in the Fund will fluctuate so that an investor's shares, when redeemed, may be worth more or less than their original cost. Past performance is no guarantee of future results. Returns shown above include the reinvestment of all dividends and capital gains. Performance results do not include adjustments made for financial reporting purposes in accordance with U.S. generally accepted accounting principles and may differ from the amount reported in the Financial Highlights. You can obtain performance data current to the most recent month end by calling 1-800-295-4485 or going to www.arbitragefunds.com. This table does not reflect the deduction of taxes that a shareholder would pay on Fund distributions or the redemption of Fund shares.
^ After sales charge.
* Class R inception: 9/18/00; Class I inception: 10/17/03; Class C inception: 6/1/12; Class A inception: 6/1/13. The "Since Inception" returns for securities indices are for the inception date of Class R shares.
# Class C One Year return includes load.
** Class C shares are subject to a 1.00% contingent deferred sales charge on all purchases redeemed within 12 months of purchase.
*** Class A shares are subject to a maximum front-end sales load of 2.75% on purchases up to $250,000. The shares are also subject to a deferred sales charge of up to 1.00% on purchases of $250,000 or more purchased without a front-end sales charge and redeemed within 18 months of purchase.
The Total Annual Fund Operating Expenses for Class R, Class I, Class C and Class A are 1.74%, 1.49%, 2.49% and 1.74%, respectively. These expense ratios are as stated in the current prospectus and may differ from the expense ratios disclosed in the financial highlights in this report.
The ICE BofA U.S. 3-Month Treasury Bill Index tracks the performance of the U.S. dollar denominated U.S. Treasury Bills publicly issued in the U.S. domestic market with a remaining term to final maturity of less than 3 months.
An investor may not invest directly in an index.
Annual Report | May 31, 2022
5
Arbitrage Fund Portfolio Information (continued)
May 31, 2022 (Unaudited)
Growth of $10,000 Investment
The chart represents historical performance of a hypothetical investment of $10,000 in the Class R shares of the Fund over ten years. Past performance does not guarantee future results. This chart does not reflect the deduction of taxes that a shareholder would pay on Fund distributions or the redemption of Fund shares.

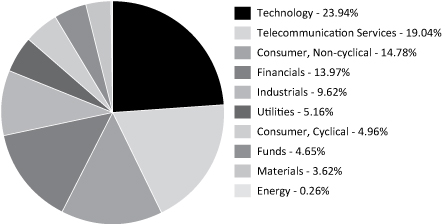
Sector Weighting
The following chart shows the sector weightings of the Arbitrage Fund's investments (including short sales and excluding derivatives) as of the report date.
www.arbitragefunds.com | 1-800-295-4485
6
Arbitrage Fund Portfolio of Investments
May 31, 2022
|
Shares |
Value |
||||||||||
|
COMMON STOCKS - 90.74% |
|||||||||||
|
Aerospace & Defense - 1.02% |
|||||||||||
|
Aerojet Rocketdyne Holdings, Inc.(a) |
398,470 |
$ |
16,233,668 |
||||||||
|
Agriculture - 0.25% |
|||||||||||
|
Swedish Match AB |
382,874 |
3,955,784 |
|||||||||
|
Auto Parts & Equipment - 2.85% |
|||||||||||
|
Meritor, Inc.(a)(b) |
639,277 |
23,122,649 |
|||||||||
|
Tenneco, Inc., Class A(a)(b) |
1,286,524 |
22,269,731 |
|||||||||
|
45,392,380 |
|||||||||||
|
Banks - 2.32% |
|||||||||||
|
First Horizon Corp.(b) |
1,615,213 |
36,875,313 |
|||||||||
|
Biotechnology - 2.56% |
|||||||||||
|
Biohaven Pharmaceutical Holding Co. Ltd.(a) |
109,709 |
15,768,474 |
|||||||||
|
Sierra Oncology, Inc.(a) |
226,274 |
12,395,290 |
|||||||||
|
Swedish Orphan Biovitrum AB(a) |
602,602 |
12,600,037 |
|||||||||
|
40,763,801 |
|||||||||||
|
Chemicals - 3.30% |
|||||||||||
|
Atotech Ltd.(a) |
765,654 |
15,550,433 |
|||||||||
|
Rogers Corp.(a) |
139,564 |
37,037,494 |
|||||||||
|
52,587,927 |
|||||||||||
|
Commercial Services - 4.30% |
|||||||||||
|
Atlantia SpA |
438,459 |
10,623,872 |
|||||||||
|
GXO Logistics, Inc.(a) |
26,134 |
1,418,299 |
|||||||||
|
Moneylion, Inc.(a)(c) |
2,489,318 |
4,381,200 |
|||||||||
|
Nielsen Holdings Plc |
1,526,980 |
39,029,609 |
|||||||||
|
Terminix Global Holdings, Inc.(a) |
302,026 |
13,110,948 |
|||||||||
|
68,563,928 |
|||||||||||
|
Computers & Computer Services - 1.10% |
|||||||||||
|
Avast Plc(d) |
1,155,291 |
7,070,732 |
|||||||||
|
Tufin Software Technologies Ltd.(a) |
827,000 |
10,478,090 |
|||||||||
|
17,548,822 |
|||||||||||
|
Construction Materials - 2.79% |
|||||||||||
|
Cornerstone Building Brands, Inc.(a) |
1,172,705 |
28,789,908 |
|||||||||
|
Forterra, Inc.(a)(e) |
653,007 |
15,672,168 |
|||||||||
|
44,462,076 |
|||||||||||
See Notes to Financial Statements.
Annual Report | May 31, 2022
7
Arbitrage Fund Portfolio of Investments (continued)
May 31, 2022
|
Shares |
Value |
||||||||||
|
COMMON STOCKS - 90.74% (Continued) |
|||||||||||
|
Diversified Financial Services - 2.32% |
|||||||||||
|
Brewin Dolphin Holdings Plc |
1,576,912 |
$ |
10,134,038 |
||||||||
|
Intertrust N.V.(a)(d) |
562,332 |
11,687,468 |
|||||||||
|
Sanne Group Plc(a) |
1,331,023 |
15,094,995 |
|||||||||
|
36,916,501 |
|||||||||||
|
Electric - 2.84% |
|||||||||||
|
Albioma SA |
157,897 |
8,451,785 |
|||||||||
|
ContourGlobal Plc(d) |
1,734,000 |
5,528,083 |
|||||||||
|
PNM Resources, Inc.(b) |
659,216 |
31,332,536 |
|||||||||
|
45,312,404 |
|||||||||||
|
Electronics - 1.09% |
|||||||||||
|
Coherent, Inc.(a) |
64,093 |
17,366,639 |
|||||||||
|
Energy - Alternate Sources - 0.26% |
|||||||||||
|
Siemens Gamesa Renewable Energy SA(a) |
212,199 |
4,091,400 |
|||||||||
|
Engineering & Construction - 0.96% |
|||||||||||
|
Boskalis Westminster |
300,600 |
10,475,138 |
|||||||||
|
HomeServe Plc |
324,743 |
4,759,096 |
|||||||||
|
15,234,234 |
|||||||||||
|
Entertainment - 0.26% |
|||||||||||
|
LeoVegas AB(d) |
668,000 |
4,110,895 |
|||||||||
|
Food - 1.28% |
|||||||||||
|
Sanderson Farms, Inc.(f) |
102,596 |
20,467,902 |
|||||||||
|
Gas - 2.20% |
|||||||||||
|
South Jersey Industries, Inc.(b) |
1,003,297 |
34,964,900 |
|||||||||
|
Healthcare - Products - 0.50% |
|||||||||||
|
Natus Medical, Inc.(a) |
243,439 |
7,982,365 |
|||||||||
|
Healthcare - Services - 3.00% |
|||||||||||
|
LHC Group, Inc.(a)(b) |
162,432 |
27,070,917 |
|||||||||
|
Tivity Health, Inc.(a) |
638,768 |
20,696,083 |
|||||||||
|
UpHealth, Inc.(a)(c) |
48,973 |
36,436 |
|||||||||
|
47,803,436 |
|||||||||||
|
Insurance - 4.33% |
|||||||||||
|
Alleghany Corp.(a) |
56,222 |
46,876,779 |
|||||||||
|
TOWER Ltd. |
7,208,016 |
3,193,785 |
|||||||||
|
Willis Towers Watson Plc(b)(f) |
89,698 |
18,932,557 |
|||||||||
|
69,003,121 |
|||||||||||
See Notes to Financial Statements.
www.arbitragefunds.com | 1-800-295-4485
8
Arbitrage Fund Portfolio of Investments (continued)
May 31, 2022
|
Shares |
Value |
||||||||||
|
COMMON STOCKS - 90.74% (Continued) |
|||||||||||
|
Internet - 6.97% |
|||||||||||
|
Anaplan, Inc.(a) |
648,354 |
$ |
42,532,022 |
||||||||
|
BasWare Oyj(a) |
114,255 |
4,875,674 |
|||||||||
|
Mandiant, Inc.(a)(b) |
2,042,543 |
45,038,073 |
|||||||||
|
Twitter, Inc.(a) |
467,389 |
18,508,604 |
|||||||||
|
110,954,373 |
|||||||||||
|
Leisure Time - 0.74% |
|||||||||||
|
Accell Group N.V.(a) |
211,060 |
11,725,694 |
|||||||||
|
Machinery - Diversified - 3.32% |
|||||||||||
|
Welbilt, Inc.(a)(b) |
2,236,435 |
52,936,416 |
|||||||||
|
Media - 5.38% |
|||||||||||
|
Houghton Mifflin Harcourt Co.(a)(e) |
1,739,400 |
36,527,400 |
|||||||||
|
TEGNA, Inc.(b) |
1,862,298 |
40,784,326 |
|||||||||
|
Uniti Group Ltd.(a) |
2,346,447 |
8,335,442 |
|||||||||
|
85,647,168 |
|||||||||||
|
Mining - 0.24% |
|||||||||||
|
Yamana Gold, Inc.(f) |
705,400 |
3,780,944 |
|||||||||
|
Pharmaceuticals - 1.63% |
|||||||||||
|
Covetrus, Inc.(a) |
759,796 |
15,818,953 |
|||||||||
|
Vifor Pharma AG(a) |
57,988 |
10,117,068 |
|||||||||
|
25,936,021 |
|||||||||||
|
Real Estate Investment Trusts - 4.11% |
|||||||||||
|
American Campus Communities, Inc. |
329,008 |
21,385,520 |
|||||||||
|
Befimmo SA |
210,440 |
10,618,140 |
|||||||||
|
Bluerock Residential Growth REIT, Inc. |
309,026 |
8,343,702 |
|||||||||
|
CatchMark Timber Trust, Inc., Class A |
677,000 |
7,981,830 |
|||||||||
|
PS Business Parks, Inc. |
91,429 |
17,154,823 |
|||||||||
|
65,484,015 |
|||||||||||
|
Retail - 0.88% |
|||||||||||
|
Vivo Energy Plc(d) |
7,964,865 |
14,031,061 |
|||||||||
|
Semiconductors - 2.69% |
|||||||||||
|
CMC Materials, Inc.(b) |
153,678 |
27,191,785 |
|||||||||
|
Magnachip Semiconductor Corp.(a) |
411,831 |
8,030,704 |
|||||||||
|
Silicon Motion Technology Corp., ADR |
84,763 |
7,654,947 |
|||||||||
|
42,877,436 |
|||||||||||
|
Software - 19.02% |
|||||||||||
|
Activision Blizzard, Inc. |
519,112 |
40,428,442 |
|||||||||
|
Black Knight, Inc.(a) |
79,969 |
5,430,695 |
|||||||||
|
CDK Global, Inc. |
647,661 |
35,271,618 |
|||||||||
See Notes to Financial Statements.
Annual Report | May 31, 2022
9
Arbitrage Fund Portfolio of Investments (continued)
May 31, 2022
|
Shares |
Value |
||||||||||
|
COMMON STOCKS - 90.74% (Continued) |
|||||||||||
|
Software - 19.02% (Continued) |
|||||||||||
|
Cerner Corp. |
313,530 |
$ |
29,738,320 |
||||||||
|
Change Healthcare, Inc.(a)(b) |
1,715,696 |
41,331,117 |
|||||||||
|
Citrix Systems, Inc. |
334,740 |
33,704,971 |
|||||||||
|
Datto Holding Corp.(a) |
450,322 |
15,810,805 |
|||||||||
|
Ideagen Plc |
2,549,970 |
11,181,993 |
|||||||||
|
Inovalon Holdings, Inc., Class A(a)(e) |
405,270 |
16,616,070 |
|||||||||
|
ManTech International Corp., Class A |
125,635 |
12,016,988 |
|||||||||
|
Momentive Global, Inc.(a) |
1,604,381 |
19,541,361 |
|||||||||
|
Onemarket Ltd.(a)(e) |
111,800 |
— |
|||||||||
|
Playtech Plc(a) |
996,000 |
7,028,332 |
|||||||||
|
Sailpoint Technologies Holdings, Inc.(a) |
417,586 |
26,491,656 |
|||||||||
|
VMware, Inc., Class A |
64,641 |
8,280,512 |
|||||||||
|
302,872,880 |
|||||||||||
|
Telecommunications - 6.23% |
|||||||||||
|
NeoPhotonics Corp.(a)(b) |
1,073,920 |
16,549,107 |
|||||||||
|
Plantronics, Inc.(a)(b) |
847,226 |
33,448,482 |
|||||||||
|
Switch, Inc., Class A |
471,426 |
15,910,628 |
|||||||||
|
Vonage Holdings Corp.(a)(f) |
1,716,270 |
33,244,150 |
|||||||||
|
99,152,367 |
|||||||||||
|
TOTAL COMMON STOCKS (Cost $1,487,947,724) |
1,445,035,871 |
||||||||||
|
RIGHTS(a) - 0.13% |
|||||||||||
|
Bristol-Myers Squibb Co. CVR |
857,631 |
771,868 |
|||||||||
|
Contra Adamas Pharmaceuticals, Inc. CVR, Expires 12/31/2024(e) |
1,150,652 |
72,606 |
|||||||||
|
Contra Adamas Pharmaceuticals, Inc. CVR, Expires 12/31/2025(e) |
1,150,652 |
72,491 |
|||||||||
|
Contra Flexion Therapeutics, Inc. CVR, Expires 12/31/2030(e) |
1,411,000 |
920,537 |
|||||||||
|
Contra Zogenix, Inc. CVR(e) |
304,716 |
211,869 |
|||||||||
|
TOTAL RIGHTS (Cost $2,405,892) |
2,049,371 |
||||||||||
|
Maturity Date |
Rate |
Principal Amount |
Value |
||||||||||||||||
|
CONVERTIBLE CORPORATE BONDS - 0.48% |
|||||||||||||||||||
|
Auto Manufacturers - 0.13% |
|||||||||||||||||||
|
Lightning eMotors, Inc.(d) |
05/15/2024 |
7.500 |
% |
$ |
2,596,000 |
$ |
1,979,197 |
||||||||||||
|
Healthcare - Services - 0.17% |
|||||||||||||||||||
|
UpHealth, Inc.(d) |
06/15/2026 |
6.250 |
% |
3,613,000 |
2,689,515 |
||||||||||||||
See Notes to Financial Statements.
www.arbitragefunds.com | 1-800-295-4485
10
Arbitrage Fund Portfolio of Investments (continued)
May 31, 2022
|
Maturity Date |
Rate |
Principal Amount |
Value |
||||||||||||||||
|
CONVERTIBLE CORPORATE BONDS - 0.48% (Continued) |
|||||||||||||||||||
|
Software - 0.18% |
|||||||||||||||||||
|
Kaleyra, Inc.(d) |
06/01/2026 |
6.125 |
% |
$ |
3,525,000 |
$ |
2,925,750 |
||||||||||||
|
TOTAL CONVERTIBLE CORPORATE BONDS (Cost $9,632,245) |
7,594,462 |
||||||||||||||||||
|
Shares |
Value |
||||||||||
|
MUTUAL FUNDS - 4.55% |
|||||||||||
|
Water Island Event-Driven Fund, Class I(g) |
6,605,365 |
$ |
72,394,803 |
||||||||
|
TOTAL MUTUAL FUNDS (Cost $60,632,644) |
72,394,803 |
||||||||||
|
PRIVATE INVESTMENTS(a)(c)(e)(h) - 0.02% |
|||||||||||
|
Fast Capital LLC |
290,700 |
290,700 |
|||||||||
|
TOTAL PRIVATE INVESTMENTS (Cost $300,786) |
290,700 |
||||||||||
|
WARRANTS(a) - 0.00%(i) |
|||||||||||
|
Commercial Services - 0.00%(i) |
|||||||||||
|
Moneylion, Inc., Exercise Price $11.50, Expires 09/22/2026 |
290,320 |
62,186 |
|||||||||
|
Healthcare - Services - 0.00%(i) |
|||||||||||
|
UpHealth, Inc., Exercise Price $11.50, Expires 07/01/2024(c) |
4,897 |
348 |
|||||||||
|
TOTAL WARRANTS (Cost $0) |
62,534 |
||||||||||
|
Expiration Date |
Exercise Price |
Notional Amount |
Contracts |
Value |
|||||||||||||||||||
|
PURCHASED OPTIONS(a) - 0.02% |
|||||||||||||||||||||||
|
Call Option Purchased - 0.00%(i) |
|||||||||||||||||||||||
|
Sanderson Farms, Inc. |
08/2022 |
$ |
210.00 |
$ |
39,900 |
2 |
$ |
260 |
|||||||||||||||
|
TOTAL CALL OPTIONS PURCHASED (Cost $252) |
260 |
||||||||||||||||||||||
|
Put Options Purchased - 0.02% |
|||||||||||||||||||||||
|
Vonage Holdings Corp. |
06/2022 |
19.00 |
215,007 |
111 |
28,860 |
||||||||||||||||||
|
Yamana Gold, Inc. |
07/2022 |
5.50 |
3,780,944 |
7,054 |
366,808 |
||||||||||||||||||
|
TOTAL PUT OPTIONS PURCHASED (Cost $358,344) |
395,668 |
||||||||||||||||||||||
|
TOTAL PURCHASED OPTIONS (Cost $358,596) |
395,928 |
||||||||||||||||||||||
See Notes to Financial Statements.
Annual Report | May 31, 2022
11
Arbitrage Fund Portfolio of Investments (continued)
May 31, 2022
|
Yield |
Shares |
Value |
|||||||||||||
|
SHORT-TERM INVESTMENTS - 1.44% |
|||||||||||||||
|
Money Market Funds |
|||||||||||||||
|
Morgan Stanley Institutional Liquidity Fund - Government Portfolio |
0.711 |
%(j) |
11,495,336 |
$ |
11,495,336 |
||||||||||
|
State Street Institutional U.S. Government Money Market Fund, Premier Class |
0.854 |
%(j) |
11,495,335 |
11,495,335 |
|||||||||||
|
22,990,671 |
|||||||||||||||
|
TOTAL SHORT-TERM INVESTMENTS (Cost $22,990,671) |
22,990,671 |
||||||||||||||
|
Total Investments - 97.38% (Cost $1,584,268,558) |
1,550,814,340 |
||||||||||||||
|
Other Assets in Excess of Liabilities - 2.62%(k) |
41,734,451 |
||||||||||||||
|
NET ASSETS - 100.00% |
$ |
1,592,548,791 |
|||||||||||||
Portfolio Footnotes
(a) Non-income-producing security.
(b) Security, or a portion of security, is being held as collateral for short sales, written option contracts or forward foreign currency exchange contracts. At May 31, 2022, the aggregate fair market value of those securities was $233,694,280, representing 14.67% of net assets.
(c) Restricted securities (including private placements) - The Fund may own investment securities that have other legal or contractual limitations. At the end of the period, the value of restricted securities (excluding 144A issues) amounted to $4,708,684 or 0.30% of net assets.
|
Restricted Security |
Acquisition Date |
Acquisition Cost |
|||||||||
|
Fast Capital LLC |
08/18/2020 |
$ |
300,786 |
||||||||
|
Moneylion, Inc. |
06/19/2020 |
17,080,470 |
|||||||||
|
UpHealth, Inc. |
06/08/2021 |
489,730 |
|||||||||
|
UpHealth, Inc., Exercise Price $11.50, Expires 07/01/2024 |
06/08/2021 |
— |
|||||||||
|
Total |
$ |
17,870,986 |
|||||||||
(d) Security exempt from registration under Rule 144A of the Securities Act of 1933. These securities may be resold in transactions exempt from registration, normally to qualified institutional buyers. As of May 31, 2022, these securities had a total value of $50,022,701 or 3.14% of net assets.
(e) Security fair valued using significant unobservable inputs and classified as a Level 3 security. As of May 31, 2022, the total fair market value of these securities was $70,383,841, representing 4.42% of net assets.
(f) Underlying security for a written/purchased call/put option.
(g) Affiliated investment.
(h) Represents a holding that is a direct investment into a private company and is not a listed or publicly traded entity.
(i) Less than 0.005% of net assets.
(j) Rate shown is the 7-day effective yield as of May 31, 2022.
(k) Includes cash held as collateral for short sales.
See Notes to Financial Statements.
www.arbitragefunds.com | 1-800-295-4485
12
Arbitrage Fund Portfolio of Investments (continued)
May 31, 2022
|
SCHEDULE OF SECURITIES SOLD SHORT |
Shares |
Value |
|||||||||
|
COMMON STOCKS SOLD SHORT - (2.02%) |
|||||||||||
|
Commercial Services - (0.73%) |
|||||||||||
|
GXO Logistics, Inc. |
(26,135 |
) |
$ |
(1,418,346 |
) |
||||||
|
Rentokil Initial Plc |
(1,603,670 |
) |
(10,229,210 |
) |
|||||||
|
(11,647,556 |
) |
||||||||||
|
Diversified Financial Services - (0.07%) |
|||||||||||
|
Intercontinental Exchange, Inc. |
(11,347 |
) |
(1,161,819 |
) |
|||||||
|
Electronics - (0.23%) |
|||||||||||
|
II-VI, Inc. |
(58,323 |
) |
(3,645,187 |
) |
|||||||
|
Internet - (0.06%) |
|||||||||||
|
NortonLifeLock, Inc. |
(34,889 |
) |
(849,198 |
) |
|||||||
|
Real Estate Investment Trusts - (0.51%) |
|||||||||||
|
PotlatchDeltic Corp. |
(155,710 |
) |
(8,168,547 |
) |
|||||||
|
Semiconductors - (0.42%) |
|||||||||||
|
Broadcom, Inc. |
(8,145 |
) |
(4,725,159 |
) |
|||||||
|
MaxLinear, Inc. |
(32,889 |
) |
(1,302,076 |
) |
|||||||
|
MKS Instruments, Inc. |
(5,169 |
) |
(638,371 |
) |
|||||||
|
(6,665,606 |
) |
||||||||||
|
TOTAL SECURITIES SOLD SHORT (Proceeds $35,374,795) |
$ |
(32,137,913 |
) |
||||||||
|
WRITTEN OPTIONS |
Expiration Date |
Exercise Price |
Notional Amount |
Contracts |
Value |
||||||||||||||||||
|
Written Call Options |
|||||||||||||||||||||||
|
Willis Towers Watson Plc |
06/2022 |
$ |
210.00 |
$ |
(1,498,597 |
) |
(71 |
) |
$ |
(39,405 |
) |
||||||||||||
|
TOTAL WRITTEN CALL OPTIONS (Premiums received $49,591) |
(39,405 |
) |
|||||||||||||||||||||
|
TOTAL WRITTEN OPTIONS (Premiums received $49,591) |
$ |
(39,405 |
) |
||||||||||||||||||||
See Notes to Financial Statements.
Annual Report | May 31, 2022
13
Arbitrage Fund Portfolio of Investments (continued)
May 31, 2022
EQUITY SWAP CONTRACTS
|
Swap Counterparty/ Payment Frequency |
Reference Obligation |
Rate Paid/ Received by the Fund |
Termination Date |
Upfront Payments Made |
Upfront Payments Received |
Market Value |
Notional Amount |
Unrealized Appreciation |
|||||||||||||||||||||||||||
|
Goldman Sachs & Co./ Monthly |
Meggitt Plc |
Paid 1 Month SONIA Plus 55 bps (1.488%) |
08/04/2022 |
$ |
— |
$ |
— |
$ |
— |
GBP |
14,407,862 |
$ |
— |
||||||||||||||||||||||
|
Goldman Sachs & Co./ Monthly |
Sanne Group Plc |
Paid 1 Month SONIA Plus 55 bps (1.488%) |
08/31/2022 |
— |
— |
— |
GBP |
5,588,289 |
— |
||||||||||||||||||||||||||
|
Goldman Sachs & Co./ Monthly |
Distell Group Holdings Ltd. |
Paid 1 Month JIBAR Plus 95 bps (5.258%) |
11/18/2022 |
— |
— |
— |
ZAR |
63,977,387 |
— |
||||||||||||||||||||||||||
|
Goldman Sachs & Co./ Monthly |
Schroder Plc |
Paid 1 Month SONIA Plus 47 bps (1.408%) |
04/28/2023 |
— |
— |
148 |
GBP |
2,398,479 |
148 |
||||||||||||||||||||||||||
|
Goldman Sachs & Co./ Monthly |
Stagecoach Group Plc |
Paid 1 Month SONIA Minus 90 bps (1.838%) |
06/16/2023 |
— |
— |
— |
GBP |
3,748,181 |
— |
||||||||||||||||||||||||||
|
Morgan Stanley & Co./ Monthly |
Entegris, Inc. |
Received 1 Month- Federal Rate Minus 40 bps (-0.430%) |
08/11/2023 |
— |
— |
— |
USD |
7,683,869 |
— |
||||||||||||||||||||||||||
See Notes to Financial Statements.
www.arbitragefunds.com | 1-800-295-4485
14
Arbitrage Fund Portfolio of Investments (continued)
May 31, 2022
|
Swap Counterparty/ Payment Frequency |
Reference Obligation |
Rate Paid/ Received by the Fund |
Termination Date |
Upfront Payments Made |
Upfront Payments Received |
Market Value |
Notional Amount |
Unrealized Appreciation |
|||||||||||||||||||||||||||
|
Morgan Stanley & Co./ Monthly |
MKS Instruments, Inc. |
Received 1 Month- Federal Rate Minus 40 bps (-0.430%) |
08/11/2023 |
$ |
— |
$ |
— |
$ |
— |
USD |
4,575,058 |
$ |
— |
||||||||||||||||||||||
|
Morgan Stanley & Co./ Monthly |
Distell Group Holdings Ltd. |
Paid 1 Month SABOR Plus 125 bps (5.810%) |
11/17/2023 |
— |
— |
— |
ZAR |
22,520,201 |
— |
||||||||||||||||||||||||||
|
Morgan Stanley & Co./ Monthly |
Hibernia REIT Plc |
Paid 1 Month EURIBOR Plus 50 bps (1.000%) |
03/25/2024 |
— |
— |
— |
EUR |
12,031,342 |
— |
||||||||||||||||||||||||||
|
Morgan Stanley & Co./ Monthly |
Hibernia REIT Plc |
Received 1 Month EURIBOR Plus 50 bps (0.380%) |
03/25/2024 |
— |
— |
— |
EUR |
11,983,809 |
— |
||||||||||||||||||||||||||
|
Morgan Stanley & Co./ Monthly |
Meggitt Plc |
Paid 1 Month SONIA Plus 54 bps (1.478%) |
04/26/2024 |
— |
— |
— |
GBP |
361,793 |
— |
||||||||||||||||||||||||||
|
Morgan Stanley & Co./ Monthly |
Schroder Plc |
Paid 1 Month SONIA Plus 35 bps (0.830%) |
04/26/2024 |
— |
— |
— |
GBP |
101,153 |
— |
||||||||||||||||||||||||||
See Notes to Financial Statements.
Annual Report | May 31, 2022
15
Arbitrage Fund Portfolio of Investments (continued)
May 31, 2022
|
Swap Counterparty/ Payment Frequency |
Reference Obligation |
Rate Paid/ Received by the Fund |
Termination Date |
Upfront Payments Made |
Upfront Payments Received |
Market Value |
Notional Amount |
Unrealized Appreciation |
|||||||||||||||||||||||||||
|
Morgan Stanley & Co./ Monthly |
Schroder Plc |
Received 1 Month SONIA Plus 0 bps (-0.938%) |
04/26/2024 |
$ |
— |
$ |
— |
$ |
— |
GBP |
2,293,329 |
$ |
— |
||||||||||||||||||||||
|
$ |
148 |
|
$ |
148 |
|||||||||||||||||||||||||||||||
OUTSTANDING FORWARD FOREIGN CURRENCY EXCHANGE CONTRACTS
|
Currency Purchased |
Currency Sold |
Counterparty |
Settlement Date |
Unrealized Appreciation |
|||||||||||||||
|
AUD |
117,300 |
USD |
80,553 |
Morgan Stanley & Co. |
06/15/2022 |
$ |
3,644 |
||||||||||||
|
USD |
30,423,011 |
AUD |
41,131,000 |
Morgan Stanley & Co. |
06/15/2022 |
899,810 |
|||||||||||||
|
CAD |
37,307,400 |
USD |
28,912,959 |
Morgan Stanley & Co. |
06/15/2022 |
579,484 |
|||||||||||||
|
USD |
4,244,780 |
CAD |
5,335,500 |
Morgan Stanley & Co. |
06/15/2022 |
26,933 |
|||||||||||||
|
CHF |
99,200 |
USD |
101,642 |
Morgan Stanley & Co. |
06/15/2022 |
1,845 |
|||||||||||||
|
USD |
135,551 |
CHF |
125,600 |
Morgan Stanley & Co. |
06/15/2022 |
4,522 |
|||||||||||||
|
EUR |
9,299,200 |
USD |
9,790,002 |
Morgan Stanley & Co. |
06/15/2022 |
199,179 |
|||||||||||||
|
USD |
72,047,283 |
EUR |
65,441,600 |
Morgan Stanley & Co. |
06/15/2022 |
1,750,052 |
|||||||||||||
|
GBP |
305,500 |
USD |
380,204 |
Morgan Stanley & Co. |
06/15/2022 |
4,757 |
|||||||||||||
|
USD |
83,900,195 |
GBP |
63,991,100 |
Morgan Stanley & Co. |
06/15/2022 |
3,264,918 |
|||||||||||||
|
USD |
11,560,234 |
NOK |
103,391,700 |
Morgan Stanley & Co. |
06/15/2022 |
528,119 |
|||||||||||||
|
NZD |
252,300 |
USD |
160,728 |
Morgan Stanley & Co. |
06/15/2022 |
3,633 |
|||||||||||||
|
USD |
4,084,664 |
NZD |
5,966,600 |
Morgan Stanley & Co. |
06/15/2022 |
197,719 |
|||||||||||||
|
SEK |
49,340,700 |
USD |
4,963,121 |
Morgan Stanley & Co. |
06/15/2022 |
91,043 |
|||||||||||||
|
USD |
21,050,436 |
SEK |
202,491,200 |
Morgan Stanley & Co. |
06/15/2022 |
308,452 |
|||||||||||||
|
$ |
7,864,110 |
||||||||||||||||||
|
Currency Purchased |
Currency Sold |
Counterparty |
Settlement Date |
Unrealized Depreciation |
|||||||||||||||
|
AUD |
29,492,600 |
USD |
21,790,170 |
Morgan Stanley & Co. |
06/15/2022 |
$ |
(620,833 |
) |
|||||||||||
|
USD |
25,027,084 |
CAD |
31,971,900 |
Morgan Stanley & Co. |
06/15/2022 |
(247,512 |
) |
||||||||||||
|
CHF |
28,100 |
USD |
30,341 |
Morgan Stanley & Co. |
06/15/2022 |
(1,027 |
) |
||||||||||||
|
USD |
1,772 |
CHF |
1,700 |
Morgan Stanley & Co. |
06/15/2022 |
(1 |
) |
||||||||||||
|
EUR |
7,660,300 |
USD |
8,339,902 |
Morgan Stanley & Co. |
06/15/2022 |
(111,223 |
) |
||||||||||||
|
USD |
22,173,491 |
EUR |
21,003,000 |
Morgan Stanley & Co. |
06/15/2022 |
(387,886 |
) |
||||||||||||
|
GBP |
32,907,100 |
USD |
43,121,163 |
Morgan Stanley & Co. |
06/15/2022 |
(1,654,880 |
) |
||||||||||||
|
USD |
21,903,173 |
GBP |
17,613,700 |
Morgan Stanley & Co. |
06/15/2022 |
(291,875 |
) |
||||||||||||
|
NOK |
103,391,700 |
USD |
11,864,180 |
Morgan Stanley & Co. |
06/15/2022 |
(832,064 |
) |
||||||||||||
|
NZD |
993,100 |
USD |
676,362 |
Morgan Stanley & Co. |
06/15/2022 |
(29,407 |
) |
||||||||||||
See Notes to Financial Statements.
www.arbitragefunds.com | 1-800-295-4485
16
Arbitrage Fund Portfolio of Investments (continued)
May 31, 2022
|
Currency Purchased |
Currency Sold |
Counterparty |
Settlement Date |
Unrealized Depreciation |
|||||||||||||||
|
USD |
139,001 |
NZD |
216,300 |
Morgan Stanley & Co. |
06/15/2022 |
$ |
(1,907 |
) |
|||||||||||
|
SEK |
32,885,600 |
USD |
3,467,215 |
Morgan Stanley & Co. |
06/15/2022 |
(98,612 |
) |
||||||||||||
|
USD |
8,320,876 |
SEK |
83,275,400 |
Morgan Stanley & Co. |
06/15/2022 |
(209,355 |
) |
||||||||||||
|
$ |
(4,486,582 |
) |
|||||||||||||||||
The following is a summary of investments classified by country exposure:
|
Country |
% of Net Assets(a) |
||||||
|
United States |
81.41 |
% |
|||||
|
United Kingdom |
5.98 |
% |
|||||
|
Netherlands |
2.13 |
% |
|||||
|
Sweden |
1.30 |
% |
|||||
|
Italy |
0.67 |
% |
|||||
|
Belgium |
0.67 |
% |
|||||
|
Israel |
0.66 |
% |
|||||
|
Switzerland |
0.64 |
% |
|||||
|
France |
0.53 |
% |
|||||
|
Australia |
0.52 |
% |
|||||
|
Republic of Korea |
0.50 |
% |
|||||
|
Taiwan |
0.48 |
% |
|||||
|
Czech Republic |
0.44 |
% |
|||||
|
Isle of Man |
0.44 |
% |
|||||
|
Finland |
0.31 |
% |
|||||
|
Spain |
0.26 |
% |
|||||
|
Canada |
0.24 |
% |
|||||
|
New Zealand |
0.20 |
% |
|||||
|
Other Assets in Excess of Liabilities |
2.62 |
% |
|||||
|
100.00 |
% |
||||||
(a) These percentages represent long positions only and are not net of short positions.
Abbreviations:
AB - Aktiebolag is the Swedish term for a limited company.
ADR - American Depositary Receipt
AG - Aktiengesellschaft is a German term that refers to a corporation that is limited by shares, i.e., owned by shareholders.
AUD - Australian dollar
bps - Basis Points. 100 Basis Points is equal to 1 percentage point.
CAD - Canadian dollar
CHF - Swiss franc
CVR - Contingent Value Rights
EUR - Euro
EURIBOR - Euro Interbank Offered Rate
GBP - British pound
See Notes to Financial Statements.
Annual Report | May 31, 2022
17
Arbitrage Fund Portfolio of Investments (continued)
May 31, 2022
JIBAR - Johannesburg Interbank Agreed Rate
LLC - Limited Liability Company
Ltd. - Limited
NOK - Norwegian krone
N.V. - Naamloze Vennootschap is the Dutch term for a public limited liability corporation.
NZD - New Zealand dollar
Oyj - Osakeyhtio is the Finnish equivalent of a public limited company.
Plc - Public Limited Company
REIT - Real Estate Investment Trust
SA - Generally designates corporations in various countries, mostly those employing civil law. This translates literally in all languages mentioned as anonymous company.
SABOR - South African Benchmark Overnight Rate
SEK - Swedish krona
SONIA - Sterling OverNight Index Average
SpA - Societa per Azione
USD - United States Dollar
ZAR - South African rand
The following table summarizes the Arbitrage Fund's investments and derivative financial instruments categorized in the fair value hierarchy as of May 31, 2022:
|
Investments in Securities at Fair Value* |
Level 1 |
Level 2 |
Level 3 |
Total |
|||||||||||||||
|
Assets |
|||||||||||||||||||
|
Common Stocks |
|||||||||||||||||||
|
Aerospace & Defense |
$ |
16,233,668 |
$ |
— |
$ |
— |
$ |
16,233,668 |
|||||||||||
|
Agriculture |
3,955,784 |
— |
— |
3,955,784 |
|||||||||||||||
|
Auto Parts & Equipment |
45,392,380 |
— |
— |
45,392,380 |
|||||||||||||||
|
Banks |
36,875,313 |
— |
— |
36,875,313 |
|||||||||||||||
|
Biotechnology |
40,763,801 |
— |
— |
40,763,801 |
|||||||||||||||
|
Chemicals |
52,587,927 |
— |
— |
52,587,927 |
|||||||||||||||
|
Commercial Services |
68,563,928 |
— |
— |
68,563,928 |
|||||||||||||||
|
Computers & Computer Services |
17,548,822 |
— |
— |
17,548,822 |
|||||||||||||||
|
Construction Materials |
28,789,908 |
— |
15,672,168 |
44,462,076 |
|||||||||||||||
|
Diversified Financial Services |
36,916,501 |
— |
— |
36,916,501 |
|||||||||||||||
|
Electric |
45,312,404 |
— |
— |
45,312,404 |
|||||||||||||||
|
Electronics |
17,366,639 |
— |
— |
17,366,639 |
|||||||||||||||
|
Energy - Alternate Sources |
4,091,400 |
— |
— |
4,091,400 |
|||||||||||||||
|
Engineering & Construction |
15,234,234 |
— |
— |
15,234,234 |
|||||||||||||||
|
Entertainment |
4,110,895 |
— |
— |
4,110,895 |
|||||||||||||||
|
Food |
20,467,902 |
— |
— |
20,467,902 |
|||||||||||||||
|
Gas |
34,964,900 |
— |
— |
34,964,900 |
|||||||||||||||
|
Healthcare - Products |
7,982,365 |
— |
— |
7,982,365 |
|||||||||||||||
|
Healthcare - Services |
47,803,436 |
— |
— |
47,803,436 |
|||||||||||||||
|
Insurance |
69,003,121 |
— |
— |
69,003,121 |
|||||||||||||||
|
Internet |
110,954,373 |
— |
— |
110,954,373 |
|||||||||||||||
|
Leisure Time |
11,725,694 |
— |
— |
11,725,694 |
|||||||||||||||
|
Machinery - Diversified |
52,936,416 |
— |
— |
52,936,416 |
|||||||||||||||
|
Media |
49,119,768 |
— |
36,527,400 |
85,647,168 |
|||||||||||||||
See Notes to Financial Statements.
www.arbitragefunds.com | 1-800-295-4485
18
Arbitrage Fund Portfolio of Investments (continued)
May 31, 2022
|
Investments in Securities at Fair Value* |
Level 1 |
Level 2 |
Level 3 |
Total |
|||||||||||||||
|
Mining |
$ |
3,780,944 |
$ |
— |
$ |
— |
$ |
3,780,944 |
|||||||||||
|
Pharmaceuticals |
25,936,021 |
— |
— |
25,936,021 |
|||||||||||||||
|
Real Estate Investment Trusts |
65,484,015 |
— |
— |
65,484,015 |
|||||||||||||||
|
Retail |
14,031,061 |
— |
— |
14,031,061 |
|||||||||||||||
|
Semiconductors |
42,877,436 |
— |
— |
42,877,436 |
|||||||||||||||
|
Software |
286,256,810 |
— |
16,616,070 |
302,872,880 |
|||||||||||||||
|
Telecommunications |
99,152,367 |
— |
— |
99,152,367 |
|||||||||||||||
|
Rights |
— |
771,868 |
1,277,503 |
2,049,371 |
|||||||||||||||
|
Convertible Corporate Bonds** |
— |
7,594,462 |
— |
7,594,462 |
|||||||||||||||
|
Mutual Funds |
72,394,803 |
— |
— |
72,394,803 |
|||||||||||||||
|
Private Investments |
— |
— |
290,700 |
290,700 |
|||||||||||||||
|
Warrants** |
62,534 |
— |
— |
62,534 |
|||||||||||||||
|
Purchased Options |
395,928 |
— |
— |
395,928 |
|||||||||||||||
|
Short-Term Investments |
22,990,671 |
— |
— |
22,990,671 |
|||||||||||||||
|
TOTAL |
$ |
1,472,064,169 |
$ |
8,366,330 |
$ |
70,383,841 |
$ |
1,550,814,340 |
|||||||||||
|
Other Financial Instruments*** |
|||||||||||||||||||
|
Assets |
|||||||||||||||||||
|
Forward Foreign Currency Exchange Contracts |
$ |
— |
$ |
7,864,110 |
$ |
— |
$ |
7,864,110 |
|||||||||||
|
Equity Swaps |
148 |
— |
— |
148 |
|||||||||||||||
|
Liabilities |
|||||||||||||||||||
|
Common Stocks** |
(32,137,913 |
) |
— |
— |
(32,137,913 |
) |
|||||||||||||
|
Written Options |
(39,405 |
) |
— |
— |
(39,405 |
) |
|||||||||||||
|
Forward Foreign Currency Exchange Contracts |
— |
(4,486,582 |
) |
— |
(4,486,582 |
) |
|||||||||||||
|
TOTAL |
$ |
(32,177,170 |
) |
$ |
3,377,528 |
$ |
— |
$ |
(28,799,642 |
) |
|||||||||
* Refer to footnote 2 where leveling hierarchy is defined.
** Refer to Portfolio of Investments for sector information.
*** Other financial instruments are instruments such as written options, securities sold short, equity swaps and forward foreign currency exchange contracts.
See Notes to Financial Statements.
Annual Report | May 31, 2022
19
Arbitrage Fund Portfolio of Investments (continued)
May 31, 2022
The following is a reconciliation of the fair valuations using significant unobservable inputs (Level 3) for the Fund's assets and liabilities during the period ended May 31, 2022:
|
Investments in Securities |
Balance as of May 31, 2021 |
Realized Gain (Loss) |
Change in Unrealized Appreciation (Depreciation) |
Purchases |
Sales Proceeds |
Transfers into Level 3 |
Transfers out of Level 3 |
Balance as of May 31, 2022 |
Net change in Unrealized Appreciation (Depreciation) from investments still held as of May 31, 2022 |
||||||||||||||||||||||||||||||
|
Common Stocks |
$ |
85,217,245 |
$ |
5,697,585 |
$ |
(4,644,445 |
) |
$ |
52,795,238 |
$ |
(85,517,289 |
) |
$ |
15,267,304 |
* |
$ |
— |
$ |
68,815,638 |
$ |
777,366 |
||||||||||||||||||
|
Rights |
1,135,875 |
(181,130 |
) |
9,803 |
1,220,105 |
(907,150 |
) |
— |
— |
1,277,503 |
57,398 |
||||||||||||||||||||||||||||
|
Convertible Corporate Bonds |
6,433,715 |
— |
328,097 |
— |
— |
— |
(6,761,812 |
)** |
— |
— |
|||||||||||||||||||||||||||||
|
Private Investments |
1,016,499 |
— |
6,899 |
3,390 |
— |
— |
(736,088 |
)** |
290,700 |
(3,390 |
) |
||||||||||||||||||||||||||||
|
Total |
$ |
93,803,334 |
$ |
5,516,455 |
$ |
(4,299,646 |
) |
$ |
54,018,733 |
$ |
(86,424,439 |
) |
$ |
15,267,304 |
$ |
(7,497,900 |
) |
$ |
70,383,841 |
$ |
831,374 |
||||||||||||||||||
* Common Stock in the amount of $15,267,304 was transferred into Level 3 as a result of a corporate action and is priced using procedures approved by the Board.
** Convertible Corporate Bonds and Private Investments in the amount of $6,761,812 and $736,088 were transferred out of Level 3 upon the conversion to securities that are priced using observable inputs.
The following table summarizes the quantitative inputs used for investments categorized as Level 3 of the fair value hierarchy as of May 31, 2022:
|
Investments in Securities |
Fair Value at May 31, 2022 |
Valuation Technique |
Unobservable Input |
Range of Values |
Weighted Average |
||||||||||||||||||
|
Common Stocks |
$ |
68,815,638 |
Deal Value |
Final determination on Dissent |
$21-$41 |
$26.51 |
|||||||||||||||||
|
Rights |
1,277,503 |
Discounted, probability adjusted value |
Discount Rate, Probability |
10%, 16.14%-40.43% |
10%, 21.95% |
||||||||||||||||||
|
Private Investments |
290,700 |
Cost |
Cost |
$1 |
$1.0000 |
||||||||||||||||||
See Notes to Financial Statements.
www.arbitragefunds.com | 1-800-295-4485
20
Water Island Event-Driven Fund Manager Commentary
May 31, 2022 (Unaudited)
Water Island Event-Driven Fund | Tickers: AEDNX, AEDFX, AGEAX
The Fund's Goal and Main Investments
The Fund seeks to provide capital growth by investing in credit and equity securities involved in specific corporate events, with a focus on low volatility and low correlation relative to the broader capital markets.
Investment Strategy
The Fund's investment process follows a disciplined, fundamental approach that values risk mitigation while identifying compelling risk/reward opportunities available to us as we screen catalyst-driven corporate events, such as mergers and acquisitions, restructurings, refinancings, recapitalizations, spin-offs, litigation, regulatory changes, and bankruptcy. We analyze these events through three core approaches: merger arbitrage, equity special situations, and credit opportunities. We seek to generate investment returns that have low volatility and low correlation compared to the broader capital markets. We do not manage against any particular benchmark and believe that capital preservation in difficult markets is as important as generating positive returns within our low correlated, low volatility event-driven investment strategy. This process and approach have been an integral part of the culture at Water Island Capital since the firm's inception.
Fiscal Year Highlights
Water Island Event-Driven Fund Class I (AEDNX) returned -4.53% for the fiscal year ended May 31, 2022. The primary source of the Fund's negative return was its hard catalyst investments, mainly from both the merger arbitrage and equity special situations sub-strategies. Returns were driven predominantly by the Americas region, while investments in Europe contributed slightly and investments in the Asia-Pacific region detracted slightly. The Fund's top-performing sectors were health care and real estate, while financials and information technology detracted the most from returns.
The Fund may utilize derivatives for several purposes, primarily to implement position-level hedges, portfolio-level hedges, or currency hedges. During the fiscal year, the Fund's investments in derivative instruments contributed to returns. Derivative performance was in line with expectations given prevailing market conditions over the period.
The Fund's top performing deal for the period was our position in the merger of US-based semiconductor manufacturers Xilinx and Advanced Micro Devices. In October 2020, Xilinx agreed to be acquired by Advanced Micro Devices for $35.7 billion in stock. This transaction experienced ongoing volatility in the deal spread, in large part due to its lengthy timeline stemming from continued delays in receiving regulatory approval from China (a required condition to complete the deal, where antitrust reviews are a notoriously opaque process). The companies ultimately received approval from China in February 2022 and the merger subsequently closed successfully, leading to gains for the Fund.
The second-best performer was our position in Monmouth Real Estate Investment Corp. In May 2021, Monmouth Real Estate Investment Corp. – a US-based Real Estate Investment Company (REIT) focused on industrial properties – agreed to be acquired by Equity Commonwealth, a US REIT, for $1.9 billion in stock and cash. With two competing proposals on the table, from Blackwells Capital and Starwood Capital Group Management, Equity Commonwealth was forced to raise its offer to $2.4 billion in August – only to be rejected by shareholders as still too low. We maintained our exposure on speculation of another bid and were rewarded when Industrial Logistics Properties Trust (Industrial Logistics) – a US-based REIT focused
Annual Report | May 31, 2022
21
Water Island Event-Driven Fund Manager Commentary (continued)
May 31, 2022 (Unaudited)
on industrial and logistics properties – entered with a $2.0 billion bid of its own in November. Industrial Logistics completed the acquisition in Q1 2022, leading to gains for the Fund.
Conversely, the top detractor in the portfolio for the period was our position in the failed merger Willis Towers Watson Plc (Willis Towers) and Aon. In March 2020, Willis Towers Watson, a UK-based provider of insurance brokerage services, agreed to be acquired by Aon, a US-based peer, for $30.3 billion in stock. The companies had already agreed to remedies with competition regulators in all required jurisdictions but one – the United States – when, following a second request from US regulators, the Department of Justice (DOJ) sued to block the merger in June 2021. While many expected the companies to not only fight the DOJ in court, but ultimately emerge victorious, in July they announced their intent to instead abandon the planned merger. After the deal broke, the spread on this position traded through what we believed to be fair value on a standalone basis, as many event-driven investors sought to unwind their exposure at the same time. Rather than follow suit, we opted to maintain our exposure and take advantage of the volatility by trading around our position. In the aftermath of the deal break, multiple activist investors have initiated positions in Willis Towers and gained board seats, and we continue to unwind our exposure on strength as they seek to implement constructive changes at the company or even push for another sale.
The Fund's second-worst performer was our position in terminated acquisition of Momentive Global, Inc. (Momentive) by Zendesk, Inc. (Zendesk). In October 2021, Zendesk – a US-based developer of software for customer support and customer communications – agreed to acquire Momentive Global – a US-based developer of software for conducting web-based surveys – for $4.1 billion in stock, after an activist investor in Momentive pushed for a sale process. In January, however, yet another activist investor – this time at Zendesk – began to push Zendesk's board of directors and management to reject the acquisition, believing the company should instead be put up for sale itself. The very next month, Zendesk management rejected an offer from a private equity consortium that would have valued the company at $17 billion – yet Zendesk shareholders appear to have agreed with the activist, as they overwhelmingly rejected the Momentive deal mere days later. Subsequent share price volatility has led to mark-to-market losses for the Fund; however, we are maintaining our Momentive exposure as not only has its activist reemerged, but the proxy background of the Zendesk merger indicated there were at least two other interested parties who put forth bids for the company before Zendesk won the initial sale process. We believe there is more left to this story.
www.arbitragefunds.com | 1-800-295-4485
22
Water Island Event-Driven Fund Portfolio Information
May 31, 2022 (Unaudited)
Performance^ (annualized returns as of May 31, 2022)
|
One Year |
Five Year |
Ten Year |
Since Inception* |
||||||||||||||||
|
Water Island Event-Driven Fund Class R |
-4.75 |
% |
3.43 |
% |
2.04 |
% |
2.20 |
% |
|||||||||||
|
Water Island Event-Driven Fund Class I |
-4.53 |
% |
3.69 |
% |
2.30 |
% |
2.46 |
% |
|||||||||||
|
Water Island Event-Driven Fund, Class A** |
-7.83 |
% |
2.76 |
% |
N/A |
1.61 |
% |
||||||||||||
|
ICE BofA U.S. 3-Month Treasury Bill Index |
0.14 |
% |
1.12 |
% |
0.64 |
% |
0.56 |
% |
|||||||||||
Current performance may be higher or lower than performance quoted above. Any performance data quoted represents past performance, and the investment return and principal value of an investment in the Fund will fluctuate so that an investor's shares, when redeemed, may be worth more or less than their original cost. Past performance is no guarantee of future results. Returns shown above include the reinvestment of all dividends and capital gains. Performance results do not include adjustments made for financial reporting purposes in accordance with U.S. generally accepted accounting principles and may differ from the amount reported in the Financial Highlights. Contractual fee waivers are currently in effect. Without such fee waivers, performance numbers would be reduced. You can obtain performance data current to the most recent month end by calling 1-800-295-4485 or going to www.arbitragefunds.com. This table does not reflect the deduction of taxes that a shareholder would pay on Fund distributions or the redemption of Fund shares.
^ After sales charge.
* Class R and Class I inception: 10/1/10; Class A inception: 6/1/13. The "Since Inception" returns for securities indices are for the inception date of Class R and Class I shares.
** Class A shares are subject to a maximum front-end sales load of 3.25% of the offering price and are also subject to a 1.00% contingent deferred sales load on purchases at or above $250,000 purchased without a front-end sales charge and redeemed within 18 months of purchase.
The Total Annual Fund Operating Expenses for Class R, Class I and Class A are 1.98%, 1.73% and 2.00%, respectively. The Adviser has contractually agreed to limit the total annual operating expenses of the Fund, not including taxes, interest, dividends on short positions, brokerage commissions, acquired fund fees and expenses, and other costs incurred in connection with the purchase or sale of portfolio securities so they do not exceed 1.69%, 1.44% and 1.69% for Class R, Class I and Class A, respectively. The agreement remains in effect until September 30, 2023, unless terminated earlier by the Board of Trustees. These expense ratios are as stated in the current prospectus and may differ from the expense ratios disclosed in the financial highlights in this report.
The ICE BofA U.S. 3-Month Treasury Bill Index tracks the performance of the U.S. dollar denominated U.S. Treasury Bills publicly issued in the U.S. domestic market with a remaining term to final maturity of less than 3 months.
An investor may not invest directly in an index.
Annual Report | May 31, 2022
23
Water Island Event-Driven Fund Portfolio Information (continued)
May 31, 2022 (Unaudited)
Growth of $10,000 Investment
The chart represents historical performance of a hypothetical investment of $10,000 in the Class R shares of the Fund over ten years. Past performance does not guarantee future results. This chart does not reflect the deduction of taxes that a shareholder would pay on Fund distributions or the redemption of Fund shares.

Sector Weighting
The following chart shows the sector weightings of the Water Island Event-Driven Fund's investments (including short sales and excluding derivatives) as of the report date.

* Concentration Risk: If a large percentage of mergers or event-driven investment opportunities taking place within the U.S. are within one industry over a given period of time, the Fund may invest a large portion of its assets in securities of issuers in a single industry for that period of time. During such a period of concentration, the Fund may be subject to greater volatility with respect to its portfolio securities than a fund that is more broadly diversified.
www.arbitragefunds.com | 1-800-295-4485
24
Water Island Event-Driven Fund Portfolio of Investments
May 31, 2022
|
Shares |
Value |
||||||||||
|
COMMON STOCKS - 95.97% |
|||||||||||
|
Aerospace & Defense - 1.57% |
|||||||||||
|
Aerojet Rocketdyne Holdings, Inc.(a) |
43,870 |
$ |
1,787,264 |
||||||||
|
Agriculture - 0.25% |
|||||||||||
|
Swedish Match AB |
27,359 |
282,668 |
|||||||||
|
Auto Parts & Equipment - 2.86% |
|||||||||||
|
Meritor, Inc.(a)(b) |
45,697 |
1,652,861 |
|||||||||
|
Tenneco, Inc., Class A(a) |
92,753 |
1,605,554 |
|||||||||
|
3,258,415 |
|||||||||||
|
Banks - 2.33% |
|||||||||||
|
First Horizon Corp.(b) |
116,450 |
2,658,553 |
|||||||||
|
Biotechnology - 2.88% |
|||||||||||
|
Biohaven Pharmaceutical Holding Co. Ltd.(a) |
7,850 |
1,128,281 |
|||||||||
|
Sierra Oncology, Inc.(a) |
18,819 |
1,030,905 |
|||||||||
|
Swedish Orphan Biovitrum AB(a) |
53,552 |
1,119,739 |
|||||||||
|
3,278,925 |
|||||||||||
|
Chemicals - 2.35% |
|||||||||||
|
Rogers Corp.(a) |
10,067 |
2,671,580 |
|||||||||
|
Commercial Services - 5.09% |
|||||||||||
|
Atlantia SpA |
31,453 |
762,107 |
|||||||||
|
GXO Logistics, Inc.(a) |
1,884 |
102,254 |
|||||||||
|
Moneylion, Inc.(a)(c) |
263,426 |
463,630 |
|||||||||
|
Nielsen Holdings Plc |
137,674 |
3,518,947 |
|||||||||
|
Terminix Global Holdings, Inc.(a) |
21,824 |
947,380 |
|||||||||
|
5,794,318 |
|||||||||||
|
Computers & Computer Services - 0.45% |
|||||||||||
|
Avast Plc(d) |
82,874 |
507,214 |
|||||||||
|
Construction Materials - 2.94% |
|||||||||||
|
Cornerstone Building Brands, Inc.(a) |
84,513 |
2,074,794 |
|||||||||
|
Forterra, Inc.(a)(e) |
53,067 |
1,273,608 |
|||||||||
|
3,348,402 |
|||||||||||
|
Diversified Financial Services - 1.69% |
|||||||||||
|
Brewin Dolphin Holdings Plc |
112,933 |
725,765 |
|||||||||
|
Intertrust N.V.(a)(d) |
40,339 |
838,403 |
|||||||||
|
Sanne Group Plc(a) |
31,615 |
358,542 |
|||||||||
|
1,922,710 |
|||||||||||
See Notes to Financial Statements.
Annual Report | May 31, 2022
25
Water Island Event-Driven Fund Portfolio of Investments (continued)
May 31, 2022
|
Shares |
Value |
||||||||||
|
COMMON STOCKS - 95.97% (Continued) |
|||||||||||
|
Electric - 2.82% |
|||||||||||
|
Albioma SA |
11,299 |
$ |
604,804 |
||||||||
|
PNM Resources, Inc.(b) |
54,845 |
2,606,783 |
|||||||||
|
3,211,587 |
|||||||||||
|
Electronics - 1.09% |
|||||||||||
|
Coherent, Inc.(a) |
4,582 |
1,241,539 |
|||||||||
|
Energy - Alternate Sources - 0.32% |
|||||||||||
|
Siemens Gamesa Renewable Energy SA(a) |
18,745 |
361,422 |
|||||||||
|
Engineering & Construction - 0.30% |
|||||||||||
|
HomeServe Plc |
23,440 |
343,512 |
|||||||||
|
Entertainment - 0.21% |
|||||||||||
|
Cineplex, Inc.(a) |
23,133 |
236,113 |
|||||||||
|
Food - 1.48% |
|||||||||||
|
Sanderson Farms, Inc.(b) |
8,434 |
1,682,583 |
|||||||||
|
Gas - 2.20% |
|||||||||||
|
South Jersey Industries, Inc. |
71,772 |
2,501,254 |
|||||||||
|
Healthcare - Products - 0.58% |
|||||||||||
|
Natus Medical, Inc.(a) |
20,244 |
663,801 |
|||||||||
|
Healthcare - Services - 3.30% |
|||||||||||
|
LHC Group, Inc.(a)(b) |
13,509 |
2,251,410 |
|||||||||
|
Tivity Health, Inc.(a) |
46,138 |
1,494,871 |
|||||||||
|
UpHealth, Inc.(a)(c) |
8,340 |
6,205 |
|||||||||
|
3,752,486 |
|||||||||||
|
Insurance - 5.56% |
|||||||||||
|
Alleghany Corp.(a) |
5,083 |
4,238,104 |
|||||||||
|
Hartford Financial Services Group, Inc. (The) |
5,355 |
388,291 |
|||||||||
|
Willis Towers Watson Plc(f) |
8,064 |
1,702,068 |
|||||||||
|
6,328,463 |
|||||||||||
|
Internet - 7.87% |
|||||||||||
|
Anaplan, Inc.(a) |
53,780 |
3,527,968 |
|||||||||
|
Just Eat Takeaway.com N.V.(a)(d) |
7,623 |
170,139 |
|||||||||
|
Mandiant, Inc.(a)(b) |
169,425 |
3,735,821 |
|||||||||
|
Twitter, Inc.(a) |
38,557 |
1,526,857 |
|||||||||
|
8,960,785 |
|||||||||||
|
Leisure Time - 0.76% |
|||||||||||
|
Accell Group N.V.(a) |
15,662 |
870,121 |
|||||||||
See Notes to Financial Statements.
www.arbitragefunds.com | 1-800-295-4485
26
Water Island Event-Driven Fund Portfolio of Investments (continued)
May 31, 2022
|
Shares |
Value |
||||||||||
|
COMMON STOCKS - 95.97% (Continued) |
|||||||||||
|
Lodging - 0.27% |
|||||||||||
|
Crown Resorts Ltd.(a) |
33,674 |
$ |
310,293 |
||||||||
|
Machinery - Diversified - 3.35% |
|||||||||||
|
Welbilt, Inc.(a)(b) |
161,311 |
3,818,231 |
|||||||||
|
Media - 6.00% |
|||||||||||
|
Uniti Group Ltd.(a) |
168,879 |
599,920 |
|||||||||
|
Houghton Mifflin Harcourt Co.(a)(e) |
156,912 |
3,295,152 |
|||||||||
|
TEGNA, Inc.(b) |
134,325 |
2,941,718 |
|||||||||
|
6,836,790 |
|||||||||||
|
Pharmaceuticals - 1.94% |
|||||||||||
|
Covetrus, Inc.(a) |
62,524 |
1,301,750 |
|||||||||
|
Vifor Pharma AG(a) |
5,200 |
907,235 |
|||||||||
|
2,208,985 |
|||||||||||
|
Real Estate Investment Trusts - 2.82% |
|||||||||||
|
American Campus Communities, Inc. |
27,363 |
1,778,595 |
|||||||||
|
PS Business Parks, Inc. |
7,604 |
1,426,739 |
|||||||||
|
3,205,334 |
|||||||||||
|
Retail - 0.89% |
|||||||||||
|
Vivo Energy Plc(d) |
573,534 |
1,010,349 |
|||||||||
|
Semiconductors - 2.84% |
|||||||||||
|
CMC Materials, Inc.(b) |
11,034 |
1,952,356 |
|||||||||
|
Magnachip Semiconductor Corp.(a) |
37,044 |
722,358 |
|||||||||
|
Silicon Motion Technology Corp., ADR |
6,131 |
553,691 |
|||||||||
|
3,228,405 |
|||||||||||
|
Software - 22.97% |
|||||||||||
|
Activision Blizzard, Inc. |
43,059 |
3,353,435 |
|||||||||
|
Black Knight, Inc.(a) |
5,765 |
391,501 |
|||||||||
|
CDK Global, Inc. |
53,698 |
2,924,393 |
|||||||||
|
Cerner Corp. |
25,774 |
2,444,664 |
|||||||||
|
Change Healthcare, Inc.(a)(b) |
214,421 |
5,165,402 |
|||||||||
|
Citrix Systems, Inc. |
27,753 |
2,794,450 |
|||||||||
|
Datto Holding Corp.(a) |
37,046 |
1,300,685 |
|||||||||
|
Ideagen Plc |
182,416 |
799,921 |
|||||||||
|
Inovalon Holdings, Inc., Class A(a)(e) |
37,435 |
1,534,835 |
|||||||||
|
ManTech International Corp., Class A |
10,421 |
996,769 |
|||||||||
|
Momentive Global, Inc.(a) |
135,658 |
1,652,314 |
|||||||||
|
Sailpoint Technologies Holdings, Inc.(a) |
34,638 |
2,197,435 |
|||||||||
|
VMware, Inc., Class A |
4,624 |
592,334 |
|||||||||
|
26,148,138 |
|||||||||||
See Notes to Financial Statements.
Annual Report | May 31, 2022
27
Water Island Event-Driven Fund Portfolio of Investments (continued)
May 31, 2022
|
Shares |
Value |
||||||||||
|
COMMON STOCKS - 95.97% (Continued) |
|||||||||||
|
Telecommunications - 5.99% |
|||||||||||
|
Plantronics, Inc.(a)(b) |
69,892 |
$ |
2,759,336 |
||||||||
|
Switch, Inc., Class A |
39,104 |
1,319,760 |
|||||||||
|
Vonage Holdings Corp.(a)(f) |
141,768 |
2,746,046 |
|||||||||
|
6,825,142 |
|||||||||||
|
TOTAL COMMON STOCKS (Cost $113,060,933) |
109,255,382 |
||||||||||
|
RIGHTS(a) - 0.07% |
|||||||||||
|
Bristol-Myers Squibb Co. CVR |
67,803 |
61,023 |
|||||||||
|
Contra Zogenix, Inc. CVR(e) |
26,158 |
18,187 |
|||||||||
|
TOTAL RIGHTS (Cost $128,568) |
79,210 |
||||||||||
|
Maturity Date |
Rate |
Principal Amount |
Value |
||||||||||||||||
|
CORPORATE BONDS - 2.84% |
|||||||||||||||||||
|
Auto Parts & Equipment - 1.80% |
|||||||||||||||||||
|
Meritor, Inc.(d) |
12/15/2028 |
4.500 |
% |
$ |
723,000 |
$ |
714,324 |
||||||||||||
|
Tenneco, Inc.(d) |
04/15/2029 |
5.125 |
% |
1,357,000 |
1,329,758 |
||||||||||||||
|
2,044,082 |
|||||||||||||||||||
|
Entertainment - 1.04% |
|||||||||||||||||||
|
Peninsula Pacific Entertainment LLC / Peninsula Pacific Entertainment Finance In(d) |
11/15/2027 |
8.500 |
% |
1,090,000 |
1,182,732 |
||||||||||||||
|
TOTAL CORPORATE BONDS (Cost $3,305,834) |
3,226,814 |
||||||||||||||||||
|
CONVERTIBLE CORPORATE BONDS - 1.44% |
|||||||||||||||||||
|
Auto Manufacturers - 0.27% |
|||||||||||||||||||
|
Lightning eMotors, Inc.(d) |
05/15/2024 |
7.500 |
% |
403,000 |
307,248 |
||||||||||||||
|
Entertainment - 0.34% |
|||||||||||||||||||
|
Cineplex, Inc.(d) |
09/30/2025 |
5.750 |
% |
392,000 |
390,497 |
||||||||||||||
|
Healthcare - Services - 0.40% |
|||||||||||||||||||
|
UpHealth, Inc.(d) |
06/15/2026 |
6.250 |
% |
616,000 |
458,550 |
||||||||||||||
|
Software - 0.43% |
|||||||||||||||||||
|
Kaleyra, Inc.(d) |
06/01/2026 |
6.125 |
% |
584,000 |
484,720 |
||||||||||||||
|
TOTAL CONVERTIBLE CORPORATE BONDS (Cost $1,885,564) |
1,641,015 |
||||||||||||||||||
See Notes to Financial Statements.
www.arbitragefunds.com | 1-800-295-4485
28
Water Island Event-Driven Fund Portfolio of Investments (continued)
May 31, 2022
|
Shares |
Value |
||||||||||
|
WARRANTS(a) - 0.00%(g) |
|||||||||||
|
Commercial Services - 0.00%(g) |
|||||||||||
|
Moneylion, Inc., Exercise Price $11.50, Expires 09/22/2026 |
22,640 |
$ |
4,850 |
||||||||
|
Healthcare - Services - 0.00%(g) |
|||||||||||
|
UpHealth, Inc., Exercise Price $11.50, Expires 07/01/2024(c) |
834 |
59 |
|||||||||
|
TOTAL WARRANTS (Cost $0) |
4,909 |
||||||||||
|
PRIVATE INVESTMENTS(a)(c)(e)(h) - 0.02% |
|||||||||||
|
Fast Capital LLC |
22,800 |
22,800 |
|||||||||
|
TOTAL PRIVATE INVESTMENTS (Cost $23,591) |
22,800 |
||||||||||
|
Expiration Date |
Exercise Price |
Notional Amount |
Contracts |
Value |
|||||||||||||||||||
|
PURCHASED OPTIONS(a) - 0.00%(g) |
|||||||||||||||||||||||
|
Put Options Purchased - 0.00%(g) |
|||||||||||||||||||||||
|
Vonage Holdings Corp. |
06/2022 |
$ |
19.00 |
$ |
17,433 |
9 |
$ |
2,340 |
|||||||||||||||
|
TOTAL PUT PURCHASED OPTIONS (Cost $189) |
2,340 |
||||||||||||||||||||||
|
TOTAL PURCHASED OPTIONS (Cost $189) |
2,340 |
||||||||||||||||||||||
|
Total Investments - 100.34% (Cost $118,404,679) |
114,232,470 |
||||||||||||||||||||||
|
Liabilities in Excess of Other Assets - (0.34%)(i) |
(390,728 |
) |
|||||||||||||||||||||
|
NET ASSETS - 100.00% |
$ |
113,841,742 |
|||||||||||||||||||||
Portfolio Footnotes
(a) Non-income-producing security.
(b) Security, or a portion of security, is being held as collateral for short sales, written option contracts or forward foreign currency exchange contracts. At May 31, 2022, the aggregate fair market value of those securities was $18,462,190, representing 16.22% of net assets.
(c) Restricted securities (including private placements) - The Fund may own investment securities that have other legal or contractual limitations. At the end of the period, the value of restricted securities (excluding 144A issues) amounted to $492,694 or 0.43% of net assets.
See Notes to Financial Statements.
Annual Report | May 31, 2022
29
Water Island Event-Driven Fund Portfolio of Investments (continued)
May 31, 2022
|
Restricted Security |
Acquisition Date |
Acquisition Cost |
|||||||||
|
Fast Capital LLC |
08/18/2020 |
$ |
23,591 |
||||||||
|
Moneylion, Inc. |
06/19/2020 |
1,926,135 |
|||||||||
|
UpHealth, Inc. |
06/08/2021 |
83,400 |
|||||||||
|
UpHealth, Inc., Exercise Price $11.50, Expires 07/01/2024 |
06/08/2021 |
— |
|||||||||
|
Total |
$ |
2,033,126 |
|||||||||
(d) Security exempt from registration under Rule 144A of the Securities Act of 1933. These securities may be resold in transactions exempt from registration, normally to qualified institutional buyers. As of May 31, 2022, these securities had a total value of $7,393,934 or 6.49% of net assets.
(e) Security fair valued using significant unobservable inputs and classified as a Level 3 security. As of May 31, 2022, the total fair market value of these securities was $6,144,582, representing 5.40% of net assets.
(f) Underlying security for a written/purchased call/put option.
(g) Less than 0.005% of net assets.
(h) Represents a holding that is a direct investment into a private company and is not a listed or publicly traded entity.
(i) Includes cash held as collateral for short sales and written option contracts.
|
SCHEDULE OF SECURITIES SOLD SHORT |
Shares |
Value |
|||||||||
|
COMMON STOCKS SOLD SHORT - (1.50%) |
|||||||||||
|
Commercial Services - (0.74%) |
|||||||||||
|
GXO Logistics, Inc. |
(1,884 |
) |
$ |
(102,245 |
) |
||||||
|
Rentokil Initial Plc |
(115,879 |
) |
(739,148 |
) |
|||||||
|
(841,393 |
) |
||||||||||
|
Diversified Financial Services - (0.07%) |
|||||||||||
|
Intercontinental Exchange, Inc. |
(818 |
) |
(83,755 |
) |
|||||||
|
Electronics - (0.23%) |
|||||||||||
|
II-VI, Inc. |
(4,170 |
) |
(260,625 |
) |
|||||||
|
Entertainment - (0.03%) |
|||||||||||
|
Cineplex, Inc. |
(3,228 |
) |
(32,947 |
) |
|||||||
|
Internet - (0.05%) |
|||||||||||
|
NortonLifeLock, Inc. |
(2,503 |
) |
(60,923 |
) |
|||||||
|
Semiconductors - (0.38%) |
|||||||||||
|
Broadcom, Inc. |
(583 |
) |
(338,216 |
) |
|||||||
|
MaxLinear, Inc. |
(2,379 |
) |
(94,185 |
) |
|||||||
|
(432,401 |
) |
||||||||||
|
TOTAL SECURITIES SOLD SHORT (Proceeds $1,940,348) |
$ |
(1,712,044 |
) |
||||||||
See Notes to Financial Statements.
www.arbitragefunds.com | 1-800-295-4485
30
Water Island Event-Driven Fund Portfolio of Investments (continued)
May 31, 2022
|
WRITTEN OPTIONS |
Expiration Date |
Exercise Price |
Notional Amount |
Contracts |
Value |
||||||||||||||||||
|
Written Call Options |
|||||||||||||||||||||||
|
Willis Towers Watson Plc |
06/2022 |
$ |
210.00 |
$ |
(126,642 |
) |
(6 |
) |
$ |
(3,330 |
) |
||||||||||||
|
TOTAL WRITTEN CALL OPTIONS (Premiums received $4,191) |
(3,330 |
) |
|||||||||||||||||||||
|
TOTAL WRITTEN OPTIONS (Premiums received $4,191) |
$ |
(3,330 |
) |
||||||||||||||||||||
EQUITY SWAP CONTRACTS
|
Swap Counterparty/ Payment Frequency |
Reference Obligation |
Rate Paid/ Received by the Fund |
Termination Date |
Upfront Payments Made |
Upfront Payments Received |
Market Value |
Notional Amount |
Unrealized Appreciation |
|||||||||||||||||||||||||||
|
Goldman Sachs & Co./ Monthly |
Meggitt Plc |
Paid 1 Month SONIA Plus 55 bps (1.488%) |
08/04/2022 |
$ |
— |
$ |
— |
$ |
— |
GBP |
1,039,562 |
$ |
— |
||||||||||||||||||||||
|
Goldman Sachs & Co./ Monthly |
Distell Group Holdings Ltd. |
Paid 1 Month JIBAR Plus 95 bps (5.258%) |
11/18/2022 |
— |
— |
— |
ZAR |
5,122,879 |
— |
||||||||||||||||||||||||||
|
Goldman Sachs & Co./ Monthly |
Stagecoach Group Plc |
Paid 1 Month SONIA Minus 90 bps (1.838%) |
03/13/2023 |
— |
— |
— |
GBP |
269,788 |
— |
||||||||||||||||||||||||||
|
Goldman Sachs & Co./ Monthly |
Sanne Group Plc |
Paid 1 Month SONIA Plus 47 bps (1.408%) |
06/15/2023 |
— |
— |
— |
GBP |
449,685 |
— |
||||||||||||||||||||||||||
|
Morgan Stanley & Co./ Monthly |
Entegris, Inc. |
Received 1 Month- Federal Rate Minus 40 bps (-0.430%) |
08/18/2023 |
— |
— |
— |
USD |
551,693 |
— |
||||||||||||||||||||||||||
See Notes to Financial Statements.
Annual Report | May 31, 2022
31
Water Island Event-Driven Fund Portfolio of Investments (continued)
May 31, 2022
|
Swap Counterparty/ Payment Frequency |
Reference Obligation |
Rate Paid/ Received by the Fund |
Termination Date |
Upfront Payments Made |
Upfront Payments Received |
Market Value |
Notional Amount |
Unrealized Appreciation |
|||||||||||||||||||||||||||
|
Morgan Stanley & Co./ Monthly |
Distell Group Holdings Ltd. |
Paid 1 Month SABOR Plus 125 bps (5.810%) |
11/17/2023 |
$ |
— |
$ |
— |
$ |
— |
ZAR |
1,200,340 |
$ |
— |
||||||||||||||||||||||
|
Morgan Stanley & Co./ Monthly |
Meggitt Plc |
Paid 1 Month SONIA Plus 54 bps (1.470%) |
04/26/2024 |
— |
— |
— |
GBP |
24,405 |
— |
||||||||||||||||||||||||||
|
$ |
— |
$ |
— |
||||||||||||||||||||||||||||||||
OUTSTANDING FORWARD FOREIGN CURRENCY EXCHANGE CONTRACTS
|
Currency Purchased |
Currency Sold |
Counterparty |
Settlement Date |
Unrealized Appreciation |
|||||||||||||||
|
AUD |
12,800 |
USD |
8,790 |
Morgan Stanley & Co. |
06/15/2022 |
$ |
398 |
||||||||||||
|
USD |
3,100,065 |
AUD |
4,197,800 |
Morgan Stanley & Co. |
06/15/2022 |
86,948 |
|||||||||||||
|
CAD |
3,427,800 |
USD |
2,659,670 |
Morgan Stanley & Co. |
06/15/2022 |
50,091 |
|||||||||||||
|
USD |
424,709 |
CAD |
534,100 |
Morgan Stanley & Co. |
06/15/2022 |
2,490 |
|||||||||||||
|
CHF |
9,000 |
USD |
9,222 |
Morgan Stanley & Co. |
06/15/2022 |
167 |
|||||||||||||
|
USD |
12,407 |
CHF |
11,500 |
Morgan Stanley & Co. |
06/15/2022 |
410 |
|||||||||||||
|
USD |
2,647,156 |
EUR |
2,409,900 |
Morgan Stanley & Co. |
06/15/2022 |
58,447 |
|||||||||||||
|
USD |
4,927,322 |
GBP |
3,759,500 |
Morgan Stanley & Co. |
06/15/2022 |
189,971 |
|||||||||||||
|
SEK |
4,860,000 |
USD |
489,413 |
Morgan Stanley & Co. |
06/15/2022 |
8,418 |
|||||||||||||
|
USD |
2,032,171 |
SEK |
19,550,400 |
Morgan Stanley & Co. |
06/15/2022 |
29,543 |
|||||||||||||
|
$ |
426,883 |
||||||||||||||||||
|
Currency Purchased |
Currency Sold |
Counterparty |
Settlement Date |
Unrealized Depreciation |
|||||||||||||||
|
AUD |
2,928,500 |
USD |
2,163,194 |
Morgan Stanley & Co. |
06/15/2022 |
$ |
(61,161 |
) |
|||||||||||
|
USD |
2,849,366 |
CAD |
3,640,700 |
Morgan Stanley & Co. |
06/15/2022 |
(28,699 |
) |
||||||||||||
|
CHF |
2,600 |
USD |
2,809 |
Morgan Stanley & Co. |
06/15/2022 |
(96 |
) |
||||||||||||
|
USD |
103 |
CHF |
100 |
Morgan Stanley & Co. |
06/15/2022 |
(1 |
) |
||||||||||||
|
EUR |
62,100 |
USD |
67,954 |
Morgan Stanley & Co. |
06/15/2022 |
(1,247 |
) |
||||||||||||
|
USD |
1,225,079 |
EUR |
1,159,400 |
Morgan Stanley & Co. |
06/15/2022 |
(20,347 |
) |
||||||||||||
|
GBP |
2,489,300 |
USD |
3,262,357 |
Morgan Stanley & Co. |
06/15/2022 |
(125,586 |
) |
||||||||||||
|
USD |
1,099,534 |
GBP |
884,700 |
Morgan Stanley & Co. |
06/15/2022 |
(15,277 |
) |
||||||||||||
|
SEK |
4,244,300 |
USD |
450,384 |
Morgan Stanley & Co. |
06/15/2022 |
(15,624 |
) |
||||||||||||
|
USD |
328,300 |
SEK |
3,314,300 |
Morgan Stanley & Co. |
06/15/2022 |
(11,197 |
) |
||||||||||||
|
$ |
(279,235 |
) |
|||||||||||||||||
See Notes to Financial Statements.
www.arbitragefunds.com | 1-800-295-4485
32
Water Island Event-Driven Fund Portfolio of Investments (continued)
May 31, 2022
The following is a summary of investments classified by country exposure:
|
Country |
% of Net Assets(a) |
||||||
|
United States |
87.88 |
% |
|||||
|
United Kingdom |
4.34 |
% |
|||||
|
Netherlands |
1.65 |
% |
|||||
|
Sweden |
1.23 |
% |
|||||
|
Australia |
0.80 |
% |
|||||
|
Switzerland |
0.80 |
% |
|||||
|
Italy |
0.67 |
% |
|||||
|
Republic of Korea |
0.63 |
% |
|||||
|
Canada |
0.55 |
% |
|||||
|
France |
0.53 |
% |
|||||
|
Taiwan |
0.49 |
% |
|||||
|
Czech Republic |
0.45 |
% |
|||||
|
Spain |
0.32 |
% |
|||||
|
Liabilities in Excess of Other Assets |
(0.34 |
)% |
|||||
|
100.00 |
% |
||||||
(a) These percentages represent long positions only and are not net of short positions.
Abbreviations:
AB - Aktiebolag is the Swedish term for a limited company.
ADR - American Depositary Receipt
AG - Aktiengesellschaft is a German term that refers to a corporation that is limited by shares, i.e., owned by shareholders.
AUD - Australian dollar
bps - Basis Points. 100 Basis Points is equal to 1 percentage point.
CAD - Canadian dollar
CHF - Swiss franc
CVR - Contingent Value Rights
EUR - Euro
GBP - British pound
JIBAR - Johannesburg Interbank Agreed Rate
LLC - Limited Liability Company
Ltd. - Limited
N.V. - Naamloze Vennootschap is the Dutch term for a public limited liability corporation.
Plc - Public Limited Company
SA - Generally designates corporations in various countries, mostly those employing civil law. This translates literally in all languages mentioned as anonymous company.
SABOR - South African Benchmark Overnight Rate
SEK - Swedish krona
SONIA - Sterling OverNight Index Average
SpA - Societa per Azione
USD - United States Dollar
ZAR - South African rand
See Notes to Financial Statements.
Annual Report | May 31, 2022
33
Water Island Event-Driven Fund Portfolio of Investments (continued)
May 31, 2022
The following table summarizes the Water Island Event-Driven Fund's investments and derivative financial instruments categorized in the fair value hierarchy as of May 31, 2022:
|
Investments in Securities at Fair Value* |
Level 1 |
Level 2 |
Level 3 |
Total |
|||||||||||||||
|
Assets |
|||||||||||||||||||
|
Common Stocks |
|||||||||||||||||||
|
Aerospace & Defense |
$ |
1,787,264 |
$ |
— |
$ |
— |
$ |
1,787,264 |
|||||||||||
|
Agriculture |
282,668 |
— |
— |
282,668 |
|||||||||||||||
|
Auto Parts & Equipment |
3,258,415 |
— |
— |
3,258,415 |
|||||||||||||||
|
Banks |
2,658,553 |
— |
— |
2,658,553 |
|||||||||||||||
|
Biotechnology |
3,278,925 |
— |
— |
3,278,925 |
|||||||||||||||
|
Chemicals |
2,671,580 |
— |
— |
2,671,580 |
|||||||||||||||
|
Commercial Services |
5,794,318 |
— |
— |
5,794,318 |
|||||||||||||||
|
Computers & Computer Services |
507,214 |
— |
— |
507,214 |
|||||||||||||||
|
Construction Materials |
2,074,794 |
— |
1,273,608 |
3,348,402 |
|||||||||||||||
|
Diversified Financial Services |
1,922,710 |
— |
— |
1,922,710 |
|||||||||||||||
|
Electric |
3,211,587 |
— |
— |
3,211,587 |
|||||||||||||||
|
Electronics |
1,241,539 |
— |
— |
1,241,539 |
|||||||||||||||
|
Energy - Alternate Sources |
361,422 |
— |
— |
361,422 |
|||||||||||||||
|
Engineering & Construction |
343,512 |
— |
— |
343,512 |
|||||||||||||||
|
Entertainment |
236,113 |
— |
— |
236,113 |
|||||||||||||||
|
Food |
1,682,583 |
— |
— |
1,682,583 |
|||||||||||||||
|
Gas |
2,501,254 |
— |
— |
2,501,254 |
|||||||||||||||
|
Healthcare - Products |
663,801 |
— |
— |
663,801 |
|||||||||||||||
|
Healthcare - Services |
3,752,486 |
— |
— |
3,752,486 |
|||||||||||||||
|
Insurance |
6,328,463 |
— |
— |
6,328,463 |
|||||||||||||||
|
Internet |
8,960,785 |
— |
— |
8,960,785 |
|||||||||||||||
|
Leisure Time |
870,121 |
— |
— |
870,121 |
|||||||||||||||
|
Lodging |
310,293 |
— |
— |
310,293 |
|||||||||||||||
|
Machinery - Diversified |
3,818,231 |
— |
— |
3,818,231 |
|||||||||||||||
|
Media |
3,541,638 |
— |
3,295,152 |
6,836,790 |
|||||||||||||||
|
Pharmaceuticals |
2,208,985 |
— |
— |
2,208,985 |
|||||||||||||||
|
Real Estate Investment Trusts |
3,205,334 |
— |
— |
3,205,334 |
|||||||||||||||
|
Retail |
1,010,349 |
— |
— |
1,010,349 |
|||||||||||||||
|
Semiconductors |
3,228,405 |
— |
— |
3,228,405 |
|||||||||||||||
|
Software |
24,613,303 |
— |
1,534,835 |
26,148,138 |
|||||||||||||||
|
Telecommunications |
6,825,142 |
— |
— |
6,825,142 |
|||||||||||||||
|
Rights |
— |
61,023 |
18,187 |
79,210 |
|||||||||||||||
|
Corporate Bonds** |
— |
3,226,814 |
— |
3,226,814 |
|||||||||||||||
|
Convertible Corporate Bonds** |
— |
1,641,015 |
— |
1,641,015 |
|||||||||||||||
|
Warrants** |
4,909 |
— |
— |
4,909 |
|||||||||||||||
|
Private Investments |
— |
— |
22,800 |
22,800 |
|||||||||||||||
|
Purchased Options |
2,340 |
— |
— |
2,340 |
|||||||||||||||
|
TOTAL |
$ |
103,159,036 |
$ |
4,928,852 |
$ |
6,144,582 |
$ |
114,232,470 |
|||||||||||
See Notes to Financial Statements.
www.arbitragefunds.com | 1-800-295-4485
34
Water Island Event-Driven Fund Portfolio of Investments (continued)
May 31, 2022
|
Other Financial Instruments*** |
Level 1 |
Level 2 |
Level 3 |
Total |
|||||||||||||||
|
Assets |
|||||||||||||||||||
|
Forward Foreign Currency Exchange Contracts |
$ |
— |
$ |
426,883 |
$ |
— |
$ |
426,883 |
|||||||||||
|
Equity Swaps |
0 |
— |
— |
0 |
|||||||||||||||
|
Liabilities |
|||||||||||||||||||
|
Common Stocks** |
(1,712,044 |
) |
— |
— |
(1,712,044 |
) |
|||||||||||||
|
Written Options |
(3,330 |
) |
— |
— |
(3,330 |
) |
|||||||||||||
|
Forward Foreign Currency Exchange Contracts |
— |
(279,235 |
) |
— |
(279,235 |
) |
|||||||||||||
|
TOTAL |
$ |
(1,715,374 |
) |
$ |
147,648 |
$ |
— |
$ |
(1,567,726 |
) |
|||||||||
* Refer to footnote 2 where leveling hierarchy is defined.
** Refer to Portfolio of Investments for sector information.
*** Other financial instruments are instruments such as written options, securities sold short, equity swaps and forward foreign currency exchange contracts.
The following is a reconciliation of the fair valuations using significant unobservable inputs (Level 3) for the Fund's assets and liabilities during the period ended May 31, 2022:
|
Investments in Securities |
Balance as of May 31, 2021 |
Realized Gain (Loss) |
Change in Unrealized Appreciation (Depreciation) |
Purchases |
Sales Proceeds |
Transfers into Level 3 |
Transfers out of Level 3 |
Balance as of May 31, 2022 |
Net change in Unrealized Appreciation (Depreciation) from investments still held as of May 31, 2022 |
||||||||||||||||||||||||||||||
|
Common Stocks |
$ |
6,055,654 |
$ |
465,366 |
$ |
(379,054 |
) |
$ |
4,868,360 |
$ |
(6,218,700 |
) |
$ |
1,311,969 |
* |
$ |
— |
$ |
6,103,595 |
$ |
67,860 |
||||||||||||||||||
|
Rights |
43,889 |
81,275 |
(3,457 |
) |
17,786 |
(121,306 |
) |
— |
— |
18,187 |
400 |
||||||||||||||||||||||||||||
|
Convertible Corporate Bonds |
1,081,737 |
— |
55,939 |
— |
— |
— |
(1,137,676 |
)** |
— |
— |
|||||||||||||||||||||||||||||
|
Private Investments |
79,400 |
— |
536 |
266 |
— |
— |
(57,402 |
)** |
22,800 |
(266 |
) |
||||||||||||||||||||||||||||
|
Total |
$ |
7,260,680 |
$ |
546,641 |
$ |
(326,036 |
) |
$ |
4,886,412 |
$ |
(6,340,006 |
) |
$ |
1,311,969 |
$ |
(1,195,078 |
) |
$ |
6,144,582 |
$ |
67,994 |
||||||||||||||||||
* Common Stock in the amount of $1,311,969 was transferred into Level 3 as a result of a corporate action and is priced using procedures approved by the Board.
** Convertible Corporate Bonds and Private Investments in the amount of $1,137,676 and $57,402 were transferred out of Level 3 upon the conversion to securities that are priced using observable inputs.
See Notes to Financial Statements.
Annual Report | May 31, 2022
35
Water Island Event-Driven Fund Portfolio of Investments (continued)
May 31, 2022
The following table summarizes the quantitative inputs used for investments categorized as Level 3 of the fair value hierarchy as of May 31, 2022:
|
Investments in Securities |
Fair Value at May 31, 2022 |
Valuation Technique |
Unobservable Input |
Range of Values |
Weighted Average |
||||||||||||||||||
|
Common Stocks |
$ |
6,103,595 |
Deal Value |
Final determination on Dissent |
$21-$41 |
$26.66 |
|||||||||||||||||
|
Rights |
18,187 |
Discounted, probability adjusted value |
Discount Rate, Probability |
10%, 18.48% |
10%, 18.48% |
||||||||||||||||||
|
Private Investments |
22,800 |
Cost |
Cost |
$1 |
$1.0000 |
||||||||||||||||||
See Notes to Financial Statements.
www.arbitragefunds.com | 1-800-295-4485
36
Water Island Credit Opportunities Fund Manager Commentary
May 31, 2022 (Unaudited)
Water Island Credit Opportunities Fund | Tickers: ACFIX, ARCFX, AGCAX
The Fund's Goal and Main Investments
The Fund seeks to provide current income and capital growth by focusing on company-specific catalysts and events in order to generate returns that are more correlated to the outcomes and timelines of those events, rather than on overall market direction or changes in interest rates.
Investment Strategy
The Fund employs a fundamentally driven investment approach. The investment team screens catalyst-driven investments such as mergers, acquisitions, asset sales, spin-offs, refinancings, recapitalizations, corporate reorganizations, litigation, and regulatory changes. From this universe the team selects investments based on factors such as risk/reward profile, potential downside, and security liquidity. The team generates returns by holding outright long and short positions and by utilizing capital structure arbitrage, merger arbitrage, and convertible arbitrage techniques to exploit security mispricing or inefficiencies. This portfolio offers a pure-play credit implementation of Water Island Capital's broader event-driven style.
Fiscal Year Highlights
Water Island Credit Opportunities Fund Class I (ACFIX) returned -1.51%% for the fiscal year ended May 31, 2022. Although the Asia-Pacific region and Europe were slightly positive, investments in the Americas detracted from returns overall. The Fund's top-performing sectors were financials and health care, while communication services and information technology were the top detractors.
The Fund may utilize derivatives for several purposes, primarily to implement position-level hedges, portfolio-level hedges, or currency hedges. During the fiscal year, the Fund's investments in derivative instruments contributed to returns. Derivative performance was in line with expectations given prevailing market conditions over the period.
The Fund's top contributor for the period was its credit market hedge. From time to time, in addition to various issuer-specific hedges, we may choose to implement broader market hedges – which may include a combination of credit, interest rate, and equity securities – in the portfolio. The intent of these hedges is to reduce directional exposure and market risk while providing the portfolio with lower volatility and smaller drawdowns, and we believe they are an integral part of our risk management strategy. These positions served their intended purpose, contributing gains to the portfolio while helping dampen volatility and hedge our positions in softer catalyst events, despite continued weakness in the broader fixed income markets.
The Fund's second-best performing investment was our position in Fresh Market, Inc. (Fresh Market) bonds. Fresh Market is a North-Carolina-based chain of gourmet supermarkets privately owned by funds related to Apollo Management. In December, the company filed an updated registration statement with the Securities and Exchange Commission (SEC) for an initial public offering ("IPO") indicating an imminent listing. Although the company's registration statement highlighted the company's intent to retire debt as part of its offering, market volatility dampened any near-term chances for IPOs, which led to a softness in the company's bonds. However, during Q2 2022, CENCOSUD, a leading South American supermarket company, offered to purchase 67% of Fresh Market with proceeds to also be used to redeem debt. This event led to gains for the portfolio and bonds have been called for redemption pending the closing of CENCOSUD's investment.
Conversely, the Fund's top detractor for the fiscal year was our position in fuboTV (fubo) convertible bonds. fubo is an internet television service provider with a primary focus on live
Annual Report | May 31, 2022
37
Water Island Credit Opportunities Fund Manager Commentary (continued)
May 31, 2022 (Unaudited)
international sports combined with a nascent online sports gaming business. We purchased fubo's convertible bonds while the company was aggressively ramping its customer base in the face of challenges with costs and acquiring subscribers. As time passed, fubo struggled to convincingly increase profitable subscribers and corrective actions were slow. During Q1 these trends continued into a weak market, and we also learned that the company had raised cash via equity sales at extremely low prices. While raising liquidity is typically a good thing, this action convinced the market that the company had effectively exhausted its capital-raising abilities. At this point we became doubtful of the company's ability to succeed and we exited the position, contributing to losses for the Fund.
The Fund's second-largest detractor was our position in Diebold Nixdorf (Diebold), a provider of automatic teller machines, electronic card systems, and financial and point-of-sale services. Our investment began as a relatively straightforward refinancing play as the company was looking to roll over its near-term debt. In May, Diebold's main competitor, NCR Corp (NCR), released weak earnings due to supply chain constraints. The news significantly lowered NCR's and Diebold's stock and bonds. Although we and the market believed Diebold's capital structure was oversold, one week later the company released lower than expected guidance, amended its credit agreement to tap into more liquidity, and hired advisors to potentially restructure. This news rapidly forced bonds lower, leading to losses for the portfolio despite having hedges in place. As we continued to do more work on the company and its prospects, we determined that the catalyst we were seeking was no longer viable and we exited the position.
www.arbitragefunds.com | 1-800-295-4485
38
Water Island Credit Opportunities Fund Portfolio Information
May 31, 2022 (Unaudited)
Performance^ (annualized returns as of May 31, 2022)
|
One Year |
Five Year |
Ten Year |
Since Inception* |
||||||||||||||||
|
Water Island Credit Opportunities Fund, Class R |
-1.84 |
% |
2.85 |
% |
N/A |
2.49 |
% |
||||||||||||
|
Water Island Credit Opportunities Fund, Class I |
-1.51 |
% |
3.14 |
% |
N/A |
2.73 |
% |
||||||||||||
|
Water Island Credit Opportunities Fund, Class A** |
-4.95 |
% |
2.18 |
% |
N/A |
2.03 |
% |
||||||||||||
|
ICE BofA U.S. 3-Month Treasury Bill Index |
0.14 |
% |
1.12 |
% |
N/A |
0.66 |
% |
||||||||||||
|
Bloomberg U.S. Aggregate Bond Index |
-8.22 |
% |
1.18 |
% |
N/A |
1.60 |
% |
||||||||||||
Current performance may be higher or lower than performance quoted above. Any performance data quoted represents past performance and the investment return and principal value of an investment in the Fund will fluctuate so that an investor's shares, when redeemed, may be worth more or less than their original cost. Past performance is no guarantee of future results. Returns shown above include the reinvestment of all dividends and capital gains. Performance results do not include adjustments made for financial reporting purposes in accordance with U.S. generally accepted accounting principles and may differ from the amount reported in the Financial Highlights. Contractual fee waivers are currently in effect. Without such fee waivers, performance numbers would be reduced. You can obtain performance data current to the most recent month end by calling 1-800-295-4485 or going to www.arbitragefunds.com. This table does not reflect the deduction of taxes that a shareholder would pay on Fund distributions or the redemption of Fund shares.
^ After sales charge.
* Class R and Class I inception: 10/1/12; Class A inception: 6/1/13. The "Since Inception" returns for securities indices are for the inception date of Class R and Class I shares.
** Class A shares are subject to a maximum front-end sales load of 3.25% of the offering price and are also subject to a 1.00% contingent deferred sales load on purchases at or above $250,000 purchased without a front-end sales charge and redeemed within 18 months of purchase.
The Total Annual Fund Operating Expenses for Class R, Class I and Class A are 1.77%, 1.52% and 1.77%, respectively. The Adviser has contractually agreed to limit the total annual operating expenses of the Fund, not including taxes, interest, dividends on short positions, brokerage commissions, acquired fund fees and expenses and other costs incurred in connection with the purchase or sale of portfolio securities so they do not exceed 1.23%, 0.98% and 1.23% for Class R, Class I and Class A, respectively. The agreement remains in effect until September 30, 2023, unless terminated earlier by the Board of Trustees. These expense ratios are as stated in the current prospectus and may differ from the expense ratios disclosed in the financial highlights in this report.
The ICE BofA U.S. 3-Month Treasury Bill Index tracks the performance of the U.S. dollar denominated U.S. Treasury Bills publicly issued in the U.S. domestic market with a remaining term to final maturity of less than 3 months.
The Bloomberg U.S. Aggregate Bond Index is a market value-weighted index of investment grade fixed-rated debt issues, including government, corporate, asset-backed and mortgage-backed securities with a maturity of one year or more.
An investor may not invest directly in an index.
Annual Report | May 31, 2022
39
Water Island Credit Opportunities Fund Portfolio Information (continued)
May 31, 2022 (Unaudited)
Growth of $10,000 Investment
The chart represents historical performance of a hypothetical investment of $10,000 in the Class R shares of the Fund since inception. Past performance does not guarantee future results. This chart does not reflect the deduction of taxes that a shareholder would pay on Fund distributions or the redemption of Fund shares.

Sector Weighting
The following chart shows the sector weightings of the Water Island Credit Opportunities Fund investments (including short sales and excluding derivatives) as of the report date.
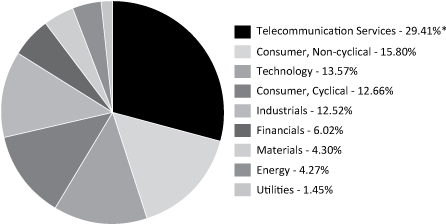
* Concentration Risk: If a large percentage of mergers or event-driven investment opportunities taking place within the U.S. are within one industry over a given period of time, the Fund may invest a large portion of its assets in securities of issuers in a single industry for that period of time. During such a period of concentration, the Fund may be subject to greater volatility with respect to its portfolio securities than a fund that is more broadly diversified.
www.arbitragefunds.com | 1-800-295-4485
40
Water Island Credit Opportunities Fund Portfolio of Investments
May 31, 2022
|
Maturity Date |
Rate |
Principal Amount |
Value |
||||||||||||||||
|
BANK LOANS - 4.14% |
|||||||||||||||||||
|
Chemicals - 0.50% |
|||||||||||||||||||
|
Zep Inc., 2017 1st Lien Term Loan, Variable Rate, (3 mo. USD LIBOR plus 4.00%) |
08/12/2024 |
5.000 |
% |
$ |
720,331 |
$ |
674,410 |
||||||||||||
|
Commercial Services - 3.64% |
|||||||||||||||||||
|
Moneygram International, Inc., 2021 Term Loan B, Variable Rate, (6 mo. USD LIBOR plus 4.50%) |
07/21/2026 |
4.592 |
% |
4,986,979 |
4,909,482 |
||||||||||||||
|
TOTAL BANK LOANS (Cost $5,716,681) |
5,583,892 |
||||||||||||||||||
|
CORPORATE BONDS - 69.76% |
|||||||||||||||||||
|
Auto Parts & Equipment - 6.82% |
|||||||||||||||||||
|
Meritor, Inc.(a)(b) |
12/15/2028 |
4.500 |
% |
2,632,000 |
2,600,416 |
||||||||||||||
|
Tenneco, Inc.(a)(b) |
04/15/2029 |
5.125 |
% |
6,731,000 |
6,595,875 |
||||||||||||||
|
9,196,291 |
|||||||||||||||||||
|
Banks - 0.69% |
|||||||||||||||||||
|
Truist Financial Corp., Variable Rate, (3 mo. USD LIBOR plus 0.65%)(b) |
03/15/2028 |
1.476 |
% |
1,000,000 |
939,045 |
||||||||||||||
|
Chemicals - 3.83% |
|||||||||||||||||||
|
GCP Applied Technologies, Inc.(a)(b) |
04/15/2026 |
5.500 |
% |
5,175,000 |
5,162,063 |
||||||||||||||
|
Commercial Services - 2.49% |
|||||||||||||||||||
|
Adtalem Global Education, Inc.(a)(b) |
03/01/2028 |
5.500 |
% |
1,563,000 |
1,449,729 |
||||||||||||||
|
RR Donnelley & Sons Co.(a) |
11/01/2026 |
6.125 |
% |
2,050,000 |
1,911,625 |
||||||||||||||
|
3,361,354 |
|||||||||||||||||||
|
Energy - Alternate Sources - 1.97% |
|||||||||||||||||||
|
Renewable Energy Group, Inc.(a) |
06/01/2028 |
5.875 |
% |
2,500,000 |
2,655,925 |
||||||||||||||
|
Entertainment - 4.28% |
|||||||||||||||||||
|
Peninsula Pacific Entertainment LLC / Peninsula Pacific Entertainment Finance In(a)(b) |
11/15/2027 |
8.500 |
% |
5,320,000 |
5,772,599 |
||||||||||||||
See Notes to Financial Statements.
Annual Report | May 31, 2022
41
Water Island Credit Opportunities Fund Portfolio of Investments (continued)
May 31, 2022
|
Maturity Date |
Rate |
Principal Amount |
Value |
||||||||||||||||
|
CORPORATE BONDS - 69.76% (Continued) |
|||||||||||||||||||
|
Food - 5.08% |
|||||||||||||||||||
|
Chobani LLC / Chobani Finance Corp., Inc.(a) |
04/15/2025 |
7.500 |
% |
$ |
4,499,000 |
$ |
4,253,984 |
||||||||||||
|
Fresh Market, Inc. (The)(a) |
05/01/2023 |
9.750 |
% |
2,588,000 |
2,593,176 |
||||||||||||||
|
6,847,160 |
|||||||||||||||||||
|
Gas - 1.46% |
|||||||||||||||||||
|
Rockpoint Gas Storage Canada Ltd.(a) |
03/31/2023 |
7.000 |
% |
2,000,000 |
1,970,420 |
||||||||||||||
|
Hand/Machine Tools - 2.26% |
|||||||||||||||||||
|
Werner FinCo LP / Werner FinCo, Inc.(a) |
07/15/2025 |
8.750 |
% |
3,000,000 |
3,052,500 |
||||||||||||||
|
Internet - 8.55% |
|||||||||||||||||||
|
Getty Images, Inc.(a) |
03/01/2027 |
9.750 |
% |
6,000,000 |
5,961,060 |
||||||||||||||
|
Twitter, Inc.(a) |
03/01/2030 |
5.000 |
% |
5,615,000 |
5,572,887 |
||||||||||||||
|
11,533,947 |
|||||||||||||||||||
|
Machinery - Diversified - 3.32% |
|||||||||||||||||||
|
JPW Industries Holding Corp.(a)(b) |
10/01/2024 |
9.000 |
% |
2,000,000 |
1,964,000 |
||||||||||||||
|
Welbilt, Inc. |
02/15/2024 |
9.500 |
% |
2,500,000 |
2,511,000 |
||||||||||||||
|
4,475,000 |
|||||||||||||||||||
|
Media - 0.70% |
|||||||||||||||||||
|
Cengage Learning, Inc.(a) |
06/15/2024 |
9.500 |
% |
1,000,000 |
943,630 |
||||||||||||||
|
Office/Business Equip - 2.72% |
|||||||||||||||||||
|
Xerox Holdings Corp.(a)(b)(c) |
08/15/2025 |
5.000 |
% |
3,745,000 |
3,670,325 |
||||||||||||||
|
Oil & Gas - 2.29% |
|||||||||||||||||||
|
Par Petroleum LLC / Par Petroleum Finance Corp.(a) |
12/15/2025 |
7.750 |
% |
3,190,000 |
3,084,854 |
||||||||||||||
|
Packaging & Containers - 4.27% |
|||||||||||||||||||
|
Intertape Polymer Group, Inc.(a) |
06/15/2029 |
4.375 |
% |
3,340,000 |
3,440,200 |
||||||||||||||
|
LABL, Inc.(a) |
07/15/2026 |
6.750 |
% |
2,400,000 |
2,316,000 |
||||||||||||||
|
5,756,200 |
|||||||||||||||||||
|
Real Estate Investment Trusts - 4.03% |
|||||||||||||||||||
|
Uniti Group LP / Uniti Fiber Holdings, Inc. / CSL Capital LLC(a) |
02/15/2025 |
7.875 |
% |
5,296,000 |
5,440,528 |
||||||||||||||
See Notes to Financial Statements.
www.arbitragefunds.com | 1-800-295-4485
42
Water Island Credit Opportunities Fund Portfolio of Investments (continued)
May 31, 2022
|
Maturity Date |
Rate |
Principal Amount |
Value |
||||||||||||||||
|
CORPORATE BONDS - 69.76% (Continued) |
|||||||||||||||||||
|
Software - 4.67% |
|||||||||||||||||||
|
CDK Global, Inc. |
10/15/2024 |
5.000 |
% |
$ |
681,000 |
$ |
699,727 |
||||||||||||
|
CDK Global, Inc.(a) |
05/15/2029 |
5.250 |
% |
200,000 |
200,000 |
||||||||||||||
|
Change Healthcare Holdings LLC / Change Healthcare Finance, Inc.(a) |
03/01/2025 |
5.750 |
% |
1,849,000 |
1,837,666 |
||||||||||||||
|
Citrix Systems, Inc. |
03/01/2030 |
3.300 |
% |
3,600,000 |
3,558,245 |
||||||||||||||
|
6,295,638 |
|||||||||||||||||||
|
Telecommunications - 10.33% |
|||||||||||||||||||
|
Altice France Holding SA(a) |
05/15/2027 |
10.500 |
% |
6,500,000 |
6,387,745 |
||||||||||||||
|
Plantronics, Inc.(a)(b) |
03/01/2029 |
4.750 |
% |
3,000,000 |
3,045,030 |
||||||||||||||
|
Switch Ltd.(a) |
09/15/2028 |
3.750 |
% |
4,500,000 |
4,501,321 |
||||||||||||||
|
13,934,096 |
|||||||||||||||||||
|
TOTAL CORPORATE BONDS (Cost $96,989,704) |
94,091,575 |
||||||||||||||||||
|
CONVERTIBLE CORPORATE BONDS - 20.54% |
|||||||||||||||||||
|
Aerospace & Defense - 2.12% |
|||||||||||||||||||
|
Kaman Corp. |
05/01/2024 |
3.250 |
% |
3,000,000 |
2,865,000 |
||||||||||||||
|
Auto Manufacturers - 0.77% |
|||||||||||||||||||
|
Lightning eMotors, Inc.(a) |
05/15/2024 |
7.500 |
% |
1,370,000 |
1,044,491 |
||||||||||||||
|
Commercial Services - 1.59% |
|||||||||||||||||||
|
Block, Inc. |
03/01/2025 |
0.125 |
% |
2,000,000 |
2,141,250 |
||||||||||||||
|
Diversified Financial Services - 1.05% |
|||||||||||||||||||
|
WisdomTree Investments, Inc.(a) |
06/15/2026 |
3.250 |
% |
1,500,000 |
1,414,500 |
||||||||||||||
|
Entertainment - 0.42% |
|||||||||||||||||||
|
Cineplex, Inc.(a) |
09/30/2025 |
5.750 |
% |
567,000 |
564,826 |
||||||||||||||
|
Healthcare - Services - 1.08% |
|||||||||||||||||||
|
UpHealth, Inc.(a)(b) |
06/15/2026 |
6.250 |
% |
1,951,000 |
1,452,323 |
||||||||||||||
|
Internet - 6.74% |
|||||||||||||||||||
|
Spotify USA, Inc.(d) |
03/15/2026 |
0.000 |
% |
3,500,000 |
2,835,000 |
||||||||||||||
|
Twitter, Inc.(b) |
06/15/2024 |
0.250 |
% |
2,500,000 |
2,495,000 |
||||||||||||||
|
Zendesk, Inc. |
06/15/2025 |
0.625 |
% |
3,500,000 |
3,760,750 |
||||||||||||||
|
9,090,750 |
|||||||||||||||||||
|
Pharmaceuticals - 1.42% |
|||||||||||||||||||
|
Paratek Pharmaceuticals, Inc.(b) |
05/01/2024 |
4.750 |
% |
2,250,000 |
1,919,700 |
||||||||||||||
See Notes to Financial Statements.
Annual Report | May 31, 2022
43
Water Island Credit Opportunities Fund Portfolio of Investments (continued)
May 31, 2022
|
Maturity Date |
Rate |
Principal Amount |
Value |
||||||||||||||||
|
CONVERTIBLE CORPORATE BONDS - 20.54% (Continued) |
|||||||||||||||||||
|
Software - 5.35% |
|||||||||||||||||||
|
Five9, Inc. |
06/01/2025 |
0.500 |
% |
$ |
3,000,000 |
$ |
2,986,500 |
||||||||||||
|
Kaleyra, Inc.(a)(b) |
06/01/2026 |
6.125 |
% |
1,900,000 |
1,577,000 |
||||||||||||||
|
RingCentral, Inc.(b)(d) |
03/01/2025 |
0.000 |
% |
3,105,000 |
2,654,775 |
||||||||||||||
|
7,218,275 |
|||||||||||||||||||
|
TOTAL CONVERTIBLE CORPORATE BONDS (Cost $31,706,113) |
27,711,115 |
||||||||||||||||||
|
Shares |
Value |
||||||||||
|
WARRANTS(e) - 0.02% |
|||||||||||
|
Auto Manufacturers - 0.02% |
|||||||||||
|
Lightning eMotors, Inc., Exercise Price $11.50, Expires 05/18/2025(f) |
53,913 |
$ |
26,957 |
||||||||
|
TOTAL WARRANTS (Cost $0) |
26,957 |
||||||||||
|
Expiration Date |
Exercise Price |
Notional Amount |
Contracts |
Value |
|||||||||||||||||||
|
PURCHASED OPTIONS(e) - 0.11% |
|||||||||||||||||||||||
|
Call Options Purchased - 0.11% |
|||||||||||||||||||||||
|
Par Pacific Holdings, Inc. |
06/2022 |
$ |
17.50 |
$ |
114,800 |
70 |
$ |
3,675 |
|||||||||||||||
|
SPDR S&P 500 ETF Trust |
|||||||||||||||||||||||
|
06/2022 |
465.00 |
8,258,600 |
200 |
900 |
|||||||||||||||||||
|
07/2022 |
425.00 |
8,258,600 |
200 |
139,700 |
|||||||||||||||||||
|
Uniti Group, Inc. |
07/2022 |
13.00 |
226,800 |
200 |
4,000 |
||||||||||||||||||
|
Xerox Holdings Corp. |
07/2022 |
23.00 |
366,990 |
195 |
1,462 |
||||||||||||||||||
|
TOTAL CALL OPTIONS PURCHASED (Cost $175,620) |
149,737 |
||||||||||||||||||||||
|
TOTAL PURCHASED OPTIONS (Cost $175,620) |
149,737 |
||||||||||||||||||||||
|
Total Investments - 94.57% (Cost $134,588,118) |
127,563,276 |
||||||||||||||||||||||
|
Other Assets in Excess of Liabilities - 5.43%(g) |
7,318,649 |
||||||||||||||||||||||
|
NET ASSETS - 100.00% |
$134,881,925 | ||||||||||||||||||||||
See Notes to Financial Statements.
www.arbitragefunds.com | 1-800-295-4485
44
Water Island Credit Opportunities Fund Portfolio of Investments (continued)
May 31, 2022
Portfolio Footnotes
(a) Security exempt from registration under Rule 144A of the Securities Act of 1933. These securities may be resold in transactions exempt from registration, normally to qualified institutional buyers. As of May 31, 2022, these securities had a total value of $92,436,698 or 68.53% of net assets.
(b) Security, or a portion of security, is being held as collateral for short sales, written option contracts or forward foreign currency exchange contracts. At May 31, 2022, the aggregate fair market value of those securities was $34,243,788, representing 25.39% of net assets.
(c) Underlying security for a written/purchased call/put option.
(d) Represents a zero coupon bond.
(e) Non-income-producing security.
(f) Restricted securities (including private placements) - The Fund may own investment securities that have other legal or contractual limitations. At the end of the period, the value of restricted securities (excluding 144A issues) amounted to $26,957 or 0.02% of net assets.
|
Restricted Security |
Acquisition Date |
Acquisition Cost |
|||||||||
|
Lightning eMotors, Inc., Exercise Price $11.50, Expires 05/18/2025 |
04/28/2021 |
$ |
— |
||||||||
|
Total |
$ |
— |
|||||||||
(g) Includes cash held as collateral for short sales and written option contracts.
|
SCHEDULE OF SECURITIES SOLD SHORT |
Shares |
Value |
|||||||||
|
COMMON STOCKS SOLD SHORT - (6.12%) |
|||||||||||
|
Aerospace & Defense - (0.28%) |
|||||||||||
|
Kaman Corp. |
(10,400 |
) |
$ |
(376,584 |
) |
||||||
|
Auto Parts & Equipment - (0.19%) |
|||||||||||
|
Meritor, Inc. |
(7,000 |
) |
(253,190 |
) |
|||||||
|
Commercial Services - (0.58%) |
|||||||||||
|
Block, Inc. |
(8,900 |
) |
(778,839 |
) |
|||||||
|
Diversified Financial Services - (0.15%) |
|||||||||||
|
WisdomTree Investments, Inc. |
(34,000 |
) |
(202,300 |
) |
|||||||
|
Entertainment - (0.25%) |
|||||||||||
|
Cineplex, Inc. |
(33,300 |
) |
(339,885 |
) |
|||||||
|
Internet - (2.34%) |
|||||||||||
|
Spotify Technology SA |
(800 |
) |
(90,216 |
) |
|||||||
|
Twitter, Inc. |
(33,700 |
) |
(1,334,520 |
) |
|||||||
|
Zendesk, Inc. |
(19,000 |
) |
(1,737,550 |
) |
|||||||
|
(3,162,286 |
) |
||||||||||
|
Machinery - Diversified - (0.22%) |
|||||||||||
|
Welbilt, Inc. |
(12,500 |
) |
(295,875 |
) |
|||||||
|
Office/Business Equip - (0.03%) |
|||||||||||
|
Xerox Holdings Corp. |
(2,500 |
) |
(47,050 |
) |
|||||||
See Notes to Financial Statements.
Annual Report | May 31, 2022
45
Water Island Credit Opportunities Fund Portfolio of Investments (continued)
May 31, 2022
|
SCHEDULE OF SECURITIES SOLD SHORT |
Shares |
Value |
|||||||||
|
COMMON STOCKS SOLD SHORT - (6.12%) (Continued) |
|||||||||||
|
Oil & Gas - (0.04%) |
|||||||||||
|
Par Pacific Holdings, Inc. |
(2,960 |
) |
$ |
(48,544 |
) |
||||||
|
Packaging & Containers - (0.11%) |
|||||||||||
|
Intertape Polymer Group, Inc. |
(5,000 |
) |
(155,829 |
) |
|||||||
|
Pharmaceuticals - (0.02%) |
|||||||||||
|
Paratek Pharmaceuticals, Inc. |
(13,450 |
) |
(25,420 |
) |
|||||||
|
Real Estate Investment Trusts - (0.13%) |
|||||||||||
|
Uniti Group, Inc. |
(15,000 |
) |
(170,100 |
) |
|||||||
|
Software - (0.87%) |
|||||||||||
|
Five9, Inc. |
(11,600 |
) |
(1,121,836 |
) |
|||||||
|
RingCentral, Inc., Class A |
(900 |
) |
(56,826 |
) |
|||||||
|
(1,178,662 |
) |
||||||||||
|
Telecommunications - (0.91%) |
|||||||||||
|
Plantronics, Inc. |
(31,000 |
) |
(1,223,880 |
) |
|||||||
|
TOTAL SECURITIES SOLD SHORT (Proceeds $11,025,666) |
$ |
(8,258,444 |
) |
||||||||
|
WRITTEN OPTIONS |
Expiration Date |
Exercise Price |
Notional Amount |
Contracts |
Value |
||||||||||||||||||
|
Written Put Options |
|||||||||||||||||||||||
|
Zendesk, Inc. |
|||||||||||||||||||||||
|
06/2022 |
$ |
80.00 |
$ |
(27,435 |
) |
(3 |
) |
$ |
(1,020 |
) |
|||||||||||||
|
06/2022 |
85.00 |
(91,450 |
) |
(10 |
) |
(4,900 |
) |
||||||||||||||||
|
TOTAL WRITTEN PUT OPTIONS (Premiums received $5,680) |
(5,920 |
) |
|||||||||||||||||||||
|
TOTAL WRITTEN OPTIONS (Premiums received $5,680) |
$ |
(5,920 |
) |
||||||||||||||||||||
EQUITY SWAP CONTRACTS
|
Swap Counterparty/ Payment Frequency |
Reference Obligation |
Rate Paid/ Received by the Fund |
Termination Date |
Upfront Payments Made |
Upfront Payments Received |
Market Value |
Notional Amount |
Unrealized Appreciation |
|||||||||||||||||||||||||||
|
Morgan Stanley & Co./ Monthly |
SPDR Bloomberg High Yield Bond ETF |
Received 1 Month- Federal Rate Minus 428 bps (3.550%) |
08/18/2023 |
$ |
— |
$ |
— |
$ |
— |
USD |
3,836,318 |
$ |
— |
||||||||||||||||||||||
See Notes to Financial Statements.
www.arbitragefunds.com | 1-800-295-4485
46
Water Island Credit Opportunities Fund Portfolio of Investments (continued)
May 31, 2022
OUTSTANDING FORWARD FOREIGN CURRENCY EXCHANGE CONTRACTS
|
Currency Purchased |
Currency Sold |
Counterparty |
Settlement Date |
Unrealized Appreciation |
|||||||||||||||
|
CAD |
169,400 |
USD |
131,794 |
Morgan Stanley & Co. |
06/15/2022 |
$ |
2,119 |
||||||||||||
|
USD |
74,007 |
CAD |
92,900 |
Morgan Stanley & Co. |
06/15/2022 |
567 |
|||||||||||||
|
$ |
2,686 |
||||||||||||||||||
|
Currency Purchased |
Currency Sold |
Counterparty |
Settlement Date |
Unrealized Depreciation |
|||||||||||||||
|
CAD |
275,100 |
USD |
218,001 |
Morgan Stanley & Co. |
06/15/2022 |
$ |
(528 |
) |
|||||||||||
|
USD |
336,563 |
CAD |
431,100 |
Morgan Stanley & Co. |
06/15/2022 |
(4,231 |
) |
||||||||||||
|
$ |
(4,759 |
) |
|||||||||||||||||
The following is a summary of investments classified by country exposure:
|
Country |
% of Net Assets(a) |
||||||
|
United States |
85.41 |
% |
|||||
|
Luxembourg |
4.73 |
% |
|||||
|
Canada |
4.43 |
% |
|||||
|
Other Assets in Excess of Liabilities |
5.43 |
% |
|||||
|
100.00 |
% |
||||||
(a) These percentages represent long positions only and are not net of short positions.
Abbreviations:
bps - Basis Points. 100 Basis Points is equal to 1 percentage point.
CAD - Canadian dollar
ETF - Exchange-Traded Fund
LIBOR - London Interbank Offered Rate
LLC - Limited Liability Company
LP - Limited Partnership
Ltd. - Limited
SA - Generally designates corporations in various countries, mostly those employing civil law. This translates literally in all languages mentioned as anonymous company.
S&P - Standard & Poor's
SPDR - Standard & Poor's Depositary Receipt
USD - United States Dollar
See Notes to Financial Statements.
Annual Report | May 31, 2022
47
Water Island Credit Opportunities Fund Portfolio of Investments (continued)
May 31, 2022
The following table summarizes the Water Island Credit Opportunities Fund's investments and derivative financial instruments categorized in the fair value hierarchy as of May 31, 2022:
|
Investments in Securities at Fair Value* |
Level 1 |
Level 2 |
Level 3 |
Total |
|||||||||||||||
|
Assets |
|||||||||||||||||||
|
Bank Loans** |
$ |
— |
$ |
5,583,892 |
$ |
— |
$ |
5,583,892 |
|||||||||||
|
Corporate Bonds** |
— |
94,091,575 |
— |
94,091,575 |
|||||||||||||||
|
Convertible Corporate Bonds** |
— |
27,711,115 |
— |
27,711,115 |
|||||||||||||||
|
Warrants** |
26,957 |
— |
— |
26,957 |
|||||||||||||||
|
Purchased Options |
149,737 |
— |
— |
149,737 |
|||||||||||||||
|
TOTAL |
$ |
176,694 |
$ |
127,386,582 |
$ |
— |
$ |
127,563,276 |
|||||||||||
|
Other Financial Instruments*** |
|||||||||||||||||||
|
Assets |
|||||||||||||||||||
|
Forward Foreign Currency Exchange Contracts |
$ |
— |
$ |
2,686 |
$ |
— |
$ |
2,686 |
|||||||||||
|
Equity Swaps |
0 |
— |
— |
0 |
|||||||||||||||
|
Liabilities |
|||||||||||||||||||
|
Common Stocks** |
(8,258,444 |
) |
— |
— |
(8,258,444 |
) |
|||||||||||||
|
Written Options |
(5,920 |
) |
— |
— |
(5,920 |
) |
|||||||||||||
|
Forward Foreign Currency Exchange Contracts |
— |
(4,759 |
) |
— |
(4,759 |
) |
|||||||||||||
|
TOTAL |
$ |
(8,264,364 |
) |
$ |
(2,073 |
) |
$ |
— |
$ |
(8,266,437 |
) |
||||||||
* Refer to footnote 2 where leveling hierarchy is defined.
** Refer to Portfolio of Investments for sector information.
*** Other financial instruments are instruments such as written options, securities sold short, equity swaps and forward foreign currency exchange contracts.
The following is a reconciliation of the fair valuations using significant unobservable inputs (Level 3) for the Fund's assets and liabilities during the period ended May 31, 2022:
|
Investments in Securities |
Balance as of May 31, 2021 |
Accrued Discounts/ (Premiums) |
Realized Gain/ (Loss) |
Change in Unrealized Appreciation (Depreciation) |
Purchases |
Sales Proceeds |
Amortization Premium/ Discount |
Transfers into Level 3 |
Transfers out of Level 3 |
Balance as of May 31, 2022 |
Net change in Unrealized Appreciation (Depreciation) from investments still held as of May 31, 2022 |
||||||||||||||||||||||||||||||||||||
|
Convertible Corporate Bonds |
$ |
1,668,592 |
$ |
— |
$ |
— |
$ |
86,360 |
$ |
— |
$ |
— |
$ |
— |
$ |
— |
$ |
(1,754,952 |
) |
$ |
— |
$ |
— |
||||||||||||||||||||||||
|
Total |
$ |
1,668,592 |
$ |
— |
$ |
— |
$ |
86,360 |
$ |
— |
$ |
— |
$ |
— |
$ |
— |
$ |
(1,754,952 |
) |
$ |
— |
$ |
— |
||||||||||||||||||||||||
See Notes to Financial Statements.
www.arbitragefunds.com | 1-800-295-4485
48
This Page Intentionally Left Blank
The Arbitrage Funds
|
Arbitrage Fund |
Water Island Event-Driven Fund |
||||||||||
|
ASSETS |
|||||||||||
|
Investments: |
|||||||||||
|
At cost of unaffiliated investments |
$ |
1,523,635,914 |
$ |
118,404,679 |
|||||||
|
At cost of affiliated investments |
60,632,644 |
— |
|||||||||
|
At fair value of unaffiliated investments (Note 2) |
1,478,419,537 |
114,232,470 |
|||||||||
|
At fair value of affiliated investments (Note 2) |
72,394,803 |
— |
|||||||||
|
Cash |
3 |
10,178 |
|||||||||
|
Cash denominated in foreign currency (Cost $4,308,885, $356,294 and $0) |
4,309,809 |
356,294 |
|||||||||
|
Deposits with brokers for securities sold short (Note 2) |
25,929,567 |
1,855,522 |
|||||||||
|
Segregated cash for collateral (Note 2) |
200,000 |
630,000 |
|||||||||
|
Receivable for investment securities sold |
58,797,209 |
3,984,142 |
|||||||||
|
Receivable for capital shares sold |
3,819,599 |
51,612 |
|||||||||
|
Unrealized appreciation on forward foreign currency exchange contracts (Note 8) |
7,864,110 |
426,883 |
|||||||||
|
Unrealized appreciation on swap contracts |
148 |
— |
|||||||||
|
Dividends and interest receivable |
1,212,640 |
117,127 |
|||||||||
|
Miscellaneous receivable |
379,257 |
— |
|||||||||
|
Prepaid expenses |
79,152 |
25,330 |
|||||||||
|
Total Assets |
1,653,405,834 |
121,689,558 |
|||||||||
|
LIABILITIES |
|||||||||||
|
Securities sold short, at value (Note 2) (proceeds $35,374,795, $1,940,348 and $11,025,666) |
32,137,913 |
1,712,044 |
|||||||||
|
Written options, at value (Note 2) (premiums received $49,591, $4,191 and $5,680) |
39,405 |
3,330 |
|||||||||
|
Line of credit payable (Note 4) |
— |
5,000,000 |
|||||||||
|
Payable for investment securities purchased |
20,221,326 |
576,380 |
|||||||||
|
Unrealized depreciation on forward foreign currency exchange contracts (Note 8) |
4,486,582 |
279,235 |
|||||||||
|
Payable for capital shares redeemed |
1,887,246 |
41,291 |
|||||||||
|
Payable to Adviser (Note 5) |
1,350,830 |
129,823 |
|||||||||
|
Payable to Distributor (Note 5) |
37,162 |
1,464 |
|||||||||
|
Payable to Administrator (Note 5) |
131,738 |
22,613 |
|||||||||
|
Payable to Transfer Agent (Note 5) |
214,898 |
11,358 |
|||||||||
|
Payable to Custodian |
48,419 |
18,680 |
|||||||||
|
Income distribution payable |
— |
— |
|||||||||
|
Interest expense payable |
1,174 |
7,121 |
|||||||||
|
Payable for swap reset |
66,366 |
4,060 |
|||||||||
|
Audit and legal fees payable |
95,250 |
21,893 |
|||||||||
|
Payable to Trustees |
45,402 |
5,233 |
|||||||||
|
Chief Compliance Officer Fees payable (Note 5) |
34,311 |
1,942 |
|||||||||
|
Chief Financial Officer Fees payable (Note 5) |
4,904 |
894 |
|||||||||
|
Other accrued expenses and liabilities |
54,117 |
10,455 |
|||||||||
|
Total Liabilities |
60,857,043 |
7,847,816 |
|||||||||
|
NET ASSETS |
$ |
1,592,548,791 |
$ |
113,841,742 |
|||||||
|
NET ASSETS CONSIST OF: |
|||||||||||
|
Paid-in capital |
1,589,478,324 |
154,796,453 |
|||||||||
|
Distributable earnings (Accumulated loss) |
3,070,467 |
(40,954,711 |
) |
||||||||
|
NET ASSETS |
$ |
1,592,548,791 |
$ |
113,841,742 |
|||||||
See Notes to Financial Statements.
www.arbitragefunds.com | 1-800-295-4485
50
Statement of Assets and Liabilities
May 31, 2022
|
Water Island Credit Opportunities Fund |
|||||||
|
ASSETS |
|||||||
|
Investments: |
|||||||
|
At cost of unaffiliated investments |
$ |
134,588,118 |
|||||
|
At cost of affiliated investments |
— |
||||||
|
At fair value of unaffiliated investments (Note 2) |
127,563,276 |
||||||
|
At fair value of affiliated investments (Note 2) |
— |
||||||
|
Cash |
4,877,099 |
||||||
|
Cash denominated in foreign currency (Cost $4,308,885, $356,294 and $0) |
— |
||||||
|
Deposits with brokers for securities sold short (Note 2) |
8,274,331 |
||||||
|
Segregated cash for collateral (Note 2) |
1,260,000 |
||||||
|
Receivable for investment securities sold |
258,630 |
||||||
|
Receivable for capital shares sold |
437,716 |
||||||
|
Unrealized appreciation on forward foreign currency exchange contracts (Note 8) |
2,686 |
||||||
|
Unrealized appreciation on swap contracts |
— |
||||||
|
Dividends and interest receivable |
1,931,395 |
||||||
|
Miscellaneous receivable |
— |
||||||
|
Prepaid expenses |
23,410 |
||||||
|
Total Assets |
144,628,543 |
||||||
|
LIABILITIES |
|||||||
|
Securities sold short, at value (Note 2) (proceeds $35,374,795, $1,940,348 and $11,025,666) |
8,258,444 |
||||||
|
Written options, at value (Note 2) (premiums received $49,591, $4,191 and $5,680) |
5,920 |
||||||
|
Line of credit payable (Note 4) |
1,000,000 |
||||||
|
Payable for investment securities purchased |
39,289 |
||||||
|
Unrealized depreciation on forward foreign currency exchange contracts (Note 8) |
4,759 |
||||||
|
Payable for capital shares redeemed |
128,602 |
||||||
|
Payable to Adviser (Note 5) |
75,561 |
||||||
|
Payable to Distributor (Note 5) |
1,892 |
||||||
|
Payable to Administrator (Note 5) |
32,840 |
||||||
|
Payable to Transfer Agent (Note 5) |
19,132 |
||||||
|
Payable to Custodian |
7,049 |
||||||
|
Income distribution payable |
106,903 |
||||||
|
Interest expense payable |
8,385 |
||||||
|
Payable for swap reset |
14,601 |
||||||
|
Audit and legal fees payable |
22,257 |
||||||
|
Payable to Trustees |
4,990 |
||||||
|
Chief Compliance Officer Fees payable (Note 5) |
3,391 |
||||||
|
Chief Financial Officer Fees payable (Note 5) |
952 |
||||||
|
Other accrued expenses and liabilities |
11,651 |
||||||
|
Total Liabilities |
9,746,618 |
||||||
|
NET ASSETS |
$ |
134,881,925 |
|||||
|
NET ASSETS CONSIST OF: |
|||||||
|
Paid-in capital |
140,737,408 |
||||||
|
Distributable earnings (Accumulated loss) |
(5,855,483 |
) |
|||||
|
NET ASSETS |
$ |
134,881,925 |
|||||
Annual Report | May 31, 2022
51
The Arbitrage Funds
|
Arbitrage Fund |
Water Island Event-Driven Fund |
||||||||||
|
PRICING OF SHARES: |
|||||||||||
|
CLASS R SHARES: |
|||||||||||
|
Net assets applicable to Class R shares |
$ |
77,865,847 |
$ |
4,502,479 |
|||||||
|
Shares of beneficial interest outstanding (unlimited number of shares authorized, no par value) |
6,207,052 |
415,317 |
|||||||||
|
Net asset value and offering price per share |
$ |
12.54 |
$ |
10.84 |
|||||||
|
CLASS I SHARES: |
|||||||||||
|
Net assets applicable to Class I shares |
$ |
1,459,175,969 |
$ |
107,037,782 |
|||||||
|
Shares of beneficial interest outstanding (unlimited number of shares authorized, no par value) |
111,779,470 |
9,770,808 |
|||||||||
|
Net asset value and offering price per share |
$ |
13.05 |
$ |
10.95 |
|||||||
|
CLASS C SHARES: |
|||||||||||
|
Net assets applicable to Class C shares |
$ |
13,466,827 |
$ |
— |
|||||||
|
Shares of beneficial interest outstanding (unlimited number of shares authorized, no par value) |
1,156,780 |
— |
|||||||||
|
Net asset value and offering price per share(a) |
$ |
11.64 |
$ |
— |
|||||||
|
CLASS A SHARES: |
|||||||||||
|
Net assets applicable to Class A shares |
$ |
42,040,148 |
$ |
2,301,481 |
|||||||
|
Shares of beneficial interest outstanding (unlimited number of shares authorized, no par value) |
3,358,751 |
212,726 |
|||||||||
|
Net asset value and offering price per share(a) |
$ |
12.52 |
$ |
10.82 |
|||||||
|
Maximum offering price per share (NAV/(100% — maximum sales charge)) |
$ |
12.87 |
$ |
11.18 |
|||||||
|
Maximum sales charge |
2.75 |
% |
3.25 |
% |
|||||||
(a) Redemption price varies based on length of time held (Note 1).
See Notes to Financial Statements.
www.arbitragefunds.com | 1-800-295-4485
52
Statement of Assets and Liabilities
May 31, 2022
|
Water Island Credit Opportunities Fund |
|||||||
|
PRICING OF SHARES: |
|||||||
|
CLASS R SHARES: |
|||||||
|
Net assets applicable to Class R shares |
$ |
9,071,749 |
|||||
|
Shares of beneficial interest outstanding (unlimited number of shares authorized, no par value) |
932,269 |
||||||
|
Net asset value and offering price per share |
$ |
9.73 |
|||||
|
CLASS I SHARES: |
|||||||
|
Net assets applicable to Class I shares |
$ |
125,705,014 |
|||||
|
Shares of beneficial interest outstanding (unlimited number of shares authorized, no par value) |
12,977,938 |
||||||
|
Net asset value and offering price per share |
$ |
9.69 |
|||||
|
CLASS C SHARES: |
|||||||
|
Net assets applicable to Class C shares |
$ |
— |
|||||
|
Shares of beneficial interest outstanding (unlimited number of shares authorized, no par value) |
— |
||||||
|
Net asset value and offering price per share(a) |
$ |
— |
|||||
|
CLASS A SHARES: |
|||||||
|
Net assets applicable to Class A shares |
$ |
105,162 |
|||||
|
Shares of beneficial interest outstanding (unlimited number of shares authorized, no par value) |
10,852 |
||||||
|
Net asset value and offering price per share(a) |
$ |
9.69 |
|||||
|
Maximum offering price per share (NAV/(100% — maximum sales charge)) |
$ |
10.02 |
|||||
|
Maximum sales charge |
3.25 |
% |
|||||
Annual Report | May 31, 2022
53
The Arbitrage Funds
|
Arbitrage Fund |
Water Island Event-Driven Fund |
||||||||||
|
INVESTMENT INCOME |
|||||||||||
|
Dividend income |
$ |
13,400,345 |
$ |
649,290 |
|||||||
|
Foreign taxes withheld on dividends |
(537,689 |
) |
(20,605 |
) |
|||||||
|
Interest income |
721,406 |
241,431 |
|||||||||
|
Total Investment Income |
13,584,062 |
870,116 |
|||||||||
|
EXPENSES |
|||||||||||
|
Investment advisory fees (Note 5) |
17,162,528 |
1,395,849 |
|||||||||
|
Distribution and service fees (Note 5) |
|||||||||||
|
Class R |
236,686 |
19,739 |
|||||||||
|
Class C |
165,682 |
— |
|||||||||
|
Class A |
99,261 |
5,224 |
|||||||||
|
Administrative fees |
361,959 |
58,066 |
|||||||||
|
Chief Compliance Officer fees |
162,248 |
11,147 |
|||||||||
|
Trustees' fees |
277,235 |
28,275 |
|||||||||
|
Dividend expense |
139,335 |
6,507 |
|||||||||
|
Interest rebate expense |
837,129 |
96,703 |
|||||||||
|
Transfer agent fees |
1,407,168 |
120,503 |
|||||||||
|
Custodian and bank service fees |
195,075 |
63,519 |
|||||||||
|
Registration and filing fees |
95,548 |
50,937 |
|||||||||
|
Printing of shareholder reports |
122,359 |
10,552 |
|||||||||
|
Professional fees |
190,119 |
29,439 |
|||||||||
|
Line of credit interest expense |
2,068 |
36,160 |
|||||||||
|
Insurance expense |
61,073 |
4,790 |
|||||||||
|
Chief Financial Officer fees |
58,791 |
11,043 |
|||||||||
|
Other expenses |
66,504 |
19,970 |
|||||||||
|
Total Expenses |
21,640,768 |
1,968,423 |
|||||||||
|
Fees waived, reimbursed or recouped by the Adviser, Class R (Note 5) |
(53,522 |
) |
1,403 |
||||||||
|
Fees waived, reimbursed or recouped by the Adviser, Class I (Note 5) |
(833,831 |
) |
21,411 |
||||||||
|
Fees waived, reimbursed or recouped by the Adviser, Class C (Note 5) |
(9,359 |
) |
— |
||||||||
|
Fees waived, reimbursed or recouped by the Adviser, Class A (Note 5) |
(22,467 |
) |
390 |
||||||||
|
Net Expenses |
20,721,589 |
1,991,627 |
|||||||||
|
NET INVESTMENT INCOME (LOSS) |
(7,137,527 |
) |
(1,121,511 |
) |
|||||||
|
REALIZED AND UNREALIZED GAINS (LOSSES) ON INVESTMENTS AND FOREIGN CURRENCIES |
|||||||||||
|
Net realized gains (losses) from: |
|||||||||||
|
Unaffiliated investments |
75,174,977 |
7,344,199 |
|||||||||
|
Purchased option contracts |
(1,844,236 |
) |
(141,575 |
) |
|||||||
|
Swap contracts |
(6,444,884 |
) |
(643,295 |
) |
|||||||
|
Securities sold short |
(19,584,880 |
) |
(2,833,577 |
) |
|||||||
|
Written option contracts |
2,115,078 |
227,040 |
|||||||||
|
Forward currency contracts |
9,860,568 |
677,044 |
|||||||||
|
Foreign currency transactions (Note 8) |
(659,632 |
) |
34,075 |
||||||||
See Notes to Financial Statements.
www.arbitragefunds.com | 1-800-295-4485
54
Statement of Operations
For the Year Ended May 31, 2022
|
Water Island Credit Opportunities Fund |
|||||||
|
INVESTMENT INCOME |
|||||||
|
Dividend income |
$ |
55,486 |
|||||
|
Foreign taxes withheld on dividends |
— |
||||||
|
Interest income |
3,717,457 |
||||||
|
Total Investment Income |
3,772,943 |
||||||
|
EXPENSES |
|||||||
|
Investment advisory fees (Note 5) |
1,231,047 |
||||||
|
Distribution and service fees (Note 5) |
|||||||
|
Class R |
22,885 |
||||||
|
Class C |
— |
||||||
|
Class A |
257 |
||||||
|
Administrative fees |
93,440 |
||||||
|
Chief Compliance Officer fees |
12,478 |
||||||
|
Trustees' fees |
28,038 |
||||||
|
Dividend expense |
19,009 |
||||||
|
Interest rebate expense |
84,368 |
||||||
|
Transfer agent fees |
120,833 |
||||||
|
Custodian and bank service fees |
19,189 |
||||||
|
Registration and filing fees |
74,672 |
||||||
|
Printing of shareholder reports |
13,428 |
||||||
|
Professional fees |
29,757 |
||||||
|
Line of credit interest expense |
21,561 |
||||||
|
Insurance expense |
3,936 |
||||||
|
Chief Financial Officer fees |
11,132 |
||||||
|
Other expenses |
20,483 |
||||||
|
Total Expenses |
1,806,513 |
||||||
|
Fees waived, reimbursed or recouped by the Adviser, Class R (Note 5) |
(27,491 |
) |
|||||
|
Fees waived, reimbursed or recouped by the Adviser, Class I (Note 5) |
(360,709 |
) |
|||||
|
Fees waived, reimbursed or recouped by the Adviser, Class C (Note 5) |
— |
||||||
|
Fees waived, reimbursed or recouped by the Adviser, Class A (Note 5) |
(309 |
) |
|||||
|
Net Expenses |
1,418,004 |
||||||
|
NET INVESTMENT INCOME (LOSS) |
2,354,939 |
||||||
|
REALIZED AND UNREALIZED GAINS (LOSSES) ON INVESTMENTS AND FOREIGN CURRENCIES |
|||||||
|
Net realized gains (losses) from: |
|||||||
|
Unaffiliated investments |
1,164,010 |
||||||
|
Purchased option contracts |
(262,482 |
) |
|||||
|
Swap contracts |
200,376 |
||||||
|
Securities sold short |
(285,977 |
) |
|||||
|
Written option contracts |
97,867 |
||||||
|
Forward currency contracts |
2,653 |
||||||
|
Foreign currency transactions (Note 8) |
883 |
||||||
Annual Report | May 31, 2022
55
The Arbitrage Funds
|
Arbitrage Fund |
Water Island Event-Driven Fund |
||||||||||
|
Net change in unrealized appreciation (depreciation) on: |
|||||||||||
|
Unaffiliated investments |
$ |
(114,517,314 |
) |
$ |
(9,533,762 |
) |
|||||
|
Affiliated investments |
(3,434,790 |
) |
— |
||||||||
|
Securities sold short |
235,533 |
(663,914 |
) |
||||||||
|
Foreign currency transactions (Note 8) |
(8,941 |
) |
(1,610 |
) |
|||||||
|
Purchased option contracts |
1,391,682 |
152,193 |
|||||||||
|
Written option contracts |
10,186 |
861 |
|||||||||
|
Swap contracts |
148 |
— |
|||||||||
|
Forward currency contracts |
5,524,437 |
363,598 |
|||||||||
|
NET REALIZED AND UNREALIZED LOSSES ON INVESTMENTS AND FOREIGN CURRENCIES |
(52,182,068 |
) |
(5,018,723 |
) |
|||||||
|
NET DECREASE IN NET ASSETS RESULTING FROM OPERATIONS |
$ |
(59,319,595 |
) |
$ |
(6,140,234 |
) |
|||||
See Notes to Financial Statements.
www.arbitragefunds.com | 1-800-295-4485
56
Statement of Operations
For the Year Ended May 31, 2022
|
Water Island Credit Opportunities Fund |
|||||||
|
Net change in unrealized appreciation (depreciation) on: |
|||||||
|
Unaffiliated investments |
$ |
(9,859,431 |
) |
||||
|
Affiliated investments |
— |
||||||
|
Securities sold short |
4,035,356 |
||||||
|
Foreign currency transactions (Note 8) |
(57 |
) |
|||||
|
Purchased option contracts |
53,356 |
||||||
|
Written option contracts |
83 |
||||||
|
Swap contracts |
— |
||||||
|
Forward currency contracts |
9,606 |
||||||
|
NET REALIZED AND UNREALIZED LOSSES ON INVESTMENTS AND FOREIGN CURRENCIES |
(4,843,757 |
) |
|||||
|
NET DECREASE IN NET ASSETS RESULTING FROM OPERATIONS |
$ |
(2,488,818 |
) |
||||
Annual Report | May 31, 2022
57
The Arbitrage Funds
|
Arbitrage Fund |
|||||||||||
|
Year Ended May 31, 2022 |
Year Ended May 31, 2021 |
||||||||||
|
FROM OPERATIONS: |
|||||||||||
|
Net investment income (loss) |
$ |
(7,137,527 |
) |
$ |
1,889,199 |
||||||
|
Net realized gains (losses) from: |
|||||||||||
|
Unaffiliated investments |
75,174,977 |
182,484,017 |
|||||||||
|
Purchased option contracts |
(1,844,236 |
) |
2,387,236 |
||||||||
|
Swap contracts |
(6,444,884 |
) |
(59,667,677 |
) |
|||||||
|
Securities sold short |
(19,584,880 |
) |
(109,802,820 |
) |
|||||||
|
Written option contracts |
2,115,078 |
119,130 |
|||||||||
|
Forward currency contracts |
9,860,568 |
(4,756,529 |
) |
||||||||
|
Foreign currency transactions |
(659,632 |
) |
(681,188 |
) |
|||||||
|
Net change in unrealized appreciation (depreciation) on: |
|||||||||||
|
Unaffiliated investments |
(114,517,314 |
) |
81,360,181 |
||||||||
|
Affiliated investments |
(3,434,790 |
) |
9,433,047 |
||||||||
|
Securities sold short |
235,533 |
10,863,412 |
|||||||||
|
Foreign currency transactions |
(8,941 |
) |
4,136 |
||||||||
|
Purchased option contracts |
1,391,682 |
(1,354,350 |
) |
||||||||
|
Written option contracts |
10,186 |
— |
|||||||||
|
Swap contracts |
148 |
— |
|||||||||
|
Forward currency contracts |
5,524,437 |
(5,032,588 |
) |
||||||||
|
Net increase (decrease) in net assets resulting from operations |
(59,319,595 |
) |
107,245,206 |
||||||||
|
FROM DIVIDENDS AND DISTRIBUTIONS TO SHAREHOLDERS: |
|||||||||||
|
Distributions from distributable earnings, Class R |
(516,092 |
) |
(5,828,800 |
) |
|||||||
|
Distributions from distributable earnings, Class I |
(7,605,189 |
) |
(77,238,670 |
) |
|||||||
|
Distributions from distributable earnings, Class C(a) |
(99,436 |
) |
(1,172,789 |
) |
|||||||
|
Distributions from distributable earnings, Class A |
(213,958 |
) |
(1,718,463 |
) |
|||||||
|
Decrease in net assets from distributions to shareholders |
(8,434,675 |
) |
(85,958,722 |
) |
|||||||
|
FROM CAPITAL SHARE TRANSACTIONS (NOTE 7): |
|||||||||||
|
Proceeds from shares sold |
493,961,134 |
601,365,070 |
|||||||||
|
Shares issued in reinvestment of distributions |
6,813,804 |
66,859,378 |
|||||||||
|
Payments for shares redeemed |
(438,357,571 |
) |
(471,800,936 |
) |
|||||||
|
Net increase (decrease) in net assets from capital share transactions |
62,417,367 |
196,423,512 |
|||||||||
|
TOTAL INCREASE (DECREASE) IN NET ASSETS |
(5,336,903 |
) |
217,709,996 |
||||||||
|
NET ASSETS: |
|||||||||||
|
Beginning of year |
1,597,885,694 |
1,380,175,698 |
|||||||||
|
End of year |
$ |
1,592,548,791 |
$ |
1,597,885,694 |
|||||||
(a) Effective April 27, 2021, Class C shares of the Event-Driven Fund were converted to
Class I shares of the Fund, and Class C was abolished.
See Notes to Financial Statements.
www.arbitragefunds.com | 1-800-295-4485
58
Statement of Changes in Net Assets
|
Water Island Event-Driven Fund |
|||||||||||
|
Year Ended May 31, 2022 |
Year Ended May 31, 2021 |
||||||||||
|
FROM OPERATIONS: |
|||||||||||
|
Net investment income (loss) |
$ |
(1,121,511 |
) |
$ |
(308,619 |
) |
|||||
|
Net realized gains (losses) from: |
|||||||||||
|
Unaffiliated investments |
7,344,199 |
21,481,075 |
|||||||||
|
Purchased option contracts |
(141,575 |
) |
(5,551 |
) |
|||||||
|
Swap contracts |
(643,295 |
) |
(3,277,975 |
) |
|||||||
|
Securities sold short |
(2,833,577 |
) |
(9,159,552 |
) |
|||||||
|
Written option contracts |
227,040 |
36,803 |
|||||||||
|
Forward currency contracts |
677,044 |
(312,861 |
) |
||||||||
|
Foreign currency transactions |
34,075 |
24,732 |
|||||||||
|
Net change in unrealized appreciation (depreciation) on: |
|||||||||||
|
Unaffiliated investments |
(9,533,762 |
) |
5,133,104 |
||||||||
|
Affiliated investments |
— |
— |
|||||||||
|
Securities sold short |
(663,914 |
) |
2,228,494 |
||||||||
|
Foreign currency transactions |
(1,610 |
) |
866 |
||||||||
|
Purchased option contracts |
152,193 |
(156,778 |
) |
||||||||
|
Written option contracts |
861 |
— |
|||||||||
|
Swap contracts |
— |
— |
|||||||||
|
Forward currency contracts |
363,598 |
(357,496 |
) |
||||||||
|
Net increase (decrease) in net assets resulting from operations |
(6,140,234 |
) |
15,326,242 |
||||||||
|
FROM DIVIDENDS AND DISTRIBUTIONS TO SHAREHOLDERS: |
|||||||||||
|
Distributions from distributable earnings, Class R |
— |
— |
|||||||||
|
Distributions from distributable earnings, Class I |
— |
(250,689 |
) |
||||||||
|
Distributions from distributable earnings, Class C(a) |
— |
— |
|||||||||
|
Distributions from distributable earnings, Class A |
— |
(1,490 |
) |
||||||||
|
Decrease in net assets from distributions to shareholders |
— |
(252,179 |
) |
||||||||
|
FROM CAPITAL SHARE TRANSACTIONS (NOTE 7): |
|||||||||||
|
Proceeds from shares sold |
16,716,837 |
28,932,531 |
|||||||||
|
Shares issued in reinvestment of distributions |
— |
243,637 |
|||||||||
|
Payments for shares redeemed |
(33,328,537 |
) |
(15,135,964 |
) |
|||||||
|
Net increase (decrease) in net assets from capital share transactions |
(16,611,700 |
) |
14,040,204 |
||||||||
|
TOTAL INCREASE (DECREASE) IN NET ASSETS |
(22,751,934 |
) |
29,114,267 |
||||||||
|
NET ASSETS: |
|||||||||||
|
Beginning of year |
136,593,676 |
107,479,409 |
|||||||||
|
End of year |
$ |
113,841,742 |
$ |
136,593,676 |
|||||||
Annual Report | May 31, 2022
59
The Arbitrage Funds Statement of Changes in Net Assets
|
Water Island Credit Opportunities Fund |
|||||||||||
|
Year Ended May 31, 2022 |
Year Ended May 31, 2021 |
||||||||||
|
FROM OPERATIONS: |
|||||||||||
|
Net investment income (loss) |
$ |
2,354,939 |
$ |
1,843,661 |
|||||||
|
Net realized gains (losses) from: |
|||||||||||
|
Unaffiliated investments |
1,164,010 |
3,994,378 |
|||||||||
|
Purchased option contracts |
(262,482 |
) |
655,253 |
||||||||
|
Swap contracts |
200,376 |
(376,581 |
) |
||||||||
|
Securities sold short |
(285,977 |
) |
(3,042,868 |
) |
|||||||
|
Written option contracts |
97,867 |
166,314 |
|||||||||
|
Forward currency contracts |
2,653 |
(24,429 |
) |
||||||||
|
Foreign currency transactions |
883 |
(1,681 |
) |
||||||||
|
Net change in unrealized appreciation (depreciation) on: |
|||||||||||
|
Unaffiliated investments |
(9,859,431 |
) |
3,306,710 |
||||||||
|
Securities sold short |
4,035,356 |
(637,868 |
) |
||||||||
|
Foreign currency transactions |
(57 |
) |
87 |
||||||||
|
Purchased option contracts |
53,356 |
(342,137 |
) |
||||||||
|
Written option contracts |
83 |
7,644 |
|||||||||
|
Forward currency contracts |
9,606 |
(11,679 |
) |
||||||||
|
Net increase (decrease) in net assets resulting from operations |
(2,488,818 |
) |
5,536,804 |
||||||||
|
FROM DIVIDENDS AND DISTRIBUTIONS TO SHAREHOLDERS: |
|||||||||||
|
Distributions from distributable earnings, Class R |
(232,802 |
) |
(69,080 |
) |
|||||||
|
Distributions from distributable earnings, Class I |
(3,360,754 |
) |
(1,867,325 |
) |
|||||||
|
Distributions from distributable earnings, Class C(b) |
— |
(10,822 |
) |
||||||||
|
Distributions from distributable earnings, Class A |
(2,624 |
) |
(2,060 |
) |
|||||||
|
Decrease in net assets from distributions to shareholders |
(3,596,180 |
) |
(1,949,287 |
) |
|||||||
|
FROM CAPITAL SHARE TRANSACTIONS (NOTE 7): |
|||||||||||
|
Proceeds from shares sold |
54,762,362 |
60,332,486 |
|||||||||
|
Shares issued in reinvestment of distributions |
3,120,787 |
1,946,010 |
|||||||||
|
Payments for shares redeemed |
(23,344,218 |
) |
(20,726,297 |
) |
|||||||
|
Net increase (decrease) in net assets from capital share transactions |
34,538,931 |
41,552,199 |
|||||||||
|
TOTAL INCREASE (DECREASE) IN NET ASSETS |
28,453,933 |
45,139,716 |
|||||||||
|
NET ASSETS: |
|||||||||||
|
Beginning of year |
106,427,992 |
61,288,276 |
|||||||||
|
End of year |
$ |
134,881,925 |
$ |
106,427,992 |
|||||||
(b) Effective April 27, 2021, Class C shares of the Credit Opportunities Fund were converted to Class I shares of the Fund, and Class C was abolished.
See Notes to Financial Statements.
www.arbitragefunds.com | 1-800-295-4485
60
Arbitrage Fund – Class R Financial Highlights
Selected Per Share Data and Ratios for a Share Outstanding Throughout the Periods Presented:
|
Year Ended May 31, |
|||||||||||||||||||||||
|
2022 |
2021 |
2020 |
2019 |
2018 |
|||||||||||||||||||
|
Net asset value, beginning of period |
$ |
13.11 |
$ |
13.04 |
$ |
12.92 |
$ |
12.65 |
$ |
13.06 |
|||||||||||||
|
Income (loss) from investment operations |
|||||||||||||||||||||||
|
Net investment income (loss)(a) |
(0.08 |
) |
(0.01 |
)(b) |
(0.05 |
) |
(0.03 |
)(b) |
0.05 |
||||||||||||||
|
Net realized and unrealized gains (losses) on investments and foreign currencies |
(0.42 |
) |
0.97 |
0.44 |
0.52 |
(0.01 |
)(b) |
||||||||||||||||
|
Total from investment operations |
(0.50 |
) |
0.96 |
0.39 |
0.49 |
0.04 |
|||||||||||||||||
|
Less distributions |
|||||||||||||||||||||||
|
From net investment income |
— |
— |
— |
(0.06 |
) |
(0.09 |
) |
||||||||||||||||
|
From net realized gains |
(0.07 |
) |
(0.89 |
) |
(0.27 |
) |
(0.16 |
) |
(0.36 |
) |
|||||||||||||
|
Total distributions |
(0.07 |
) |
(0.89 |
) |
(0.27 |
) |
(0.22 |
) |
(0.45 |
) |
|||||||||||||
|
Proceeds from redemption fees collected |
— |
— |
— |
— |
0.00 |
(c) |
|||||||||||||||||
|
Net asset value, end of period |
$ |
12.54 |
$ |
13.11 |
$ |
13.04 |
$ |
12.92 |
$ |
12.65 |
|||||||||||||
|
Total return(d) |
(3.83 |
%) |
7.58 |
% |
3.07 |
% |
3.89 |
% |
0.31 |
% |
|||||||||||||
|
Net assets, end of period (in 000s) |
$ |
77,866 |
$ |
97,909 |
$ |
98,715 |
$ |
163,349 |
$ |
222,309 |
|||||||||||||
|
RATIOS TO AVERAGE NET ASSETS: |
|||||||||||||||||||||||
|
Gross expenses(e) |
1.55 |
% |
1.64 |
% |
1.66 |
% |
1.94 |
% |
1.91 |
% |
|||||||||||||
|
Net expenses after advisory fees waived and expenses reimbursed(e)(f) |
1.49 |
% |
1.58 |
% |
1.63 |
% |
1.93 |
% |
1.90 |
% |
|||||||||||||
|
Net investment income (loss) |
(0.61 |
%) |
(0.08 |
%)(b) |
(0.36 |
%) |
(0.20 |
%)(b) |
0.41 |
% |
|||||||||||||
|
Portfolio turnover rate |
206 |
% |
300 |
% |
273 |
% |
419 |
% |
362 |
% |
|||||||||||||
(a) Per share amounts were calculated using average shares outstanding for the year.
(b) The amount shown for a share outstanding throughout the period may not correlate with the Statement of Operations for the period due to timing of sales and redemptions of Fund shares in relation to income earned and/or fluctuating market value of the investments of the Fund.
(c) Amount rounds to less than $0.01 per share.
(d) Total return is a measure of the change in the value of an investment in the Fund over the years covered, which assumes any dividends or capital gains distributions are reinvested in shares of the Fund. Returns shown do not reflect the deduction of taxes a shareholder would pay on Fund distributions or the redemption of Fund shares.
(e) Dividend expense totaled 0.01%, 0.00%, 0.15%, 0.46%, and 0.42% of average net assets for the years ended May 31, 2022, 2021, 2020, 2019 and 2018, respectively. Interest rebate expense and line of credit interest expense totaled 0.05%, 0.11%, 0.01%, 0.00% and 0.01% of average net assets for the years ended May 31, 2022, 2021, 2020, 2019 and 2018, respectively.
(f) Excluding dividend and interest expenses, the Fund's net expenses after advisory fees waived and expenses reimbursed would have been 1.43%, 1.47%, 1.47%, 1.47%, and 1.47% of average net assets for the years ended May 31, 2022, 2021, 2020, 2019 and 2018, respectively.
See Notes to Financial Statements.
Annual Report | May 31, 2022
61
Arbitrage Fund – Class I Financial Highlights
Selected Per Share Data and Ratios for a Share Outstanding Throughout the Periods Presented:
|
Year Ended May 31, |
|||||||||||||||||||||||
|
2022 |
2021 |
2020 |
2019 |
2018 |
|||||||||||||||||||
|
Net asset value, beginning of period |
$ |
13.60 |
$ |
13.47 |
$ |
13.32 |
$ |
13.03 |
$ |
13.46 |
|||||||||||||
|
Income (loss) from investment operations |
|||||||||||||||||||||||
|
Net investment income (loss)(a) |
(0.05 |
) |
0.02 |
(0.02 |
) |
0.01 |
0.05 |
||||||||||||||||
|
Net realized and unrealized gains (losses) on investments and foreign currencies |
(0.43 |
) |
1.00 |
0.45 |
0.54 |
0.01 |
|||||||||||||||||
|
Total from investment operations |
(0.48 |
) |
1.02 |
0.43 |
0.55 |
0.06 |
|||||||||||||||||
|
Less distributions |
|||||||||||||||||||||||
|
From net investment income |
— |
— |
(0.01 |
) |
(0.10 |
) |
(0.13 |
) |
|||||||||||||||
|
From net realized gains |
(0.07 |
) |
(0.89 |
) |
(0.27 |
) |
(0.16 |
) |
(0.36 |
) |
|||||||||||||
|
Total distributions |
(0.07 |
) |
(0.89 |
) |
(0.28 |
) |
(0.26 |
) |
(0.49 |
) |
|||||||||||||
|
Proceeds from redemption fees collected |
— |
— |
— |
— |
0.00 |
(b) |
|||||||||||||||||
|
Net asset value, end of period |
$ |
13.05 |
$ |
13.60 |
$ |
13.47 |
$ |
13.32 |
$ |
13.03 |
|||||||||||||
|
Total return(c) |
(3.55 |
%) |
7.87 |
% |
3.27 |
% |
4.21 |
% |
0.50 |
% |
|||||||||||||
|
Net assets, end of period (in 000s) |
$ |
1,459,176 |
$ |
1,449,309 |
$ |
1,243,838 |
$ |
1,546,542 |
$ |
1,510,598 |
|||||||||||||
|
RATIOS TO AVERAGE NET ASSETS: |
|||||||||||||||||||||||
|
Gross expenses(d) |
1.30 |
% |
1.39 |
% |
1.41 |
% |
1.69 |
% |
1.66 |
% |
|||||||||||||
|
Net expenses after advisory fees waived and expenses reimbursed(d)(e) |
1.24 |
% |
1.33 |
% |
1.38 |
% |
1.68 |
% |
1.65 |
% |
|||||||||||||
|
Net investment income (loss) |
(0.41 |
%) |
0.16 |
% |
(0.13 |
%) |
0.06 |
% |
0.35 |
% |
|||||||||||||
|
Portfolio turnover rate |
206 |
% |
300 |
% |
273 |
% |
419 |
% |
362 |
% |
|||||||||||||
(a) Per share amounts were calculated using average shares outstanding for the year.
(b) Amount rounds to less than $0.01 per share.
(c) Total return is a measure of the change in the value of an investment in the Fund over the years covered, which assumes any dividends or capital gains distributions are reinvested in shares of the Fund. Returns shown do not reflect the deduction of taxes a shareholder would pay on Fund distributions or the redemption of Fund shares.
(d) Dividend expense totaled 0.01%, 0.00%, 0.15%, 0.46%, and 0.42% of average net assets for the years ended May 31, 2022, 2021, 2020, 2019 and 2018, respectively. Interest rebate expense and line of credit interest expense totaled 0.05%, 0.11%, 0.01%, 0.00% and 0.01% of average net assets for the years ended May 31, 2022, 2021, 2020, 2019 and 2018, respectively.
(e) Excluding dividend and interest expenses, the Fund's net expenses after advisory fees waived and expenses reimbursed would have been 1.18%, 1.22%, 1.22%, 1.22%, and 1.22% of average net assets for the years ended May 31, 2022, 2021, 2020, 2019 and 2018, respectively.
See Notes to Financial Statements.
www.arbitragefunds.com | 1-800-295-4485
62
Arbitrage Fund – Class C Financial Highlights
Selected Per Share Data and Ratios for a Share Outstanding Throughout the Periods Presented:
|
Year Ended May 31, |
|||||||||||||||||||||||
|
2022 |
2021 |
2020 |
2019 |
2018 |
|||||||||||||||||||
|
Net asset value, beginning of period |
$ |
12.26 |
$ |
12.34 |
$ |
12.34 |
$ |
12.12 |
$ |
12.54 |
|||||||||||||
|
Income (loss) from investment operations |
|||||||||||||||||||||||
|
Net investment loss(a) |
(0.16 |
) |
(0.10 |
)(b) |
(0.14 |
) |
(0.12 |
)(b) |
(0.07 |
)(b) |
|||||||||||||
|
Net realized and unrealized gains (losses) on investments and foreign currencies |
(0.39 |
) |
0.91 |
0.41 |
0.50 |
0.01 |
|||||||||||||||||
|
Total from investment operations |
(0.55 |
) |
0.81 |
0.27 |
0.38 |
(0.06 |
) |
||||||||||||||||
|
Less distributions |
|||||||||||||||||||||||
|
From net investment income |
— |
— |
— |
— |
(0.00 |
)(c) |
|||||||||||||||||
|
From net realized gains |
(0.07 |
) |
(0.89 |
) |
(0.27 |
) |
(0.16 |
) |
(0.36 |
) |
|||||||||||||
|
Total distributions |
(0.07 |
) |
(0.89 |
) |
(0.27 |
) |
(0.16 |
) |
(0.36 |
) |
|||||||||||||
|
Net asset value, end of period |
$ |
11.64 |
$ |
12.26 |
$ |
12.34 |
$ |
12.34 |
$ |
12.12 |
|||||||||||||
|
Total return(d)(e) |
(4.51 |
%) |
6.77 |
% |
2.24 |
% |
3.11 |
% |
(0.45 |
%) |
|||||||||||||
|
Net assets, end of period (in 000s) |
$ |
13,467 |
$ |
18,043 |
$ |
19,860 |
$ |
19,050 |
$ |
22,917 |
|||||||||||||
|
RATIOS TO AVERAGE NET ASSETS: |
|||||||||||||||||||||||
|
Gross expenses(f) |
2.30 |
% |
2.39 |
% |
2.41 |
% |
2.69 |
% |
2.66 |
% |
|||||||||||||
|
Net expenses after advisory fees waived and expenses reimbursed(f)(g) |
2.24 |
% |
2.33 |
% |
2.38 |
% |
2.68 |
% |
2.65 |
% |
|||||||||||||
|
Net investment loss |
(1.35 |
%) |
(0.85 |
%)(b) |
(1.16 |
%) |
(0.94 |
%)(b) |
(0.56 |
%) |
|||||||||||||
|
Portfolio turnover rate |
206 |
% |
300 |
% |
273 |
% |
419 |
% |
362 |
% |
|||||||||||||
(a) Per share amounts were calculated using average shares outstanding for the year.
(b) The amount shown for a share outstanding throughout the period may not correlate with the Statement of Operations for the period due to timing of sales and redemptions of Fund shares in relation to income earned and/or fluctuating market value of the investments of the Fund.
(c) Amount rounds to less than $0.01 per share.
(d) Total return is a measure of the change in the value of an investment in the Fund over the years covered, which assumes any dividends or capital gains distributions are reinvested in shares of the Fund. Returns shown do not reflect the deduction of taxes a shareholder would pay on Fund distributions or the redemption of Fund shares.
(e) Total return excludes sales charges, if any, and would be lower for the period presented if it reflected these charges.
(f) Dividend expense totaled 0.01%, 0.00%, 0.15%, 0.46%, and 0.42% of average net assets for the years ended May 31, 2022, 2021, 2020, 2019 and 2018, respectively. Interest rebate expense and line of credit interest expense totaled 0.05%, 0.11%, 0.01%, 0.00% and 0.01% of average net assets for the years ended May 31, 2022, 2021, 2020, 2019 and 2018, respectively.
(g) Excluding dividend and interest expenses, the Fund's net expenses after advisory fees waived and expenses reimbursed would have been 2.18%, 2.22%, 2.22%, 2.22%, and 2.22% of average net assets for the years ended May 31, 2022, 2021, 2020, 2019 and 2018, respectively.
See Notes to Financial Statements.
Annual Report | May 31, 2022
63
Arbitrage Fund – Class A Financial Highlights
Selected Per Share Data and Ratios for a Share Outstanding Throughout the Periods Presented:
|
Year Ended May 31, |
|||||||||||||||||||||||
|
2022 |
2021 |
2020 |
2019 |
2018 |
|||||||||||||||||||
|
Net asset value, beginning of period |
$ |
13.08 |
$ |
13.01 |
$ |
12.90 |
$ |
12.63 |
$ |
13.07 |
|||||||||||||
|
Income (loss) from investment operations |
|||||||||||||||||||||||
|
Net investment income (loss)(a) |
(0.09 |
) |
— |
(b) |
(0.05 |
) |
(0.02 |
)(c) |
— |
(b) |
|||||||||||||
|
Net realized and unrealized gains (losses) on investments and foreign currencies |
(0.40 |
) |
0.96 |
0.43 |
0.52 |
0.02 |
|||||||||||||||||
|
Total from investment operations |
(0.49 |
) |
0.96 |
0.38 |
0.50 |
0.02 |
|||||||||||||||||
|
Less distributions |
|||||||||||||||||||||||
|
From net investment income |
— |
— |
— |
(0.07 |
) |
(0.10 |
) |
||||||||||||||||
|
From net realized gains |
(0.07 |
) |
(0.89 |
) |
(0.27 |
) |
(0.16 |
) |
(0.36 |
) |
|||||||||||||
|
Total distributions |
(0.07 |
) |
(0.89 |
) |
(0.27 |
) |
(0.23 |
) |
(0.46 |
) |
|||||||||||||
|
Net asset value, end of period |
$ |
12.52 |
$ |
13.08 |
$ |
13.01 |
$ |
12.90 |
$ |
12.63 |
|||||||||||||
|
Total return(d)(e) |
(3.77 |
%) |
7.60 |
% |
3.00 |
% |
3.94 |
% |
0.21 |
% |
|||||||||||||
|
Net assets, end of period (in 000s) |
$ |
42,040 |
$ |
32,624 |
$ |
17,762 |
$ |
18,341 |
$ |
16,740 |
|||||||||||||
|
RATIOS TO AVERAGE NET ASSETS: |
|||||||||||||||||||||||
|
Gross expenses(f) |
1.55 |
% |
1.64 |
% |
1.66 |
% |
1.94 |
% |
1.91 |
% |
|||||||||||||
|
Net expenses after advisory fees waived and expenses reimbursed(f)(g) |
1.49 |
% |
1.58 |
% |
1.63 |
% |
1.93 |
% |
1.90 |
% |
|||||||||||||
|
Net investment loss |
(0.74 |
%) |
(0.03 |
%)(c) |
(0.40 |
%) |
(0.19 |
%)(c) |
(0.01 |
%) |
|||||||||||||
|
Portfolio turnover rate |
206 |
% |
300 |
% |
273 |
% |
419 |
% |
362 |
% |
|||||||||||||
(a) Per share amounts were calculated using average shares outstanding for the year.
(b) Amount rounds to less than $0.01 per share.
(c) The amount shown for a share outstanding throughout the period may not correlate with the Statement of Operations for the period due to timing of sales and redemptions of Fund shares in relation to income earned and/or fluctuating market value of the investments of the Fund.
(d) Total return is a measure of the change in the value of an investment in the Fund over the years covered, which assumes any dividends or capital gains distributions are reinvested in shares of the Fund. Returns shown do not reflect the deduction of taxes a shareholder would pay on Fund distributions or the redemption of Fund shares.
(e) Total return excludes sales charges, if any, and would be lower for the period presented if it reflected these charges.
(f) Dividend expense totaled 0.01%, 0.00%, 0.15%, 0.46%, and 0.42% of average net assets for the years ended May 31, 2022, 2021, 2020, 2019 and 2018, respectively. Interest rebate expense and line of credit interest expense totaled 0.05%, 0.11%, 0.01%, 0.00%, and 0.01% of average net assets for the years ended May 31, 2022, 2021, 2020, 2019 and 2018, respectively.
(g) Excluding dividend and interest expenses, the Fund's net expenses after advisory fees waived and expenses reimbursed would have been 1.43%, 1.47%, 1.47%, 1.47%, and 1.47% of average net assets for the years ended May 31, 2022, 2021, 2020, 2019 and 2018, respectively.
See Notes to Financial Statements.
www.arbitragefunds.com | 1-800-295-4485
64
Water Island Event-Driven Fund – Class R Financial Highlights
Selected Per Share Data and Ratios for a Share Outstanding Throughout the Periods Presented:
|
Year Ended May 31, |
|||||||||||||||||||||||
|
2022 |
2021 |
2020 |
2019 |
2018 |
|||||||||||||||||||
|
Net asset value, beginning of period |
$ |
11.38 |
$ |
9.97 |
$ |
9.47 |
$ |
9.46 |
$ |
9.34 |
|||||||||||||
|
Income (loss) from investment operations |
|||||||||||||||||||||||
|
Net investment income (loss)(a) |
(0.12 |
) |
(0.05 |
) |
0.01 |
0.07 |
0.06 |
||||||||||||||||
|
Net realized and unrealized gains (losses) on investments and foreign currencies |
(0.42 |
) |
1.46 |
0.51 |
0.08 |
0.09 |
|||||||||||||||||
|
Total from investment operations |
(0.54 |
) |
1.41 |
0.52 |
0.15 |
0.15 |
|||||||||||||||||
|
Less distributions |
|||||||||||||||||||||||
|
From net investment income |
— |
— |
(0.02 |
) |
(0.14 |
) |
(0.03 |
) |
|||||||||||||||
|
Total distributions |
— |
— |
(0.02 |
) |
(0.14 |
) |
(0.03 |
) |
|||||||||||||||
|
Proceeds from redemption fees collected |
— |
— |
— |
— |
0.00 |
(b) |
|||||||||||||||||
|
Net asset value, end of period |
$ |
10.84 |
$ |
11.38 |
$ |
9.97 |
$ |
9.47 |
$ |
9.46 |
|||||||||||||
|
Total return(c) |
(4.75 |
%) |
14.14 |
% |
5.49 |
% |
1.60 |
% |
1.56 |
% |
|||||||||||||
|
Net assets, end of period (in 000s) |
$ |
4,502 |
$ |
10,116 |
$ |
7,694 |
$ |
30,423 |
$ |
45,383 |
|||||||||||||
|
RATIOS TO AVERAGE NET ASSETS: |
|||||||||||||||||||||||
|
Gross expenses(d) |
1.78 |
% |
1.98 |
% |
2.11 |
% |
2.58 |
% |
2.59 |
% |
|||||||||||||
|
Net expenses after advisory fees waived and expenses reimbursed or recouped(d)(e) |
1.80 |
% |
1.89 |
% |
1.83 |
% |
2.18 |
% |
2.16 |
% |
|||||||||||||
|
Net investment income (loss) |
(1.08 |
%) |
(0.51 |
%) |
0.09 |
% |
0.70 |
% |
0.58 |
% |
|||||||||||||
|
Portfolio turnover rate |
217 |
% |
320 |
% |
397 |
% |
504 |
% |
421 |
% |
|||||||||||||
(a) Per share amounts were calculated using average shares outstanding for the year.
(b) Amount rounds to less than $0.01 per share.
(c) Total return is a measure of the change in the value of an investment in the Fund over the years covered, which assumes any dividends or capital gains distributions are reinvested in shares of the Fund. Returns shown do not reflect the deduction of taxes a shareholder would pay on Fund distributions or the redemption of Fund shares.
(d) Dividend expense totaled 0.01%, 0.01%, 0.13%, 0.46%, and 0.44% of average net assets for the years ended May 31, 2022, 2021, 2020, 2019 and 2018, respectively. Interest rebate expense and line of credit interest expense totaled 0.10%, 0.19%, 0.01%, 0.03% and 0.03% of average net assets for the years ended May 31, 2022, 2021, 2020, 2019 and 2018, respectively.
(e) Excluding dividend and interest expenses, the Fund's net expenses after advisory fees waived and expenses reimbursed or recouped would have been 1.69%, 1.69%, 1.69%, 1.69%, and 1.69% of average net assets for the years ended May 31, 2022, 2021, 2020, 2019 and 2018, respectively.
See Notes to Financial Statements.
Annual Report | May 31, 2022
65
Water Island Event-Driven Fund – Class I Financial Highlights
Selected Per Share Data and Ratios for a Share Outstanding Throughout the Periods Presented:
|
Year Ended May 31, |
|||||||||||||||||||||||
|
2022 |
2021 |
2020 |
2019 |
2018 |
|||||||||||||||||||
|
Net asset value, beginning of period |
$ |
11.47 |
$ |
10.05 |
$ |
9.54 |
$ |
9.53 |
$ |
9.43 |
|||||||||||||
|
Income (loss) from investment operations |
|||||||||||||||||||||||
|
Net investment income (loss)(a) |
(0.10 |
) |
(0.03 |
) |
0.02 |
0.09 |
0.04 |
||||||||||||||||
|
Net realized and unrealized gains (losses) on investments and foreign currencies |
(0.42 |
) |
1.48 |
0.53 |
0.09 |
0.12 |
|||||||||||||||||
|
Total from investment operations |
(0.52 |
) |
1.45 |
0.55 |
0.18 |
0.16 |
|||||||||||||||||
|
Less distributions |
|||||||||||||||||||||||
|
From net investment income |
— |
(0.03 |
) |
(0.04 |
) |
(0.17 |
) |
(0.06 |
) |
||||||||||||||
|
Total distributions |
— |
(0.03 |
) |
(0.04 |
) |
(0.17 |
) |
(0.06 |
) |
||||||||||||||
|
Proceeds from redemption fees collected |
— |
— |
— |
— |
0.00 |
(b) |
|||||||||||||||||
|
Net asset value, end of period |
$ |
10.95 |
$ |
11.47 |
$ |
10.05 |
$ |
9.54 |
$ |
9.53 |
|||||||||||||
|
Total return(c) |
(4.53 |
%) |
14.51 |
% |
5.83 |
% |
1.88 |
% |
1.69 |
% |
|||||||||||||
|
Net assets, end of period (in 000s) |
$ |
107,038 |
$ |
125,093 |
$ |
99,069 |
$ |
92,710 |
$ |
103,001 |
|||||||||||||
|
RATIOS TO AVERAGE NET ASSETS: |
|||||||||||||||||||||||
|
Gross expenses(d) |
1.53 |
% |
1.73 |
% |
1.86 |
% |
2.33 |
% |
2.34 |
% |
|||||||||||||
|
Net expenses after advisory fees waived and expenses reimbursed or recouped(d)(e) |
1.55 |
% |
1.64 |
% |
1.58 |
% |
1.93 |
% |
1.91 |
% |
|||||||||||||
|
Net investment income (loss) |
(0.86 |
%) |
(0.24 |
%) |
0.20 |
% |
0.92 |
% |
0.46 |
% |
|||||||||||||
|
Portfolio turnover rate |
217 |
% |
320 |
% |
397 |
% |
504 |
% |
421 |
% |
|||||||||||||
(a) Per share amounts were calculated using average shares outstanding for the year.
(b) Amount rounds to less than $0.01 per share.
(c) Total return is a measure of the change in the value of an investment in the Fund over the years covered, which assumes any dividends or capital gains distributions are reinvested in shares of the Fund. Returns shown do not reflect the deduction of taxes a shareholder would pay on Fund distributions or the redemption of Fund shares.
(d) Dividend expense totaled 0.01%, 0.01%, 0.13%, 0.46%, and 0.44% of average net assets for the years ended May 31, 2022, 2021, 2020, 2019 and 2018, respectively. Interest rebate expense and line of credit interest expense totaled 0.10%, 0.19%, 0.01%, 0.03% and 0.03% of average net assets for the years ended May 31, 2022, 2021, 2020, 2019 and 2018, respectively.
(e) Excluding dividend and interest expenses, the Fund's net expenses after advisory fees waived and expenses reimbursed or recouped would have been 1.44%, 1.44%, 1.44%, 1.44%, and 1.44% of average net assets for the years ended May 31, 2022, 2021, 2020, 2019 and 2018, respectively.
See Notes to Financial Statements.
www.arbitragefunds.com | 1-800-295-4485
66
Water Island Event-Driven Fund – Class A Financial Highlights
Selected Per Share Data and Ratios for a Share Outstanding Throughout the Periods Presented:
|
Year Ended May 31, |
|||||||||||||||||||||||
|
2022 |
2021 |
2020 |
2019 |
2018 |
|||||||||||||||||||
|
Net asset value, beginning of period |
$ |
11.36 |
$ |
9.97 |
$ |
9.46 |
$ |
9.46 |
$ |
9.35 |
|||||||||||||
|
Income (loss) from investment operations |
|||||||||||||||||||||||
|
Net investment income (loss)(a) |
(0.15 |
) |
(0.06 |
) |
(0.00 |
)(b) |
0.06 |
0.04 |
|||||||||||||||
|
Net realized and unrealized gains (losses) on investments and foreign currencies |
(0.39 |
) |
1.46 |
0.53 |
0.08 |
0.10 |
|||||||||||||||||
|
Total from investment operations |
(0.54 |
) |
1.40 |
0.53 |
0.14 |
0.14 |
|||||||||||||||||
|
Less distributions |
|||||||||||||||||||||||
|
From net investment income |
— |
(0.01 |
) |
(0.02 |
) |
(0.14 |
) |
(0.03 |
) |
||||||||||||||
|
Total distributions |
— |
(0.01 |
) |
(0.02 |
) |
(0.14 |
) |
(0.03 |
) |
||||||||||||||
|
Net asset value, end of period |
$ |
10.82 |
$ |
11.36 |
$ |
9.97 |
$ |
9.46 |
$ |
9.46 |
|||||||||||||
|
Total return(c)(d) |
(4.75 |
%) |
14.20 |
% |
5.62 |
% |
1.56 |
% |
1.49 |
% |
|||||||||||||
|
Net assets, end of period (in 000s) |
$ |
2,301 |
$ |
1,384 |
$ |
347 |
$ |
799 |
$ |
701 |
|||||||||||||
|
RATIOS TO AVERAGE NET ASSETS: |
|||||||||||||||||||||||
|
Gross expenses(e) |
1.77 |
% |
2.00 |
% |
2.11 |
% |
2.58 |
% |
2.59 |
% |
|||||||||||||
|
Net expenses after advisory fees waived and expenses reimbursed or recouped(e)(f) |
1.79 |
% |
1.91 |
% |
1.83 |
% |
2.18 |
% |
2.16 |
% |
|||||||||||||
|
Net investment income (loss) |
(1.35 |
%) |
(0.59 |
%) |
0.02 |
% |
0.65 |
% |
0.41 |
% |
|||||||||||||
|
Portfolio turnover rate |
217 |
% |
320 |
% |
397 |
% |
504 |
% |
421 |
% |
|||||||||||||
(a) Per share amounts were calculated using average shares outstanding for the year.
(b) Amount rounds to less than $0.01 per share.
(c) Total return excludes sales charges, if any, and would be lower for the period presented if it reflected these charges.
(d) Total return is a measure of the change in the value of an investment in the Fund over the years covered, which assumes any dividends or capital gains distributions are reinvested in shares of the Fund. Returns shown do not reflect the deduction of taxes a shareholder would pay on Fund distributions or the redemption of Fund shares or the imposition of any sales load.
(e) Dividend expense totaled 0.00%, 0.01%, 0.13%, 0.46%, and 0.44% of average net assets for the years ended May 31, 2022, 2021, 2020, 2019 and 2018, respectively. Interest rebate expense and line of credit interest expense totaled 0.10%, 0.21%, 0.01%, 0.03%, and 0.03% of average net assets for the years ended May 31, 2022, 2021, 2020, 2019 and 2018, respectively.
(f) Excluding dividend and interest expenses, the Fund's net expenses after advisory fees waived and expenses reimbursed or recouped would have been 1.69%, 1.69%, 1.69%, 1.69%, and 1.69% of average net assets for the years ended May 31, 2022, 2021, 2020, 2019 and 2018, respectively.
See Notes to Financial Statements.
Annual Report | May 31, 2022
67
Water Island Credit Opportunities Fund – Class R Financial Highlights
Selected Per Share Data and Ratios for a Share Outstanding Throughout the Periods Presented:
|
Year Ended May 31, |
|||||||||||||||||||||||
|
2022 |
2021 |
2020 |
2019 |
2018 |
|||||||||||||||||||
|
Net asset value, beginning of period |
$ |
10.16 |
$ |
9.64 |
$ |
9.70 |
$ |
9.77 |
$ |
9.67 |
|||||||||||||
|
Income (loss) from investment operations |
|||||||||||||||||||||||
|
Net investment income(a) |
0.16 |
0.22 |
0.24 |
0.31 |
0.20 |
||||||||||||||||||
|
Net realized and unrealized gains (losses) on investments and foreign currencies |
(0.33 |
) |
0.54 |
(0.01 |
) |
(0.07 |
) |
0.12 |
|||||||||||||||
|
Total from investment operations |
(0.17 |
) |
0.76 |
0.23 |
0.24 |
0.32 |
|||||||||||||||||
|
Less distributions |
|||||||||||||||||||||||
|
From net investment income |
(0.26 |
) |
(0.24 |
) |
(0.29 |
) |
(0.31 |
) |
(0.22 |
) |
|||||||||||||
|
Total distributions |
(0.26 |
) |
(0.24 |
) |
(0.29 |
) |
(0.31 |
) |
(0.22 |
) |
|||||||||||||
|
Net asset value, end of period |
$ |
9.73 |
$ |
10.16 |
$ |
9.64 |
$ |
9.70 |
$ |
9.77 |
|||||||||||||
|
Total return(b) |
(1.74 |
%) |
8.09 |
% |
2.46 |
% |
2.55 |
% |
3.21 |
% |
|||||||||||||
|
Net assets, end of period (in 000s) |
$ |
9,072 |
$ |
7,553 |
$ |
3,673 |
$ |
7,845 |
$ |
9,533 |
|||||||||||||
|
RATIOS TO AVERAGE NET ASSETS: |
|||||||||||||||||||||||
|
Gross expenses(c) |
1.62 |
% |
1.77 |
% |
1.96 |
% |
2.10 |
%(d) |
2.27 |
% |
|||||||||||||
|
Net expenses after advisory fees waived and expenses reimbursed(c)(e) |
1.32 |
% |
1.32 |
% |
1.35 |
% |
1.59 |
%(d) |
1.95 |
% |
|||||||||||||
|
Net investment income |
1.58 |
% |
2.20 |
% |
2.48 |
% |
3.18 |
%(d) |
2.09 |
% |
|||||||||||||
|
Portfolio turnover rate |
148 |
% |
147 |
% |
175 |
% |
221 |
% |
314 |
% |
|||||||||||||
(a) Per share amounts were calculated using average shares outstanding for the year.
(b) Total return is a measure of the change in the value of an investment in the Fund over the years covered, which assumes any dividends or capital gains distributions are reinvested in shares of the Fund. Returns shown do not reflect the deduction of taxes a shareholder would pay on Fund distributions or the redemption of Fund shares.
(c) Dividend expense totaled 0.01%, 0.01%, 0.07%, 0.29%, and 0.42% of average net assets for the years ended May 31, 2022, 2021, 2020, 2019 and 2018, respectively. Interest rebate expense and line of credit interest expense totaled 0.08%, 0.08%, 0.05%, 0.01% and 0.03% of average net assets for the years ended May 31, 2022, 2021, 2020, 2019 and 2018, respectively.
(d) Effective August 6, 2018, the investment adviser reduced the advisory fee paid by the Fund and agreed to increase the expense reimbursements it provides to the Fund by contractually limiting the Fund's total expenses (other than certain expenses noted in the Notes to Financial Statements) to 1.23% for Class R shares. Prior to August 6, 2018, the expense limitation had been 1.50%.
(e) Excluding dividend and interest expenses, the Fund's net expenses after advisory fees waived and expenses reimbursed would have been 1.23%, 1.23%, 1.23%, 1.29%, and 1.50% of average net assets for the years ended May 31, 2022, 2021, 2020, 2019 and 2018, respectively.
See Notes to Financial Statements.
www.arbitragefunds.com | 1-800-295-4485
68
Water Island Credit Opportunities Fund – Class I Financial Highlights
Selected Per Share Data and Ratios for a Share Outstanding Throughout the Periods Presented:
|
Year Ended May 31, |
|||||||||||||||||||||||
|
2022 |
2021 |
2020 |
2019 |
2018 |
|||||||||||||||||||
|
Net asset value, beginning of period |
$ |
10.12 |
$ |
9.60 |
$ |
9.65 |
$ |
9.73 |
$ |
9.65 |
|||||||||||||
|
Income (loss) from investment operations |
|||||||||||||||||||||||
|
Net investment income(a) |
0.18 |
0.24 |
0.26 |
0.34 |
0.23 |
||||||||||||||||||
|
Net realized and unrealized gains (losses) on investments and foreign currencies |
(0.33 |
) |
0.55 |
0.01 |
(b) |
(0.08 |
) |
0.11 |
|||||||||||||||
|
Total from investment operations |
(0.15 |
) |
0.79 |
0.27 |
0.26 |
0.34 |
|||||||||||||||||
|
Less distributions |
|||||||||||||||||||||||
|
From net investment income |
(0.28 |
) |
(0.27 |
) |
(0.32 |
) |
(0.34 |
) |
(0.26 |
) |
|||||||||||||
|
Total distributions |
(0.28 |
) |
(0.27 |
) |
(0.32 |
) |
(0.34 |
) |
(0.26 |
) |
|||||||||||||
|
Net asset value, end of period |
$ |
9.69 |
$ |
10.12 |
$ |
9.60 |
$ |
9.65 |
$ |
9.73 |
|||||||||||||
|
Total return(c) |
(1.51 |
%) |
8.29 |
% |
2.82 |
% |
2.70 |
% |
3.61 |
% |
|||||||||||||
|
Net assets, end of period (in 000s) |
$ |
125,705 |
$ |
98,777 |
$ |
56,869 |
$ |
49,795 |
$ |
36,207 |
|||||||||||||
|
RATIOS TO AVERAGE NET ASSETS: |
|||||||||||||||||||||||
|
Gross expenses(d) |
1.37 |
% |
1.52 |
% |
1.71 |
% |
1.85 |
%(e) |
2.02 |
% |
|||||||||||||
|
Net expenses after advisory fees waived and expenses reimbursed(d)(f) |
1.07 |
% |
1.07 |
% |
1.10 |
% |
1.32 |
%(e) |
1.70 |
% |
|||||||||||||
|
Net investment income |
1.84 |
% |
2.44 |
% |
2.73 |
% |
3.51 |
%(e) |
2.34 |
% |
|||||||||||||
|
Portfolio turnover rate |
148 |
% |
147 |
% |
175 |
% |
221 |
% |
314 |
% |
|||||||||||||
(a) Per share amounts were calculated using average shares outstanding for the year.
(b) The amount shown for a share outstanding throughout the period may not correlate with the Statement of Operations for the period due to timing of sales and redemptions of Fund shares in relation to income earned and/or fluctuating market value of the investments of the Fund.
(c) Total return is a measure of the change in the value of an investment in the Fund over the years covered, which assumes any dividends or capital gains distributions are reinvested in shares of the Fund. Returns shown do not reflect the deduction of taxes a shareholder would pay on Fund distributions or the redemption of Fund shares.
(d) Dividend expense totaled 0.01%, 0.01%, 0.07%, 0.29%, and 0.42% of average net assets for the years ended May 31, 2022, 2021, 2020, 2019 and 2018, respectively. Interest rebate expense and line of credit interest expense totaled 0.08%, 0.08%, 0.05%, 0.01% and 0.03% of average net assets for the years ended May 31, 2022, 2021, 2020, 2019 and 2018, respectively.
(e) Effective August 6, 2018, the investment adviser reduced the advisory fee paid by the Fund and agreed to increase the expense reimbursements it provides to the Fund by contractually limiting the Fund's total expenses (other than certain expenses noted in the Notes to Financial Statements) to 0.98% for Class I shares. Prior to August 6, 2018, the expense limitation had been 1.25%.
(f) Excluding dividend and interest expenses, the Fund's net expenses after advisory fees waived and expenses reimbursed would have been 0.98%, 0.98%, 0.98%, 1.02%, and 1.25% of average net assets for the years ended May 31, 2022, 2021, 2020, 2019 and 2018, respectively.
See Notes to Financial Statements.
Annual Report | May 31, 2022
69
Water Island Credit Opportunities Fund – Class A Financial Highlights
Selected Per Share Data and Ratios for a Share Outstanding Throughout the Periods Presented:
|
Year Ended May 31, |
|||||||||||||||||||||||
|
2022 |
2021 |
2020 |
2019 |
2018 |
|||||||||||||||||||
|
Net asset value, beginning of period |
$ |
10.12 |
$ |
9.60 |
$ |
9.65 |
$ |
9.73 |
$ |
9.66 |
|||||||||||||
|
Income (loss) from investment operations |
|||||||||||||||||||||||
|
Net investment income(a) |
0.16 |
0.22 |
0.23 |
0.31 |
0.17 |
||||||||||||||||||
|
Net realized and unrealized gains (losses) on investments and foreign currencies |
(0.33 |
) |
0.54 |
0.01 |
(b) |
(0.08 |
) |
0.14 |
|||||||||||||||
|
Total from investment operations |
(0.17 |
) |
0.76 |
0.24 |
0.23 |
0.31 |
|||||||||||||||||
|
Less distributions |
|||||||||||||||||||||||
|
From net investment income |
(0.26 |
) |
(0.24 |
) |
(0.29 |
) |
(0.31 |
) |
(0.24 |
) |
|||||||||||||
|
Total distributions |
(0.26 |
) |
(0.24 |
) |
(0.29 |
) |
(0.31 |
) |
(0.24 |
) |
|||||||||||||
|
Net asset value, end of period |
$ |
9.69 |
$ |
10.12 |
$ |
9.60 |
$ |
9.65 |
$ |
9.73 |
|||||||||||||
|
Total return(c)(d) |
(1.76 |
%) |
8.02 |
% |
2.56 |
% |
2.45 |
% |
3.10 |
% |
|||||||||||||
|
Net assets, end of period (in 000s) |
$ |
105 |
$ |
97 |
$ |
88 |
$ |
121 |
$ |
153 |
|||||||||||||
|
RATIOS TO AVERAGE NET ASSETS: |
|||||||||||||||||||||||
|
Gross expenses(e) |
1.62 |
% |
1.77 |
% |
1.96 |
% |
2.10 |
%(f) |
2.27 |
% |
|||||||||||||
|
Net expenses after advisory fees waived and expenses reimbursed(e)(g) |
1.32 |
% |
1.32 |
% |
1.35 |
% |
1.58 |
%(f) |
1.95 |
% |
|||||||||||||
|
Net investment income |
1.59 |
% |
2.21 |
% |
2.37 |
% |
3.24 |
%(f) |
1.81 |
% |
|||||||||||||
|
Portfolio turnover rate |
148 |
% |
147 |
% |
175 |
% |
221 |
% |
314 |
% |
|||||||||||||
(a) Per share amounts were calculated using average shares outstanding for the year.
(b) The amount shown for a share outstanding throughout the period may not correlate with the Statement of Operations for the period due to timing of sales and redemptions of Fund shares in relation to income earned and/or fluctuating market value of the investments of the Fund.
(c) Total return is a measure of the change in the value of an investment in the Fund over the years covered, which assumes any dividends or capital gains distributions are reinvested in shares of the Fund. Returns shown do not reflect the deduction of taxes a shareholder would pay on Fund distributions or the redemption of Fund shares or the imposition of any sales load.
(d) Total return excludes sales charges, if any, and would be lower for the period presented if it reflected these charges.
(e) Dividend expense totaled 0.01%, 0.01%, 0.07%, 0.29%, and 0.42% of average net assets for the years ended May 31, 2022, 2021, 2020, 2019 and 2018, respectively. Interest rebate expense and line of credit interest expense totaled 0.08%, 0.08%, 0.05%, 0.01%, and 0.03% of average net assets for the years ended May 31, 2022, 2021, 2020, 2019 and 2018, respectively.
(f) Effective August 6, 2018, the investment adviser reduced the advisory fee paid by the Fund and agreed to increase the expense reimbursements it provides to the Fund by contractually limiting the Fund's total expenses (other than certain expenses noted in the Notes to Financial Statements) to 1.23% for Class A shares. Prior to August 6, 2018, the expense limitation had been 1.50%.
(g) Excluding dividend and interest expenses, the Fund's net expenses after advisory fees waived and expenses reimbursed would have been 1.23%, 1.23%, 1.23%, 1.28%, and 1.50% of average net assets for the years ended May 31, 2022, 2021, 2020, 2019 and 2018, respectively.
See Notes to Financial Statements.
www.arbitragefunds.com | 1-800-295-4485
70
The Arbitrage Funds Notes to Financial Statements
May 31, 2022
1. ORGANIZATION
The Arbitrage Funds (the "Trust") is a Delaware statutory trust, which was organized on December 22, 1999 and is registered under the Investment Company Act of 1940, as amended (the "1940 Act"), as an open-end management investment company issuing its shares in series. Each series represents a distinct portfolio with its own investment objective and policies. The three series presently authorized are the Arbitrage Fund (the "Arbitrage Fund"), the Water Island Event-Driven Fund (the "Event-Driven Fund") and the Water Island Credit Opportunities Fund (the "Credit Opportunities Fund"), each a "Fund" and collectively the "Funds". The Arbitrage Fund and the Credit Opportunities Fund are each a diversified series of the Trust. The Event-Driven Fund is a non-diversified series of the Trust. Water Island Capital, LLC acts as the Funds' investment adviser (the "Adviser"). The Adviser is responsible for overseeing the management and business affairs of the Funds, and has discretion to purchase and sell securities in accordance with the Funds' objectives, policies, and restrictions, subject to the authority of and supervision by the Trust's Board of Trustees (the "Board"). The Adviser continuously reviews, supervises, and administers the Funds' investment programs. The Funds, together with the series of AltShares Trust, an open-end management investment company also advised by the Adviser, are part of a family of investment companies referred to as the Water Island Capital-Advised Funds.
|
Commencement of Operations |
|||||||||||||||||||
|
Fund |
Class R shares |
Class I shares |
Class C shares |
Class A shares |
|||||||||||||||
|
Arbitrage Fund |
September 18, 2000 |
October 17, 2003 |
June 1, 2012 |
June 1, 2013 |
|||||||||||||||
|
Event-Driven Fund |
October 1, 2010 |
October 1, 2010 |
N/A |
June 1, 2013 |
|||||||||||||||
|
Credit Opportunities Fund |
October 1, 2012 |
October 1, 2012 |
N/A |
June 1, 2013 |
|||||||||||||||
The investment objective of the Arbitrage Fund is to seek to achieve capital growth by engaging in merger arbitrage. The investment objective of the Event-Driven Fund is to seek to achieve capital growth by investing in companies that are impacted by corporate events such as mergers, acquisitions, asset sales, restructurings, refinancings, recapitalizations, reorganizations, or other special situations. The investment objective of the Credit Opportunities Fund is to seek to provide current income and capital growth by investing primarily in debt securities impacted by catalysts and events such as mergers, acquisitions, debt maturities, refinancings, regulatory changes, recapitalizations, reorganizations, restructurings, and other special situations.
The Arbitrage Fund's four classes of shares, Class R, Class I, Class C and Class A, and the Event-Driven Fund's and Credit Opportunities Fund's three classes of shares, Class R, Class I and Class A, represent interests in the same portfolio of investments and have the same rights, but differ primarily in the expenses to which they are subject and the investment eligibility requirements. Class R shares, Class C shares and Class A shares are subject to an annual distribution and servicing fee of up to 0.25%, 1.00% and 0.25%, respectively, of each Fund's average daily net assets attributable to Class R shares, Class C shares and Class A shares, respectively, whereas Class I shares are not subject to any distribution and servicing fees. Class C shares are also subject to a 1.00% contingent deferred sales charge on all purchases redeemed within 12 months of purchase. Class A shares of the Arbitrage Fund are sold subject to a maximum front-end sales load equal to 2.75% of the offering price and are also subject to a 1.00% contingent deferred sales load on purchases at or above $250,000, purchased without a front-end sales charge and redeemed within 18 months of purchase. Class A shares of the Event-Driven Fund and the Credit Opportunities Fund are sold subject to a maximum front-end sales load equal to 3.25% of the offering price and are also subject to a 1.00% contingent deferred sales load on purchases at or above $250,000 purchased without a front-end sales charge and redeemed within 18 months of purchase.
Annual Report | May 31, 2022
71
The Arbitrage Funds Notes to Financial Statements (continued)
May 31, 2022
2. SIGNIFICANT ACCOUNTING POLICIES
The following is a summary of significant accounting policies followed by the Funds. These policies are in conformity with U.S. generally accepted accounting principles ("GAAP"). The Funds are considered investment companies for financial reporting purposes under GAAP and Accounting Standards Codification Topic 946 — Financial Services — Investment Companies.
In March 2020, the FASB issued ASU 2020-04, Reference Rate Reform, which provide optional expedients and exceptions for applying GAAP to contracts, hedging relationships, and other transactions which are affected by reference rate reform if certain criteria are met. Such provisions are elective and apply to all entities as of March 12, 2020 through December 31, 2022, subject to meeting certain criteria, that have transactions that reference the London Interbank Offered Rate ("LIBOR") or another reference rate that are discontinued because of reference rate reform. ASU 2020-04 had no impact on the Funds during the current reporting period.
In July 2017, the Financial Conduct Authority, the United Kingdom's financial regulatory body, announced that after 2021 it will cease its active encouragement of banks to provide quotations needed to sustain the LIBOR rate, which means that the LIBOR rate may no longer be published after 2021. The elimination of London Inter-Bank Offered Rate (LIBOR), among other "inter-bank offered" reference rates, may adversely affect the interest rates on, and value of, certain Fund investments for which the value is tied to LIBOR. The U.K. Financial Conduct Authority and the ICE Benchmark Administration have announced that most LIBOR settings will no longer be published after December 31, 2021 and a majority of U.S. dollar LIBOR settings will cease publication after June 30, 2023. It's possible that a subset of LIBOR settings will be published after these dates on a "synthetic" basis, but any such publications would be considered non-representative of the underlying market. Markets are slowly developing in response to these new reference rates. Uncertainty related to the liquidity impact of the change in rates, and how to appropriately adjust these rates at the time of transition, poses risks for the Funds. These risks are likely to persist until new reference rates and fallbacks for both legacy and new instruments and contracts are commercially accepted, and market practices become settled. Alternatives to LIBOR have been established or are in development in most major currencies, including the Secured Overnight Financing Rate (SOFR) that is intended to replace U.S. dollar LIBOR.
In October 2020, the SEC adopted new regulations governing the use of derivatives by registered investment companies. Rule 18f-4 under the 1940 Act will impose limits on the amount of derivatives a fund could enter into, eliminate the asset segregation framework currently used by funds to comply with Section 18 of the 1940 Act, and in addition to these and other requirements, require funds to maintain a derivatives risk management program and appoint a derivatives risk manager. The Funds will not be required to comply with Rule 18f-4 until August 19, 2022. Management expects that the adoption of this rule will not have a material impact on the Funds' financial statements.
In December 2020, the SEC adopted Rule 2a-5 under the 1940 Act, which is intended to address valuation practices and the role of a fund's board with respect to the fair value of the investments of a registered investment company or business development company. Rule 2a-5, among other things, establishes an updated regulatory framework for registered investment company valuation practices. The Funds will not be required to comply with Rule 2a-5 until September 2022. Management expects that the adoption of this rule will not have a material impact on the Funds' financial statements.
Use of Estimates — The preparation of financial statements in conformity with GAAP requires management to make estimates and assumptions that affect the reported amounts of assets and
www.arbitragefunds.com | 1-800-295-4485
72
The Arbitrage Funds Notes to Financial Statements (continued)
May 31, 2022
liabilities at the date of the financial statements and the reported amounts of increases and decreases in net assets from operations during the reporting period. Actual results could differ from those estimates.
Valuation of Investments — The Funds' portfolio securities are valued as of the close of trading of the New York Stock Exchange ("NYSE") (normally 4:00 p.m., Eastern standard time). Common stocks, mutual funds and other securities, including open short positions that are traded on a securities exchange, are valued at the last quoted sales price at the close of regular trading on the day the valuation is made. Securities which are quoted by NASDAQ are valued at the NASDAQ Official Closing Price. Price information on listed stocks is taken from the exchange where the security is primarily traded. Redeemable securities issued by open-end investment companies are valued at the investment company's respective net asset value, with the exception of exchange-traded open-end investment companies, which are priced as common stocks. Market quotations of foreign securities from the principal markets in which they trade may not be reliable if events or circumstances that may affect the value of portfolio securities occur between the time of the market quotation and the close of trading on the NYSE. If a significant event that affects the valuation of a foreign security occurs between the close of a foreign security's primary exchange and the time the Funds calculate their net asset value ("NAV"), the Funds will fair value the foreign security to account for this discrepancy. Securities which are listed on an exchange but which are not traded on the valuation date will be valued at last bid if held long, and last ask if held short. Put and call options and securities traded in the over-the-counter market are valued at the mean of the most recent bid and ask prices. Foreign currency forward contracts are valued at the current day's interpolated foreign exchange rate, as calculated using the current day's spot rate, and the thirty, sixty, ninety and one-hundred eighty day forward rates provided by an independent source.
Debt securities are priced based upon an evaluated bid provided by independent, third-party pricing agents, if available. The third-party pricing agents may also value debt securities at an evaluated bid price by employing methodologies that utilize actual market transactions, broker-supplied valuations, or other methodologies designed to identify the market value for such securities. Unlisted securities for which market quotations are readily available are valued at the latest quoted bid price. Single name swap agreements are valued based on the underlying terms of the agreement. Other swap agreements (such as baskets of securities) are valued daily based on the terms of the swap agreement as provided by an independent third party or the counterparty. If a third-party valuation is not available, these other swap agreements are valued based on the valuation provided by the counterparty.
Other assets and securities for which no quotations are readily available are valued at fair value using methods determined in good faith by the Pricing Committee, which is under the supervision of the Board. Some of the more common reasons that may necessitate that a security be valued at fair value include: the security's trading has been halted or suspended; the security has been delisted from a national exchange; the security's primary trading market is temporarily closed at a time when under normal conditions it would be open; the security has been acquired through completion of a merger/tender or the security's primary pricing source is not able or willing to provide a price. Such methods of fair valuation may include, but are not limited to: multiple of earnings, multiple of book value, discount from market of a similar freely traded security, purchase price of a security, subsequent private transactions in the security or related securities, or a combination of these and other factors. Foreign securities are translated from the local currency into U.S. dollars using currency exchange rates supplied by a quotation service.
Annual Report | May 31, 2022
73
The Arbitrage Funds Notes to Financial Statements (continued)
May 31, 2022
Fair Value Measurements — In accordance with the authoritative guidance on fair value measurements under GAAP, the Funds disclose fair value of their investments in a hierarchy that prioritizes the inputs to valuation techniques used to measure the fair value. The objective of a fair value measurement is to determine the price that would be received to sell an asset or paid to transfer a liability in an orderly transaction between market participants at the measurement date (an exit price). Accordingly, the fair value hierarchy gives the highest priority to quoted prices (unadjusted) in active markets for identical assets or liabilities (Level 1) and the lowest priority to unobservable inputs (Level 3). The guidance establishes three levels of the fair value hierarchy as follows:
Level 1 — Unadjusted quoted prices in active markets for identical, unrestricted assets or liabilities that the Funds have the ability to access at the measurement date;
Level 2 — Observable inputs other than quoted prices included in Level 1 that are observable (either directly or indirectly) for substantially the full term of the asset or liability; and
Level 3 — Unobservable inputs for the asset or liability, to the extent relevant observable inputs are not available, representing each Fund's own assumption about the assumptions a market participant would use in valuing the asset or liability, and would be based on the best information available.
Investments are classified within the level of the lowest significant input considered in determining fair value. Investments classified within Level 3, whose fair value measurement considers several inputs, may include Level 1 or Level 2 inputs as components of the overall fair value measurement. The inputs or methodology used for valuing securities are not necessarily an indication of the risk associated with investing in those securities.
For the year ended May 31, 2022, there were no significant changes to the Funds' fair value methodologies. Transfers for Level 3 securities, if any, are shown as part of the leveling table in each Fund's Portfolio of Investments.
The availability of observable inputs can vary from security to security and is affected by a wide variety of factors, including, but not limited to, the type of security, whether the security is new and not yet established in the marketplace, the liquidity of markets, and other characteristics particular to the security. To the extent that valuation is based on models or inputs that are less observable or unobservable in the market, the determination of fair value requires more judgment. Accordingly, the degree of judgment exercised in determining fair value is generally greatest for instruments categorized in Level 3. Due to the inherent uncertainty of valuation, the determination of values may differ significantly from values that would have been realized had a ready market for investments existed, and the differences could be material.
Share Valuation and Redemption Fees — The net asset value per share of each class of shares of the Funds is calculated daily by dividing the total value of a Fund's assets attributable to that class, less liabilities attributable to that class, by the number of shares of that class outstanding. The offering price and redemption price per share of each class of each Fund is equal to the net asset value per share. The Trust does not impose a redemption fee on the sale of a Fund's shares.
Security Transactions — Security transactions are accounted for on trade date. Gains and losses on securities sold are determined on a specific identification basis.
Short Positions — The Funds may sell securities short for economic hedging purposes. Subsequent fluctuations in the market prices of securities sold short may require purchasing the
www.arbitragefunds.com | 1-800-295-4485
74
The Arbitrage Funds Notes to Financial Statements (continued)
May 31, 2022
securities at prices which may differ from the market value reflected on the Portfolio of Investments. The Funds are liable for any dividends and interest payable on securities while those securities are in a short position. As collateral for their short positions, the Funds are required under the 1940 Act to maintain assets consisting of cash, cash equivalents or liquid securities. The amount of the collateral is required to be adjusted daily to reflect changes in the value of the securities sold short. The Funds are charged an interest rebate expense by the prime broker on securities sold short. The interest rebate expense is charged for the duration of time that a security is sold short and is shown on the Statements of Operations.
Collateral — The Funds maintain a margin account with a broker that is used to hold proceeds received from short sales as well as daily mark-to-market adjustments. The balance is shown in the Statement of Assets and Liabilities as 'Deposits with brokers for securities sold short'. Further, both short sales and swap contracts require the Funds to maintain additional collateral with the broker/counterparty and to pledge assets or cash which is held in a segregated tri-party account. Securities pledged as collateral are designated in the Schedule of Investments and cash collateral as 'Segregated cash for collateral' in the Statement of Assets and Liabilities.
Derivative Instruments and Hedging Activities — The following discloses the Funds' use of derivative instruments and hedging activities.
The Funds' investment objectives not only permit the Funds to purchase investment securities, but they also allow certain Funds to enter into various types of derivative contracts, including, but not limited to, swap contracts, forward foreign currency exchange contracts, and purchased and written option contracts. In doing so, the Funds will employ strategies in differing combinations to permit them to increase, decrease, or change the level or types of exposure to market factors. Central to those strategies are features inherent to derivatives that make them more attractive for this purpose than equity or debt securities: they require little or no initial cash investment; they can focus exposure on only certain selected risk factors; and they may not require the ultimate receipt or delivery of the underlying security (or securities) to satisfy the contract. This may allow the Funds to pursue their objectives more quickly and efficiently than if they were to make direct purchases or sales of securities capable of effecting a similar response to market factors. The Funds may, but are not required to, seek to reduce their currency risk by hedging part or all of their exposure to various foreign currencies.
Market Risk Factors: In pursuit of their investment objectives, the Funds may seek to use derivatives to increase or decrease their exposure to the following market risk factors:
Equity Risk: Equity risk relates to the change in value of equity securities as they relate to increases or decreases in the general market. Investments in securities issued by small and medium capitalization companies tend to be less liquid and more volatile than stocks of companies with relatively large market capitalizations. To the extent a Fund invests in securities of small and medium capitalization companies, it may be more vulnerable to adverse business events than larger, more established companies.
Interest Rate Risk: Interest rate risk refers to the fluctuations in value of fixed-income securities resulting from the inverse relationship between price and yield. For example, an increase in general interest rates will tend to reduce the market value of fixed income investments, and a decline in general interest rates will tend to increase the value of such investments. In addition, debt securities with longer maturities, which tend to have higher yields, are subject to potentially greater fluctuations in value from changes in interest rates than obligations with shorter maturities.
Annual Report | May 31, 2022
75
The Arbitrage Funds Notes to Financial Statements (continued)
May 31, 2022
Foreign Exchange Rate Risk: Foreign exchange rate risk relates to the change in the U.S. dollar value of a security held that is denominated in a foreign currency. The value of a foreign currency denominated security will decrease as the dollar appreciates against the currency, while the value of the foreign currency denominated security will increase as the dollar depreciates against the currency. Adverse changes in exchange rates may erode or reverse any gains produced by foreign currency denominated investments and may widen any losses.
Credit Risk: Credit risk relates to the ability of the issuer to meet interest and principal payments, or both, as they come due. In general, lower-grade, higher-yield bonds are subject to credit risk to a greater extent than lower-yield, higher-quality bonds.
The extent of the impact of the novel coronavirus ("COVID-19") outbreak on the financial performance of the Funds continues to depend on developments, including duration and spread of the outbreak, related advisories and restrictions, and the impact of COVID-19 on the financial markets and the overall economy, all of which are highly uncertain and cannot be predicted. Adverse market conditions may be prolonged and may not have the same impact on all types of securities. These disruptions could prevent a Fund from executing advantageous investment decisions in a timely manner and could negatively impact the Fund's ability to achieve its investment objective. If the financial markets and/or the overall economy continue to be impacted for an extended period of time, the Funds' results of operations may be materially adversely affected.
Market Disruption Risks Related to Russia-Ukraine Conflict: Russia's invasion of Ukraine in late February 2022, the resulting responses of various countries, the European Union and NATO to Russia's actions (including potential further sanctions), the potential for military escalation and other corresponding events, including potential retaliatory actions (including cyberattacks) by Russia, have had, and could continue to have, severe negative effects on regional and global economic and financial markets, including increased volatility, reduced liquidity and overall uncertainty. The negative impact may be particularly acute in certain sectors including, but not limited to, energy, financials, commodities, engineering and defense. This could negatively affect Fund performance and the value of an investment in the Funds, even beyond any direct investment exposure the Funds may have to Russian issuers or the adjoining geographic regions.
Risk of Investing in Derivatives: The Funds' use of derivatives can result in losses due to unanticipated changes in the market risk factors and the overall market. In instances where the Funds are using derivatives to decrease or hedge exposures to market risk factors for securities held by the Funds, there are also risks that those derivatives may not perform as expected, resulting in losses for the combined or hedged positions.
Derivatives may have little or no initial cash investment relative to their market value exposure and therefore can produce significant gains or losses in excess of their cost. This use of embedded leverage allows the Funds to increase their market value exposure relative to their net assets and can substantially increase the volatility of the Funds' performance.
Additional associated risks from investing in derivatives also exist and potentially could have significant effects on the valuation of the derivative instruments and the Funds. Typically, the associated risks are not the risks that the Funds are attempting to increase or decrease exposure to, per their investment objectives, but are the additional risks from investing in derivatives.
Examples of these associated risks are liquidity risk, which is the risk that the Funds will not be able to sell the derivative in the open market in a timely manner, and counterparty credit risk,
www.arbitragefunds.com | 1-800-295-4485
76
The Arbitrage Funds Notes to Financial Statements (continued)
May 31, 2022
which is the risk that the counterparty to a transaction will not fulfill its obligation to the Funds. Associated risks can be different for each type of derivative and are discussed by derivative type in the notes that follow.
Option Writing/Purchasing: Certain Funds may write or purchase option contracts to adjust risk and return of their overall investment positions. When a Fund writes or purchases an option, an amount equal to the premium received or paid by the Fund is recorded as a liability or an asset and is subsequently adjusted to the current market value of the option written or purchased. Premiums received or paid from writing or purchasing options that expire unexercised are treated by the Fund on the expiration date as realized gains or losses. The difference between the premium and the amount paid or received on effecting a closing purchase or sale transaction, including brokerage commissions, is also treated as a realized gain or loss. If an option is exercised, the premium paid or received is added to the cost of the purchase or proceeds from the sale in determining whether the Fund has realized a gain or loss on investment transactions. Risks from entering into option transactions arise from the potential inability of counterparties to meet the terms of the contracts, the potential inability to enter into closing transactions because of an illiquid secondary market and from unexpected movements in security values.
Options held by the Funds at May 31, 2022 are disclosed in the Portfolio of Investments.
During the period ended May 31, 2022, the Funds engaged in option writing/purchasing to limit volatility and correlation and to create income and optionality. The maximum potential amount of future payments (undiscounted) that a fund as a writer of put options could be required to make is equal to the notional amount multiplied by the exercise price as shown in the Schedule of Investments.
Foreign Currency Exchange Contracts: The Funds may enter into forward foreign currency exchange contracts as a way of managing foreign exchange rate risk. The Funds may enter into these contracts for the purchase or sale of a specific foreign currency at a fixed price on a future date as a hedge or cross-hedge against either specific transactions or portfolio positions. The objective of the Funds' foreign currency hedging transactions is to reduce risk that the U.S. dollar value of the Funds' securities denominated in foreign currency will decline in value due to changes in foreign currency exchange rates.
Foreign currency exchange contracts held by the Funds at May 31, 2022 are disclosed in the Portfolio of Investments.
During the period ended May 31, 2022, the Funds entered into foreign currency exchange contracts to hedge currency risk.
Warrants/Rights: Each Fund may purchase or otherwise receive warrants or rights. Warrants and rights generally give the holder the right to receive, upon exercise, a security of the issuer at a set price. The Funds typically use warrants and rights in a manner similar to their use of purchased options on securities, as described in the Options Writing/Purchasing section above. Risks associated with the use of warrants and rights are generally similar to risks associated with the use of purchased options. However, warrants and rights often do not have standardized terms, and may have longer maturities and may be less liquid than exchange-traded options. In addition, the terms of warrants or rights may limit each Fund's ability to exercise the warrants or rights at such times and in such quantities as each Fund would otherwise wish. Warrants and rights generally pay no dividends and confer no voting or other rights other than to purchase the underlying security.
Annual Report | May 31, 2022
77
The Arbitrage Funds Notes to Financial Statements (continued)
May 31, 2022
Warrants/rights held by the Funds at May 31, 2022 are disclosed in the Portfolio of Investments.
During the period ended May 31, 2022, the Funds held warrants/rights as a result of receiving them from completed deals, and to participate in investment opportunities.
Swaps: Certain Funds may enter into interest rate, index, equity, total return and credit default swap agreements, for hedging and non-hedging purposes. These transactions would be entered into in an attempt to obtain a particular return when it is considered desirable to do so, possibly at a lower cost to a Fund than if the Fund had invested directly in the asset that yielded the desired return. Swap agreements may be executed in a multilateral or other trade facility program, such as a registered exchange ("centrally cleared swaps") or may be privately negotiated in the over-the-counter market. The duration of a swap agreement typically ranges from a few weeks to more than one year. In a standard swap transaction, two parties agree to exchange the returns (or differentials in rates of return) earned or realized on particular predetermined investments or instruments, which may be adjusted for an interest factor. The gross returns to be exchanged or "swapped" between the parties are generally calculated with respect to a "notional amount" (i.e., the return on or increase in value of a particular dollar amount invested at a particular interest rate, a particular security, in a particular foreign currency, or in a "basket" of securities representing a particular index). In a centrally cleared swap, immediately following execution of the swap agreement, the swap agreement is novated to a central counterparty (the "CCP") and the Fund's counterparty on the swap agreement becomes the CCP.
Total return swap agreements are contracts in which one party agrees to make periodic payments based on the change in market value of underlying assets, which may include a specified security, basket of securities, defined portfolios of bonds, loans and mortgages, or securities indexes during the specified period in return for periodic payments based on a fixed or variable interest rate or the total return from other underlying assets or indices. Total return swap agreements may be used to obtain exposure to a security or market index without owning or taking physical custody of such security or component securities of a market index. Total return swap agreements may effectively add leverage to a Fund's portfolio because, in addition to its total net assets, the Fund would be subject to investment exposure on the notional amount of the swap. Total return swaps are a mechanism for the user to accept the economic benefits of asset ownership without utilizing the balance sheet. The other leg of the swap, usually an identified reference rate such as the Secured Overnight Financing Rate ("SOFR") or the federal funds rate, is spread to reflect the non-balance sheet nature of the product. Total return swaps can be designed with any underlying asset agreed upon between two parties. Typically no notional amounts are exchanged with total return swaps. Total return swap agreements entail the risk that a party will default on its payment obligations to a Fund thereunder. Swap agreements also entail the risk that a Fund will not be able to meet its obligation to the counterparty. Generally, a Fund will enter into total return swaps on a net basis (i.e., the two payment streams are netted out with the Fund receiving or paying, as the case may be, only the net amount of the two payments). The Funds will typically enter into agreements based on either long or short exposure to underlying equities. To help mitigate against default risk by the counterparties these agreements are reset monthly, with cashflows exchanged based on the change in the value of the underlying equity from either the opening price or the last reset price, netted against the interest leg of the swap.
Most swap agreements entered into by a Fund calculate the obligations of the parties to the agreement on a "net basis." Consequently, a Fund's current obligations (or rights) under a swap agreement will generally be equal only to the net present value of amounts to be paid or received
www.arbitragefunds.com | 1-800-295-4485
78
The Arbitrage Funds Notes to Financial Statements (continued)
May 31, 2022
under the agreement based on the relative values of the positions held by each party to the agreement (the "net amount"). A Fund's current obligations under a swap agreement will be accrued daily (offset against amounts owed to the Fund), and any accrued but unpaid net amounts owed to a swap counterparty will be covered in accordance with applicable regulatory requirements to limit any potential leveraging of a Fund's portfolio. Any net amount accrued but not yet paid to a Fund by the counterparty under a swap agreement (i.e., the Fund's current rights under the swap agreement) is recorded as unrealized appreciation until the amount is paid to the Fund. The Fund's maximum risk of loss from counterparty credit risk is generally limited to the net payment to be received by the Fund and/or the termination value at the end of the contract. Obligations under swap agreements so covered will not be construed to be "senior securities" for purposes of the Funds' investment restriction concerning senior securities.
Whether a Fund's use of swap agreements will be successful in furthering its investment objective will depend on management's ability to correctly predict whether certain types of investments are likely to produce greater returns than other investments. Swap agreements that cannot be terminated or sold within seven days may be considered to be illiquid investments. Moreover, a Fund bears the risk of loss of the amount expected to be received under a swap agreement in the event of the default or bankruptcy of a swap agreement counterparty. Although centrally cleared swaps typically present less counterparty risk than non-centrally cleared swaps, a Fund that has entered into centrally cleared swaps is subject to the risk of the failure of the CCP. A Fund will enter into swap agreements only with counterparties that meet certain standards for creditworthiness (generally, such counterparties would have to be eligible counterparties under the terms of the Fund's repurchase agreement guidelines) or that are centrally cleared. Certain restrictions imposed on the Funds by the Internal Revenue Code of 1986, as amended (the "Code"), may limit a Fund's ability to use swap agreements. It is possible that developments in the swap market, including additional government regulation, could adversely affect a Fund's ability to terminate existing swap agreements or to realize amounts to be received under such agreements.
International Swaps and Derivatives Association, Inc. Master Agreements ("ISDA Master Agreements") govern over-the-counter financial derivative transactions entered into by a Fund and counterparty. The ISDA Master Agreements maintain provisions for general obligations, representations, agreements, collateral and events of default or termination. Events of termination include conditions that may entitle counterparties to elect to terminate early and cause settlement of all outstanding transactions under the applicable ISDA Master Agreement. Any election to terminate early could be material to the financial statements.
Swap agreements held by the Funds at May 31, 2022 are disclosed in the Portfolio of Investments.
During the period ended May 31, 2022, the Arbitrage Fund, Event-Driven Fund and Credit Opportunities Fund entered into swap agreements to gain efficient exposure to underlying equities.
Fair Value of Derivative Instruments — Fair values of derivatives presented in the financial statements are not netted with the fair value of other derivatives or with any collateral amounts
Annual Report | May 31, 2022
79
The Arbitrage Funds Notes to Financial Statements (continued)
May 31, 2022
posted by the Funds or any counterparty on the Statement of Assets and Liabilities. The fair value of derivative instruments for the Funds as of May 31, 2022, was as follows:
|
Derivatives Not Accounted For As Hedging Instruments |
Asset Derivatives Statement of Assets and Liabilities Location |
Fair Value |
Liability Derivatives Statement of Assets and Liabilities Location |
Fair Value |
|||||||||||||||
|
Arbitrage Fund |
|||||||||||||||||||
|
Forward Foreign Currency Exchange Contracts |
Unrealized appreciation on forward foreign currency exchange contracts |
$ |
7,864,110 |
Unrealized depreciation on forward foreign currency exchange contracts |
$ |
4,486,582 |
|||||||||||||
|
Equity Contracts (swap contracts) |
Unrealized appreciation on swap contracts |
148 |
Unrealized depreciation on swap contracts |
— |
|||||||||||||||
|
Equity Contracts (purchased option contracts) |
Investments: at fair value of unaffiliated investments |
395,928 |
— |
||||||||||||||||
|
Equity Contracts (written option contracts) |
— |
Written options, at value |
39,405 |
||||||||||||||||
|
$ |
8,260,186 |
$ |
4,525,987 |
||||||||||||||||
|
Derivatives Not Accounted For As Hedging Instruments |
Asset Derivatives Statement of Assets and Liabilities Location |
Fair Value |
Liability Derivatives Statement of Assets and Liabilities Location |
Fair Value |
|||||||||||||||
|
Event-Driven Fund |
|||||||||||||||||||
|
Forward Foreign Currency Exchange Contracts |
Unrealized appreciation on forward foreign currency exchange contracts |
$ |
426,883 |
Unrealized depreciation on forward foreign currency exchange contracts |
$ |
279,235 |
|||||||||||||
|
Equity Contracts (purchased option contracts) |
Investments: at fair value of unaffiliated investments |
2,340 |
— |
||||||||||||||||
|
Equity Contracts (written option contracts) |
— |
Written options, at value |
3,330 |
||||||||||||||||
|
$ |
429,223 |
$ |
282,565 |
||||||||||||||||
www.arbitragefunds.com | 1-800-295-4485
80
The Arbitrage Funds Notes to Financial Statements (continued)
May 31, 2022
|
Derivatives Not Accounted For As Hedging Instruments |
Asset Derivatives Statement of Assets and Liabilities Location |
Fair Value |
Liability Derivatives Statement of Assets and Liabilities Location |
Fair Value |
|||||||||||||||
|
Credit Opportunities Fund |
|||||||||||||||||||
|
Forward Foreign Currency Exchange Contracts |
Unrealized appreciation on forward foreign currency exchange contracts |
$ |
2,686 |
Unrealized depreciation on forward foreign currency exchange contracts |
$ |
4,759 |
|||||||||||||
|
Equity Contracts (purchased option contracts) |
Investments: at fair value of unaffiliated investments |
149,737 |
— |
||||||||||||||||
|
Equity Contracts (written option contracts) |
— |
Written options, at value |
5,920 |
||||||||||||||||
|
$ |
152,423 |
$ |
10,679 |
||||||||||||||||
Annual Report | May 31, 2022
81
The Arbitrage Funds Notes to Financial Statements (continued)
May 31, 2022
The effect of derivative instruments on the Funds' Statement of Operations for the year ended May 31, 2022, was as follows:
|
Derivatives Not Accounted For As Hedging Instruments |
Location Of Gains/(Loss) On Derivatives Recognized In Income |
Realized Gain/(Loss) On Derivatives Recognized In Income |
Change in Unrealized Gain/(Loss) On Derivatives Recognized In Income |
||||||||||||
|
Arbitrage Fund |
|||||||||||||||
|
Forward Foreign Currency Exchange Contracts |
Net realized gains (losses) from: Forward currency contracts / Net change in unrealized appreciation (depreciation) on: Forward currency contracts |
$ |
9,860,568 |
$ |
5,524,437 |
||||||||||
|
Swap Contracts |
Net realized gains (losses) from: Swap contracts / Net change in unrealized appreciation (depreciation) on: Swap contracts |
(6,444,884 |
) |
148 |
|||||||||||
|
Equity Contracts (purchased option contracts) |
Net realized gains (losses) from: Purchased option contracts / Net change in unrealized appreciation (depreciation) on: Purchased option contracts |
(1,844,236 |
) |
1,391,682 |
|||||||||||
|
Equity Contracts (written option contracts) |
Net realized gains (losses) from: Written option contracts / Net change in unrealized appreciation (depreciation) on: Written option contracts |
2,115,078 |
10,186 |
||||||||||||
|
$ |
3,686,526 |
$ |
6,926,453 |
||||||||||||
www.arbitragefunds.com | 1-800-295-4485
82
The Arbitrage Funds Notes to Financial Statements (continued)
May 31, 2022
|
Derivatives Not Accounted For As Hedging Instruments |
Location Of Gains/(Loss) On Derivatives Recognized In Income |
Realized Gain/(Loss) On Derivatives Recognized In Income |
Change in Unrealized Gain/(Loss) On Derivatives Recognized In Income |
||||||||||||
|
Event-Driven Fund |
|||||||||||||||
|
Forward Foreign Currency Exchange Contracts |
Net realized gains (losses) from: Forward currency contracts / Net change in unrealized appreciation (depreciation) on: Forward currency contracts |
$ |
677,044 |
$ |
363,598 |
||||||||||
|
Swap Contracts |
Net realized gains (losses) from: Swap contracts / Net change in unrealized appreciation (depreciation) on: Swap contracts |
(643,295 |
) |
— |
|||||||||||
|
Equity Contracts (purchased option contracts) |
Net realized gains (losses) from: Purchased option contracts / Net change in unrealized appreciation (depreciation) on: Purchased option contracts |
(141,575 |
) |
152,193 |
|||||||||||
|
Equity Contracts (written option contracts) |
Net realized gains (losses) from: Written option contracts / Net change in unrealized appreciation (depreciation) on: Written option contracts |
227,040 |
861 |
||||||||||||
|
$ |
119,214 |
$ |
516,652 |
||||||||||||
Annual Report | May 31, 2022
83
The Arbitrage Funds Notes to Financial Statements (continued)
May 31, 2022
|
Derivatives Not Accounted For As Hedging Instruments |
Location Of Gains/(Loss) On Derivatives Recognized In Income |
Realized Gain/(Loss) On Derivatives Recognized In Income |
Change in Unrealized Gain/(Loss) On Derivatives Recognized In Income |
||||||||||||
|
Credit Opportunities Fund |
|||||||||||||||
|
Forward Foreign Currency Exchange Contracts |
Net realized gains (losses) from: Forward currency contracts / Net change in unrealized appreciation (depreciation) on: Forward currency contracts |
$ |
2,653 |
$ |
9,606 |
||||||||||
|
Swap Contracts |
Net realized gains (losses) from: Swap contracts / Net change in unrealized appreciation (depreciation) on: Swap contracts |
200,376 |
— |
||||||||||||
|
Equity Contracts (purchased option contracts) |
Net realized gains (losses) from: Purchased option contracts / Net change in unrealized appreciation (depreciation) on: Purchased option contracts |
(262,482 |
) |
53,356 |
|||||||||||
|
Equity Contracts (written option contracts) |
Net realized gains (losses) from: Written option contracts / Net change in unrealized appreciation (depreciation) on: Written option contracts |
97,867 |
83 |
||||||||||||
|
$ |
38,414 |
$ |
63,045 |
||||||||||||
Volume of derivative instruments held by the Funds during the year ended May 31, 2022, was as follows:
|
Derivative Type |
Unit of Measurement |
Monthly Average |
|||||||||
|
Arbitrage Fund |
|||||||||||
|
Swap Contracts |
Notional Quantity |
$ |
285,754,773 |
||||||||
|
Forward Foreign Currency Exchange Contracts |
Net Contracts to Deliver/(Receive) |
(147,351,041 |
) |
||||||||
|
Purchased Option Contracts |
Contracts |
11,304 |
|||||||||
|
Written Option Contracts |
Contracts |
(785 |
) |
||||||||
|
Derivative Type |
Unit of Measurement |
Monthly Average |
|||||||||
|
Event-Driven Fund |
|||||||||||
|
Swap Contracts |
Notional Quantity |
$ |
23,100,213 |
||||||||
|
Forward Foreign Currency Exchange Contracts |
Net Contracts to Deliver/(Receive) |
(9,293,011 |
) |
||||||||
|
Purchased Option Contracts |
Contracts |
941 |
|||||||||
|
Written Option Contracts |
Contracts |
(81 |
) |
||||||||
www.arbitragefunds.com | 1-800-295-4485
84
The Arbitrage Funds Notes to Financial Statements (continued)
May 31, 2022
|
Derivative Type |
Unit of Measurement |
Monthly Average |
|||||||||
|
Credit Opportunities Fund |
|||||||||||
|
Swap Contracts |
Notional Quantity |
$ |
6,647,616 |
||||||||
|
Forward Foreign Currency Exchange Contracts |
Net Contracts to Deliver/(Receive) |
(231,369 |
) |
||||||||
|
Purchased Option Contracts |
Contracts |
1,425 |
|||||||||
|
Written Option Contracts |
Contracts |
(94 |
) |
||||||||
Certain derivative contracts are executed under either standardized netting agreements or, for exchange-traded derivatives, the relevant contracts for a particular exchange which contain enforceable netting provisions. A derivative netting arrangement creates an enforceable right of set-off that becomes effective, and affects the realization of settlement on individual assets, liabilities and collateral amounts, only following a specified event of default or early termination. Default events may include the failure to make payments or deliver securities timely, material adverse changes in financial condition or insolvency, the breach of minimum regulatory capital requirements, or loss of license, charter or other legal authorization necessary to perform under the contract.
Arbitrage Fund held financial instruments such as equity swaps that are subject to enforceable netting arrangements or other similar agreements as of May 31, 2022. All other derivative contracts held by the Funds were not subject to netting agreements.
The following table presents financial instruments held by the Arbitrage Fund that are subject to enforceable netting arrangements or other similar agreements as of May 31, 2022:
Arbitrage Fund
|
Gross |
Gross Amounts Offset in |
Net Amounts Presented in |
Gross Amounts Not Offset in the Statement of Assets and Liabilities |
||||||||||||||||||||||||
|
Description |
Amounts of Recognized Assets |
the Statements of Assets and Liabilities |
the Statement of Assets and Liabilities |
Financial Instruments |
Cash Collateral Received |
Net Amount |
|||||||||||||||||||||
|
Equity Swaps |
$ |
148 |
$ |
— |
$ |
148 |
$ |
— |
$ |
— |
$ |
148 |
|||||||||||||||
|
Total |
$ |
148 |
$ |
— |
$ |
148 |
$ |
— |
$ |
— |
$ |
148 |
|||||||||||||||
Investment Income — Interest income, adjusted for amortization of premium and accretion of discount, is recorded on the accrual basis. Dividend income is recorded on the ex-dividend date, net of any non-reclaimable tax withholdings. Payment-in-kind securities have the option at each interest payment date of making interest payments in cash or additional debt securities. Any interest accrued on payment-in-kind securities is recorded as interest income on an accrual basis. Distributions from real estate investment trusts ("REITs") may be characterized as ordinary income, net capital gain, or a return of capital to the Funds. The proper characterization of REIT distributions is generally not known until after the end of each calendar year. As such, estimates are used in reporting the character of income and distributions for financial statement purposes when information is not available.
Dividends and Distributions to Shareholders — Dividends arising from net investment income and net capital gain distributions, if any, are declared and paid at least annually to shareholders of the Arbitrage Fund and Event-Driven Fund. Dividends arising from net investment income, if any, are declared daily and paid monthly, and net capital gain distributions, if any, are declared and paid at least annually to shareholders of the Credit Opportunities Fund.
Annual Report | May 31, 2022
85
The Arbitrage Funds Notes to Financial Statements (continued)
May 31, 2022
Cash — The Funds may invest a portion of their assets in cash or cash items. These cash items and other high-quality debt securities may include money market instruments, such as securities issued by the U.S. Government and its agencies, bankers' acceptances, commercial paper, bank certificates of deposit and investment companies that invest primarily in such instruments. As of May 31, 2022, cash held by the Funds represented cash held at a third-party custodian.
Allocation Between Classes — Investment income earned, realized capital gains and losses, and unrealized appreciation and depreciation are allocated daily to each class of shares based upon the proportionate shares of total net assets of each Fund. Class-specific expenses are charged directly to the class incurring the expense. Common expenses which are not attributable to a specific class are allocated daily to each class of shares based upon the proportionate share of total net assets of each Fund.
Federal Income Tax — It is the Funds' policy to continue to comply with the special provisions of Subchapter M of the Code, as amended, applicable to regulated investment companies. As provided therein, in any fiscal year in which a fund so qualifies and distributes at least 90% of its taxable net income, a fund (but not the shareholders) will be relieved of Federal income tax on the income distributed. Accordingly, no provision for income taxes has been made.
As of and during the year ended May 31, 2022, the Funds did not have a liability for any unrecognized tax benefits. The Funds recognize interest and, if applicable, penalties for any uncertain tax positions. Interest and penalty expense will be recorded as a component of interest or other tax expense. No interest or penalties were recorded during the year ended May 31, 2022. The Funds file U.S. federal, state, and local tax returns as required. The Funds' tax returns are subject to examination by the relevant tax authorities until expiration of the applicable statute of limitations which is generally three years after the filing of the tax return. Tax returns for open years have incorporated no uncertain tax positions that require a provision for income taxes.
3. INVESTMENT TRANSACTIONS
During the year ended May 31, 2022, cost of purchases and proceeds from sales and maturities of investment securities, excluding short-term investments, U.S. government securities, equity swap contracts, purchased and written option contracts and securities sold short, were as follows:
|
Arbitrage Fund |
Event-Driven Fund |
Credit Opportunities Fund |
|||||||||||||
|
Purchases |
$ |
3,469,384,382 |
$ |
269,535,172 |
$ |
220,297,556 |
|||||||||
|
Sales and Maturities |
3,065,004,462 |
273,698,215 |
183,342,789 |
||||||||||||
During the year ended May 31, 2022, cost of purchases and proceeds from sales and maturities of U.S. government securities for the Credit Opportunities Fund were as follows:
|
Credit Opportunities Fund |
|||||||
|
Purchases |
$ |
3,359,659 |
|||||
|
Sales |
— |
||||||
4. LINE OF CREDIT
The Trust, on behalf of the Funds, entered into an agreement which enables the Funds to participate in a $100,000,000 unsecured uncommitted revolving line of credit (the "Uncommitted Line") with State Street Bank and Trust Company (the "Custodian"). Borrowings under the Uncommitted Line are made solely to temporarily finance the purchase or sale of securities or to finance the redemption of the shares of an investor of the Funds. The Uncommitted Line has an upfront fee of $30,000, is held available on a discretionary demand basis and may be terminated
www.arbitragefunds.com | 1-800-295-4485
86
The Arbitrage Funds Notes to Financial Statements (continued)
May 31, 2022
by the Custodian or the Trust at any time for any or no reason. Such fees are included in the custodian bank and service fees on the Statements of Operations. Interest on the Uncommitted Line is charged to the Funds based on their borrowing at a rate equal to the higher of (a) the federal funds rate plus 1.35% and (b) the overnight bank funding rate plus 1.35%. For purposes of calculating the effective interest rate, if the federal funds rate or the overnight bank funding rate shall be less than zero, then such rate shall be deemed to be zero.
For the year ended May 31, 2022, the Arbitrage Fund, the Event-Driven Fund and the Credit Opportunities Fund had average borrowings of $8,500,000, $4,029,612 and $4,516,038, respectively, over a period of 6 days, 207 days and 106 days, respectively, at a weighted average interest rate of 1.46%, 1.58% and 1.65%, respectively. Interest expense on the line of credit for the Arbitrage Fund, the Event-Driven Fund and the Credit Opportunities Fund during the year ended May 31, 2022 is shown as line of credit interest expense on the Statements of Operations. The Arbitrage Fund had no outstanding borrowings at May 31, 2022. The Event-Driven Fund and the Credit Opportunities Fund had outstanding borrowings of $5,000,000, and $1,000,000, respectively, at May 31, 2022.
5. ADVISORY FEES, ADMINISTRATION FEES AND OTHER AGREEMENTS
Investment Advisory Agreement
The Funds' investments are managed by the Adviser according to the terms of Investment Advisory Agreements. Under each of the Investment Advisory Agreements, fees are computed and accrued daily and paid monthly. Under the Investment Advisory Agreement between the Adviser and the Arbitrage Fund, as amended and restated on October 1, 2007, the Arbitrage Fund pays the Adviser an annual fee, of 1.25% on the first $250 million, 1.20% on the next $50 million, 1.15% on the next $50 million, 1.10% on the next $75 million, 1.05% on the next $75 million, and 1.00% on its average daily net assets in excess of $500 million. Effective November 1, 2019, the Event-Driven Fund pays the Adviser an annual fee of 1.10% based on the Event-Driven Fund's average daily net assets. Effective August 6, 2018, the Credit Opportunities Fund pays the Adviser an annual fee of 0.95% on the first $250 million, 0.90% on the next $500 million, and 0.85% on its average daily net assets in excess of $750 million.
Under an Amended and Restated Expense Waiver and Reimbursement Agreement for each of Arbitrage Fund, Event-Driven Fund and Credit Opportunities Fund, the Adviser has contractually agreed to waive its advisory fee and/or reimburse the Funds' other expenses to the extent that total operating expenses (exclusive of taxes, interest, dividends on short positions, brokerage commissions, acquired fund fees and expenses and other costs incurred in connection with the purchase or sale of portfolio securities) exceed the annual rate of the Funds' average daily net assets attributable to each share class as shown in the table below. The agreement remains in effect until September 30, 2023, unless terminated earlier by the Board.
|
Arbitrage Fund |
Event-Driven Fund |
Credit Opportunities Fund |
|||||||||||||
|
Class R |
1.69 |
% |
1.69 |
% |
1.23 |
% |
|||||||||
|
Class I |
1.44 |
% |
1.44 |
% |
0.98 |
% |
|||||||||
|
Class C |
2.44 |
% |
N/A |
N/A |
|||||||||||
|
Class A |
1.69 |
% |
1.69 |
% |
1.23 |
% |
|||||||||
The Adviser agreed not to charge the Arbitrage Fund an advisory fee on the portion of its assets invested in the Event-Driven Fund. This resulted in $919,179 of advisory fees being waived during the year ended May 31, 2022.
Annual Report | May 31, 2022
87
The Arbitrage Funds Notes to Financial Statements (continued)
May 31, 2022
For the year ended May 31, 2022, the aggregate net fee paid to the Adviser as a percentage of average net assets for the Arbitrage Fund, Event-Driven Fund and Credit Opportunities Fund was 1.00%, 1.12% and 0.65%, respectively.
The Adviser can recapture, with the exception of the advisory fees waived related to Arbitrage Fund's investment in the Event-Driven Fund, any waived amount from a Fund pursuant to the Amended and Restated Expense Waiver and Reimbursement Agreements if such recapture does not cause the Fund to exceed the expense limitations in effect at the time the amounts were waived, the recapture does not cause the Fund to exceed the current expense limitation, and the recapture is done within three years after the date on which the expense was waived. During the year ended May 31, 2022, the Adviser recaptured the following fees or expenses from the Event-Driven Fund. There were no amounts recaptured during the period ended May 31, 2022, for Credit Opportunities Fund.
|
Event-Driven Fund |
Recaptured Amount |
||||||
|
Class R |
$ |
1,403 |
|||||
|
Class I |
21,411 |
||||||
|
Class A |
390 |
||||||
As of May 31, 2022, the balances of waived expenses that are eligible for potential recapture for each Fund are as follows:
|
Expiring May 31, 2023 |
Expiring May 31, 2024 |
Expiring May 31, 2025 |
Total |
||||||||||||||||
|
Event-Driven Fund |
|||||||||||||||||||
|
Class R |
$ |
72,714 |
$ |
7,526 |
$ |
— |
$ |
80,240 |
|||||||||||
|
Class I |
279,224 |
94,924 |
— |
374,148 |
|||||||||||||||
|
Class A |
2,112 |
706 |
— |
2,818 |
|||||||||||||||
|
Credit Opportunities Fund |
|||||||||||||||||||
|
Class R |
$ |
46,492 |
$ |
14,935 |
$ |
27,491 |
$ |
88,918 |
|||||||||||
|
Class I |
305,422 |
327,225 |
360,709 |
993,356 |
|||||||||||||||
|
Class A |
1,504 |
386 |
309 |
2,199 |
|||||||||||||||
Administration Agreement
State Street Bank & Trust Company serves as the Trust's administrator pursuant to an Administration Agreement with the Trust.
Distribution Agreement
ALPS Distributors, Inc. (the "Distributor") serves as the Funds' distributor. The Distributor acts as an agent for the Funds and the distributor of their shares. The Funds have adopted, with respect to their Class R, Class C shares and Class A shares, as applicable, a plan of distribution pursuant to Rule 12b-1 under the 1940 Act which permits each Fund to pay for expenses incurred in the distribution and promotion of the Funds' Class R shares, Class C shares and Class A shares and for services provided to shareholders. The Plan is a "reimbursement" plan. This means that a Fund's Class R shares, Class C shares and Class A shares only pay the 12b-1 fee to the extent that the Adviser, the Distributor or others have incurred expenses in the promotion and distribution of the shares, including but not limited to, the printing of prospectuses and reports used for sales purposes, expenses of preparation of sales literature and related expenses, advertisements, and other distribution-related expenses, as well as any distribution fees paid to securities dealers or others. Under the distribution plan, a Fund may pay compensation to any broker-dealer with whom the Distributor or the Funds has entered into a contract to distribute Class R shares, Class C shares or Class A shares, or to any other qualified financial services firm, for distribution and/or
www.arbitragefunds.com | 1-800-295-4485
88
The Arbitrage Funds Notes to Financial Statements (continued)
May 31, 2022
shareholder-related services with respect to shares held or purchased by their respective customers or in connection with the purchase of shares attributable to their efforts. The amount of payments under the Plan in any year shall not exceed 0.25% for Class R shares, 0.75% for Class C shares and 0.25% for Class A shares, respectively, of the average daily net assets allocable to a Fund's Class R shares, Class C shares and Class A shares, respectively. In addition, the Plan permits each Fund to make payments at an annual rate of up to 0.25% of the Fund's Class C shares for expenses incurred in connection with the provision of shareholder support or administrative services for the Fund's Class C shares.
During the year ended May 31, 2022, the Arbitrage Fund's Class R shares and Class A shares incurred $236,686 and $99,261 in distribution expenses, respectively, and Class C shares incurred $165,682 in distribution and shareholder support expenses, all of which were used to compensate broker-dealers. During the year ended May 31, 2022, the Event-Driven Fund's Class R shares and Class A shares incurred $19,739 and $5,224 in distribution expenses, respectively, all of which were used to compensate broker-dealers. During the year ended May 31, 2022, the Credit Opportunities Fund's Class R shares and Class A shares incurred $22,885 and $257 in distribution expenses, respectively, all of which were used to compensate broker-dealers.
Chief Compliance Officer
The Chief Compliance Officer ("CCO") of the Trust also serves as the CCO of the Adviser. The Trust pays a portion of the CCO's compensation as approved by the Board of Trustees. Information related to the CCO Fees can be found in the Funds' Statements of Operations.
Chief Financial Officer
Foreside Management Services, LLC provides Chief Financial Officer ("CFO") services to the Trust. Foreside Management Services, LLC is compensated by the Trust under a Fund CFO/Treasurer Agreement.
Transfer Agent and Shareholder Services Agreement
DST Systems, Inc. ("DST") is the Funds' transfer agent, and per an agency agreement, maintains the records of each shareholder's account, answers shareholders' inquiries concerning their accounts, processes purchases and redemptions of the Funds shares, acts as dividend and distribution disbursing agent and performs other shareholder service functions.
6. RELATED PARTIES
The Adviser is a related party of the Funds and certain officers of the Trust are also officers of the Adviser. Fees payable to related parties are disclosed in Note 5 and accrued amounts are disclosed in the Statements of Operations.
7. AFFILIATED ISSUER TRANSACTIONS
A summary of affiliated transactions for the Arbitrage Fund for the year ended May 31, 2022 follows:
|
Affiliated Issuer |
Beginning Value as of May 31, 2021 |
Purchases at Cost |
Proceeds from Sales |
Net Realized Gain/ (Loss) on Sales |
Change in Unrealized Appreciation/ Depreciation |
Ending Value as of May 31, 2022 |
Shares as of May 31, 2022 |
Dividend Income |
Capital Gain Distributions |
||||||||||||||||||||||||||||||
|
Water Island Event-Driven Fund |
$ |
75,829,593 |
$ |
— |
$ |
— |
$ |
— |
$ |
(3,434,790 |
) |
$ |
72,394,803 |
6,605,365 |
$ |
— |
$ |
— |
|||||||||||||||||||||
At May 31, 2022, Arbitrage Fund, an affiliated fund, owned 63.52% of Event-Driven Fund's shares.
Annual Report | May 31, 2022
89
The Arbitrage Funds Notes to Financial Statements (continued)
May 31, 2022
8. CAPITAL SHARE TRANSACTIONS
Proceeds and payments on capital shares as shown in the Statement of Changes in Net Assets are the result of the following capital share transactions for the periods shown:
|
Year Ended May 31, 2022 |
Year Ended May 31, 2021 |
||||||||||||||||||
|
Arbitrage Fund - Class R |
Shares |
Value |
Shares |
Value |
|||||||||||||||
|
Proceeds from shares sold |
1,682,625 |
$ |
21,585,919 |
2,414,150 |
$ |
31,424,837 |
|||||||||||||
|
Shares issued in reinvestment of distributions |
39,313 |
499,276 |
447,203 |
5,652,646 |
|||||||||||||||
|
Payments for shares redeemed |
(2,985,174 |
) |
(37,993,767 |
) |
(2,962,158 |
) |
(38,713,791 |
) |
|||||||||||
|
Net decrease |
(1,263,236 |
) |
$ |
(15,908,572 |
) |
(100,805 |
) |
$ |
(1,636,308 |
) |
|||||||||
|
Arbitrage Fund - Class I |
|||||||||||||||||||
|
Proceeds from shares sold |
33,994,762 |
$ |
451,556,693 |
40,521,797 |
$ |
546,153,766 |
|||||||||||||
|
Shares issued in reinvestment of distributions |
462,945 |
6,110,874 |
4,521,559 |
59,232,426 |
|||||||||||||||
|
Payments for shares redeemed |
(29,221,299 |
) |
(386,744,281 |
) |
(30,859,800 |
) |
(420,193,242 |
) |
|||||||||||
|
Net increase |
5,236,408 |
$ |
70,923,286 |
14,183,556 |
$ |
185,192,950 |
|||||||||||||
|
Arbitrage Fund - Class C |
|||||||||||||||||||
|
Proceeds from shares sold |
224,527 |
$ |
2,685,087 |
349,823 |
$ |
4,280,666 |
|||||||||||||
|
Shares issued in reinvestment of distributions |
6,547 |
77,389 |
81,448 |
965,971 |
|||||||||||||||
|
Payments for shares redeemed |
(546,088 |
) |
(6,468,684 |
) |
(568,832 |
) |
(7,020,954 |
) |
|||||||||||
|
Net decrease |
(315,014 |
) |
$ |
(3,706,208 |
) |
(137,561 |
) |
$ |
(1,774,317 |
) |
|||||||||
|
Arbitrage Fund - Class A |
|||||||||||||||||||
|
Proceeds from shares sold |
1,416,227 |
$ |
18,133,435 |
1,499,981 |
$ |
19,505,801 |
|||||||||||||
|
Shares issued in reinvestment of distributions |
9,966 |
126,265 |
79,963 |
1,008,335 |
|||||||||||||||
|
Payments for shares redeemed |
(561,906 |
) |
(7,150,839 |
) |
(450,557 |
) |
(5,872,949 |
) |
|||||||||||
|
Net increase |
864,287 |
$ |
11,108,861 |
1,129,387 |
$ |
14,641,187 |
|||||||||||||
|
Event-Driven Fund - Class R |
|||||||||||||||||||
|
Proceeds from shares sold |
72,562 |
$ |
802,465 |
360,644 |
$ |
3,964,990 |
|||||||||||||
|
Payments for shares redeemed |
(546,503 |
) |
(5,986,060 |
) |
(243,218 |
) |
(2,630,326 |
) |
|||||||||||
|
Net increase/(decrease) |
(473,941 |
) |
$ |
(5,183,595 |
) |
117,426 |
$ |
1,334,664 |
|||||||||||
|
Event-Driven Fund - Class I |
|||||||||||||||||||
|
Proceeds from shares sold |
1,162,749 |
$ |
13,034,737 |
2,077,590 |
$ |
23,076,347 |
|||||||||||||
|
Shares issued in reinvestment of distributions |
— |
— |
22,338 |
242,147 |
|||||||||||||||
|
Payments for shares redeemed |
(2,297,771 |
) |
(25,475,126 |
) |
(1,050,674 |
) |
(11,144,686 |
) |
|||||||||||
|
Net increase/(decrease) |
(1,135,022 |
) |
$ |
(12,440,389 |
) |
1,049,254 |
$ |
12,173,808 |
|||||||||||
www.arbitragefunds.com | 1-800-295-4485
90
The Arbitrage Funds Notes to Financial Statements (continued)
May 31, 2022
|
Year Ended May 31, 2022 |
Year Ended May 31, 2021 |
||||||||||||||||||
|
Event-Driven Fund - Class C(a) |
Shares |
Value |
Shares |
Value |
|||||||||||||||
|
Proceeds from shares sold |
— |
$ |
— |
5,355 |
$ |
57,250 |
|||||||||||||
|
Payments for shares redeemed |
— |
— |
(43,315 |
) |
(471,565 |
) |
|||||||||||||
|
Net increase/(decrease) |
— |
$ |
— |
(37,960 |
) |
$ |
(414,315 |
) |
|||||||||||
|
Event-Driven Fund - Class A |
|||||||||||||||||||
|
Proceeds from shares sold |
264,682 |
$ |
2,879,635 |
169,784 |
$ |
1,833,944 |
|||||||||||||
|
Shares issued in reinvestment of distributions |
— |
— |
139 |
1,490 |
|||||||||||||||
|
Payments for shares redeemed |
(173,800 |
) |
(1,867,351 |
) |
(82,907 |
) |
(889,387 |
) |
|||||||||||
|
Net increase |
90,882 |
$ |
1,012,284 |
87,016 |
$ |
946,047 |
|||||||||||||
(a) Effective April 27, 2021, Class C shares of the Event-Driven Fund were converted to Class I shares of the Fund, and Class C was abolished.
|
Year Ended May 31, 2022 |
Year Ended May 31, 2021 |
||||||||||||||||||
|
Credit Opportunities Fund - Class R |
Shares |
Value |
Shares |
Value |
|||||||||||||||
|
Proceeds from shares sold |
389,395 |
$ |
3,924,678 |
608,398 |
$ |
6,154,299 |
|||||||||||||
|
Shares issued in reinvestment of distributions |
23,145 |
232,547 |
6,834 |
68,562 |
|||||||||||||||
|
Payments for shares redeemed |
(223,471 |
) |
(2,237,808 |
) |
(252,856 |
) |
(2,494,718 |
) |
|||||||||||
|
Net increase |
189,069 |
$ |
1,919,417 |
362,376 |
$ |
3,728,143 |
|||||||||||||
|
Credit Opportunities Fund - Class I |
|||||||||||||||||||
|
Proceeds from shares sold |
5,052,483 |
$ |
50,828,009 |
5,413,326 |
$ |
54,158,839 |
|||||||||||||
|
Shares issued in reinvestment of distributions |
288,204 |
2,885,616 |
187,212 |
1,864,921 |
|||||||||||||||
|
Payments for shares redeemed |
(2,127,208 |
) |
(21,106,410 |
) |
(1,760,287 |
) |
(17,509,853 |
) |
|||||||||||
|
Net increase |
3,213,479 |
$ |
32,607,215 |
3,840,251 |
$ |
38,513,907 |
|||||||||||||
|
Credit Opportunities Fund - Class C(a) |
|||||||||||||||||||
|
Shares issued in reinvestment of distributions |
— |
— |
1,055 |
10,467 |
|||||||||||||||
|
Payments for shares redeemed |
— |
— |
(69,621 |
) |
(705,444 |
) |
|||||||||||||
|
Net increase/(decrease) |
— |
$ |
— |
(68,566 |
) |
$ |
(694,977 |
) |
|||||||||||
|
Credit Opportunities Fund - Class A |
|||||||||||||||||||
|
Proceeds from shares sold |
957 |
$ |
9,675 |
1,919 |
$ |
19,348 |
|||||||||||||
|
Shares issued in reinvestment of distributions |
262 |
2,624 |
207 |
2,060 |
|||||||||||||||
|
Payments for shares redeemed |
— |
— |
(1,648 |
) |
(16,282 |
) |
|||||||||||||
|
Net increase |
1,219 |
$ |
12,299 |
478 |
$ |
5,126 |
|||||||||||||
(a) Effective April 27, 2021, Class C shares of the Credit Opportunities Fund were converted to Class I shares of the Fund, and Class C was abolished.
Annual Report | May 31, 2022
91
The Arbitrage Funds Notes to Financial Statements (continued)
May 31, 2022
9. FOREIGN CURRENCY TRANSLATION
Amounts denominated in or expected to settle in foreign currencies are translated to U.S. dollars based on exchange rates on the basis outlined below:
A. The market values of investment securities and other assets and liabilities are translated at the closing rate of exchange each day.
B. Purchases and sales of investment securities and income and expenses are translated at the rate of exchange prevailing on the respective dates of such transactions.
C. The Funds do not isolate that portion of the results of operations caused by changes in foreign exchange rates on investments from those caused by changes in market prices of securities held. Such fluctuations are included with the net realized and unrealized gains or losses on investments. Reported net realized foreign exchange gains or losses arise from 1) purchases and sales of foreign currencies; 2) currency gains or losses realized between the trade and settlement dates on security transactions; and 3) the difference between the amounts of dividends, interest and foreign withholding taxes recorded on the Funds' books, and the U.S. dollar equivalent of the amounts actually received or paid. Reported net unrealized foreign exchange gains and losses arise from changes in the value of assets and liabilities, other than investment securities, resulting from changes in exchange rates.
10. CONTINGENCIES AND COMMITMENTS
The Funds indemnify the Trust's officers and trustees for certain liabilities that might arise from their performance of their duties to the Funds. Additionally, in the normal course of business, the Funds enter into contracts that contain a variety of representations and warranties and which provide general indemnifications. The Funds' maximum exposure under these arrangements is unknown, as this would involve future claims that may be made against the Funds that have not yet occurred. However, based on experience, the Funds expect the risk of loss to be remote.
11. SECURITIES LENDING
To generate additional income, the Funds may, from time to time, lend portfolio securities to broker-dealers, banks or institutional borrowers of securities. At the time of the loan, the Funds must receive from the borrower 102% collateral in the form of cash or U.S. government securities. This collateral must be valued daily and, should the market value of the loaned securities increase, the borrower must furnish additional collateral to the Funds. During the time portfolio securities are on loan, the borrower pays the Funds any dividends or interest paid on such securities.
Loans are subject to termination by the Funds or the borrower at any time. While the Funds do not have the right to vote securities on loan, they have the right to terminate the loan and regain the right to vote if that is considered important with respect to the investment. In the event the borrower defaults in its obligation to the Fund, the Funds bear the risk of delay in the recovery of portfolio securities and the risk of loss of rights in the collateral.
The Funds may participate in a securities lending program under which the Funds' custodian, State Street Bank and Trust Company (the "Custodian") acting as securities lending agent, is authorized to lend Fund portfolio securities to qualified brokers/dealers and financial institutions that post appropriate collateral. The value of securities loaned will not exceed one-third of the value of the total assets of the Fund making the loan. The Custodian has agreed to indemnify the Fund in case of default of any security borrower.
www.arbitragefunds.com | 1-800-295-4485
92
The Arbitrage Funds Notes to Financial Statements (continued)
May 31, 2022
Securities on loan are fully collateralized and the collateral was equal to or exceeded the securities on loan. Cash collateral is invested in the State Street Institutional U.S. Government Money Market Fund, Premier Class. The Custodian receives a portion of the interest earned on any reinvested collateral. Income received by the Funds in securities lending transactions during the year ended May 31, 2022, if any, is net of fees retained by the securities lending agent and is reflected as securities lending income in the Statement of Operations. There were no securities on loan at May 31, 2022.
12. FEDERAL TAX INFORMATION
In order to avoid imposition of the excise tax applicable to regulated investment companies, it is each Fund's intention to declare as dividends in each calendar year at least 98.0% of its net investment income (earned during the calendar year) and 98.2% of its net realized capital gains (earned during the twelve months ended October 31), plus undistributed amounts from prior years.
The amount of distributions from net investment income and net realized gains, if any, are determined in accordance with Federal income tax regulations which may differ from accounting principles generally accepted in the United States of America. These "book/tax" differences are either temporary or permanent in nature and permanent differences are charged or credited to undistributed net investment income (loss), accumulated net realized gain (loss) or paid-in capital as appropriate in the period that the differences arise.
Permanent differences between the Funds' financial statement and income tax reporting requirements are primarily attributable to gains and losses on certain foreign currency related transactions, short sale related dividend expense, investments in passive foreign investment companies, investments in swaps, premium amortization, net operating losses, ordinary loss netting to reduce short-term capital gains, convertible bonds, non-deductible excise tax activity and partnership basis adjustments. These have no effect on the Funds' net assets or net asset value per share.
|
Fund |
Distributable Earnings (Accumulated Loss) |
Paid-in Capital |
|||||||||
|
Arbitrage Fund |
$ |
1,019 |
$ |
(1,019 |
) |
||||||
|
Event-Driven Fund |
3,402,433 |
(3,402,433 |
) |
||||||||
|
Credit Opportunities Fund |
— |
— |
|||||||||
The tax character of dividends and distributions declared and paid during the years ended May 31, 2022 and May 31, 2021 was as follows:
|
Fund |
Year Ended |
Ordinary Income |
Long-Term Capital Gains* |
Total Distributions |
|||||||||||||||
|
Arbitrage Fund |
5/31/2022 |
$ |
— |
$ |
8,434,675 |
$ |
8,434,675 |
||||||||||||
|
5/31/2021 |
85,958,483 |
239 |
85,958,722 |
||||||||||||||||
|
Event-Driven Fund |
5/31/2022 |
$ |
— |
$ |
— |
$ |
— |
||||||||||||
|
5/31/2021 |
252,179 |
— |
252,179 |
||||||||||||||||
|
Credit Opportunities Fund |
5/31/2022 |
$ |
3,596,180 |
$ |
— |
$ |
3,596,180 |
||||||||||||
|
5/31/2021 |
1,949,287 |
— |
1,949,287 |
||||||||||||||||
* The Funds designate these distributions as long-term capital gains dividends per IRC code section 852(b)(3)(C).
Annual Report | May 31, 2022
93
The Arbitrage Funds Notes to Financial Statements (continued)
May 31, 2022
As of May 31, 2022, the components of distributable earnings on a tax basis were as follows:
|
Arbitrage Fund |
Event-Driven Fund |
Credit Opportunities Fund |
|||||||||||||
|
Undistributed ordinary income |
$ |
700,765 |
$ |
— |
$ |
442,320 |
|||||||||
|
Accumulated capital gains/losses |
35,442,941 |
— |
— |
||||||||||||
|
Unrealized appreciation/(depreciation) |
(33,073,239 |
) |
(3,019,349 |
) |
(5,214,185 |
) |
|||||||||
|
Capital loss carryover and late year ordinary loss deferrals |
— |
(37,935,362 |
) |
(976,715 |
) |
||||||||||
|
Total distributable earnings (accumulated loss) |
$ |
3,070,467 |
$ |
(40,954,711 |
) |
$ |
(5,748,580 |
) |
|||||||
As of May 31, 2022, the cost and aggregate gross unrealized appreciation/(depreciation) of long security positions, short security positions and derivative instruments for federal income tax purposes were as follows:
|
Fund |
Gross Appreciation (excess of value over tax cost) |
Gross Depreciation (excess of tax cost over value) |
Net Unrealized Appreciation |
Aggregate Cost of Investments for Income Tax Purposes |
|||||||||||||||
|
Arbitrage Fund |
$ |
32,746,647 |
$ |
(69,051,885 |
) |
$ |
(36,305,238 |
) |
$ |
1,587,119,578 |
|||||||||
|
Event-Driven Fund |
1,945,681 |
(5,192,469 |
) |
(3,246,788 |
) |
117,480,119 |
|||||||||||||
|
Credit Opportunities Fund |
3,166,535 |
(11,147,972 |
) |
(7,981,437 |
) |
135,544,713 |
|||||||||||||
The differences between book-basis and tax-basis net unrealized appreciation/(depreciation) for the Funds are attributable to dividends related to short securities, swap mark to market, wash sales, convertible bonds, straddle loss deferrals, premium amortization, constructive gains and constructive sales adjustments, partnership basis adjustments and forward contracts mark to market.
Capital Losses
As of May 31, 2022, the Event-Driven Fund had $31,626,473 of short term and $5,295,181 of long term capital loss carryforwards and the Credit Opportunities Fund had $976,715 of short term capital loss carryforwards which may reduce the Funds' taxable income arising from future net realized gains on investments, if any, to the extent permitted by the Code and thus may reduce the amount of the distributions to shareholders which would otherwise be necessary to relieve the Funds of any liability for federal tax.
The Event-Driven Fund utilized $2,713,682 of capital loss carryforwards during the year ended May 31, 2022.
Late Year Losses
The Event-Driven Fund elected to defer to the period ending May 31, 2022 losses in the amount of $1,013,708.
13. SUBSEQUENT EVENTS
Management has evaluated subsequent events for the Funds through the date the financial statements were issued, and has concluded that there are no recognized or non-recognized subsequent events relevant for financial statement disclosure.
www.arbitragefunds.com | 1-800-295-4485
94
Report of Independent Registered Public Accounting Firm
To the Shareholders and the Board of
Trustees of The Arbitrage Funds
Opinion on the Financial Statements
We have audited the accompanying statements of assets and liabilities of The Arbitrage Funds (the Trust) (comprising Arbitrage Fund, Water Island Event-Driven Fund, and Water Island Credit Opportunities Fund, (collectively referred to as the "Funds")), including the schedules of investments, as of May 31, 2022, and the related statements of operations for the year then ended, the statements of changes in net assets for each of the two years in the period then ended, the financial highlights for each of the five years in the period then ended and the related notes (collectively referred to as the "financial statements"). In our opinion, the financial statements present fairly, in all material respects, the financial position of each of the Funds comprising the Trust at May 31, 2022, the results of their operations for the year then ended, changes in their net assets for each of the two years in the period then ended and their financial highlights for each of the five years in the period then ended, in conformity with U.S. generally accepted accounting principles.
Basis for Opinion
These financial statements are the responsibility of the Trust's management. Our responsibility is to express an opinion on each of the Funds' financial statements based on our audits. We are a public accounting firm registered with the Public Company Accounting Oversight Board (United States) ("PCAOB") and are required to be independent with respect to the Trust in accordance with the U.S. federal securities laws and the applicable rules and regulations of the Securities and Exchange Commission and the PCAOB.
We conducted our audits in accordance with the standards of the PCAOB. Those standards require that we plan and perform the audit to obtain reasonable assurance about whether the financial statements are free of material misstatement, whether due to error or fraud. The Trust is not required to have, nor were we engaged to perform, an audit of the Trust's internal control over financial reporting. As part of our audits, we are required to obtain an understanding of internal control over financial reporting, but not for the purpose of expressing an opinion on the effectiveness of the Trust's internal control over financial reporting. Accordingly, we express no such opinion.
Our audits included performing procedures to assess the risks of material misstatement of the financial statements, whether due to error or fraud, and performing procedures that respond to those risks. Such procedures included examining, on a test basis, evidence regarding the amounts and disclosures in the financial statements. Our procedures included confirmation of securities owned as of May 31, 2022, by correspondence with the custodians, agent banks, and brokers or by other appropriate auditing procedures where replies from agent banks and brokers were not received. Our audits also included evaluating the accounting principles used and significant estimates made by management, as well as evaluating the overall presentation of the financial statements. We believe that our audits provide a reasonable basis for our opinion.

We have served as the auditor of one or more of the Water Island Capital investment companies since 2012.
Minneapolis, Minnesota
July 29, 2022
Annual Report | May 31, 2022
95
The Arbitrage Funds Disclosure of Fund Expenses
May 31, 2022 (Unaudited)
As a shareholder of a mutual fund you incur two types of costs: transaction costs, including sales charges (loads) on some share classes, and operating expenses. Your investment is affected by these ongoing costs, which include (among others) costs for portfolio management, administrative services, distribution (12b-1) expenses, redemption fees and shareholder reports like this one. It is important for you to understand the impact of these costs on your investment returns.
Operating expenses such as these are deducted from a mutual fund's gross income and directly reduce its final investment return. These expenses are expressed as a percentage of a mutual fund's average net assets; this percentage is known as a mutual fund's expense ratio.
The following examples use the expense ratio and are intended to help you understand the ongoing costs (in dollars) of investing in your Fund and to compare these costs with those of other mutual funds. The examples are based on an investment of $1,000 made at the beginning of the period shown and held for the entire period.
The table on the following page illustrates your Fund's cost in two ways:
Actual Fund Return. The section helps you to estimate the actual expenses after fee waivers that your Fund incurred over the period. The "Expenses Paid During Period" column shows the actual dollar expense cost incurred by a $1,000 investment in the Fund, and the "Ending Account Value" number is derived from deducting that expense cost from the Fund's gross investment return.
You can use this information, together with the actual amount you invested in the Fund, to estimate the expenses you paid over that period. Simply divide your actual account value by $1,000 to arrive at a ratio (for example, an $8,600 account value divided by $1,000 = 8.6), then multiply that ratio by the number shown for your Fund under "Expenses Paid During Period."
Hypothetical 5% Return. This section helps you compare your Fund's costs with those of other mutual funds. It assumes that the Fund had an annual 5% return before expenses during the period, but that expense ratio (Column 3) for the period is unchanged. This example is useful in making comparisons because the Securities and Exchange Commission requires all mutual funds to make this 5% calculation. You can assess your Fund's comparative cost by comparing the hypothetical result for your Fund in the "Expenses Paid During Period" column with those that appear in the same charts in the shareholder reports for other mutual funds.
Note: Because the return is set at 5% for comparison purposes — NOT your Fund's actual return — the account values shown may not apply to your specific investment.
www.arbitragefunds.com | 1-800-295-4485
96
The Arbitrage Funds Disclosure of Fund Expenses (continued)
May 31, 2022 (Unaudited)
|
Beginning Account Value 12/01/2021 |
Ending Account Value 05/31/2022 |
Expense Ratio(a) |
Expenses Paid During Period(b) |
||||||||||||||||
|
Arbitrage Fund |
|||||||||||||||||||
|
Class R |
|||||||||||||||||||
|
Actual |
$ |
1,000.00 |
$ |
1,000.00 |
1.47 |
% |
$ |
7.33 |
|||||||||||
|
Hypothetical (5% return before expenses) |
$ |
1,000.00 |
$ |
1,017.60 |
1.47 |
% |
$ |
7.39 |
|||||||||||
|
Class I |
|||||||||||||||||||
|
Actual |
$ |
1,000.00 |
$ |
990.70 |
1.23 |
% |
$ |
6.10 |
|||||||||||
|
Hypothetical (5% return before expenses) |
$ |
1,000.00 |
$ |
1,018.80 |
1.23 |
% |
$ |
6.19 |
|||||||||||
|
Class C |
|||||||||||||||||||
|
Actual |
$ |
1,000.00 |
$ |
1,000.00 |
2.19 |
% |
$ |
10.92 |
|||||||||||
|
Hypothetical (5% return before expenses) |
$ |
1,000.00 |
$ |
1,014.01 |
2.19 |
% |
$ |
11.00 |
|||||||||||
|
Class A |
|||||||||||||||||||
|
Actual |
$ |
1,000.00 |
$ |
990.40 |
1.44 |
% |
$ |
7.15 |
|||||||||||
|
Hypothetical (5% return before expenses) |
$ |
1,000.00 |
$ |
1,017.75 |
1.44 |
% |
$ |
7.24 |
|||||||||||
(a) Annualized, based on the Fund's most recent fiscal half-year expenses.
(b) Expenses, are equal to the Fund's annualized ratio multiplied by the average account value over the period, multiplied by the number of days in the most recent fiscal half year (182), divided by 365.
|
Beginning Account Value 12/01/2021 |
Ending Account Value 05/31/2022 |
Expense Ratio(a) |
Expenses Paid During Period(b) |
||||||||||||||||
|
Water Island Event-Driven Fund |
|||||||||||||||||||
|
Class R |
|||||||||||||||||||
|
Actual |
$ |
1,000.00 |
$ |
992.70 |
1.79 |
% |
$ |
8.89 |
|||||||||||
|
Hypothetical (5% return before expenses) |
$ |
1,000.00 |
$ |
1,016.01 |
1.79 |
% |
$ |
9.00 |
|||||||||||
|
Class I |
|||||||||||||||||||
|
Actual |
$ |
1,000.00 |
$ |
994.60 |
1.54 |
% |
$ |
7.66 |
|||||||||||
|
Hypothetical (5% return before expenses) |
$ |
1,000.00 |
$ |
1,017.25 |
1.54 |
% |
$ |
7.75 |
|||||||||||
|
Class A |
|||||||||||||||||||
|
Actual |
$ |
1,000.00 |
$ |
993.60 |
1.80 |
% |
$ |
8.95 |
|||||||||||
|
Hypothetical (5% return before expenses) |
$ |
1,000.00 |
$ |
1,015.96 |
1.80 |
% |
$ |
9.05 |
|||||||||||
(a) Annualized, based on the Fund's most recent fiscal half-year expenses.
(b) Expenses, are equal to the Fund's annualized ratio multiplied by the average account value over the period, multiplied by the number of days in the most recent fiscal half year (182), divided by 365.
Annual Report | May 31, 2022
97
The Arbitrage Funds Disclosure of Fund Expenses (continued)
May 31, 2022 (Unaudited)
|
Beginning Account Value 12/01/2021 |
Ending Account Value 05/31/2022 |
Expense Ratio(a) |
Expenses Paid During Period(b) |
||||||||||||||||
|
Water Island Credit Opportunities Fund |
|||||||||||||||||||
|
Class R |
|||||||||||||||||||
|
Actual |
$ |
1,000.00 |
$ |
974.10 |
1.34 |
% |
$ |
6.60 |
|||||||||||
|
Hypothetical (5% return before expenses) |
$ |
1,000.00 |
$ |
1,018.25 |
1.34 |
% |
$ |
6.74 |
|||||||||||
|
Class I |
|||||||||||||||||||
|
Actual |
$ |
1,000.00 |
$ |
976.20 |
1.09 |
% |
$ |
5.37 |
|||||||||||
|
Hypothetical (5% return before expenses) |
$ |
1,000.00 |
$ |
1,019.50 |
1.09 |
% |
$ |
5.49 |
|||||||||||
|
Class A |
|||||||||||||||||||
|
Actual |
$ |
1,000.00 |
$ |
974.00 |
1.27 |
% |
$ |
6.25 |
|||||||||||
|
Hypothetical (5% return before expenses) |
$ |
1,000.00 |
$ |
1,018.60 |
1.27 |
% |
$ |
6.39 |
|||||||||||
(a) Annualized, based on the Fund's most recent fiscal half-year expenses.
(b) Expenses, are equal to the Fund's annualized ratio multiplied by the average account value over the period, multiplied by the number of days in the most recent fiscal half year (182), divided by 365.
www.arbitragefunds.com | 1-800-295-4485
98
The Arbitrage Funds Additional Information
May 31, 2022 (Unaudited)
1. PROXY VOTING POLICIES AND VOTING RECORD
A description of the policies and procedures that the Funds use to determine how to vote proxies relating to portfolio securities is available without charge, upon request, by calling 1-800-295-4485 or on the Securities and Exchange Commission's ("SEC") website at http://www.sec.gov.
Information regarding how the Funds voted proxies relating to portfolio securities during the most recent 12-month period ended June 30 is available without charge upon request by calling 1-800-295-4485 or on the SEC 's website at http://www.sec.gov.
2. QUARTERLY PORTFOLIO HOLDINGS
The Funds file a complete listing of their portfolio holdings with the SEC as of the first and third quarters of each fiscal year on Form N-PORT. The filings are available on the Funds' website at www.arbitragefunds.com/resources or upon request by calling 1-800-295-4485. Furthermore, you may obtain a copy of the filing on the SEC's website at http://www.sec.gov.
Annual Report | May 31, 2022
99
The Arbitrage Funds Approval of Investment Advisory Agreements
May 31, 2022 (Unaudited)
As required under the Investment Company Act of 1940 (the "1940 Act"), the Board of Trustees (the "Board") of The Arbitrage Funds (the "Trust"), which is comprised of Arbitrage Fund, Water Island Event-Driven Fund and Water Island Credit Opportunities Fund (each, a "Fund" and, collectively, the "Funds"), determines annually whether to continue each Fund's investment advisory agreement with Water Island Capital, LLC, the investment adviser to each Fund (the "Adviser"). In considering the renewal of the agreements, the Board, including a majority of those Trustees who are not "interested persons" of the Funds (the "Independent Trustees"), as defined in the 1940 Act, met with representatives of the Adviser on May 17, 2022 and on May 24, 2022 (the "Meetings") and in separate executive sessions in advance of and at the May 24, 2022 meeting and approved the continuation of the agreements after concluding that the continuation of the agreements was in the best interests of each Fund and its shareholders.
The Board requested and received materials relating to the agreements in advance of the Meetings. Among other things, the Board considered expense and performance comparisons with other mutual funds in each Fund's peer group as determined by Broadridge Financial Solutions Inc. ("Broadridge"), an independent provider of mutual fund industry data, as well as additional substantial material prepared by the Funds' management. The additional material prepared by management generally included Fund-by-Fund information including each Fund's average net assets; management fees; expense limitation arrangements; investment performance and risk metrics (in addition to the performance information prepared by Broadridge); information about services provided by the Adviser and profitability information. The Board also considered that it had reviewed the Funds' performance against other comparable mutual funds as provided by the Adviser at the Meetings and at the Board's other meetings throughout the year, in addition to other information requested by the Independent Trustees and provided by the Adviser and other service providers at the Meetings and throughout the year. The Trustees were also continually aware of information provided by the Adviser and other service providers in response to the Board's requests, including from previous contract renewal periods, as well as certain information available to the Trustees from various other sources such as the Investment Company Institute, the Independent Directors Council and the Mutual Fund Directors Forum, among others.
In evaluating the agreements, the Board, including the Independent Trustees advised by independent legal counsel, considered the factors it deemed relevant, including the nature, quality and extent of services provided, the performance of each Fund, the profitability of the Adviser, expenses and fees, the potential for economies of scale that may be shared with each Fund and its shareholders as each Fund's assets grow, and any other benefits derived by the Adviser from its relationship with the Funds. In their deliberations, the Trustees did not identify any single factor which alone was responsible for the Board's decision to approve the agreement with respect to each Fund, and each Trustee may have given different weights to different factors and, thus, each Trustee may have had a different basis for his or her decision. In connection with its deliberations, the Board considered information provided by the Adviser throughout the year at regular Board meetings and between Board meetings, presentations from portfolio managers and other information, as well as information furnished at or in advance of the meeting held on May 24, 2022.
Nature, Extent and Quality of the Services under the Advisory Agreements
Based on the written and oral reports received by the Board prior to and at the May 24, 2022 meeting, including in executive session, the Board considered the nature, quality, and extent of the services provided to each Fund by the Adviser under the advisory agreement for such Fund. The Board also noted information received at regular meetings and at other times throughout the year related to the services rendered by the Adviser. The Board reviewed information regarding the overall organization and business functions of the Adviser and considered the background and experience
www.arbitragefunds.com | 1-800-295-4485
100
The Arbitrage Funds Approval of Investment Advisory Agreements (continued)
May 31, 2022 (Unaudited)
of the Adviser's senior management. The Board also reviewed the qualifications, backgrounds and responsibilities of the portfolio managers primarily responsible for the day-to-day portfolio management of the Funds and the extent of the resources devoted to research and analysis of actual and potential investments. The Board considered that the Adviser provides a number of additional services, including oversight of Fund service providers, duties with respect to the Fund's valuations, and operation of the Fund's compliance program. The Board considered the steps that the Adviser had taken during the past year to improve performance, including, without limitation, hiring and changes in personnel, enhancements in technology, and the Adviser's focus on evaluating risk and performance for the Funds. The Board also received and considered available information about the nature, extent and quality of services and fee rates offered to other clients of the Adviser for advisory services. The Trustees and the Adviser discussed the differences between an adviser's duties and its risks incurred in offering a sponsored mutual fund versus the more limited duties and risks involved in acting as a subadviser to a mutual fund, and also in comparing a sponsor adviser's duties and risks incurred in offering a sponsored mutual fund versus the much more limited duties and risks incurred managing an institutional separate account. The Board also considered that the Adviser assumes significant entrepreneurial risk in sponsoring new funds and that the Adviser also bears and assumes significant ongoing risks, including investment, operational, enterprise, litigation, regulatory and compliance risks, with respect to all the Funds.
Adviser Profitability
The Board was provided with information on the Adviser's profitability in serving as the investment adviser to each Fund. The Board recognized that it is difficult to make comparisons of profitability from fund management contracts because comparative information is not generally publicly available and is affected by numerous factors, including the structure of the particular adviser, the types of funds it manages, its business mix, numerous assumptions regarding allocations of expenses and the adviser's capital structure and cost of capital. Taking these factors into account, the Board concluded that the Adviser's profitability in relation to the services rendered was reasonable and that it was believed to be sufficient to continue to support investments to enhance services to the Funds and their shareholders.
Economies of Scale
The Board considered information regarding potential economies of scale with respect to the management of each Fund, whether the Fund has appropriately benefited from any economies of scale, and whether there is potential for realization of any further economies of scale. With respect to Arbitrage Fund, the Board noted that the management fee schedule for the Fund includes breakpoints, which have the effect of decreasing the fee rate as assets increase, and that at its current level of assets the Fund's effective fee rate reflected those rate reductions. The Board noted that the advisory fee schedule for Water Island Event-Driven Fund does not contain breakpoints that would reduce the fee rate on assets above specified levels. The Board noted that the advisory fee for the Water Island Event-Driven Fund had been reduced effective November 1, 2019. The Board determined that, while fee breakpoints were not currently necessary for the Water Island Event-Driven Fund given the Fund's relatively smaller size, it would continue to review whether breakpoints should be incorporated as part of the fee structure. With respect to Water Island Credit Opportunities Fund, the Board noted that the Fund's management fee schedule includes breakpoints and that amendments to the management fee schedule in 2018 had lowered the Fund's management fee. The Independent Trustees also recognized that potential economies of scale may be shared acceptably with a Fund in many different manners such as fee breakpoints, fee waivers or caps, reinvestments in the Adviser's business above contractual levels, additional new product offerings, and pricing to scale from inception, among others. The Trustees noted that each Fund is party to an
Annual Report | May 31, 2022
101
The Arbitrage Funds Approval of Investment Advisory Agreements (continued)
May 31, 2022 (Unaudited)
expense limitation agreement with the Adviser, pursuant to which the Adviser has agreed to waive or reimburse expenses should they exceed certain contractually specified levels. The Independent Trustees recognized that is it extremely difficult to determine whether potential economies of scale in fact exist for any fund, or for a fund complex, and, or, at what point any potential economies of scale may begin to be reduced at some asset level, or possibly reverse and become diseconomies of scale. Thus, the Trustees were aware that they needed to use their business judgment and experience in evaluating whether any potential economies of scale might be equitably shared with the Funds.
Other Benefits to the Adviser
The Board considered other benefits received by the Adviser as a result of its relationship with the Funds. The Board concluded that the potential benefits to be derived by the Adviser included the ability to use soft dollar credits as well as the potential benefits consistent with those generally resulting from an increase in assets under management, specifically, potential access to additional research resources and benefits to its reputation. The Board concluded that the benefits derived by the Adviser were consistent with the types of benefits generally derived by investment advisers to mutual funds. The Board considered the standards applied in seeking best execution and reviewed the Adviser's method for and policies with respect to allocating portfolio investment opportunities among its advisory clients, including the Funds. The Independent Trustees considered these and any other potential fall-out benefits and generally determined these to be not material to the consideration of the management and other fees and to the Adviser's profitability generally.
Other Factors and Broader Review
As discussed above, the Board considered detailed materials received from the Adviser as part of the annual review and at quarterly meetings throughout the year and over previous years. The Board also reviews and assesses the quality of the services that the Funds receive throughout the year. In this regard, the Board reviews reports of the Adviser at least quarterly, which include, among other things, detailed portfolio and market reviews, detailed Fund performance reports and compliance reports along with various reports and information evaluating the Adviser's supervisory oversight of third-party service providers to the Funds.
Investment Advisory Fee Rates and Expenses and Performance
The Board reviewed and considered the contractual advisory fee rates for each Fund in light of the nature, extent and quality of the advisory services provided by the Adviser. The Board also reviewed and considered the expense limitation agreements currently in place for each Fund. The Board received and considered information on the contractual advisory fee and gross and net total operating expense ratios for each Fund in comparison to those of a group of funds within the Fund's Morningstar category selected independently by Broadridge (the "Peer Group") as well as to funds in the same Morningstar category (the "Category"). For each Fund, the Board considered information provided by Broadridge on the Fund's contractual advisory fee in comparison with the contractual advisory fee that would have been charged by other funds within a Peer Group and Category assuming the other funds were similar in size to the Fund. The contractual advisory fee analysis does not take into account any fee waivers or expense reimbursements. The comparisons placed each Fund in various quartiles, with the first quartile being the lowest cost mutual funds. The Broadridge expense data was based upon historical information taken from each Fund's audited annual report for the period ended May 31, 2021. Broadridge provided expense data for Class I shares of each Fund.
The performance of each Fund for the periods ended March 31, 2022, was compared to the performance of the funds within the same Morningstar Category, regardless of asset size or primary channel of distribution ("Performance Category"). The comparisons placed each Fund in various quartiles, with the first quartile being the best performing funds. The Board also received and
www.arbitragefunds.com | 1-800-295-4485
102
The Arbitrage Funds Approval of Investment Advisory Agreements (continued)
May 31, 2022 (Unaudited)
considered additional information provided by the Adviser on comparisons of the performance of each Fund to its prospectus benchmark and to additional securities indices that the Adviser deemed relevant to the Board's considerations. The Independent Trustees also reviewed performance in relation to certain measures of the degree of investment risk undertaken by the portfolio managers. The Independent Trustees also noted that they regularly engage in discussions with the Adviser and counsel with regard to the portfolio benchmark comparisons for each Fund.
In evaluating the Funds' performance, the Board generally considered long-term performance to be more important than short-term performance and also took into account factors including general market conditions; the "style" in which the Funds are managed, as applicable, and whether that style is in or out of favor in the market; the relative sizes of the Funds; and fund cash flows. In this regard, the Board also noted how changes in time periods for performance calculations (for example, whether a one-year period is from December to December or March to March) can significantly impact a Fund's returns and peer ranking on a relative basis. The Board also considered that variations in performance among a Fund's operating classes reflect variations in class expenses, which result in lower performance for higher expense classes.
The Board received a description of Broadridge's methodology for determining peer groups, and factored into its evaluation of each Fund's performance, fees and expenses the limitations inherent in the methodology for constructing peer groups and determining, from year to year, which mutual funds should be included in which peer groups, among other things. The Board recognized these inherent limitations and, taking into account commentary and information from management, also recognized that comparisons between a Fund and other mutual funds in a peer category may not be as relevant in certain circumstances, given that in some cases a Fund may notably differ (for example, in its management techniques or relative size) when compared to other mutual funds in the peer group. The Board also noted that the number of mutual funds included in a peer group may be relatively small and constituent mutual funds included in a peer group may differ from year to year, which, among other factors, can limit the relevance of the comparisons. While recognizing these inherent limitations, the Board believed the analysis conducted by Broadridge provided a useful measure of comparative performance.
Arbitrage Fund
The Fund's performance (Class I Shares, net of fees) was compared to that of funds comprising the Morningstar Event Driven Category. The Fund's net total return ranked in the fourth quartile of the Performance Category for the one-year period, the third quartile for the three- and five-year periods and the fourth quartile for the ten-year period. The Fund's performance was also compared to its prospectus benchmark index, the ICE BofA U.S. 3-Month Treasury Bill Index. The Fund outperformed its benchmark for the three-, five- and ten-year periods and since inception. The Fund's contractual advisory fee was in the second quartile of its Category and Peer Group, and the Fund's net total operating expense ratio (i.e., the Fund's total operating expenses, net of waivers/reimbursements) was in the second quartile for the Category and the Peer Group. It was noted that the Adviser had entered into an expense waiver and reimbursement agreement to limit fees through September 30, 2023, although the Fund's expenses did not currently reach a level to require the Adviser to waive fees or reimburse expenses.
The Board determined that, given all of the factors provided, it would be in the best interests of the Fund and its shareholders to continue the advisory agreement. The Fund's fee structure was considered reasonable.
Annual Report | May 31, 2022
103
The Arbitrage Funds Approval of Investment Advisory Agreements (continued)
May 31, 2022 (Unaudited)
Water Island Event-Driven Fund
The Fund's performance (Class I Shares, net of fees) was compared to that of funds comprising the Morningstar Event Driven Category. The Fund's net total return ranked in the fourth quartile of the Performance Category for the one and ten-year periods and in the second quartile for the three- and five-year periods. The Fund's performance was also compared to its prospectus benchmark index, the ICE BofA U.S. 3-Month Treasury Bill Index. The Fund outperformed its benchmark for the three-, five- and ten-year periods and since inception. The Fund's contractual advisory fee was in the second quartile of its Category and Peer Group and the Fund's net total operating expense ratio (i.e., the Fund's total operating expenses, net of waivers/reimbursements) was in the second quartile of its Category and Peer Group. The Board considered that the Fund's contractual advisory fee rate had been reduced effective November 1, 2019 from 1.25% to 1.10%. It was further noted that the Adviser had entered into an expense waiver and reimbursement agreement to limit fund fees and expenses through September 30, 2023.
The Board determined that, given all of the factors provided, it would be in the best interests of the Fund and its shareholders to continue the advisory agreement. In light of the Fund's current size and fee rate, the Board concluded that the fee structure was reasonable and that the absence of breakpoints in the Fund's fee schedule was acceptable at this time, although the Board would continue to monitor whether breakpoints should be implemented for the Fund.
Water Island Credit Opportunities Fund
The Fund's performance (Class I Shares, net of fees) was compared to that of funds comprising the Morningstar Nontraditional Bond Category. The Fund's net total return ranked in the first quartile of the Performance Category for the one-, three- and five-year periods. The Fund outperformed its prospectus benchmark, the ICE BofA U.S. 3-Month Treasury Bill Index, for the three- and five-year periods and since inception. The Fund outperformed its supplemental benchmark, the Bloomberg U.S. Aggregate Bond Index, for the three- and five-year periods and since inception. The Fund's contractual advisory fee was in fourth quartile of its Category and second quartile of its Peer Group, and the Fund's net total operating expense ratio (i.e., the Fund's total operating expenses, net of waivers/reimbursements) was in the third quartile for the Category and the second quartile for the Peer Group. It was noted that the median average net asset size of the funds in the Category and Peer Group was significantly larger than that of the Fund and that many of those funds appear to benefit from economies of scale. It was further noted that the Adviser had lowered the Fund's management fee and instituted a breakpoint to the Fund's management fee schedule in 2018 and had entered into an expense waiver and reimbursement agreement to further limit fund fees and expenses through September 30, 2023.
The Board determined, given all of the factors provided, that it would be in the best interests of the Fund and its shareholders to continue the advisory agreement. In light of the Fund's current size and fee rate, the Board concluded that the fee structure was reasonable.
www.arbitragefunds.com | 1-800-295-4485
104
The Arbitrage Funds Liquidity Risk
May 31, 2022 (Unaudited)
Annual Review of Liquidity Risk Management Program (the "LRMP") including Report from the Liquidity Risk Management Program Administrator
Consistent with Rule 22e-4 under the Investment Company Act of 1940 (the "Liquidity Rule"), the Funds have adopted and implemented a liquidity risk management program (the "Program"). The Program seeks to assess and manage each Fund's liquidity risk, which is defined as the risk that a Fund is unable to meet investor redemption requests without significantly diluting the remaining investors' interests in the Fund. The Funds' Board of Trustees (the "Board") has designated Water Island Capital, LLC, the Funds' investment adviser, as the administrator of the Program. The Program is implemented and monitored by the Operational Risk Committee, a committee comprised of representatives of Water Island Capital, LLC. As part of its responsibilities as administrator, Water Island Capital, LLC has retained a third party to perform certain functions, including providing market data and liquidity classification model information.
The Funds' Program includes a number of processes designed to support the assessment and management of its liquidity risk. In particular, the Program includes no less than annual assessments of factors that influence each Fund's liquidity risk; no less than monthly classifications of each Fund's investments into one of four liquidity classifications provided for in the Liquidity Rule; a 15% of net assets limit on the acquisition of "illiquid investments" (as defined under the Liquidity Rule); establishment of a minimum percentage of a Fund's assets to be invested in investments classified as "highly liquid" (as defined under the Liquidity Rule) if the Fund does not invest primarily in highly liquid investments; and periodic reporting to the Funds' Board.
At a meeting of the Board of Trustees on February 22, 2022, Water Island Capital, LLC provided a written report (the "Report") to the Board addressing the operation, adequacy, and effectiveness of the Funds' Program, including any material changes to the Program for the period April 1, 2021 through December 31, 2021 ("Reporting Period"). The Report included a summary of the oversight of the Program and the system that is used to operate the Program, a discussion of the Funds' investment strategies and liquidity sources, reasonably anticipated trade sizes, historical redemptions, investor concentrations, liquidity events and liquidity classifications during the Reporting Period. The Report concluded that the Program was operating adequately and effectively in promoting effective liquidity risk management for the Funds during the Reporting Period. There were no material changes to the Program during the Reporting Period. The Report further concluded that each Fund's investment strategy continues to be appropriate given the Fund's status as an open-end fund.
There can be no assurance that the Program will achieve its objectives in the future. Additional information regarding risks of investing in each Fund, including liquidity risks presented by the Funds' investment portfolios, is found in the Funds' Prospectus and Statement of Additional Information.
Annual Report | May 31, 2022
105
The Arbitrage Funds Trustees & Officers
May 31, 2022 (Unaudited)
The Trustees serve for an indefinite term and the officers are elected annually. It is the policy of the Board that each Trustee, at the conclusion of the first meeting at which the Trustee has attained age 75, shall retire from the Board.
The Statement of Additional Information includes additional information about the Funds' Trustees and is available, without charge, upon request by calling toll-free 1-800-295-4485 or on the Funds' website at www.arbitragefunds.com/resources.
INTERESTED TRUSTEES:
|
Name, Address and Age |
Length of Time Served |
Position with Trust |
Principal Occupation During the Past Five Years |
Other Directorships During the Past Five Years |
Number of Portfolios in the Fund Complex Overseen by Trustee** |
||||||||||||||||||
|
John S. Orrico, CFA* 41 Madison Avenue, 42nd Floor, New York, NY 10010 (Age 62) |
Since 2000 |
President and Chairman of the Board of Trustees |
Managing Member, Water Island Capital, LLC, the Investment Adviser, since January 2000. |
None |
5 |
||||||||||||||||||
|
Christina Chew* 41 Madison Avenue, 42nd Floor, New York, NY 10010 (Age 51) |
Since 2018 |
Trustee |
Senior Managing Partner of Water Island Capital, LLC, the Investment Adviser, since 2013. |
None |
3 |
||||||||||||||||||
* John S. Orrico and Christina Chew, as affiliated persons of the Adviser, are each an "interested person" of the Trust within the meaning of Section 2(a)(19) of the 1940 Act.
** The registered investment companies in the fund complex include the Trust and AltShares Trust.
www.arbitragefunds.com | 1-800-295-4485
106
The Arbitrage Funds Trustees & Officers (continued)
May 31, 2022 (Unaudited)
INDEPENDENT TRUSTEES*:
|
Name, Address and Age |
Length of Time Served |
Position with Trust |
Principal Occupation During the Past Five Years |
Other Directorships During the Past Five Years |
Number of Portfolios in the Fund Complex Overseen by Trustee** |
||||||||||||||||||
|
John C. Alvarado (Age 62) |
Since 2003 |
Lead Independent Trustee |
COO (2018 -present) and CFO (2016-present) of Magnum Development LLC, a privately held Utah-based integrated energy storage and power generation company. Previously, Managing Director at Alvarado Energy Advisors LLC ("AEA"), a boutique investment banking firm providing financial advisory services to middle market energy companies (2014 - 2016); Managing Director for The Seaport Group, a credit-focused investment bank (2010 - 2014). |
None |
3 |
||||||||||||||||||
Annual Report | May 31, 2022
107
The Arbitrage Funds Trustees & Officers (continued)
May 31, 2022 (Unaudited)
|
Name, Address and Age |
Length of Time Served |
Position with Trust |
Principal Occupation During the Past Five Years |
Other Directorships During the Past Five Years |
Number of Portfolios in the Fund Complex Overseen by Trustee** |
||||||||||||||||||
|
Robert P. Herrmann (Age 59) |
Since 2012 |
Trustee |
CEO of EQIS Capital Management, Inc., a national financial advisory firm (2020-present). Independent Director of GeoWealth LLC, a technology provider in the financial services industry (2019 -present); Previously, President & CEO of Discovery Data, a leading financial services industry data provider (2009 - 2019). |
Independent Director and Chairman of Nominating and Governance Committee of TD Funds (USA) (2014 - 2019); Independent Director of FundChoice Holdings LLC (2014 - 2018); Chairman of the Board, Monmouth Medical Center (since 2012), Advisory Board Member, Monmouth University School of Science (since 2017). |
3 |
||||||||||||||||||
www.arbitragefunds.com | 1-800-295-4485
108
The Arbitrage Funds Trustees & Officers (continued)
May 31, 2022 (Unaudited)
|
Name, Address and Age |
Length of Time Served |
Position with Trust |
Principal Occupation During the Past Five Years |
Other Directorships During the Past Five Years |
Number of Portfolios in the Fund Complex Overseen by Trustee** |
||||||||||||||||||
|
Stephen R. Byers (Age 68) |
Since 2016 |
Trustee |
Independent Director (since 2011); Independent Consultant (since 2014). |
Independent Chair (since November 2016), Trustee (since 2011), Lead Independent Trustee (2015 - 2016) and Audit Committee Chair (2011 - 2015), Deutsche Bank db-X ETF Trust (45 portfolios); Independent Director, Barings BDC (BBDC), a business development company; Trustee (2002 - 2011), The College of William and Mary, Graduate School of Business; Board Member, (since 2016) and Audit Committee Chair (since 2019), Mutual Fund Directors Forum. |
3 |
||||||||||||||||||
Annual Report | May 31, 2022
109
The Arbitrage Funds Trustees & Officers (continued)
May 31, 2022 (Unaudited)
|
Name, Address and Age |
Length of Time Served |
Position with Trust |
Principal Occupation During the Past Five Years |
Other Directorships During the Past Five Years |
Number of Portfolios in the Fund Complex Overseen by Trustee** |
||||||||||||||||||
|
Francis X. Tracy (Age 64) |
Since 2016 |
Trustee |
Independent Director (since 2016). Previously, President, Chief Financial Officer, Treasurer, and Secretary for Batterymarch Financial Management, Inc. (1999 - 2014). |
Batterymarch Global Emerging Markets Fund (Luxembourg) (2010 - 2014). |
5 |
||||||||||||||||||
|
Nancy M. Morris (Age 69) |
Since 2018 |
Trustee |
Independent Director (since 2019). Previously, Chief Compliance Officer and Managing Director, Wellington Management Company LLP (2012 - 2018). |
Director of Diamond Hill Funds (13 portfolios) (since 2019). |
5 |
||||||||||||||||||
www.arbitragefunds.com | 1-800-295-4485
110
The Arbitrage Funds Trustees & Officers (continued)
May 31, 2022 (Unaudited)
EXECUTIVE OFFICERS:
|
Name, Address and Age |
Length of Time Served |
Position with Trust |
Principal Occupation During the Past Five Years |
Other Directorships During the Past Five Years |
Number of Portfolios in the Fund Complex Overseen by Trustee** |
||||||||||||||||||
|
William Keena 41 Madison Avenue, 42nd Floor, New York, NY 10010 (Age 71) |
Anti-Money Laundering Officer since November 2019, Secretary since 2013 |
Anti-Money Laundering Officer, Secretary |
Anti-Money Laundering Officer (2019 - present), Compliance Officer (November 2021 - present), and Chief Administrative Officer (2010 - October 2021), Water Island Capital. |
N/A |
N/A |
||||||||||||||||||
|
Jonathon Hickey 41 Madison Avenue, 42nd Floor, New York, NY 10010 (Age 41) |
Since 2013 |
Treasurer |
Chief Operating Officer (2016 -present); Director of Operations (2011 - 2016), Water Island Capital. |
N/A |
N/A |
||||||||||||||||||
|
Monique Labbe Foreside Management Services, LLC 211 Congress Street, 10th Floor, Suite 1010, Boston, MA 02110 (Age 48) |
Since 2015 |
Chief Financial Officer |
Senior Director, Foreside Management Services, LLC*** (2014 - present) |
N/A |
N/A |
||||||||||||||||||
Annual Report | May 31, 2022
111
The Arbitrage Funds Trustees & Officers (continued)
May 31, 2022 (Unaudited)
|
Name, Address and Age |
Length of Time Served |
Position with Trust |
Principal Occupation During the Past Five Years |
Other Directorships During the Past Five Years |
Number of Portfolios in the Fund Complex Overseen by Trustee** |
||||||||||||||||||
|
Philip Channen 41 Madison Avenue, 42nd Floor, New York, NY 10010 (Age: 57) |
Since December 2019 |
Chief Compliance Officer |
Chief Compliance Officer, Water Island Capital (2019 -present); Deputy Chief Compliance Officer, HarbourVest Partners, LLC (2017 - 2019); Chief Compliance Officer/Senior Advisor to the CCO, QS Investors, LLC (2014 - 2016). |
N/A |
N/A |
||||||||||||||||||
* Each Independent Trustee may be contacted by writing to the Trustee c/o Fatima Sulaiman, K&L Gates LLP, 1601 K Street, NW, Washington, D.C. 20006-1600.
** The registered investment companies in the fund complex include the Trust and AltShares Trust.
*** Foreside Fund Services provides chief financial officer services to the Trust under a Fund CFO/Treasurer agreement with the Trust.
www.arbitragefunds.com | 1-800-295-4485
112

Arbitrage Fund
Water Island Event-Driven Fund
Water Island Credit Opportunities Fund
800-295-4485
www.arbitragefunds.com
Adviser
Water Island Capital, LLC
41 Madison Avenue, 42nd Floor
New York, NY 10010
Distributor
ALPS Distributors, Inc.
1290 Broadway, Suite 1100
Denver, CO 80203
Transfer Agent
DST Systems, Inc.
P.O. Box 219842
Kansas City, MO 64121-9842
Custodian
State Street Bank & Trust
225 Liberty Street
New York, NY 10281
This material must be preceded or accompanied by a prospectus. Please read it carefully before investing.
| (b) | Not applicable. |
Item 2. Code of Ethics.
| (a) | The Registrant, as of the end of the period covered by the report, has adopted a code of ethics that applies to the Registrant's principal executive officer, principal financial officer, principal accounting officer or controller or any persons performing similar functions on behalf of the Registrant. |
| (b) | Not applicable. |
| (c) | During the period covered by this report, no amendments were made to the provisions of the code of ethics adopted in 2(a) above. |
| (d) | During the period covered by this report, no implicit or explicit waivers to the provisions of the code of ethics adopted in 2(a) above were granted. |
| (e) | Not applicable. |
| (f) | The Registrant's Code of Ethics is attached as an Exhibit hereto. |
Item 3. Audit Committee Financial Expert.
| (a)(1) | The Registrant’s board of trustees has determined that the Registrant has at least one audit committee financial expert serving on the audit committee |
| (a)(2) | The audit committee financial experts are John C. Alvarado and Francis X. Tracy, who are each independent as defined in Form N-CSR Item 3(a)(2). |
Item 4. Principal Accountant Fees and Services.
| (a) | Audit Fees: For the Registrant’s fiscal years ended May 31, 2022 and May 31, 2021, the aggregate fees billed for professional services rendered by the principal accountant for the audit of the Registrant’s annual financial statements were $100,000 and $120,000, respectively. |
| (b) | Audit-Related Fees: For the Registrant’s fiscal years ended May 31, 2022 and May 31, 2021, the aggregate fees billed for assurance and related services by the principal accountant that are reasonably related to the performance of the audit of the Registrant’s financial statements and are not reported under paragraph (a) of this Item were $0 and $0, respectively. |
| (c) | Tax Fees: For the Registrant’s fiscal years ended May 31, 2022 and May 31, 2021, aggregate fees of $27,400 and $33,200, respectively, were billed for professional services rendered by the principal accountant for tax compliance, tax advice, and tax planning. Services for which fees in the Tax Fees category are billed include E&Y’s review of the registrant’s U.S. federal income tax returns and the required state corporate income tax returns, as well as E&Y’s review of excise tax distribution calculations and identification and analyzation of the passive foreign investment company status of foreign corporate equities. |
| (d) | All Other Fees: For the Registrant’s fiscal years ended May 31, 2022 and May 31, 2021, no fees were billed to the Registrant by the principal accountant for services other than the services reported in paragraphs (a) through (c) of this item. |
| (e)(1) | Audit Committee’s Pre-Approval Policies and Procedures: All services to be performed by the Registrant's principal auditors must be pre-approved by the Registrant's audit committee. |
| (e)(2) | No services described in paragraphs (b) through (d) were approved pursuant to paragraph (c)(7)(i)(C) of Rule 2-01 of Regulation S-X. |
| (f) | Not applicable. |
| (g) | The aggregate non-audit fees billed by the Registrant’s principal accountant for the fiscal years ended May 31, 2022 and May 31, 2021 were $27,400 and $33,200, respectively. |
| (h) | Not applicable. |
| (i) | Not applicable. |
| (j) | Not applicable. |
Item 5. Audit Committee of Listed Registrants.
Not applicable.
Item 6. Schedule of Investments.
The Schedule of Investments is included as part of the Report to Stockholders filed under Item 1 of this form.
Item 7. Disclosure of Proxy Voting Policies and Procedures for Closed-End Management Investment Companies.
Not applicable.
Item 8. Portfolio Managers of Closed-End Management Investment Companies.
Not applicable.
Item 9. Purchases of Equity Securities by Closed-End Management Investment Company and Affiliated Purchasers.
Not applicable.
Item 10. Submission of Matters to Vote of Security Holders.
There have been no material changes to the procedures by which shareholders may recommend nominees to the registrant’s Board of Trustees.
Item 11. Controls and Procedures.
| (a) | The registrant’s principal executive officer and principal financial officer have evaluated the registrant’s disclosure controls and procedures (as defined in Rule 30a-3(c) under the Investment Company Act of 1940, as amended) within the most recent fiscal half-year of the filing date and have concluded that the registrant’s disclosure controls and procedures were effective, as of that date. |
| (b) | There was no change in the registrant’s internal control over financial reporting (as defined in Rule 30a-3(d) under the Investment Company Act of 1940, as amended) during the period covered by this report that has materially affected, or is reasonably likely to materially affect, the registrant’s internal control over financial reporting. |
Item 12. Disclosure of Securities Lending Activities for Closed-End Management Investment Companies
Not applicable.
Item 13. Exhibits.
| (a)(1) | The code of ethics that applies to the registrant's principal executive officer and principal financial officer is attached hereto as EX-13.A.1. |
| (a)(3) | Not applicable. |
| (a)(4) | Not applicable. |
SIGNATURES
Pursuant to the requirements of the Securities Exchange Act of 1934 and the Investment Company Act of 1940, the registrant has duly caused this report to be signed on its behalf by the undersigned, thereunto duly authorized.
THE ARBITRAGE FUNDS
| By: | /s/ John S. Orrico | |
| John S. Orrico | ||
| President (Principal Executive Officer) | ||
| Date: | August 8, 2022 |
Pursuant to the requirements of the Securities Exchange Act of 1934 and the Investment Company Act of 1940, this report has been signed below by the following persons on behalf of the registrant and in the capacities and on the dates indicated.
| By: | /s/ John S. Orrico | |
| John S. Orrico | ||
| President (Principal Executive Officer) | ||
| Date: | August 8, 2022 |
| By: | /s/ Monique Labbe | |
| Monique Labbe | ||
| Chief Financial Officer (Principal Financial Officer) | ||
| Date: | August 8, 2022 |
Exhibit 99.CODEETH
EX-13.A.1
THE ARBITRAGE FUNDS
CODE OF ETHICS FOR PRINCIPAL EXECUTIVE
AND SENIOR FINANCIAL OFFICERS
| I. | Covered Officers/Purpose of the Code |
This Code of Ethics (the “Code”) for The Arbitrage Funds (the “Company”) applies to the Company’s Principal Executive Officer, Principal Financial Officer and Principal Accounting Officer (the “Covered Officers” each of whom are set forth in Exhibit A) for the purpose of promoting:
| · | honest and ethical conduct, including the ethical handling of actual or apparent conflicts of interest between personal and professional relationships; |
| · | full, fair, accurate, timely and understandable disclosure in reports and documents that a registrant files with, or submits to, the U.S. Securities and Exchange Commission (“SEC”) and in other public communications made by the Company; |
| · | compliance with applicable laws and governmental rules and regulations; |
| · | the prompt internal reporting of violations of the Code to an appropriate person or persons identified in the Code; and |
| · | accountability for adherence to the Code. |
Each Covered Officer should adhere to a high standard of business ethics and should be sensitive to situations that may give rise to actual as well as apparent conflicts of interest.
| II. | Covered Officers Should Handle Ethically Actual and Apparent Conflicts of Interest |
Overview. A “conflict of interest” occurs when a Covered Officer’s private interest interferes with the interests of, or his service to, the Company. For example, a conflict of interest would arise if a Covered Officer, or a member of his family, receives improper personal benefits as a result of his position with the Company.
Certain conflicts of interest arise out of the relationships between Covered Officers and the Company and already are subject to conflict of interest provisions in the Investment Company Act of 1940, as amended (the “1940 Act”) and the Investment Advisers Act of 1940, as amended (the “Advisers Act”). For example, Covered Officers may not individually engage in certain transactions (such as the purchase or sale of securities or other property) with the Company because of their status as “affiliated persons” of the Company. The Company’s and the investment adviser’s compliance programs and procedures are designed to prevent, or identify and correct, violations of these provisions. This Code does not, and is not intended to, repeat or replace these programs and procedures, and such conflicts fall outside of the parameters of this Code.
Although typically not presenting an opportunity for improper personal benefit, conflicts arise from, or as a result of, the contractual relationship between the Company and the investment adviser and/or administrator of which the Covered Officers are also officers or employees. As a result, this Code recognizes that the Covered Officers will, in the normal course of their duties (whether formally for the Company or for the adviser/administrator, or for both), be involved in establishing policies and implementing decisions that will have different effects on the investment adviser and/or administrator and the Company. The participation of the Covered Officers in such activities is inherent in the contractual relationship between the Company and the investment adviser and/or administrator and is consistent with the performance by the Covered Officers of their duties as officers of the Company. Thus, if performed in conformity with the provisions of the 1940 Act and the Advisers Act, such activities will be deemed to have been handled ethically. In addition, it is recognized by the Company’s Board of Trustees (the “Board”) that the Covered Officers may also be officers or employees of one or more investment companies covered by other codes.
Other conflicts of interest are covered by the Code, even if such conflicts of interest are not subject to provisions in the 1940 Act and the Advisers Act. The following list provides examples of conflicts of interest under the Code, but Covered Officers should keep in mind that these examples are not exhaustive. The overarching principle is that the personal interest of a Covered Officer should not be placed improperly before the interest of the Company.
Each Covered Officer must:
| · | not use his personal influence or personal relationships improperly to influence investment decisions or financial reporting by the Company whereby the Covered Officer would benefit personally to the detriment of the Company; |
| · | not cause the Company to take action, or fail to take action, for the individual personal benefit of the Covered Officer rather than the benefit of the Company; |
| · | not use material non-public knowledge of portfolio transactions made or contemplated for the Company to trade personally or cause others to trade personally in contemplation of the market effect of such transactions; |
| · | report at least annually any affiliations or other relationships related to conflicts of interest that the Company’s Trustees and Officers Questionnaire covers. |
There are some conflict of interest situations that should always be discussed with Counsel for the Company if material. Examples of these include:
| · | service as a director on the board of any public company; |
| · | the receipt of any non-nominal gifts; |
| · | the receipt of any entertainment from any company with which the Company has current or prospective business dealings unless such entertainment is business-related, reasonable in cost, appropriate as to time and place, and not so frequent as to raise any questions of impropriety; |
| · | any ownership interest in, or any consulting or employment relationship with, any of the Company’s service providers, other than its investment adviser, principal underwriter, administrator or any affiliated person thereof; |
| · | a direct or indirect financial interest in commissions, transaction charges or spreads paid by the Company for effecting portfolio transactions or for selling or redeeming shares other than an interest arising from the Covered Officer’s employment, such as compensation or equity ownership. |
| III. | Disclosure and Compliance |
| · | Each Covered Officer should familiarize himself with the disclosure requirements generally applicable to the Company. | |
| · | Each Covered Officer should not knowingly misrepresent, or cause others to misrepresent, facts about the Company to others, whether within or outside the Company, including to the Company’s directors and auditors, and to governmental regulators and self-regulatory organizations. | |
| · | Each Covered Officer should, to the extent appropriate within his area of responsibility, consult with other officers and employees of the Company and the adviser/administrator with the goal of promoting full, fair, accurate, timely and understandable disclosure in the reports and documents the Company files with, or submits to, the SEC and in other public communications made by the Company. | |
| · | It is the responsibility of each Covered Officer to promote compliance with the standards and restrictions imposed by applicable laws, rules and regulations. |
| IV. | Reporting and Accountability |
Each Covered Person must:
| · | upon adoption of the Code (or thereafter as applicable, upon becoming a Covered Officer), affirm in writing to the Company’s Chief Compliance Officer that s/he has received, read, and understands the Code; |
| · | annually thereafter, affirm to the Company’s Chief Compliance Officer that he has complied with the requirements of the Code; |
| · | not retaliate against any other Covered Officer or any employee of the Company or their affiliated persons for reports of potential violations that are made in good faith; and |
| · | notify Counsel for the Company promptly if he knows of any violation of this Code. Failure to do so is itself a violation of this Code. |
Counsel for the Company is responsible for applying this Code to specific situations in which questions are presented under it and has the authority to interpret this Code in any particular situation. However, any approvals or waivers sought by a Covered Officer will be considered by the Audit Committee.
The Company will follow these procedures in investigating and enforcing this Code:
| · | Counsel for the Company will take all appropriate action to investigate any potential violations reported to him or her; | |
| · | if, after such investigation, Counsel believes that no violation has occurred, Counsel is not required to take any further action; | |
| · | any matter that Counsel believes is a violation will be reported to the Committee; | |
| · | if the Committee concurs that a violation has occurred, it will inform and make a recommendation to the Board, which will consider appropriate action, which may include review of, and appropriate modifications to, applicable policies and procedures; notification to appropriate personnel of the investment adviser/administrator or its board; or a recommendation to dismiss the Covered Officer; | |
| · | the Board will be responsible for granting waivers, as appropriate; and | |
| · | any changes to or waivers of this Code will, to the extent required, be disclosed as provided by SEC rules. |
| V. | Other Policies and Procedures |
This Code shall be the sole code of ethics adopted by the Company for purposes of Section 406 of the Sarbanes-Oxley Act of 2002 and the rules and forms applicable to registered investment companies thereunder. Insofar as other policies or procedures of the Company, the Company’s investment adviser, principal underwriter, or other service providers govern or purport to govern the behavior or activities of the Covered Officers who are subject to this Code, they are superseded by this Code to the extent that they overlap or conflict with the provisions of this Code. The Company’s and its investment adviser’s and principal underwriter’s codes of ethics under Rule 17j-1 under the 1940 Act are separate requirements applying to the Covered Officers and others, and are not part of this Code.
Any amendments to this Code, other than amendments to Exhibit A, must be approved or ratified by a majority vote of the Board, including a majority of independent trustees.
| VI. | Confidentiality |
All reports and records prepared or maintained pursuant to this Code will be considered confidential and shall be maintained and protected accordingly. Except as otherwise required by law or this Code, such matters shall not be disclosed to anyone other than the Board and Counsel for the Company.
| VII. | Internal Use |
The Code is intended solely for the internal use by the Company and does not constitute an admission, by or on behalf of the Company, as to any fact, circumstance, or legal conclusion.
Exhibit A
Persons Covered by this Code of Ethics
John S. Orrico
Monique Labbe
THE ARBITRAGE FUNDS
CODE OF ETHICS FOR PRINCIPAL EXECUTIVE
AND SENIOR FINANCIAL OFFICERS
CERTIFICATE OF COMPLIANCE
As a Covered Officer as defined in the Code of Ethics for Principal Executive and Senior Financial Officers of The Arbitrage Funds (the “Code”), I hereby certify that I have received and have read and fully understand the Code, and I recognize that I am subject to the Code. I further certify that since any prior certification of the Code, I have complied with the policies and procedures as in effect during that time and agree to comply with the requirements of the Code in the future.
| Signature | |
| Name (Please Print) | |
| Title | |
| Date |
Exhibit 99.CERT
I, John S. Orrico, President (Principal Executive Officer) of The Arbitrage Funds, certify that:
| 1. | I have reviewed this report on Form N-CSR of The Arbitrage Funds; |
| 2. | Based on my knowledge, this report does not contain any untrue statement of a material fact or omit to state a material fact necessary to make the statements made, in light of the circumstances under which such statements were made, not misleading with respect to the period covered by this report; |
| 3. | Based on my knowledge, the financial statements and other financial information included in this report, fairly present in all material respects the financial condition, results of operations, changes in net assets, and cash flows (if the financial statements are required to include a statement of cash flows) of the registrant as of, and for, the periods presented in this report; |
| 4. | The registrant’s other certifying officer and I are responsible for establishing and maintaining disclosure controls and procedures (as defined in Rule 30a-3(c) under the Investment Company Act of 1940) and internal control over financial reporting (as defined in Rule 30a-3 (d) under the Investment Company Act of 1940) for the registrant and have: |
| (a) | Designed such disclosure controls and procedures, or caused such disclosure controls and procedures to be designed under our supervision, to ensure that material information relating to the registrant, including its consolidated subsidiaries, is made known to us by others within those entities, particularly during the period in which this report is being prepared; |
| (b) | Designed such internal control over financial reporting, or caused such internal control over financial reporting to be designed under our supervision, to provide reasonable assurance regarding the reliability of financial reporting and the preparation of financial statements for external purposes in accordance with generally accepted accounting principles; |
| (c) | Evaluated the effectiveness of the registrant’s disclosure controls and procedures and presented in this report our conclusions about the effectiveness of the disclosure controls and procedures, as of a date within the most recent fiscal half-year prior to the filing date of this report based on such evaluation; and |
| (d) | Disclosed in this report any change in the registrant’s internal control over financial reporting that occurred during the period covered by this report that has materially affected, or is reasonably likely to materially affect, the registrant’s internal control over financial reporting; and |
| 5. | The registrant’s other certifying officer and I have disclosed to the registrant’s auditors and the audit committee of the registrant’s board of trustees (or persons performing the equivalent functions): |
| (a) | All significant deficiencies and material weaknesses in the design or operation of internal control over financial reporting which are reasonably likely to adversely affect the registrant’s ability to record, process, summarize, and report financial information; and |
| (b) | Any fraud, whether or not material, that involves management or other employees who have a significant role in the registrant’s internal control over financial reporting. |
| By: | /s/ John S. Orrico | |
| John S. Orrico | ||
| President (Principal Executive Officer) | ||
| Date: | August 8, 2022 |
I, Monique Labbe, Chief Financial Officer (Principal Financial Officer) of The Arbitrage Funds, certify that:
| 1. | I have reviewed this report on Form N-CSR of The Arbitrage Funds; |
| 2. | Based on my knowledge, this report does not contain any untrue statement of a material fact or omit to state a material fact necessary to make the statements made, in light of the circumstances under which such statements were made, not misleading with respect to the period covered by this report; |
| 3. | Based on my knowledge, the financial statements and other financial information included in this report, fairly present in all material respects the financial condition, results of operations, changes in net assets, and cash flows (if the financial statements are required to include a statement of cash flows) of the registrant as of, and for, the periods presented in this report; |
| 4. | The registrant’s other certifying officer and I are responsible for establishing and maintaining disclosure controls and procedures (as defined in Rule 30a-3(c) under the Investment Company Act of 1940) and internal control over financial reporting (as defined in Rule 30a-3 (d) under the Investment Company Act of 1940) for the registrant and have: |
| (a) | Designed such disclosure controls and procedures, or caused such disclosure controls and procedures to be designed under our supervision, to ensure that material information relating to the registrant, including its consolidated subsidiaries, is made known to us by others within those entities, particularly during the period in which this report is being prepared; |
| (b) | Designed such internal control over financial reporting, or caused such internal control over financial reporting to be designed under our supervision, to provide reasonable assurance regarding the reliability of financial reporting and the preparation of financial statements for external purposes in accordance with generally accepted accounting principles; |
| (c) | Evaluated the effectiveness of the registrant’s disclosure controls and procedures and presented in this report our conclusions about the effectiveness of the disclosure controls and procedures, as of a date within the most recent fiscal half-year prior to the filing date of this report based on such evaluation; and |
| (d) | Disclosed in this report any change in the registrant’s internal control over financial reporting that occurred during the period covered by this report that has materially affected, or is reasonably likely to materially affect, the registrant’s internal control over financial reporting; and |
| 5. | The registrant’s other certifying officer and I have disclosed to the registrant’s auditors and the audit committee of the registrant’s board of trustees (or persons performing the equivalent functions): |
| (a) | All significant deficiencies and material weaknesses in the design or operation of internal control over financial reporting which are reasonably likely to adversely affect the registrant’s ability to record, process, summarize, and report financial information; and |
| (b) | Any fraud, whether or not material, that involves management or other employees who have a significant role in the registrant’s internal control over financial reporting. |
| By: | /s/ Monique Labbe | |
| Monique Labbe | ||
| Chief Financial Officer (Principal Financial Officer) | ||
| Date: | August 8, 2022 |
Exhibit 99.906CERT
This certification is furnished pursuant to Section 906 of the Sarbanes-Oxley Act of 2002, 18 U.S.C. § 1350, and accompanies the report on Form N-CSR for the period ended May 31, 2022 of The Arbitrage Funds (the “Company”).
I, John S. Orrico, the President (Principal Executive Officer) of the Company, certify that:
| (i) | the Form N-CSR fully complies with the requirements of Section 13(a) or Section 15(d), as applicable, of the Securities Exchange Act of 1934 (15 U.S.C. 78m or 78o(d)); and |
| (ii) | the information contained in the Form N-CSR fairly presents, in all material respects, the financial condition and results of operations of the Company. |
A signed original of this written statement required by Section 906, or other document authenticating, acknowledging, or otherwise adopting the signature that appears in typed form within the electronic form of this written statement required by Section 906, has been provided to the Company and will be retained by the Company and furnished to the Securities and Exchange Commission or its staff upon request.
| Dated: | August 8, 2022 | |
| By: | /s/ John S. Orrico | |
| John S. Orrico | ||
| President (Principal Executive Officer) |
This certification is furnished pursuant to Section 906 of the Sarbanes-Oxley Act of 2002, 18 U.S.C. § 1350, and accompanies the report on Form N-CSR for the period ended May 31, 2022 of The Arbitrage Funds (the “Company”).
I, Monique Labbe, Chief Financial (Principal Financial Officer) Officer of the Company, certify that:
| (i) | the Form N-CSR fully complies with the requirements of Section 13(a) or Section 15(d), as applicable of the Securities Exchange Act of 1934 (15 U.S.C. 78m or 78o(d)); and |
| (ii) | the information contained in the Form N-CSR fairly presents, in all material respects, the financial condition and results of operations of the Company. |
A signed original of this written statement required by Section 906, or other document authenticating, acknowledging, or otherwise adopting the signature that appears in typed form within the electronic form of this written statement required by Section 906, has been provided to the Company and will be retained by the Company and furnished to the Securities and Exchange Commission or its staff upon request.
| Dated: | August 8, 2022 | |
| By: | /s/ Monique Labbe | |
| Monique Labbe | ||
| Chief Financial Officer (Principal Financial Officer) |
Serious News for Serious Traders! Try StreetInsider.com Premium Free!
You May Also Be Interested In
- Dicello Levitt LLP Announces Investor Class Action Lawsuit Filed Against QuidelOrtho Corp. f/k/a Quidel Corp. (NASDAQ: QDEL) And Lead Plaintiff Deadline
- NorthWestern Reports First Quarter 2024 Financial Results
- CIDARA Therapeutics ALERT: Bragar Eagel & Squire, P.C. is Investigating Cidara Therapeutics, Inc. on Behalf of Cidara Therapeutics Stockholders and Encourages Investors to Contact the Firm
Create E-mail Alert Related Categories
SEC FilingsSign up for StreetInsider Free!
Receive full access to all new and archived articles, unlimited portfolio tracking, e-mail alerts, custom newswires and RSS feeds - and more!
