

Form FWP HSBC USA INC /MD/ Filed by: HSBC USA INC /MD/
 Tweet
Tweet Share
Share
An Artificially Intelligent Equity Index with IBM Watson ΠISSUER FREE WRITING PROSPECTUS Filed Pursuant to Rule 433 Registration Statement No. 333 - 253385 January 18, 2022
1 SUB SUB An Artificially Intelligent Multi Asset Index The AI Powered US Equity Indexes are the first and only rules - based equity strategies to use IBM Watson to turn data into investment insight. By working around the clock to keep up with the increasing volume of data created every day, the AI Powered US Equity Index 6 (“AiPEX6”) uses the power of Artificial Intelligence (“AI”) to continually improve processes, in an effort to build an informational advantage as markets evolve and as new information becomes available. AiPEX6 seeks to identify companies whose stock prices are poised for potential growth through an objective selection process that is like a fundamental approach, only thousands of times faster and broader in scope. Award Winning Innovation SPi is a market intelligence company that provides market intelligence, reference data and lifecycle information for the structured products industry. In 2021, the HSBC AI Powered US Equity Indexes won the Best New Index award. This award recognises, following the Index Standard methodology, the best non - traditional index provider of the year, which outlines their methodology, innovation, and value to investors.

2 AI Powered US Equity Index 6 SUB 07/23 SUB SUB SUB The Future of Investing For investors seeking to grow their wealth by investing in equities, the birth of Big Data represents an unprecedented opportunity. Each new piece of data represents a new possible insight on a company or the markets that can lead to better investment decisions. However, the sheer amount of data now available to investors is staggering, and the gap between what is available and what humans can take in and analyze is wide and will only continue to grow. By some measures, 90% of the data that exists today has been created in just the past two years , and data continues to explode at an exponential pace .* Much of this data is non - traditional ; newer data such as social media posts, satellite imagery, and website traffic patterns must be analyzed and organized to be useful . * Recent advances in machine learning and cloud computing enable AI systems to analyze and continuously learn from the vast amount of data being generated each day.* Successful investment strategies of the future must keep up with the growing amount of data being generated each day. * Please see the IBM website for more information. Information contained in IBM’s website is not incorporated by reference in, and should not be considered as part of, this brochure.
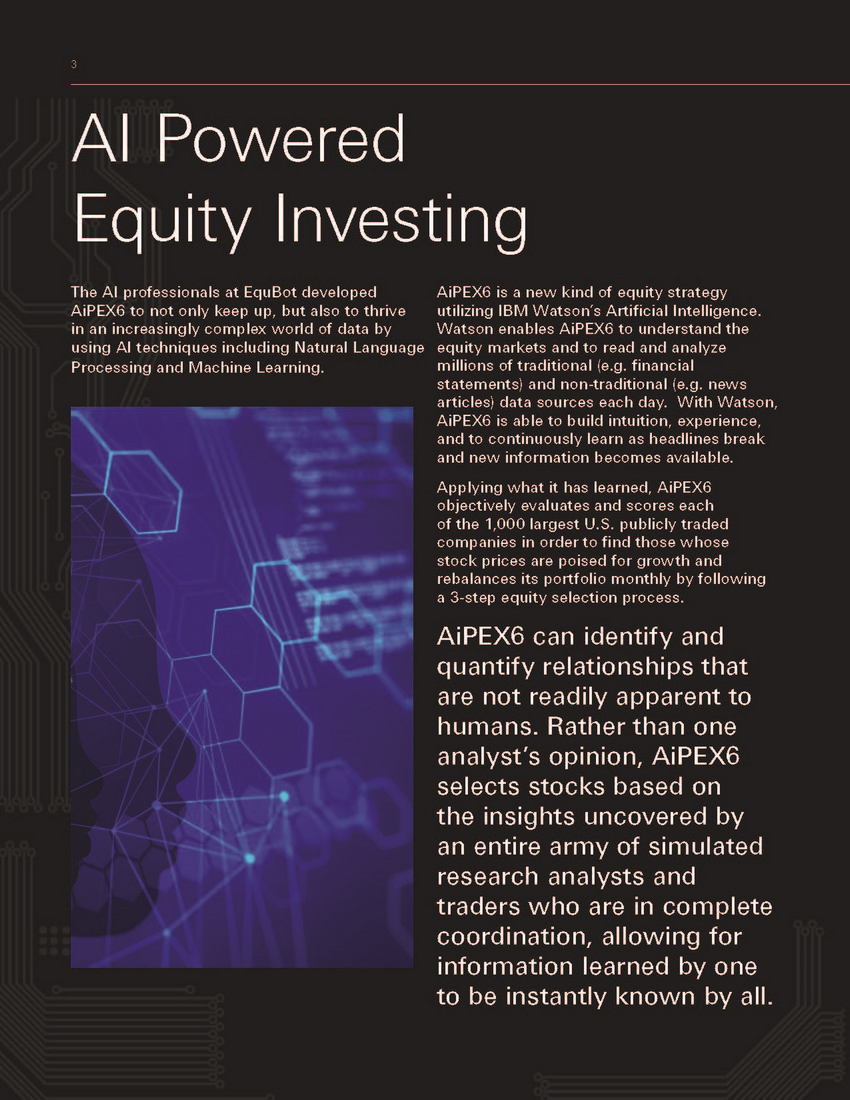
3 The AI professionals at EquBot developed AiPEX6 to not only keep up, but also to thrive in an increasingly complex world of data by using AI techniques including Natural Language Processing and Machine Learning. AiPEX6 is a new kind of equity strategy utilizing IBM Watson’s Artificial Intelligence. Watson enables AiPEX6 to understand the equity markets and to read and analyze millions of traditional (e.g. financial statements) and non - traditional (e.g. news articles) data sources each day. With Watson, AiPEX6 is able to build intuition, experience, and to continuously learn as headlines break and new information becomes available. Applying what it has learned, AiPEX6 objectively evaluates and scores each of the 1,000 largest U.S. publicly traded companies in order to find those whose stock prices are poised for growth and rebalances its portfolio monthly by following a 3 - step equity selection process. AiPEX6 can identify and quantify relationships that are not readily apparent to humans. Rather than one analyst’s opinion, AiPEX6 selects stocks based on the insights uncovered by an entire army of simulated research analysts and traders who are in complete coordination, allowing for information learned by one to be instantly known by all. AI Powered Equity Investing

4 AI Powered US Equity Index 6 AiPEX6 3 - Step Monthly Equity Selection Process: For more information on the index methodology, please see the AiPEX 6 Index Guideline and the AI Powered US Equity Base Index Guideline published by Solactive AG . Information contained in these Index Guidelines or otherwise available from Solactive is not incorporated by reference in, and should not be considered a part of, this brochure . Scores for the 1,000 largest U.S. companies are calculated based on: • Financial Health Score: evaluates a company’s fundamentals and key figures. • Management Score: assesses a company’s management strength and thought leadership. • News & Information Score: measures a company’s market sentiment, economic, and geopolitical risks. Approximately 250 companies with the highest combined Financial Health, Management, and News and Information Scores are selected for the portfolio. Companies are assigned portfolio weights, with the largest weights going to the companies with the highest combined scores (subject to diversification and market liquidity limits). 3. Diversify 2. Select 1. Score

5 Daily Risk Control Helps Provide Smoother Returns AiPEX6 reacts daily to changing market conditions, as rapid movement in the market, or volatility, can create greater potential risk. AiPEX6 reduces the impact of short - term volatility in the equity markets through daily re - allocations between the equities selected by the AI algorithms and a cash component. AiPEX6 seeks a 6% daily volatility target. If the volatility falls below the target, the allocation to selected equities is increased up to a maximum of 150%. If the volatility is greater than the target, allocations to the selected equities may be reduced. Allocations below 100% to selected companies will be reallocated to a cash component. For more information on the index methodology, please see the AiPEX 6 Index Guideline and the AI Powered US Equity Base Index Guideline published by Solactive AG . Information contained in these Index Guidelines or otherwise available from Solactive is not incorporated by reference in, and should not be considered a part of, this brochure .
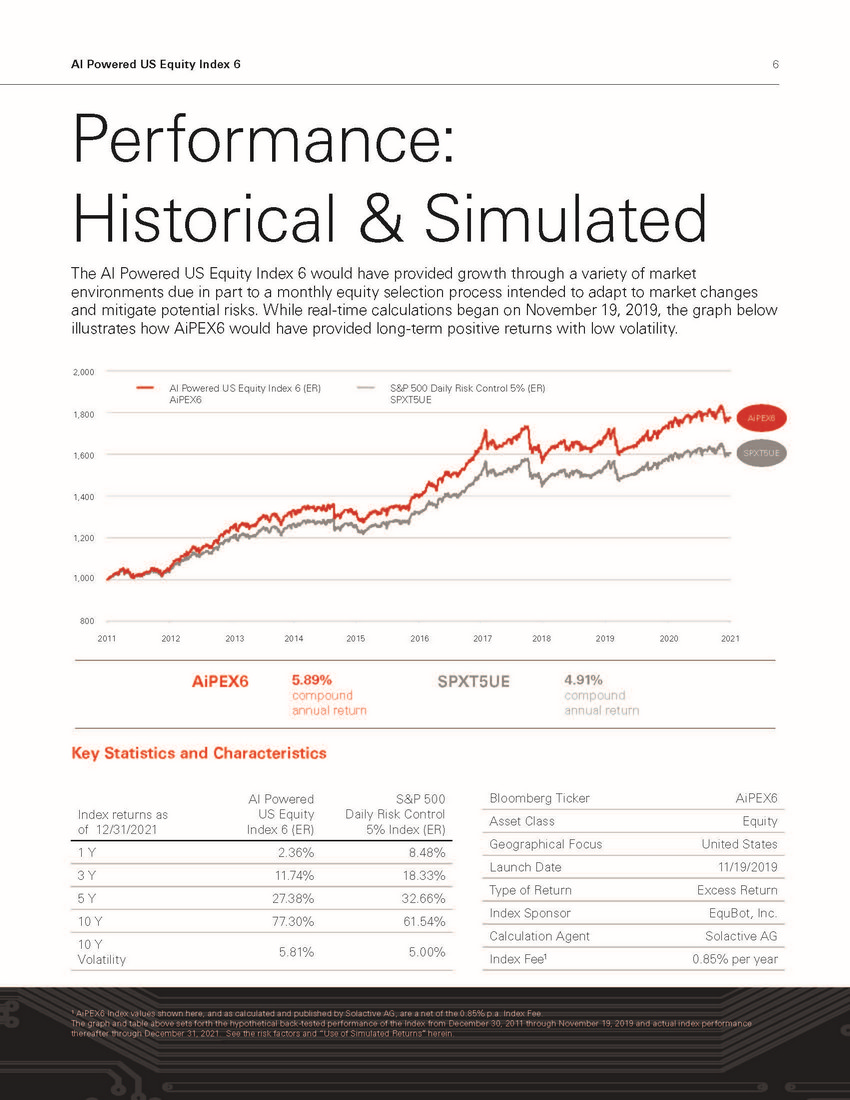
6 AI Powered US Equity Index 6 Performance: Historical & Simulated The AI Powered US Equity Index 6 would have provided growth through a variety of market environments due in part to a monthly equity selection process intended to adapt to market changes and mitigate potential risks. While real - time calculations began on November 19, 2019, the graph below illustrates how AiPEX6 would have provided long - term positive returns with low volatility. 1 AiPEX6 Index values shown here, and as calculated and published by Solactive AG, are a net of the 0.85% p.a. Index Fee. The graph and table above sets forth the hypothetical back - tested performance of the Index from December 30, 2011 through November 19, 2019 and actual index performance thereafter through December 31, 2021. See the risk factors and “Use of Simulated Returns” herein. Index returns as AI Powered US Equity S&P 500 Daily Risk Control of 12/31/2021 Index 6 (ER) 5% Index (ER) 1 Y 2 . 3 6 % 8 . 4 8 % 3 Y 1 1 . 7 4 % 1 8 . 3 3 % 5 Y 2 7 . 3 8 % 3 2 . 66 % 10 Y 7 7 . 3 0 % 6 1 . 5 4 % 10 Y Volatility 5. 8 1 % 5 . 0 0 % Key Statistics and Characteristics Bloomberg Ticker A i P E X 6 A ss et Cl a ss E q u it y Geographical Focus United States Launch Date 11/19/2019 Type of Return Excess Return Index Sponsor EquBot, Inc. Calculation Agent Solactive AG Index Fee 1 0.85% per year 2011 2012 2013 2014 2015 2016 2017 2018 2019 1,800 1,000 800 5.89% compound annual return 4.91% compound annual return A i P E X6 S P X T 5 U E AiPEX6 SPXT5UE AI Powered US Equity Index 6 (ER) AiPEX6 S&P 500 Daily Risk Control 5% (ER) SPXT5UE 2020 2021 1,200 1,400 1,600 2,000

7 Growing Presence of Artificial Intelligence The AiPEX indexes are the first of their kind, but likely not the first time investors have encountered AI. Technology similar to that which AiPEX6 uses to gain market insights is already helping to improve our daily lives, even if we don’t realize it. AI is helping the Mayo Clinic improve their breast cancer early screening results and match patients with clinical trials.* AI is helping our armed forces and law enforcement professionals identify persons of interest with facial recognition.* AI is helping power the billions of online searches each day, and has transformed the communication industry with software such as text message auto completion.* * Please see IBM’s Website for more details.

8 AI Powered US Equity Index 6 Index C o l l a b or a t o r s IBM Watson is IBM’s suite of enterprise Artificial Intelligence applications and APIs. IBM Watson represents a new era in computing, where systems understand the world the way humans do: through intuition, learning, and experience. IBM Watson continuously learns, gaining value and knowledge from interactions over time. EquBot, Inc. (“EquBot”), a San Francisco based a sset manager, is a member of the IBM Global Entrepreneur Progr am and developed AiPEX6 to provide investors access to the opportu nities that AI can uncover. EquBot was co - founded by the former Director of Engineering at Intel, was the first manager to develop an AI based ETF, and currently manages several funds and separate accounts for institutional investors. HSBC is one of the world’s largest banking and financial services companies, an award winning provider of US Structured Products, and is the exclusive licensor of the AiPEX suite of indexes.

9 Key Terms and Definitions Artificial Intelligence enables computers to do things normally requiring human intelligence, such as visual perception, speech recognition, interpretation of language, and decision - making Natural Language Processing is a branch of artificial intelligence that reads, deciphers, understands, and makes sense of human languages Machine Learning is a subset of artificial intelligence that gives computers the ability to learn without being explicitly programmed in order to identify patterns and make successful predictions Volatility is the range of price change a security experiences over a given period of time. If the price remains relatively stable, the security has low volatility and if the price moves erratically, the security has high volatility For more information on the AI Powered US Equity Index 6 (AiPEX6): Go to: aipex6.gbm.hsbc.com

The strategy tracked by AiPEX6 and the Base Index and the views implicit in AiPEX6 and the Base Index are not guaranteed to succeed. The strategies tracked by AiPEX 6 and its underlying index, the AI Powered US Equity Base Index (the “Base Index”), are not guaranteed to be successful . It is impossible to predict whether and the extent to which AiPEX 6 , the Base Index or the underlying constituents of the Base Index will yield positive or negative results . AiPEX 6 adjusts its exposure to the Base Index based on historical economic relationships which may not hold true in the future . You should seek your own advice as necessary to assess AiPEX 6 , the Base Index and their respective strategies . AiPEX6 and the Base Index were recently launched and have limited operating history. AiPEX 6 was launched on November 19 , 2019 and therefore has limited historical performance . The Base Index has also recently launched and has similarly limited historical performance . As a result, limited actual historical performance information is available for you to consider in making an independent investigation of AiPEX 6 , which may make it more difficult for you to evaluate the historical performance of AiPEX 6 and make an informed investment decision than would be the case if AiPEX 6 and the Base Index had a longer trading history . Hypothetical back - tested performance prior to the launch of AiPEX 6 and the Base Index provided in this document refers to simulated performance data created by applying AiPEX 6 ’s and the Base Index’s calculation methodologies to historical prices of the equities that comprise the Base Index and LIBOR levels . Such simulated performance data has been produced by the retroactive application of a back - tested methodology in hindsight, and may give more preference towards equities that have performed well in the past . Hypothetical back - tested results are neither an indicator nor a guarantor of future results . The hypothetical back - tested performance of AiPEX 6 prior to November 19 , 2019 cannot fully reflect the actual results that would have occurred had AiPEX 6 actually been calculated during that period, and should not be relied upon as an indication of AiPEX 6 ’s future performance . A longer history of actual performance could be helpful in providing more reliable information on which to assess AiPEX 6 . AiPEX6 may not approximate the Target Volatility. No assurance can be given that AiPEX 6 will maintain a realized volatility that approximates the Target Volatility, and the actual realized volatility of AiPEX 6 may be greater or less than the Target Volatility . AiPEX 6 seeks to maintain a realized volatility approximately equal to the Target Volatility of 6 % by rebalancing its exposures to the Base Index on each day based on two measures of realized volatility . However, there is no guarantee that trends exhibited by any such measures will continue in the future . The volatility - targeting feature may cause AiPEX6 to perform poorly during certain market conditions. AiPEX 6 allocates exposure to the Base Index based on two measures of realized volatility . Realized volatility is not the same as implied volatility, which is an estimation of future volatility, and may better reflect market volatility expectation . Because exposure is adjusted based on historic levels and trends, AiPEX 6 may not meaningfully reduce its exposure to the Base Index until a down - turn has already occurred, and by the time reduced exposure does take effect, the recovery may have already begun . AiPEX 6 varies its exposure to the Base Index . As a result, exposure to the Base Index may be limited and the performance of AiPEX 6 may be adversely affected . AiPEX 6 , on each day on which it is calculated, adjusts its exposure to the Base Index in an attempt to maintain a historical volatility approximately equal to the Target Volatility . If the exposure to the Base Index is less than 100 % , AiPEX 6 will include an uninvested position that does not earn interest or any other return . AiPEX 6 may include an uninvested position even when the Base Index is performing favorably . As a result, AiPEX 6 may underperform a similar index that does not include an uninvested position . The performance of AiPEX6 will be reduced by the performance of the reference rate and the embedded fees. AiPEX 6 is an excess return index . The return of AiPEX 6 is determined by reference to the performance of the Base Index (as adjusted based on the applicable exposure) in excess of the level of a reference rate, the USD 3 - month LIBOR rate . The level of AiPEX 6 also reflects an embedded index fee of 0 . 85 % per annum . The level of the reference rate and the embedded fees will offset, in whole or in part, any positive performance and increase any negative performance of the Base Index. As a result, any return on AiPEX 6 may be reduced or eliminated . When AiPEX 6 is uninvested (i . e . the exposure to the Base Index is less than 100 % ), the negative effect of the embedded fees will be magnified, and the return on AiPEX 6 may be negative even while the level of the Base Index increases . LIBOR reform may adversely affect the level of AiPEX6. A discontinuance of LIBOR or a change in its method of calculation could have a material adverse effect on the level of AiPEX6. The Base Index selects and weights its underlying constituents based on AI models ; the strategies and views implicit in such models and in the Base Index are not guaranteed to succeed . The strategy of the AI models, and therefore the Base Index, is not guaranteed to be successful . It is impossible to predict whether and the extent to which any underlying constituents of the Base Index will yield positive or negative results . The method by which the Base Index reweights the underlying constituents and the reallocation period may negatively affect the level of the Base Index . The underlying constituents are reviewed and the Base Index is rebalanced monthly . At the end of each month, the AI models are used to recalculate the AI scores for each eligible constituent, and these scores are used by the index sponsor to select and weight the underlying constituents, subject to pre - determined constraints . The weight of each underlying constituent selected from the eligible constituents is subject to a cap (equal to 7 . 50 % unless a lower cap is applicable based on the liquidity of such underlying) and any excess weight is allocated to the iShares® 1 - 3 Year Treasury Bond ETF (“the ETF Constituent”) . The allocation rules, including the cap, will be followed even where they limit the Base Index’s exposure to positively performing underlying constituents or increase the Base Index’s exposure to negatively performing underlying constituents, and may result in lower returns on the Base Index . The Base Index is exposed to equity risk, including from mid - capitalization companies. The Base Index is linked to the performance of the underlying constituents, which include U . S . large - capitalization and mid - capitalization stocks . The level of the Base Index can rise or fall sharply due to factors specific to the underlying constituents, such as stock price volatility, earnings and financial conditions, corporate, industry and regulatory developments, management changes and decisions and other events, as well as general market factors, such as general market volatility and levels, interest rates and economic and political conditions . Changes in U.S. Treasury rates and the perceived creditworthiness of the United States may affect the level of the Base Index. Because the value of the Base Index is linked, in part, to the ETF Constituent which tracks the value of U . S . Treasury bonds, changes in U . S . Treasury rates may affect the level of the Base Index . AiPEX6 and the Base Index are purely notional. The exposures to the underlying constituents are purely notional and will exist solely in the records maintained by or on behalf of Solactive AG . There is no actual portfolio of assets to which any person is entitled or in which any person has any ownership interest . Consequently, you will not have any claim against any of the underlying assets that are referenced by AiPEX 6 or the Base Index . Solactive AG administers, calculates and publishes AiPEX6 and the Base Index. Solactive AG has the authority to determine whether certain events affecting AiPEX 6 or the Base Index have occurred including, but not limited to, events affecting the reference rate or the underlying equity constituents of the Base Index . Potential investors in any financial instrument of which AiPEX 6 or the Base Index is an underlying need to be aware that any determination or calculation made by Solactive may affect the level of AiPEX 6 or the Base Index, as applicable, and, as appropriate, the performance of any instruments linked to the performance of AiPEX 6 or the Base Index . Solactive AG has no obligation to consider the interest of investors in any such instruments when making any determination or calculation . Such discretion in the decisions taken by Solactive AG (in the absence of manifest or proven error) are binding on all investors and holders of such instruments . The level of the Base Index, and therefore AiPEX 6 , may be determined by reference to the SPDR® S&P 500 ® ETF (“SPY”) if the AI models become unavailable . In the event that EquBot Inc . , the provider of the AI models, no longer provides the applicable AI scores with respect to the eligible constituents, the shares of SPY will be selected as the sole underlying constituent of the Base Index with a weight of 100 % . In such an event, the value of the Base Index, and therefore AiPEX 6 , will be determined by reference to SPY . Risks Associated with the AI Powered US Equity Index 6 (“AiPEX6”)
D i s c l o s u r e HSBC USA Inc . and HSBC Bank USA, N . A . (together, “HSBC”), are members of the HSBC Group . Any member of the HSBC Group may from time to time underwrite, make a market or otherwise buy and sell, as principal, structured investments, or together with their directors, officers and employers may have either long or short positions in the structured investments, or stocks, commodities or currencies to which the structured investments are linked, or may perform or seek to perform investment banking services for those linked assets mentioned herein . These activities may be in conflict with the interests of investors of debt obligations or certificates of deposit issued by members of the HSBC Group . The Index may be partially uninvested . The strategy tracks the excess return of a notional dynamic basket of equities and cash over the ICE LIBOR USD 3 Month interest rate . The weight of a Cash Investment (if any) for a Monthly Reference Portfolio at any given time represents the portion of the Monthly Reference Portfolio that is uninvested in the applicable equity basket at that time . As such, any allocation to a Cash Investment within the Index, which also accrues at the ICE LIBOR USD 3 Month interest rate, will not affect the level of the Index . The Index will reflect no return for any uninvested portion (i . e . , any portion represented by a Cash Investment) . Accordingly, to the extent that the Index is allocated to the Cash Investment, it may not reflect the full increase of any relevant equity component . Under certain circumstances, the Index may be 100 % allocated to the Cash Investment . Important Disclaimer Information This brochure is for informational purposes only and intended to provide a general overview of the Index and does not provide the terms of any specific issuance of structured investments . The material presented does not constitute and should not be construed as a recommendation to enter into a securities or derivatives transaction . Prior to any decision to invest in a specific structured investment, investors should carefully review the disclosure documents for such issuance which contains a detailed explanation of the terms of the issuance as well as the risks, tax treatment and other relevant information . Investing in financial instruments linked to the Index is not equivalent to a direct investment in any part of the Index . Investments linked to the Index require investors to assess several characteristics and risk factors that may not be present in other types of transactions . In reaching a determination as to the appropriateness of any proposed transaction, clients should undertake a thorough independent review of the legal, regulatory, credit, tax, accounting and economic consequences of such transaction in relation to their particular circumstances . This brochure contains market data from various sources other than us and our affiliates, and, accordingly, we make no representation or warranty as to the market data’s accuracy or completeness and we are not obligated to update any market data presented in this brochure . All information is subject to change without notice . We or our affiliated companies may make a market or deal as principal in the investments mentioned in this brochure or in options, futures or other derivatives based thereon . This brochure discusses a number of different HSBC entities and you should fully inform yourself about the specific HSBC issuer prior to making any investment in its debt obligations or certificates of deposit . HSBC Holdings plc, HSBC North America Holdings Inc . and other affiliated entities are not liable for any of the obligations of HSBC USA Inc . or HSBC Bank USA, N . A . HSBC USA Inc . has filed a registration statement (including a prospectus and prospectus supplement) with the Securities and Exchange Commission for any offering to which this free writing prospectus may relate . Before you invest, you should read the prospectus and prospectus supplement in that registration statement and other documents HSBC USA Inc . has filed with the SEC for more complete information about HSBC USA Inc . and any related offering . You may get these documents for free by visiting EDGAR on the SEC’s web site at www . sec . gov . Alternatively, HSBC Securities (USA) Inc . or any dealer participating in the related offering will arrange to send you the prospectus and prospectus supplement if you request them by calling toll - free 1 - 866 - 811 - 8049 . Solactive AG Solactive AG is the administrator and calculation agent of the Index . The financial instruments that are based on the Index are not sponsored, endorsed, promoted or sold by Solactive AG in any way and Solactive AG makes no express or implied representation, guarantee or assurance with regard to : (a) the advisability in investing in the financial instruments ; (b) the quality, accuracy and/or completeness of the Index ; and/or (c) the results obtained or to be obtained by any person or entity from the use of the Index . Solactive AG does not guarantee the accuracy and/or the completeness of the Index and shall not have any liability for any errors or omissions with respect thereto . Solactive AG reserves the right to change the methods of calculation or publication and Solactive AG shall not be liable for any miscalculation of or any incorrect, delayed or interrupted publication with respect to the Index . Solactive AG shall not be liable for any damages, including, without limitation, any loss of profits or business, or any special, incidental, punitive, indirect or consequential damages suffered or incurred as a result of the use (or inability to use) of the Index . Use of Simulated Returns The Index was launched on November 19 , 2019 and therefore has limited historical performance . The Base Index has also recently launched and has similarly limited historical performance . As a result, limited actual historical performance information is available for you to consider in making an independent investigation of the Index, which may make it difficult for you to evaluate the historical performance of the Index and make an informed investment decision than would be the case if the Index and the Base Index had a longer trading history . Hypothetical back - tested performance prior to the launch of the Index and the Base Index provided in this brochure refers to simulated performance data created by applying the Index and the Base Index’s calculation methodologies to historical prices of the underlying constituents and the reference rate . Such simulated performance data has been produced by the retroactive application of a back - tested methodology in hindsight, and may give more preference towards underlying constituents that have performed well in the past . Hypothetical back - tested results are neither an indicator nor a guarantor of future results . The hypothetical back - tested performance of the Index prior to November 19 , 2019 cannot fully reflect the actual results that would have occurred had the Index actually been calculated during that period, and should not be relied upon as an indication of the Index’s future performance . Because of the lack of actual historical performance data, your investment in any structured investment linked to the Index may involve a greater risk than investing in a security or other instrument linked to one or more indices with an established record of performance . HSBC operates in various jurisdictions through its affiliates, including, but not limited to, HSBC Securities (USA) Inc . , member of NYSE, FINRA and SIPC . © 2022 HSBC USA Inc . All rights reserved . All Sources : Solactive, EquBot, HSBC, Bloomberg, from 12 / 30 / 2011 through 12 / 31 / 2021
Serious News for Serious Traders! Try StreetInsider.com Premium Free!
You May Also Be Interested In
- HSBC Upgrades UPS (UPS) to Buy, 'Back to earnings growth'
- Hong Kong Exchange (388:HK) (HKXCY) PT Lowered to HK$270 at HSBC
- Marex Group (MRX) Prices 15.38M Share IPO at $19/sh
Create E-mail Alert Related Categories
SEC FilingsRelated Entities
HSBCSign up for StreetInsider Free!
Receive full access to all new and archived articles, unlimited portfolio tracking, e-mail alerts, custom newswires and RSS feeds - and more!
