

Form FWP HSBC USA INC /MD/ Filed by: HSBC USA INC /MD/
 Tweet
Tweet Share
Share
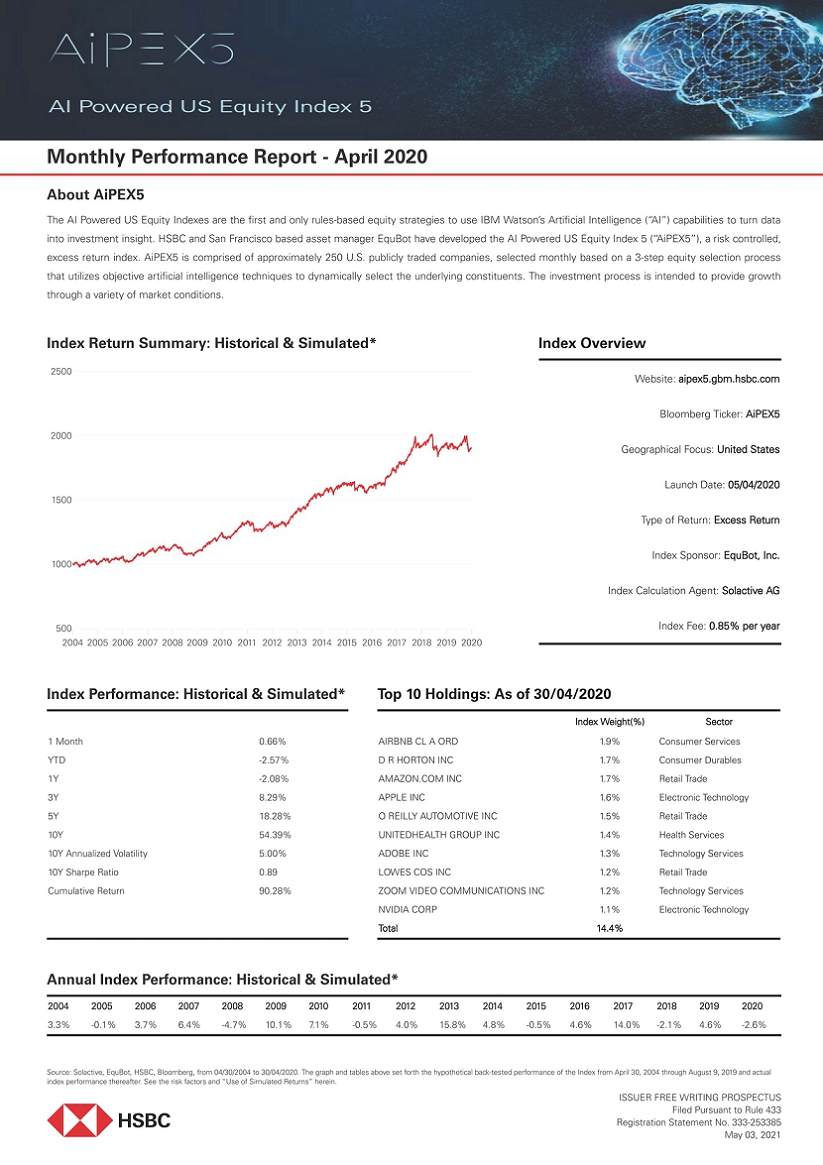
Monthly Performance Report - April 2020About AiPEX5 The AI Powered US Equity Indexes are the first and only rules-based equity strategies to use IBM Watson’s Artificial Intelligence (“AI”) capabilities to turn data into investment insight. HSBC and San Francisco based asset manager EquBot have developed the AI Powered US Equity Index 5 (“AiPEX5”), a risk controlled, excess return index. AiPEX5 is comprised of approximately 250 U.S. publicly traded companies, selected monthly based on a 3-step equity selection process that utilizes objective artificial intelligence techniques to dynamically select the underlying constituents. The investment process is intended to provide growth through a variety of market conditions.Index Return Summary: Historical & Simulated*2500200015001000500Index OverviewWebsite: aipex5.gbm.hsbc.com Bloomberg Ticker: AiPEX5 Geographical Focus: United States Launch Date: 05/04/2020 Type of Return: Excess Return Index Sponsor: EquBot, Inc. Index Calculation Agent: Solactive AG Index Fee: 0.85% per year2004 2005 2006 2007 2008 2009 2010 2011 2012 2013 2014 2015 2016 2017 2018 2019 2020Index Performance: Historical & Simulated* Top 10 Holdings: As of 30/04/2020Index Weight(%) Sector1 Month 0.66%YTD -2.57%1Y -2.08%3Y 8.29%5Y 18.28%10Y 54.39%10Y Annualized Volatility 5.00% 10Y Sharpe Ratio 0.89 Cumulative Return 90.28%AIRBNB CL A ORD 1.9% Consumer ServicesD R HORTON INC 1.7% Consumer DurablesAMAZON.COM INC 1.7% Retail TradeAPPLE INC 1.6% Electronic TechnologyO REILLY AUTOMOTIVE INC 1.5% Retail TradeUNITEDHEALTH GROUP INC 1.4% Health ServicesADOBE INC 1.3% Technology ServicesLOWES COS INC 1.2% Retail TradeZOOM VIDEO COMMUNICATIONS INC 1.2% Technology Services NVIDIA CORP 1.1% Electronic Technology Total 14.4%Annual Index Performance: Historical & Simulated*2004 2005 2006 2007 2008 2009 2010 2011 2012 2013 2014 2015 2016 2017 2018 2019 20203.3% -0.1% 3.7% 6.4% -4.7% 10.1% 7.1% -0.5% 4.0% 15.8% 4.8% -0.5% 4.6% 14.0% -2.1% 4.6% -2.6%Source: Solactive, EquBot, HSBC, Bloomberg, from 04/30/2004 to 30/04/2020. The graph and tables above set forth the hypothetical back-tested performance of the Index from April 30, 2004 through August 9, 2019 and actual index performance thereafter. See the risk factors and “Use of Simulated Returns” herein.ISSUER FREE WRITING PROSPECTUS Filed Pursuant to Rule 433 Registration Statement No. 333-253385 May 03, 2021

Monthly Performance Report - April 2020Top 10 Sector Allocations Contributions to Return0% 5% 10% 15% 20% 25% 30% 0% 0.5% 1% 1.5%Commercial Services5.12% 1.29%Commercial Services0.16% 0.11%Consumer Durables5.71% 2.82%Consumer Durables0.21% 0.13%Consumer Non-Durables5.39% 4.87%Consumer Non-Durables0.05% 0.08%Consumer Services6.25% 5.12%Consumer Services0.09% 0.14%Electronic Technology9.20% 13.01%Electronic Technology0.21%0.49%Finance14.84% 15.85%Finance0.73%1.08%Health Technology8.19% 10.09%Health Technology0.16% 0.38%Producer Manufacturing4.25% 3.95%Producer Manufacturing0.05% 0.10%Retail TradeTechnology Services8.22%12.85%14.46% 20.23%Retail TradeTechnology Services0.42% 0.64%0.50%1.54%PortfolioSolactive US Large & Mid Cap IndexPortfolioSolactive US Large & Mid Cap IndexDaily Risk Control Allocation - Historical & Simulated*As of 30/04/2020 3Y Average 5Y Average 10Y Average Equity Portfolio 8.28% 40.14% 39.48% 36.34% Cash 91.72% 59.86% 60.52% 63.66%Source: Solactive, EquBot, HSBC, Bloomberg, from 04/30/2004 to 30/04/2020. The graph and tables above set forth the hypothetical back-tested performance of the Index from April 30, 2004 through August 9, 2019 and actual index performance thereafter. See the risk factors and “Use of Simulated Returns” herein.Risks Relating to the IndexHSBC USA Inc. and HSBC Bank USA, N.A. (together, “HSBC”), are members of the HSBC Group. Any member of the HSBC Group may from time to time underwrite, make a market or otherwise buy and sell, as principal, structured investments, or together with their directors, officers and employers may have either long or short positions in the structured investments, or stocks, commodities or currencies to which the structured investments are linked, or may perform or seek to perform investment banking services for those linked assets mentioned herein. These activities maybe in conflict with the interests of investors of debt obligations or certificates of deposit issued by members of the HSBC Group. The Index may be partially uninvested. The strategy tracks the excess return of a notional dynamic basket of equities and cash over a change in the ICE LIBOR USD 3 Month interest rate. The weight of a Cash Investment (if any) for a Monthly Reference Portfolio at any given time represents the portion of the Monthly Reference Portfolio that is uninvested in the applicable equity basket at that time. As such, any allocation to a Cash Investment within the Index, which also accrues at the ICE LIBOR USD 3 Month interest rate, will not affect the level of the Index. The Index will reflect no return for any uninvested portion (i.e., any portion represented by a Cash Investment). Accordingly, to the extent that the Index is allocated to the Cash Investment, it may not reflect the full increase of any relevant equity component. Under certain circumstances, the Index may be 100% allocated to the Cash Investment. Important Disclaimer Information This document is for informational purposes only and intended to provide a general overview of the AI Powered US Equity Index and does not provide the terms of any specific issuance of structured investments. The material presented does not constitute and should not be construed as a recommendation to enter into a securities or derivatives transaction. Prior to any decision to invest in a specific structured investment, investors should carefully review the disclosure documents for such issuance which contains a detailed explanation of the terms of the issuance as well as the risks, tax treatment and other relevant information. Investing in financial instruments linked to the AI Powered US Equity Index is not equivalent to a direct investment in any part of the AI Powered US Equity Index. Investments linked to the AI Powered US Equity Index require investors to assess several characteristics and risk factors that may not be present in other types of transactions. In reaching a determination as to the appropriateness of any proposed transaction, clients should undertake a thorough independent review of the legal, regulatory, credit, tax, accounting and economic consequences of such transaction in relation to their particular circumstances. This brochure contains market data from various sources other than us and our affiliates, and, accordingly, we make no representation or warranty as to the market data’s accuracy or completeness and we are not obligated to update any market data presented in this document. All information is subject to change without notice. We or our affiliated companies may make a market or deal as principal in the investments mentioned in this document or in options, futures or other derivatives based thereon. Solactive AG Solactive AG is the administrator and calculation agent of the AI Powered US Equity Index. The financial instruments that are based on the AI Powered US Equity Index are not sponsored, endorsed, promoted or sold by Solactive AG in any way and Solactive AG makes no express or implied representation, guarantee or assurance with regard to: (a) the advisability in investing in the financial instruments; (b) the quality, accuracy and/or completeness of the Index; and/or (c) the results obtained or to be obtained by any person or entity from the use of the Index. Solactive AG does not guarantee the accuracy and/or the completeness of the AIPowered US Equity Index and shall not have any liability for any errors or omissions with respect thereto. Solactive AG reserves the right to change the methods of calculation or publication and Solactive AG shall not be liable for any miscalculation of or any incorrect, delayed or interrupted publication with respect to the AI Powered US Equity Index. Solactive AG shall not be liable for any damages, including, without limitation, any loss of profits or business, or any special, incidental, punitive, indirect or consequential damages suffered or incurred as a result of the use (or inability to use) of the AI Powered US Equity Index. Use of Simulated Returns Any historical performance information included in this document prior to August 9, 2019 represents only hypothetical historical results. No representation is being made that the AI Powered US Equity Index will achieve a performance record similar to that shown. In fact, there may often be sharp differences between hypothetical performance and actual performance. Back-testing and other statistical analysis material provided to you in connection with the explanations of the potential returns associated with an investment in a debt obligation or certificate of deposit linked to the AI Powered US Equity Index use simulated analysis and hypothetical assumptions in order to illustrate the manner in which the AI Powered US Equity Index may have performed in periods prior to the actual existence of the AI Powered US Equity Index. Alternative modelling techniques or assumptions may produce different hypothetical information that might prove to be more appropriate and that might differ significantly from the hypothetical information set forth above. The back-tested data was produced by applying the AI Powered US Equity Index methodology to historical data, including information and sources available at each specific point of time in history. New information and sources were incorporated one timestep at a time and only information with validated time stamps was considered. The results obtained from “back-testing” information should not be considered indicative of actual results that might be obtained from an investment or participation in a financial instrument or transaction referencing the AI Powered US Equity Index. You should not place undue reliance on the “back-testing” information, which is provided for illustrative purposes only. HSBC provides no assurance or guarantee that the AI Powered US Equity Index will operate or would have operated in the past in a manner consistent with the results presented in these materials. Hypothetical back-tested results are neither an indicator nor a guarantee of future returns. Actual results will vary, perhaps materially, from the analysis implied in the hypothetical information. You should review and consider the hypothetical information only with the full AI Powered US Equity Index methodology. HSBC USA Inc. has filed a registration statement (including a prospectus and prospectus supplement) with the Securities and Exchange Commission for any offering to which this free writing prospectus may relate. Before you invest, you should read the prospectus and prospectus supplement in that registration statement and other documents HSBC USA Inc. has filed with the SEC for more complete information about HSBC USA Inc. and any related offering. You may get these documents for free by visiting EDGAR on the SEC’s web site at www.sec.gov. Alternatively, HSBC Securities (USA) Inc. or any dealer participating in the related offering will arrange to send you the prospectus and prospectus supplement if you request them by calling toll-free 1-866-811-8049. HSBC operates in various jurisdictions through its affiliates, including, but not limited to, HSBC Securities (USA) Inc., member of NYSE, FINRA, and SIPC. Ⓒ 2020 HSBC USA Inc. All rights reserved.
Serious News for Serious Traders! Try StreetInsider.com Premium Free!
You May Also Be Interested In
- HSBC says Microsoft's valuation remains 'attractive'
- NetEase.com (NTES) PT Lowered to $126 at HSBC
- Marex Group (MRX) Prices 15.38M Share IPO at $19/sh
Create E-mail Alert Related Categories
SEC FilingsRelated Entities
HSBCSign up for StreetInsider Free!
Receive full access to all new and archived articles, unlimited portfolio tracking, e-mail alerts, custom newswires and RSS feeds - and more!
