

Form 8-K Walker & Dunlop, Inc. For: May 19
 Tweet
Tweet Share
ShareExhibit 99.1
| May 19, 2022 |

| 2 Forward-Looking Statements Some of the statements contained in this presentation may constitute forward-looking statements within the meaning of the federal securities laws. Forward-looking statements relate to expectations, projections, plans and strategies, anticipated events or trends and similar expressions concerning matters that are not historical facts. In some cases, you can identify forward-looking statements by the use of forward-looking terminology such as ''may,'' ''will,'' ''should,'' ''expects,'' ''intends,'' ''plans,'' ''anticipates,'' ''believes,'' ''estimates,'' ''predicts,'' or ''potential'' or the negative of these words and phrases or similar words or phrases that are predictions of or indicate future events or trends and which do not relate solely to historical matters. You can also identify forward-looking statements by discussions of strategy, plans or intentions. The forward-looking statements contained in this presentation reflect our current views about future events and are subject to numerous known and unknown risks, uncertainties, assumptions and changes in circumstances that may cause actual results to differ significantly from those expressed or contemplated in any forward-looking statement. While forward-looking statements reflect our good faith projections, assumptions and expectations, they are not guarantees of future results. Furthermore, we disclaim any obligation to publicly update or revise any forward-looking statement to reflect changes in underlying assumptions or factors, new information, data or methods, future events or other changes, except as required by applicable law. Factors that could cause our results to differ materially include, but are not limited to: (1) general economic conditions and multifamily and commercial real estate market conditions, (2) regulatory and/or legislative changes to Freddie Mac, Fannie Mae or HUD, (3) our ability to retain and attract loan originators and other professionals, (4) risks related to our recently completed acquisitions, including our ability to integrate and achieve the expected benefits of such acquisitions, and (5) changes in federal government fiscal and monetary policies, including any constraints or cuts in federal funds allocated to HUD for loan originations. For a further discussion of these and other factors that could cause future results to differ materially from those expressed or contemplated in any forward-looking statements, see the section titled ''Risk Factors" in our most recent Annual Report on Form 10-K, as it may be updated or supplemented by our subsequent Quarterly Reports on Form 10-Q and other SEC filings. Such filings are available publicly on our Investor Relations web page at www.walkerdunlop.com. Non-GAAP Financial Measures To supplement our financial statements presented in accordance with United States generally accepted accounting principles (“GAAP”), the Company uses adjusted EBITDA and estimated Alliant adjusted EBITDA, each a non- GAAP financial measure. The presentation of adjusted EBITDA is not intended to be considered in isolation or as a substitute for, or superior to, the financial information prepared and presented in accordance with GAAP. When analyzing our operating performance, readers should use adjusted EBITDA in addition to, and not as an alternative for, net income. Adjusted EBITDA represents net income before income taxes, interest expense on our term loan facility and Alliant’s note payable, and amortization and depreciation, adjusted for provision (benefit) for credit losses net of write-offs, stock-based incentive compensation charges, the fair value of expected net cash flows from servicing, net, and the gain associated with the revaluation of our previously held equity-method investment in connection with our acquisition of GeoPhy. In addition, adjusted EBITDA further excludes the impact of the acquisition of CWCapital and deal-related expenses, integration and restructuring costs, severance and lease restructuring charges related to our fourth quarter 2013 expense reduction efforts, early extinguishment of our term loan facility, and revenues from the termination fee related to the transfer of servicing for a portion of the small loan portfolio that are not considered part of our ongoing operations. Estimated adjusted EBITDA for Alliant presented in this presentation represents estimated Alliant net income before income taxes, interest expense on estimated incremental debt associated with our acquisition of Alliant, including an estimated increase to our corporate debt and Alliant’s existing debt assumed by us upon closing of the acquisition, and amortization and depreciation, adjusted for provision (benefit) for credit losses net of write-offs, stock-based incentive compensation charges, and non-cash revenues such as the fair value of expected net cash flows from servicing, net. Because not all companies use identical calculations, our presentation of adjusted EBITDA may not be comparable to similarly titled measures of other companies. Furthermore, adjusted EBITDA is not intended to be a measure of free cash flow for our management's discretionary use, as it does not reflect certain cash requirements such as tax and debt service payments. The amounts shown for adjusted EBITDA may also differ from the amounts calculated under similarly titled definitions in our debt instruments, which are further adjusted to reflect certain other cash and non-cash charges that are used to determine compliance with financial covenants. We use adjusted EBITDA to evaluate the operating performance of our business, for comparison with forecasts and strategic plans, and for benchmarking performance externally against competitors. We believe that this non-GAAP measure, when read in conjunction with our GAAP financials, provides useful information to investors by offering: − the ability to make more meaningful period-to-period comparisons of the Company's on-going operating results; − the ability to better identify trends in the Company's underlying business and perform related trend analyses; and − a better understanding of how management plans and measures the Company's underlying business. We believe that adjusted EBITDA has limitations in that it does not reflect all of the amounts associated with the Company's results of operations as determined in accordance with GAAP and that adjusted EBITDA should only be used to evaluate the Company's results of operations in conjunction with net income. For information on adjusted EBITDA, refer to the appendix of this presentation. Estimated adjusted EBITDA for Alliant presented in this presentation represents estimated Alliant net income before income taxes, interest expense on estimated incremental debt associated with our acquisition of Alliant, including an estimated increase to our corporate debt and Alliant’s existing debt assumed by us upon closing of the acquisition, and amortization and depreciation, adjusted for provision (benefit) for credit losses net of write-offs, stock-based incentive compensation charges, and non-cash revenues such as the fair value of expected net cash flows from servicing, net. For information on Estimated adjusted EBITDA, refer to the appendix of this presentation. |
| WELCOME WILLY WALKER Chairman & CEO |

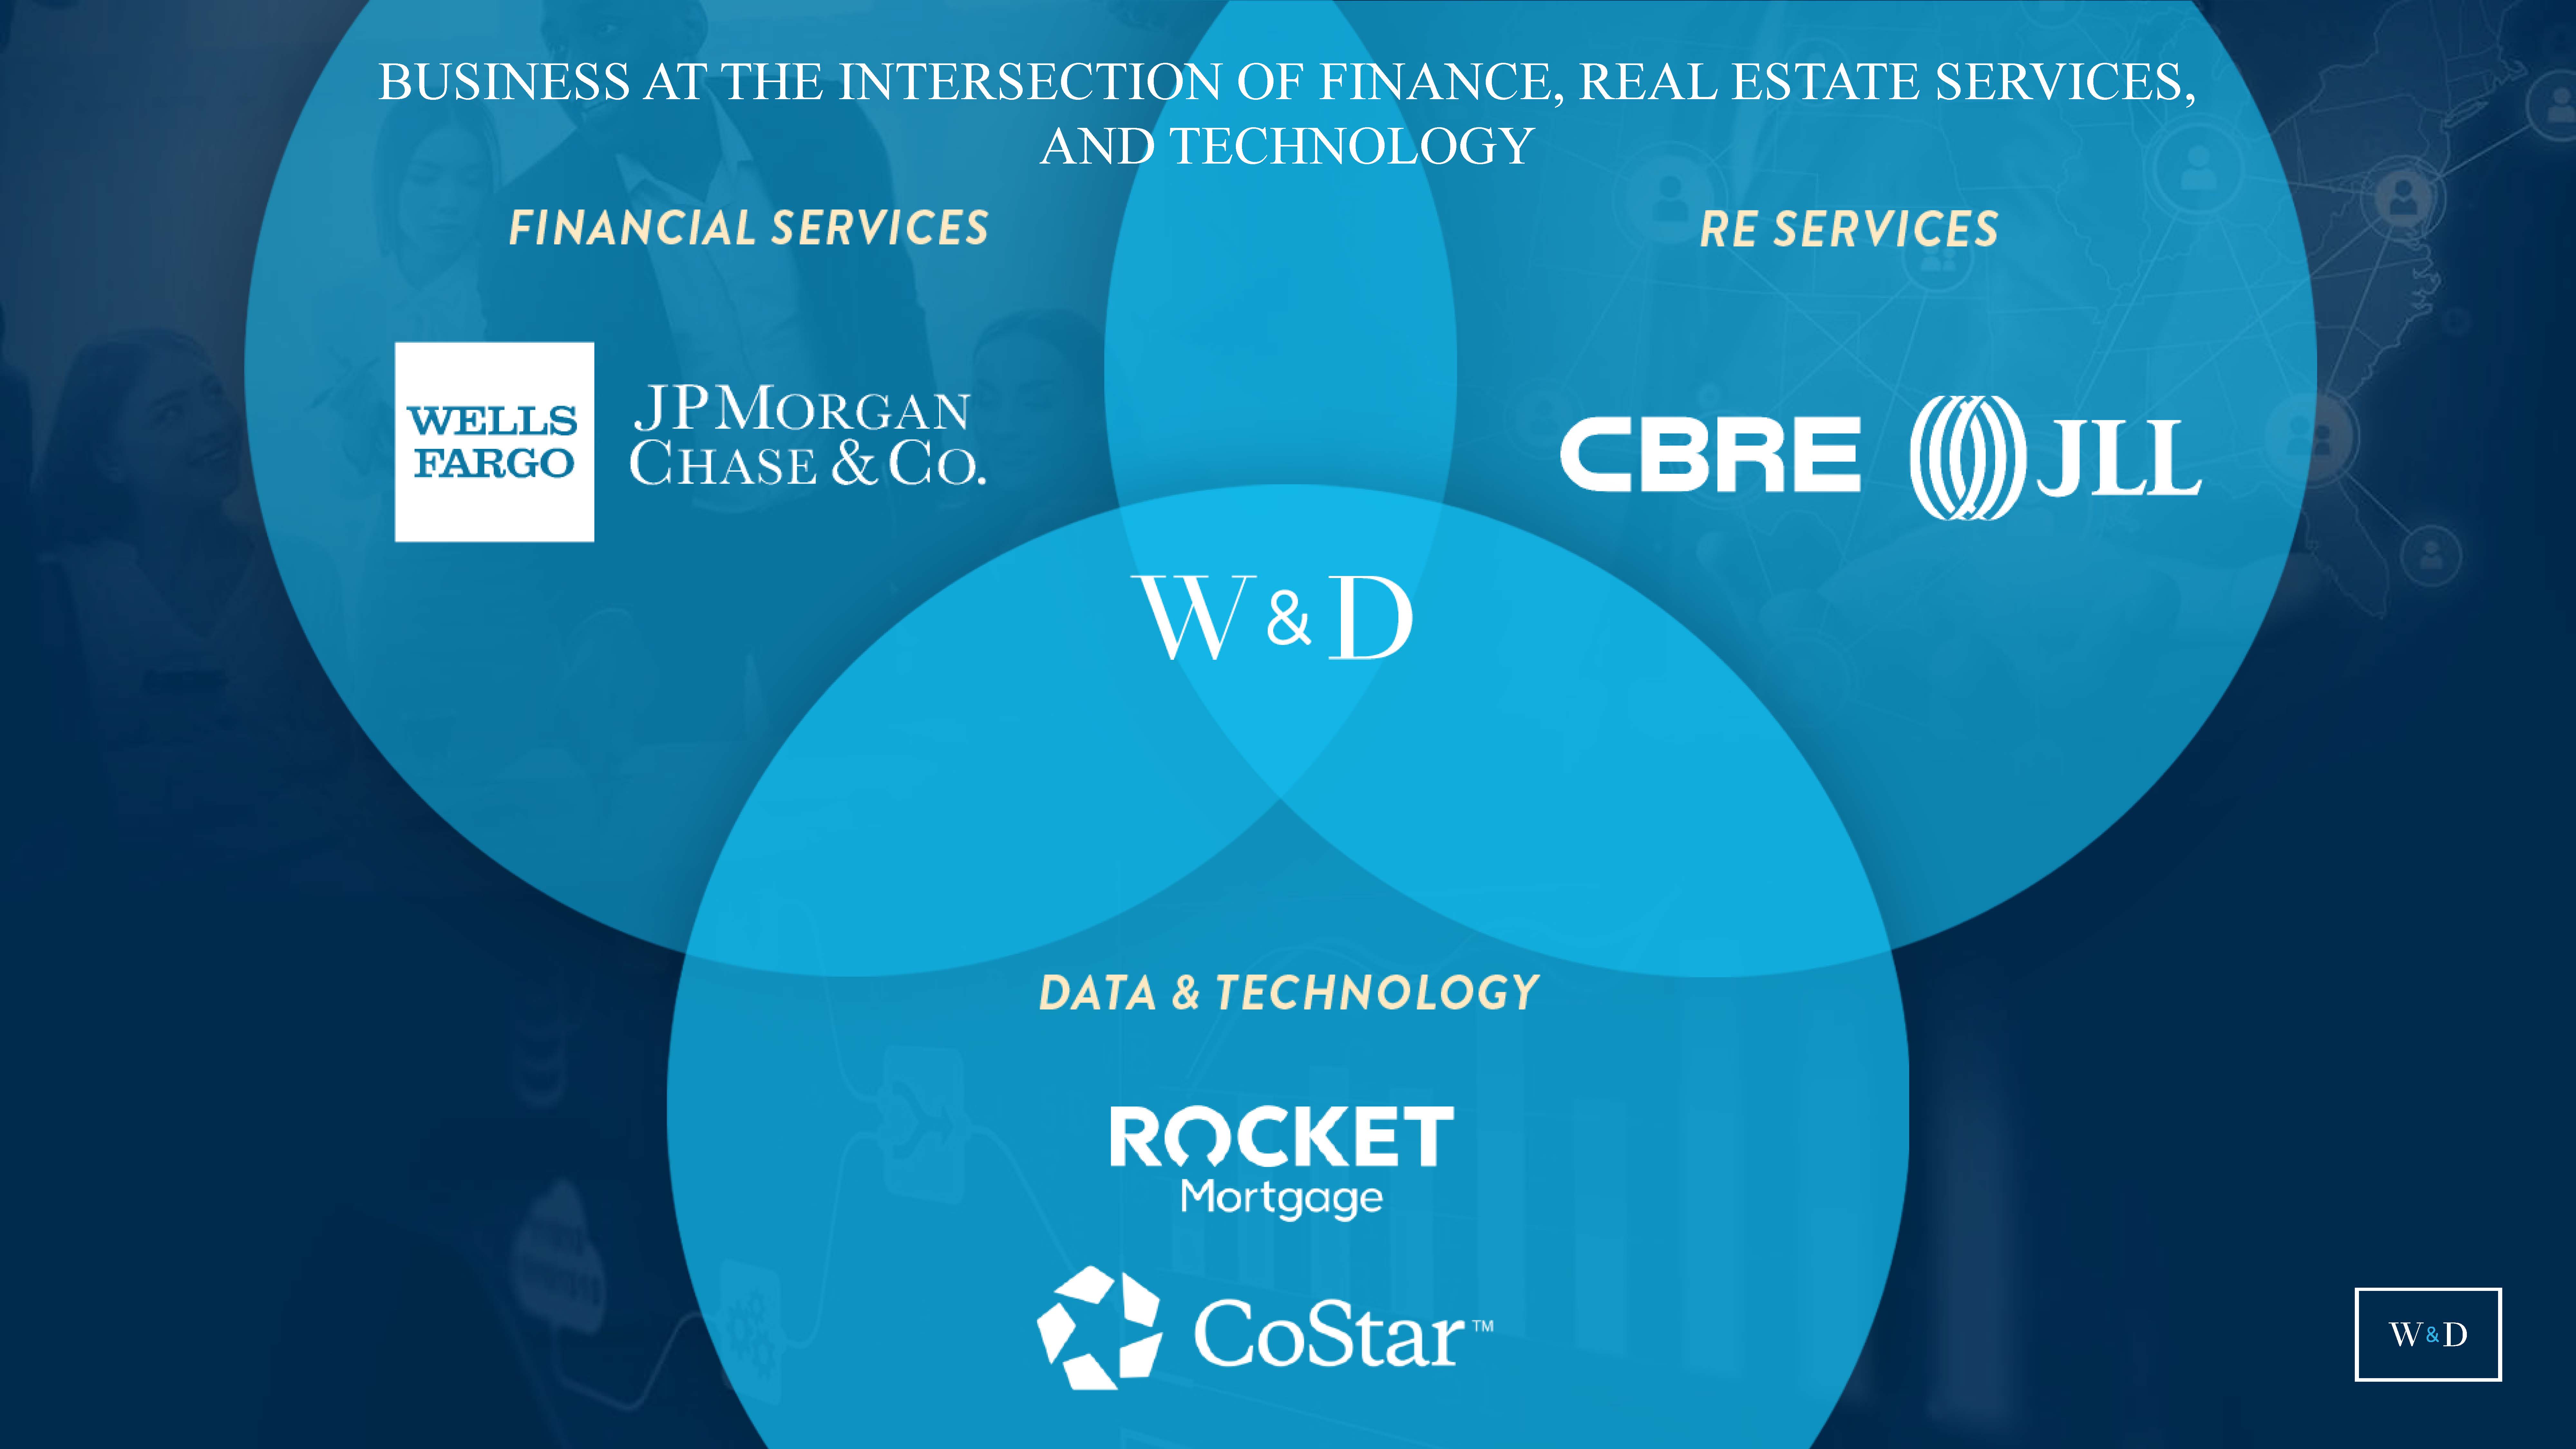
| BUSINESS AT THE INTERSECTION OF FINANCE, REAL ESTATE SERVICES, AND TECHNOLOGY 4 |
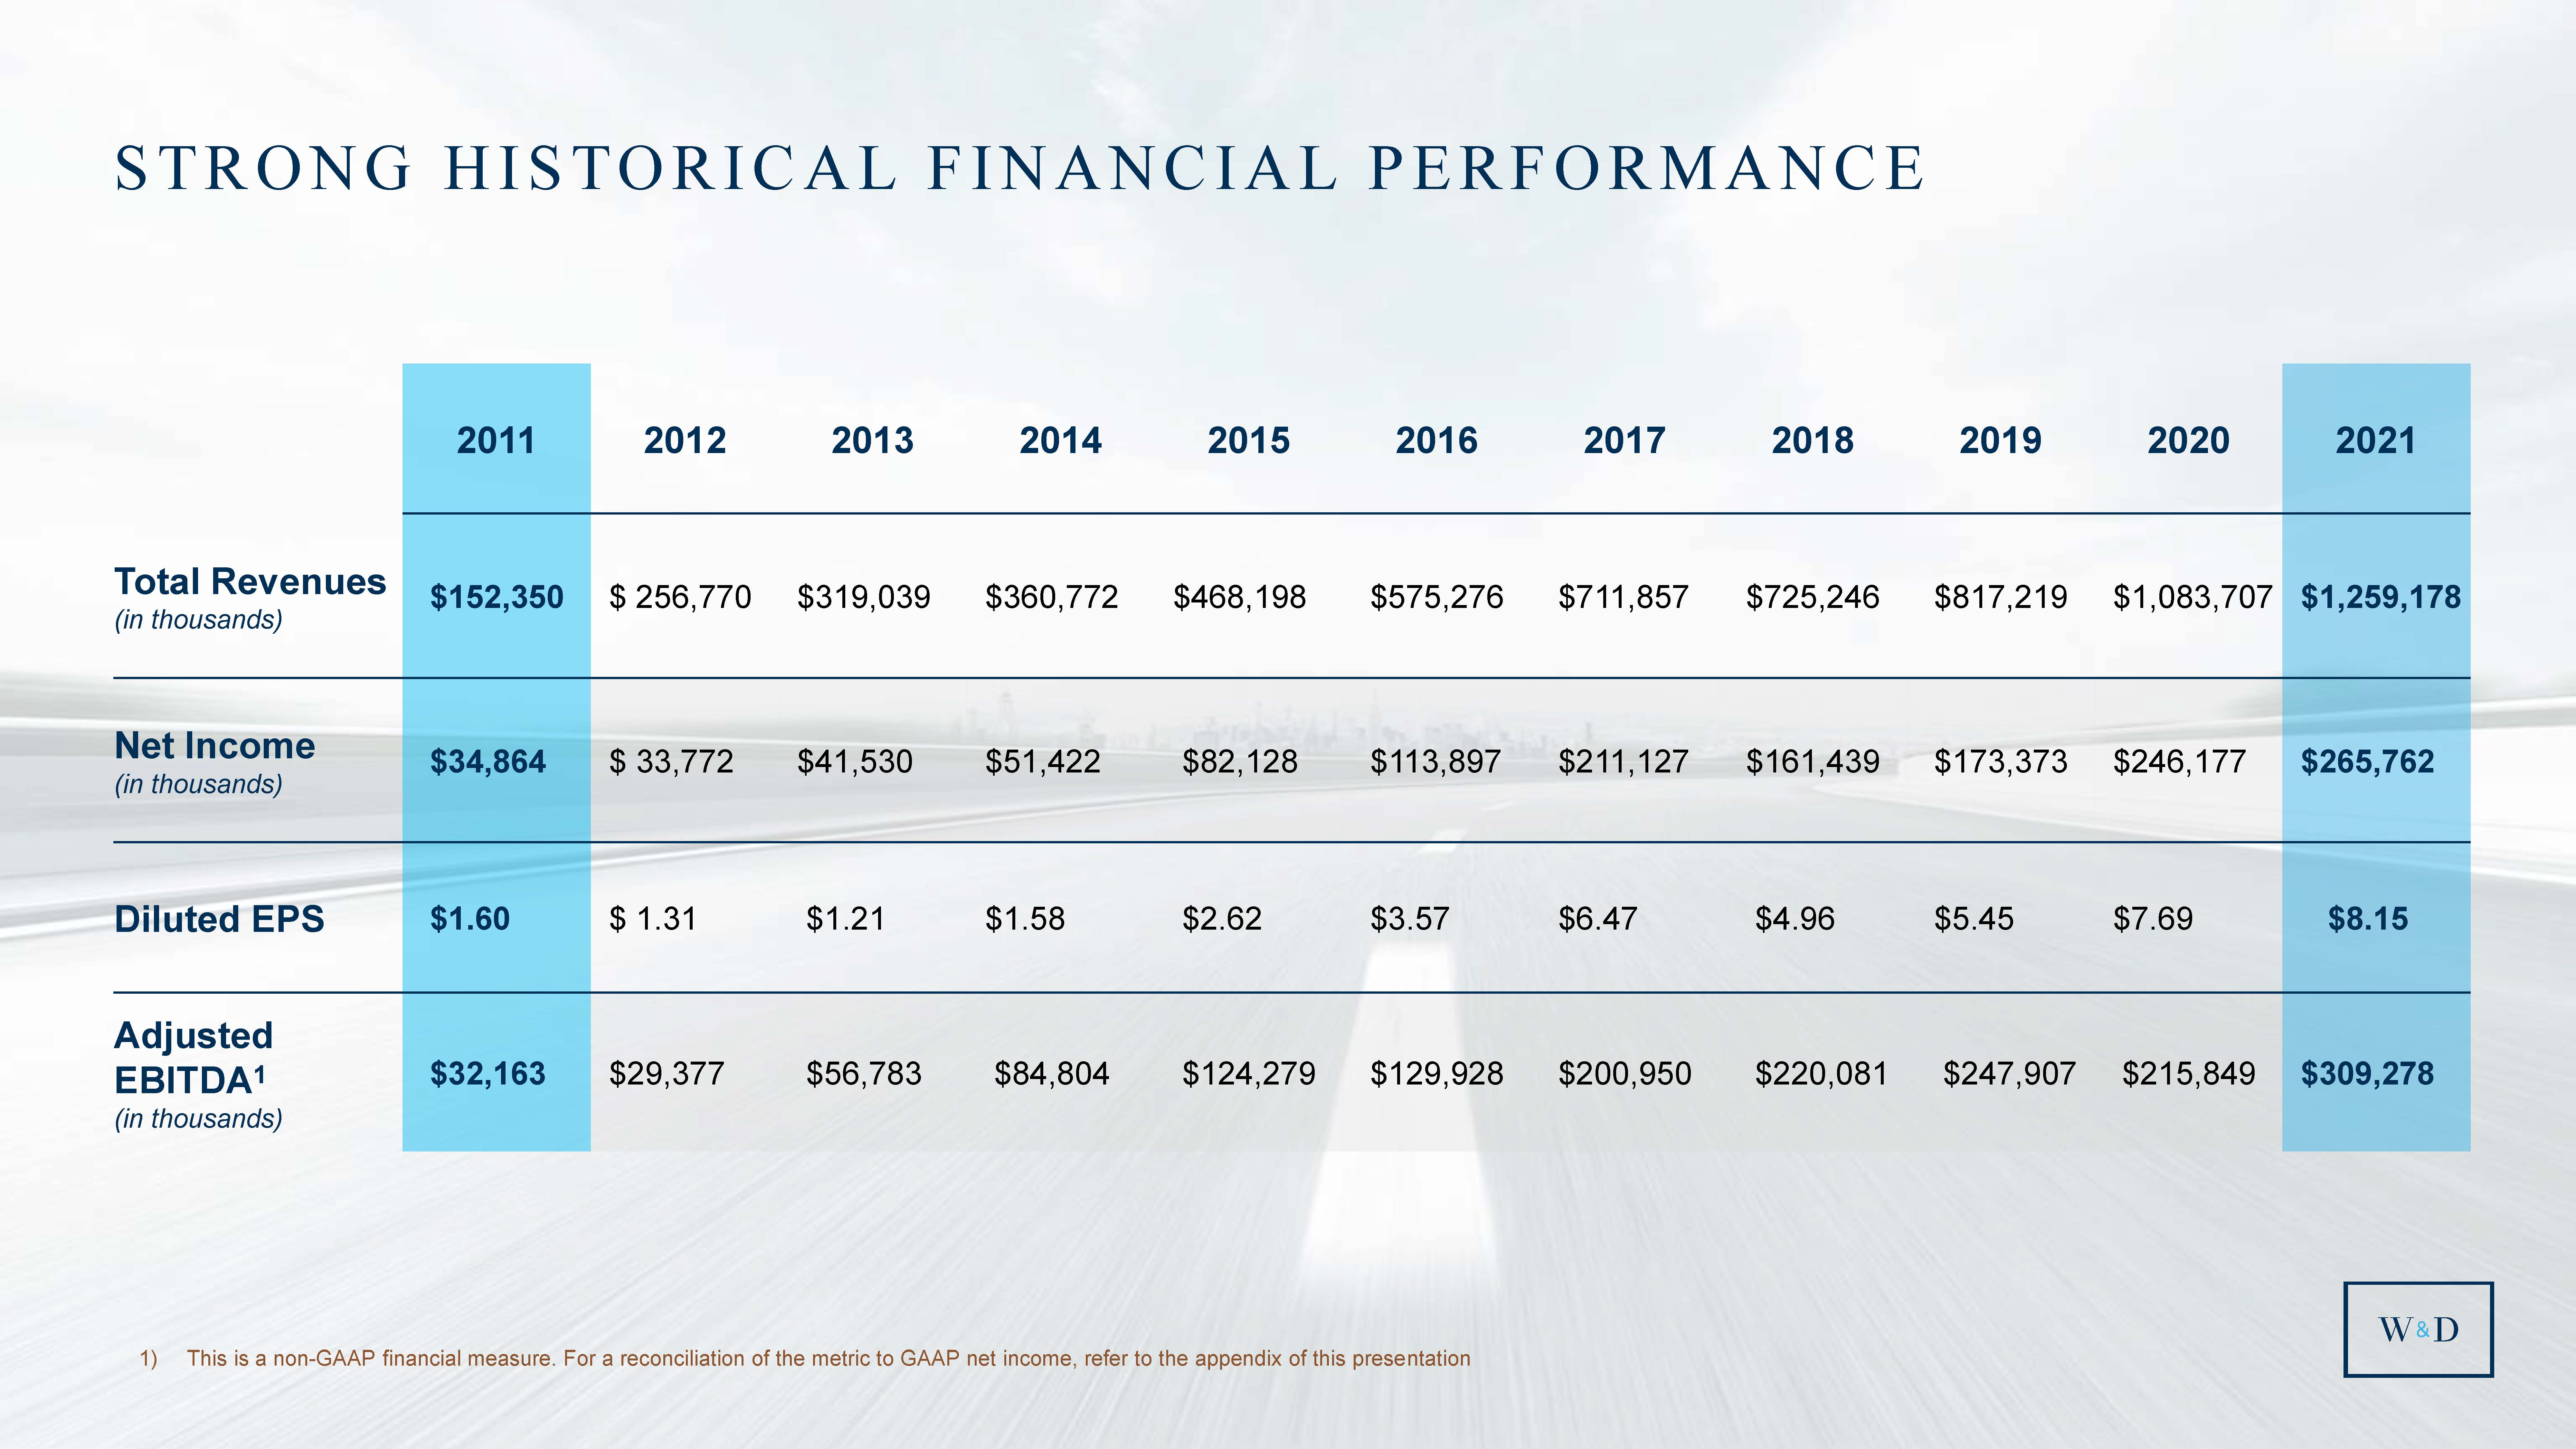
| 2011 2012 2013 2014 2015 2016 2017 2018 2019 2020 2021 Total Revenue (in thousands) $152,350 $ 256,770 $319,039 $360,772 $468,198 $575,276 $711,857 $725,246 $817,219 $1,083,707 $1,259,178 Net Income (in thousands) $34,864 $ 33,772 $41,530 $51,422 $82,128 $113,897 $211,127 $161,439 $173,373 $246,177 $265,762 Diluted EPS $1.60 $ 1.31 $1.21 $1.58 $2.65 $3.57 $6.47 $4.96 $5.45 $7.69 $8.15 Adjusted EBITDA (in thousands) $32,163 $29,377 $56,783 $84,804 $124,279 $129,928 $$200,950 $220,081 $247,907 $215,849 $309,278 STRONG HISTORICAL FINANCIAL PERFORMANCE 1) This is a non-GAAP financial measure. For a reconciliation of the metric to GAAP net income, refer to the appendix of this presentation 5 |
| 6 Vulnerability is the birthplace of innovation, creativity and change." - BRENE BROWN 6 |

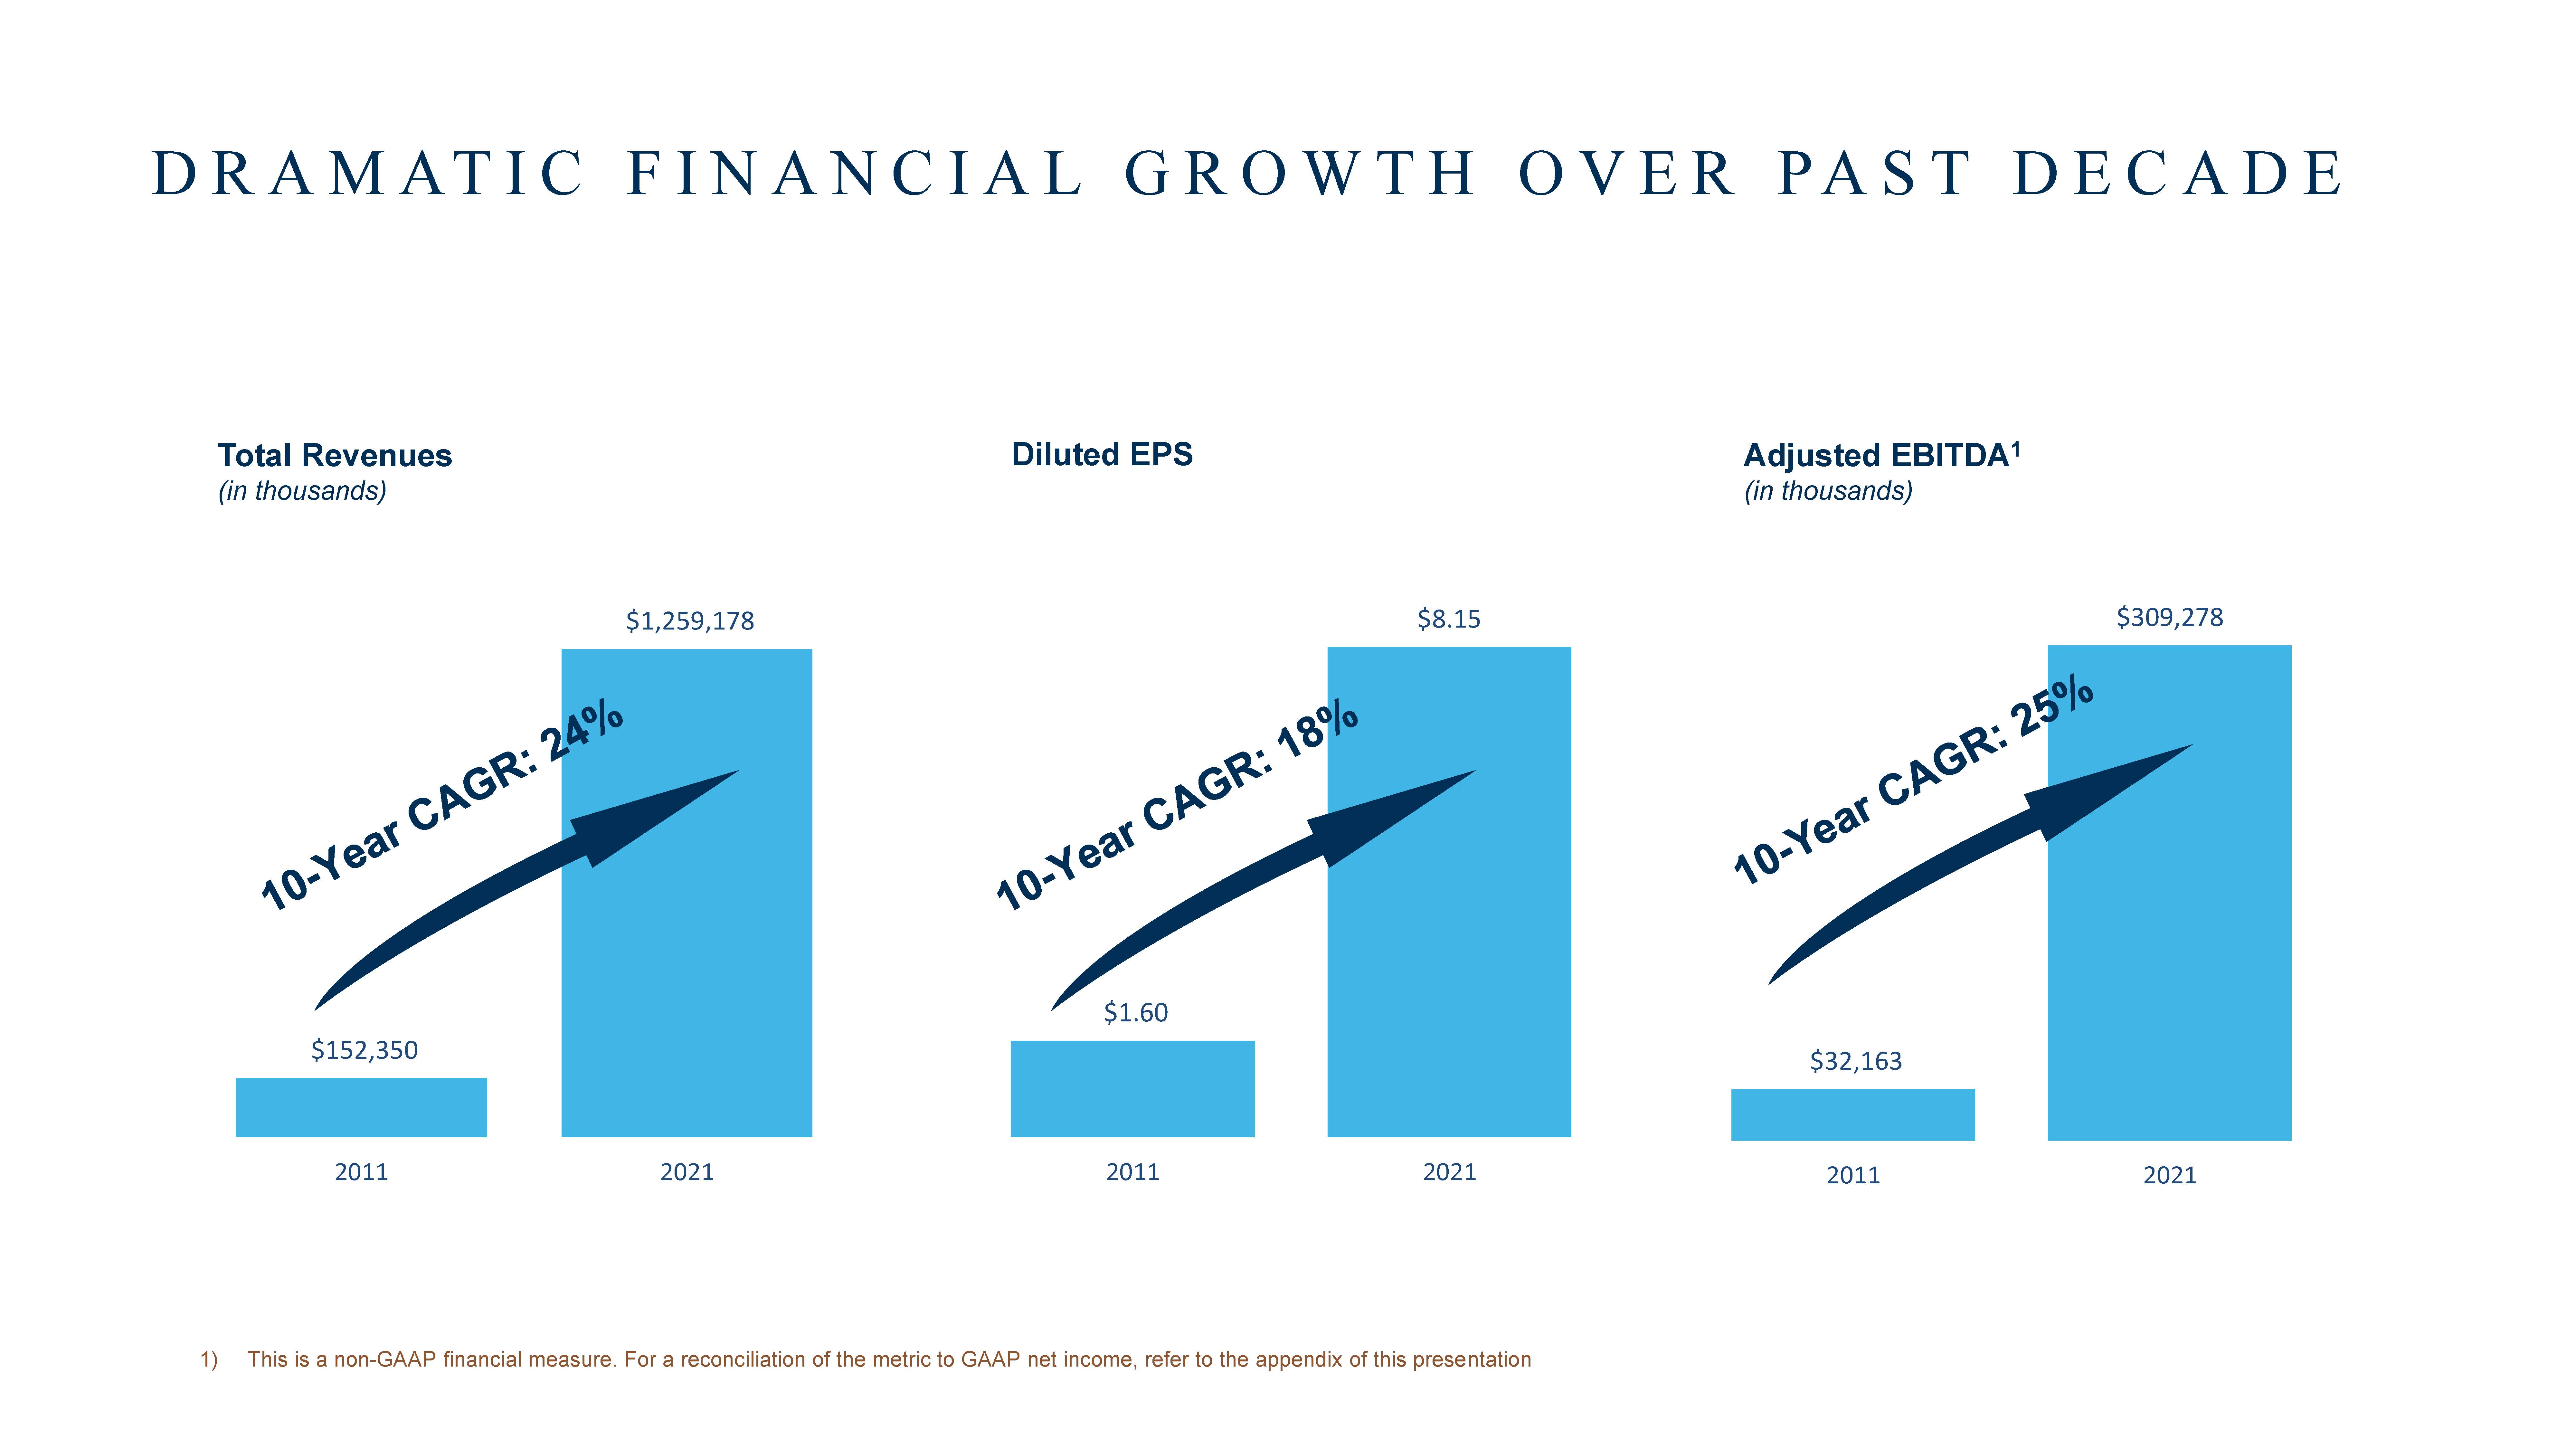
| $1.60 $8.15 2011 2021 $152,350 $1,259,178 2011 2021 7 Total Revenues (in thousands) Diluted EPS Adjusted EBITDA1 (in thousands) $32,163 $309,278 2011 2021 1) This is a non-GAAP financial measure. For a reconciliation of the metric to GAAP net income, refer to the appendix of this presentation DRAMATIC FINANCIAL GROWTH OVER PAST DECADE |
| INSERT CSH VIDEO STILL OR IMAGE OF MURAL 8 |

| WHERE WE ARE GOING GROW DEBT FINANCING VOLUME GROW PROPERTY SALES VOLUME GROW INVESTMENT BANKING AND ASSET MANAGEMENT BUSINESSES ENVIRONMENTAL, SOCIAL AND GOVERNANCE $60B+ Origination Volume / $5B+ Small Balance Loans / $160B Servicing Portfolio $25B+ Sales Volume $10B+ Assets Under Management Increase Diverse Leadership / Reduce Carbon Emission / Donate 1% of Pre-Tax Profits / Grow Affordable Lending 10 |

| AGENDA Introduction – Willy Walker Investment Banking/Research – Ivy Zelman Small Balance Lending – Alison Williams Apprise – Meghan Czechowski GeoPhy and Technology – Teun van den Dries Alliant and Affordable Housing – Sheri Thompson Bringing All of W&D to our Clients – Kelly Mitchell Operating Performance – Steve Theobald Segment Reporting – Greg Florkowski Closing Remarks – Willy Walker Q&A 11 |

| IVY ZELMAN Chief Executive Officer, Zelman & Associates INVESTMENT BANKING & RESEARCH |

| ALISON WILLIAMS SVP & Chief Production Officer, Small Balance Lending SMALL BALANCE LENDING “SBL” |

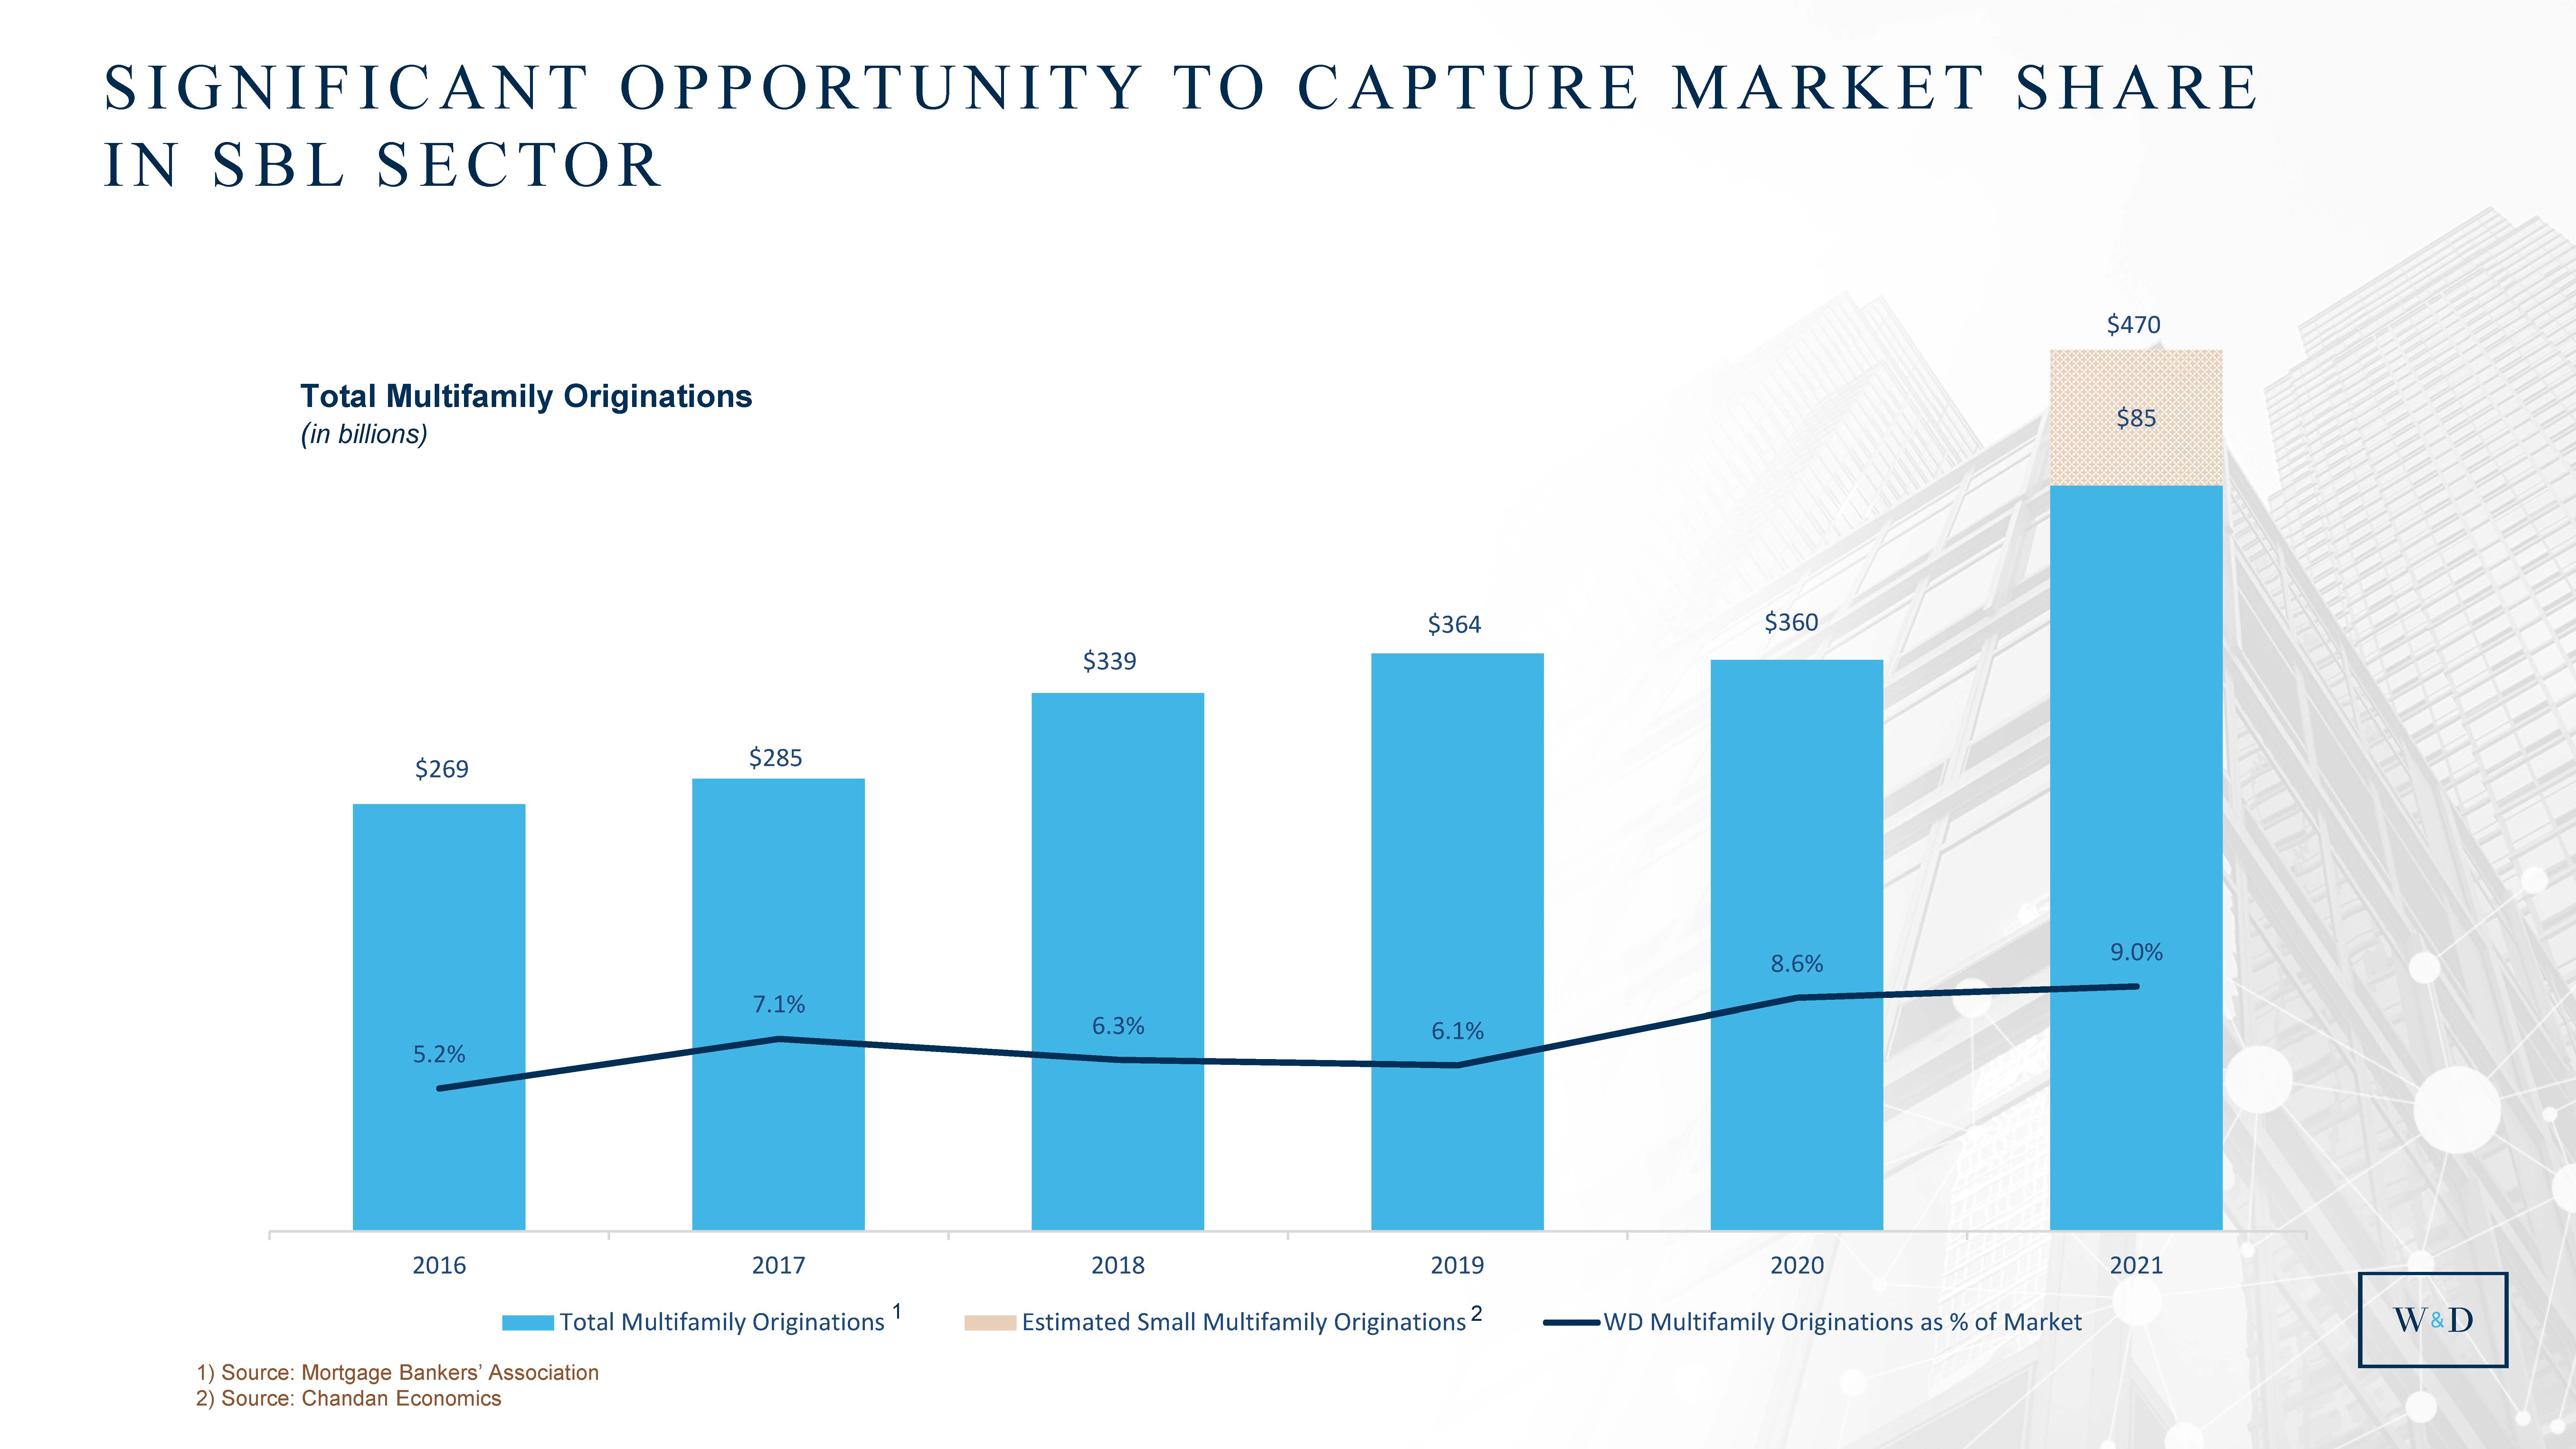
| $470 billion Total Multifamily Origination Volume $85 billion Estimated Small Multifamily Origination Volume $269 $285 $339 $364 $360 $470 $85 5.2% 7.1% 6.3% 6.1% 8.6% 9.0% 2016 2017 2018 2019 2020 2021 Total Multifamily Originations Estimated Small Multifamily Originations WD Multifamily Originations as % of Market SIGNIFICANT OPPORTUNITY TO CAPTURE MARKET SHARE IN SBL SECTOR 14 Total Multifamily Originations (in billions) 1) Source: Mortgage Bankers’ Association 2) Source: Chandan Economics 1 2 |
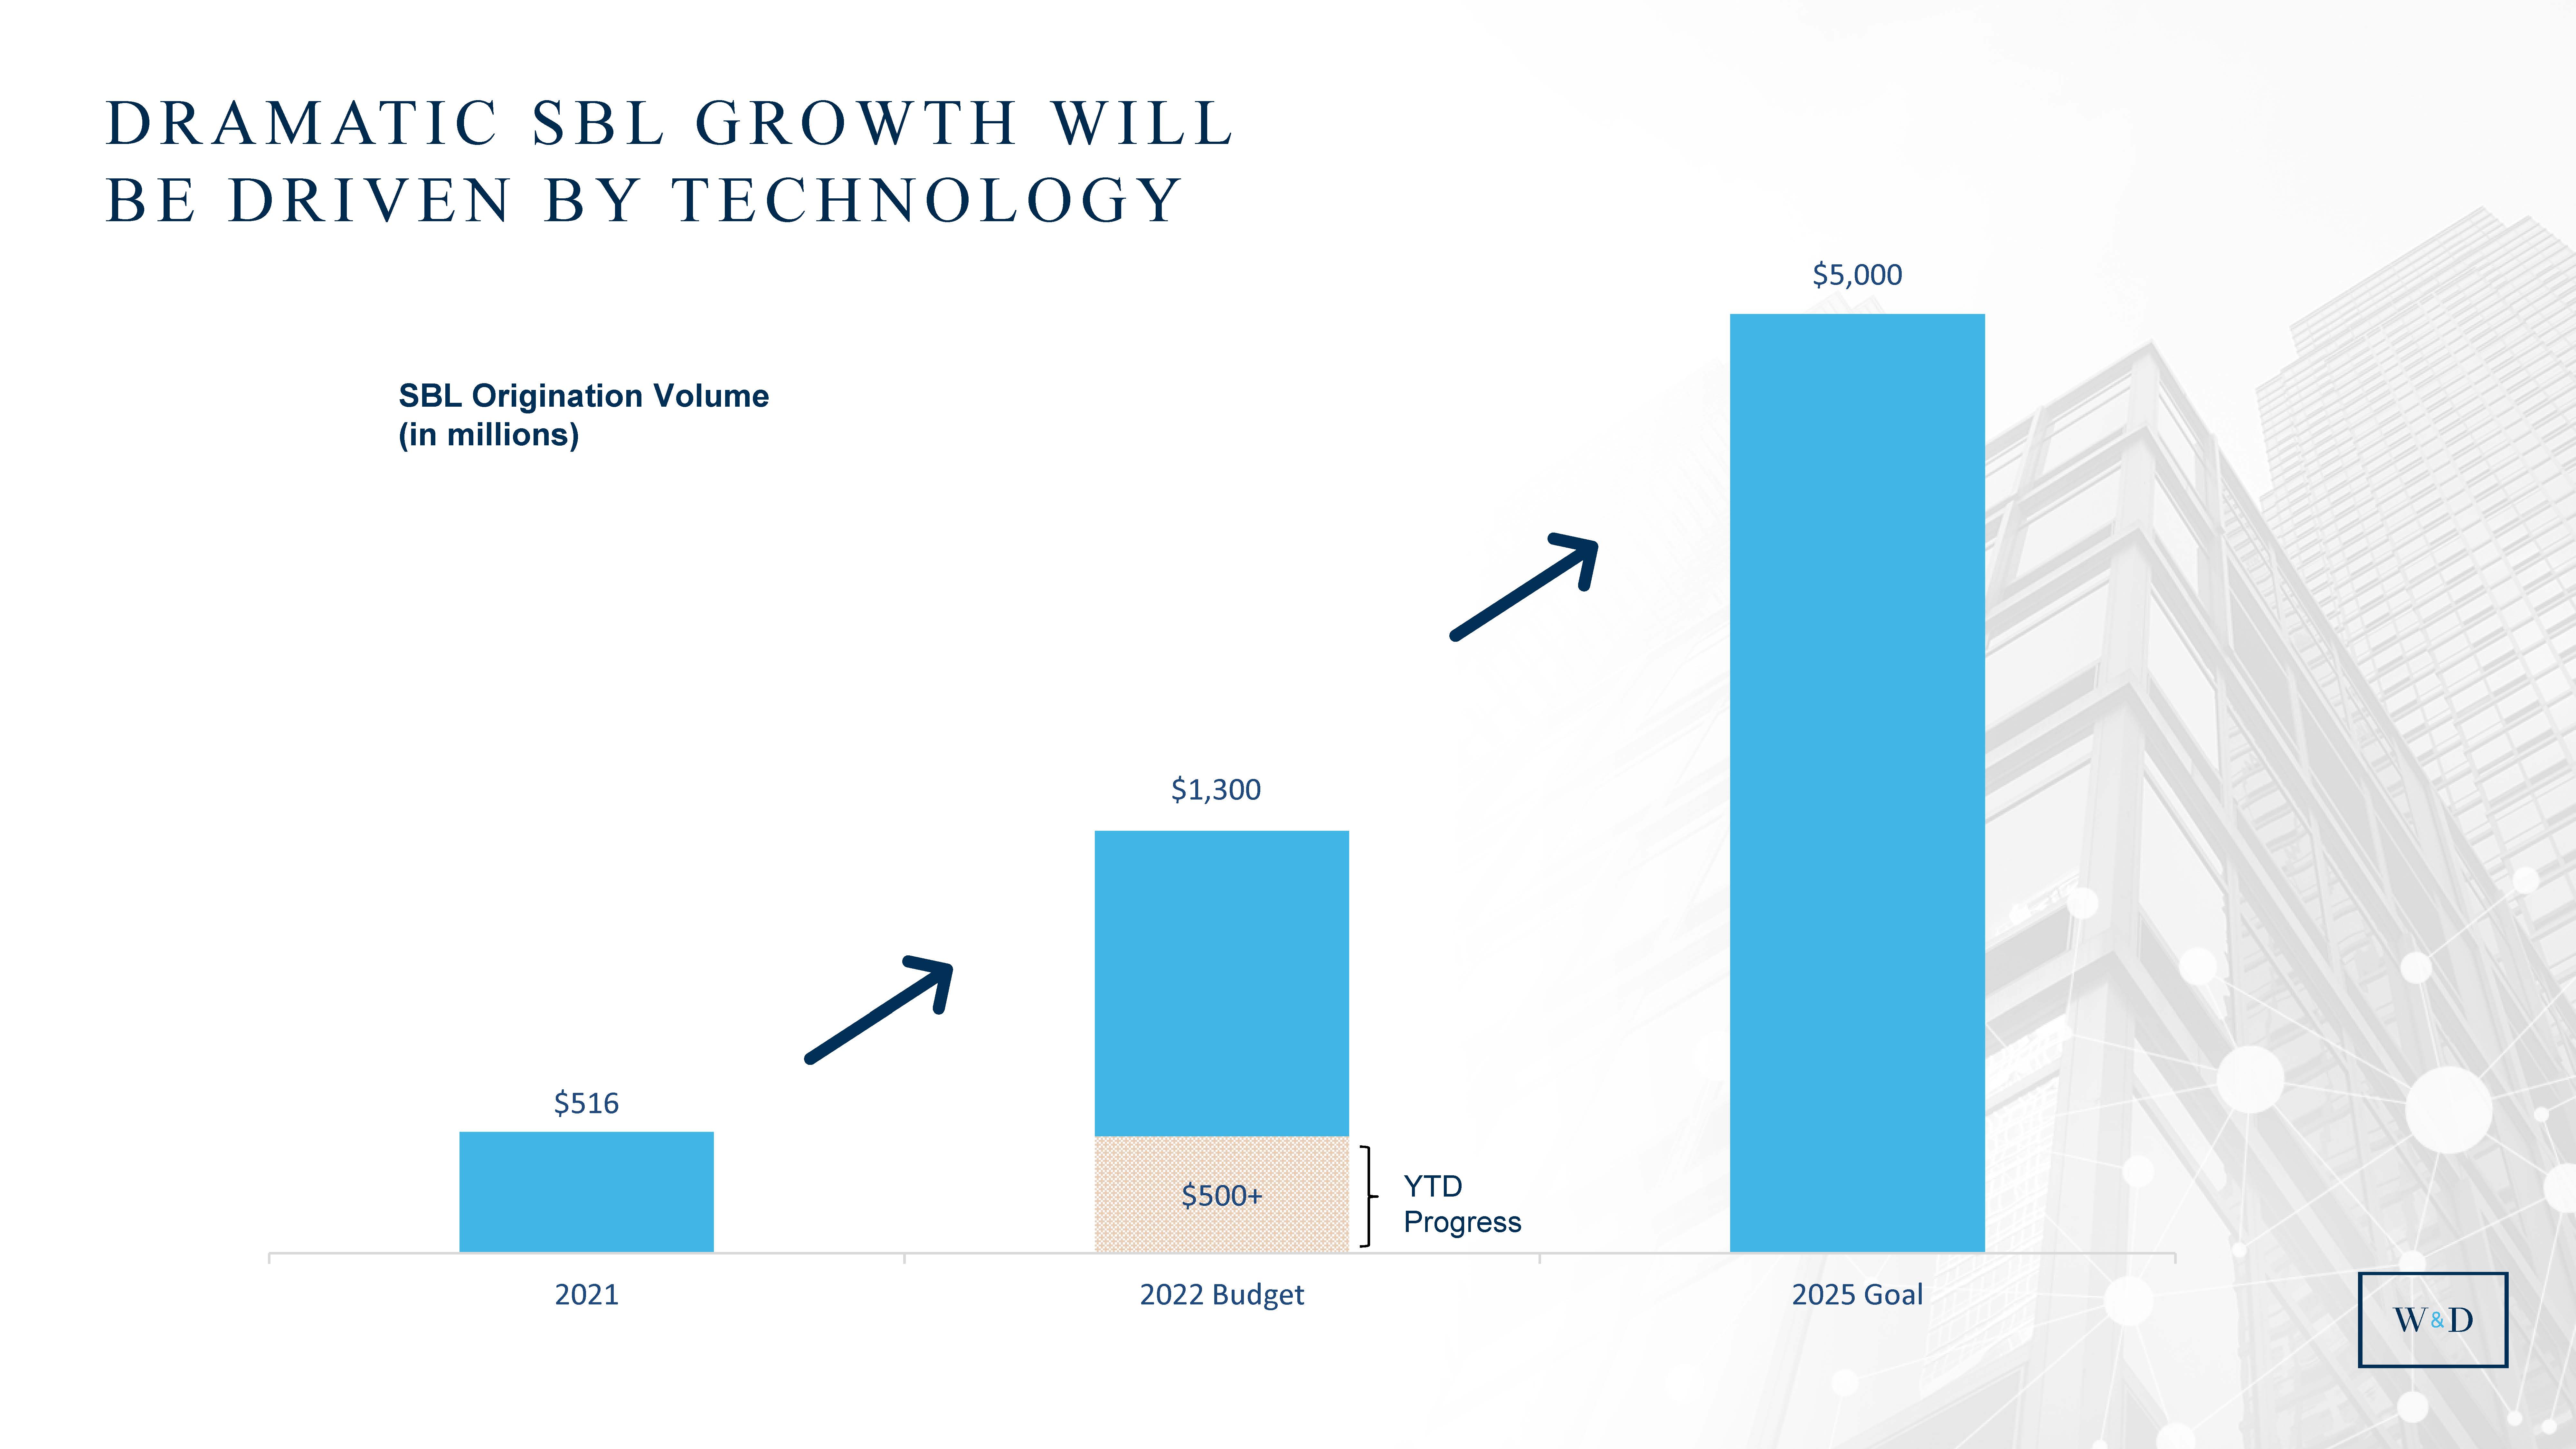
| DRAMATIC SBL GROWTH WILL BE DRIVEN BY TECHNOLOGY SBL Origination Volume (in millions) $500+ $516 $1,300 $5,000 2021 2022 Budget 2025 Goal YTD Progress 15 |
| 16 |

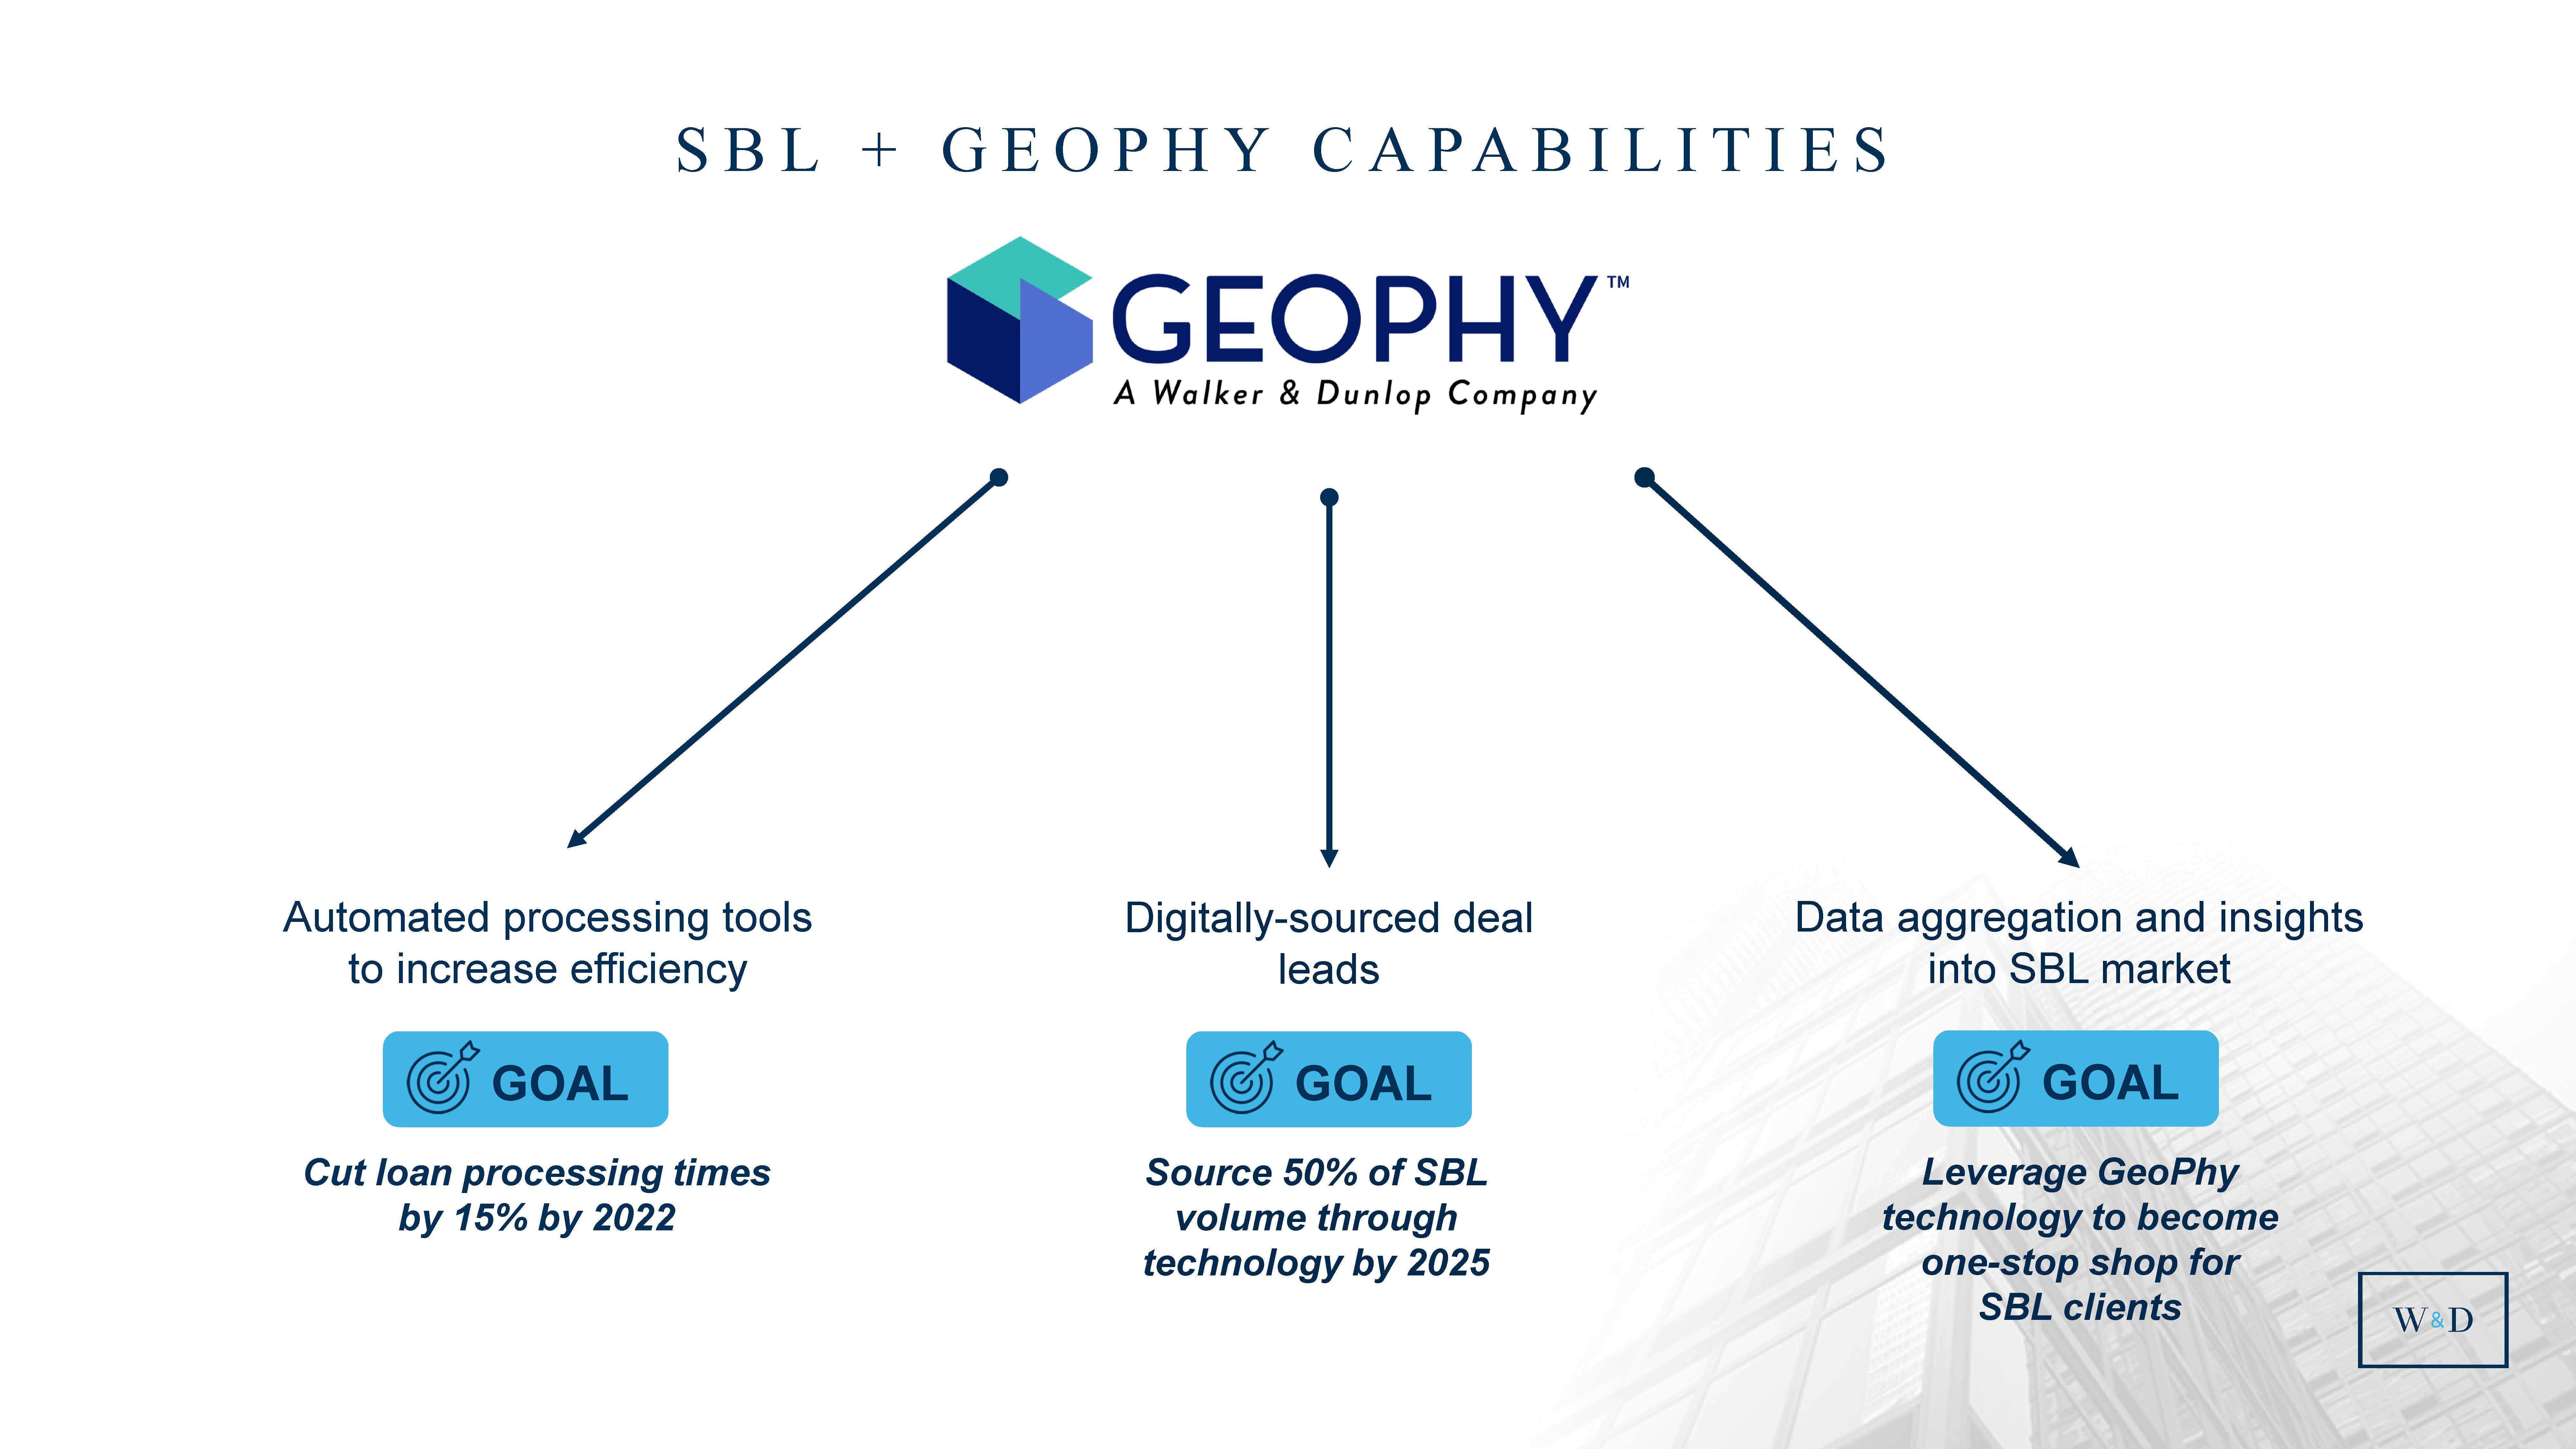
| SBL + GEOPHY CAPABILITIES Automated processing tools to increase efficiency Digitally-sourced deal leads Data aggregation and insights into SBL market GOAL Cut loan processing times by 15% by 2022 GOAL Source 50% of SBL volume through technology by 2025 GOAL Leverage GeoPhy technology to become one-stop shop for SBL clients 17 |
| MEGHAN CZECHOWSKI Senior Vice President, Apprise APPRISE |

| Time consuming for appraiser & client Inconsistent Quality highly dependent on individual appraiser Long lag Hard to get to the insights Fewer appraisers tackling more work APPRISE REMOVES CHALLENGES OF TRADITIONAL APPRAISAL PROCESSES 19 |

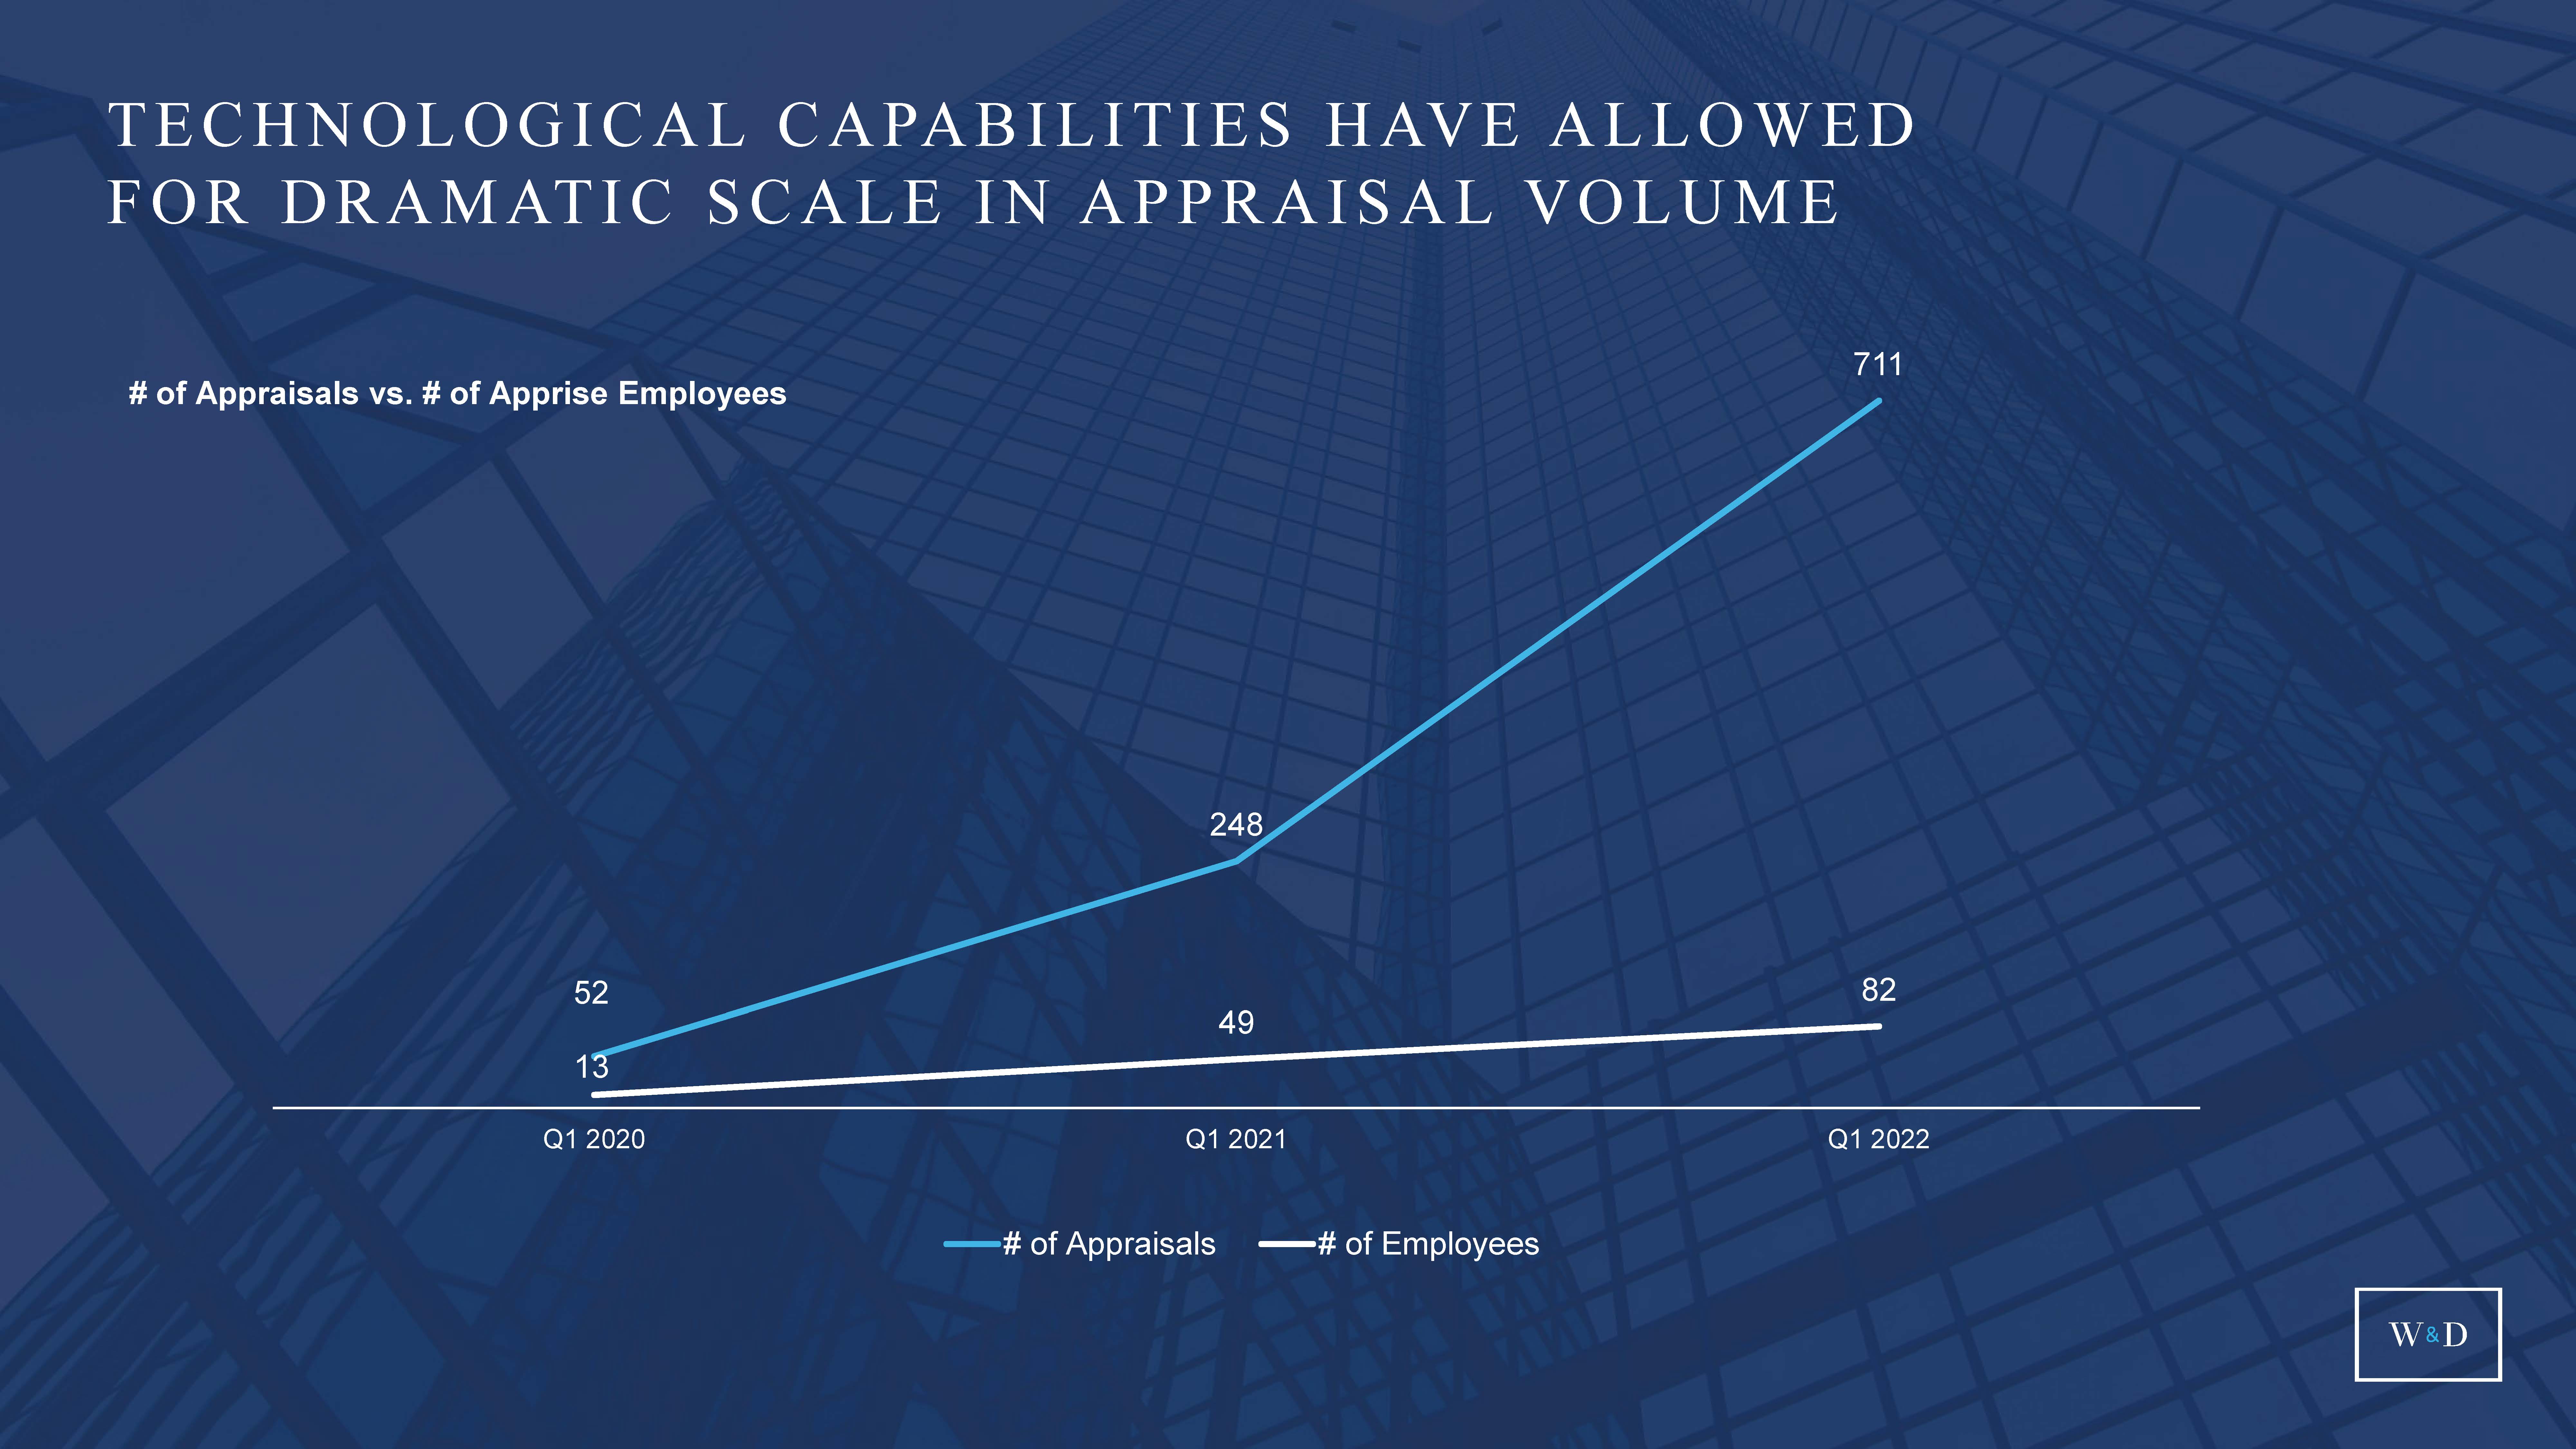
| 52 248 711 13 49 82 Q1 2020 Q1 2021 Q1 2022 # of Appraisals # of Employees TECHNOLOGICAL CAPABILITIES HAVE ALLOWED FOR DRAMATIC SCALE IN APPRAISAL VOLUME # of Appraisals vs. # of Apprise Employees 20 |
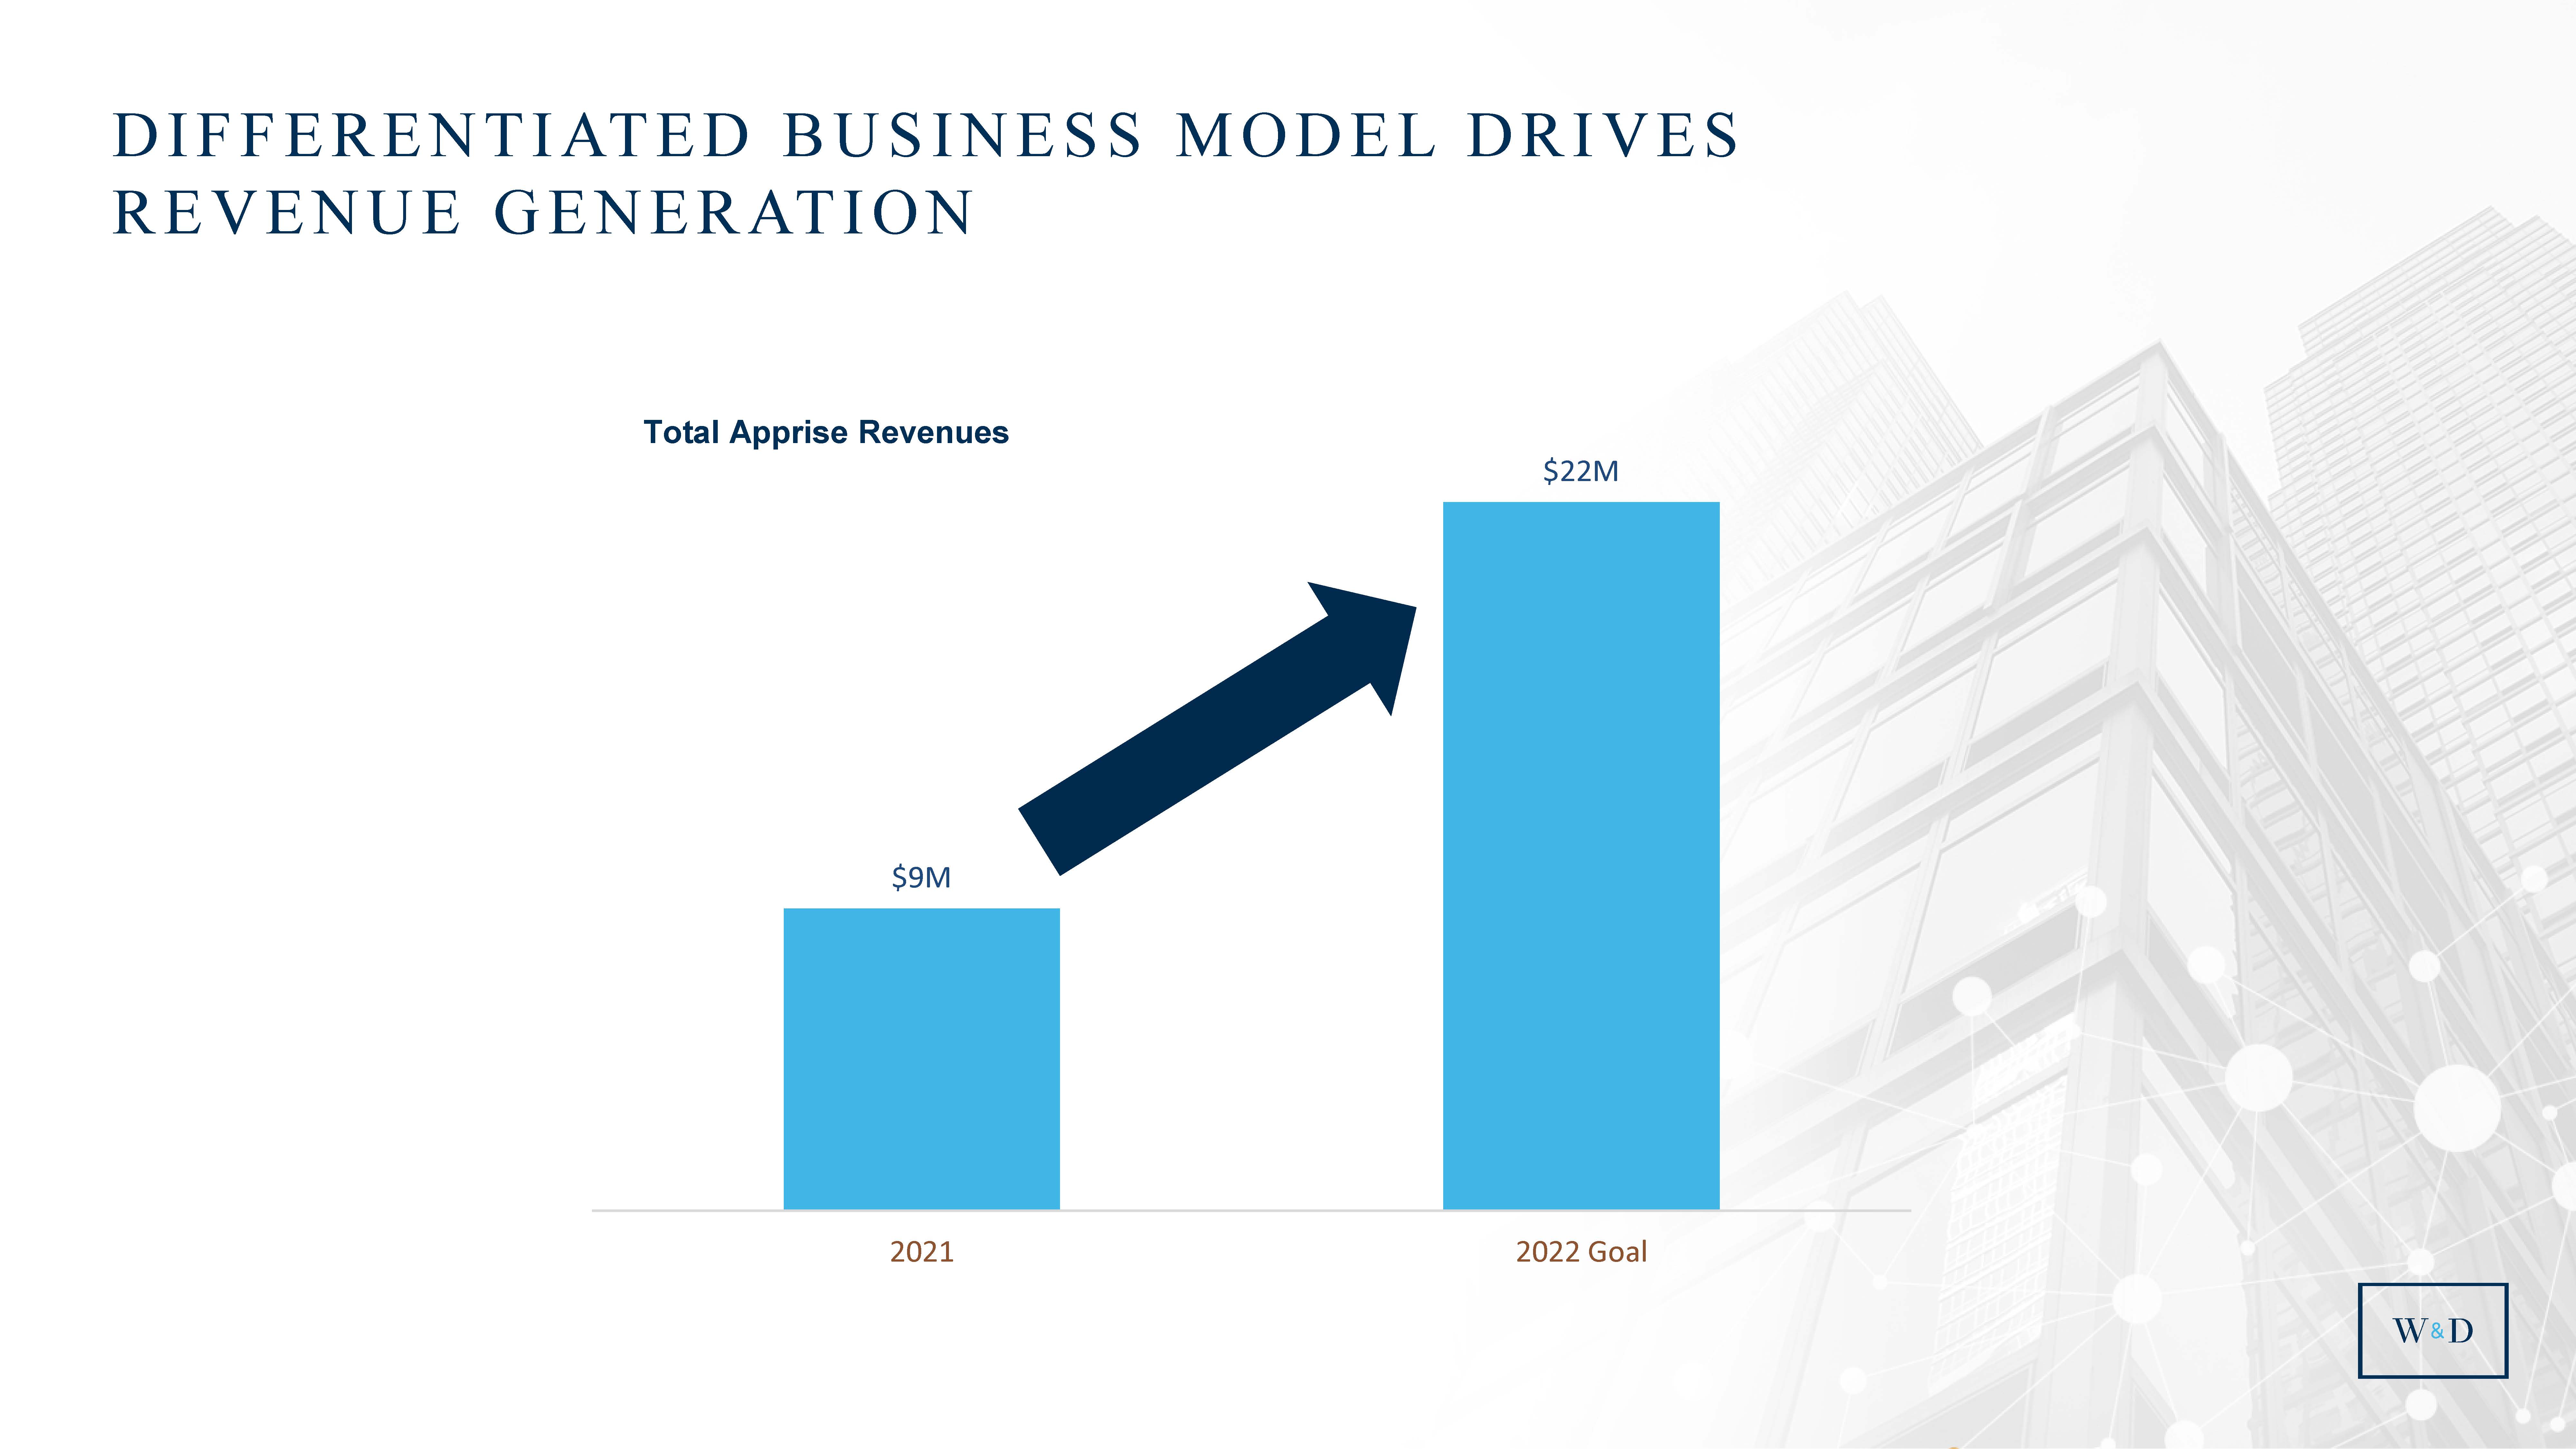
| DIFFERENTIATED BUSINESS MODEL DRIVES REVENUE GENERATION Total Apprise Revenues $9M $22M 2021 2022 Goal 21 |
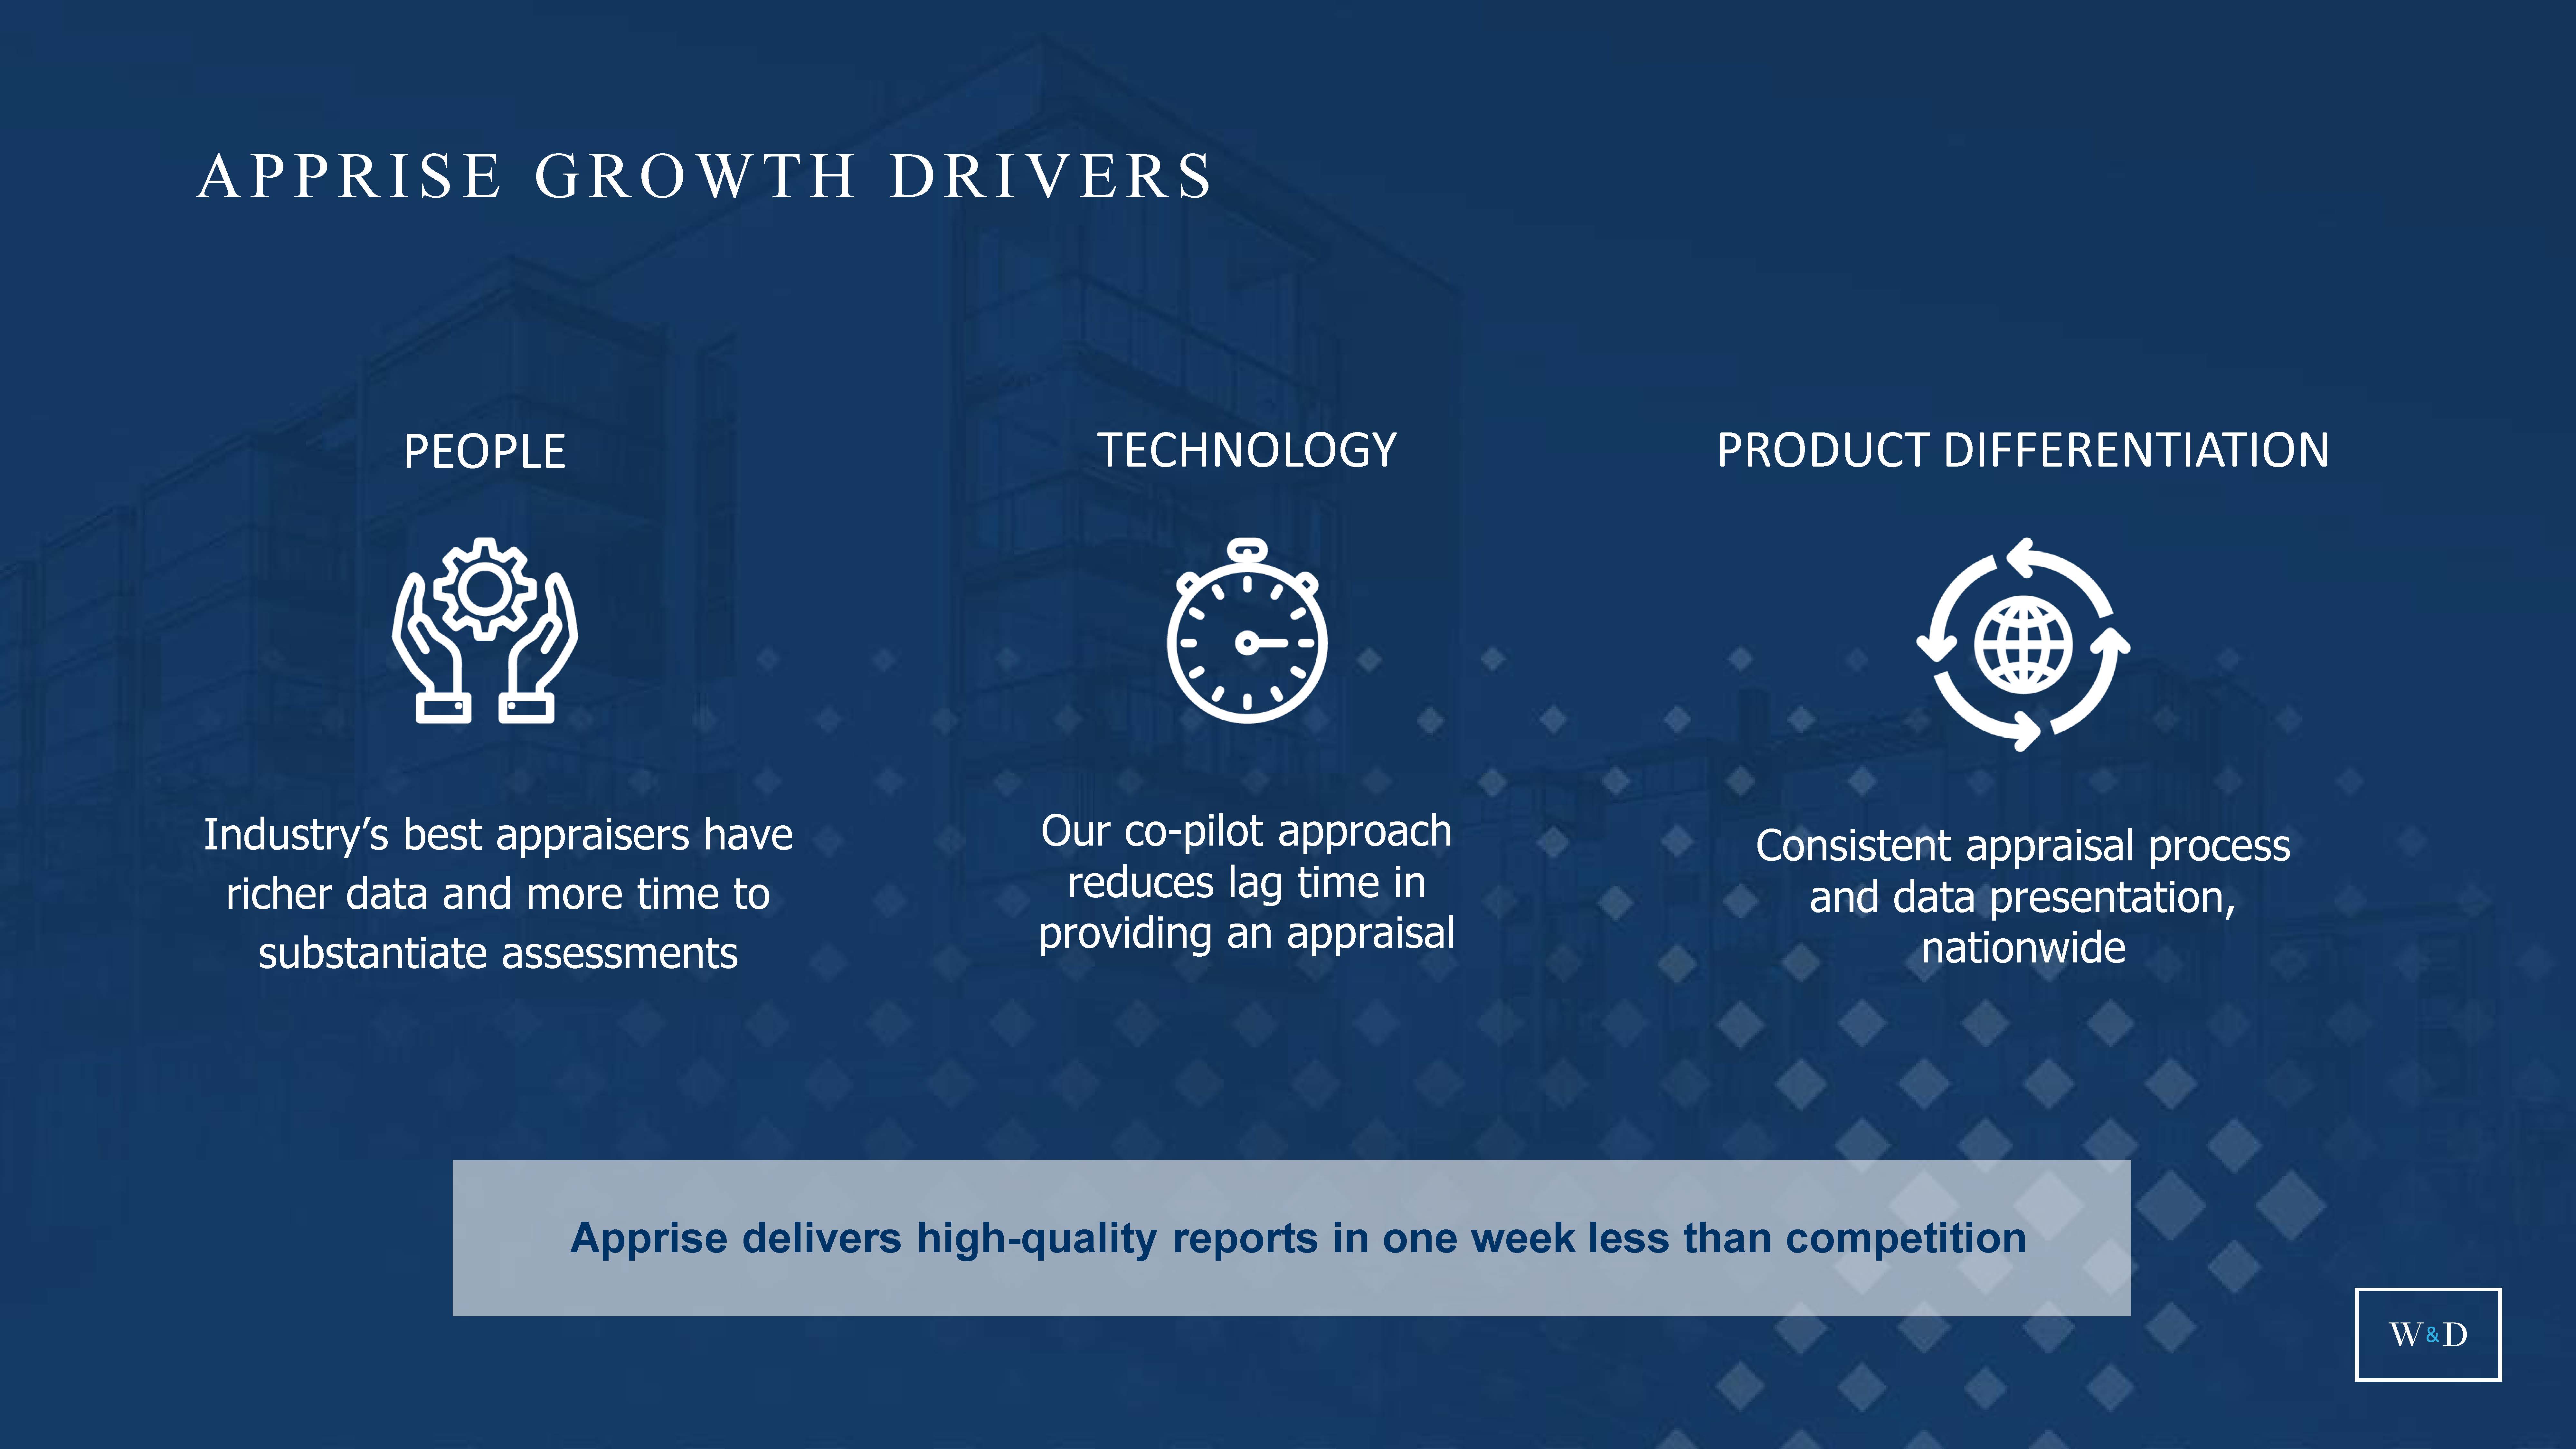
| Industry’s best appraisers have richer data and more time to substantiate assessments Our co-pilot approach reduces lag time in providing an appraisal Consistent appraisal process and data presentation, nationwide Apprise delivers high-quality reports in one week less than competition APPRISE GROWTH DRIVERS PEOPLE TECHNOLOGY PRODUCT DIFFERENTIATION 22 |
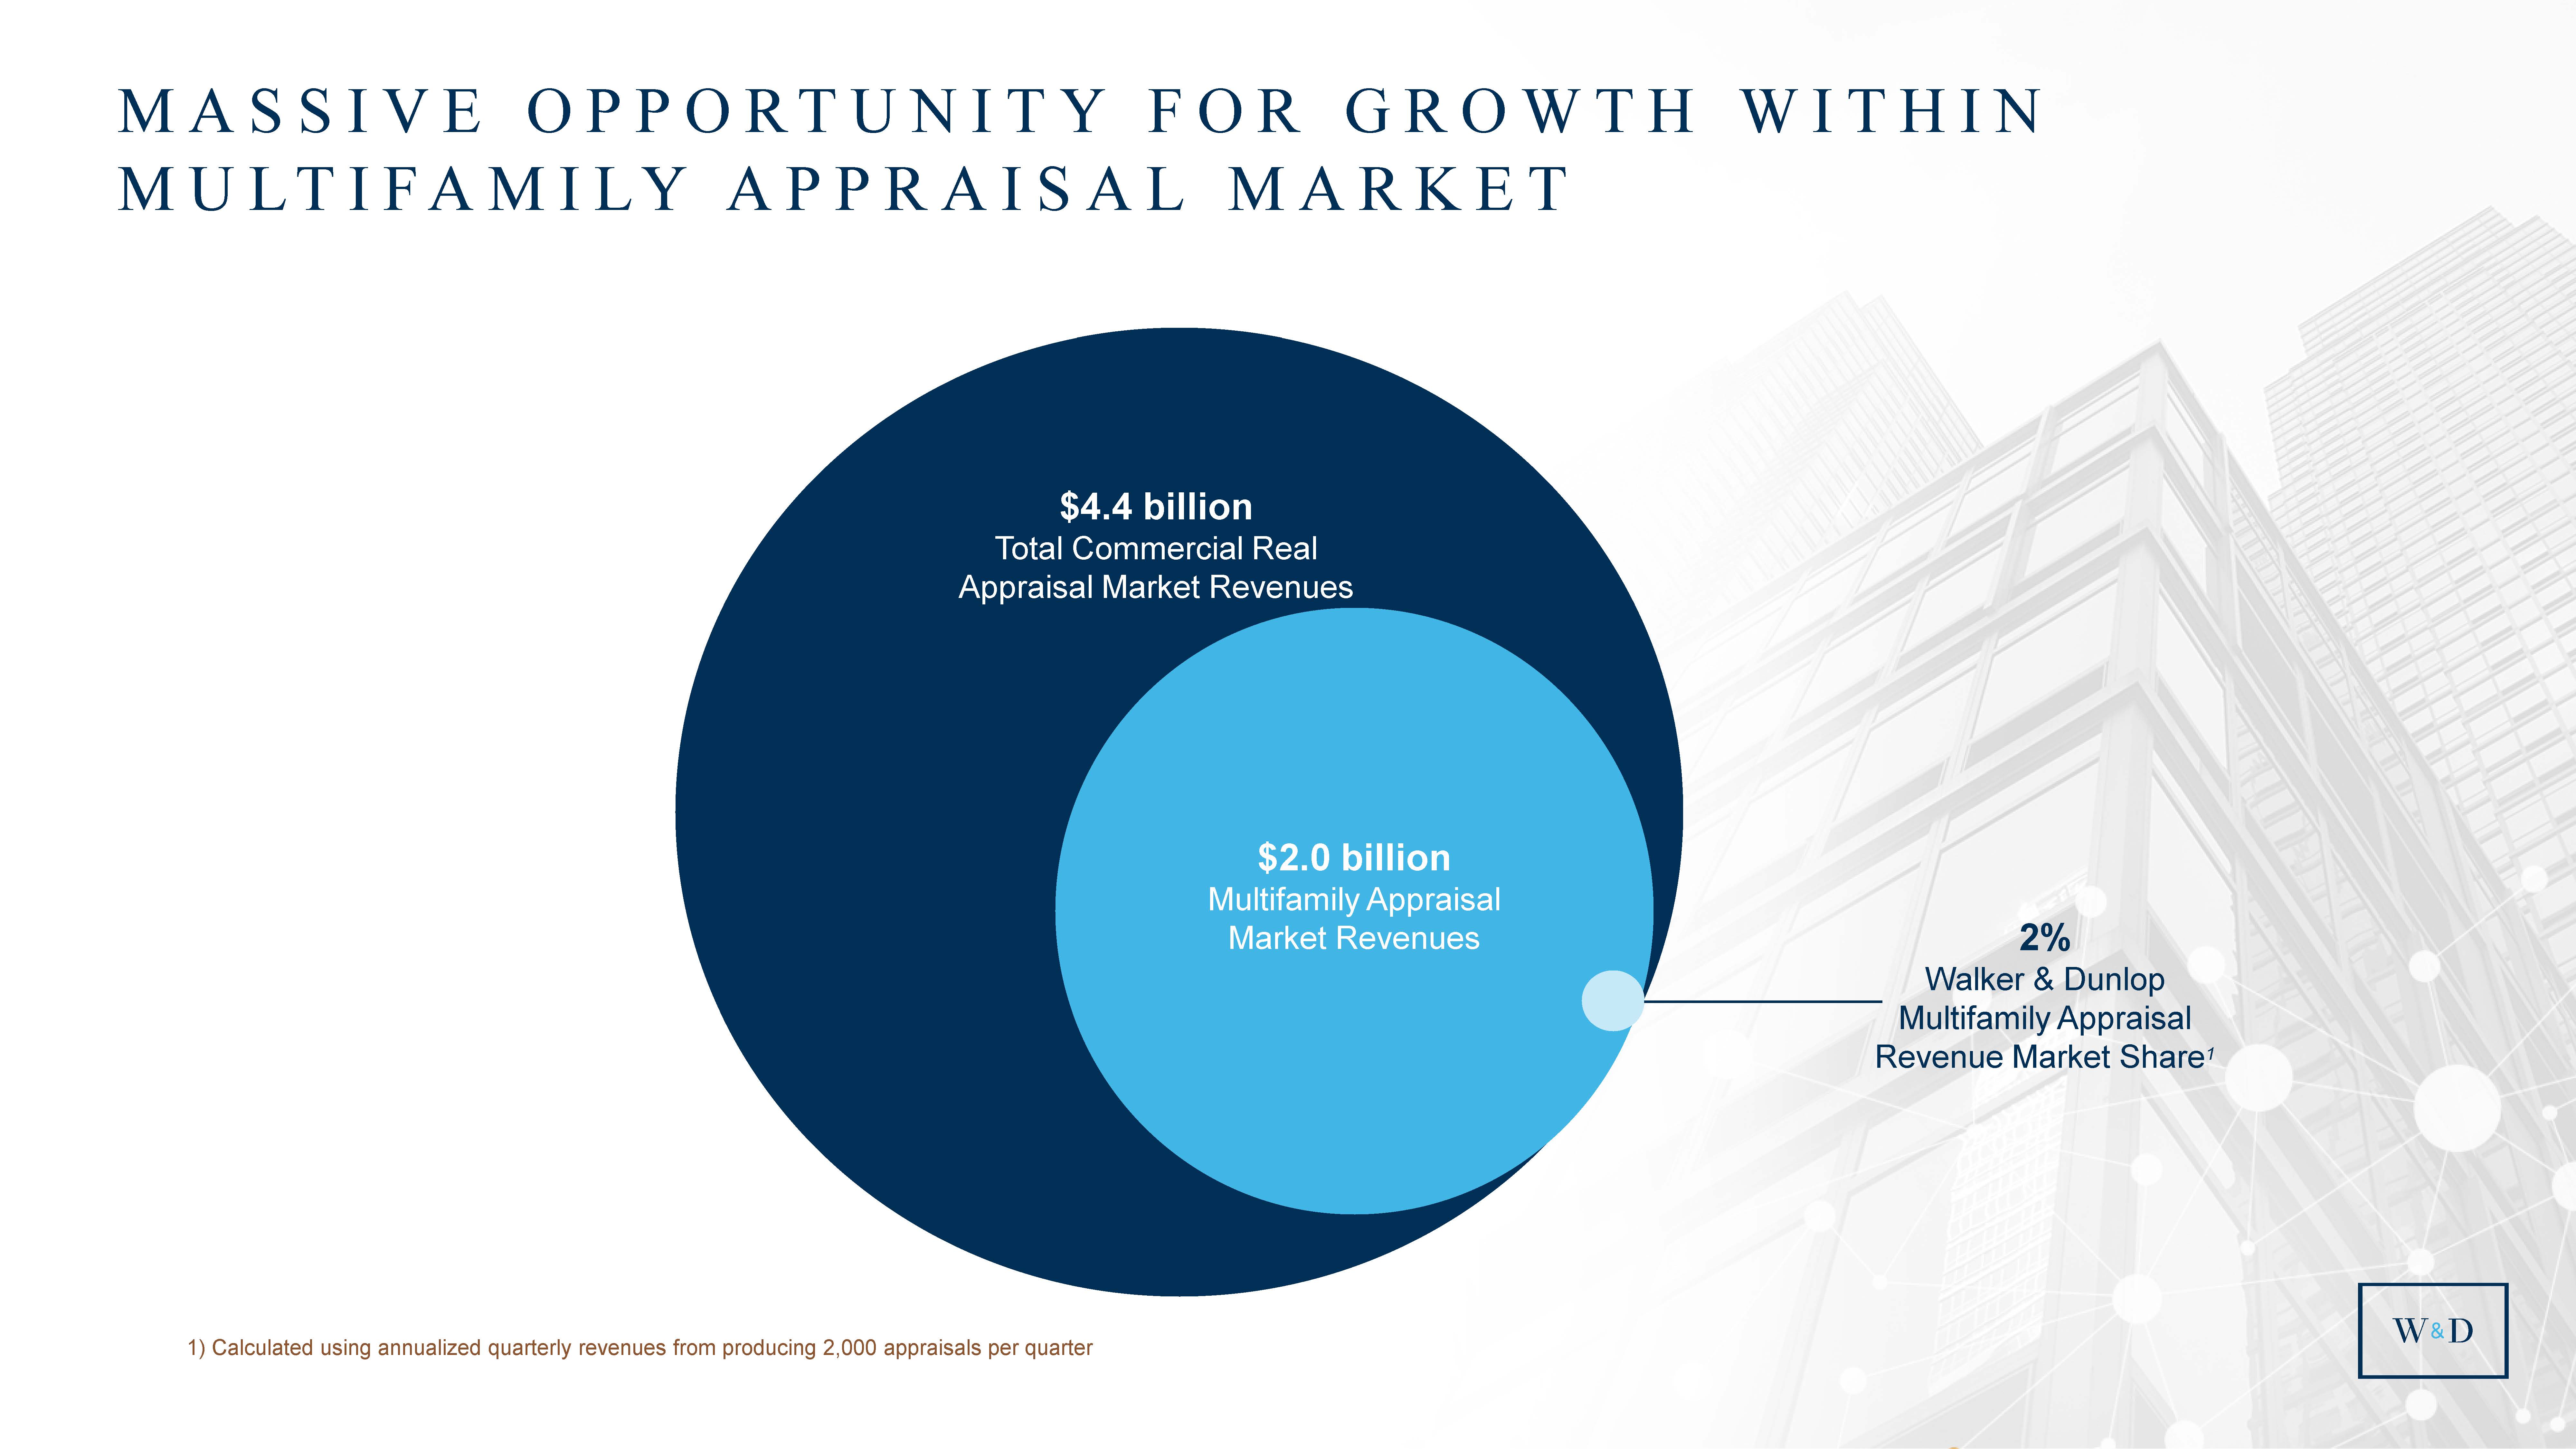
| 23 $4.4 billion Total Commercial Real Appraisal Market Revenues $2.0 billion Multifamily Appraisal Market Revenues MASSIVE OPPORTUNITY FOR GROWTH WITHIN MULTIFAMILY APPRAISAL MARKET 2% Walker & Dunlop Multifamily Appraisal Revenue Market Share1 1) Calculated using annualized quarterly revenues from producing 2,000 appraisals per quarter |
| TEUN VAN DEN DRIES Executive Vice President, GeoPhy GEOPHY AND TECHNOLOGY |

| SHERI THOMPSON Executive Vice President, Affordable Housing and Investment Management/Proprietary Capital ALLIANT & AFFORDABLE HOUSING |

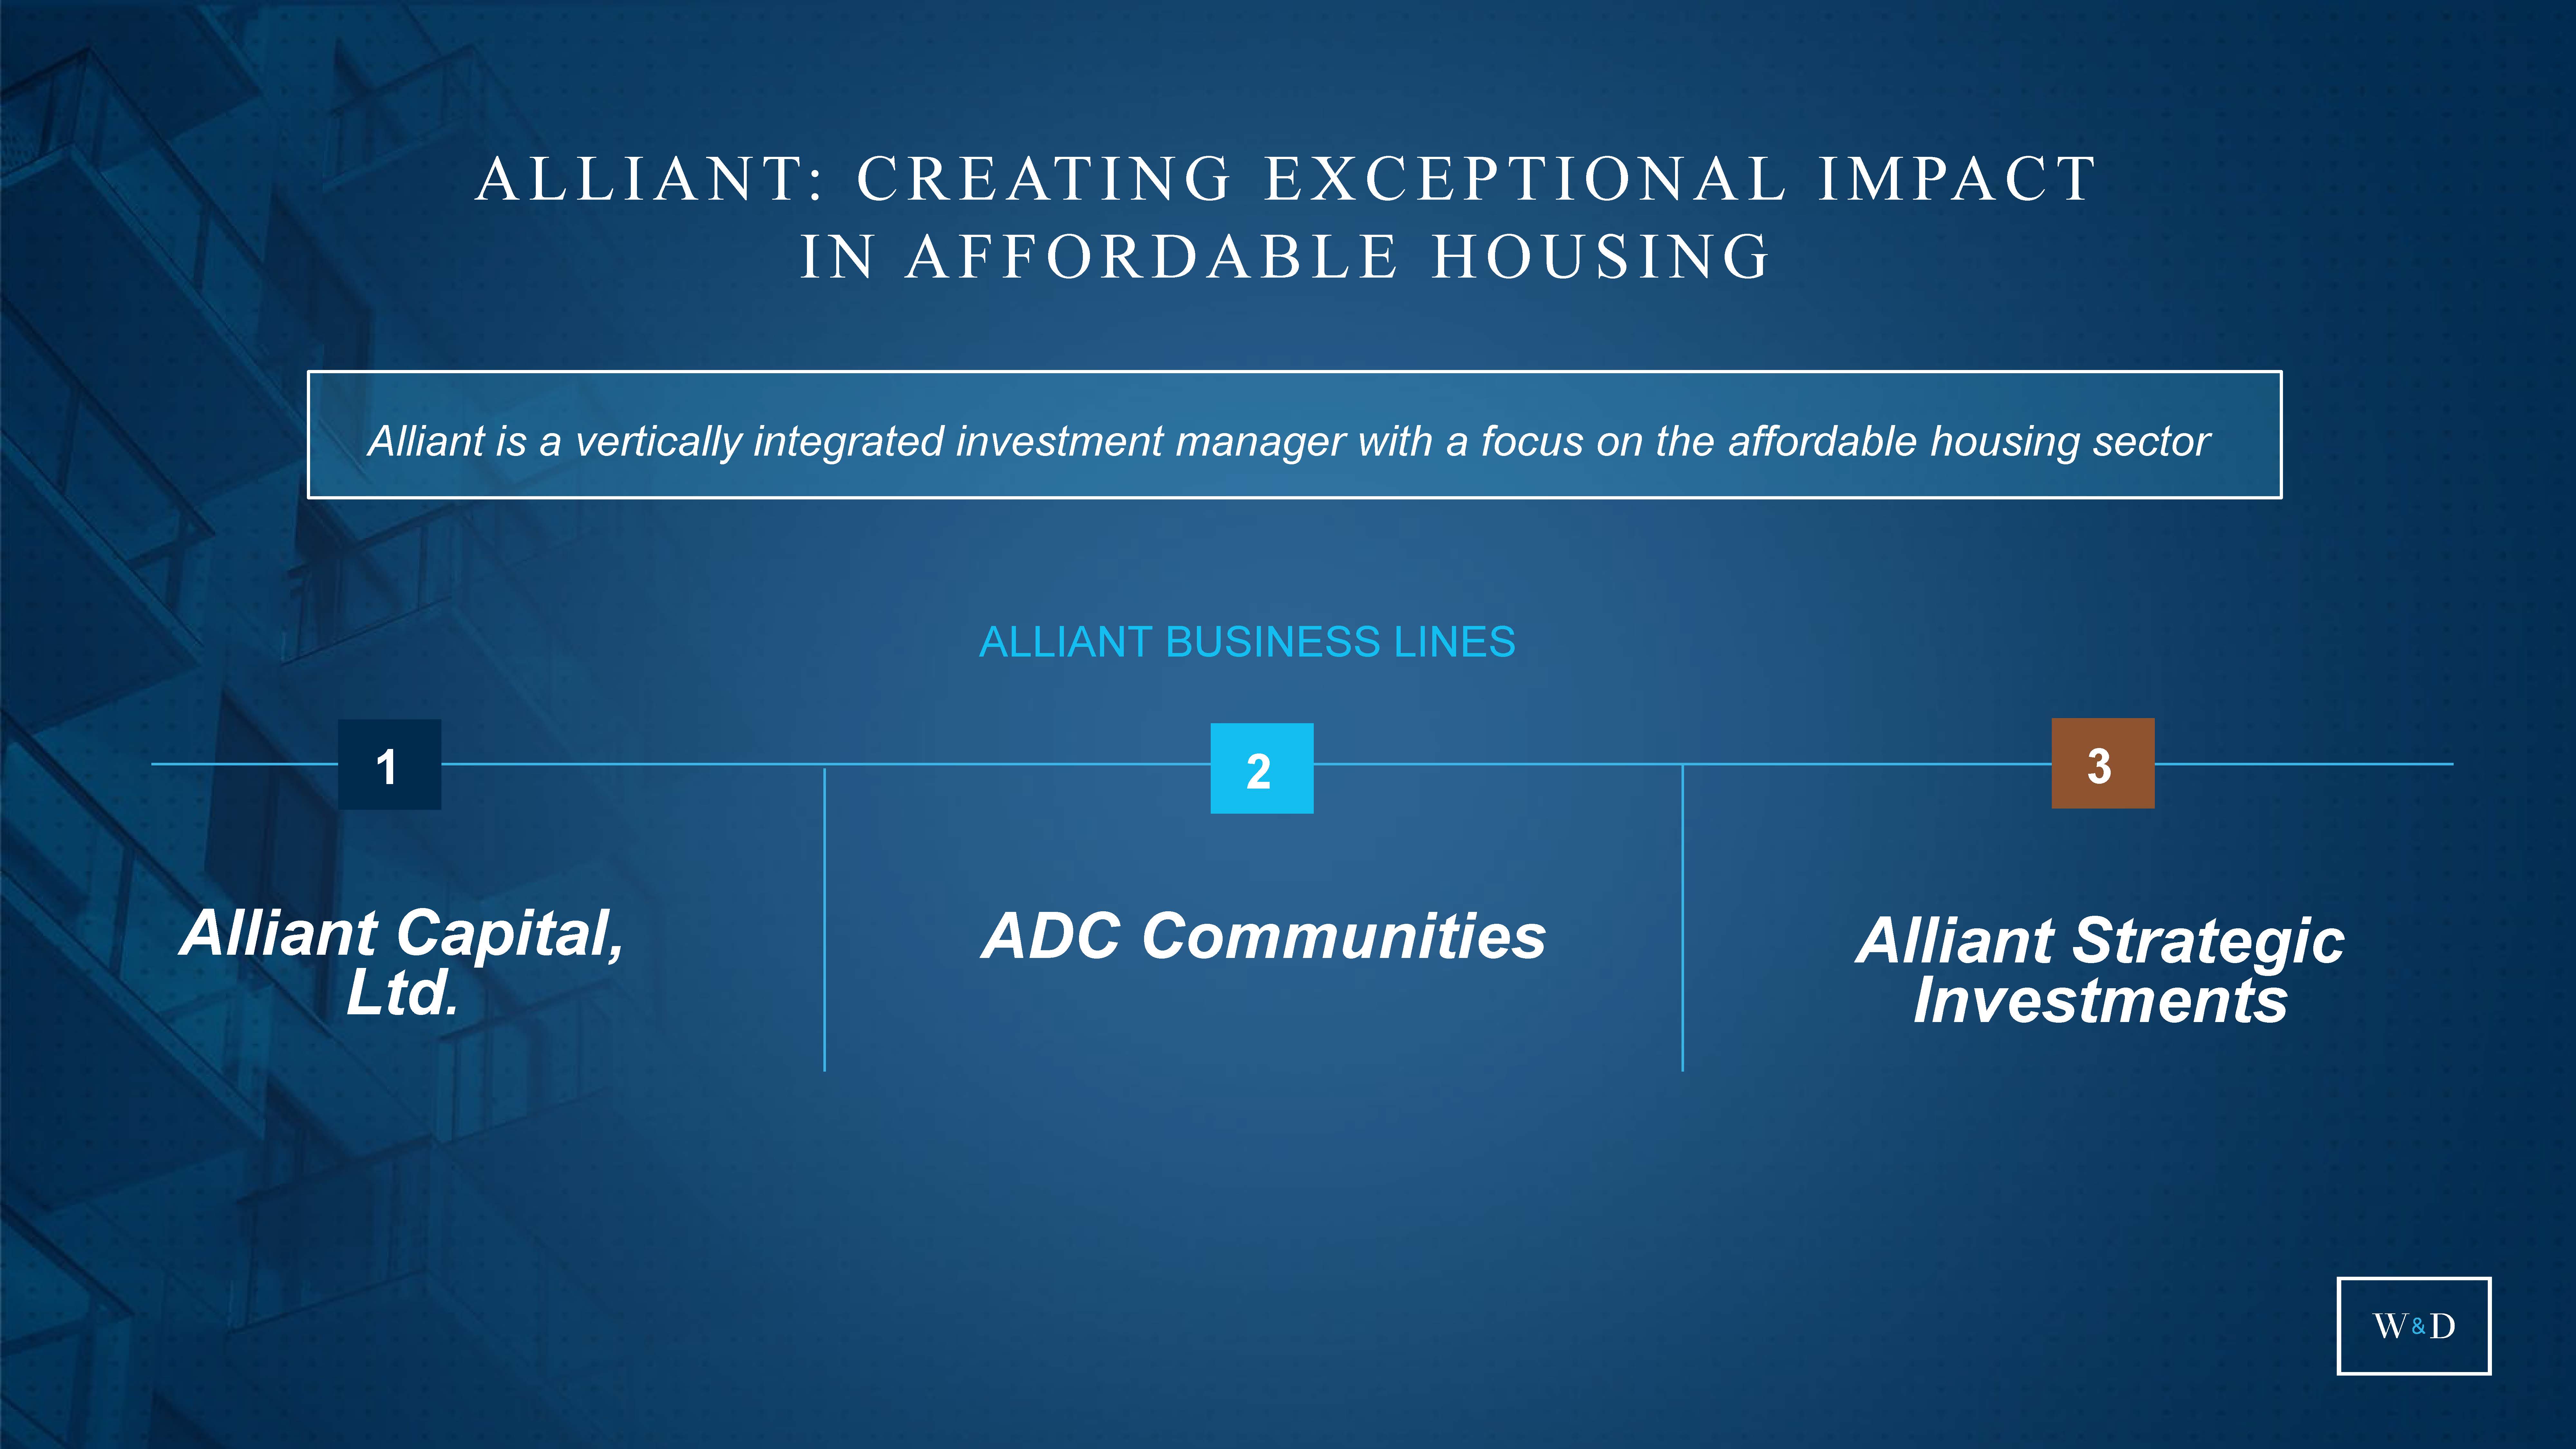
| ALLIANT: CREATING EXCEPTIONAL IMPACT IN AFFORDABLE HOUSING Alliant Capital, Ltd. Alliant Strategic Investments ALLIANT BUSINESS LINES ADC Communities Alliant is a vertically integrated investment manager with a focus on the affordable housing sector 1 2 3 26 |
| INVESTMENTS AND OWNERSHIP IN Affordable Housing Units 27 |
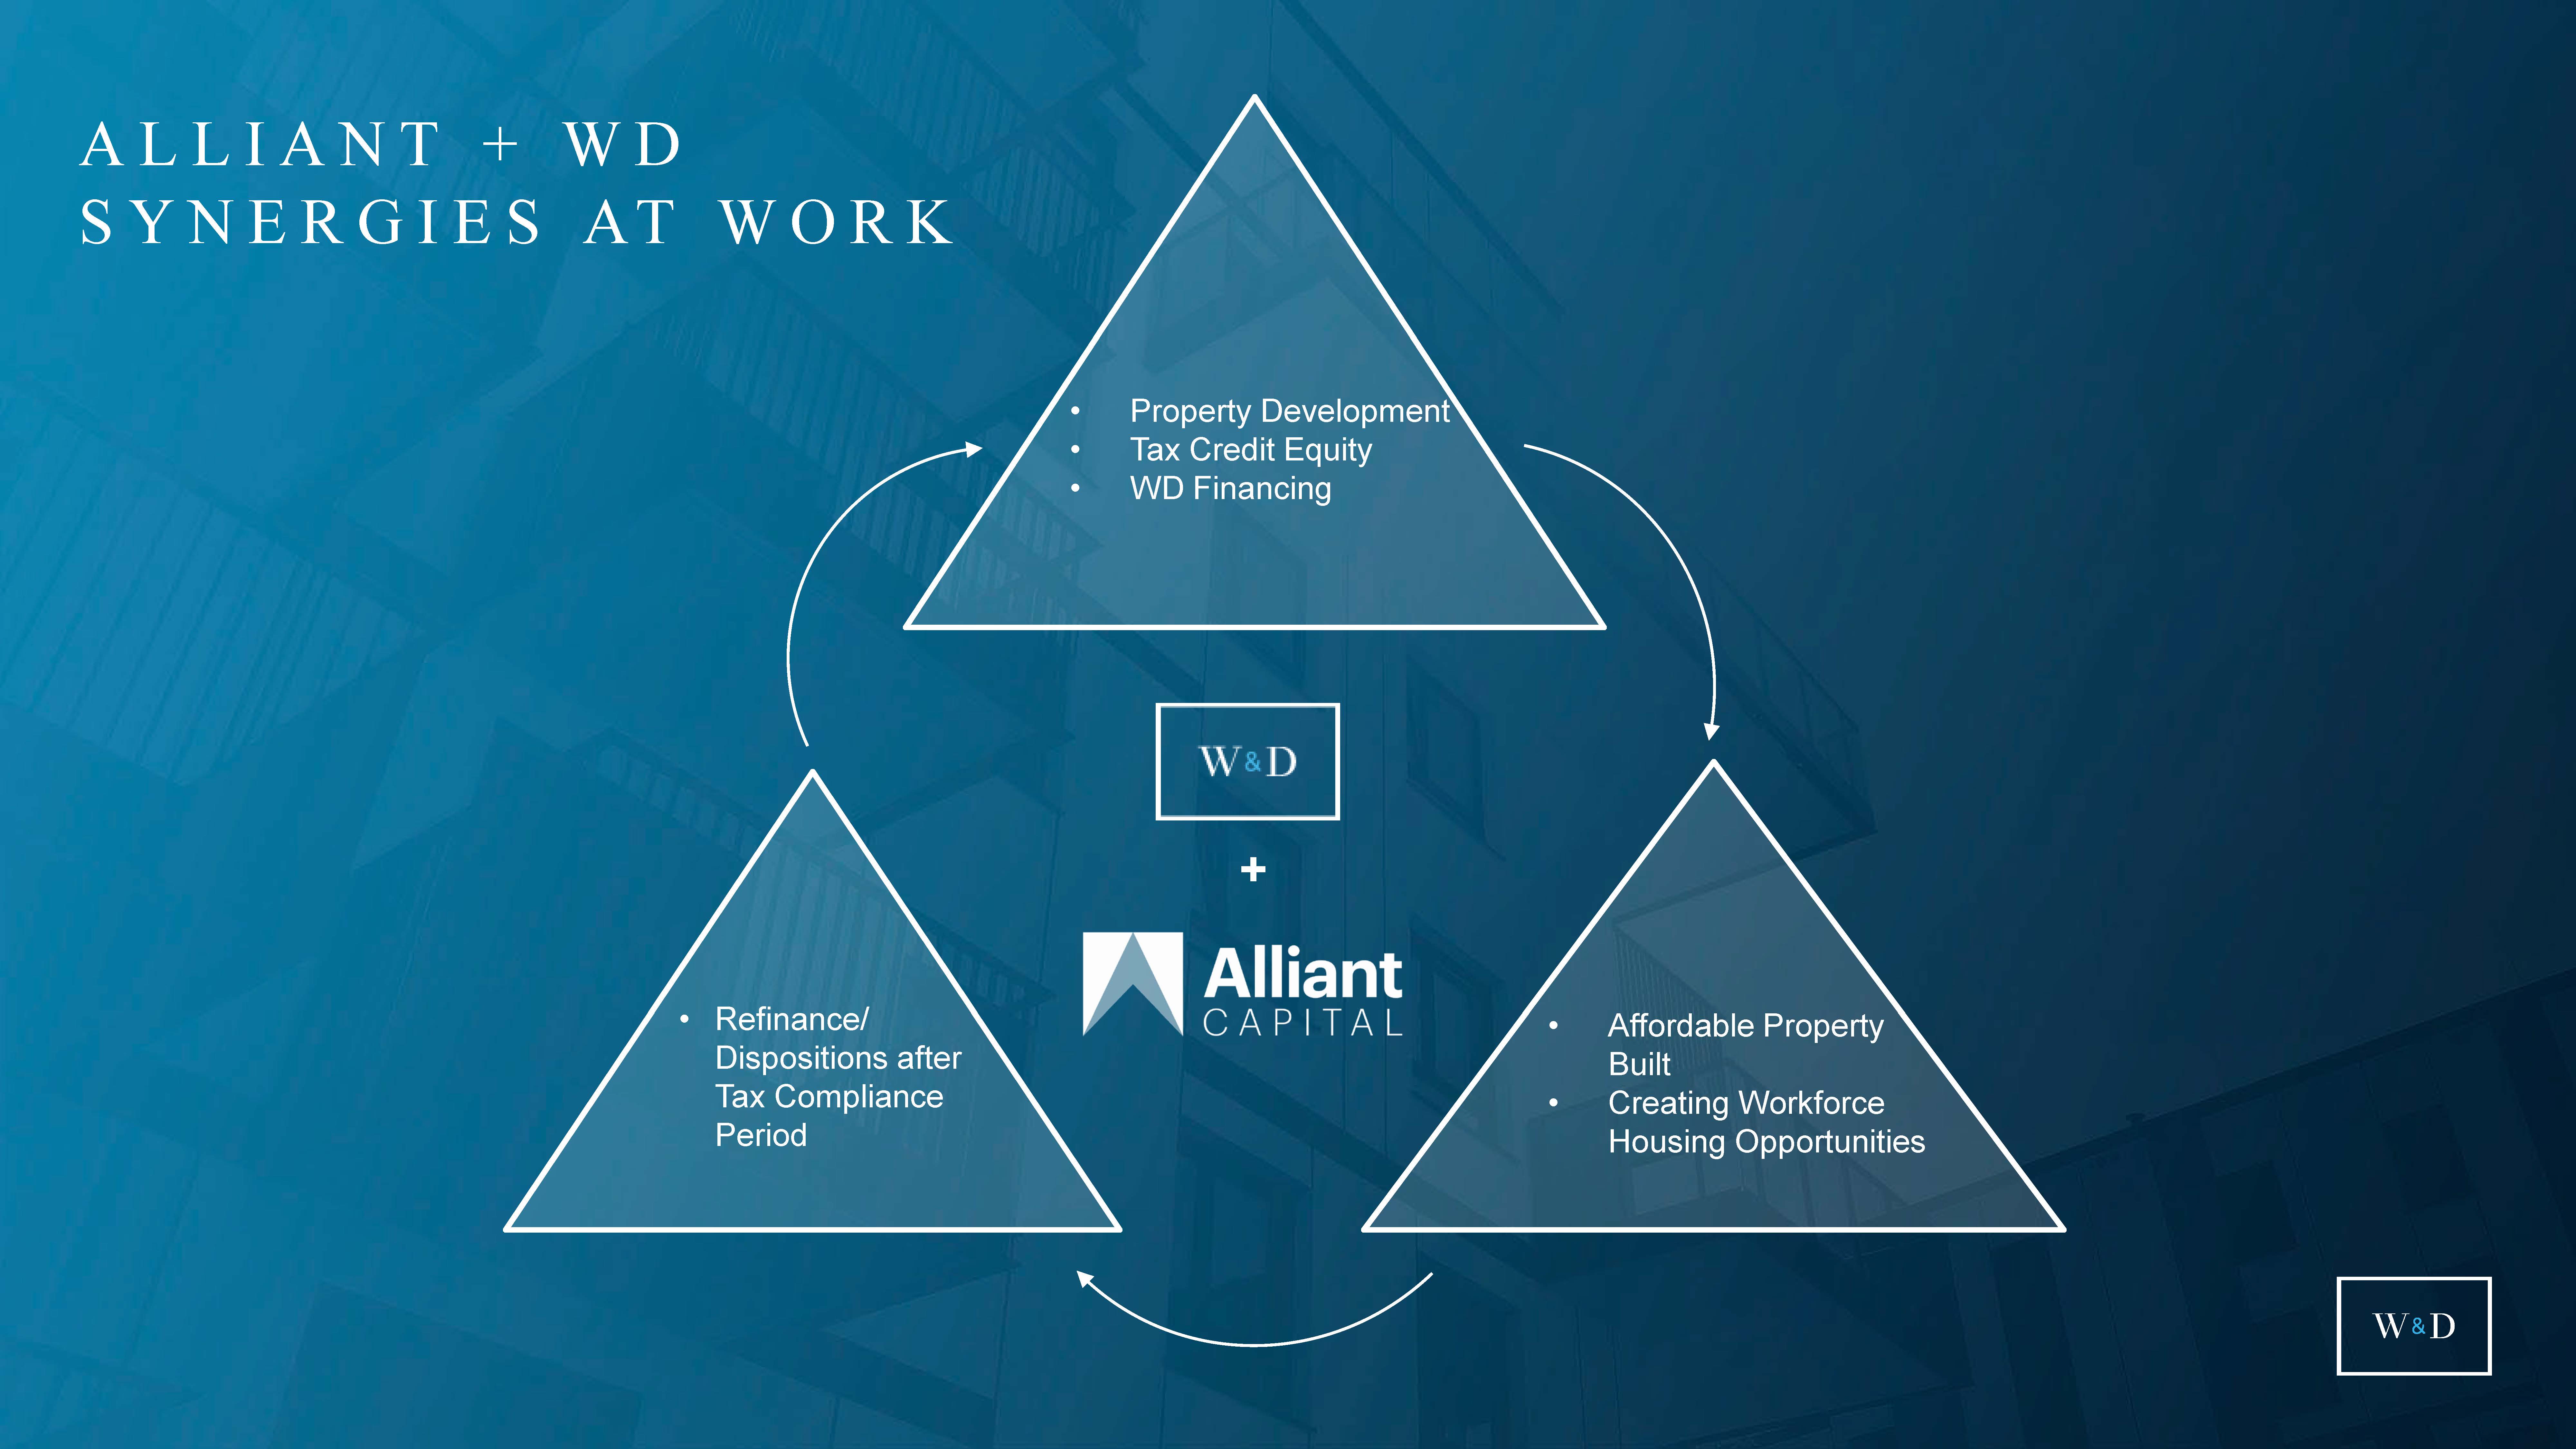
| ALLIANT + WD SYNERGIES AT WORK • Property Development • Tax Credit Equity • WD Financing • Refinance/ Dispositions after Tax Compliance Period • Affordable Property Built • Creating Workforce Housing Opportunities + 28 |
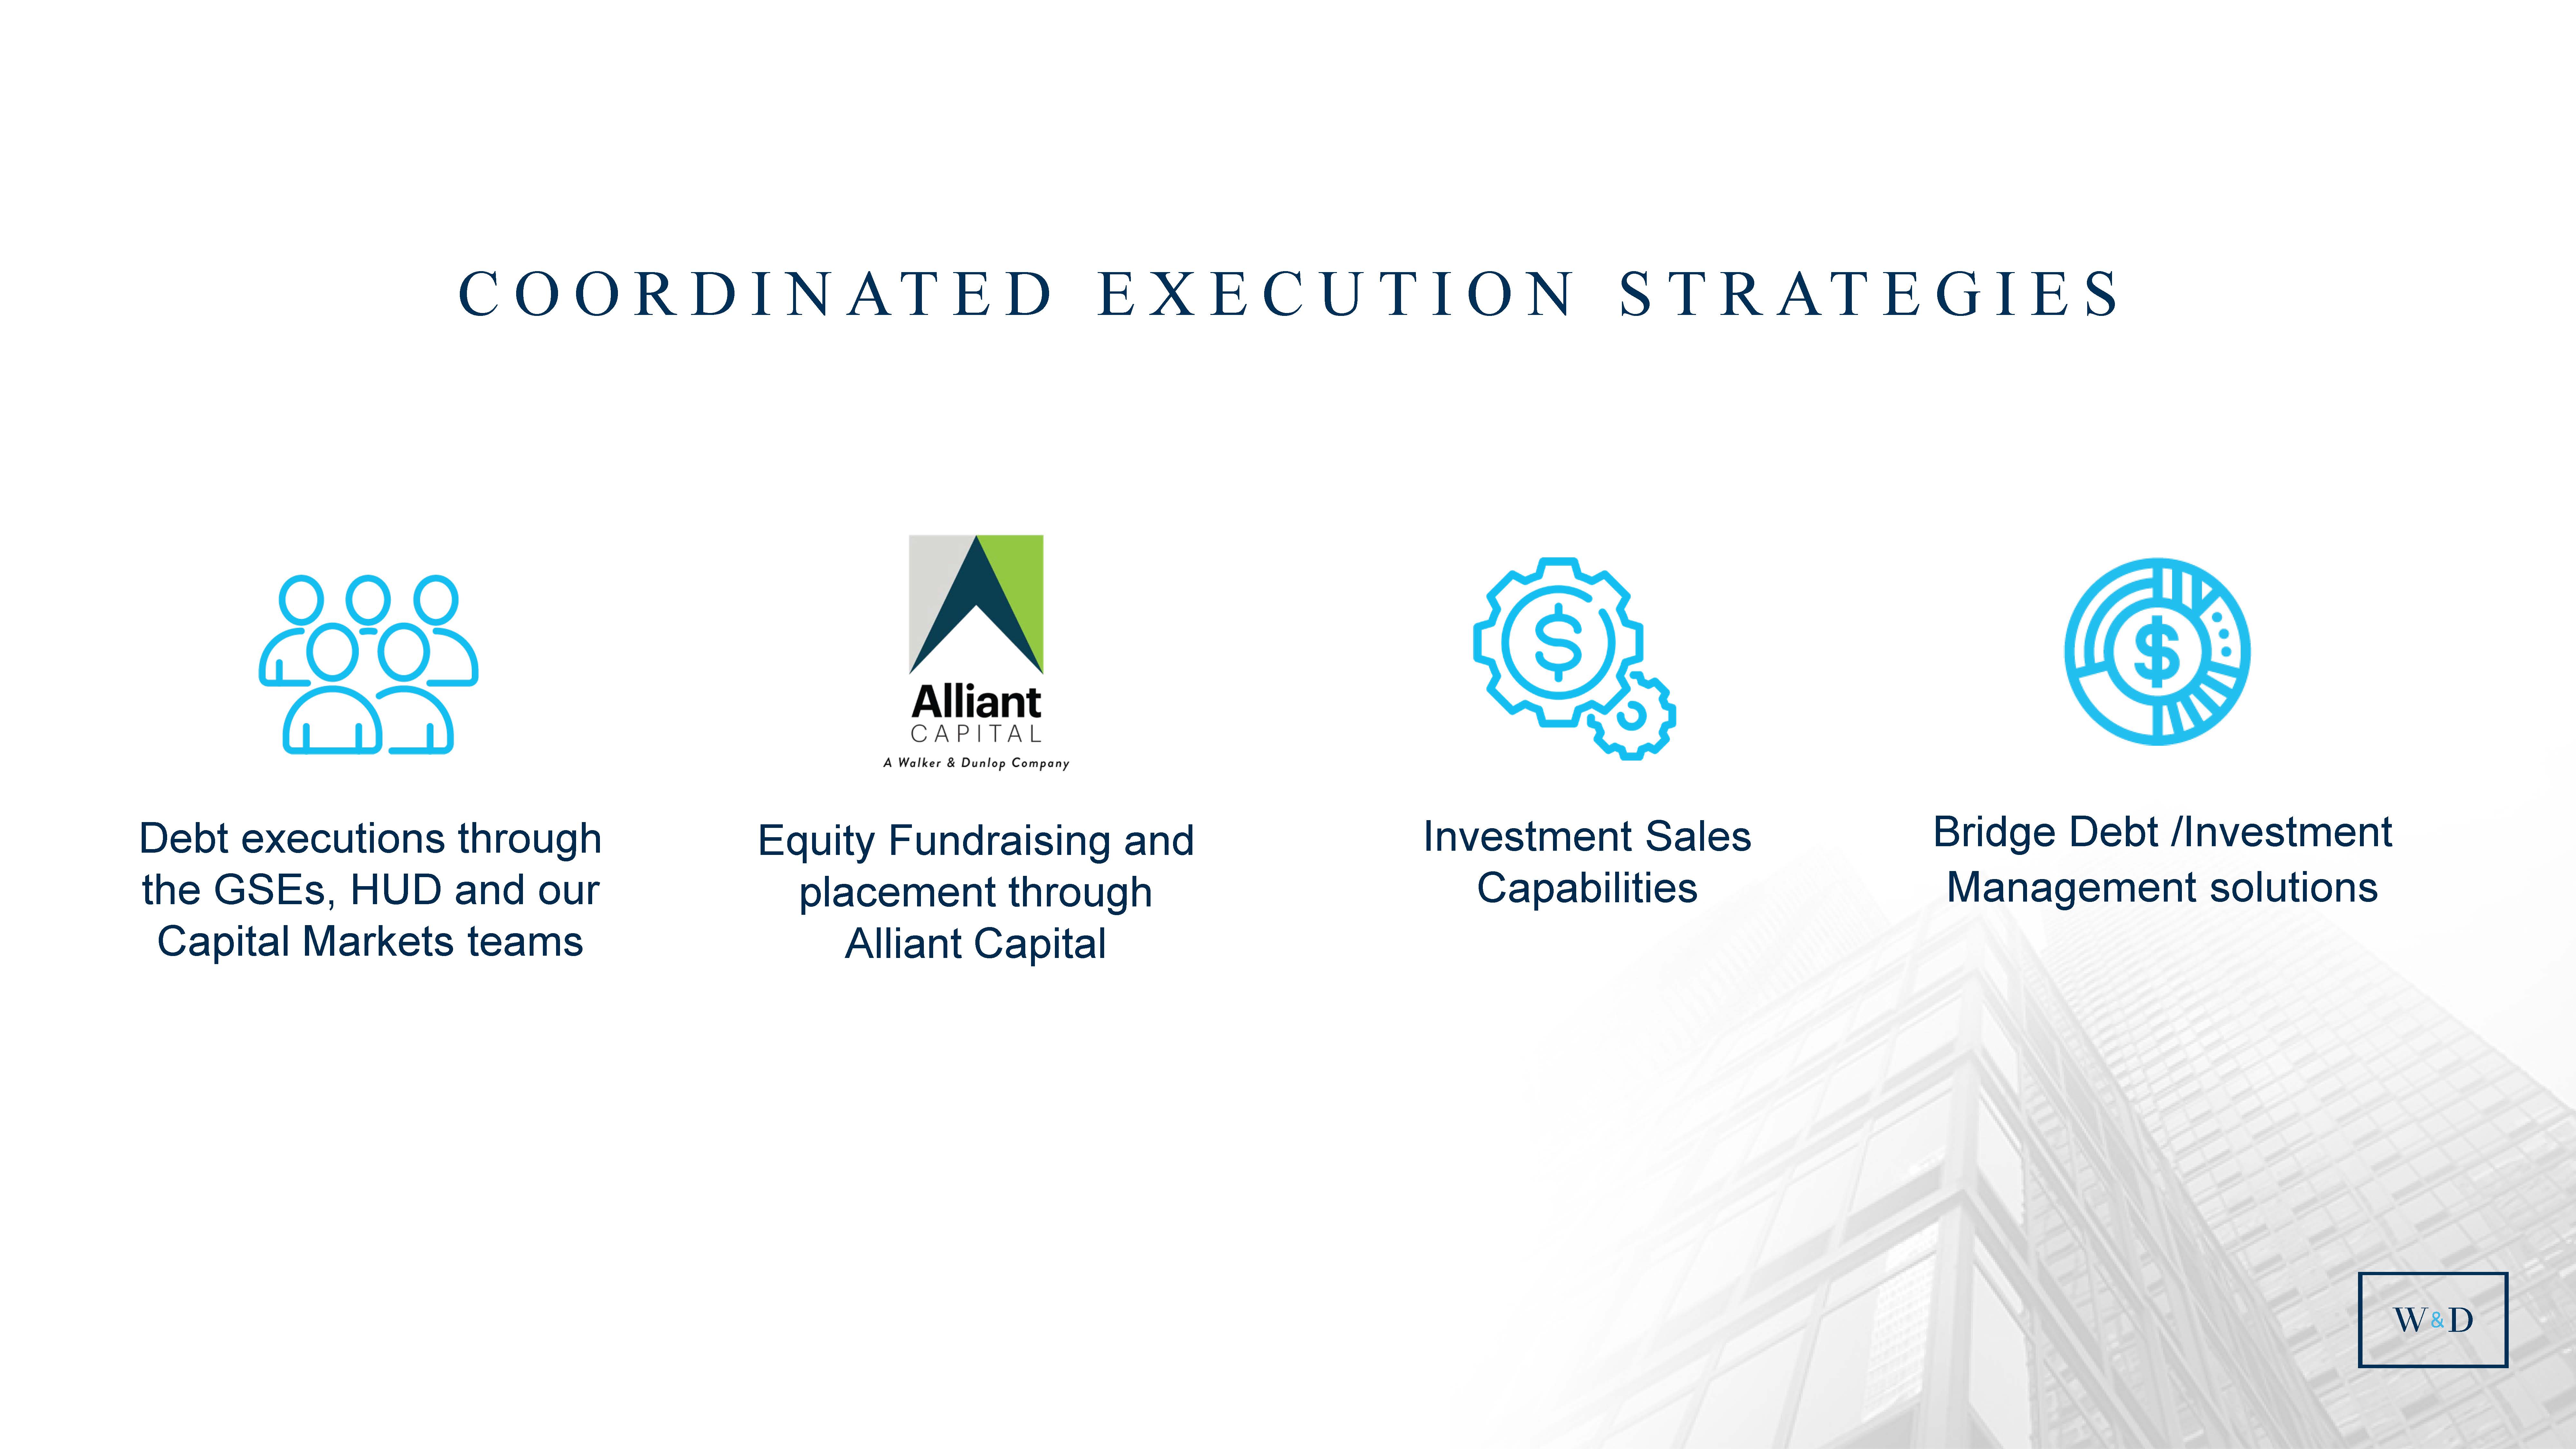
| COORDINATED EXECUTION STRATEGIES Bridge Debt /Investment Management solutions Debt executions through the GSEs, HUD and our Capital Markets teams Equity Fundraising and placement through Alliant Capital Investment Sales Capabilities 29 |
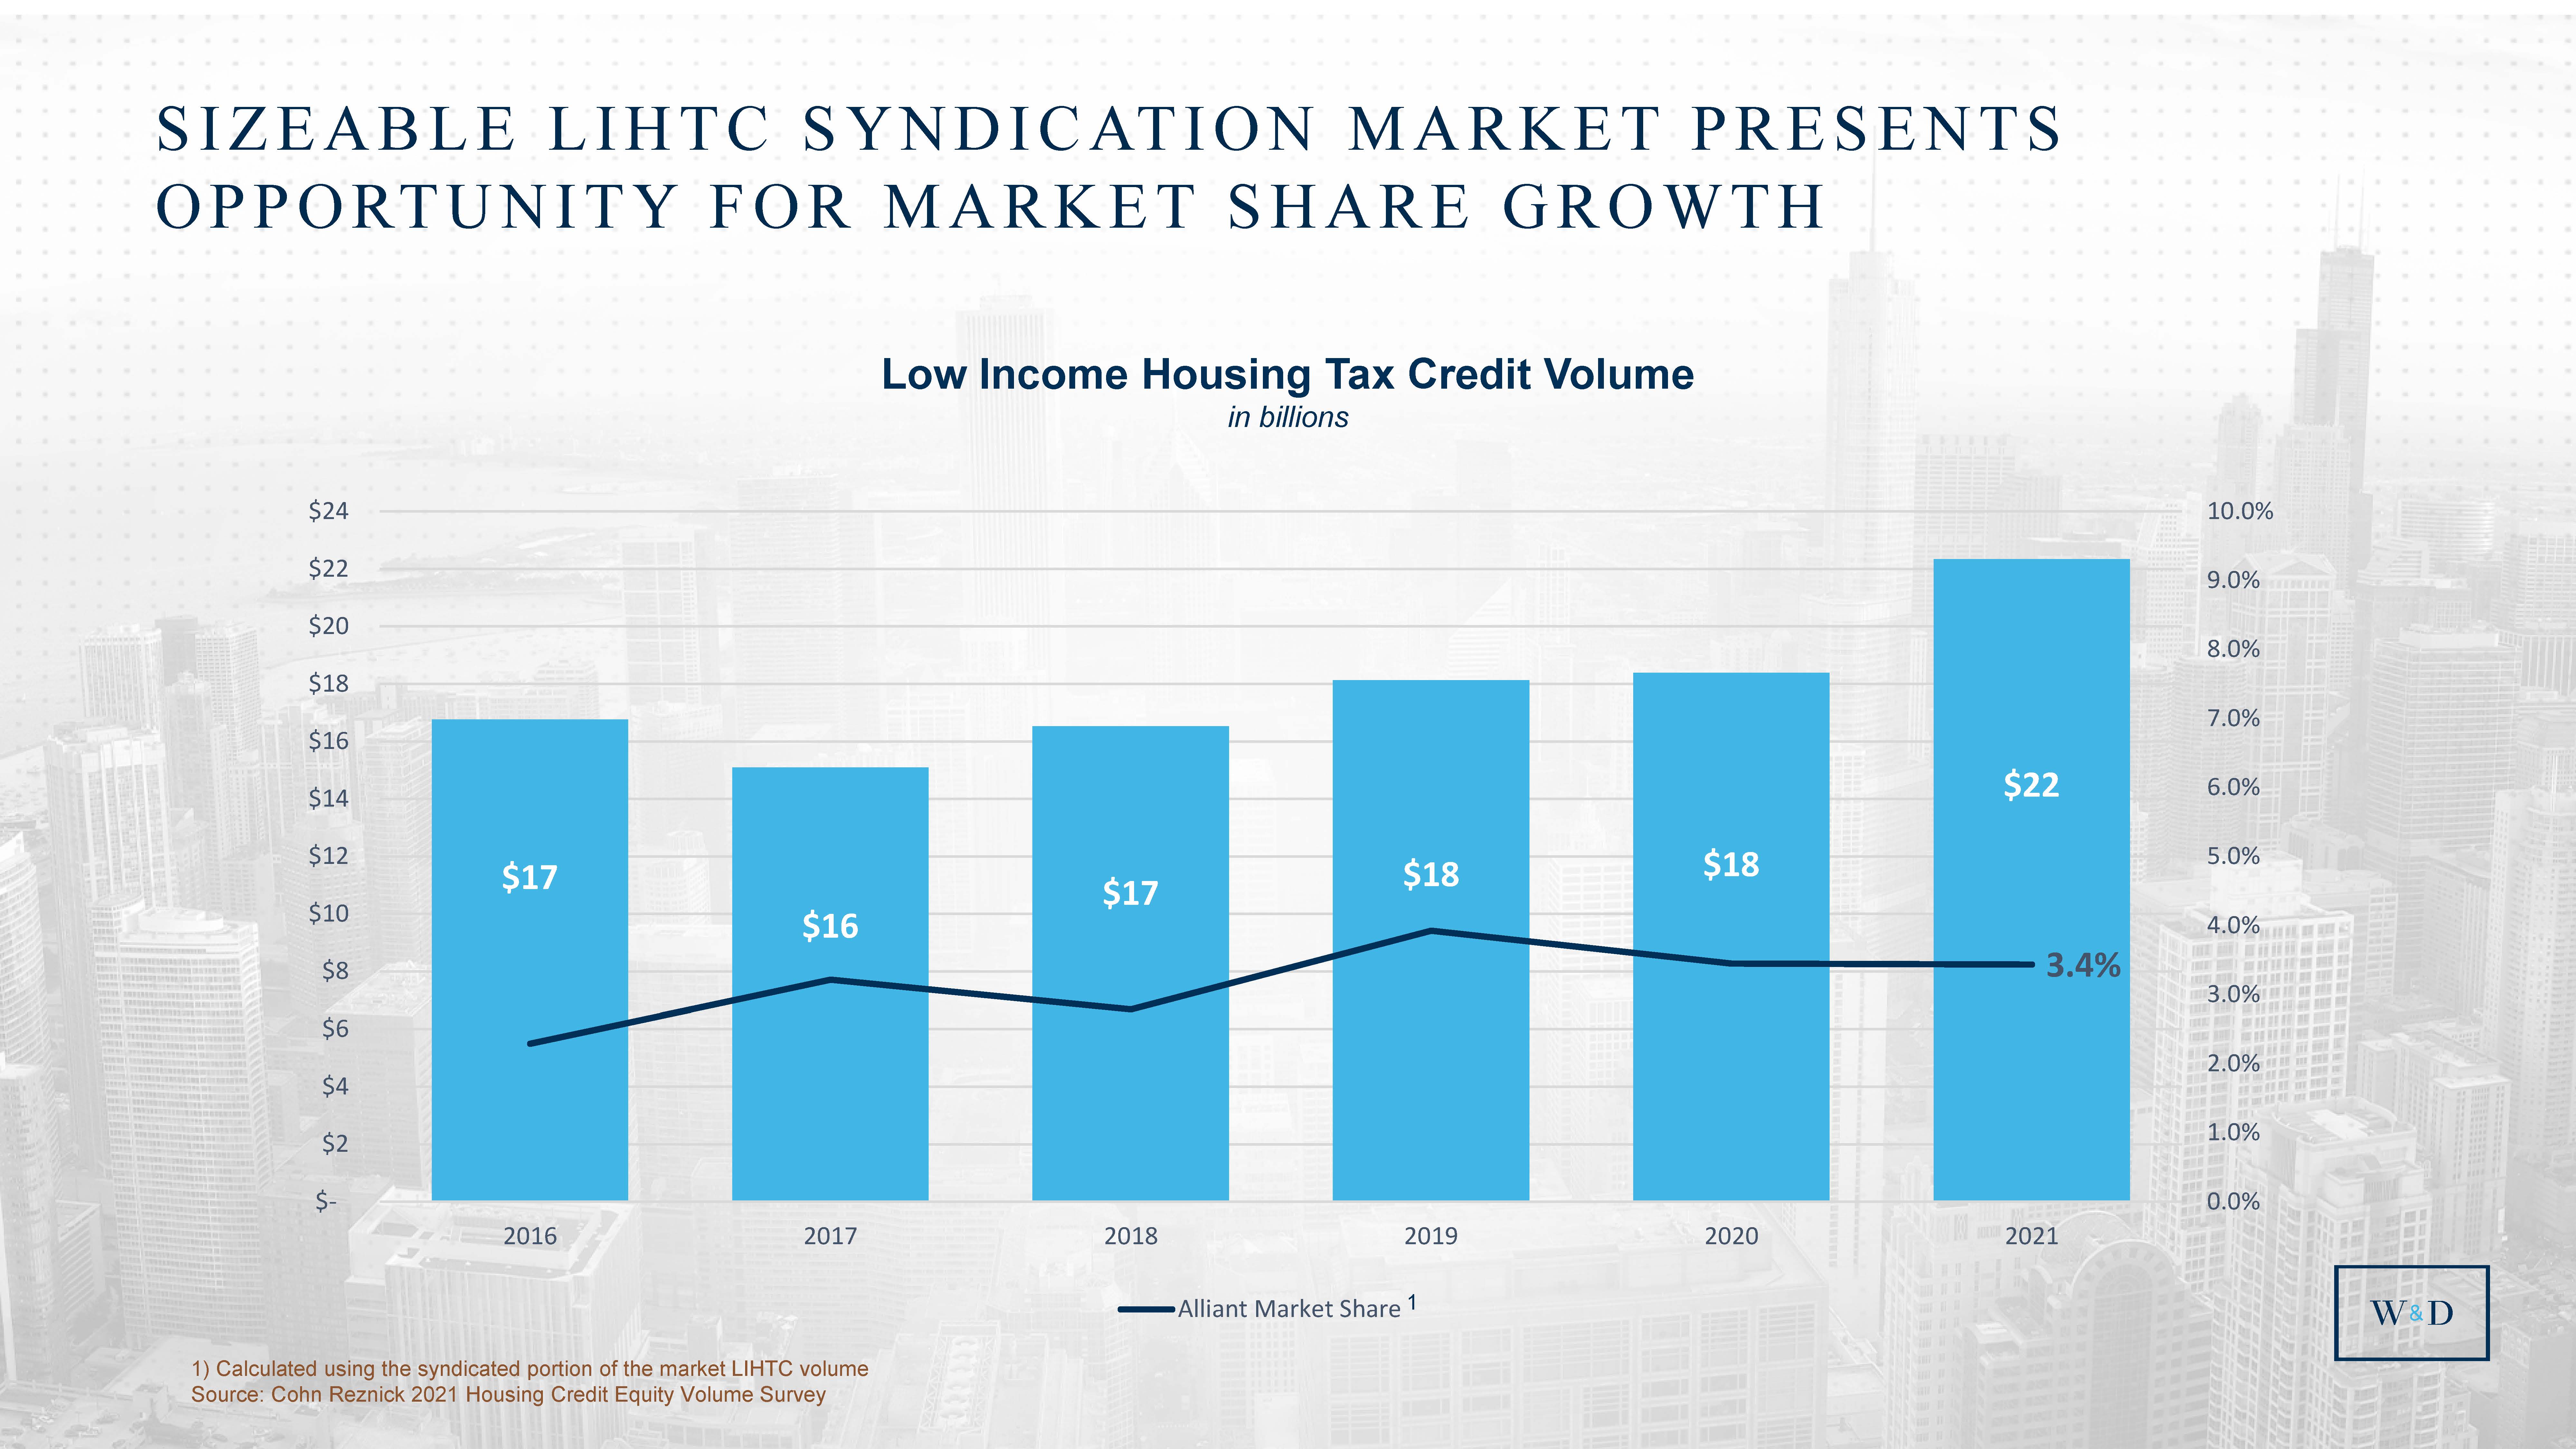
| 30 SIZEABLE LIHTC SYNDICATION MARKET PRESENTS OPPORTUNITY FOR MARKET SHARE GROWTH Low Income Housing Tax Credit Volume in billions 1) Calculated using the syndicated portion of the market LIHTC volume Source: Cohn Reznick 2021 Housing Credit Equity Volume Survey 1 $17 $16 $17 $18 $18 $22 3.4% 0.0% 1.0% 2.0% 3.0% 4.0% 5.0% 6.0% 7.0% 8.0% 9.0% 10.0% $- $2 $4 $6 $8 $10 $12 $14 $16 $18 $20 $22 $24 2016 2017 2018 2019 2020 2021 Alliant Market Share |
| KELLY MITCHELL Managing Director, Client Services BRINGING ALL OF W&D TO OUR CLIENTS |

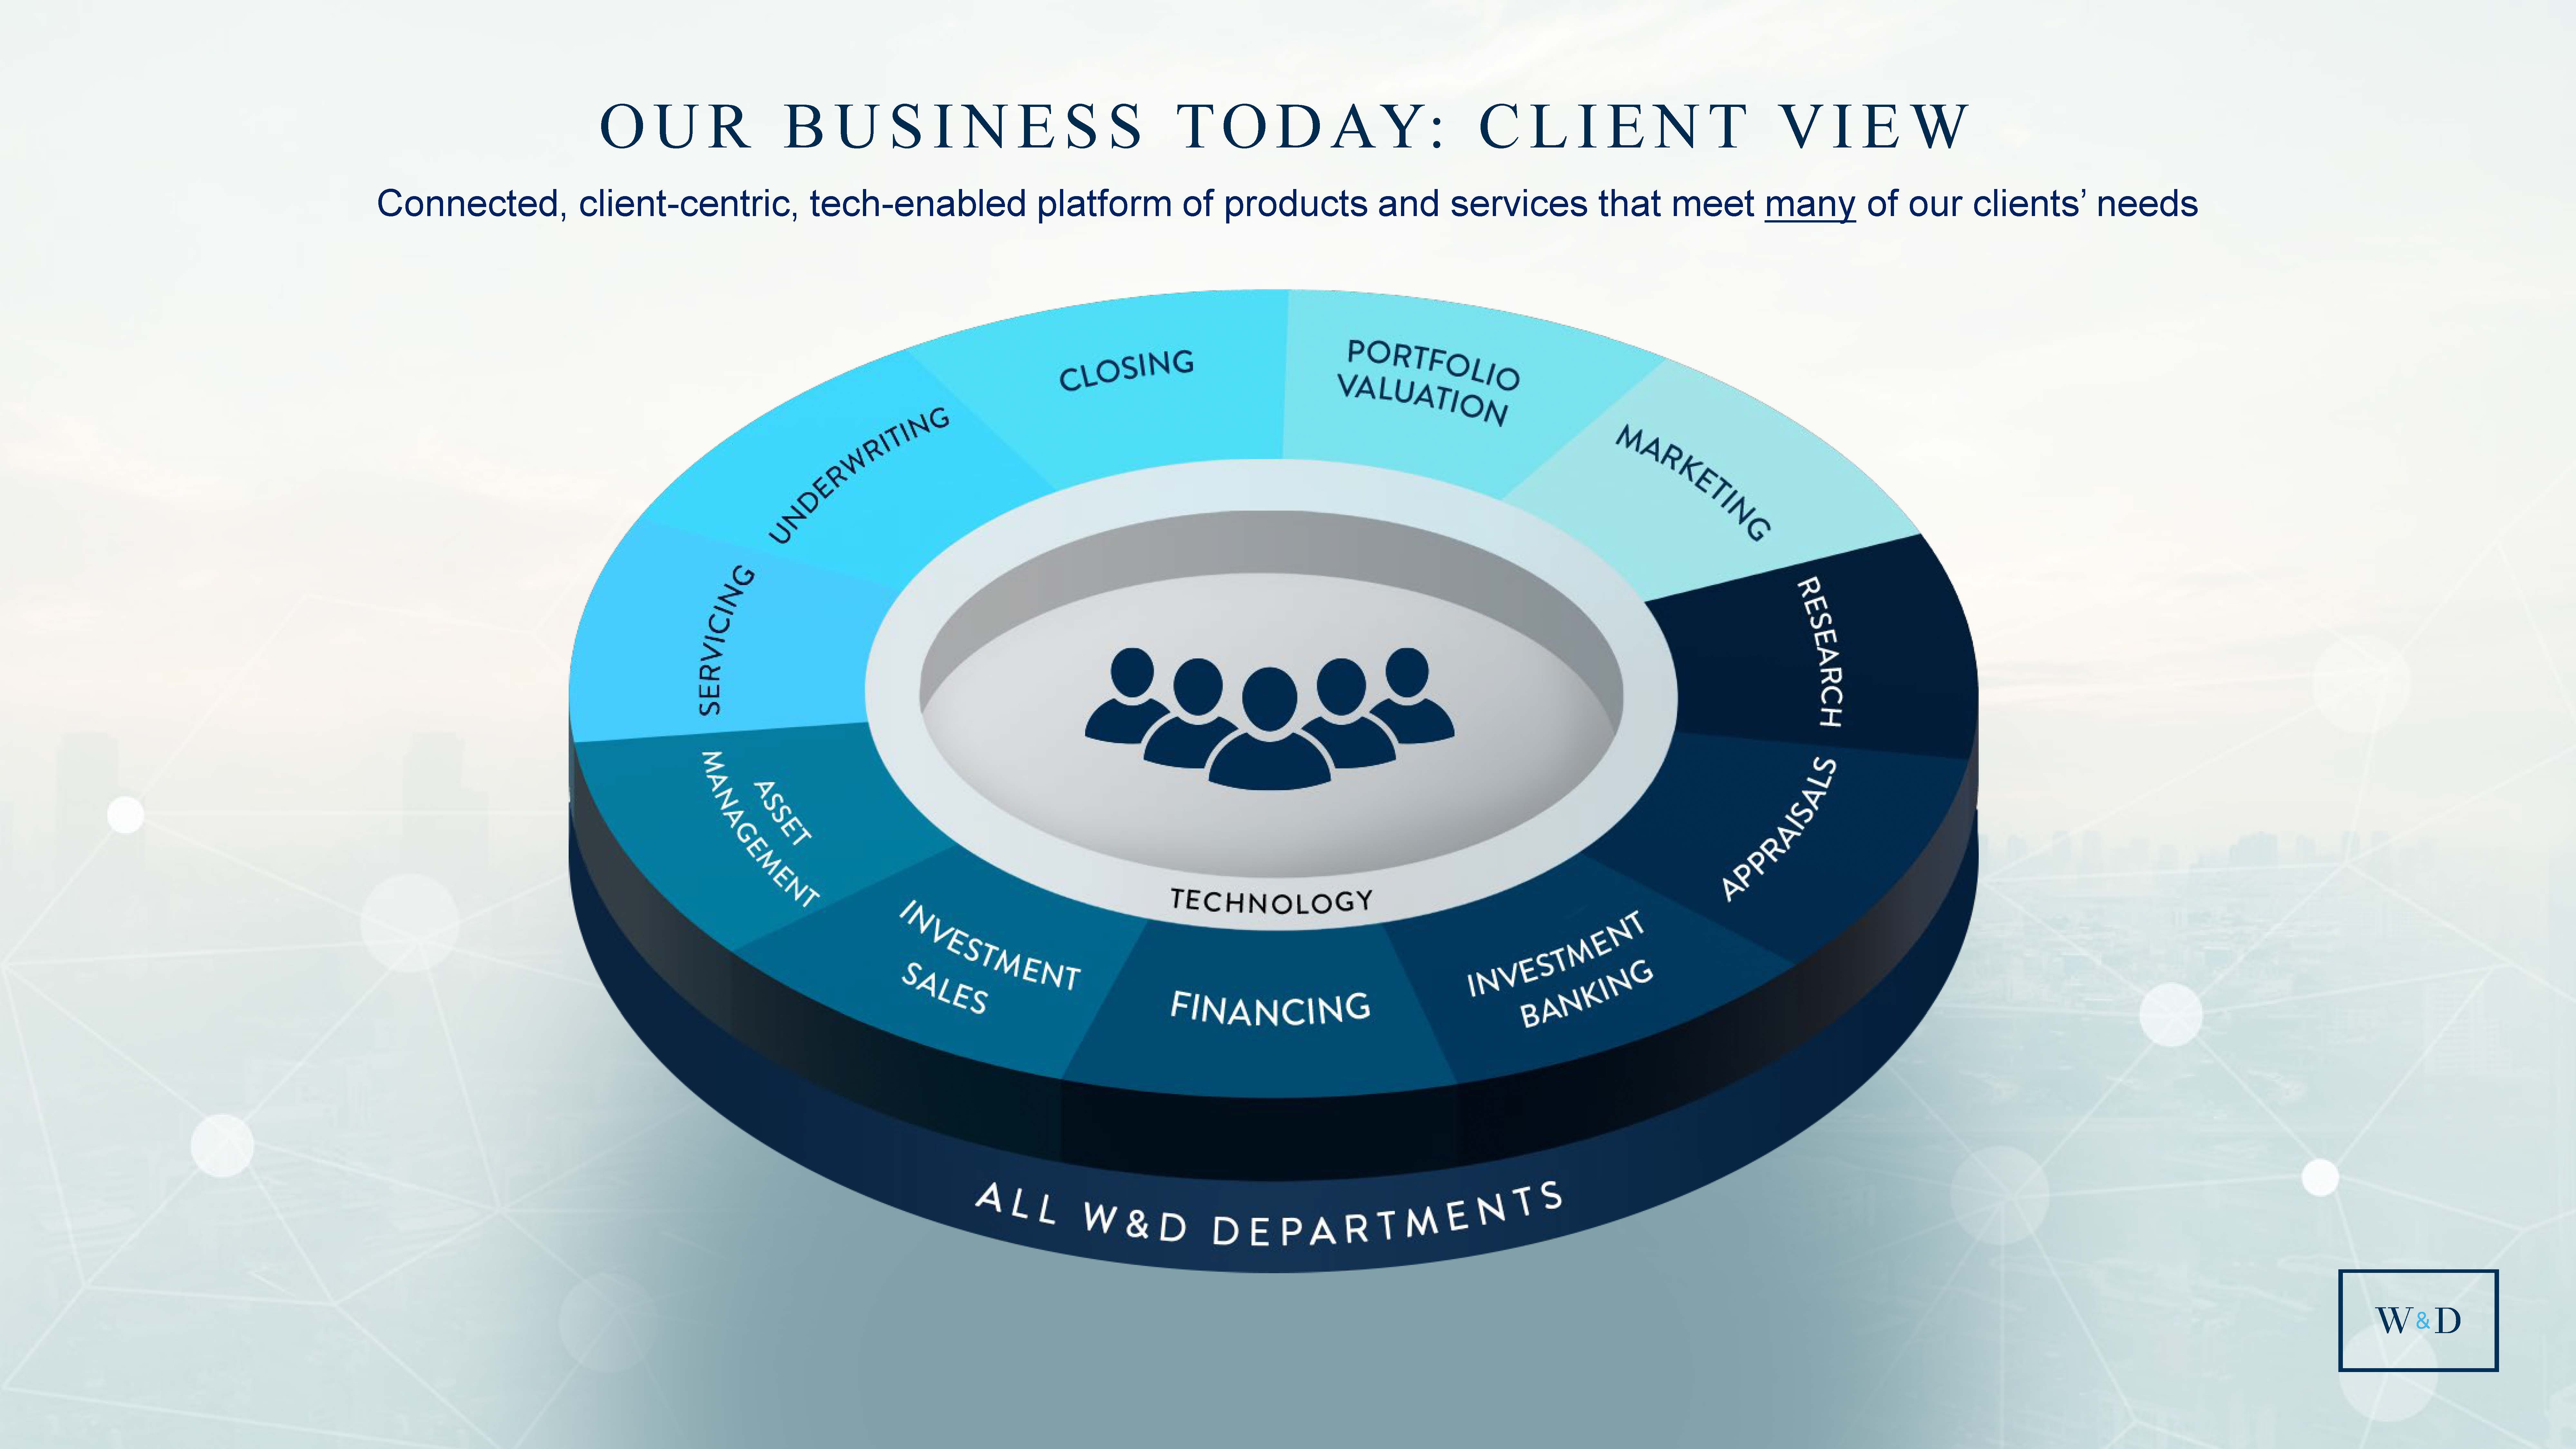
| OUR BUSINESS TODAY: CLIENT VIEW Connected, client-centric, tech-enabled platform of products and services that meet many of our clients’ needs 33 |
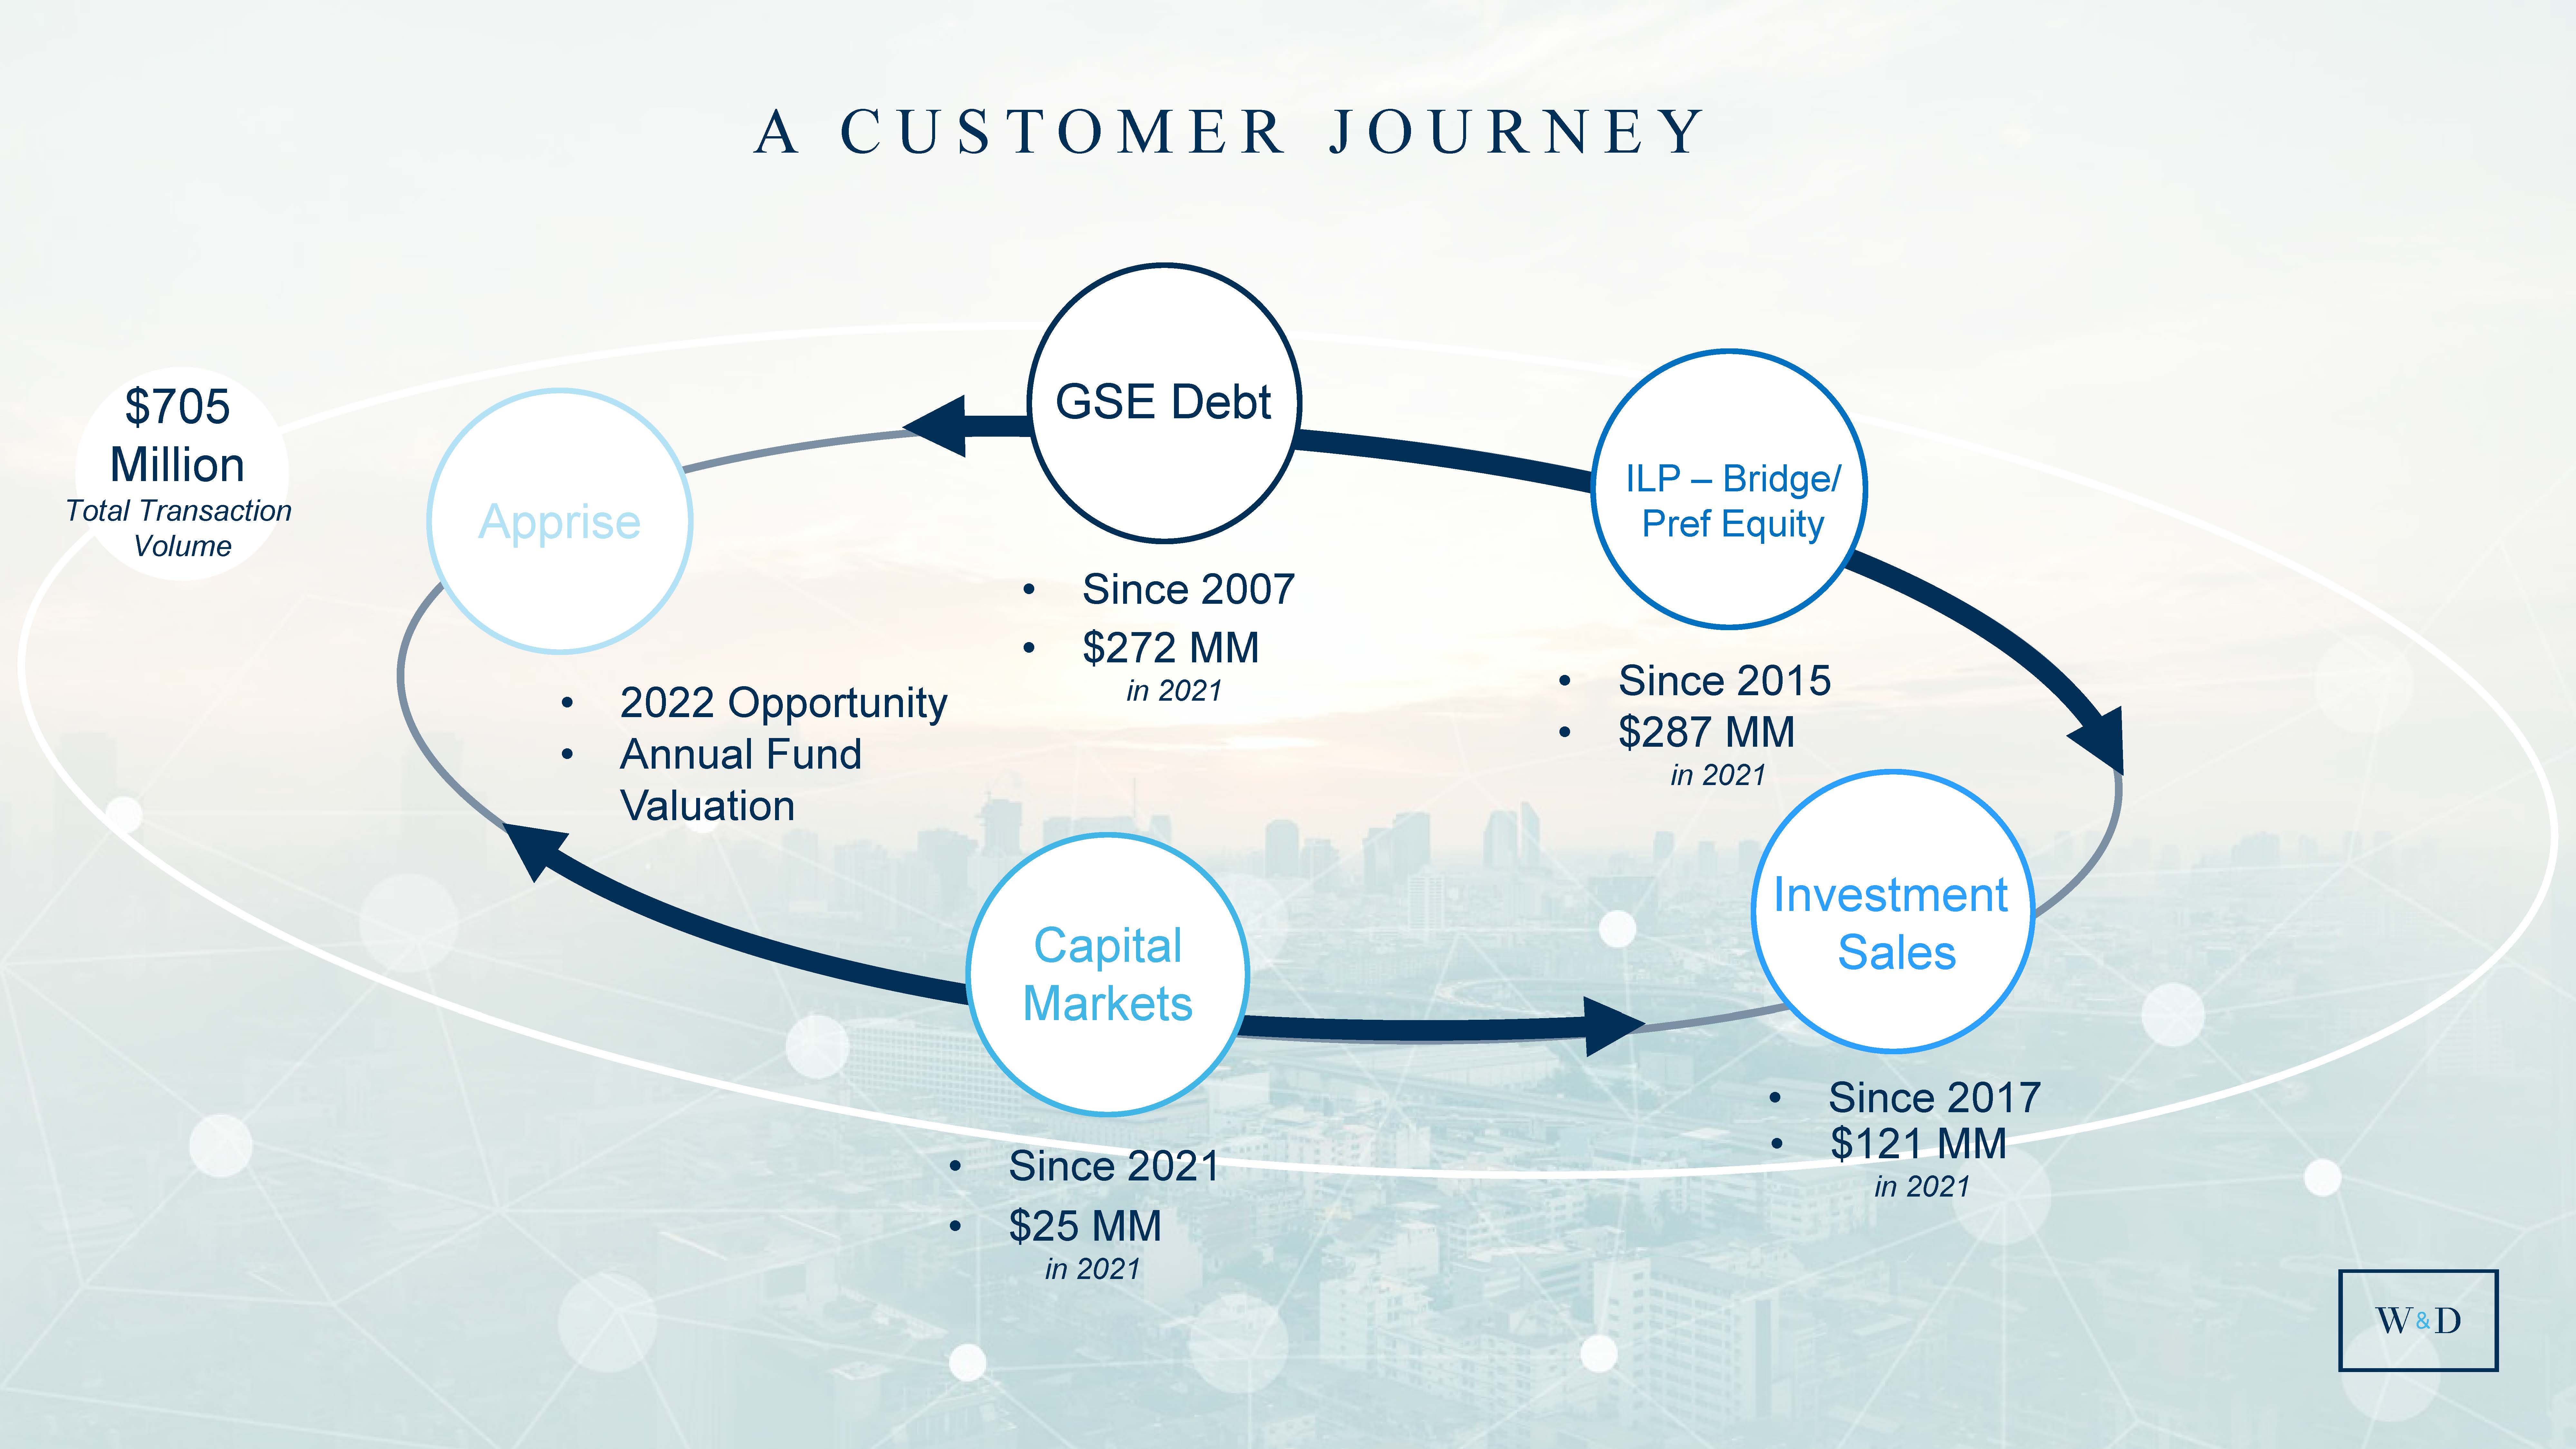
| 33 A CUSTOMER JOURNEY ILP – Bridge/ Pref Equity • Since 2015 Investment Sales • Since 2017 • Since 2021 Capital Markets Apprise • 2022 Opportunity • Annual Fund Valuation • Since 2007 GSE Debt $705 Million Total Transaction Volume • $272 MM in 2021 • $287 MM in 2021 • $121 MM in 2021 • $25 MM in 2021 |
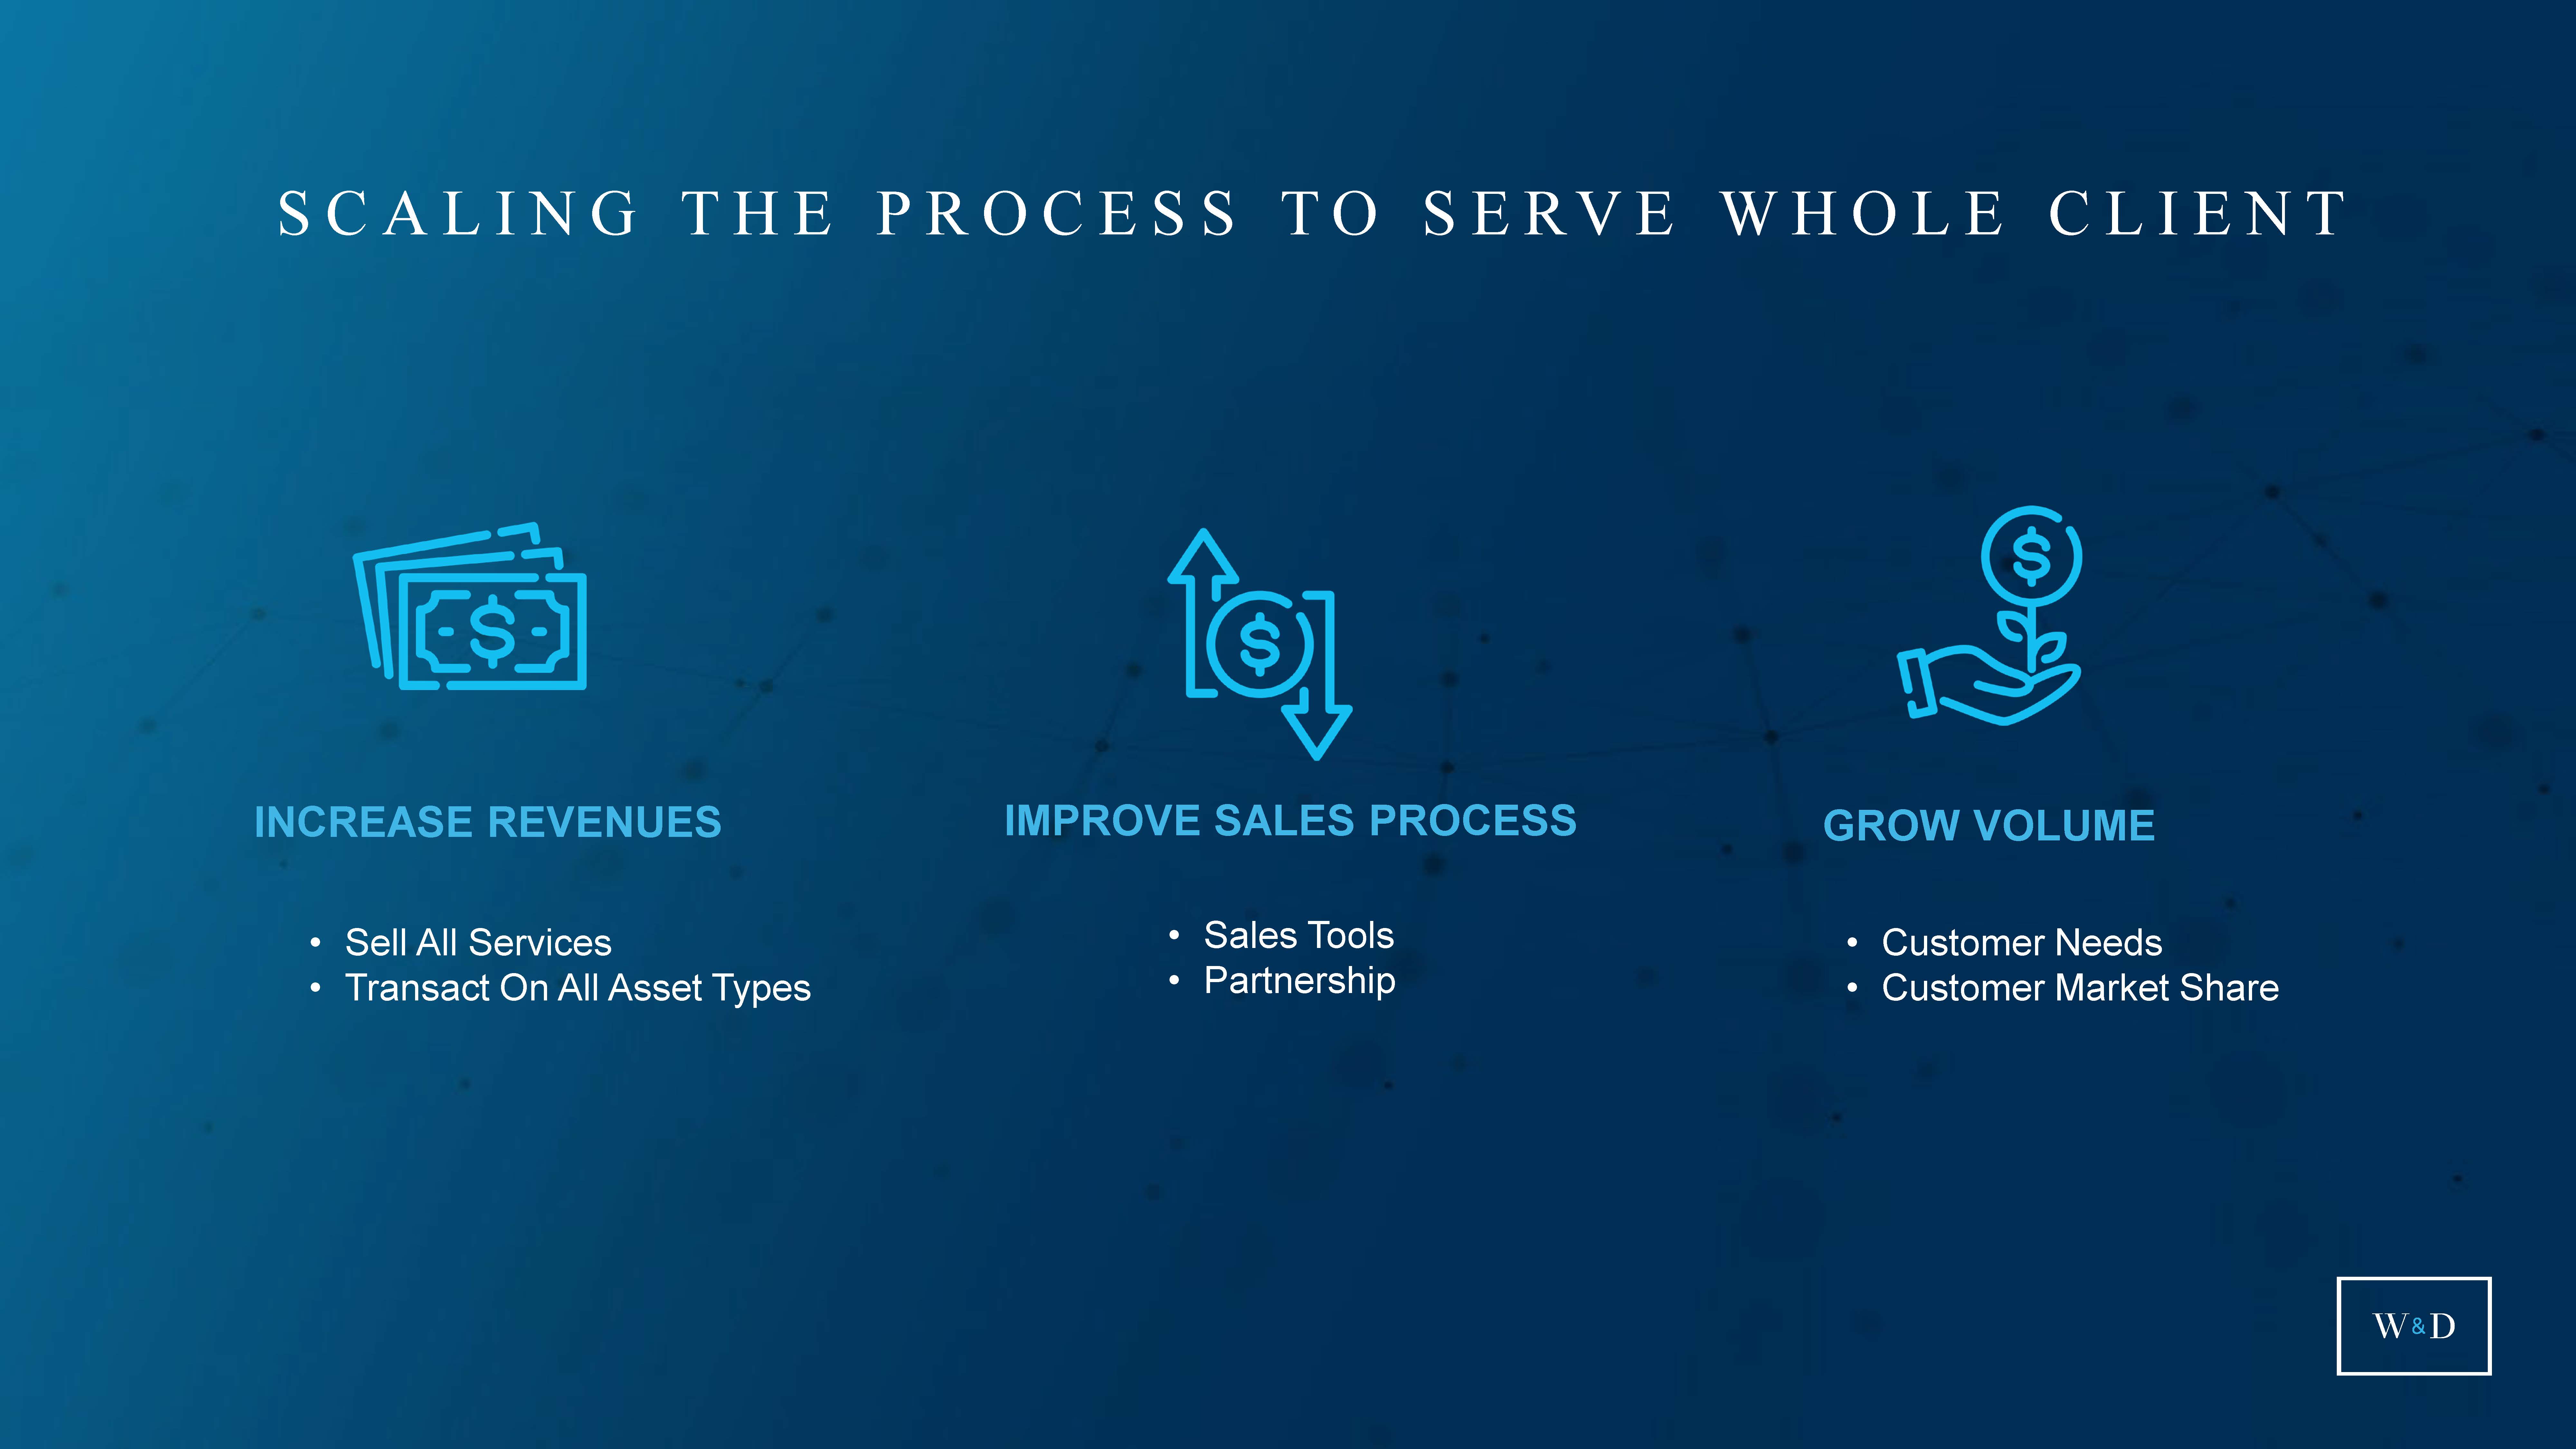
| SCALING THE PROCESS TO SERVE WHOLE CLIENT 34 INCREASE REVENUES GROW VOLUME • Customer Needs • Customer Market Share IMPROVE SALES PROCESS • Sales Tools • Partnership • Sell All Services • Transact On All Asset Types |
| STEVE THEOBALD Executive Vice President & Chief Financial Officer OPERATING PERFORMANCE |

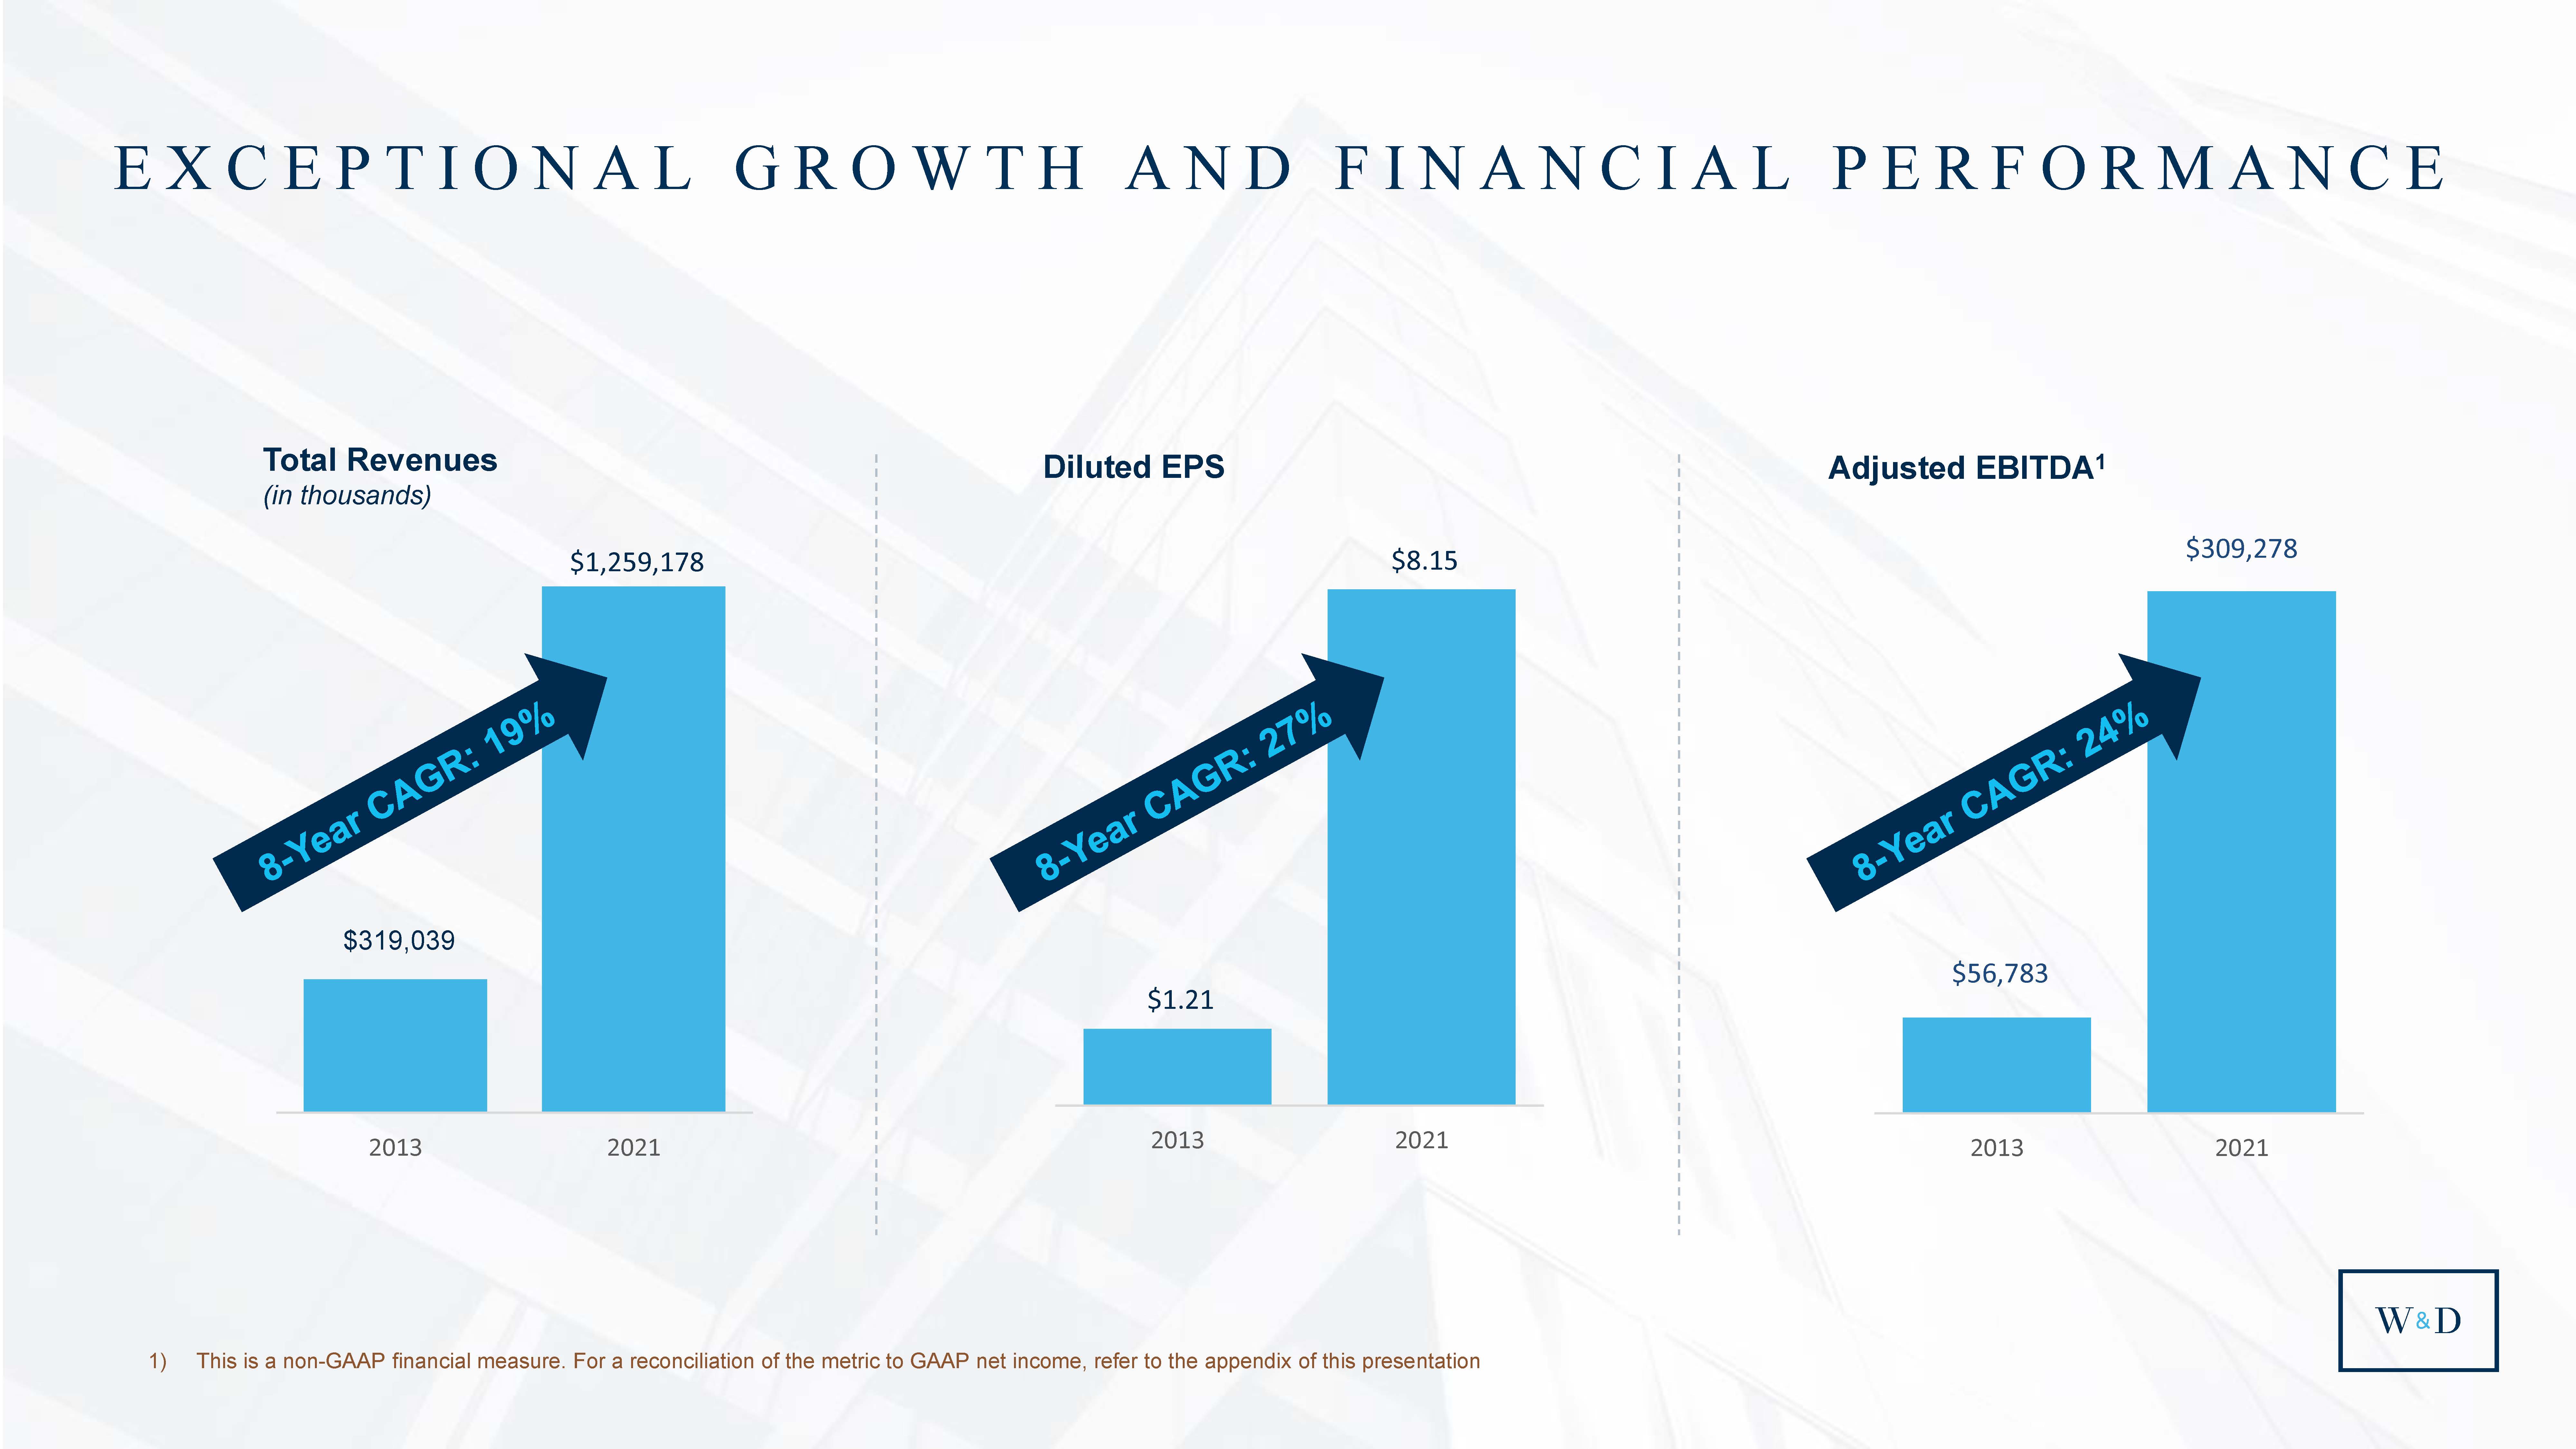
| $319,039 $1,259,178 2013 2021 37 Total Revenues (in thousands) Diluted EPS $1.21 $8.15 2013 2021 EXCEPTIONAL GROWTH AND FINANCIAL PERFORMANCE $56,783 $309,278 2013 2021 Adjusted EBITDA1 1) This is a non-GAAP financial measure. For a reconciliation of the metric to GAAP net income, refer to the appendix of this presentation |
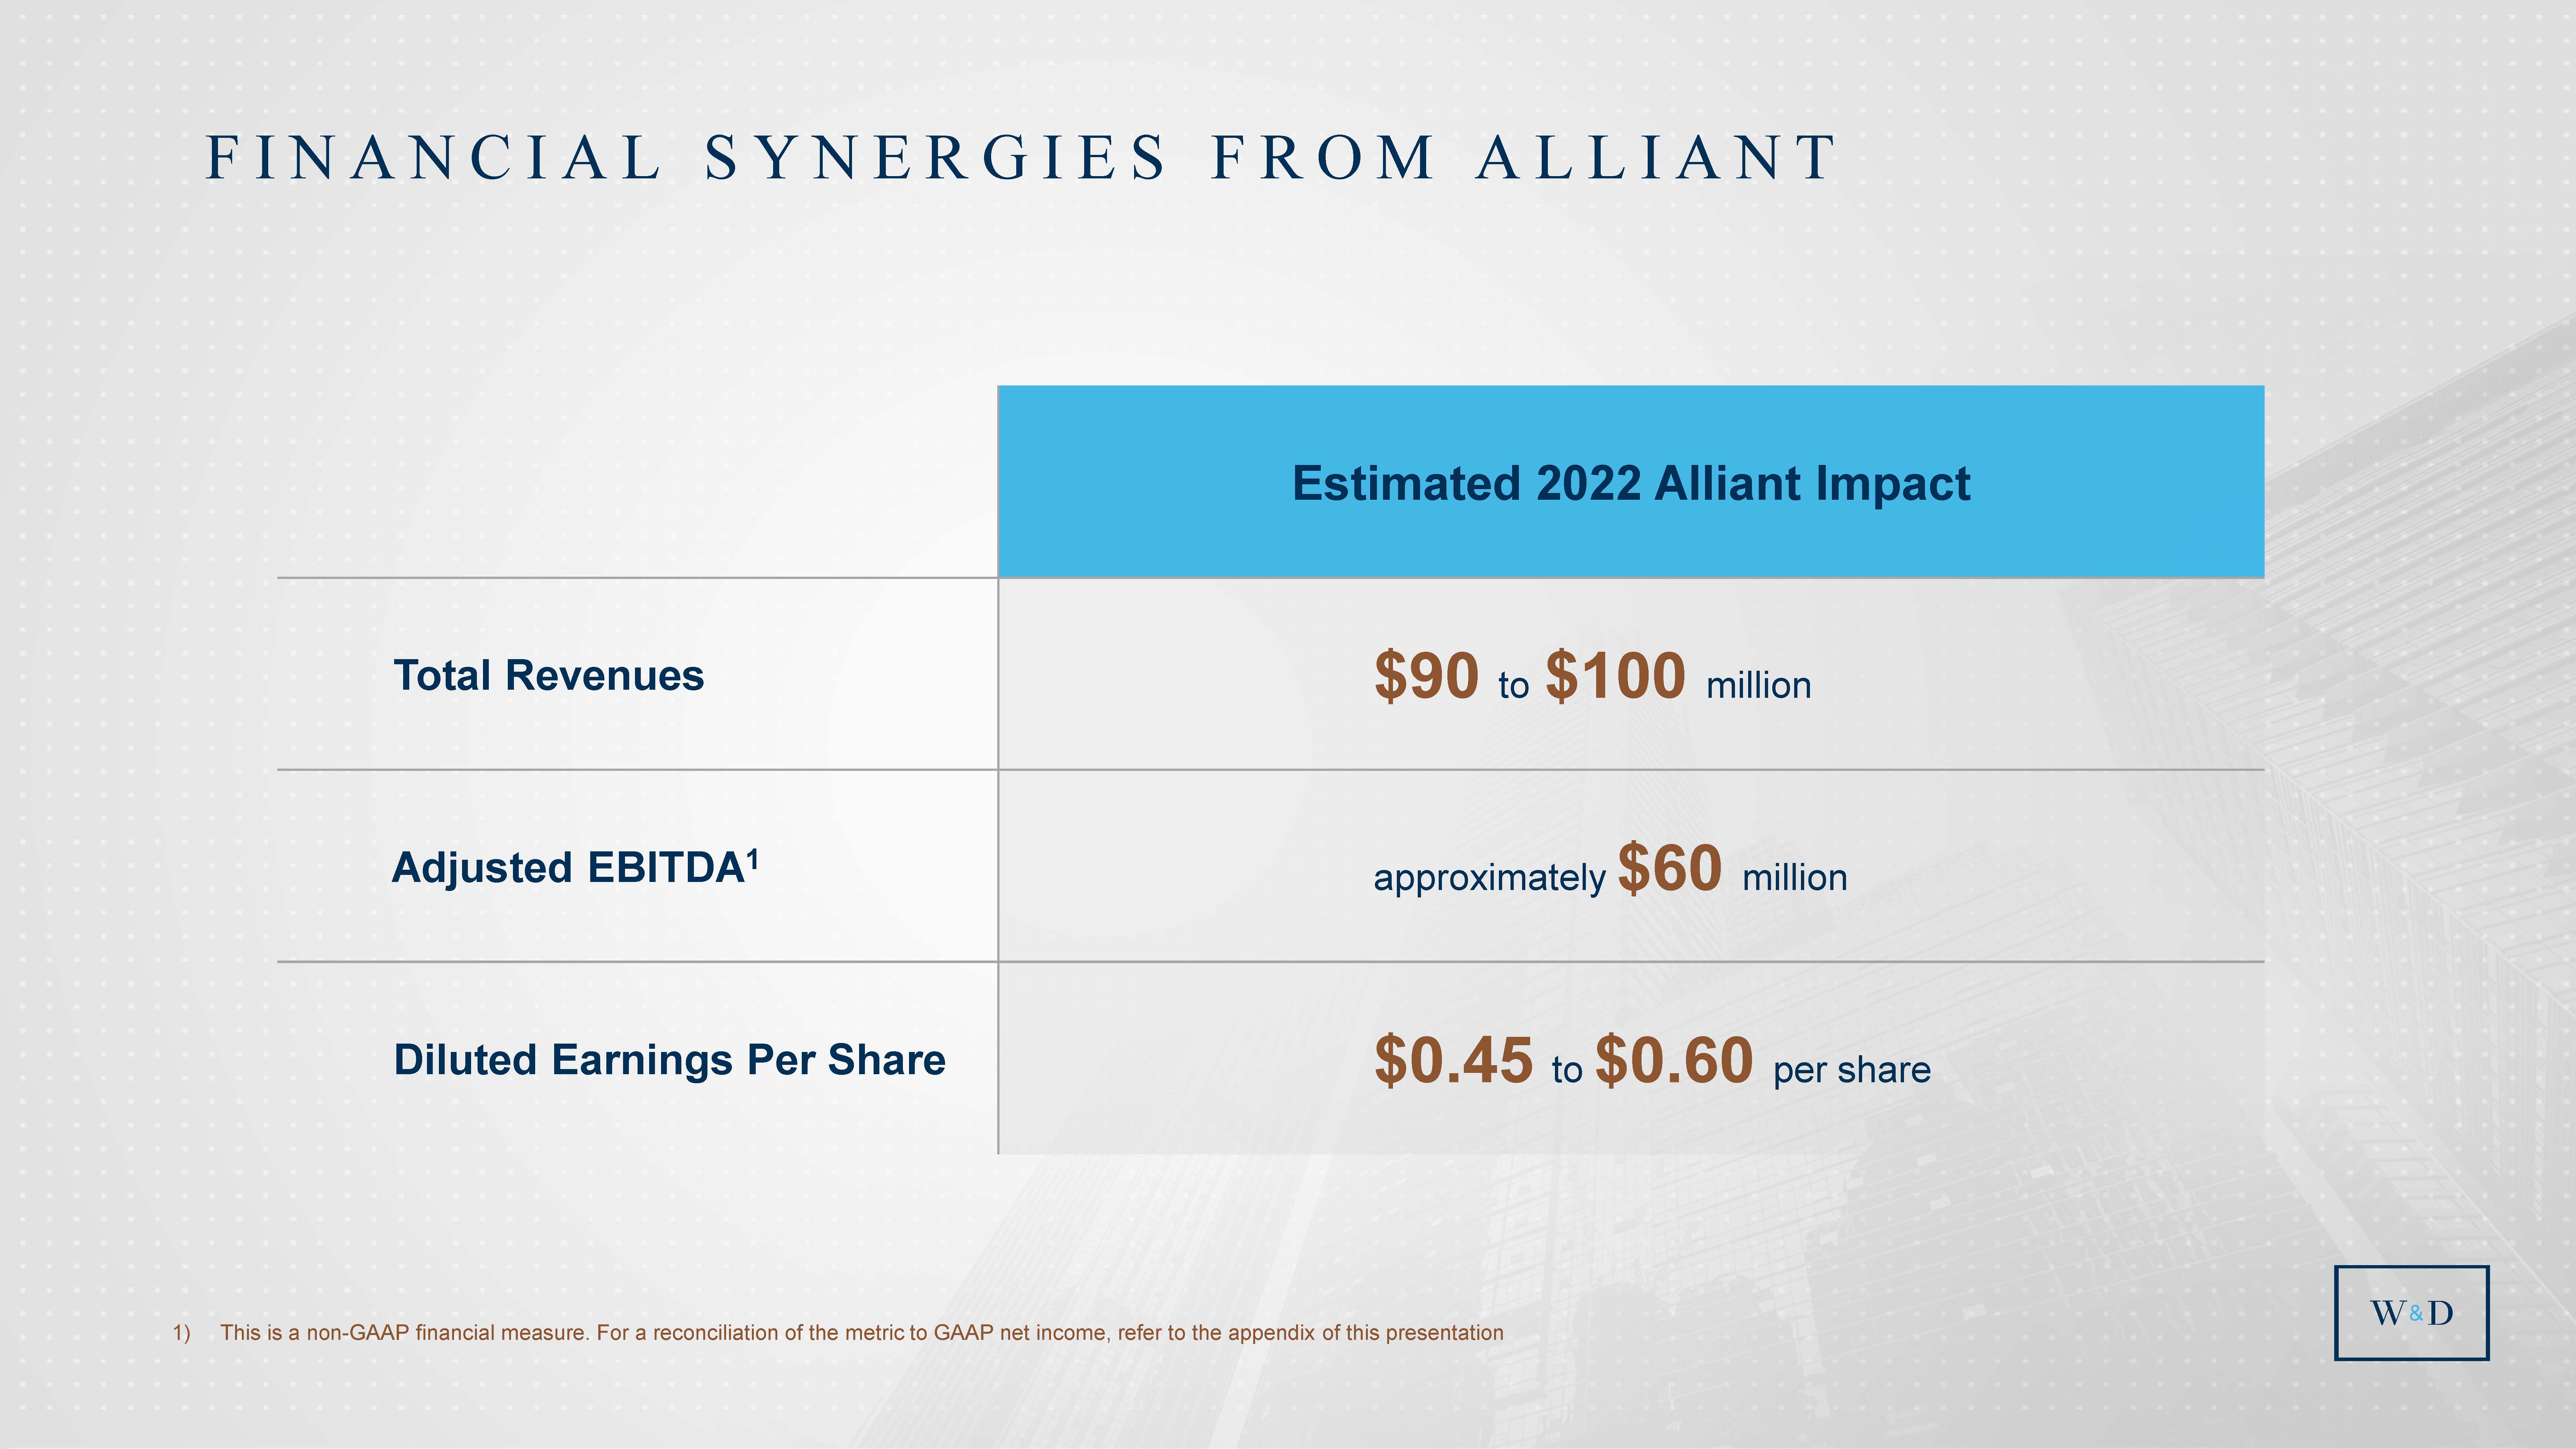
| FINANCIAL SYNERGIES FROM ALLIANT Estimated 2022 Alliant Impact Total Revenues $90 to $100 million Adjusted EBITDA1 approximately $60 million Diluted Earnings Per Share $0.45 to $0.60 per share 1) This is a non-GAAP financial measure. For a reconciliation of the metric to GAAP net income, refer to the appendix of this presentation 37 |
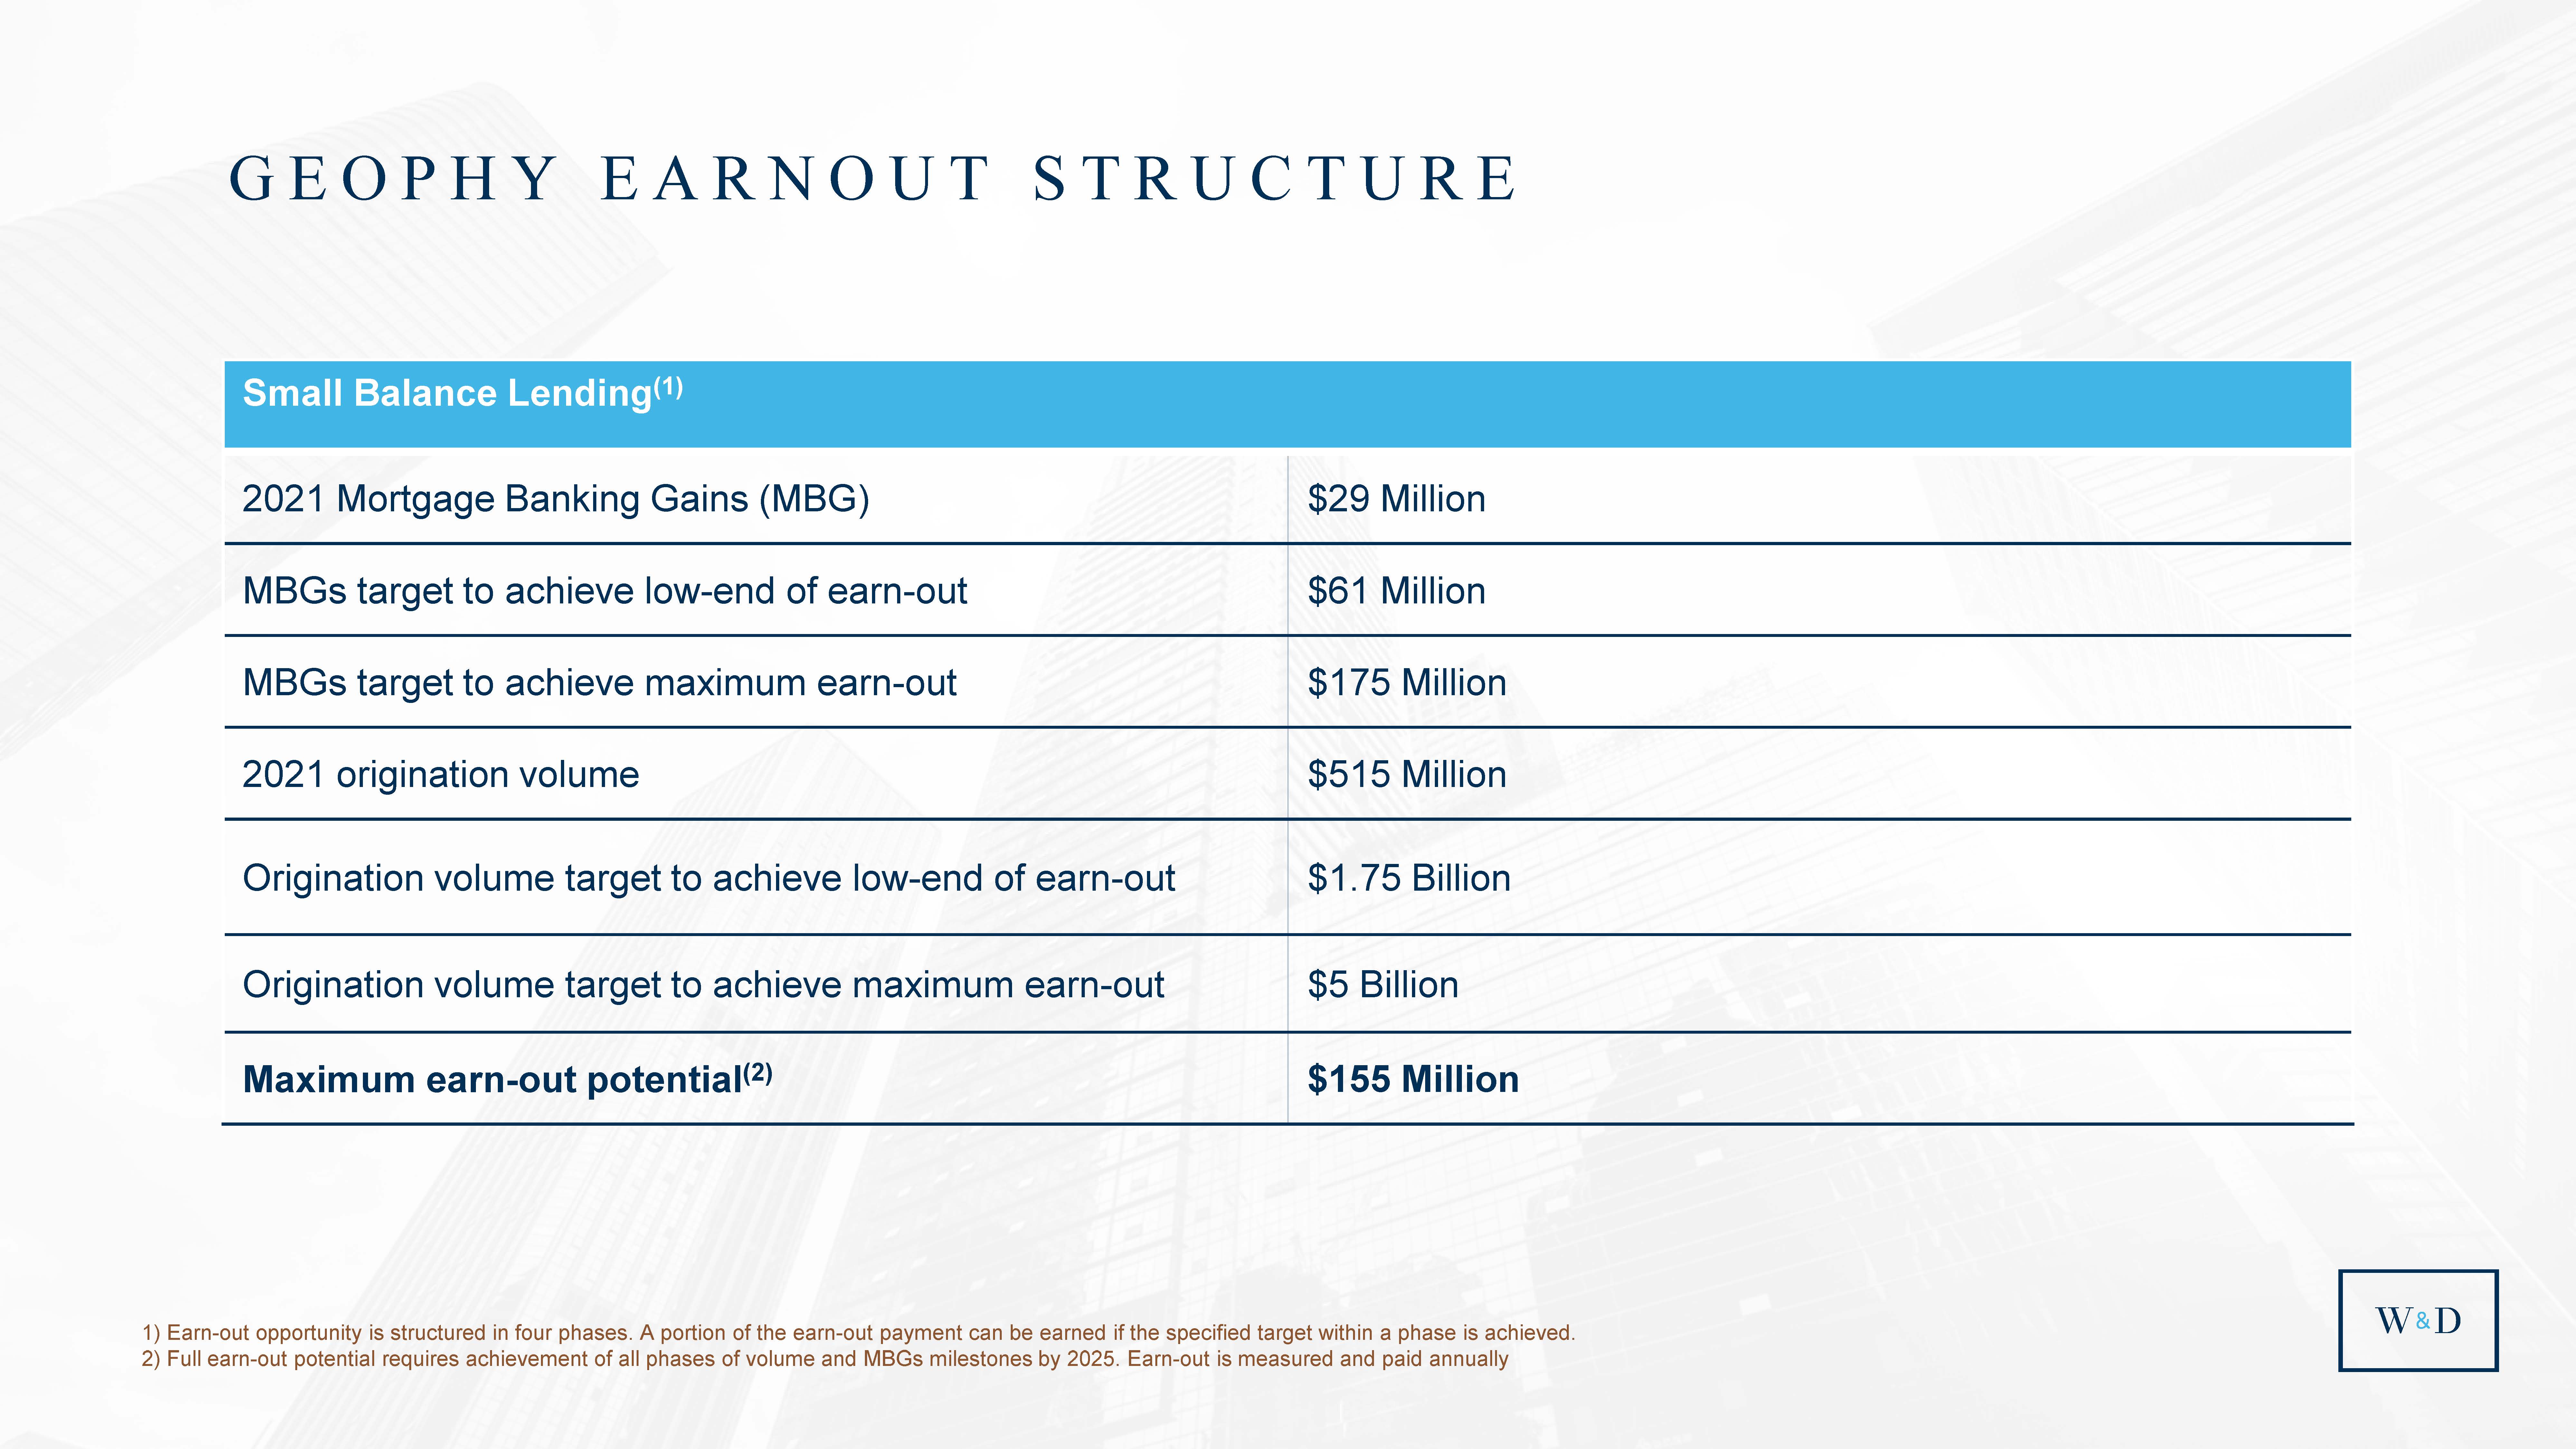
| GEOPHY EARNOUT STRUCTURE 1) Earn-out opportunity is structured in four phases. A portion of the earn-out payment can be earned if the specified target within a phase is achieved. 2) Full earn-out potential requires achievement of all phases of volume and MBGs milestones by 2025. Earn-out is measured and paid annually Small Balance Lending(1) 2021 Mortgage Banking Gains (MBG) $29 Million MBGs target to achieve low-end of earn-out $61 Million MBGs target to achieve maximum earn-out $175 Million 2021 origination volume $515 Million Origination volume target to achieve low-end of earn-out $1.75 Billion Origination volume target to achieve maximum earn-out $5 Billion Maximum earn-out potential(2) $155 Million 38 |
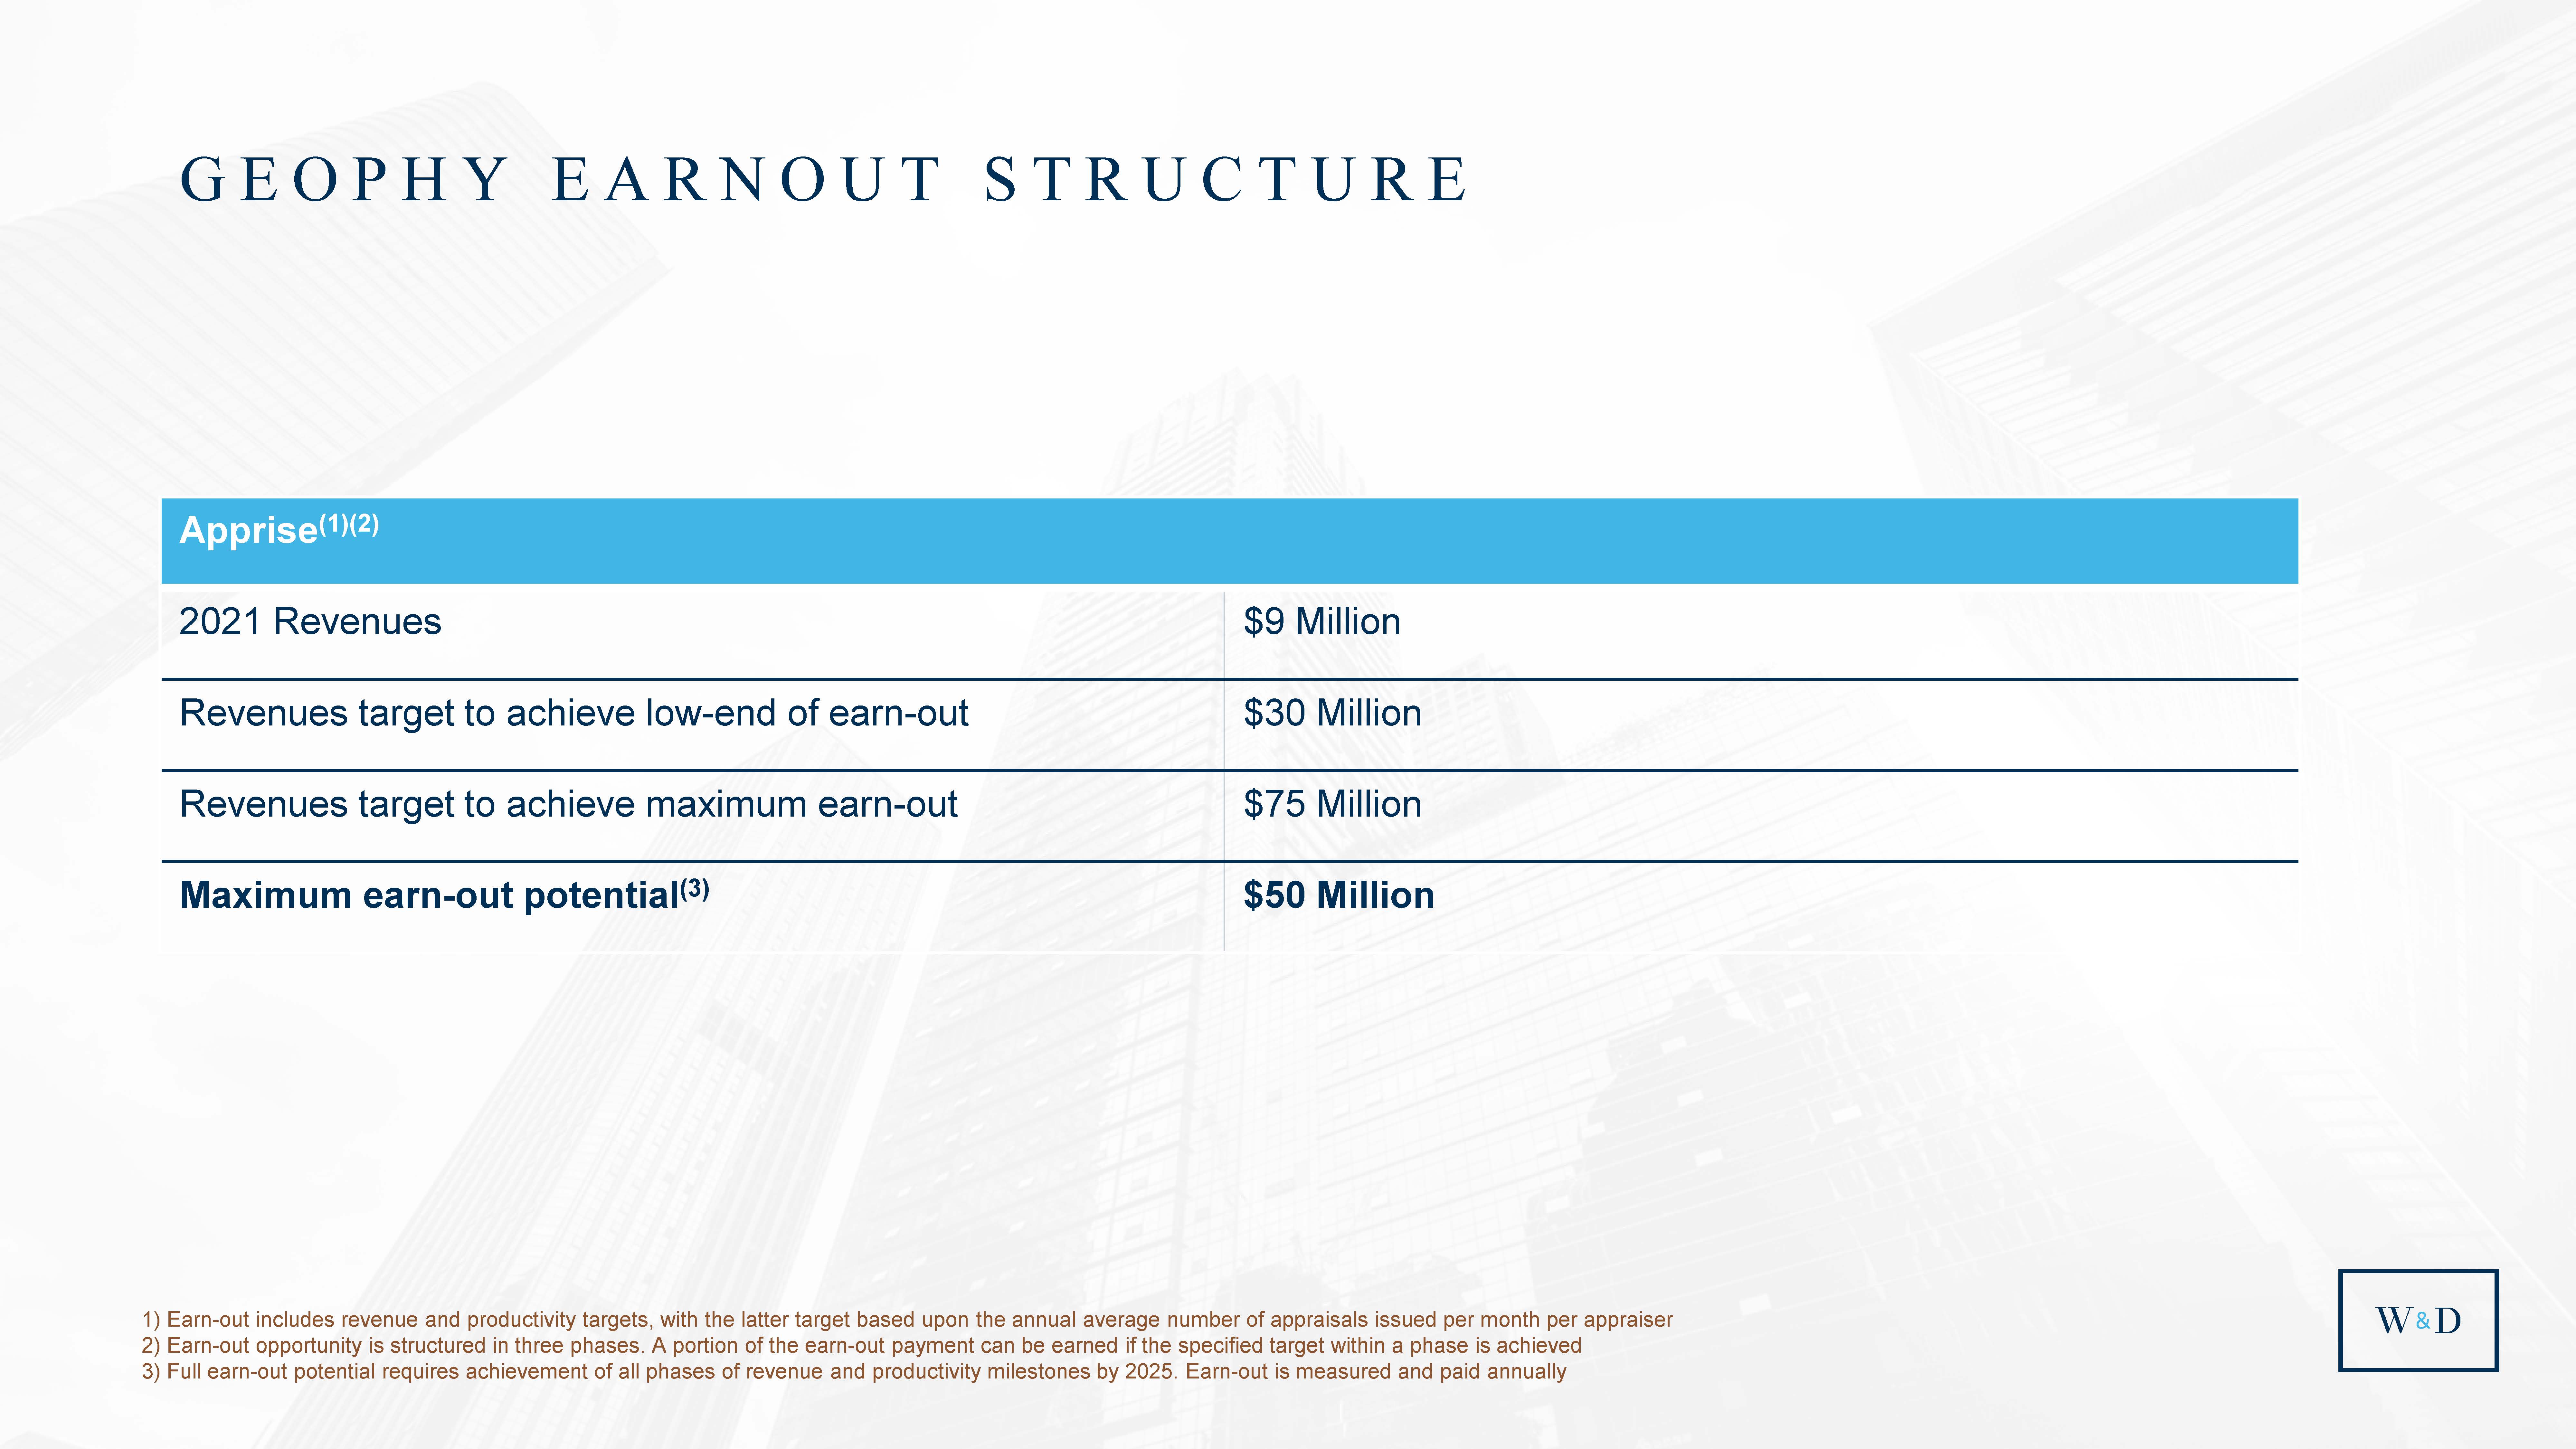
| GEOPHY EARNOUT STRUCTURE 1) Earn-out includes revenue and productivity targets, with the latter target based upon the annual average number of appraisals issued per month per appraiser 2) Earn-out opportunity is structured in three phases. A portion of the earn-out payment can be earned if the specified target within a phase is achieved 3) Full earn-out potential requires achievement of all phases of revenue and productivity milestones by 2025. Earn-out is measured and paid annually Apprise(1)(2) 2021 Revenues $9 Million Revenues target to achieve low-end of earn-out $30 Million Revenues target to achieve maximum earn-out $75 Million Maximum earn-out potential(3) $50 Million 39 |
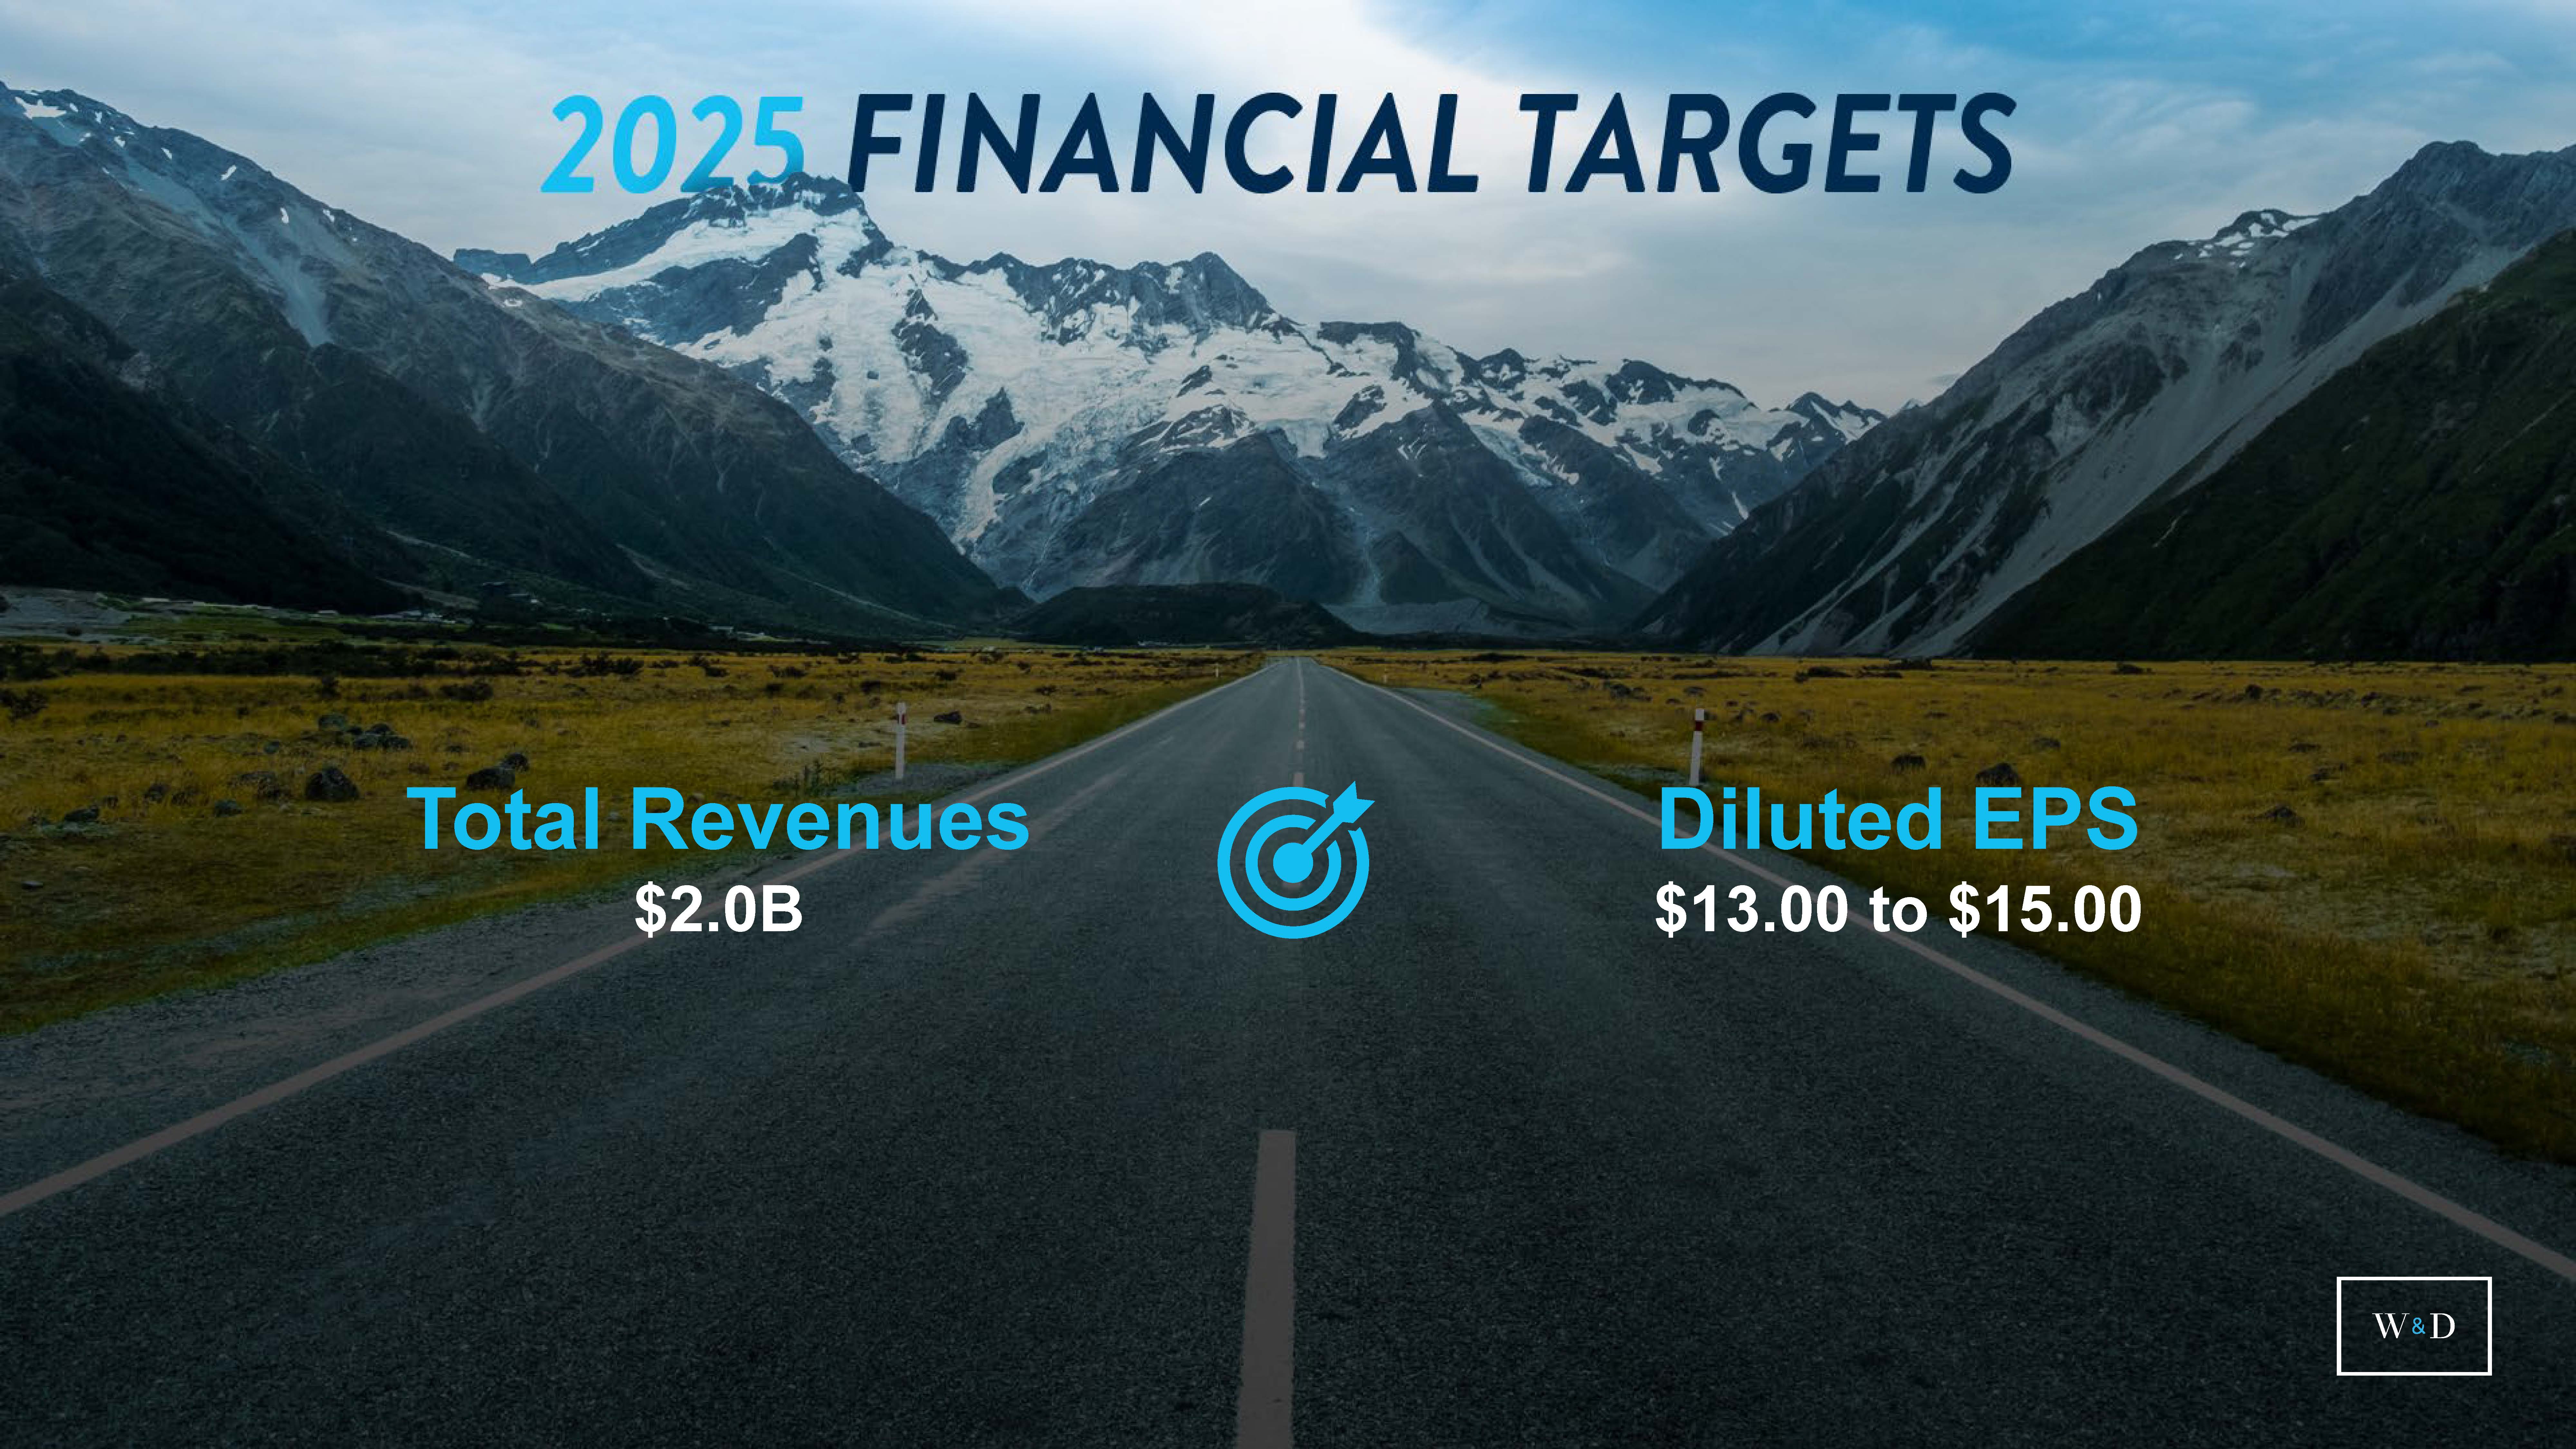
| Total Revenues $2.0B Diluted EPS $13.00 to $15.00 41 |
| GREG FLORKOWSKI Executive Vice President, Business Development OPERATING PERFORMANCE |

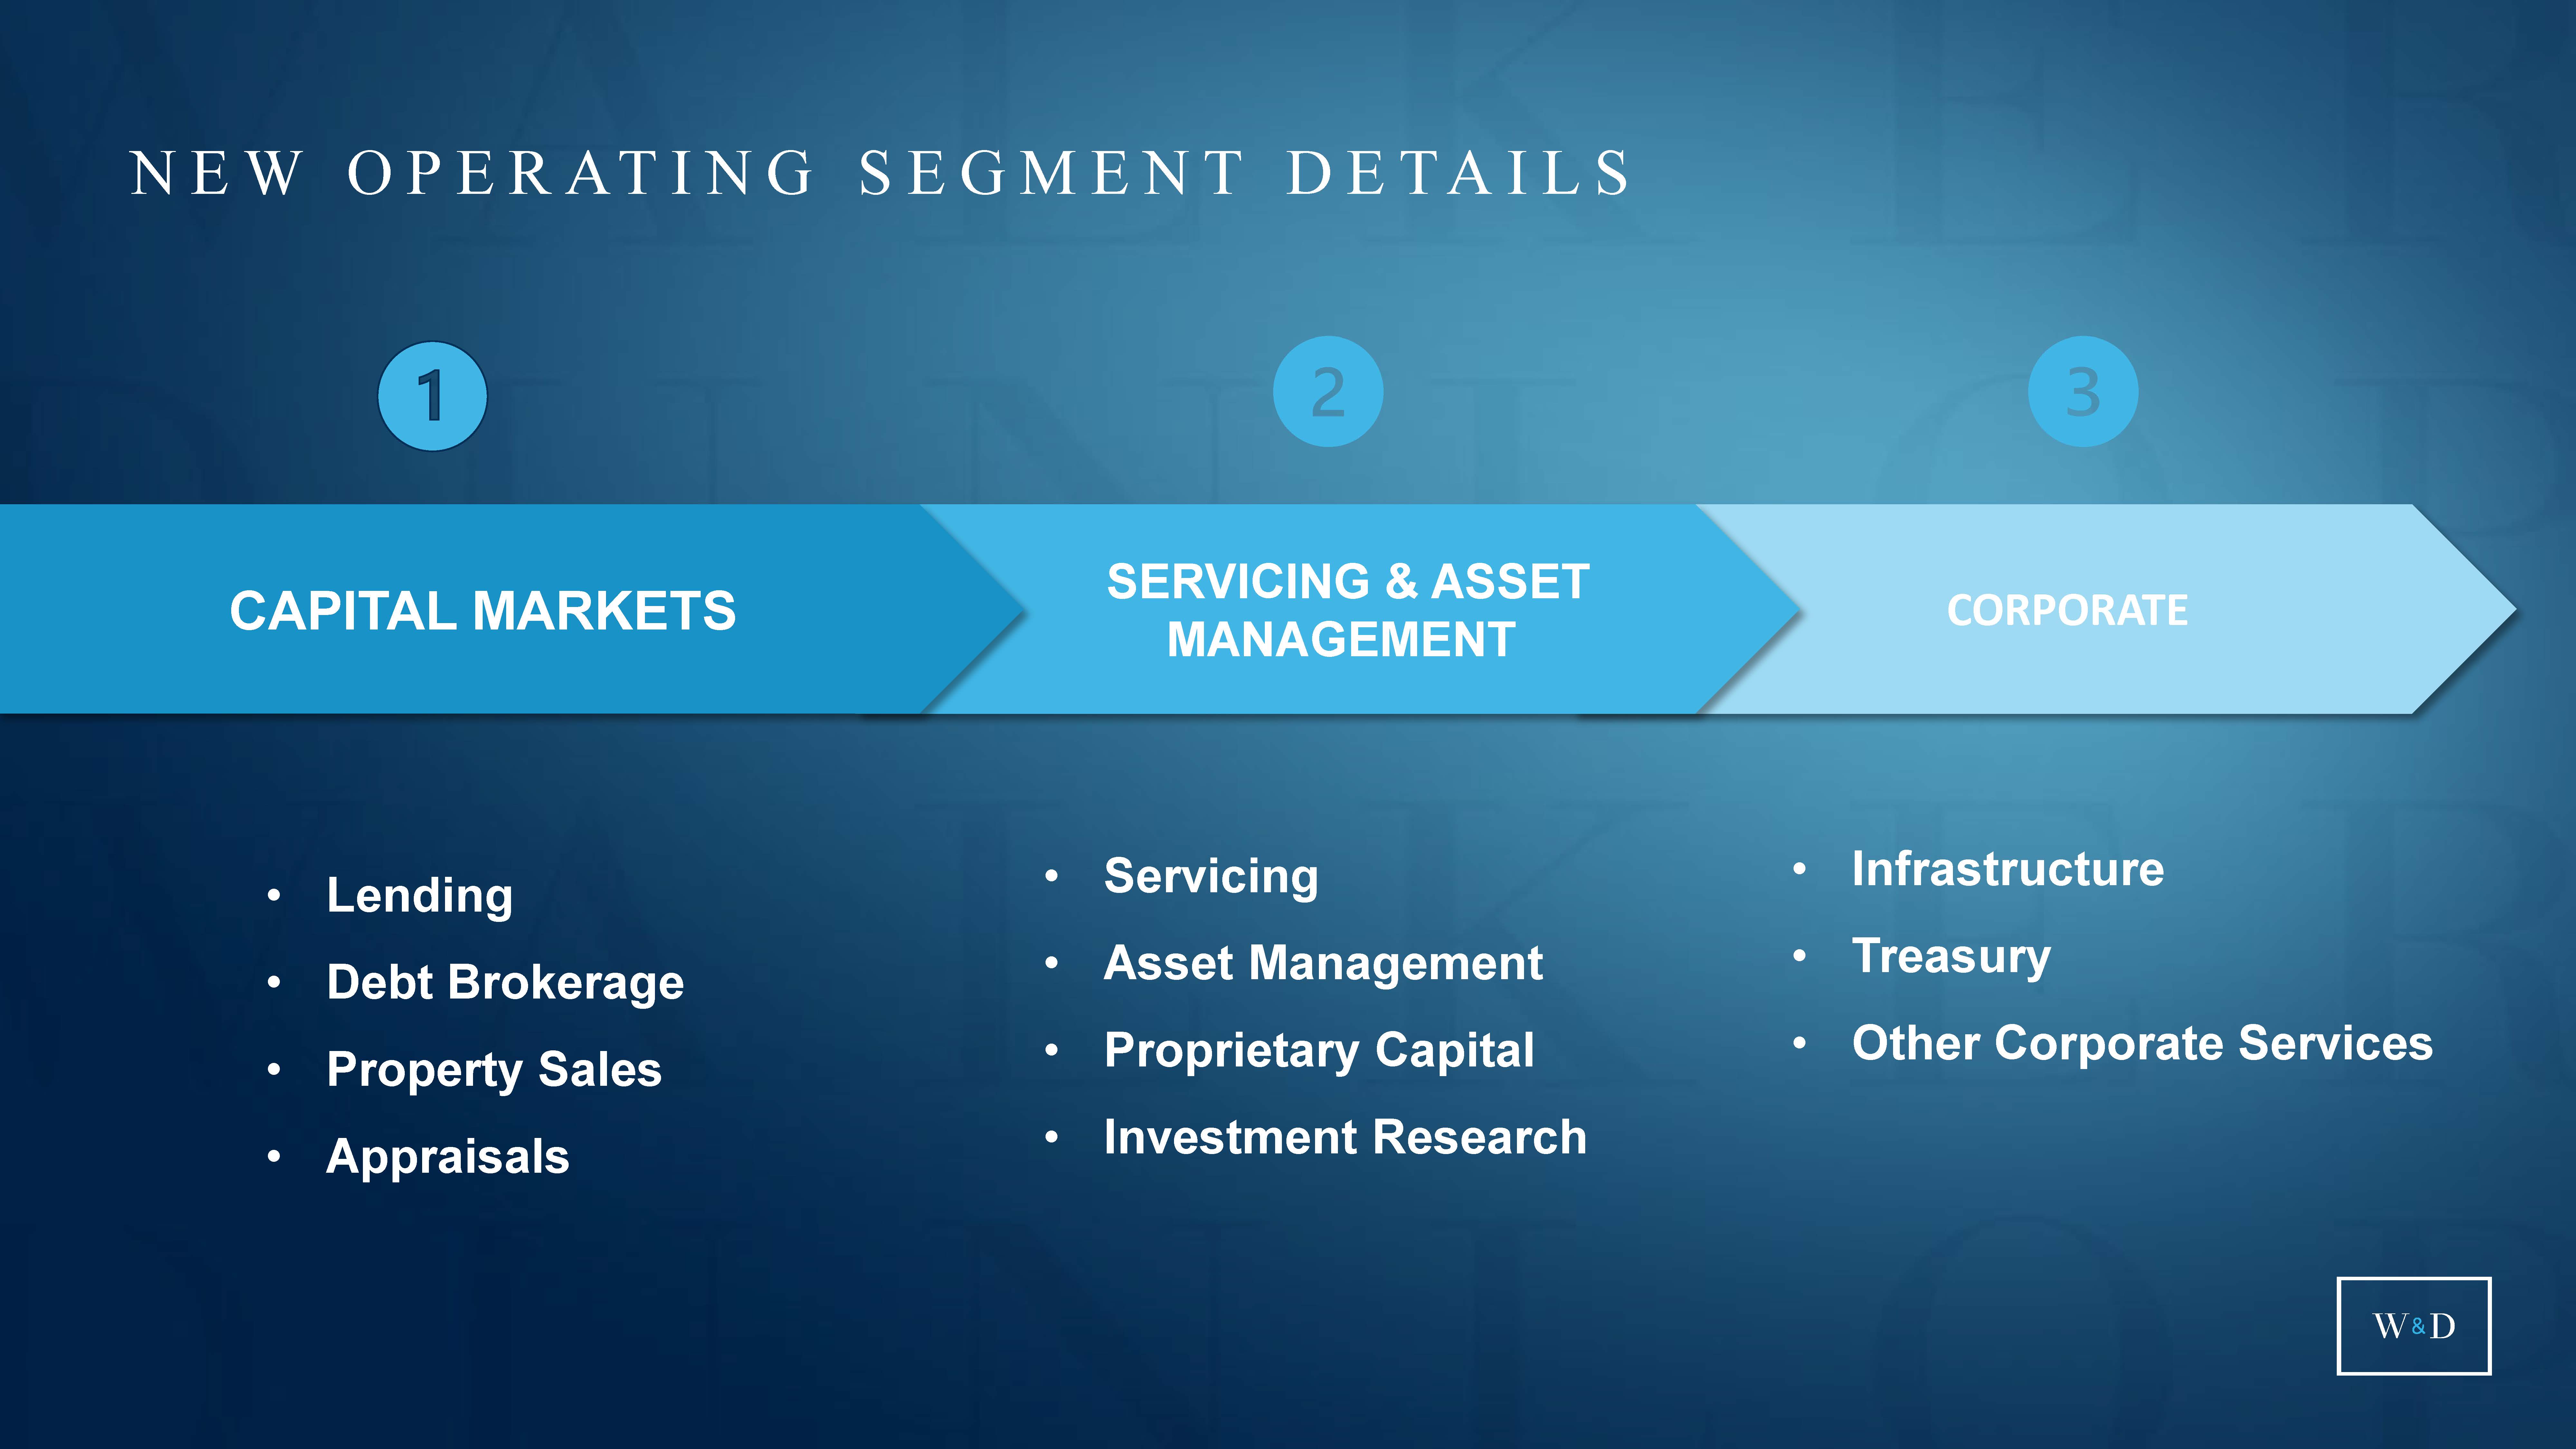
| NEW OPERATING SEGMENT DETAILS 43 • Servicing • Asset Management • Proprietary Capital • Investment Research • Lending • Debt Brokerage • Property Sales • Appraisals • Infrastructure • Treasury • Other Corporate Services CORPORATE SERVICING & ASSET MANAGEMENT CAPITAL MARKETS |
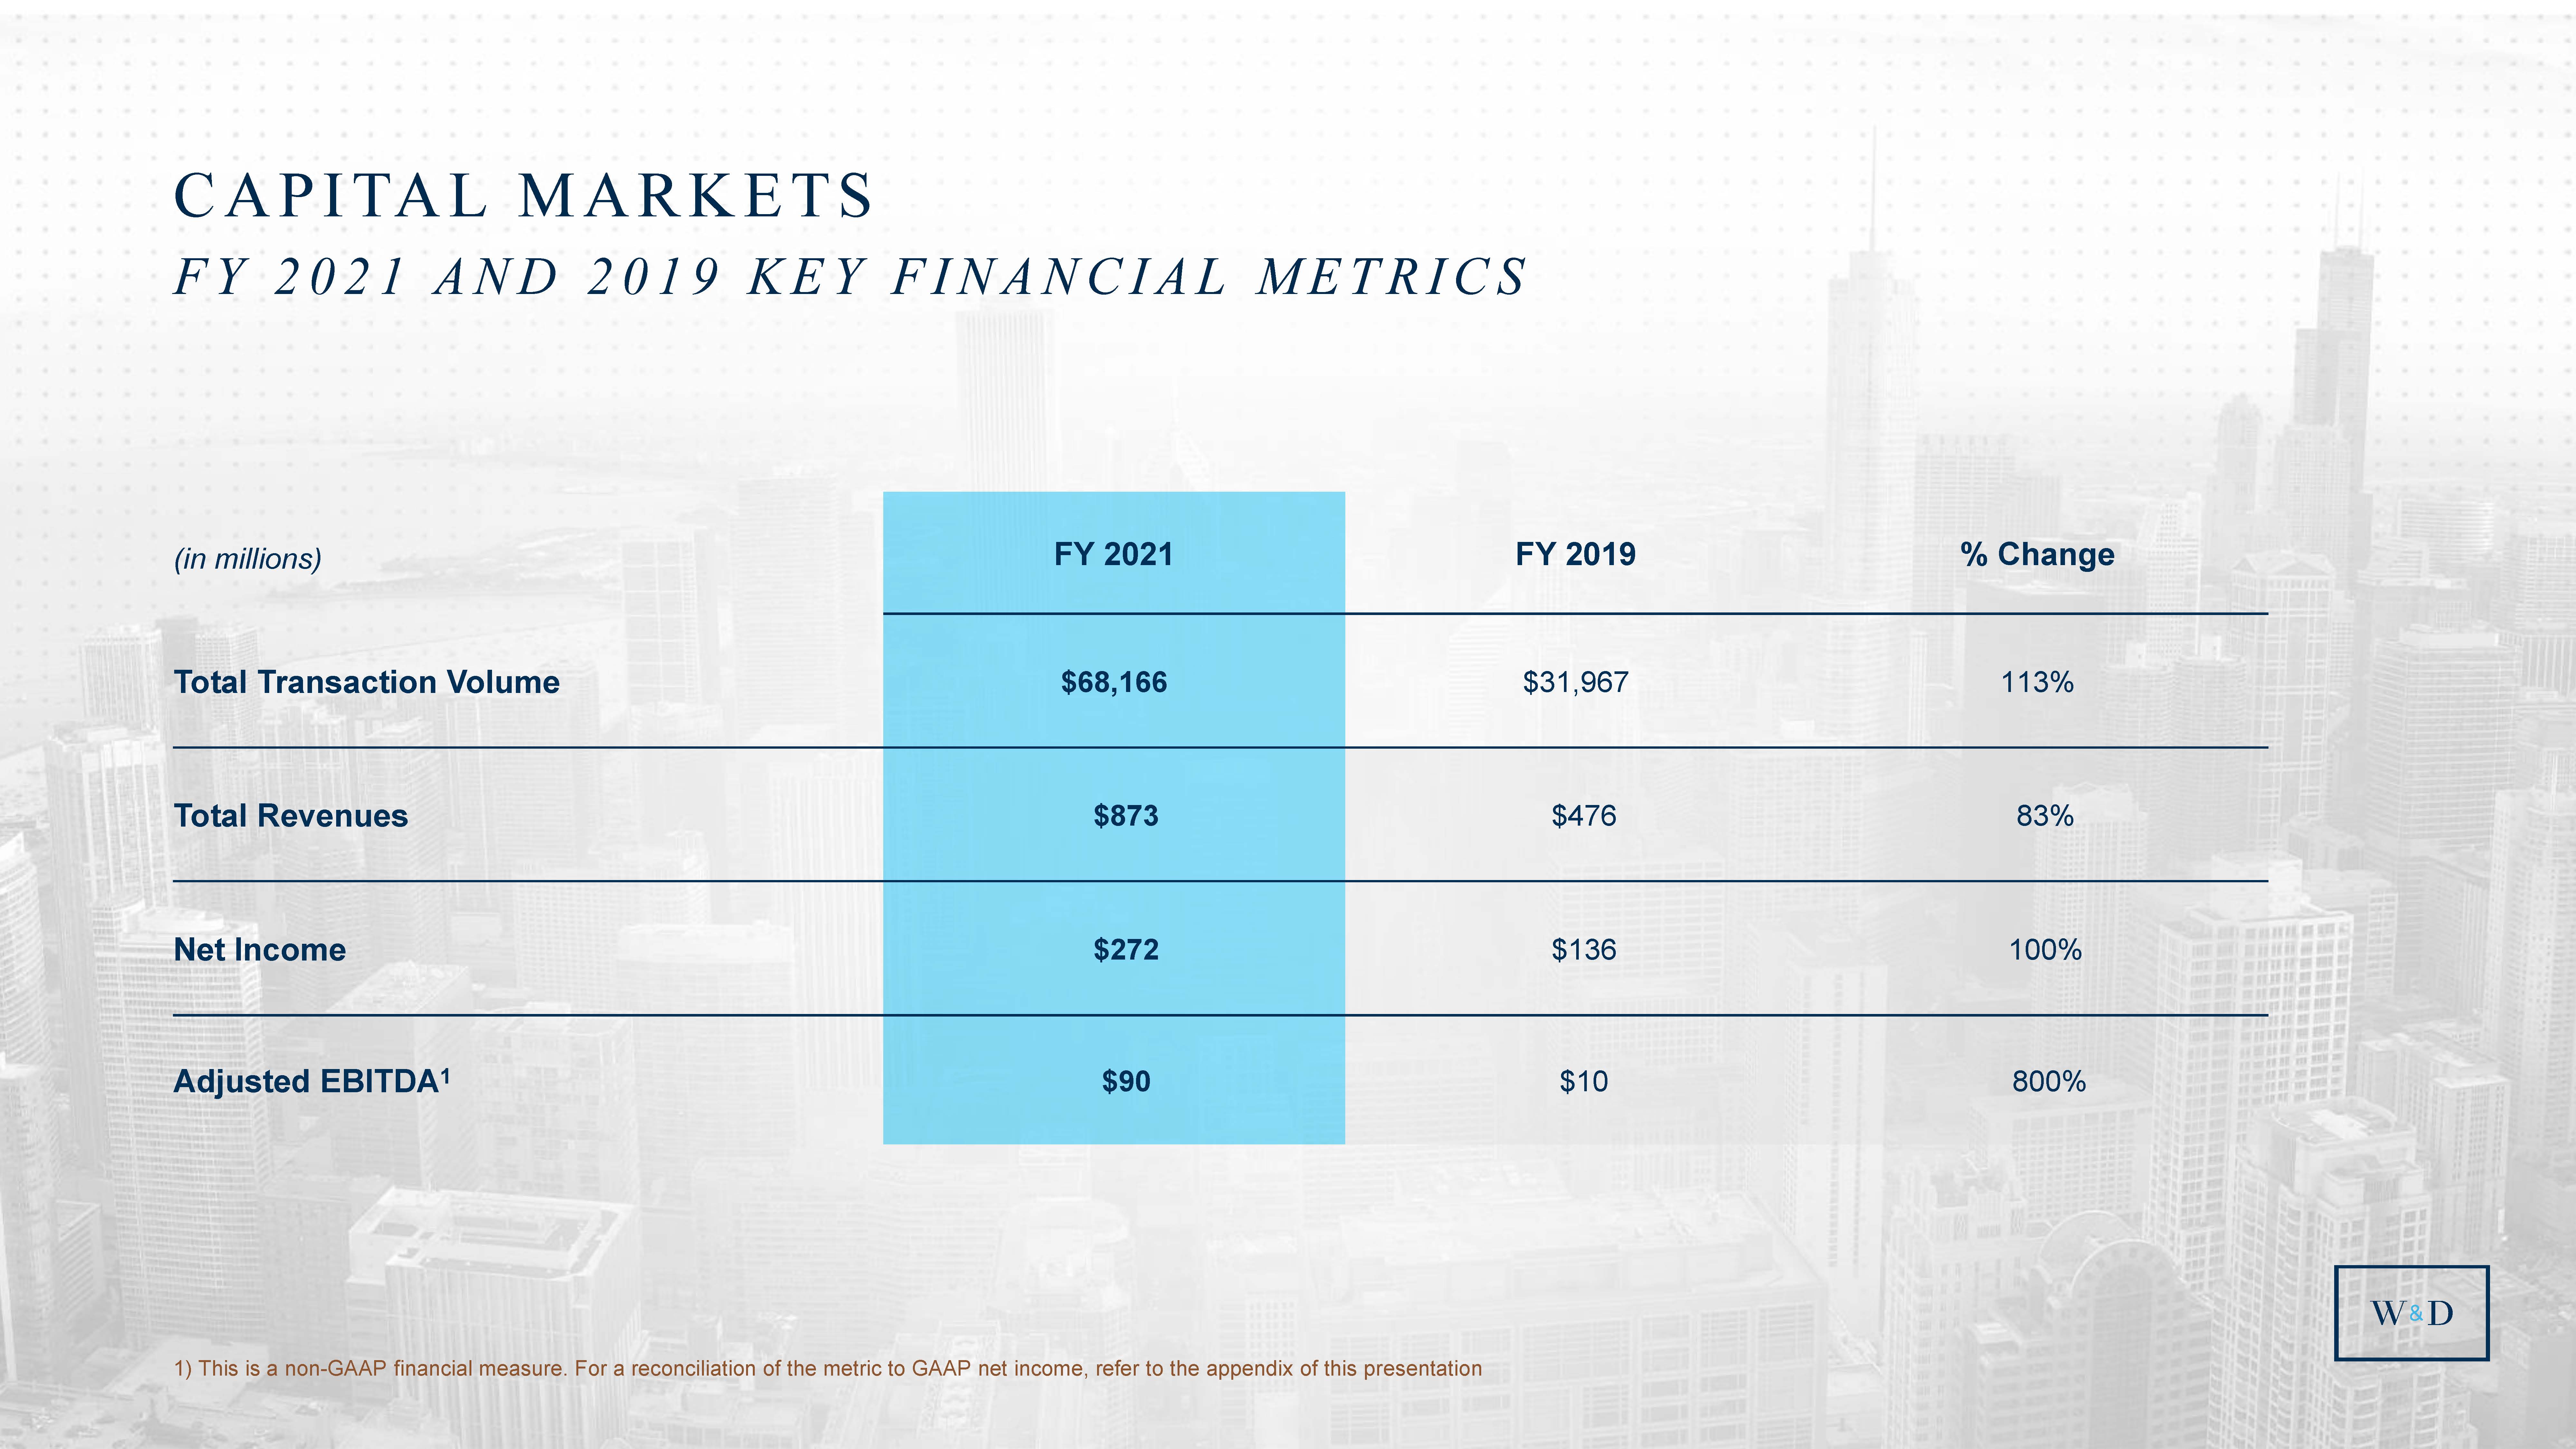
| 43 CAPITAL MARKETS FY 2021 AND 2019 KEY FINANCIAL METRICS 1 (in millions) FY 2021 FY 2019 % Change Total Transaction Volume $68 $32 113% Total Revenues $873 $476 83% Net Income $272 $136 100% Adjusted EBITDA1 $90 $10 800% 1) This is a non-GAAP financial measure. For a reconciliation of the metric to GAAP net income, refer to the appendix of this presentation |
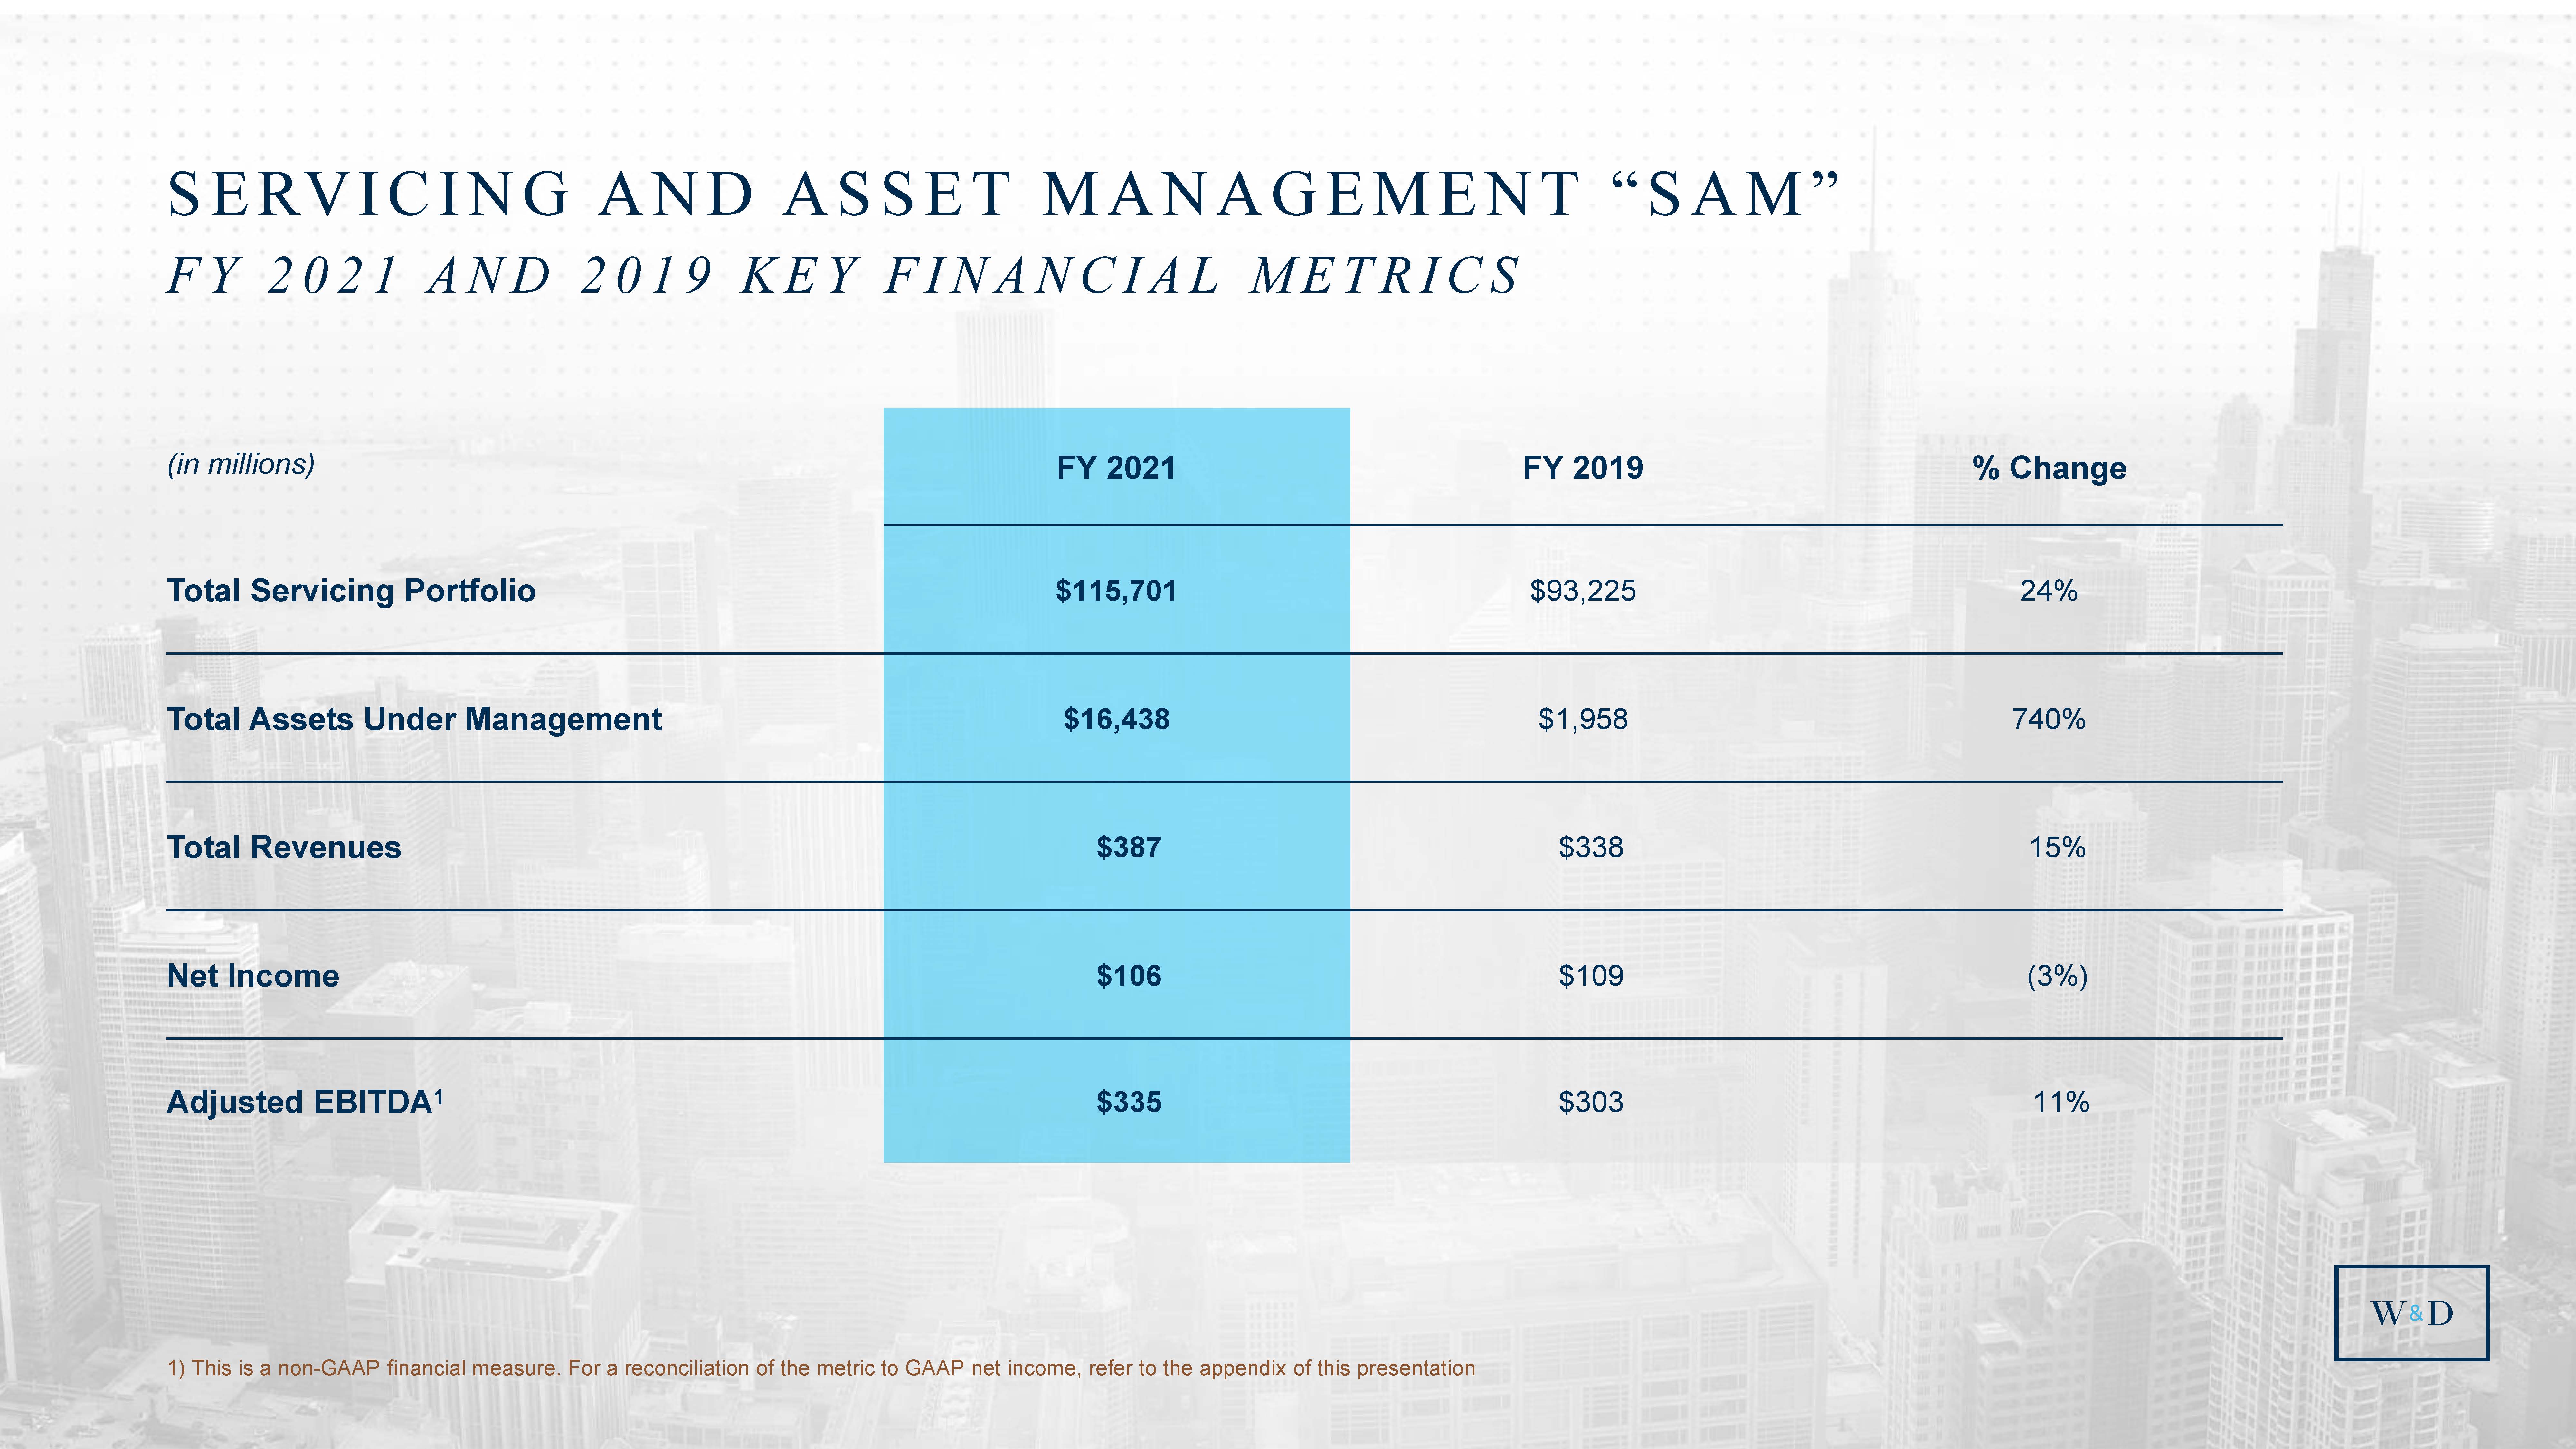
| 44 SERVICING AND ASSET MANAGEMENT “SAM” FY 2021 AND 2019 KEY FINANCIAL METRICS 1 (in millions) FY 2021 FY 2019 % Change Total Servicing Portfolio $115,701 $93,225 24% Total Assets Under Management $16,438 $1,958 740% Total Revenues $387 $338 15% Net Income $106 $109 (3%) Adjusted EBITDA1 $335 $303 11% 1) This is a non-GAAP financial measure. For a reconciliation of the metric to GAAP net income, refer to the appendix of this presentation |
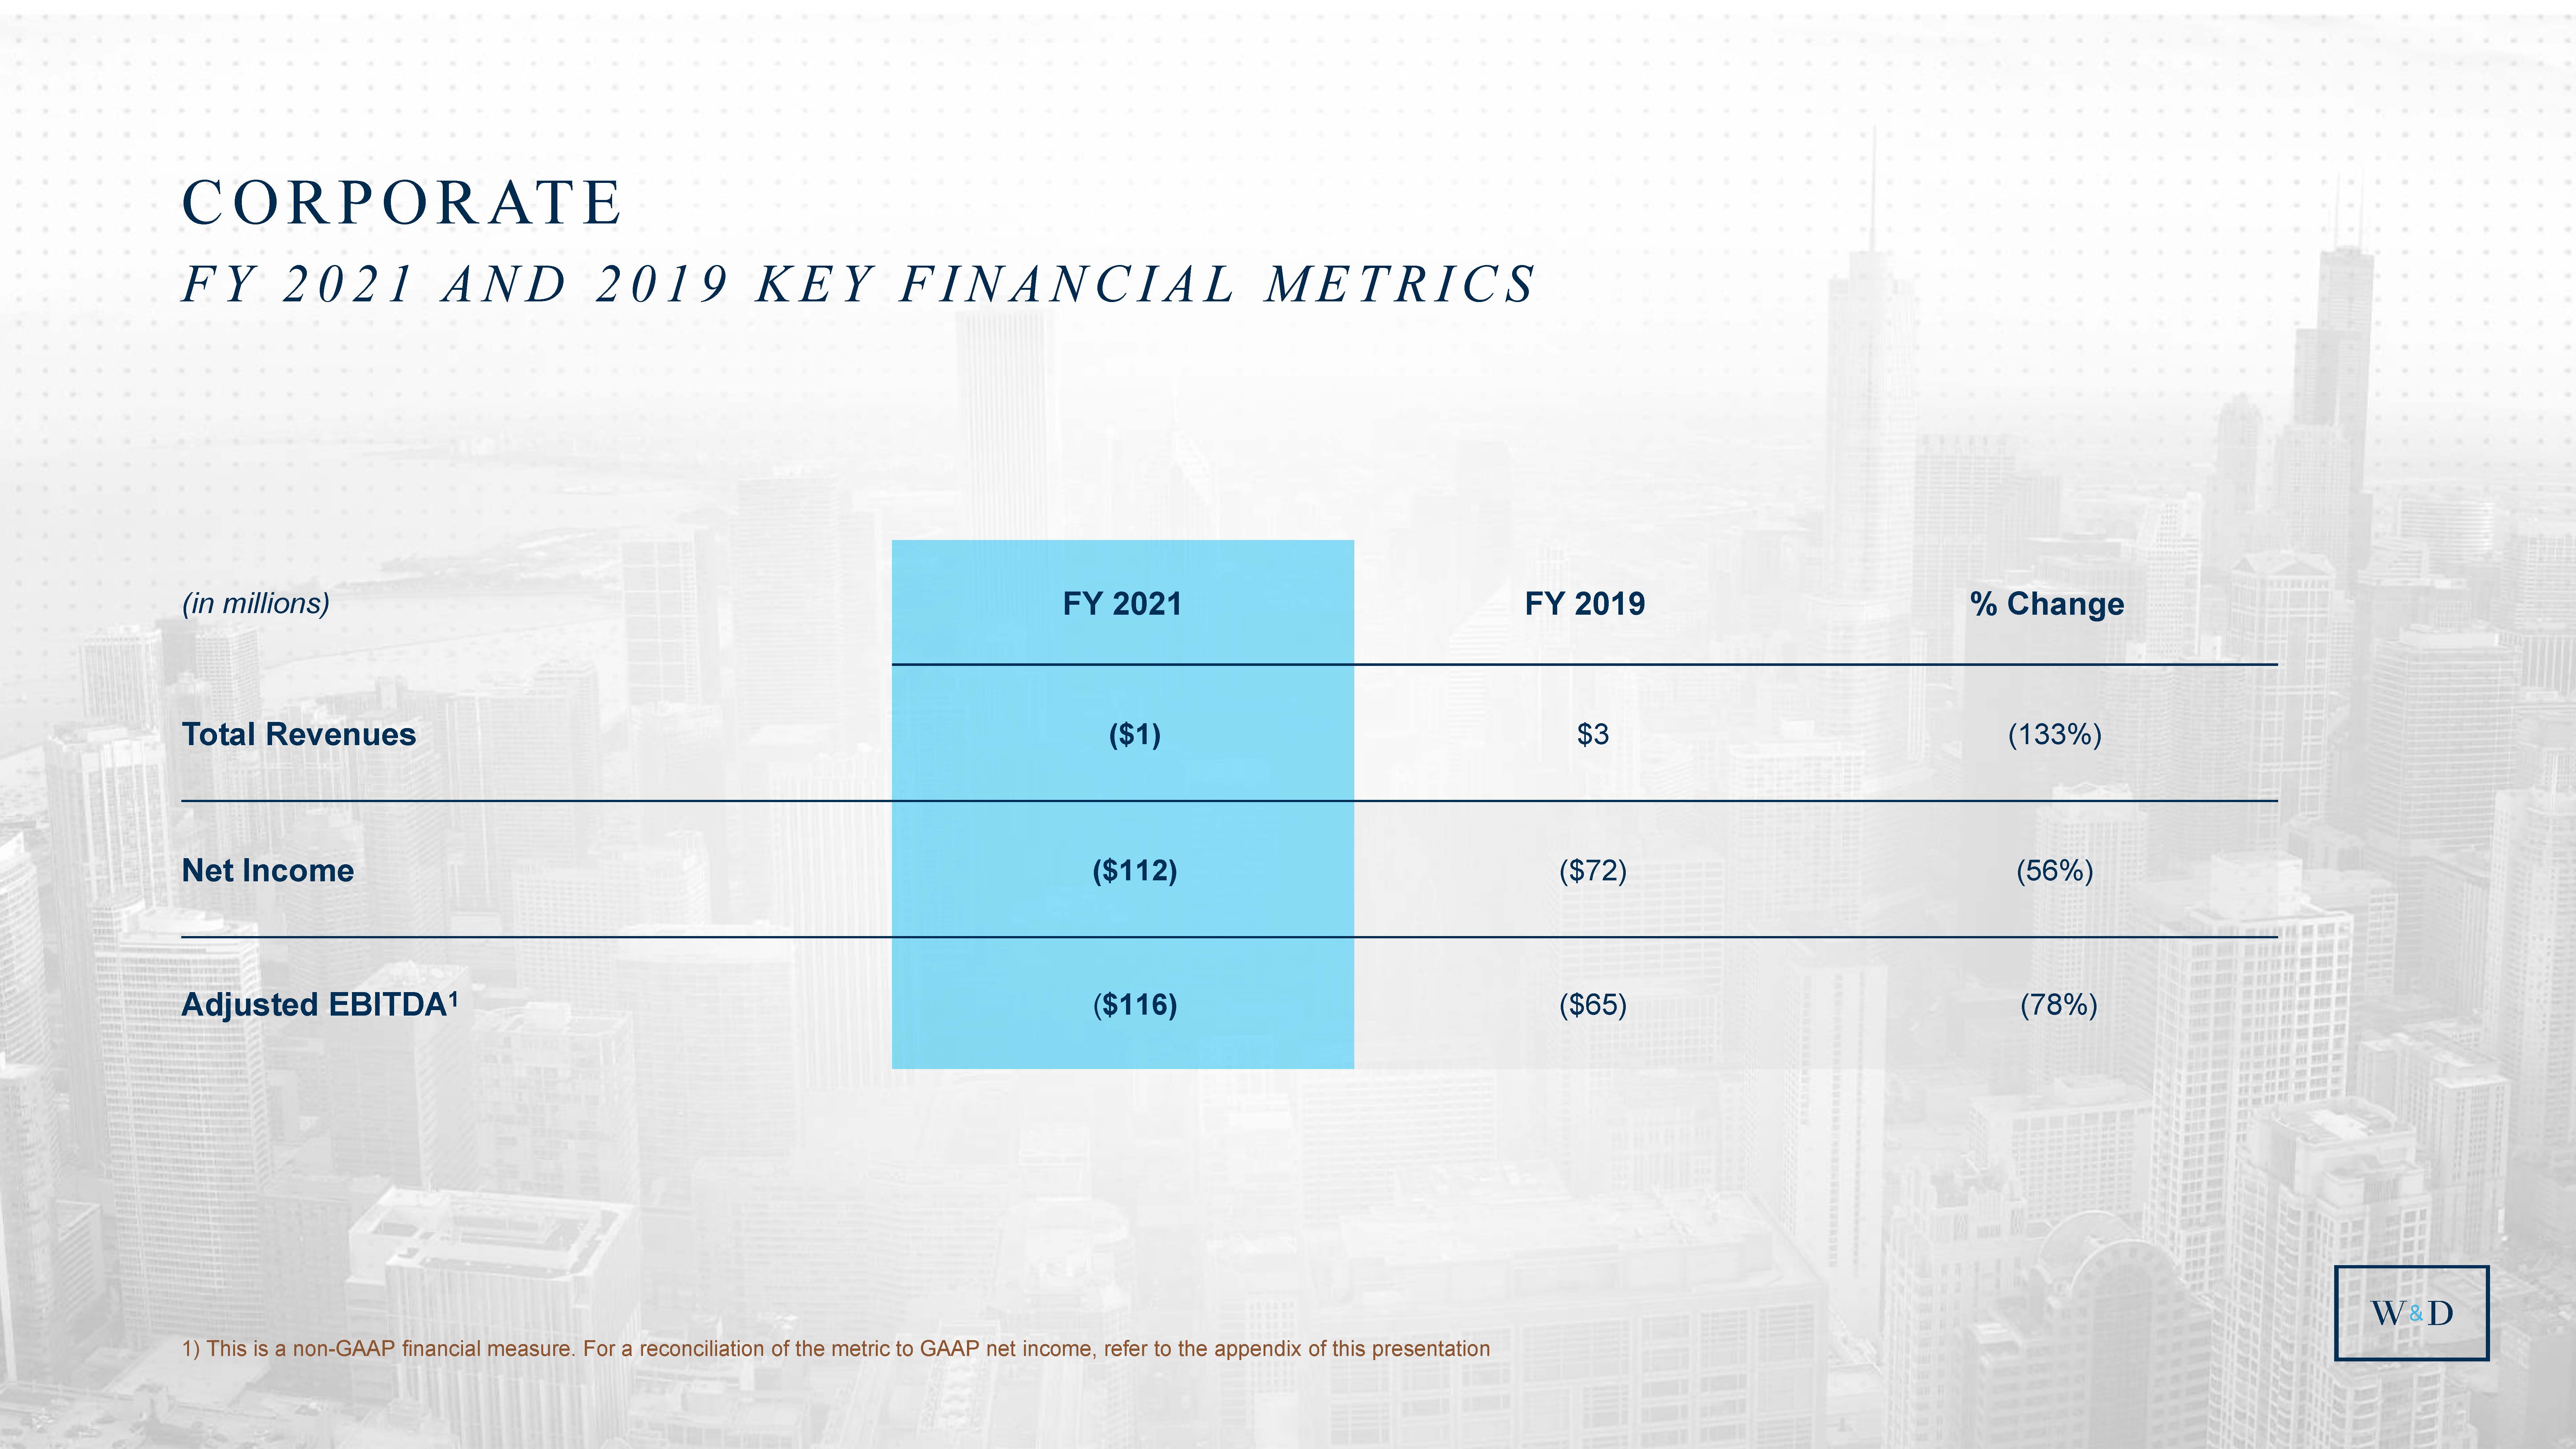
| 45 CORPORATE FY 2021 AND 2019 KEY FINANCIAL METRICS (in millions) FY 2021 FY 2019 % Change Total Revenues ($1) $3 (142%) Net Income ($112) ($72) (56%) Adjusted EBITDA1 ($116) ($66) (76%) 1) This is a non-GAAP financial measure. For a reconciliation of the metric to GAAP net income, refer to the appendix of this presentation |
| Q&A |

| Appendix |

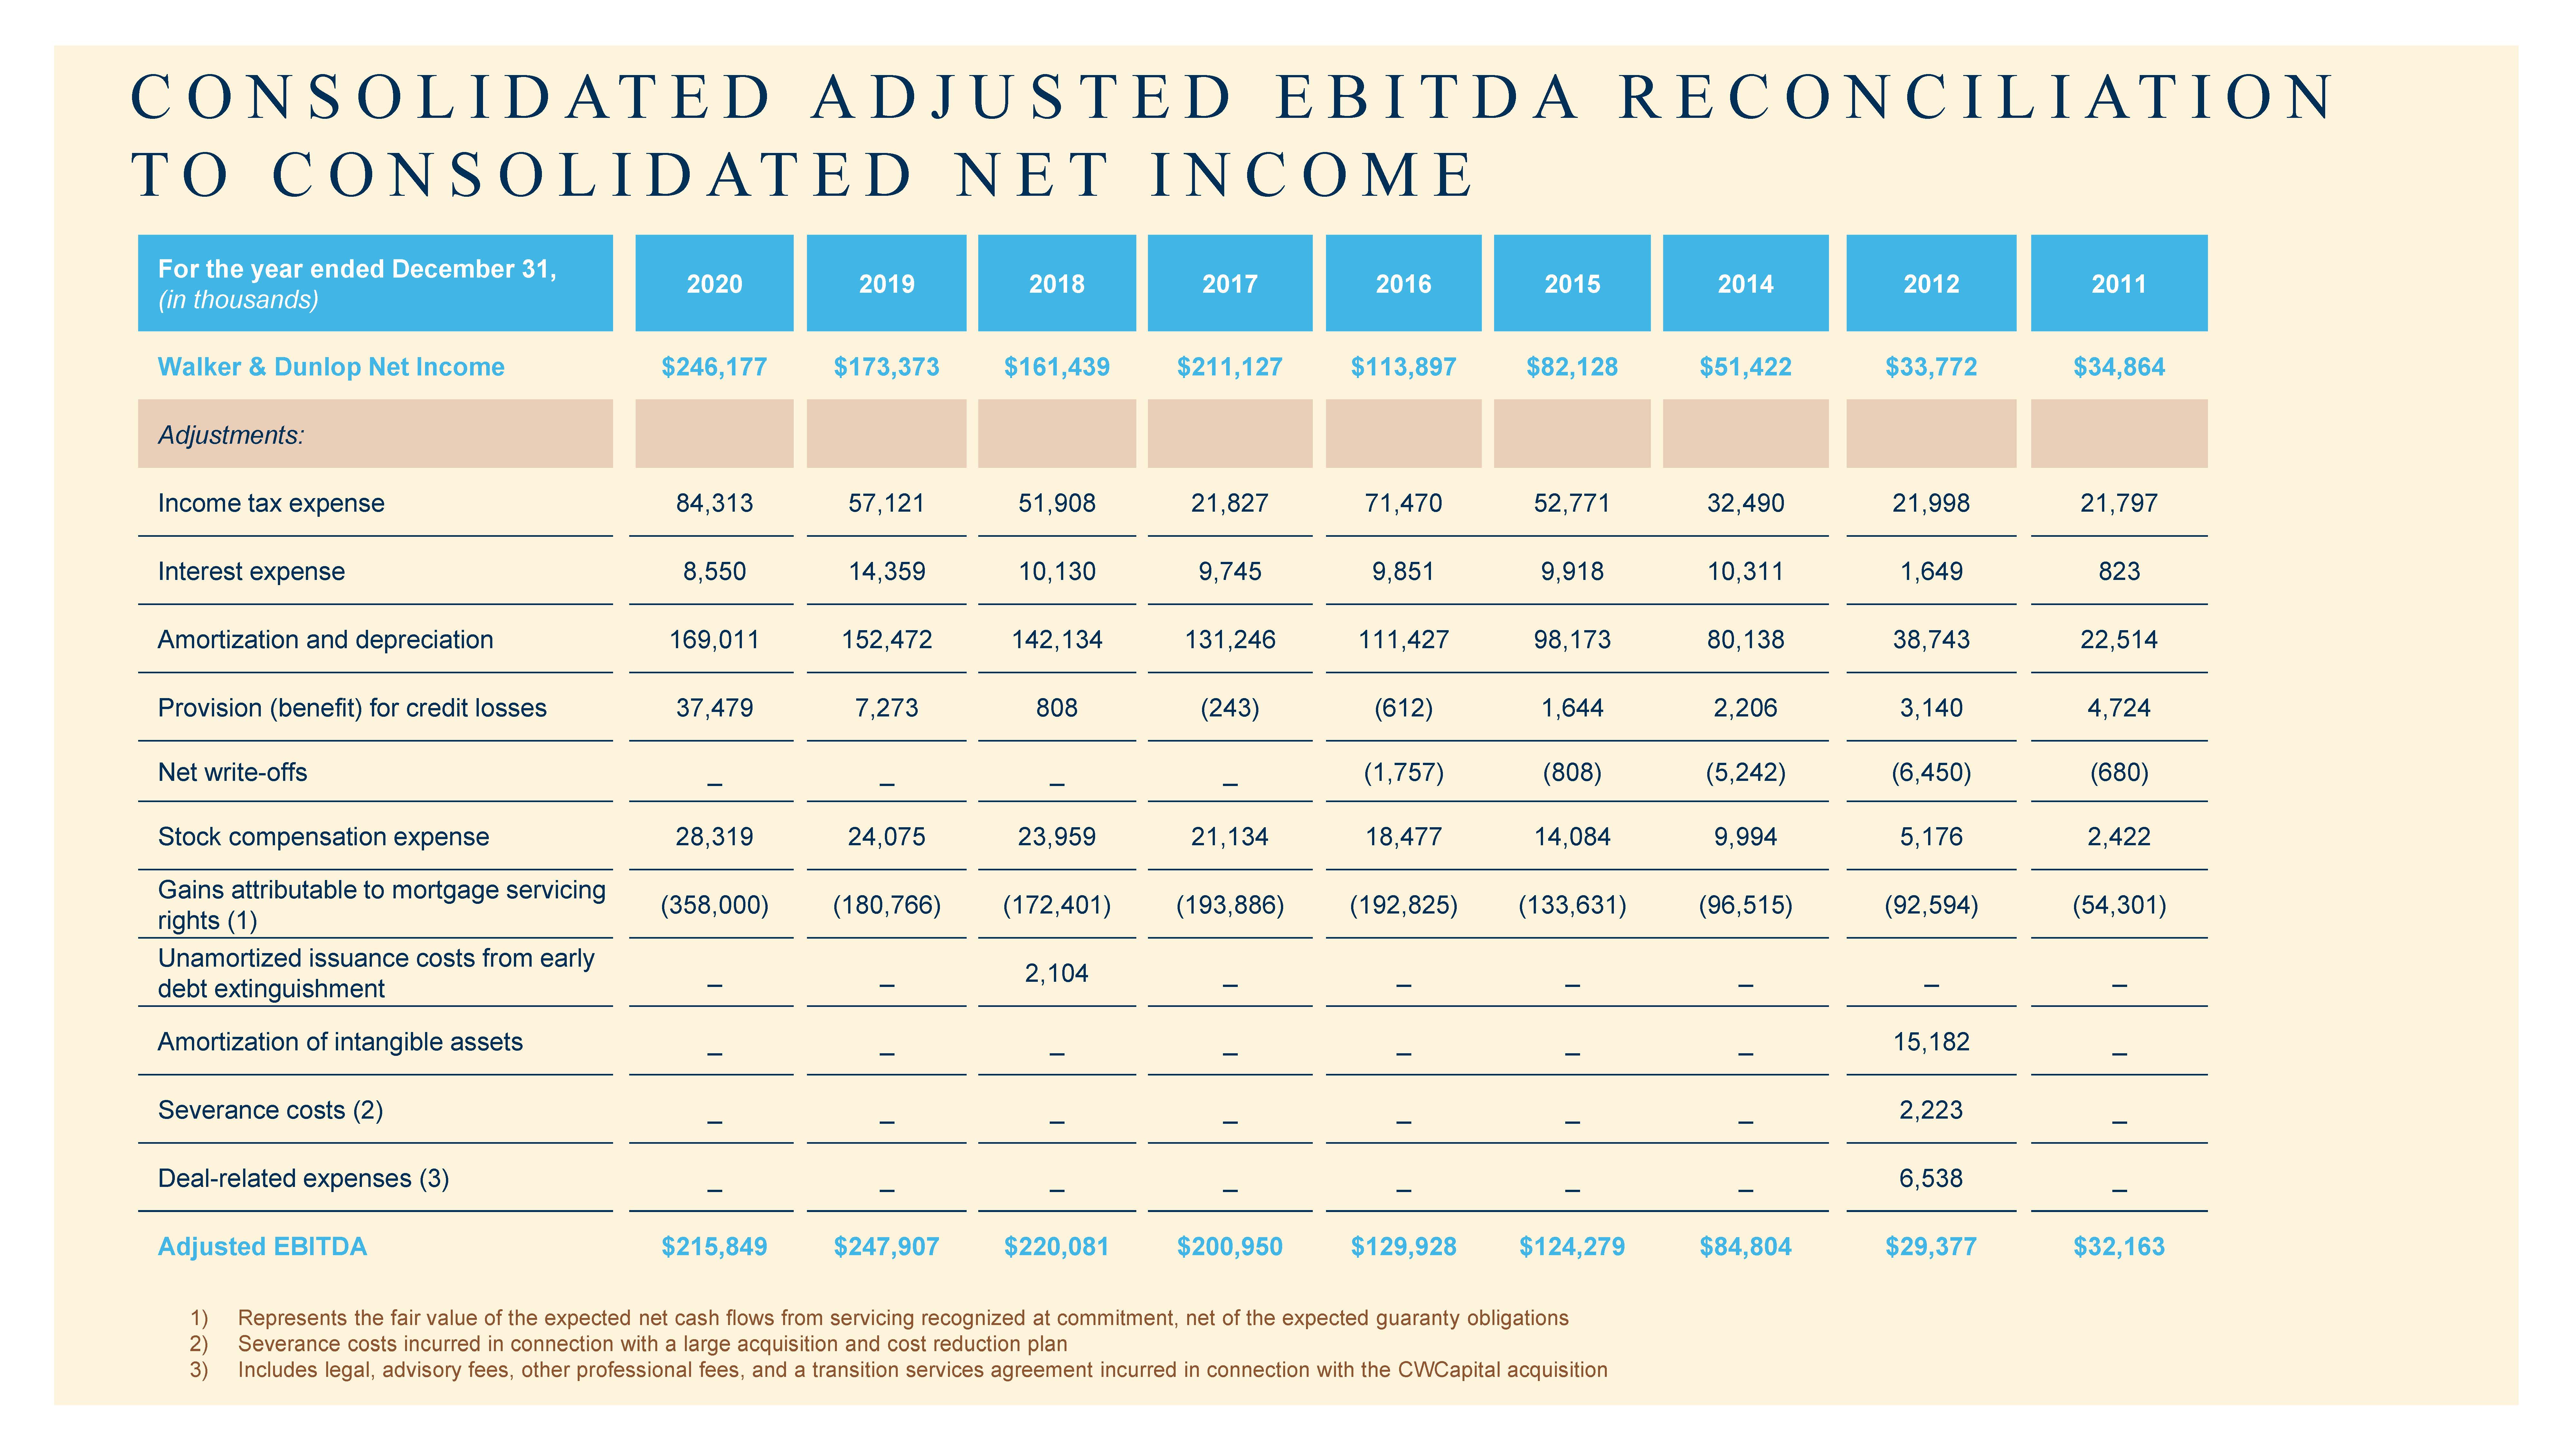
| CONSOLIDATED ADJUSTED EBITDA RECONCILIATION TO CONSOLIDATED NET INCOME For the year ended December 31, (in thousands) 2020 2019 2018 2017 2016 2015 2014 2012 2011 Walker & Dunlop Net Income $246,177 $173,373 $161,439 $211,127 $113,897 $82,128 $51,422 $33,772 $34,864 Adjustments: Income tax expense 84,313 57,121 51,908 21,827 71,470 52,771 32,490 21,998 21,797 Interest expense 8,550 14,359 10,130 9,745 9,851 9,918 10,311 1,649 823 Amortization and depreciation 169,011 152,472 142,134 131,246 111,427 98,173 80,138 38,743 22,514 Provision (benefit) for credit losses 37,479 7,273 808 (243) (612) 1,644 2,206 3,140 4,724 Net write-offs _ _ _ _ (1,757) (808) (5,242) (6,450) (680) Stock compensation expense 28,319 24,075 23,959 21,134 18,477 14,084 9,994 5,176 2,422 Gains attributable to mortgage servicing rights (1) (358,000) (180,766) (172,401) (193,886) (192,825) (133,631) (96,515) (92,594) (54,301) Unamortized issuance costs from early debt extinguishment _ _ 2,104 _ _ _ _ _ _ Amortization of intangible assets _ _ _ _ _ _ _ 15,182 _ Severance costs (2) _ _ _ _ _ _ _ 2,223 _ Deal-related expenses (3) _ _ _ _ _ _ _ 6,538 _ Adjusted EBITDA $215,849 $247,907 $220,081 $200,950 $129,928 $124,279 $84,804 $29,377 $32,163 1) Represents the fair value of the expected net cash flows from servicing recognized at commitment, net of the expected guaranty obligations 2) Severance costs incurred in connection with a large acquisition and cost reduction plan 3) Includes legal, advisory fees, other professional fees, and a transition services agreement incurred in connection with the CWCapital acquisition |
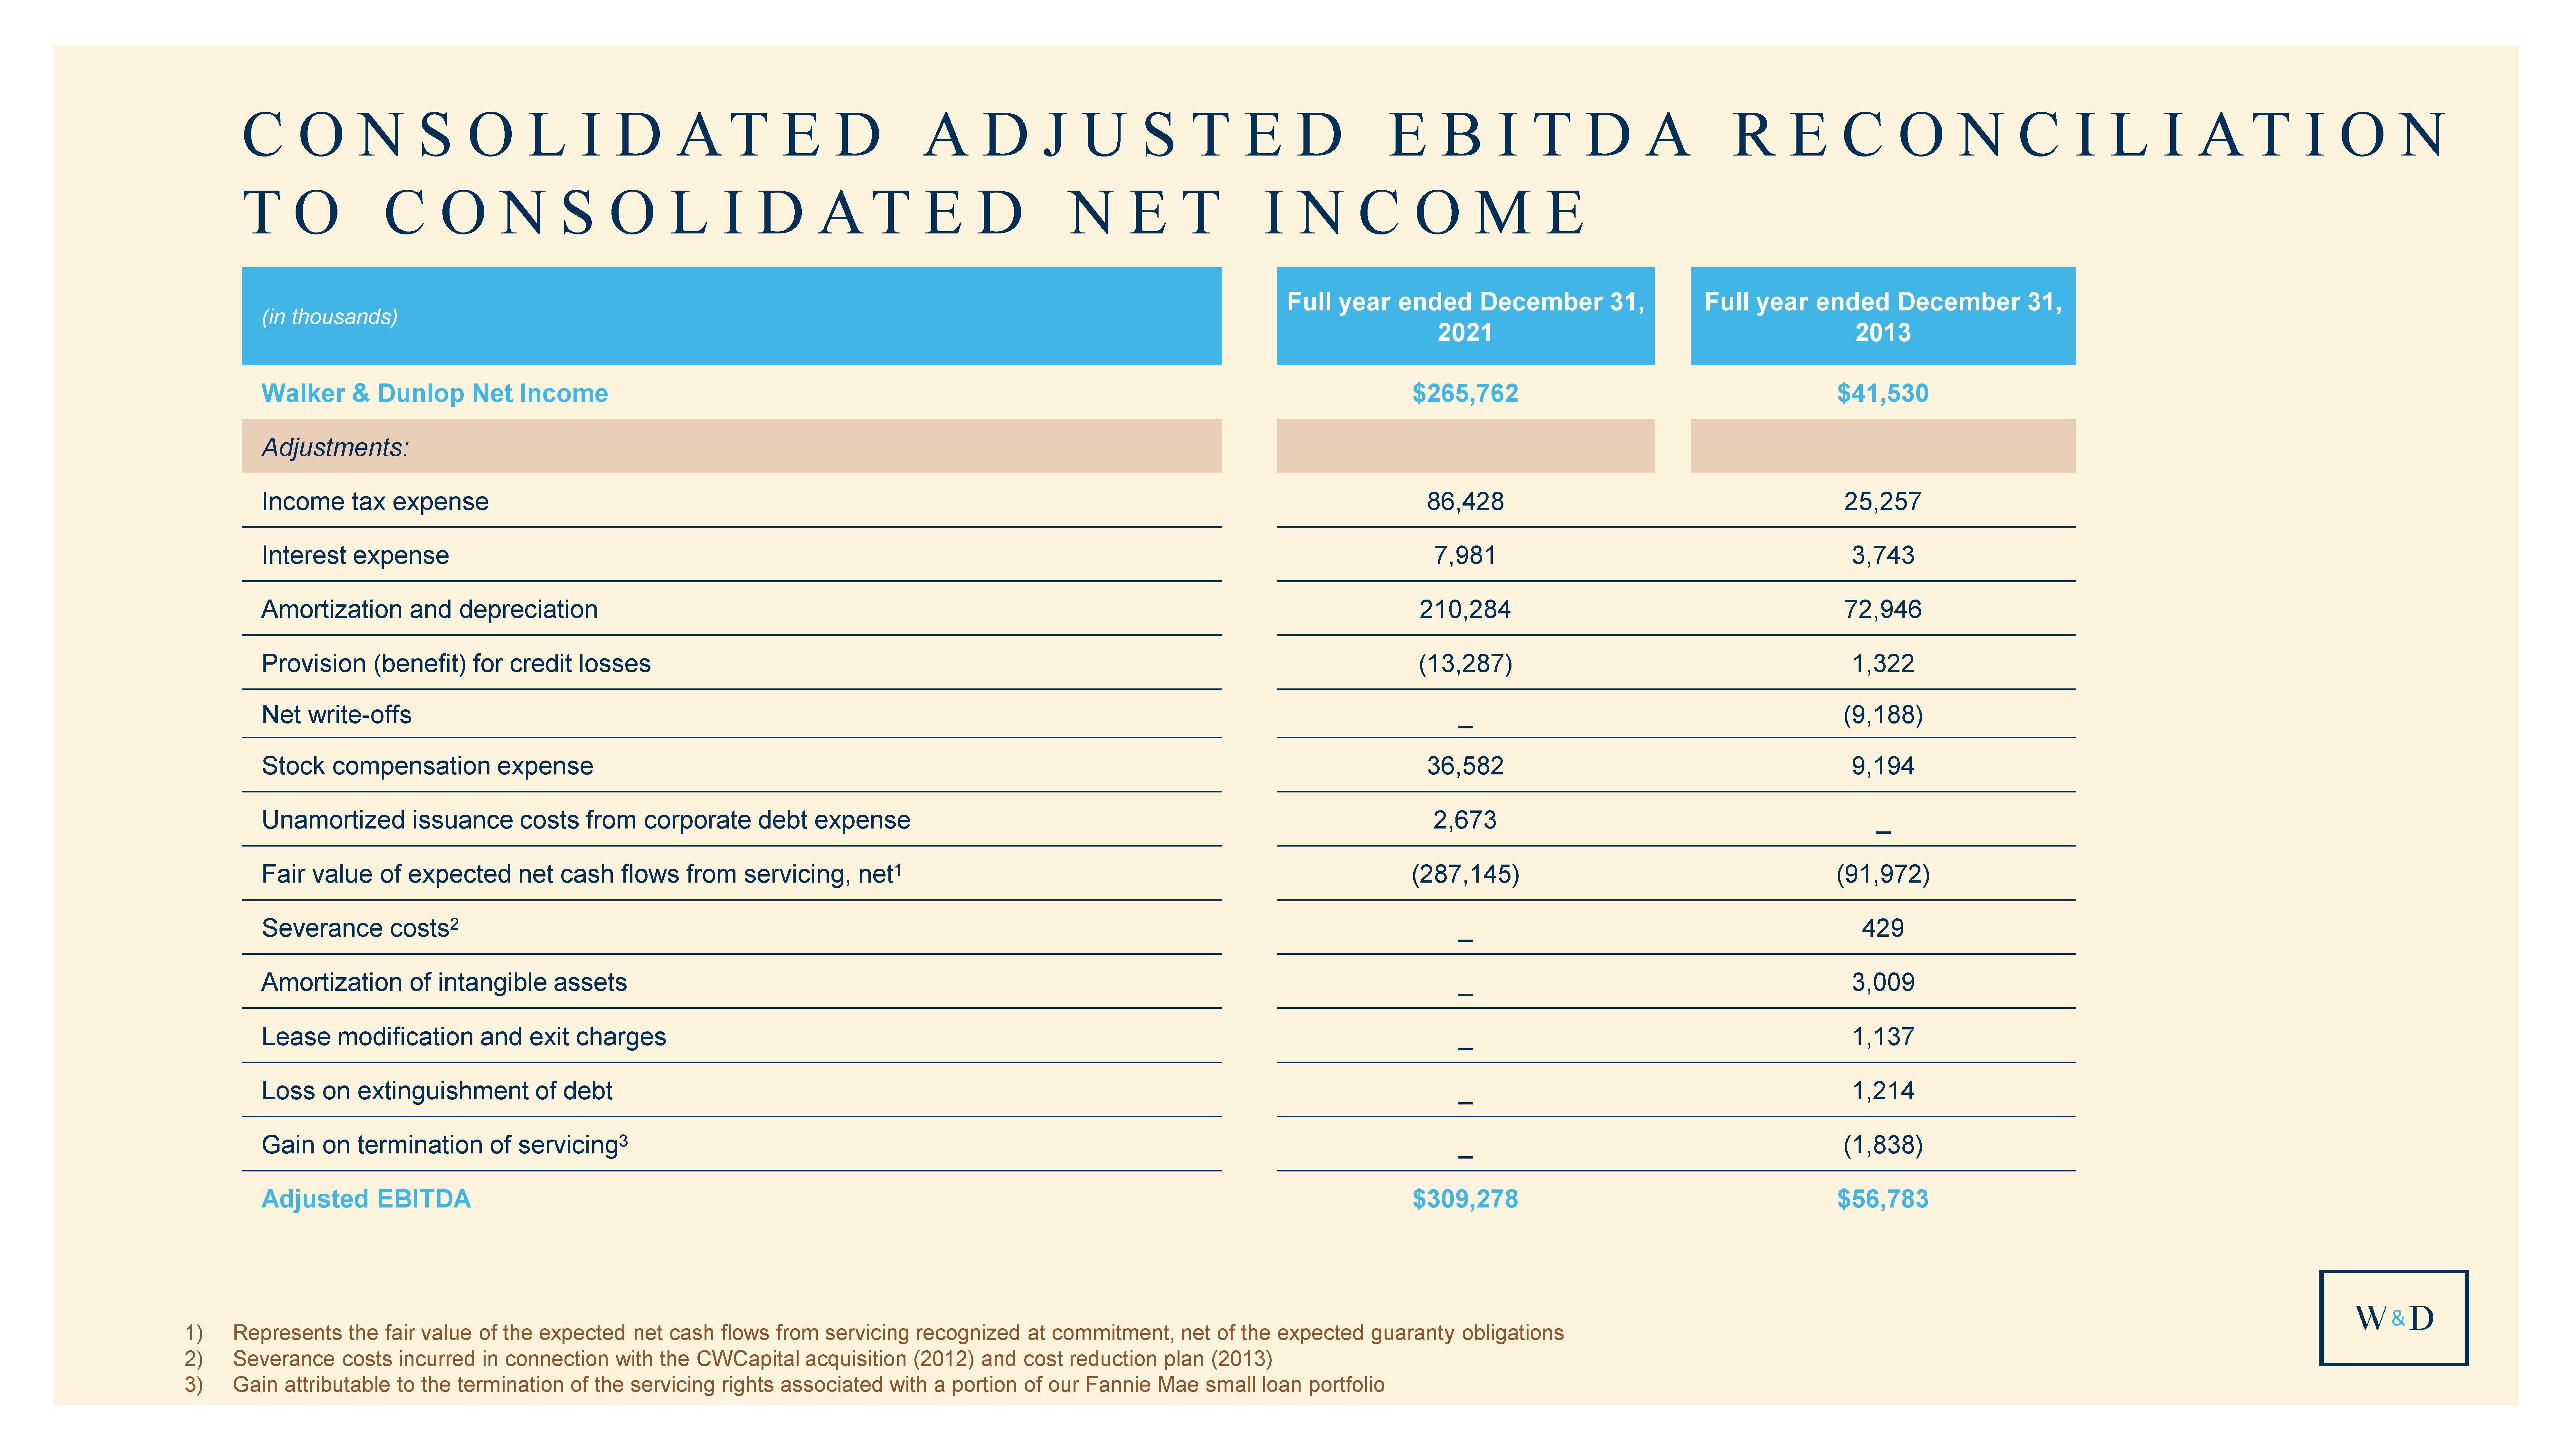
| CONSOLIDATED ADJUSTED EBITDA RECONCILIATION TO CONSOLIDATED NET INCOME (in thousands) Full year ended December 31, 2021 Full year ended December 31, 2013 Walker & Dunlop Net Income $265,762 $41,530 Adjustments: Income tax expense 86,428 25,257 Interest expense 7,981 3,743 Amortization and depreciation 210,284 72,946 Provision (benefit) for credit losses (13,287) 1,322 Net write-offs _ (9,188) Stock compensation expense 36,582 9,194 Unamortized issuance costs from corporate debt expense 2,673 _ Fair value of expected net cash flows from servicing, net1 (287,145) (91,972) Severance costs2 _ 429 Amortization of intangible assets _ 3,009 Lease modification and exit charges _ 1,137 Loss on extinguishment of debt _ 1,214 Gain on termination of servicing3 _ (1,838) Adjusted EBITDA $309,278 $56,783 1) Represents the fair value of the expected net cash flows from servicing recognized at commitment, net of the expected guaranty obligations 2) Severance costs incurred in connection with the CWCapital acquisition (2012) and cost reduction plan (2013) 3) Gain attributable to the termination of the servicing rights associated with a portion of our Fannie Mae small loan portfolio |
| ESTIMATED ALLIANT ADJUSTED EBITDA RECONCILIATION TO NET INCOME For the year ended (in thousands) December 31, 20221 December 31, 20222 Estimated Alliant Net Income $15,000 $20,000 Adjustments: Income tax expense 5,500 7,500 Interest expense 22,000 22,000 Amortization and depreciation 17,500 10,500 Provision (benefit) for credit losses _ _ Net write-offs _ _ Stock compensation expense _ _ Fair value of expected net cash flows from servicing, net _ _ Adjusted EBITDA $60,000 $60,000 1) Low end of net income estimated range 2) High end of net income estimated range |

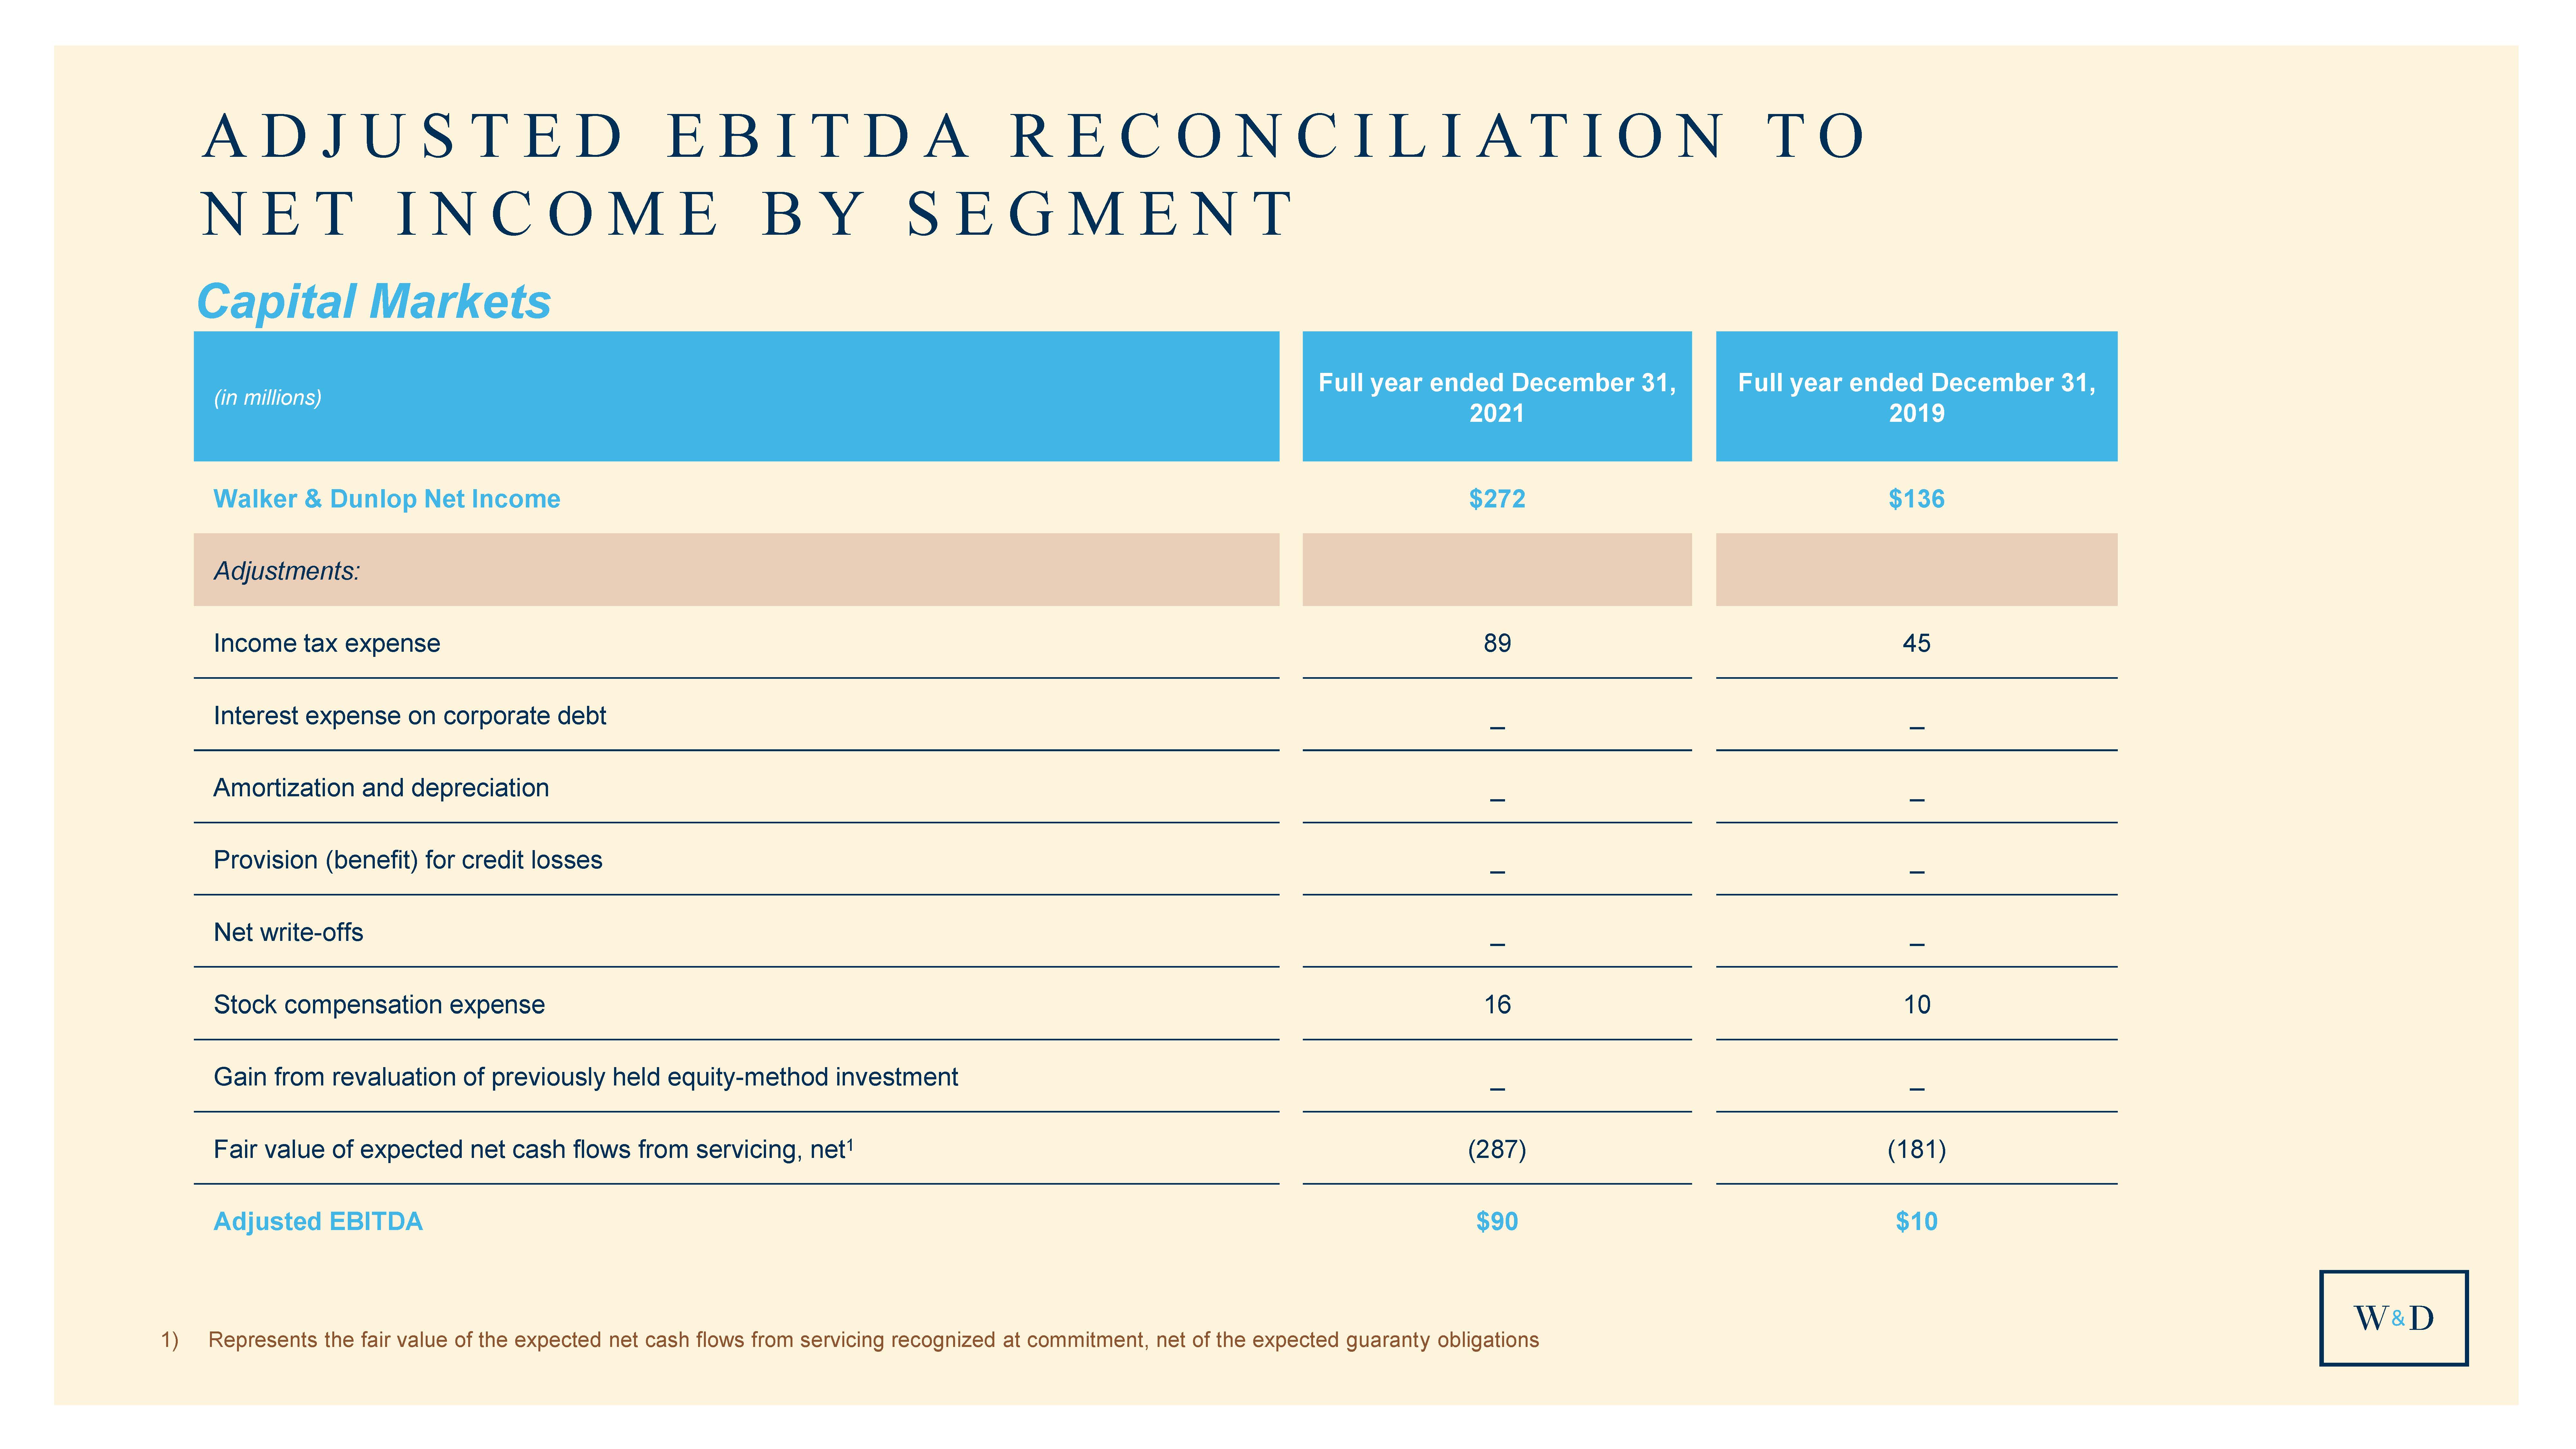
| ADJUSTED EBITDA RECONCILIATION TO NET INCOME BY SEGMENT (in millions) Full year ended December 31, 2021 Full year ended December 31, 2019 Walker & Dunlop Net Income $272 $136 Adjustments: Income tax expense 89 45 Interest expense on corporate debt _ _ Amortization and depreciation _ _ Provision (benefit) for credit losses _ _ Net write-offs _ _ Stock compensation expense 16 11 Gain from revaluation of previously held equity-method investment _ _ Fair value of expected net cash flows from servicing, net1 (287) (181) Adjusted EBITDA $90 $10 1) Represents the fair value of the expected net cash flows from servicing recognized at commitment, net of the expected guaranty obligations Capital Markets |
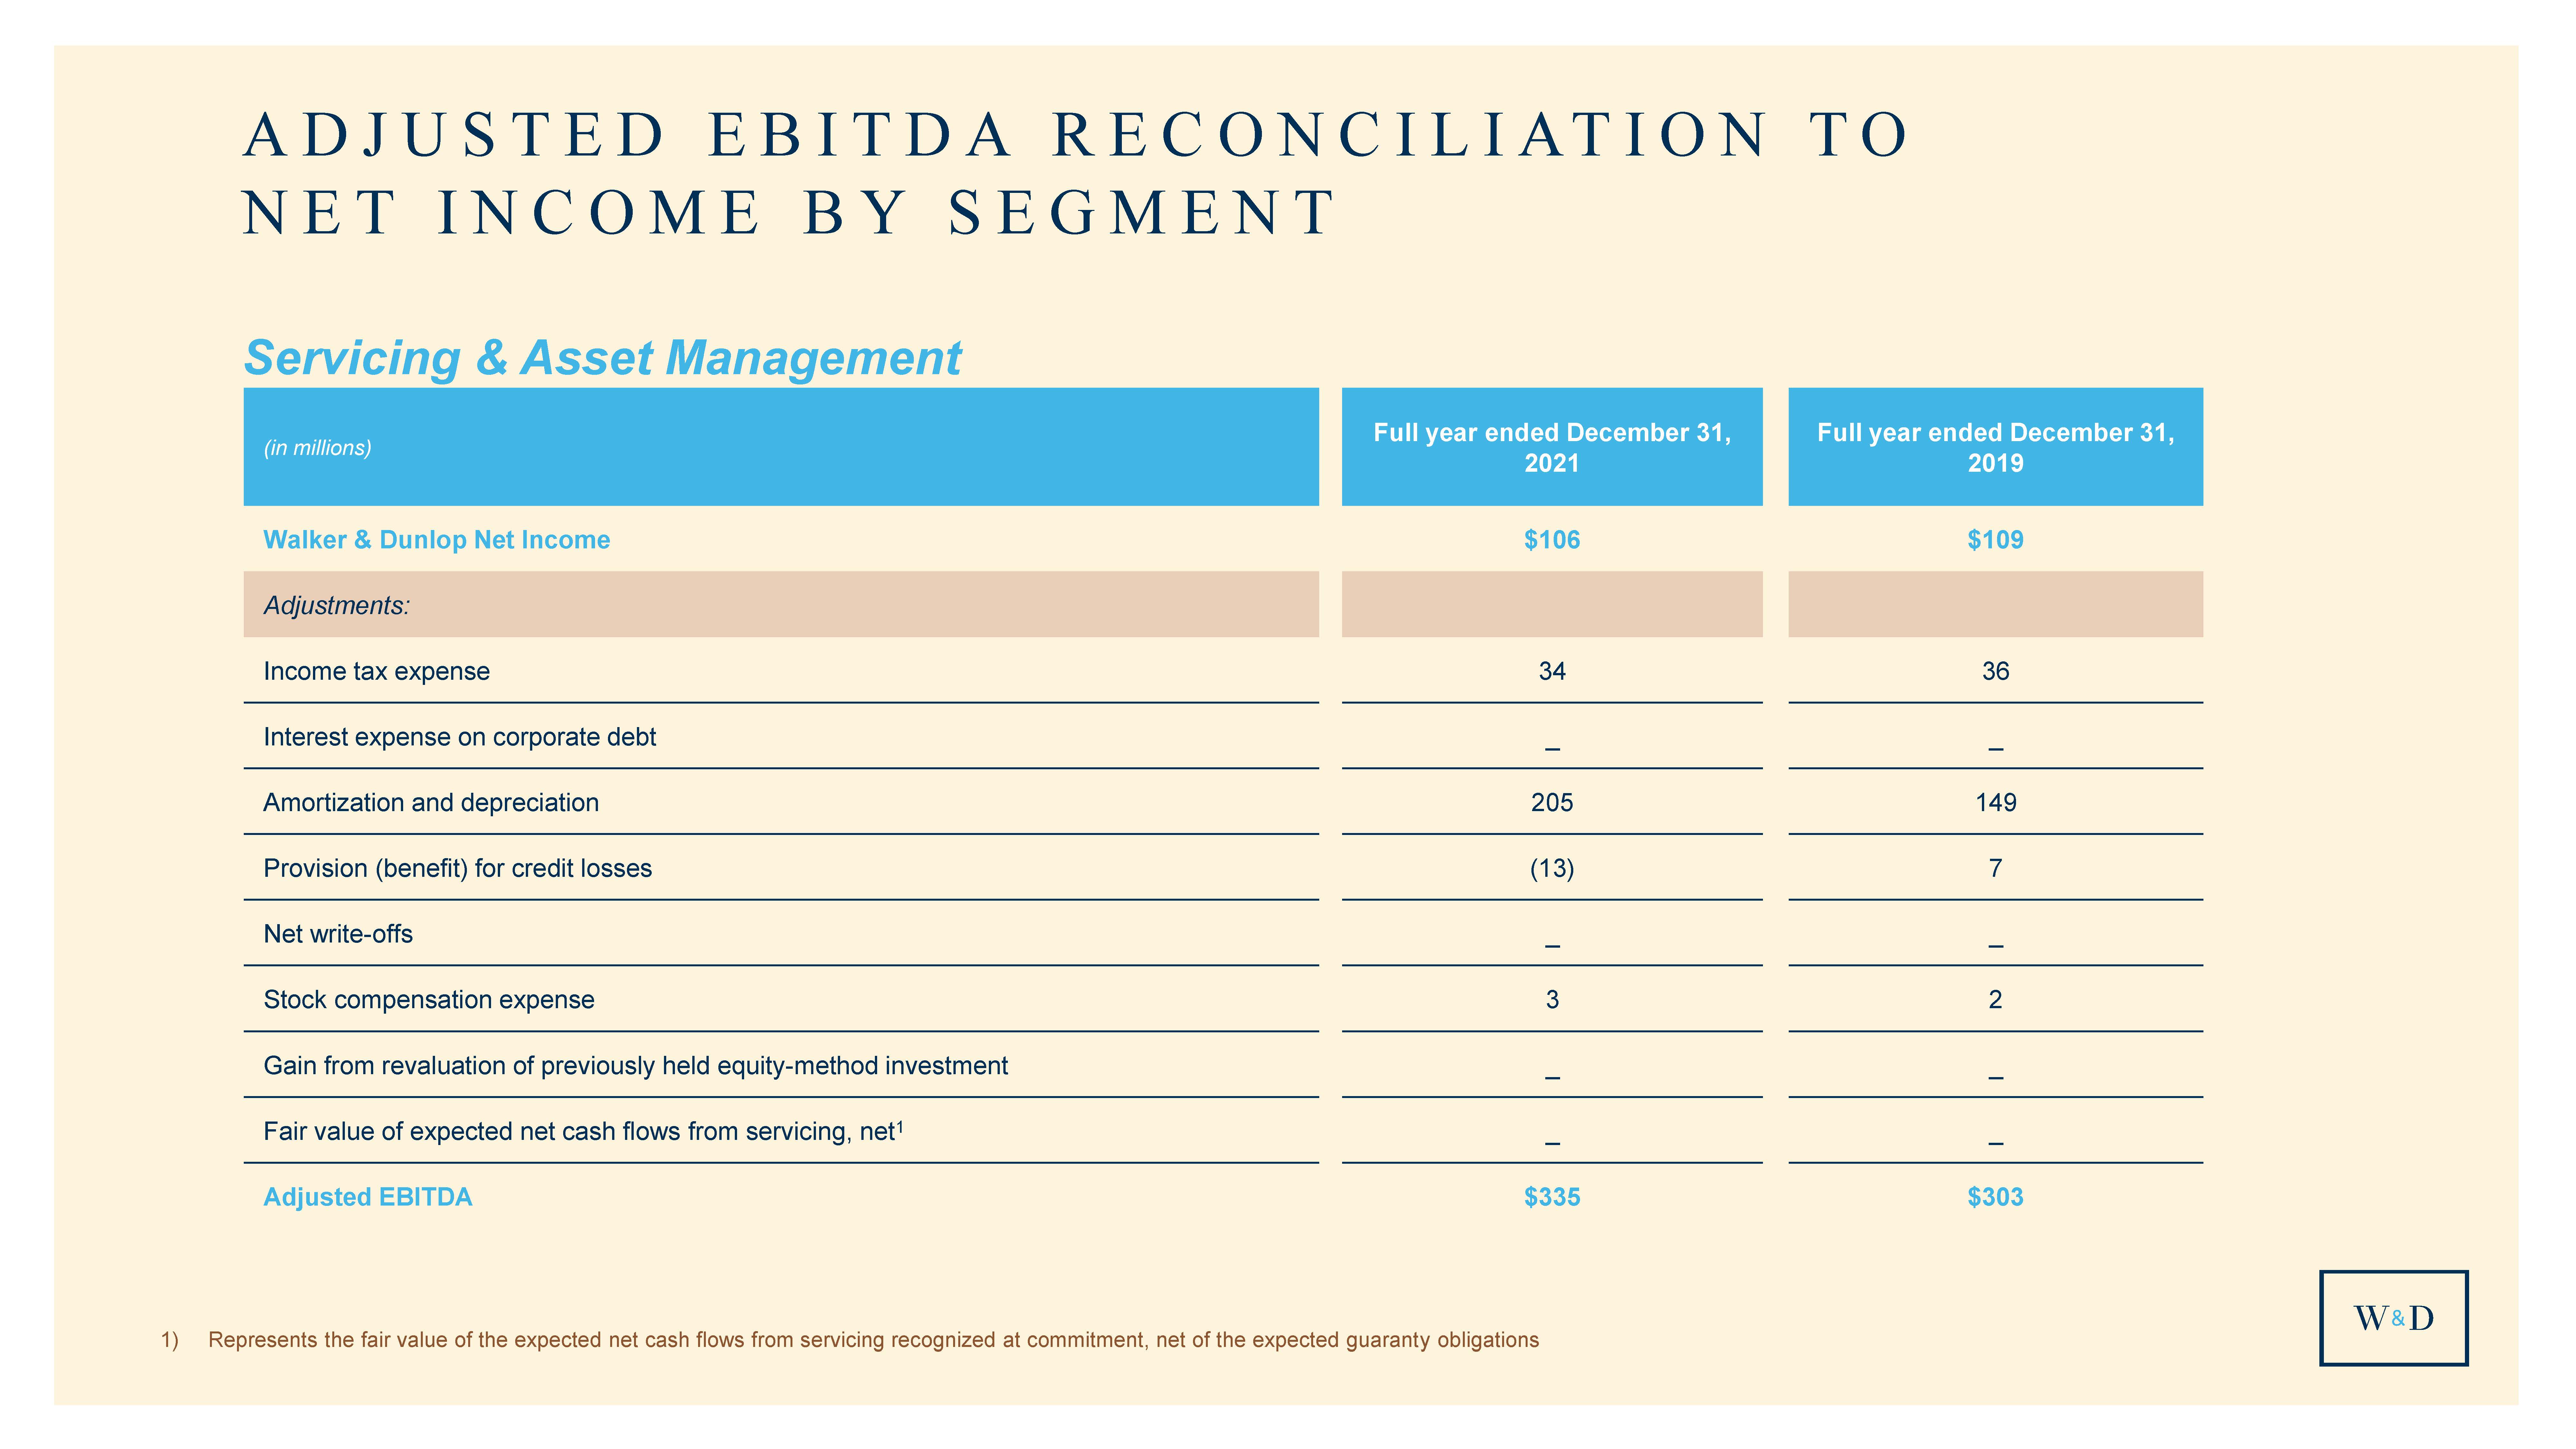
| ADJUSTED EBITDA RECONCILIATION TO NET INCOME BY SEGMENT (in millions) Full year ended December 31, 2021 Full year ended December 31, 2019 Walker & Dunlop Net Income $106 $109 Adjustments: Income tax expense 34 36 Interest expense on corporate debt _ _ Amortization and depreciation 205 149 Provision (benefit) for credit losses (13) 7 Net write-offs _ _ Stock compensation expense 3 2 Gain from revaluation of previously held equity-method investment _ _ Fair value of expected net cash flows from servicing, net1 _ _ Adjusted EBITDA $335 $303 Servicing & Asset Management 1) Represents the fair value of the expected net cash flows from servicing recognized at commitment, net of the expected guaranty obligations |
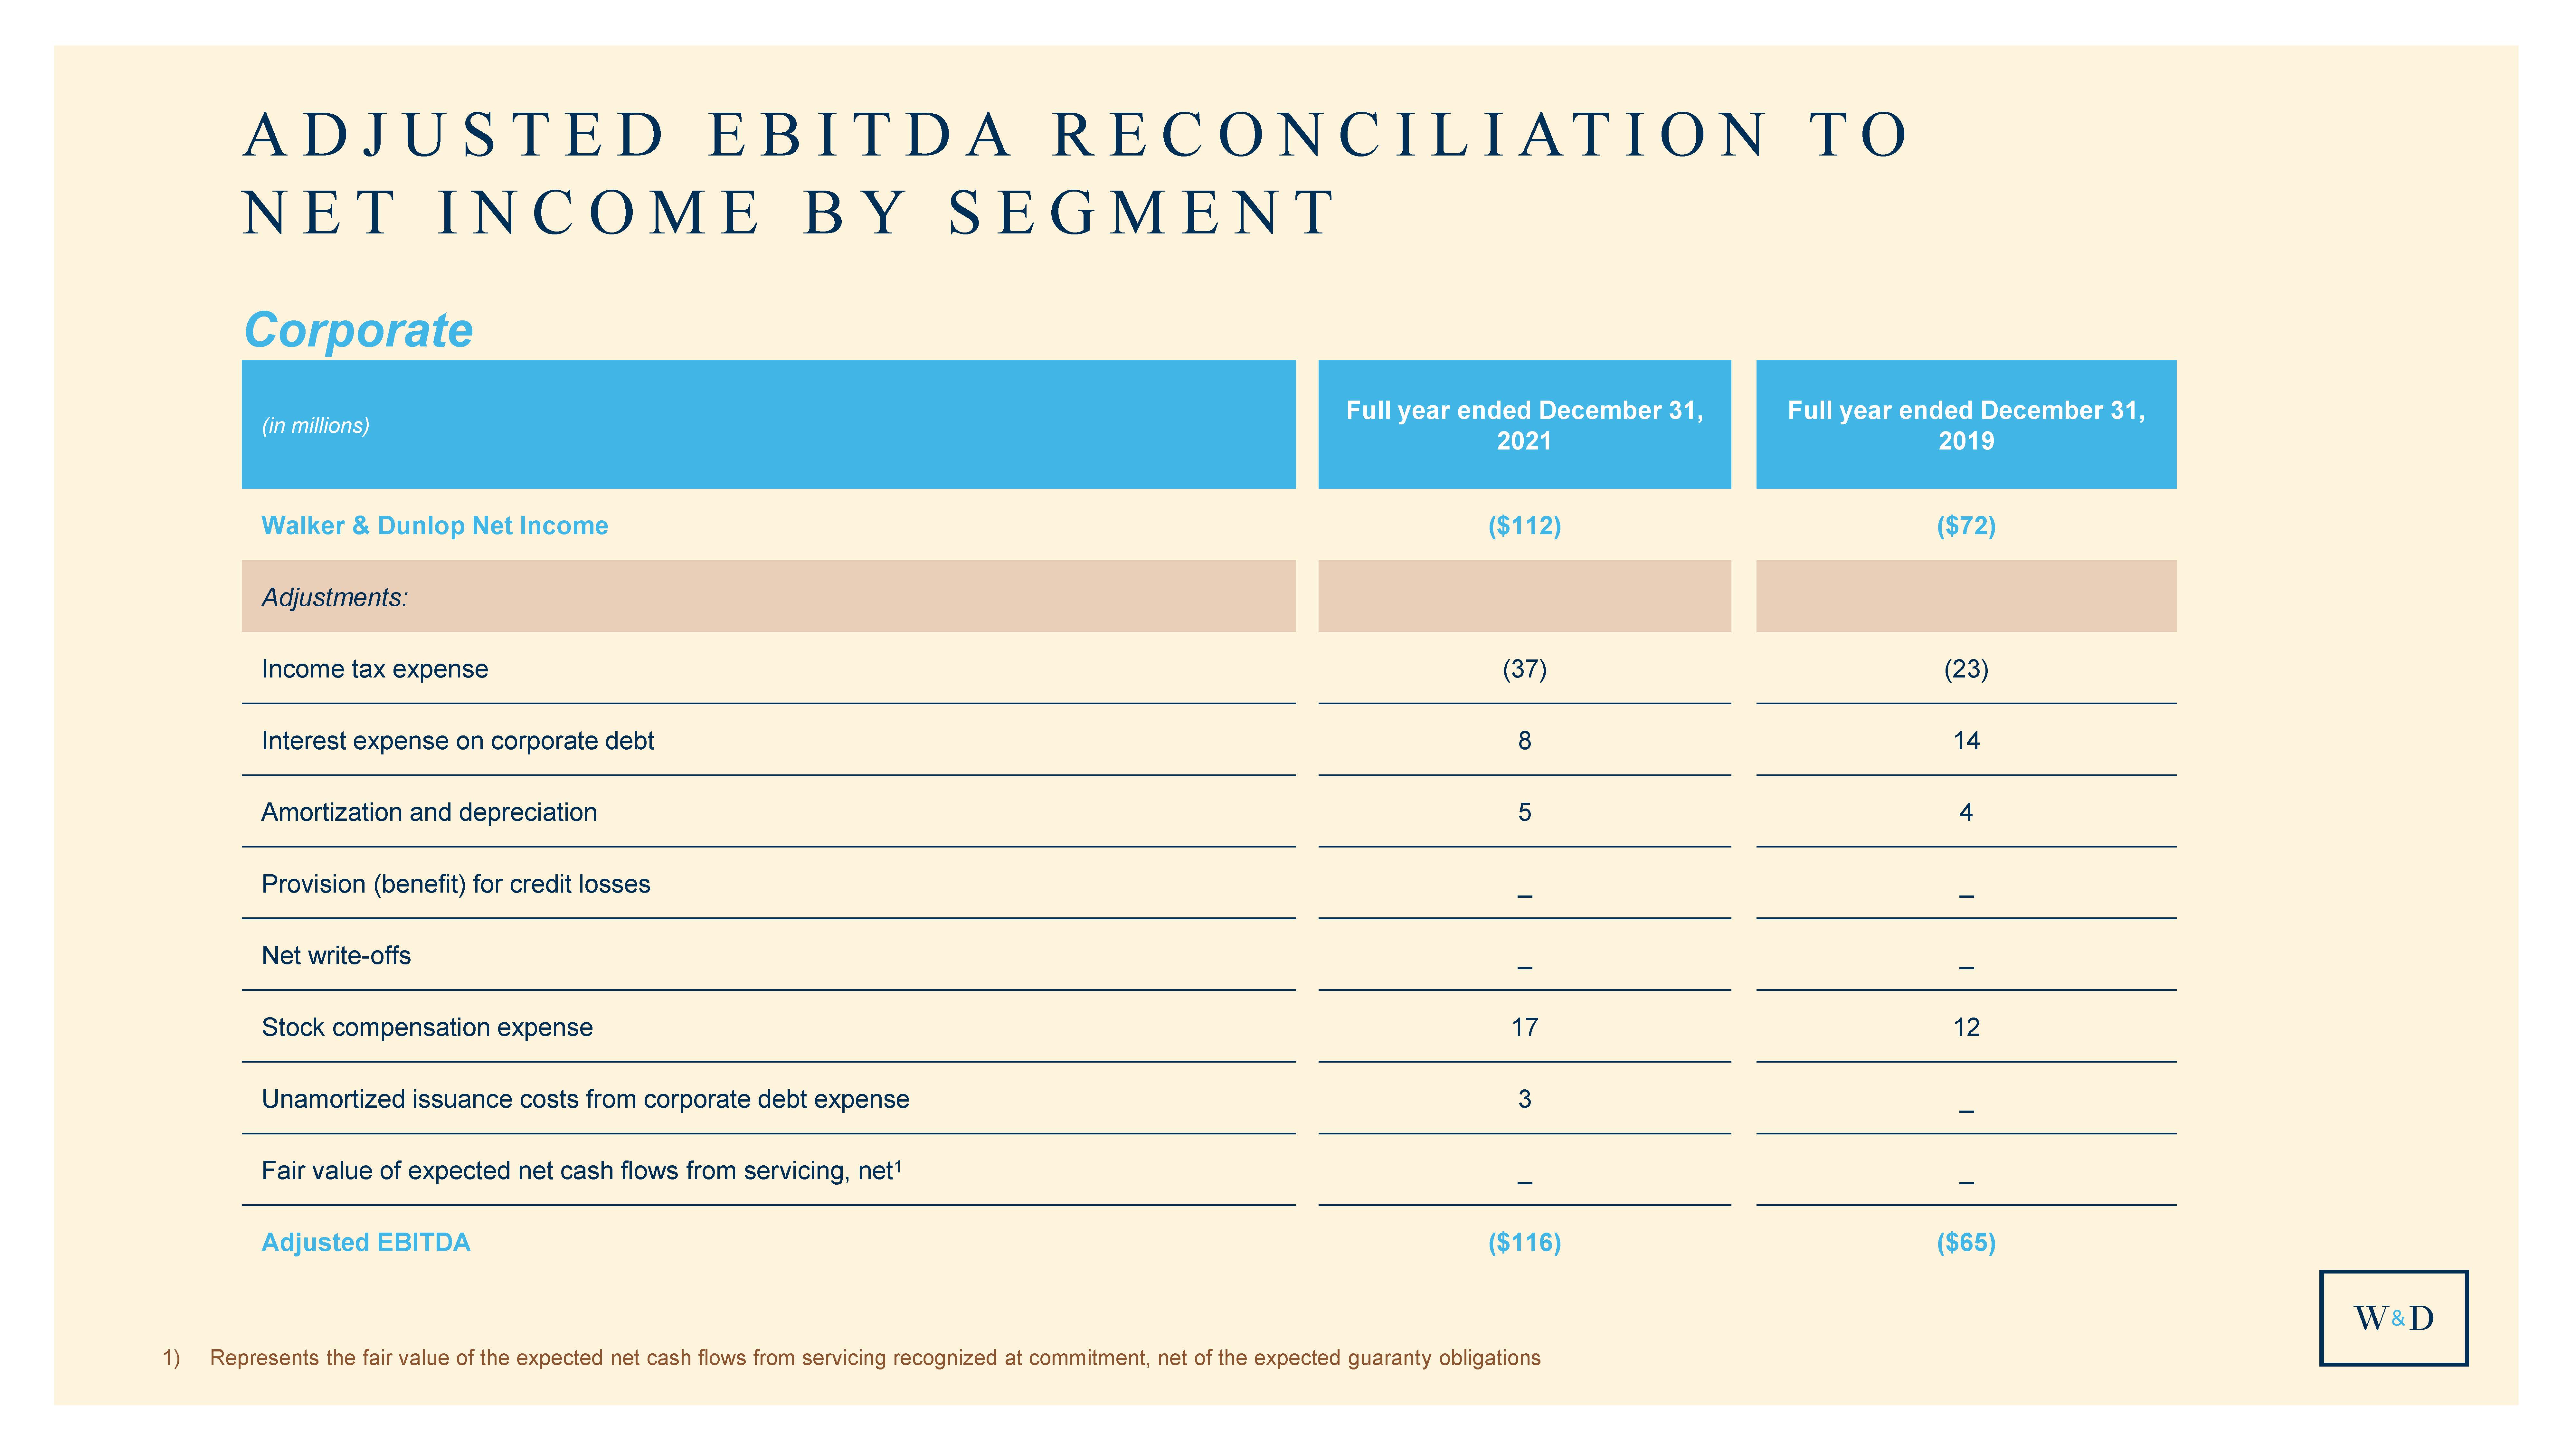
| ADJUSTED EBITDA RECONCILIATION TO NET INCOME BY SEGMENT (in millions) Full year ended December 31, 2021 Full year ended December 31, 2019 Walker & Dunlop Net Income ($112) ($72) Adjustments: Income tax expense (37) (24) Interest expense on corporate debt 8 14 Amortization and depreciation 5 4 Provision (benefit) for credit losses _ _ Net write-offs _ _ Stock compensation expense 17 12 Unamortized issuance costs from corporate debt expense 3 _ Fair value of expected net cash flows from servicing, net1 _ _ Adjusted EBITDA ($116) ($65) Corporate 1) Represents the fair value of the expected net cash flows from servicing recognized at commitment, net of the expected guaranty obligations |
Serious News for Serious Traders! Try StreetInsider.com Premium Free!
You May Also Be Interested In
- Medigene AG reports Financial Results and Business Update for Q1 2024
- Hollywood Star ‘The Pink Cadillac’ Hits Auction Blocks
- Internationally Renowned Botulinum Toxin Experts Join WizMedi Bio's New Botulinum Toxin Development Project
Create E-mail Alert Related Categories
SEC FilingsSign up for StreetInsider Free!
Receive full access to all new and archived articles, unlimited portfolio tracking, e-mail alerts, custom newswires and RSS feeds - and more!
