

Form 8-K Morningstar, Inc. For: Apr 28
 Tweet
Tweet Share
Share
Exhibit 99.1
 |
News Release
|
|||
| 22 West Washington Street | Telephone: +1 312 696-6000 | |||
| Chicago | Facsimile: +1 312 696-6009 | |||
| Illinois 60602 |
FOR IMMEDIATE RELEASE
Morningstar, Inc. Reports First-Quarter 2021 Financial Results
CHICAGO, Apr. 28, 2021 - Morningstar, Inc. (Nasdaq: MORN), a leading provider of independent investment research, today reported first-quarter 2021 financial results.
"Broad-based growth reflects strength across our business,” said Kunal Kapoor, Morningstar’s chief executive officer. “Our license-based offerings keep resonating with both public and private market investors, DBRS Morningstar remains focused on cementing its position as the leading alternative to legacy rating agencies, and our ongoing expansion of environmental, social, and governance (ESG) solutions fulfills rising interest in sustainable investing. Recent ESG-related efforts include delivering the data and research that asset managers need to comply with the EU Sustainable Finance Disclosure Regulation. Moreover, we enhanced the transparency of our own corporate sustainability initiatives by releasing our inaugural Enterprise Sustainability Report, which describes our most material ESG risks and opportunities."
First-Quarter 2021 Financial Highlights
| · | Revenue increased 21.2% to $392.8 million; organic revenue increased 13.0%. |
| · | Operating income increased 51.0% to $67.2 million; adjusted operating income increased 50.3%, excluding intangible amortization expense and all mergers & acquisitions (M&A)-related expenses. |
| · | Diluted net income per share increased 130.9% to $1.27 versus $0.55 in the prior period. Adjusted diluted net income per share increased 106.0% to $1.73, excluding intangible amortization expense and all M&A-related expenses. |
| · | Cash provided by operating activities increased 31.8% to $64.2 million. Free cash flow increased 23.5% to $41.5 million. |
Page 1 of 12
Overview of First-Quarter 2021 Financial Results
Revenue for the first quarter of 2021 increased 21.2% to $392.8 million. Organic revenue, which excludes all M&A and foreign currency effects, grew 13.0% compared with the prior-year period.
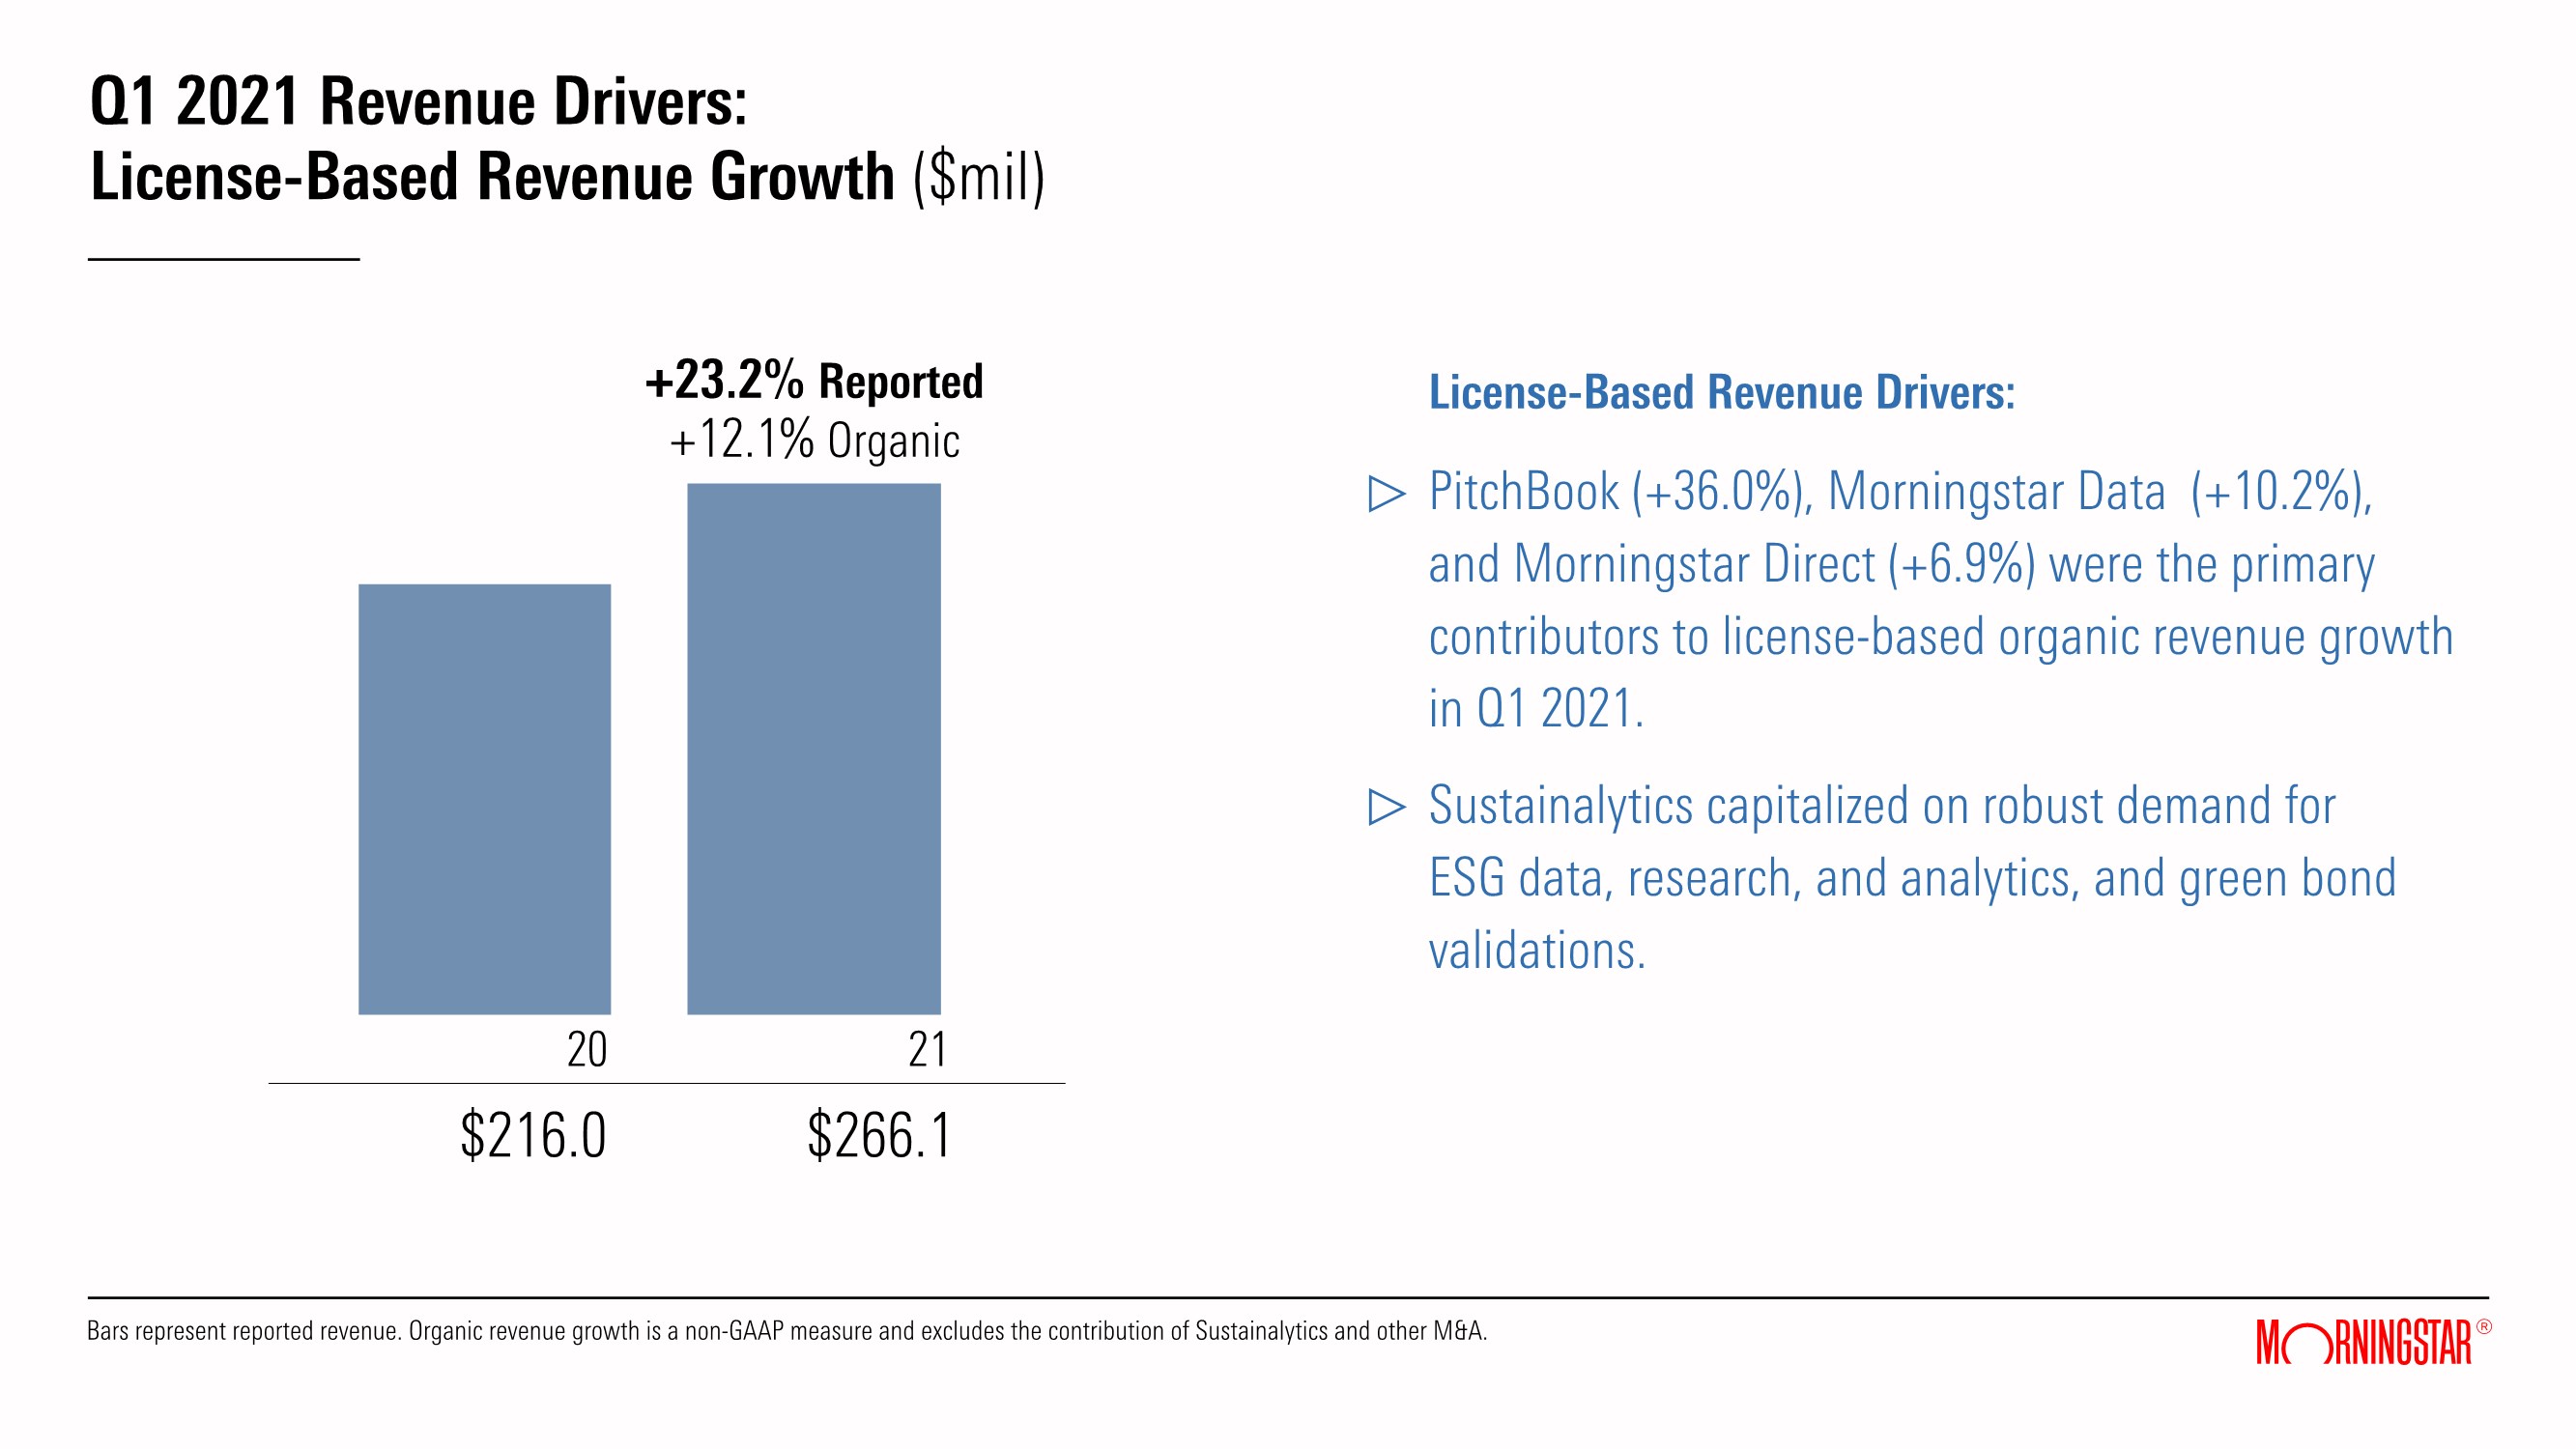
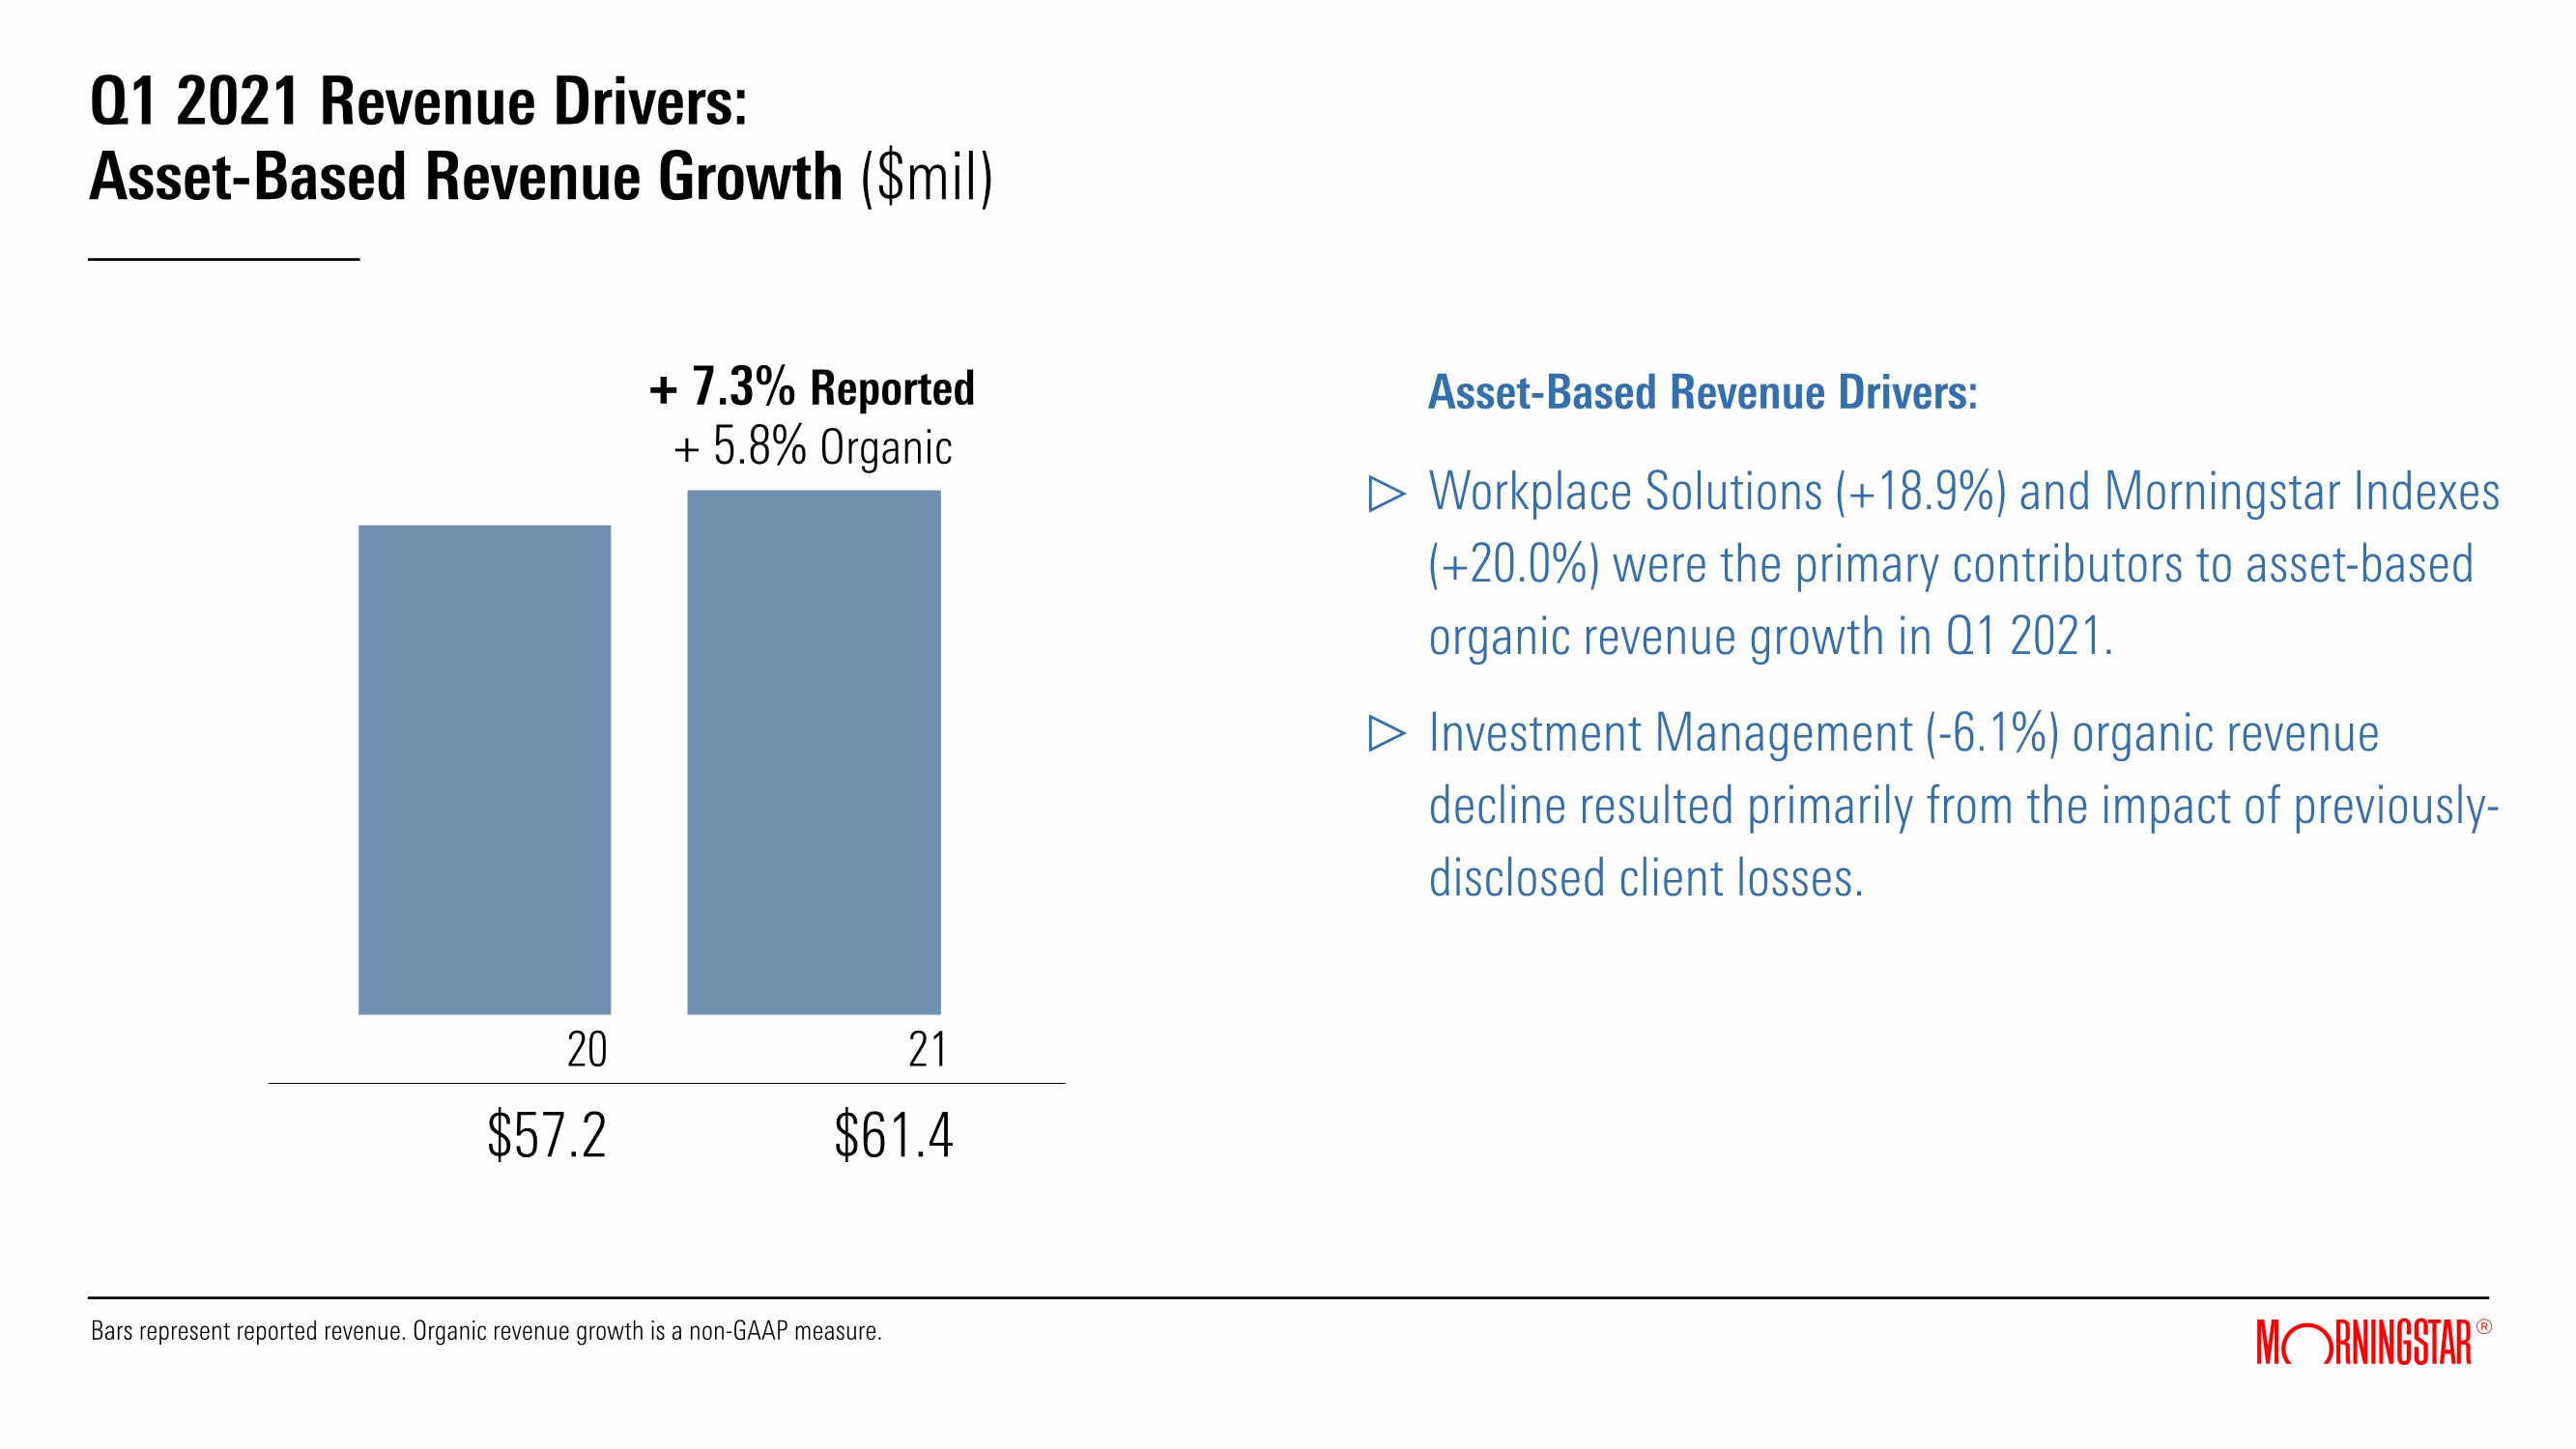
License-based revenue grew 23.2% year over year, or 12.1% on an organic basis, which excludes revenue from Sustainalytics and other M&A activity. PitchBook, Morningstar Data, and Morningstar Direct were the primary contributors to license-based organic revenue growth in the quarter. Asset-based revenue increased 7.3% year over year, or 5.8% organically, with Workplace Solutions and Morningstar Indexes revenue growth more than offsetting the impact of previously-disclosed client losses in Investment Management. Transaction-based revenue increased 28.5% year over year, or 24.8% on an organic basis. DBRS Morningstar and higher year-over-year ad spending on morningstar.com were the primary contributors of growth.
Operating expense increased 16.5% to $325.6 million in the first quarter of 2021, which includes the expense contribution of Sustainalytics. Excluding Sustainalytics and other M&A, operating expense grew 7.4% as higher compensation and benefits, commissions, mutual fund operating costs (offset in revenue), and facilities expenses were partially mitigated by lower travel and professional fees. The decline in certain expenses versus the prior-year period, including $4.4 million of travel and conference costs, was primarily due to reduced travel and pandemic-related gathering restrictions. These favorable comparisons are likely to moderate through 2021. Additionally, accelerated product development efforts related to key product areas increased capitalized software development by $4.3 million, which had a favorable impact on operating expense in the quarter.
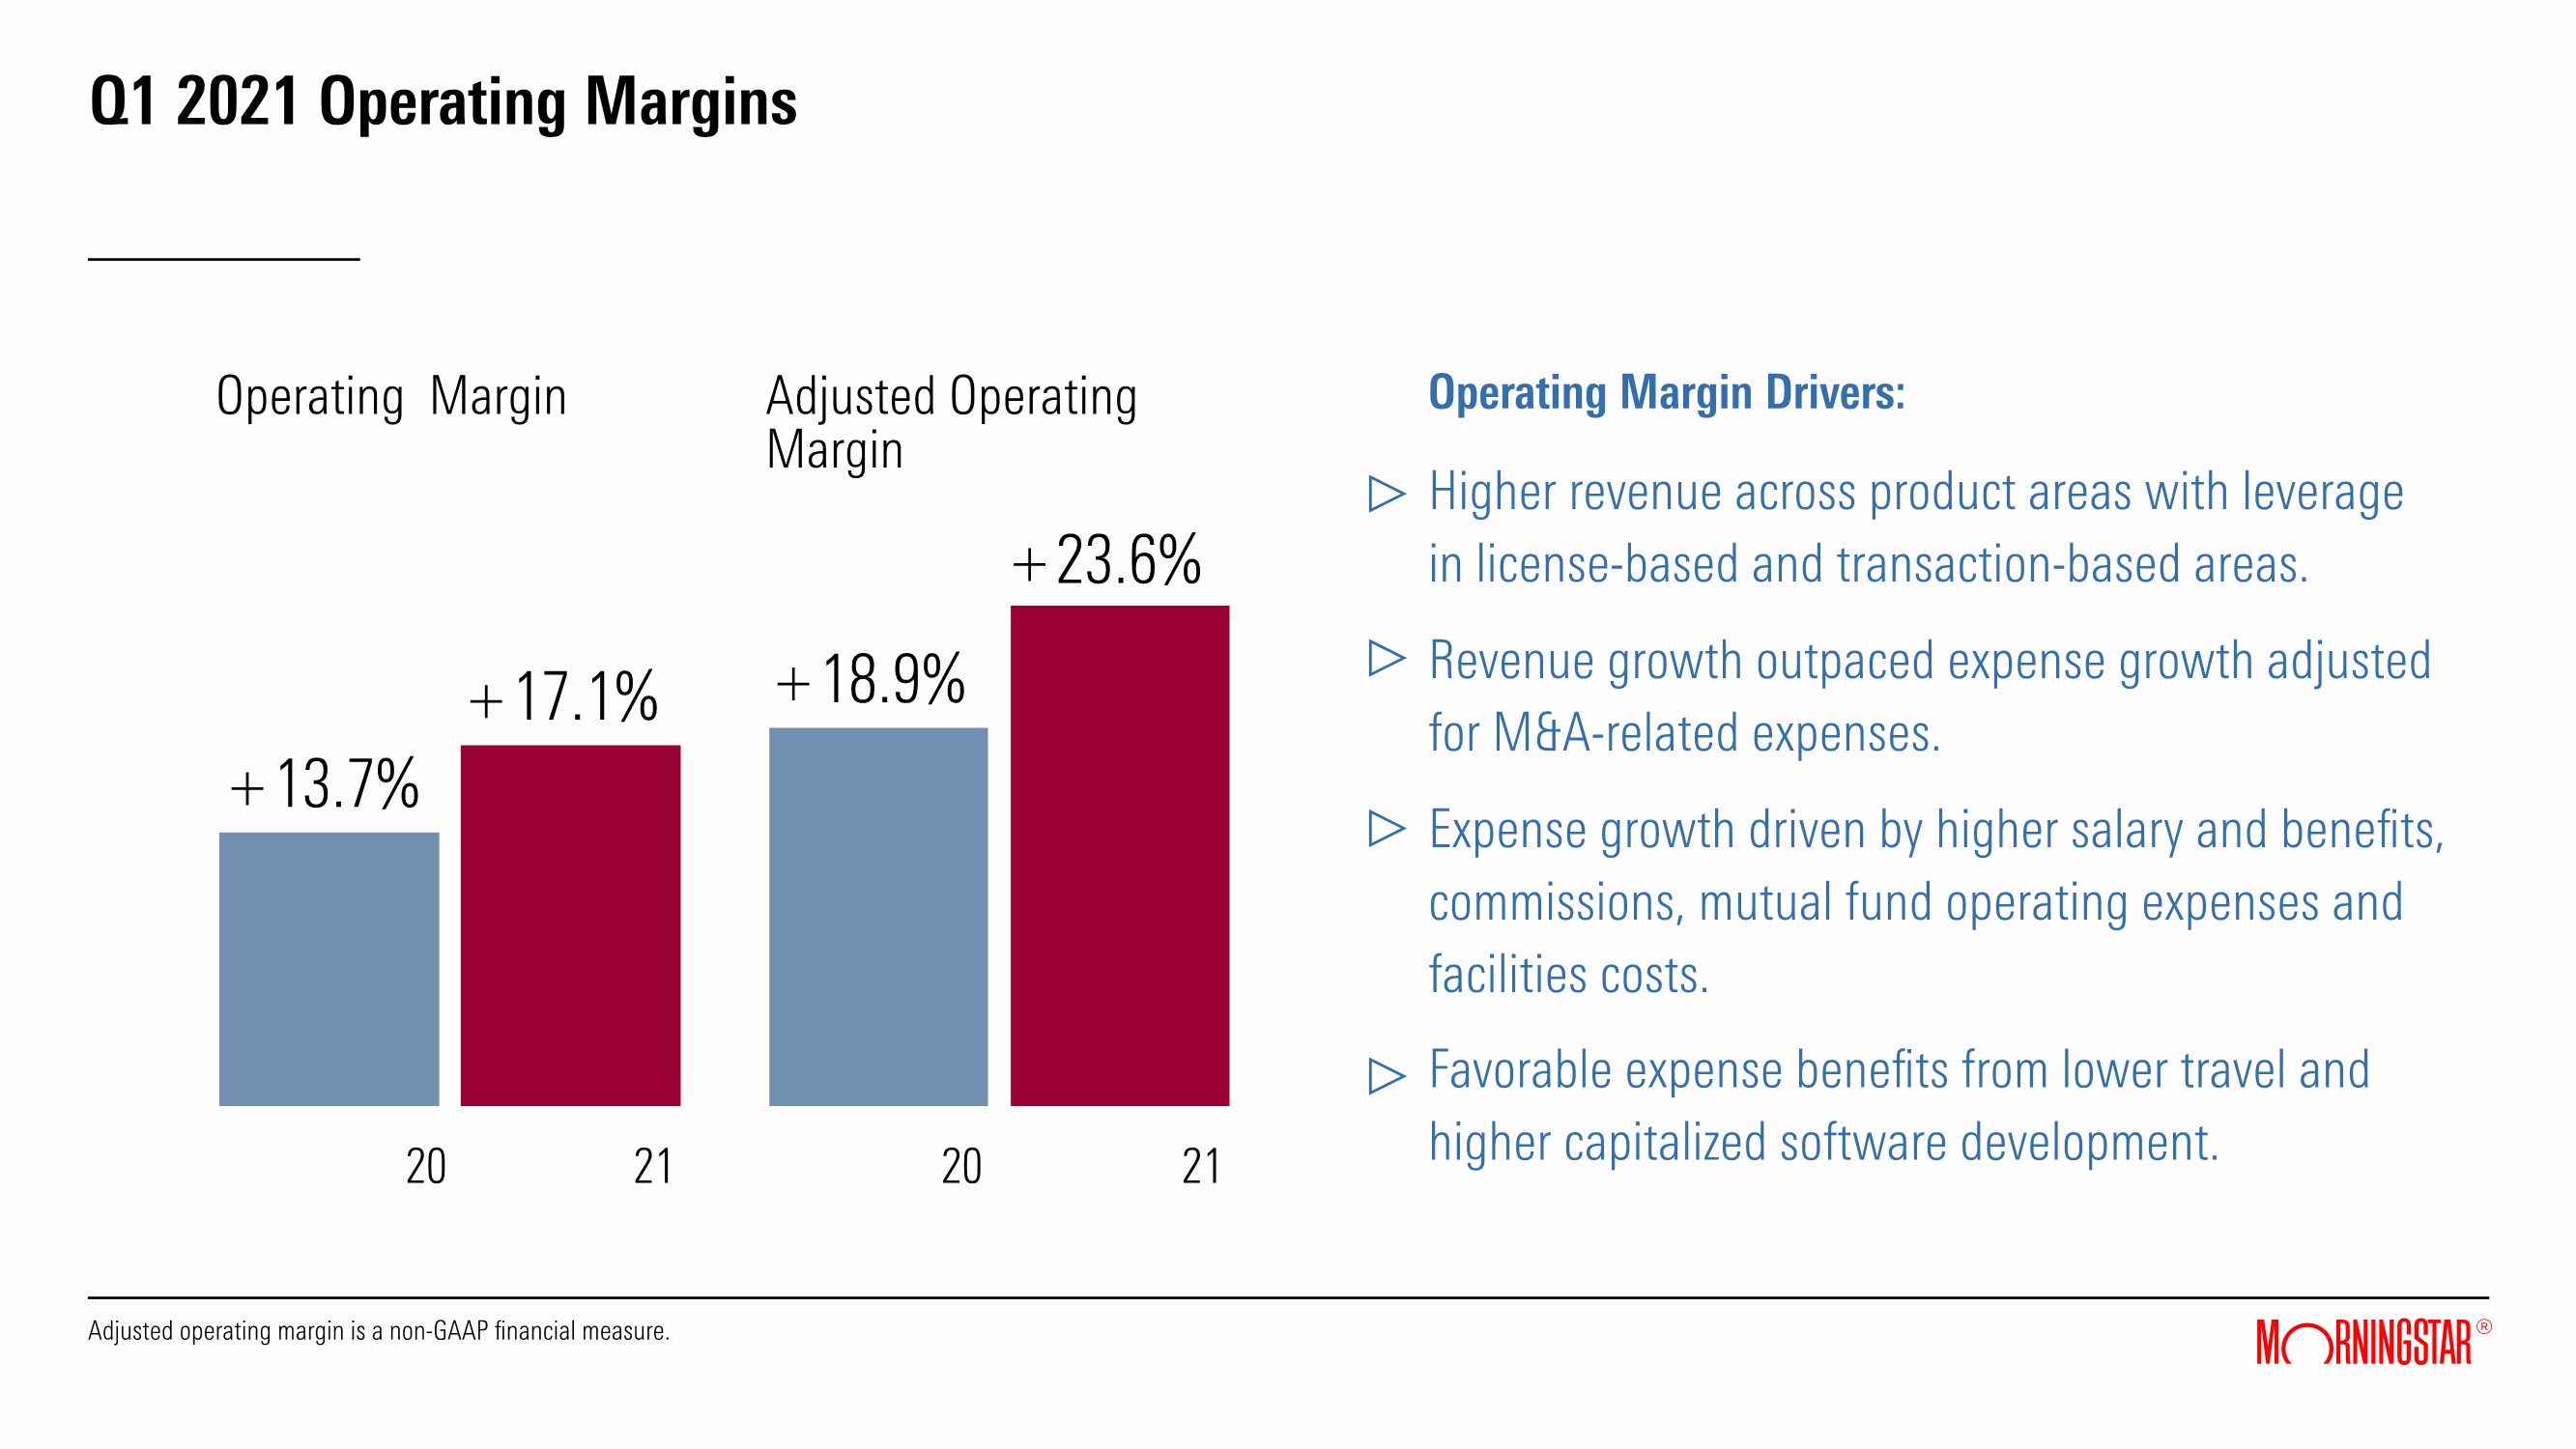
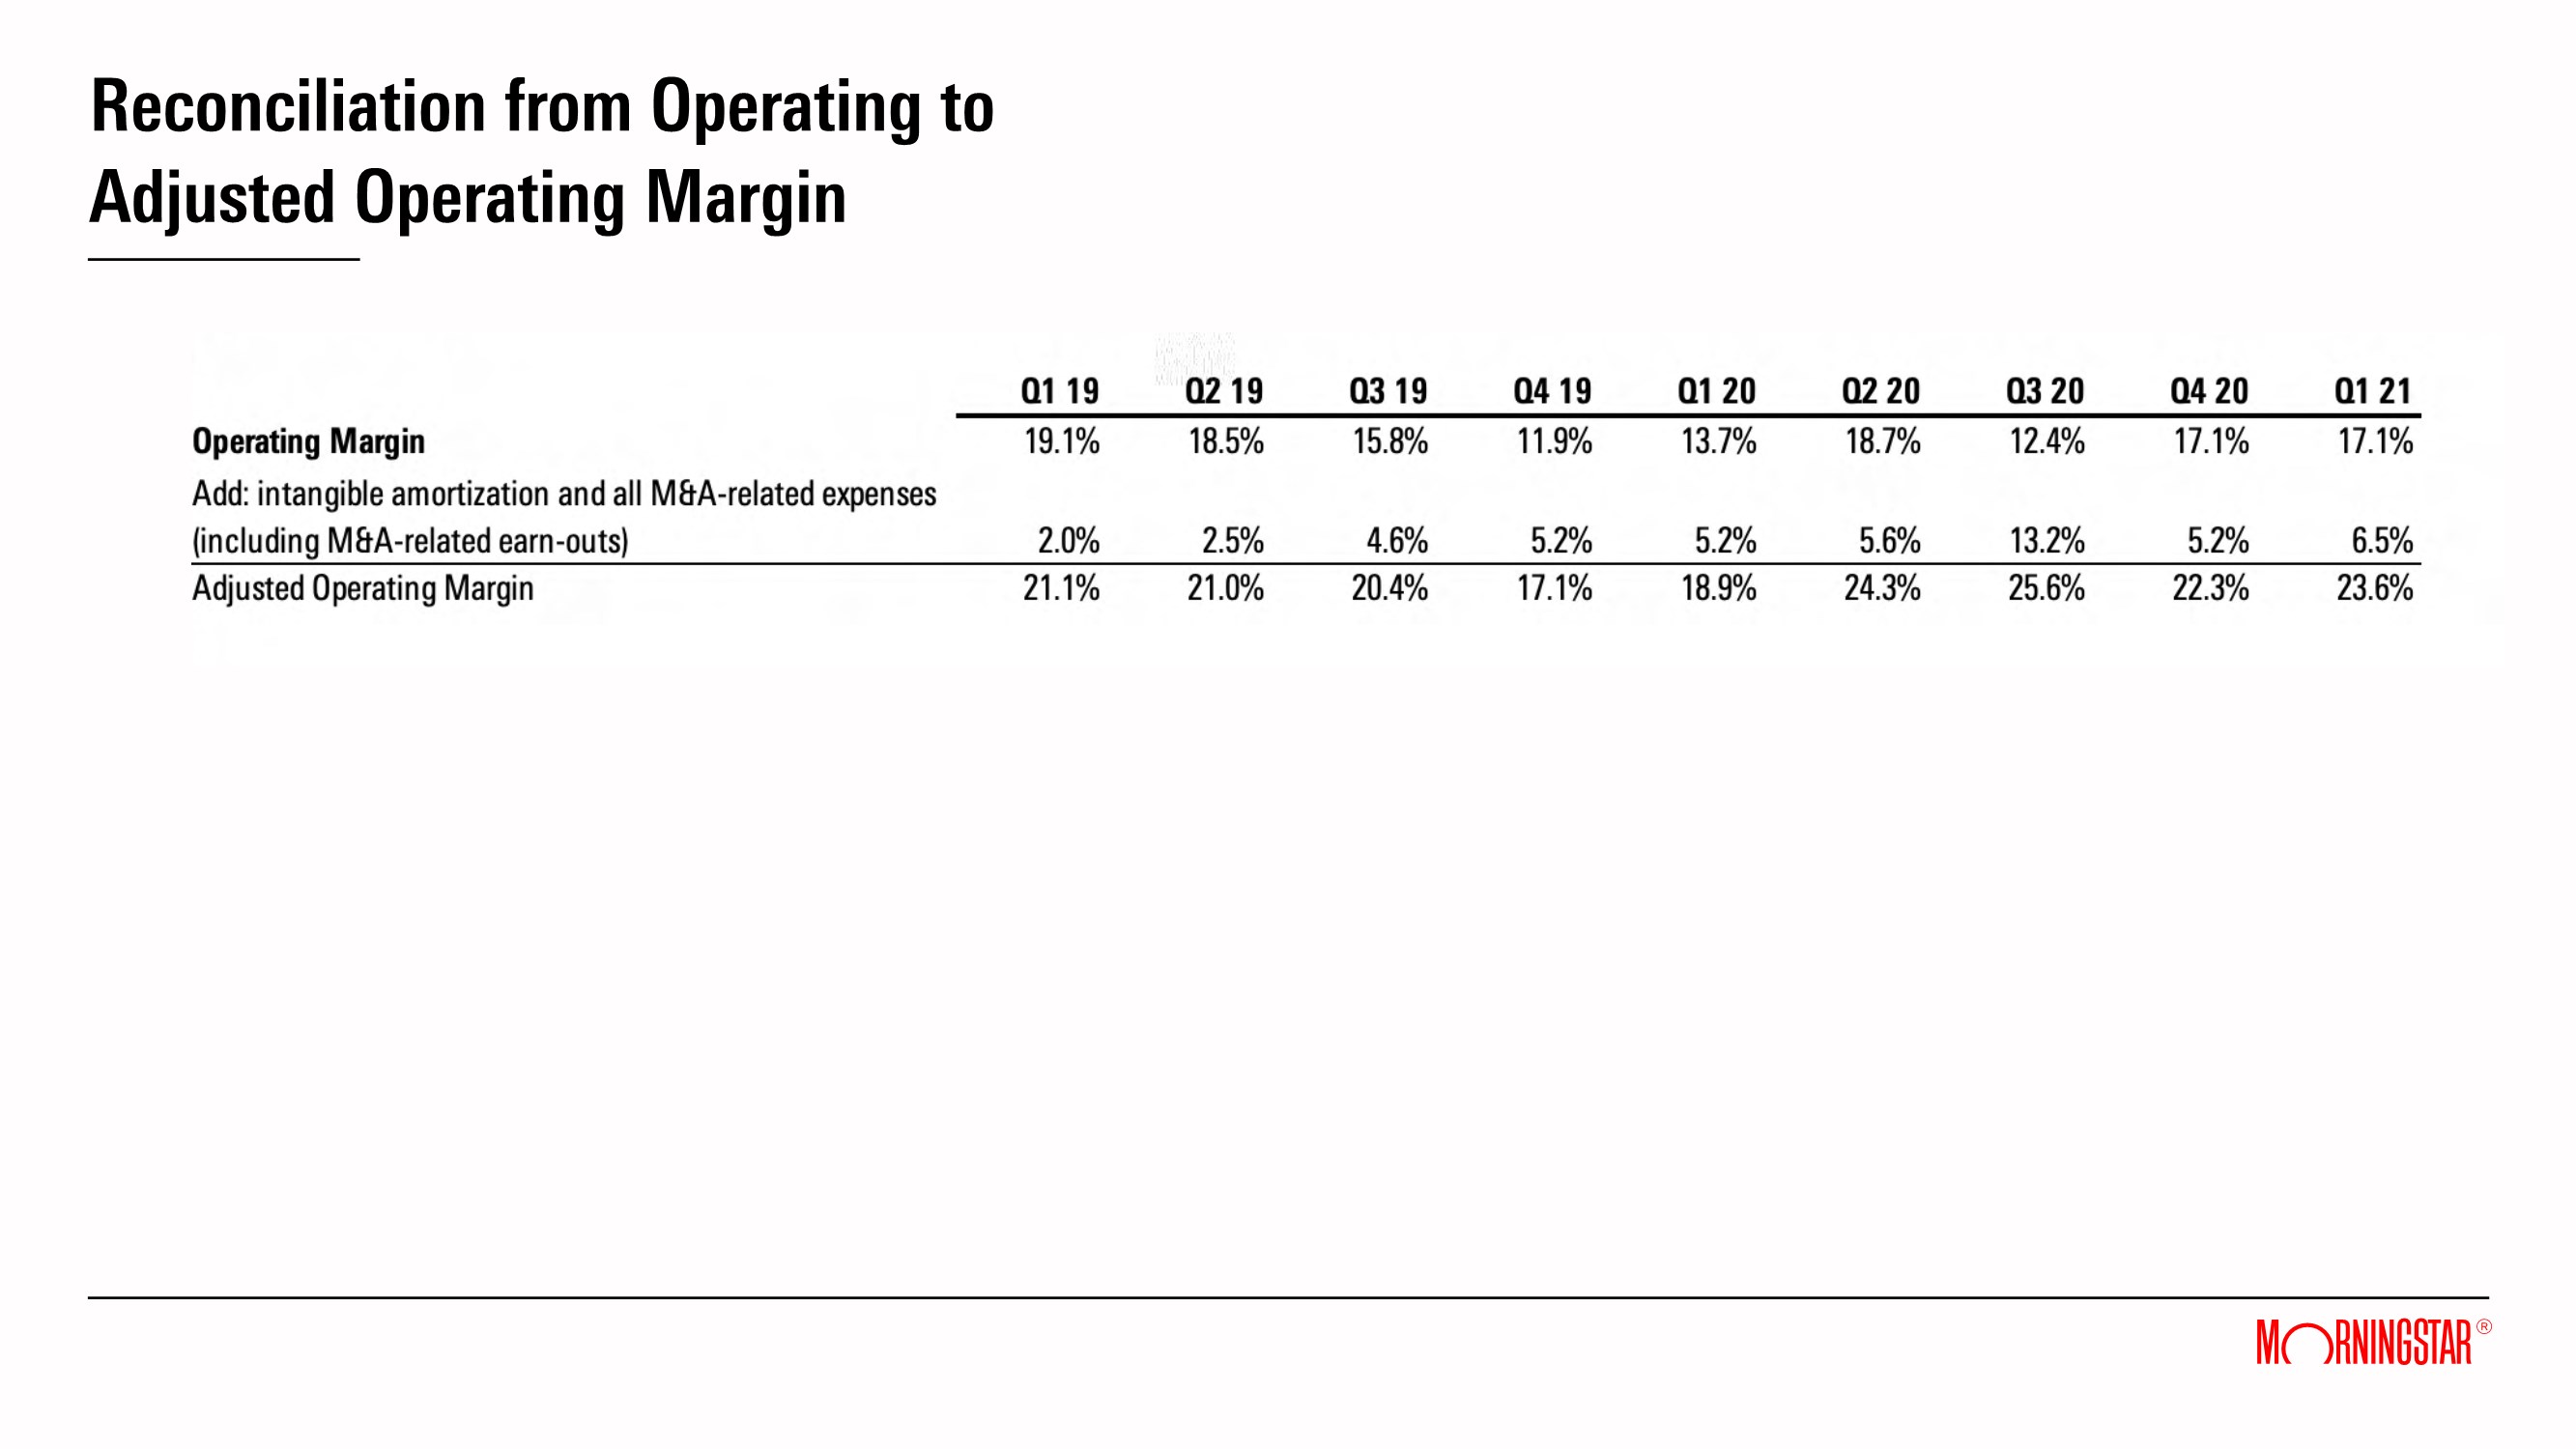
First-quarter operating income was $67.2 million, an increase of 51.0% compared with the prior-year period. Adjusted operating income, which excludes intangible amortization expense and all M&A-related expenses, was $92.3 million in the quarter, an increase of 50.3%, compared with the prior-year period. First-quarter operating margin was 17.1%, compared with 13.7% in the prior-year period. Adjusted operating margin was 23.6% in the first quarter of 2021, versus 18.9% in the prior-year period.
Net income in the first quarter of 2021 was $54.9 million, or $1.27 per diluted share, compared with $23.9 million, or $0.55 per diluted share, in the first quarter of 2020. Adjusted diluted net income per share increased 106.0% to $1.73 in the first quarter of 2021, compared with $0.84 in the prior-year period, excluding intangible amortization expense and all M&A-related expenses.
The effective tax rate for the first quarter of 2021 was 20.4% versus 26.2% in the prior-year period. The decrease is partially attributable to a reduction in our reserves for unrecognized tax benefits in the first quarter of 2021. Also, the effective tax rate in the first quarter of 2020 was higher due to a non-deductible foreign exchange loss.
Page 2 of 12
Product Area Highlights
The Company continues to execute its strategy and invest for long-term growth (performance of the largest product areas and key metrics are reported in the Supplemental Data table). On a consolidated basis, PitchBook, DBRS Morningstar, Morningstar Data, Workplace Solutions, and Morningstar Direct were the primary contributors of organic revenue growth in the first quarter of 2021. Highlights of these and other products include:
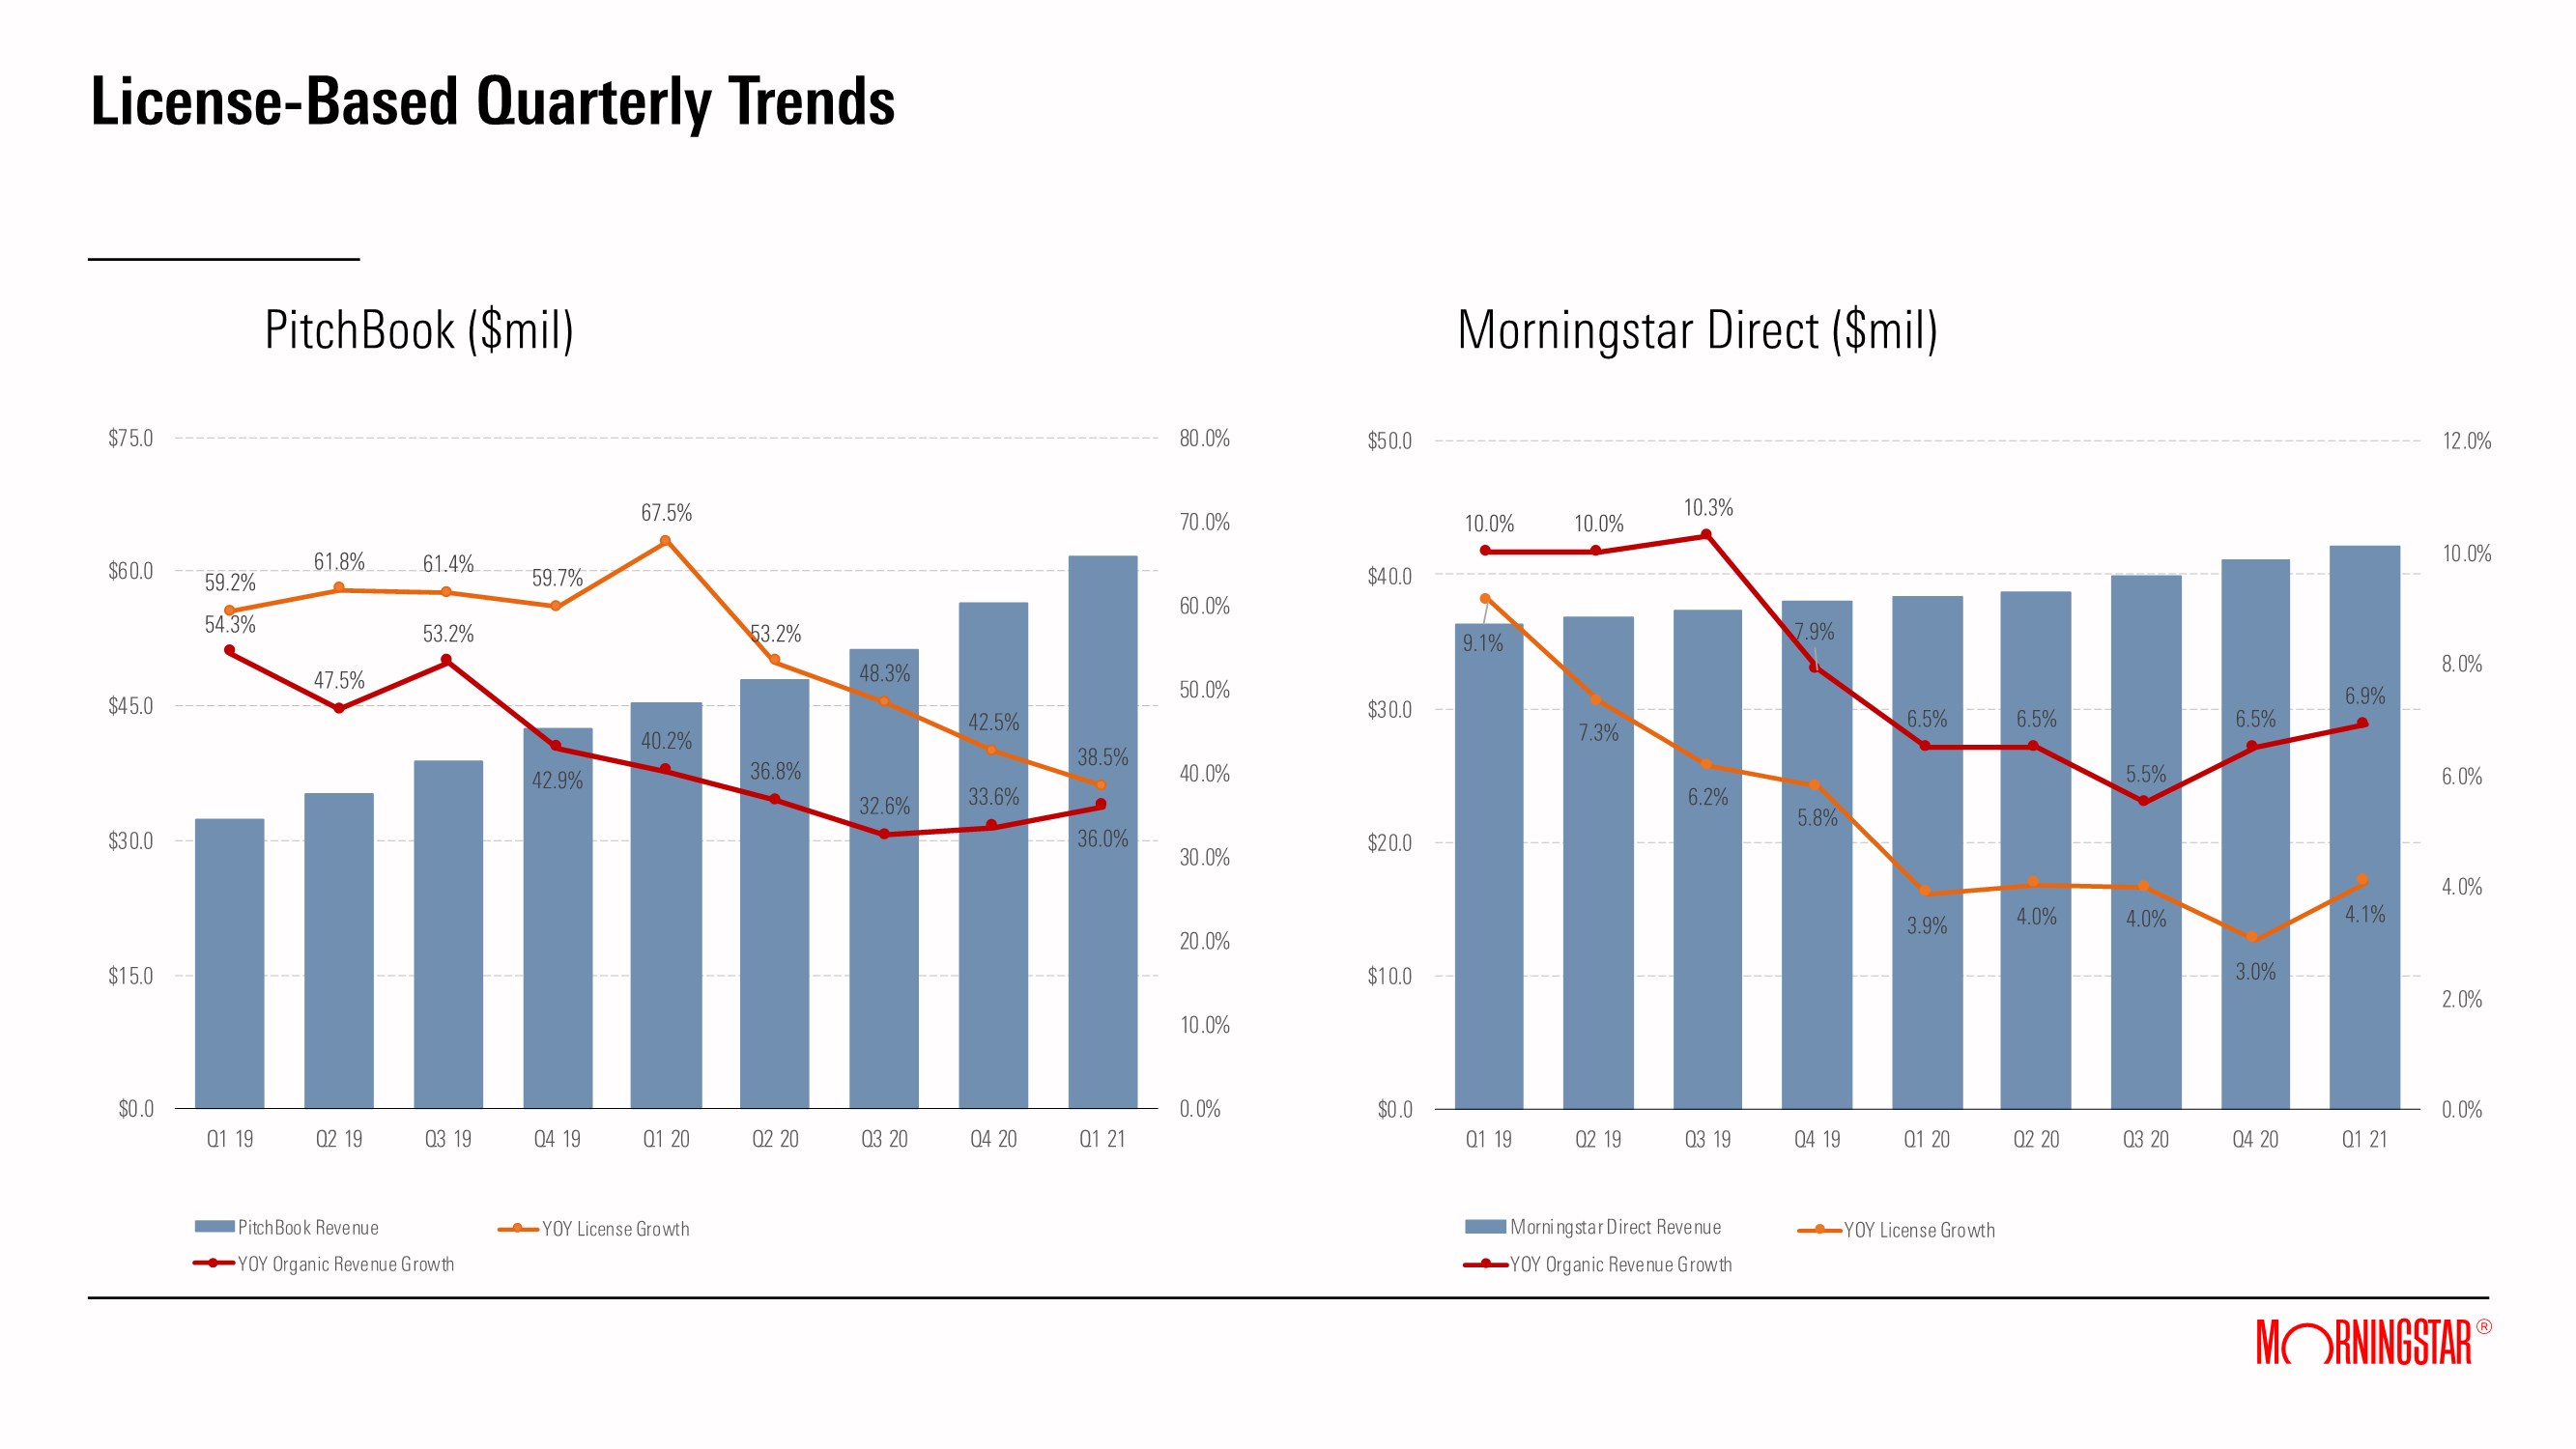
| · | PitchBook grew revenue by 36.0% and licenses by 38.5%, highlighting ongoing expansion of existing client relationships along with growth in new users. In the first quarter, PitchBook increased its coverage of European companies, including accelerating valuation coverage by nearly 200% versus the prior year. This improves its capability in an important geography for private market investing. |
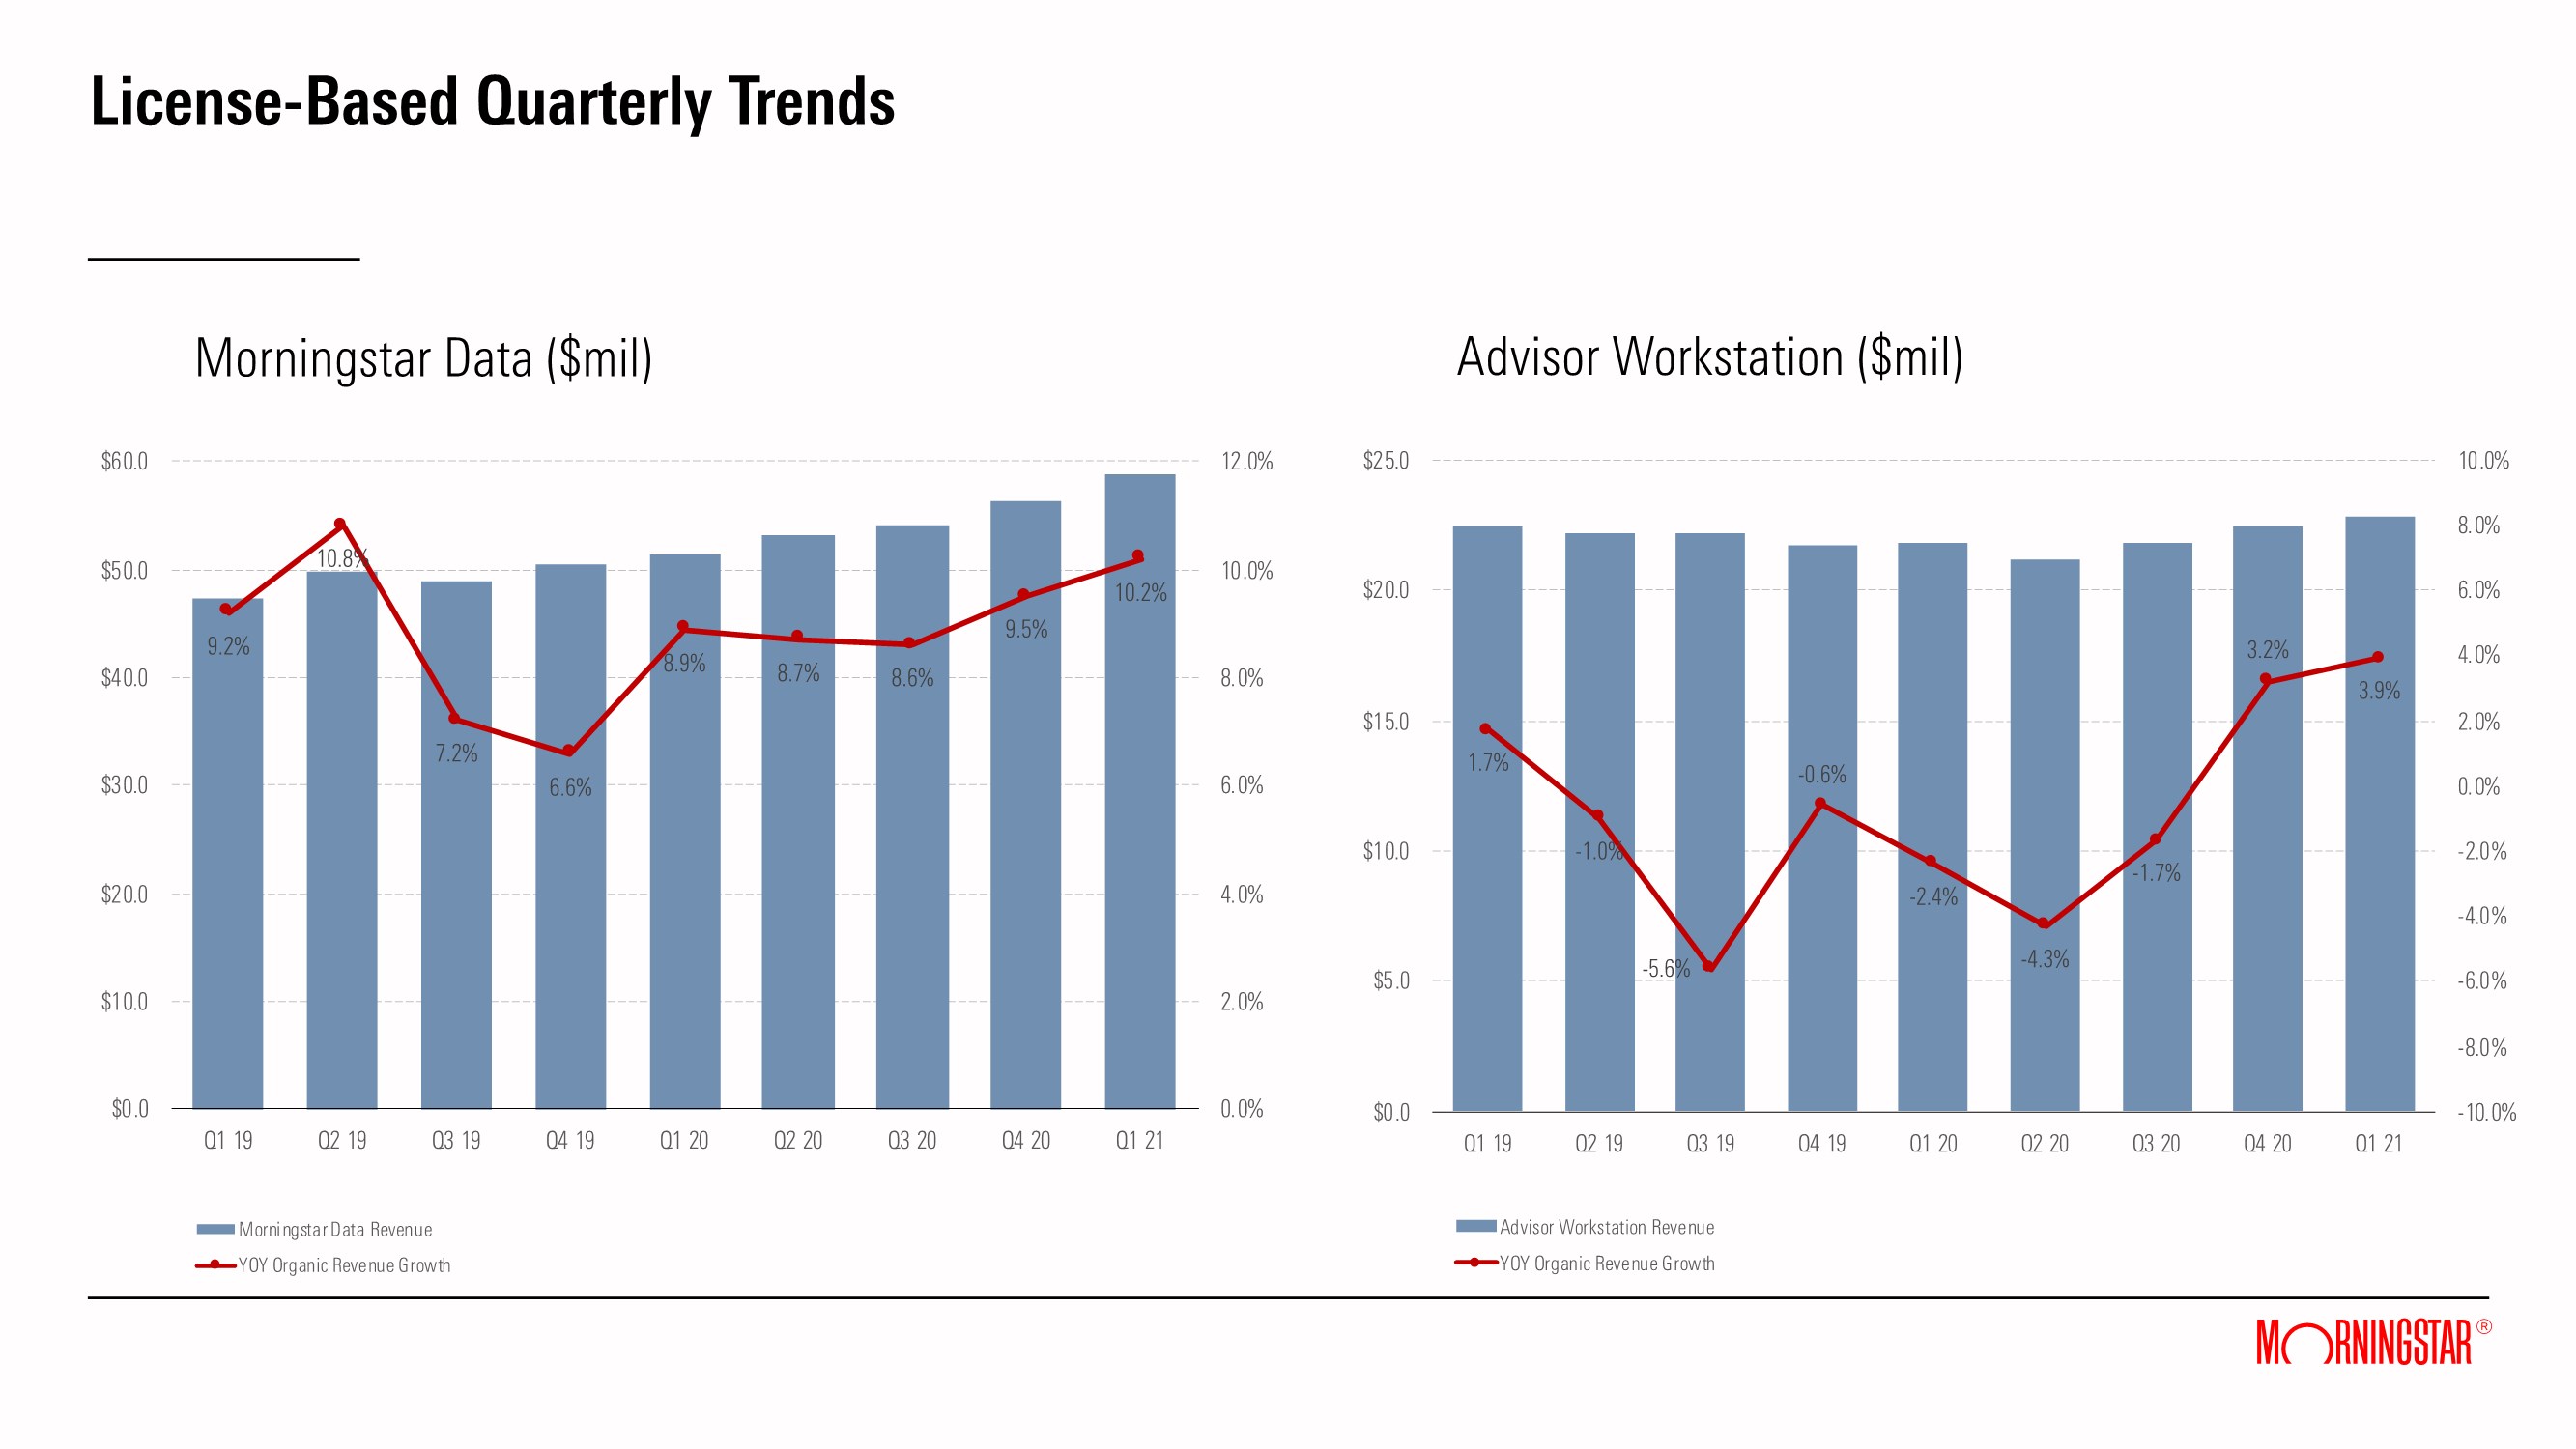
| · | Morningstar Data grew revenue year over year by 14.4%, or 10.2% on an organic basis, driven primarily by sales of Fund Datafeeds and Morningstar Essentials, a bundled offering of Morningstar's proprietary offerings like the Morningstar Rating™ and the Morningstar Style Box™, in the U.S. and Europe. |
| · | Morningstar Direct year-over-year revenue growth of 9.9%, or 6.9% on an organic basis, was driven primarily by increased sales of Morningstar Direct in the U.S. and Europe, and supported by the addition of new ESG data points in Direct. |
| · | Advisor Workstation grew revenue 4.6%, or 3.9% on an organic basis. A resurgence in client demand due to Regulation Best Interest and ongoing development of Morningstar's new financial planning solutions continues to build momentum. |
| · | Sustainalytics continued to capitalize on robust demand for ESG research, data and analytics, with particular strength in green bond validations in the first quarter of 2021. In support of clients preparing to comply with the new EU Sustainable Finance Disclosure Regulation (SFDR), Sustainalytics released a data package mapping its research to the 60 indicators defined by the regulation, while Morningstar's broad suite of ESG solutions, including Morningstar ESG Indexes and research on sustainability and corporate governance risks, addressed other key aspects of the SFDR. |
| · | Investment Management revenue declined 3.6%, or 6.1% on an organic basis due primarily to previously reported client losses. |
| · | Workplace Solutions grew revenue by 18.9%, driven primarily by market gains and growth in Managed Accounts as assets under management and advisement continued to climb in Morningstar Retirement Manager. |
| · | Morningstar Indexes revenue increased by 21.1%, or 20.0% on an organic basis, resulting from continued momentum across products and regions. Strong net inflows spanned both beta and strategic-beta products, while clients seeking alternatives in the face of fee pressure continue to support demand for licensed index data. |
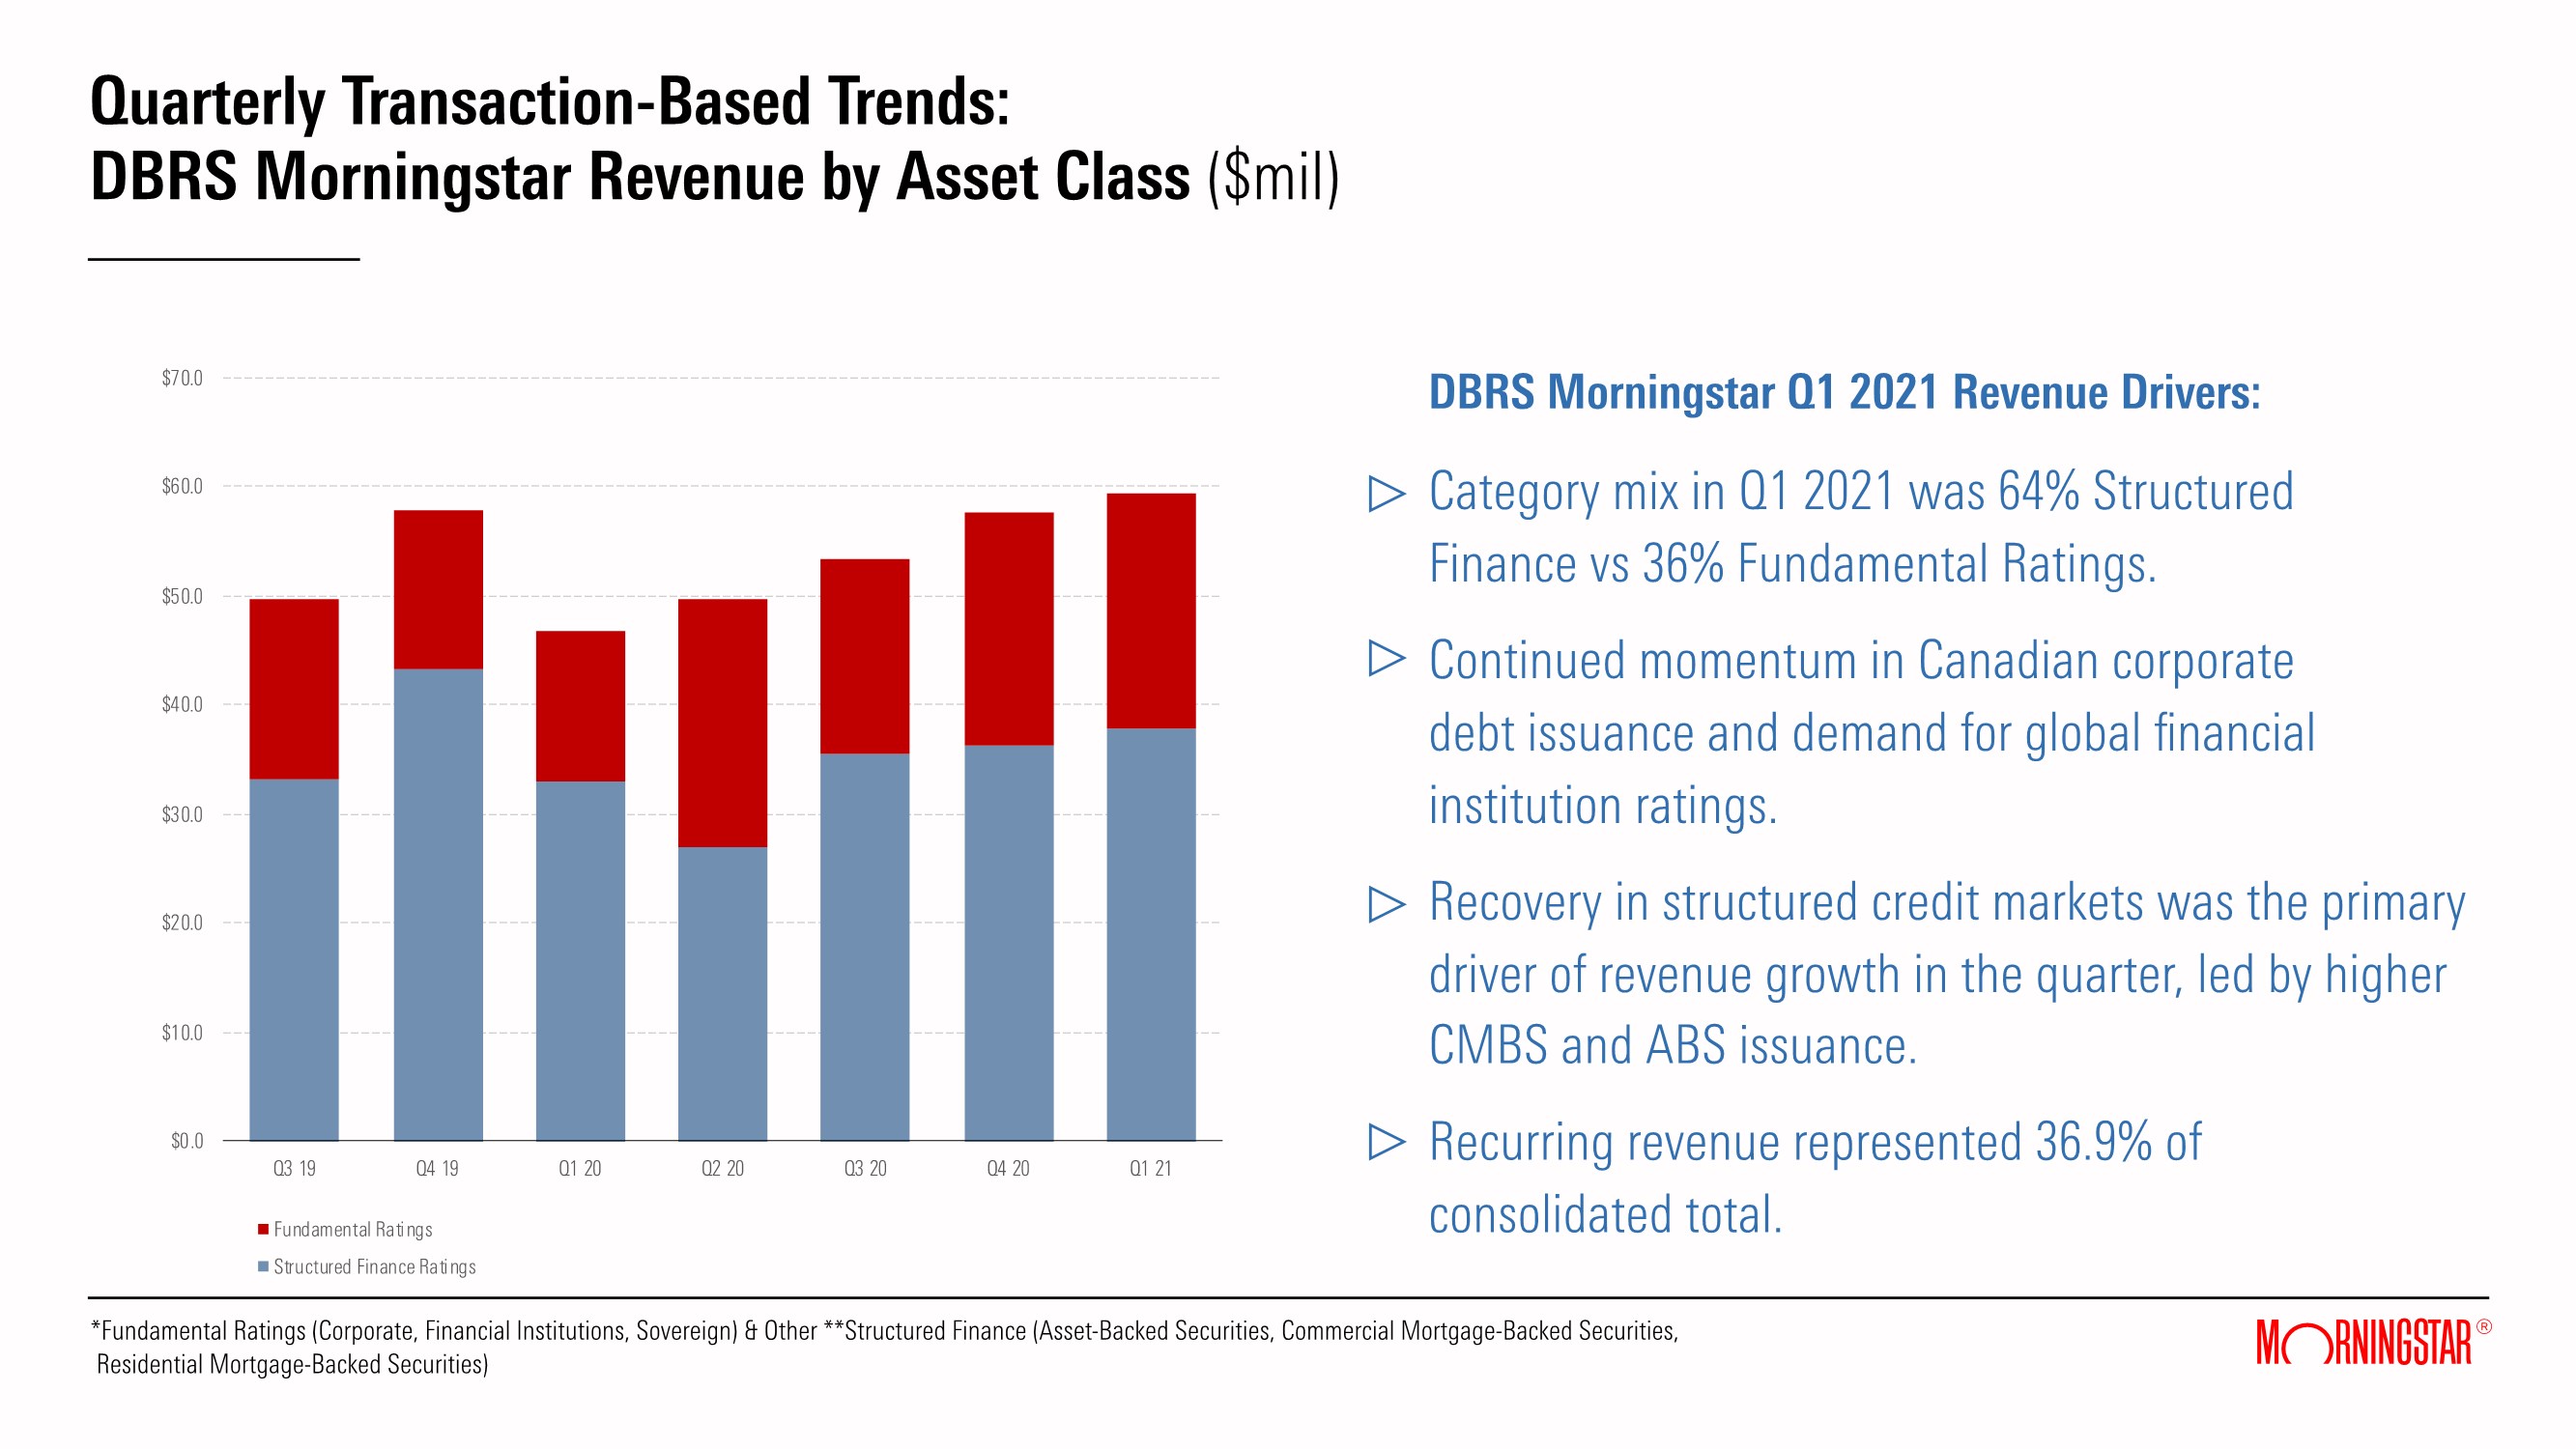
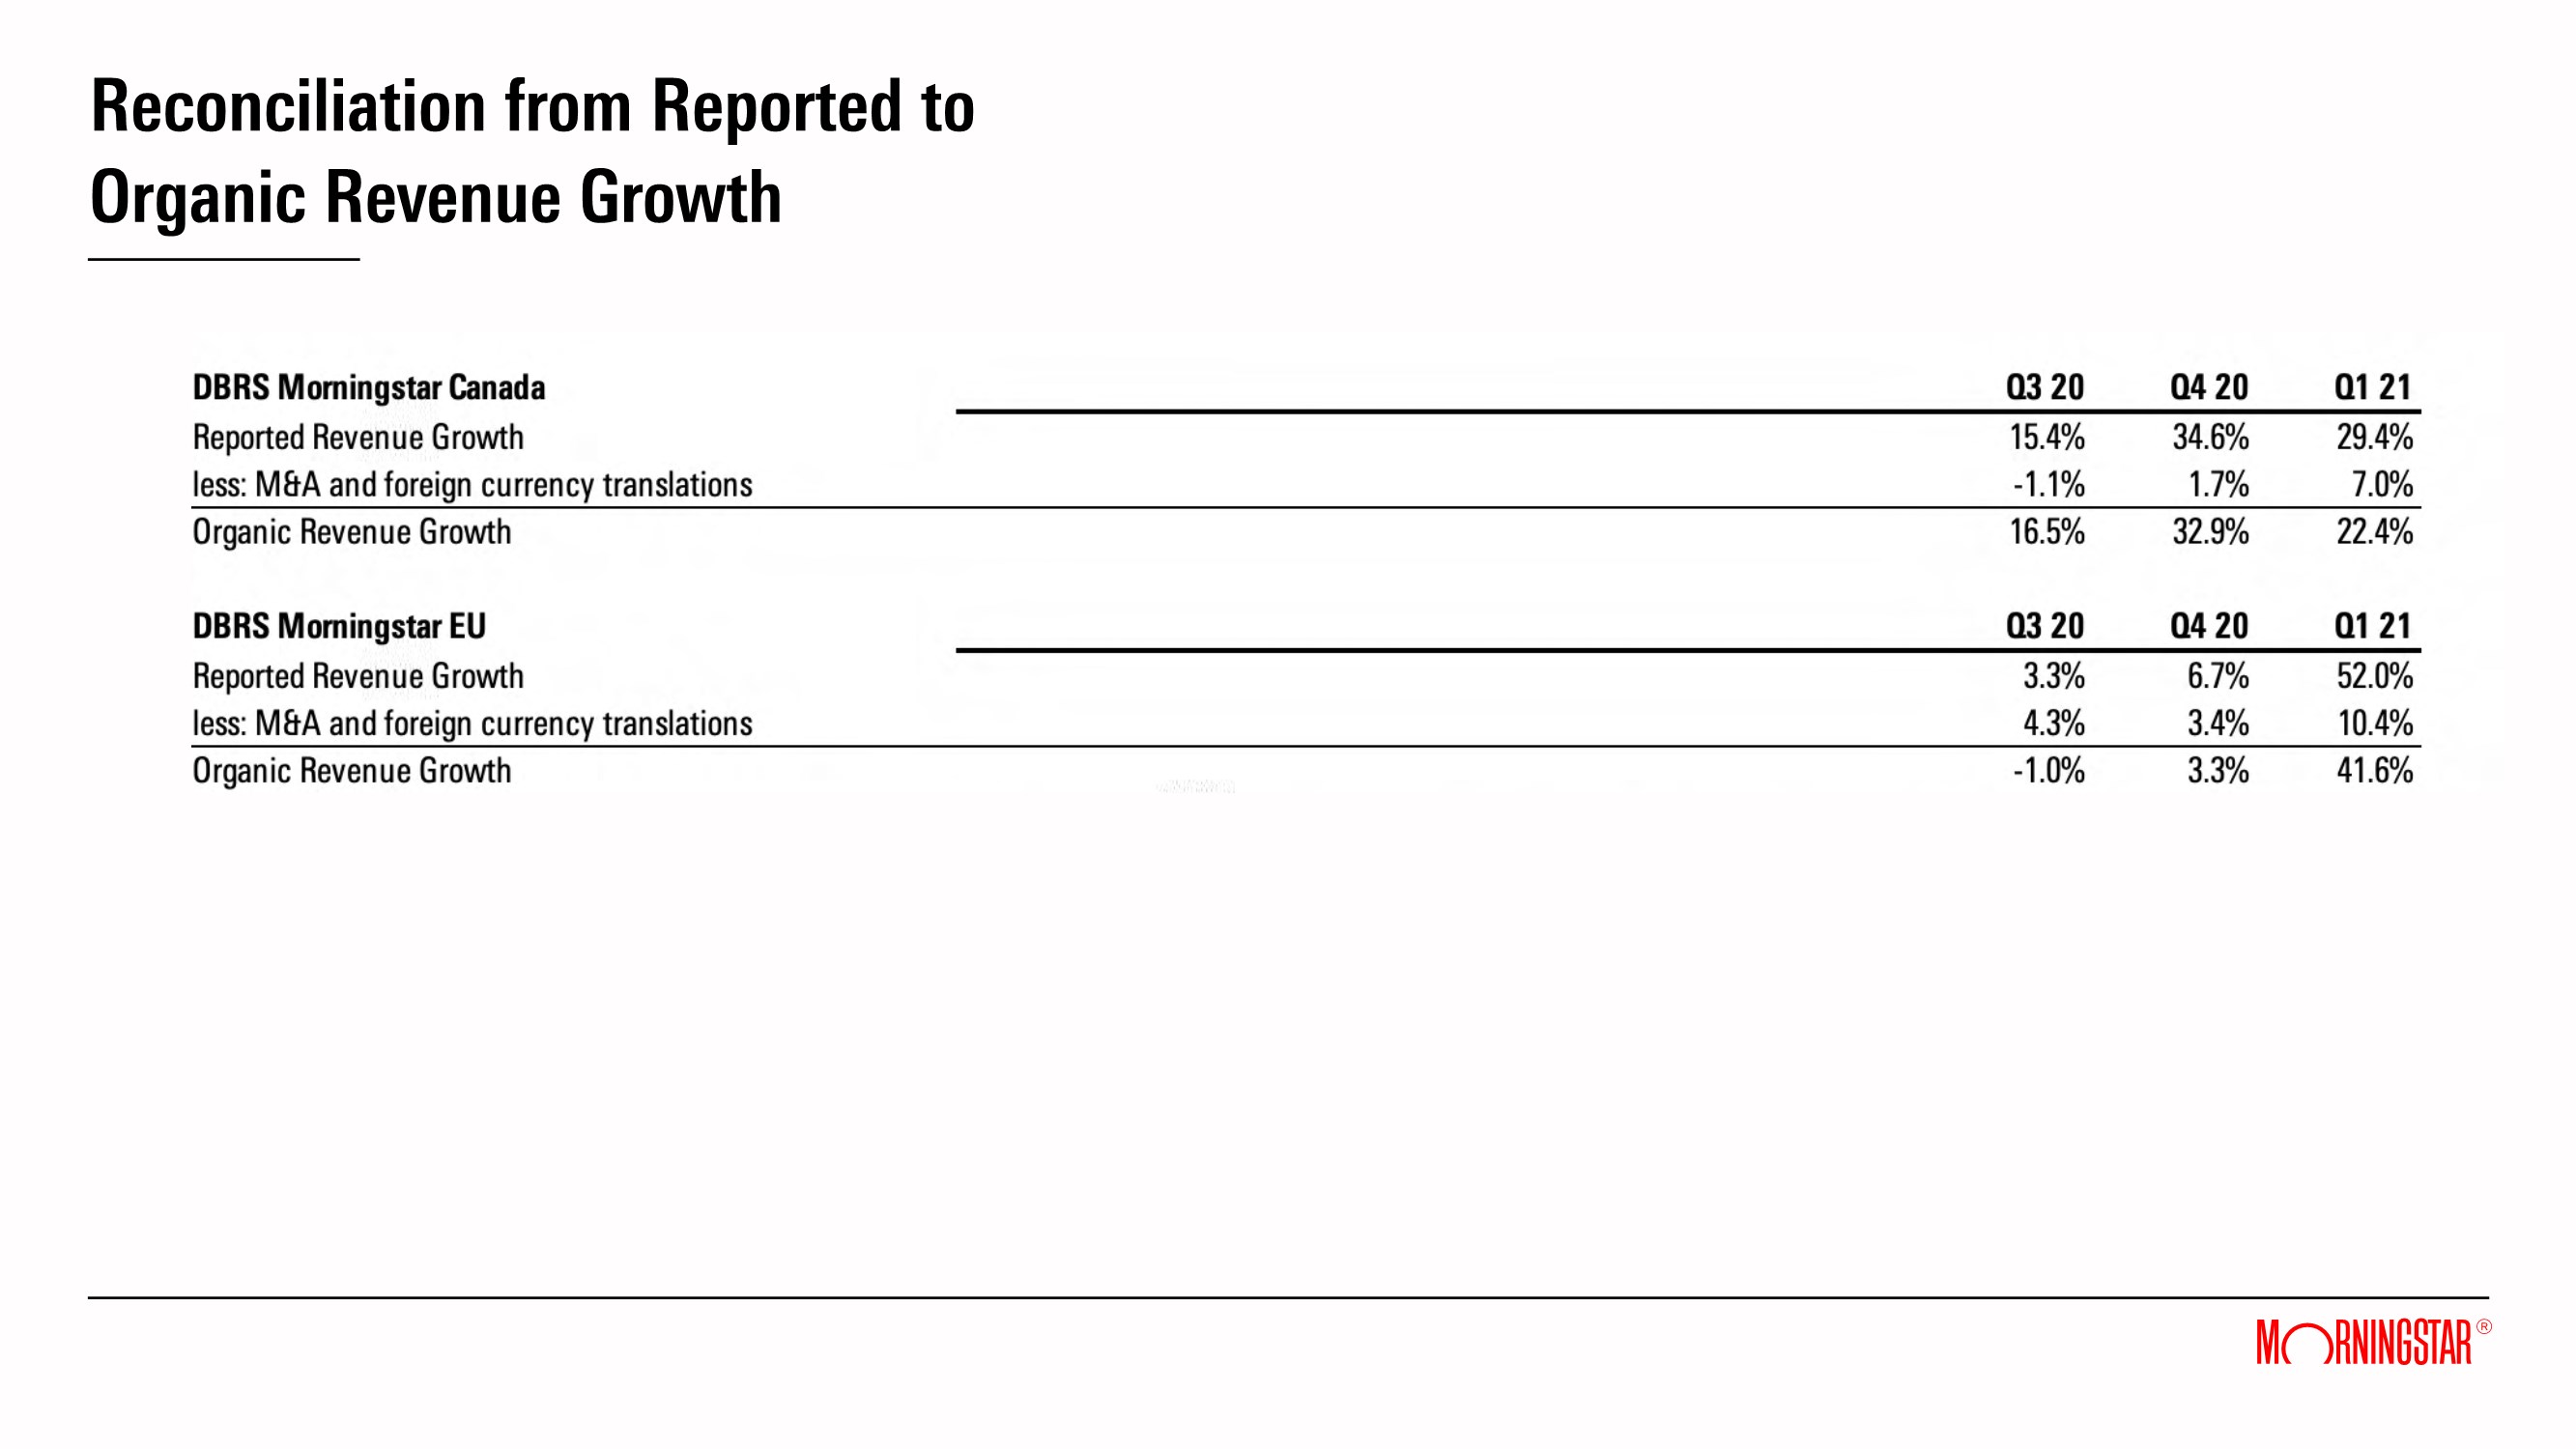
| · | DBRS Morningstar year-over-year revenue growth of 27.0%, or 23.5% on an organic basis, stemmed primarily from a recovery in the structured credit markets, which tightened in the first quarter of 2020 due to pandemic-related concerns. Stronger issuance activity in both commercial mortgage-backed and asset-backed securities were the primary drivers of performance within structured finance asset classes. Continued momentum in issuance of Canadian corporates and global financial institutions also contributed to revenue growth in the quarter. |
Page 3 of 12
Balance Sheet and Capital Allocation
As of March 31, 2021, the Company had cash, cash equivalents, and investments totaling $433.7 million and $404.2 million of long-term debt, compared with cash, cash equivalents, and investments of $464.2 million and $449.1 million of long-term debt as of Dec. 31, 2020.
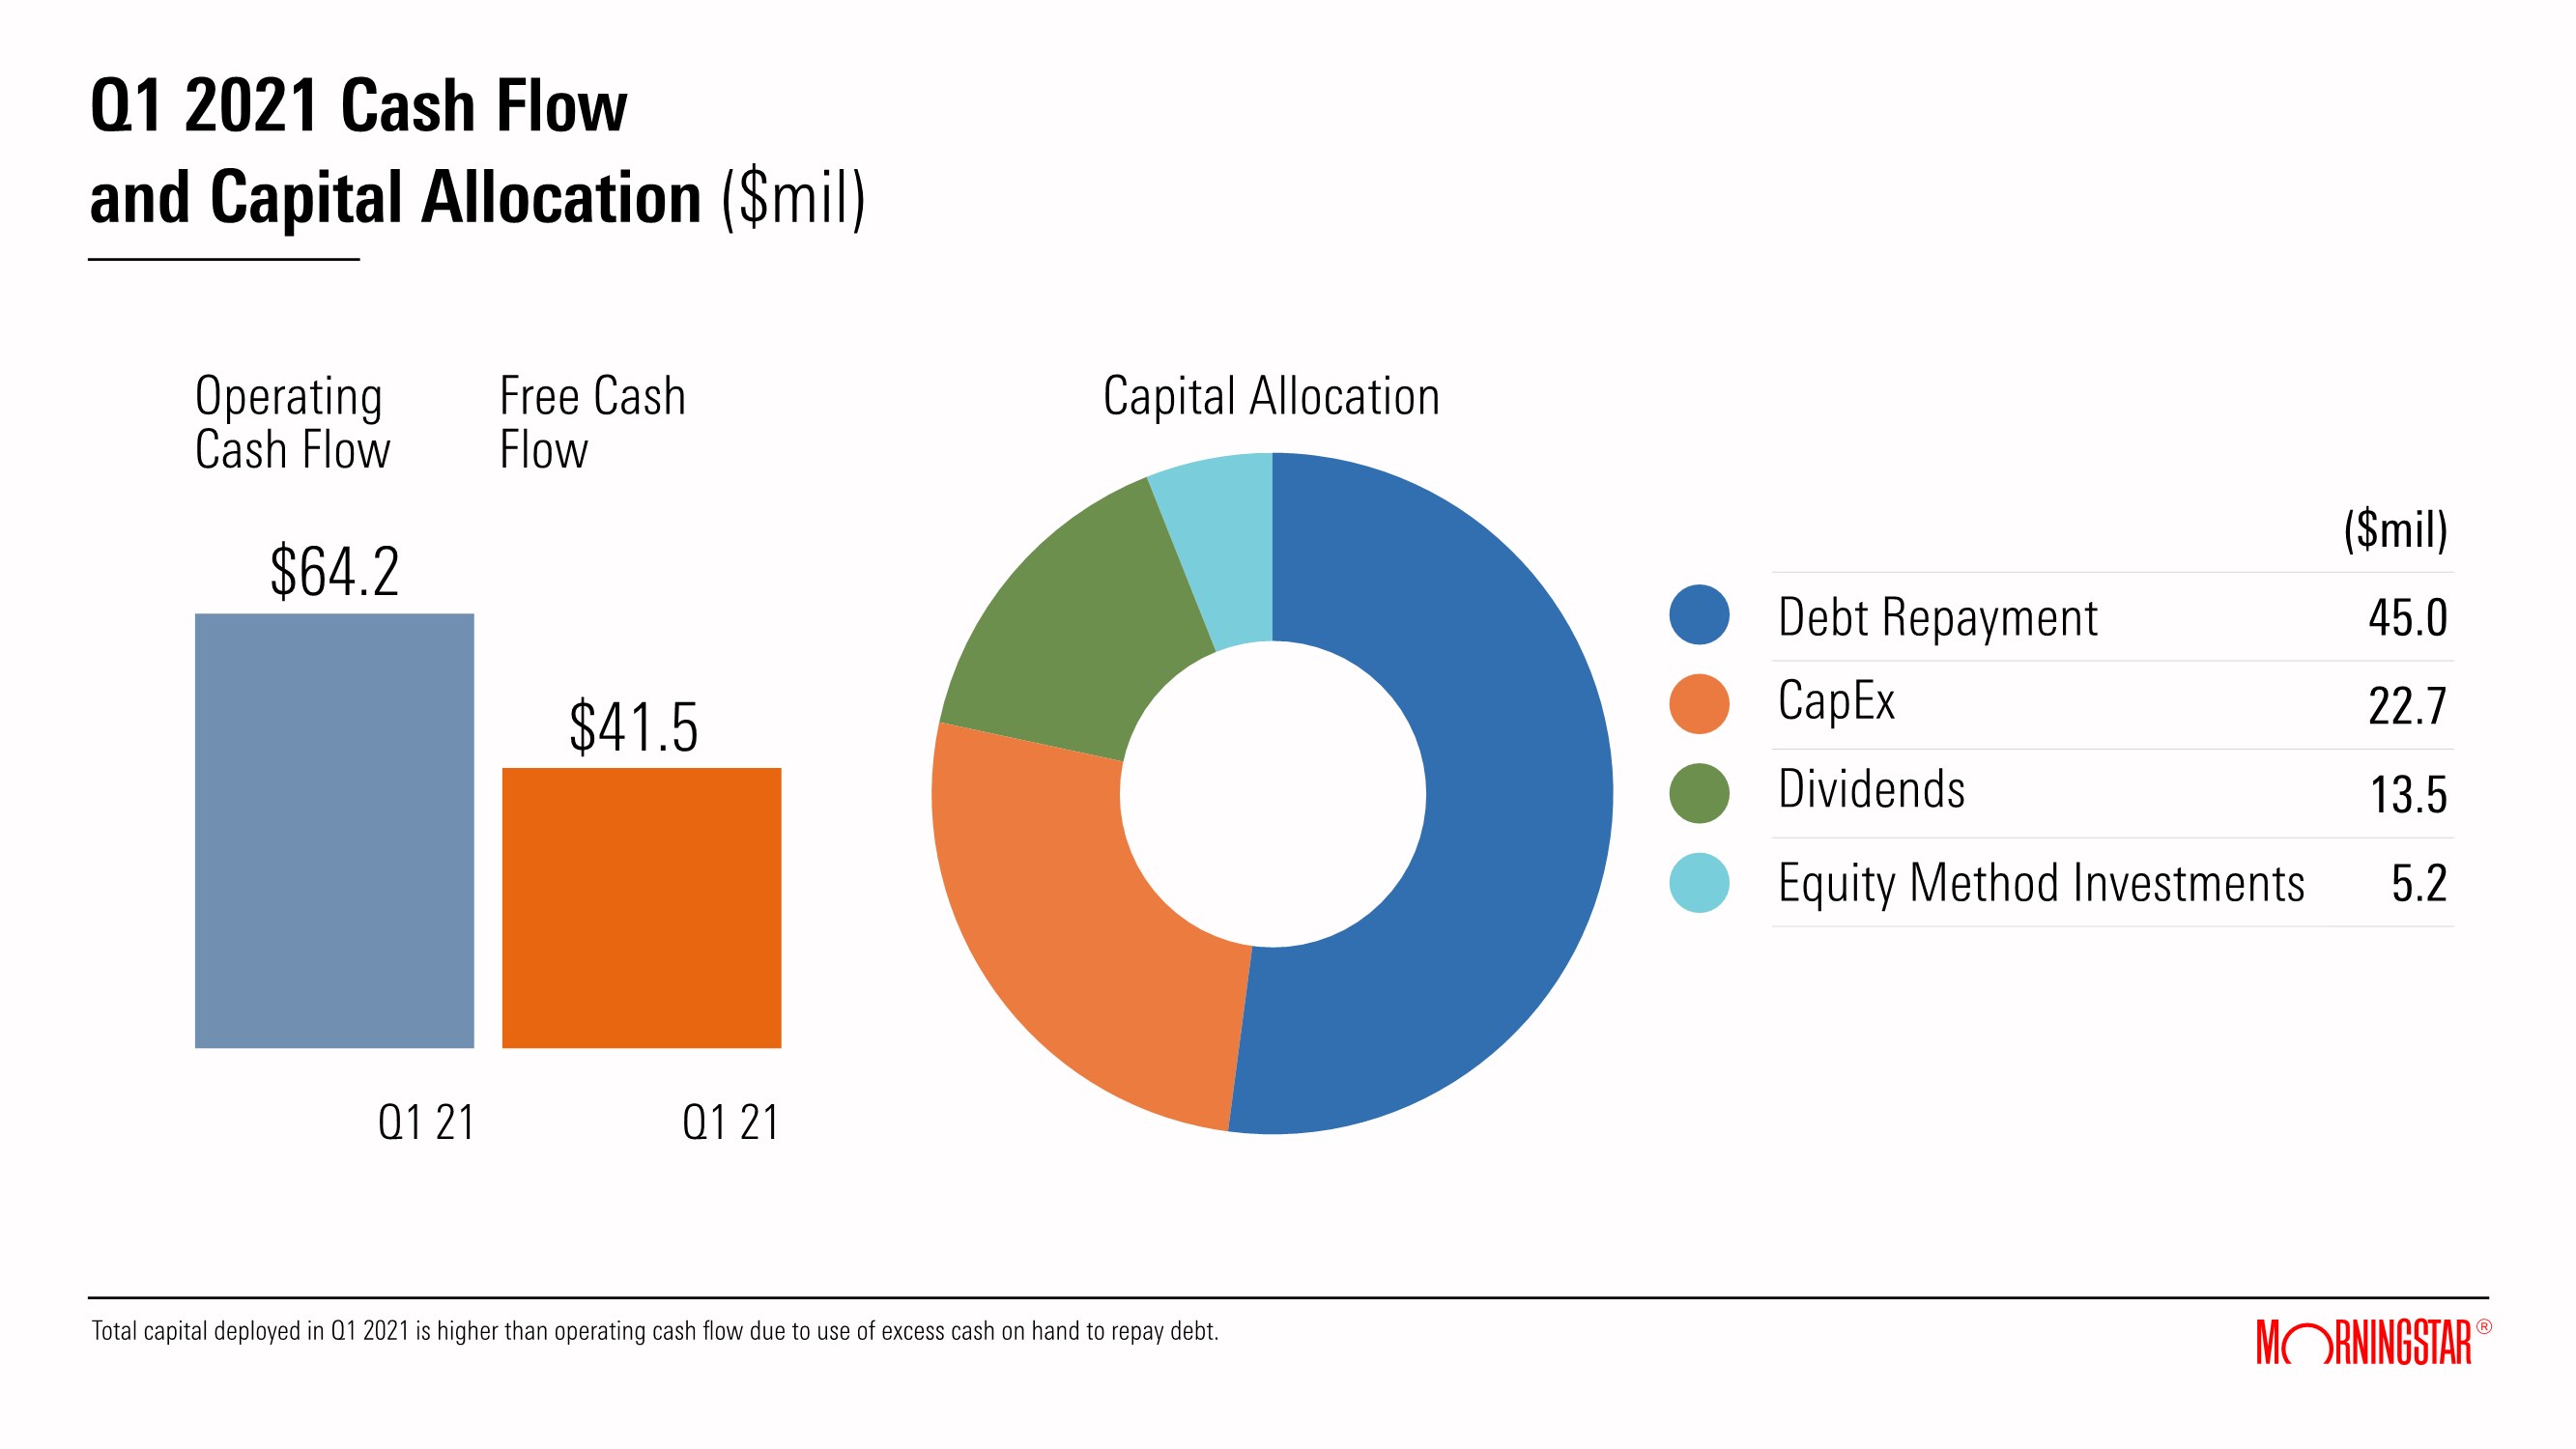
Cash provided by operating activities was $64.2 million for the first quarter of 2021, compared with $48.7 million in the prior-year period driven by higher cash earnings and strong working capital management. Free cash flow was $41.5 million in the first quarter of 2021 compared with $33.6 million in the prior-year period. In the first quarter of 2021, the Company paid $13.5 million in dividends, and repaid $45.0 million of total debt.
Comparability of Year-Over-Year Results
In addition to the contributions from Sustainalytics, and the intangible amortization expense and the M&A-related expenses discussed above, certain other items affected the comparability of first-quarter 2021 results versus the same period in 2020.
| · | First-quarter 2021 organic revenue excludes revenue from Sustainalytics and other acquisitions. |
| · | Foreign currency translation increased revenue by $8.3 million, or 2.6%, and operating expense by $7.5 million, or 2.7%, in the first quarter of 2021. This resulted in an increase of $0.8 million in first-quarter operating income. |
Use of Non-GAAP Financial Measures
The tables at the end of this press release include a reconciliation of the non-GAAP financial measures used by the Company to comparable GAAP measures and an explanation of why the Company uses them.
2021 Shareholders’ Meeting
Shareholders, prospective shareholders, analysts, and other interested parties are cordially invited to attend our 2021 Annual Shareholders' Meeting, which will be held at 9 a.m. Central time on Friday, May 14, 2021. In order to facilitate participation from our shareholders around the world, our annual meeting will be held via a live webcast. The meeting will cover the official business described in our proxy statement and include presentations from our management team, along with a question-and- answer period. To register for the meeting, please visit: https://cvent.me/NxnKkW
Investor Communication
Morningstar encourages all interested parties — including securities analysts, current shareholders, potential shareholders, and others — to submit questions in writing. Investors and others may send questions about Morningstar’s business to [email protected]. Morningstar will make written responses to selected inquiries available to all investors at the same time in Form 8-Ks furnished to the Securities and Exchange Commission, generally every month.
Page 4 of 12
About Morningstar, Inc.
Morningstar, Inc. is a leading provider of independent investment research in North America, Europe, Australia, and Asia. The Company offers an extensive line of products and services for individual investors, financial advisors, asset managers and owners, retirement plan providers and sponsors, and institutional investors in the debt and private capital markets. Morningstar provides data and research insights on a wide range of investment offerings, including managed investment products, publicly listed companies, private capital markets, debt securities, and real-time global market data. Morningstar also offers investment management services through its investment advisory subsidiaries, with approximately $244 billion in assets under advisement and management as of March 31, 2021. The Company has operations in 29 countries. For more information, visit www.morningstar.com/company. Follow Morningstar on Twitter @MorningstarInc.
Caution Concerning Forward-Looking Statements
This press release contains forward-looking statements as that term is used in the Private Securities Litigation Reform Act of 1995. These statements are based on our current expectations about future events or future financial performance. Forward- looking statements by their nature address matters that are, to different degrees, uncertain, and often contain words such as “may,” “could,” “expect,” “intend,” “plan,” “seek,” “anticipate,” “believe,” “estimate,” “predict,” “potential,” or “continue.” These statements involve known and unknown risks and uncertainties that may cause the events we discuss not to occur or to differ significantly from what we expect. For us, these risks and uncertainties include, among others, failing to maintain and protect our brand, independence, and reputation; liability for any losses that result from an actual or claimed breach of our fiduciary duties or failure to comply with applicable securities laws; liability related to cybersecurity and the protection of confidential information, including personal information about individuals; compliance failures, regulatory action, or changes in laws applicable to our credit ratings operations, investment advisory, ESG, and index businesses; prolonged volatility or downturns affecting the financial sector, global financial markets, and global economy and its effect on our revenue from asset- based fees and credit ratings business; the impact of the current COVID-19 pandemic on our business, financial condition, and results of operations; inadequacy of our operational risk management and business continuity programs in the event of a material disruptive event; failing to respond to technological change, keep pace with new technology developments, or adopt a successful technology strategy; failing to differentiate our products and services and continuously create innovative, proprietary and insightful financial technology solutions; liability relating to the information and data we collect, store, use, create, and distribute or the reports that we publish or are produced by our software products; trends in the financial services industry, including fee compression within the asset and wealth management sectors and increased industry consolidation; an outage of our database, technology-based products and services, or network facilities or the movement of parts of our technology and data infrastructure to the public cloud and other outsourced providers; the failure of acquisitions and other investments to be efficiently integrated and produce the results we anticipate; the failure to recruit, develop, and retain qualified employees; challenges faced by our non-U.S. operations, including the concentration of data and development work at our offshore facilities in China and India; our indebtedness could adversely affect our cash flows and financial flexibility; and the failure to protect our intellectual property rights or claims of intellectual property infringement against us. A more complete description of these risks and uncertainties can be found in our filings with the Securities and Exchange Commission, including our most recent Annual Report on Form 10-K. If any of these risks and uncertainties materialize, our actual future results and other future events may vary significantly from what we expected. We do not undertake to update our forward-looking statements as a result of new information or future events.
# # #
Investor Relations Contact:
Barbara Noverini, CFA +1 312-696-6164, [email protected]
Media Relations Contact:
Stephanie Lerdall, +1 312-244-7805, [email protected]
©2021 Morningstar, Inc. All Rights Reserved.
MORN-E
Page 5 of 12
Morningstar, Inc. and Subsidiaries
Unaudited Condensed Consolidated Statements of Income
| Three months ended March 31 | ||||||||||||
| (in millions, except per share amounts) | 2021 | 2020 | change | |||||||||
| Revenue | $ | 392.8 | $ | 324.0 | 21.2 | % | ||||||
| Operating expense: | ||||||||||||
| Cost of revenue | 157.3 | 137.0 | 14.8 | % | ||||||||
| Sales and marketing | 61.9 | 50.9 | 21.6 | % | ||||||||
| General and administrative | 69.8 | 57.4 | 21.6 | % | ||||||||
| Depreciation and amortization | 36.6 | 34.2 | 7.0 | % | ||||||||
| Total operating expense | 325.6 | 279.5 | 16.5 | % | ||||||||
| Operating income | 67.2 | 44.5 | 51.0 | % | ||||||||
| Operating margin | 17.1 | % | 13.7 | % | 3.4 pp | |||||||
| Non-operating income (loss), net: | ||||||||||||
| Interest expense, net | (2.8 | ) | (3.2 | ) | (12.5 | )% | ||||||
| Other income (expense), net | 2.9 | (8.1 | ) | NMF | ||||||||
| Non-operating income (loss), net | 0.1 | (11.3 | ) | NMF | ||||||||
| Income before income taxes and equity in net income (loss) of unconsolidated entities | 67.3 | 33.2 | 102.7 | % | ||||||||
| Equity in net income (loss) of unconsolidated entities | 1.7 | (0.8 | ) | NMF | ||||||||
| Income tax expense | 14.1 | 8.5 | 65.9 | % | ||||||||
| Consolidated net income | $ | 54.9 | $ | 23.9 | 129.7 | % | ||||||
| Net income per share: | ||||||||||||
| Basic | $ | 1.28 | $ | 0.56 | 128.6 | % | ||||||
| Diluted | $ | 1.27 | $ | 0.55 | 130.9 | % | ||||||
| Weighted average shares outstanding: | ||||||||||||
| Basic | 42.9 | 42.9 | — | % | ||||||||
| Diluted | 43.3 | 43.3 | — | % | ||||||||
NMF - Not meaningful, pp - percentage points
Page 6 of 12
Morningstar, Inc. and Subsidiaries
Unaudited Condensed Consolidated Statements of Cash Flows
| Three months ended March 31 | ||||||||
| (in millions) | 2021 | 2020 | ||||||
| Operating activities | ||||||||
| Consolidated net income | $ | 54.9 | $ | 23.9 | ||||
| Adjustments to reconcile consolidated net income to net cash flows from operating activities | 44.6 | 53.7 | ||||||
| Changes in operating assets and liabilities, net | (35.3 | ) | (28.9 | ) | ||||
| Cash provided by operating activities | 64.2 | 48.7 | ||||||
| Investing activities | ||||||||
| Capital expenditures | (22.7 | ) | (15.1 | ) | ||||
| Acquisitions, net of cash acquired | — | (4.5 | ) | |||||
| Purchases of equity method investments | (5.2 | ) | (0.5 | ) | ||||
| Other, net | (5.5 | ) | 0.6 | |||||
| Cash used for investing activities | (33.4 | ) | (19.5 | ) | ||||
| Financing activities | ||||||||
| Common shares repurchased | — | (20.0 | ) | |||||
| Dividends paid | (13.5 | ) | (12.9 | ) | ||||
| Repayments of long-term debt | (45.0 | ) | (37.8 | ) | ||||
| Proceeds from long-term debt | — | 55.0 | ||||||
| Other, net | (7.5 | ) | (11.2 | ) | ||||
| Cash used for financing activities | (66.0 | ) | (26.9 | ) | ||||
| Effect of exchange rate changes on cash and cash equivalents | (3.7 | ) | (13.9 | ) | ||||
| Net decrease in cash and cash equivalents | (38.9 | ) | (11.6 | ) | ||||
| Cash and cash equivalents-beginning of period | 422.5 | 334.1 | ||||||
| Cash and cash equivalents-end of period | $ | 383.6 | $ | 322.5 | ||||
Page 7 of 12
Morningstar, Inc. and Subsidiaries
Unaudited Condensed Consolidated Balance Sheets
| As of March 31 | As of December 31 | |||||||
| (in millions) | 2021 | 2020 | ||||||
| Assets | ||||||||
| Current assets: | ||||||||
| Cash and cash equivalents | $ | 383.6 | $ | 422.5 | ||||
| Investments | 50.1 | 41.7 | ||||||
| Accounts receivable, net | 229.1 | 205.1 | ||||||
| Income tax receivable, net | — | 2.2 | ||||||
| Other current assets | 68.0 | 58.5 | ||||||
| Total current assets | 730.8 | 730.0 | ||||||
| Property, equipment, and capitalized software, net | 156.7 | 155.1 | ||||||
| Operating lease assets | 138.9 | 147.7 | ||||||
| Investments in unconsolidated entities | 38.5 | 32.6 | ||||||
| Goodwill | 1,201.9 | 1,205.0 | ||||||
| Intangible assets, net | 364.8 | 380.1 | ||||||
| Deferred tax asset, net | 12.4 | 12.6 | ||||||
| Other assets | 31.3 | 32.9 | ||||||
| Total assets | $ | 2,675.3 | $ | 2,696.0 | ||||
Liabilities and equity | ||||||||
| Current liabilities: | ||||||||
| Accounts payable and accrued liabilities | $ | 57.6 | $ | 64.5 | ||||
| Accrued compensation | 105.9 | 169.2 | ||||||
| Deferred revenue | 363.1 | 306.8 | ||||||
| Operating lease liabilities | 37.7 | 39.9 | ||||||
| Contingent consideration liability | 33.5 | 35.0 | ||||||
| Other current liabilities | 12.8 | 11.1 | ||||||
| Total current liabilities | 610.6 | 626.5 | ||||||
| Operating lease liabilities | 128.5 | 137.7 | ||||||
| Accrued compensation | 34.4 | 35.1 | ||||||
| Deferred tax liability, net | 106.9 | 108.9 | ||||||
| Long-term debt | 404.2 | 449.1 | ||||||
| Other long-term liabilities | 69.3 | 67.3 | ||||||
| Total liabilities | 1,353.9 | 1,424.6 | ||||||
| Total equity | 1,321.4 | 1,271.4 | ||||||
| Total liabilities and equity | $ | 2,675.3 | $ | 2,696.0 | ||||
Page 8 of 12
Morningstar,
Inc. and Subsidiaries
Supplemental Data (Unaudited)
| Three months ended March 31 | ||||||||||||||||
| (in millions) | 2021 | 2020 | Change | Organic (1) | ||||||||||||
| Revenue by type | ||||||||||||||||
| License-based (2) | $ | 266.1 | $ | 216.0 | 23.2 | % | 12.1 | % | ||||||||
| Asset-based (3) | 61.4 | 57.2 | 7.3 | % | 5.8 | % | ||||||||||
| Transaction-based (4) | 65.3 | 50.8 | 28.5 | % | 24.8 | % | ||||||||||
| Key product area revenue | ||||||||||||||||
| PitchBook | $ | 61.6 | $ | 45.3 | 36.0 | % | 36.0 | % | ||||||||
| DBRS Morningstar (5) | 59.3 | 46.7 | 27.0 | % | 23.5 | % | ||||||||||
| Morningstar Data | 58.8 | 51.4 | 14.4 | % | 10.2 | % | ||||||||||
| Morningstar Direct | 42.1 | 38.3 | 9.9 | % | 6.9 | % | ||||||||||
| Investment Management (6) | 29.4 | 30.5 | (3.6 | )% | (6.1 | )% | ||||||||||
| Workplace Solutions | 25.2 | 21.2 | 18.9 | % | 18.9 | % | ||||||||||
| Morningstar Advisor Workstation | 22.8 | 21.8 | 4.6 | % | 3.9 | % | ||||||||||
| As of March 31 | ||||||||||||||||
| 2021 | 2020 | Change | ||||||||||||||
| Select business metrics | ||||||||||||||||
| Morningstar Direct licenses | 16,651 | 15,998 | 4.1 | % | ||||||||||||
| PitchBook Platform licenses | 57,196 | 41,308 | 38.5 | % | ||||||||||||
| Advisor Workstation clients (U.S. and Canada) | 236 | 249 | (7) | (5.2 | )% | |||||||||||
| Morningstar.com Premium Membership subscriptions (U.S.) | 116,593 | 111,354 | 4.7 | % | ||||||||||||
| As of March 31 | ||||||||||||||||
| Assets under management and advisement (approximate) ($bil) | 2021 | 2020 | Change | |||||||||||||
| Workplace Solutions | ||||||||||||||||
| Managed Accounts | $ | 100.7 | $ | 65.3 | 54.2 | % | ||||||||||
| Fiduciary Services | 55.9 | 41.5 | 34.7 | % | ||||||||||||
| Custom Models/CIT | 39.2 | 28.5 | (8) | 37.5 | % | |||||||||||
| Workplace Solutions (total) | $ | 195.8 | $ | 135.3 | 44.7 | % | ||||||||||
| Investment Management | ||||||||||||||||
| Morningstar Managed Portfolios | $ | 29.0 | $ | 23.1 | 25.5 | % | ||||||||||
| Institutional Asset Management | 12.1 | 14.0 | (13.6 | )%(9) | ||||||||||||
| Asset Allocation Services | 6.7 | 6.4 | 4.7 | % | ||||||||||||
| Investment Management (total) | $ | 47.8 | $ | 43.5 | 9.9 | % | ||||||||||
| Asset value linked to Morningstar Indexes ($bil) | $ | 97.1 | $ | 47.2 | 105.7 | % | ||||||||||
| Three months ended March 31 | ||||||||||||||||
| 2021 | 2020 | Change | ||||||||||||||
| Average assets under management and advisement ($bil) | $ | 235.2 | $ | 205.5 | (8) | 14.5 | % | |||||||||
| (1) | Organic revenue excludes acquisitions, divestitures, the adoption of new accounting standards, and the effect of foreign currency translations. | |
| (2) | License-based revenue includes PitchBook, Morningstar Data, Morningstar Direct, Morningstar Advisor Workstation, Sustainalytics, and other similar products. | |
| (3) | Asset-based revenue includes Investment Management, Workplace Solutions, and Morningstar Indexes. | |
| (4) | Transaction-based revenue includes DBRS Morningstar, Internet advertising, and Morningstar-sponsored conferences. | |
| (5) | For the three months ended March 31, 2021, DBRS Morningstar recurring revenue derived primarily from surveillance, research, and other transaction-related services was 36.9%. For the three months ended March 31, 2020, recurring revenue was 41.9%. |
Page 9 of 12
| (6) | Investment Management revenue includes the contribution of the Morningstar Funds Trust, which records revenue as well as sub-advisory fees on a gross basis. This contribution represented $5.5 million of revenue in the quarter ended March 31, 2021 versus $4.0 million in the prior-year period. | |
| (7) | Revised to reflect updated enterprise client reporting for Advisor Workstation to include clients in Canada. | |
| (8) | Revised to include CIT assets in the reporting for this category. | |
| (9) | The decline in Institutional Asset Management assets is attributed to the non-renewal of a client contract in the third quarter of 2020. |
Page 10 of 12
Morningstar, Inc. and Subsidiaries
Reconciliations of Non-GAAP Measures with the Nearest Comparable GAAP Measures (Unaudited)
To supplement Morningstar’s condensed consolidated financial statements presented in accordance with U.S. Generally Accepted Accounting Principles (GAAP), Morningstar uses the following measures considered as non-GAAP by the Securities and Exchange Commission, including:
| • | consolidated revenue, excluding acquisitions, divestitures, adoption of new accounting standards, and the effect of foreign currency translations (organic revenue), | |
| • | consolidated operating income, excluding intangible amortization expense and all mergers and acquisitions (M&A)-related expenses (including M&A-related earn- outs) (adjusted operating income), | |
| • | consolidated operating margin, excluding intangible amortization expense and all M&A-related expenses (including M&A-related earn-outs) (adjusted operating margin), | |
| • | consolidated diluted net income per share, excluding intangible amortization expense, all M&A-related expenses (including M&A-related earn-outs), and non- operating gains/losses (adjusted diluted net income per share), and | |
| • | cash provided by or used for operating activities less capital expenditures (free cash flow). |
These non-GAAP measures may not be comparable to similarly titled measures reported by other companies.
Morningstar presents organic revenue because the Company believes this non-GAAP measure helps investors better compare period-over-period results. We exclude revenue from acquired businesses from our organic revenue growth calculation for a period of 12 months after we complete the acquisition. For divestitures, we exclude revenue in the prior period for which there is no comparable revenue in the current period. In the third quarter of 2020, Morningstar completed its acquisition of Sustainalytics. The total revenue contribution is excluded from organic revenue growth for Sustainalytics for the first three months of 2021.
In addition, Morningstar presents free cash flow solely as supplemental disclosure to help investors better understand how much cash is available after making capital expenditures. Morningstar's management team uses free cash flow to evaluate its business. Free cash flow should not be considered an alternative to any measure required to be reported under GAAP (such as cash provided by (used for) operating, investing, and financing activities).
| Three months ended March 31 | ||||||||||||
| (in millions) | 2021 | 2020 | change | |||||||||
| Reconciliation from consolidated revenue to organic revenue: | ||||||||||||
| Consolidated revenue | $ | 392.8 | $ | 324.0 | 21.2 | % | ||||||
| Less: acquisitions | (18.3 | ) | — | NMF | ||||||||
| Effect of foreign currency translations | (8.3 | ) | — | NMF | ||||||||
| Organic revenue | $ | 366.2 | $ | 324.0 | 13.0 | %(1) | ||||||
| Reconciliation from consolidated operating income to adjusted operating income: | ||||||||||||
| Consolidated operating income | $ | 67.2 | $ | 44.5 | 51.0 | % | ||||||
| Add: intangible amortization expense | 15.6 | 14.0 | 11.4 | % | ||||||||
| Add: M&A-related expenses | 3.8 | 2.9 | 31.0 | % | ||||||||
| Add: M&A-related earn-outs (2) | 5.7 | — | NMF | |||||||||
| Adjusted operating income | $ | 92.3 | $ | 61.4 | 50.3 | % | ||||||
| Reconciliation from consolidated operating margin to adjusted operating margin: | ||||||||||||
| Consolidated operating margin | 17.1 | % | 13.7 | % | 3.4 pp | |||||||
| Add: intangible amortization expense | 4.0 | % | 4.3 | % | (0.3) pp | |||||||
| Add: M&A-related expenses | 1.0 | % | 0.9 | % | 0.1 pp | |||||||
| Add: M&A-related earn-out (2) | 1.5 | % | — | % | 1.5 pp | |||||||
| Adjusted operating margin | 23.6 | % | 18.9 | % | 4.7 pp | |||||||
| Reconciliation from consolidated diluted net income per share to adjusted diluted net income per share: | ||||||||||||
| Consolidated diluted net income per share | $ | 1.27 | $ | 0.55 | 130.9 | % | ||||||
| Add: intangible amortization expense | 0.27 | 0.24 | 12.5 | % | ||||||||
| Add: M&A-related expenses | 0.06 | 0.05 | 20.0 | % | ||||||||
| Add: M&A-related earn-outs (2) | 0.13 | — | NMF | |||||||||
| Adjusted diluted net income per share | $ | 1.73 | $ | 0.84 | 106.0 | % | ||||||
Page 11 of 12
| Three months ended March 31 | ||||||||||||
| (in millions) | 2021 | 2020 | change | |||||||||
| Reconciliation from cash provided by operating activities to free cash flow: | ||||||||||||
| Cash provided by operating activities | $ | 64.2 | $ | 48.7 | 31.8 | % | ||||||
| Capital expenditures | (22.7 | ) | (15.1 | ) | 50.3 | % | ||||||
| Free cash flow | $ | 41.5 | $ | 33.6 | 23.5 | % | ||||||
NMF - Not meaningful, pp - percentage points
| (1) | Organic revenue for the three months ended March 31, 2021 excludes Sustainalytics and other M&A. | |
| (2) | M&A-related earn-outs included in current period operating expense. |
Page 12 of 12
Exhibit 99.2
| First Quarter 2021 Supplemental Presentation April 28, 2021 |

| This presentation contains forward-looking statements within the meaning of the Private Securities Litigation Reform Act of 1995. These statements are based on our current expectations about future events or future financial performance. Forward-looking statements by their nature address matters that are, to different degrees, uncertain, and often contain words such as “may,” “could,” “expect,” “intend,” “plan,” “seek,” “anticipate,” “believe,” “estimate,” “predict,” “potential,” or “continue.” These statements involve known and unknown risks and uncertainties that may cause the events we discuss not to occur or to differ significantly from what we expect. More information about factors that could affect Morningstar’s business and financial results are in our filings with the SEC, including our most recent 8-K, 10-K and 10-Q. Morningstar undertakes no obligation to publicly update any forward-looking statements as a result of new information, future events, or otherwise, except as required by law. In addition, this presentation references non-GAAP financial measures including, but not limited to, organic revenue, adjusted operating income and free cash flow. These non-GAAP measures may not be comparable to similarly titled measures reported by other companies. A reconciliation of non-GAAP financial measures to the most directly comparable GAAP financial measures is provided in the appendix to this presentation and in our filings with the SEC, including our most recent 8-K, 10-K and 10-Q. |
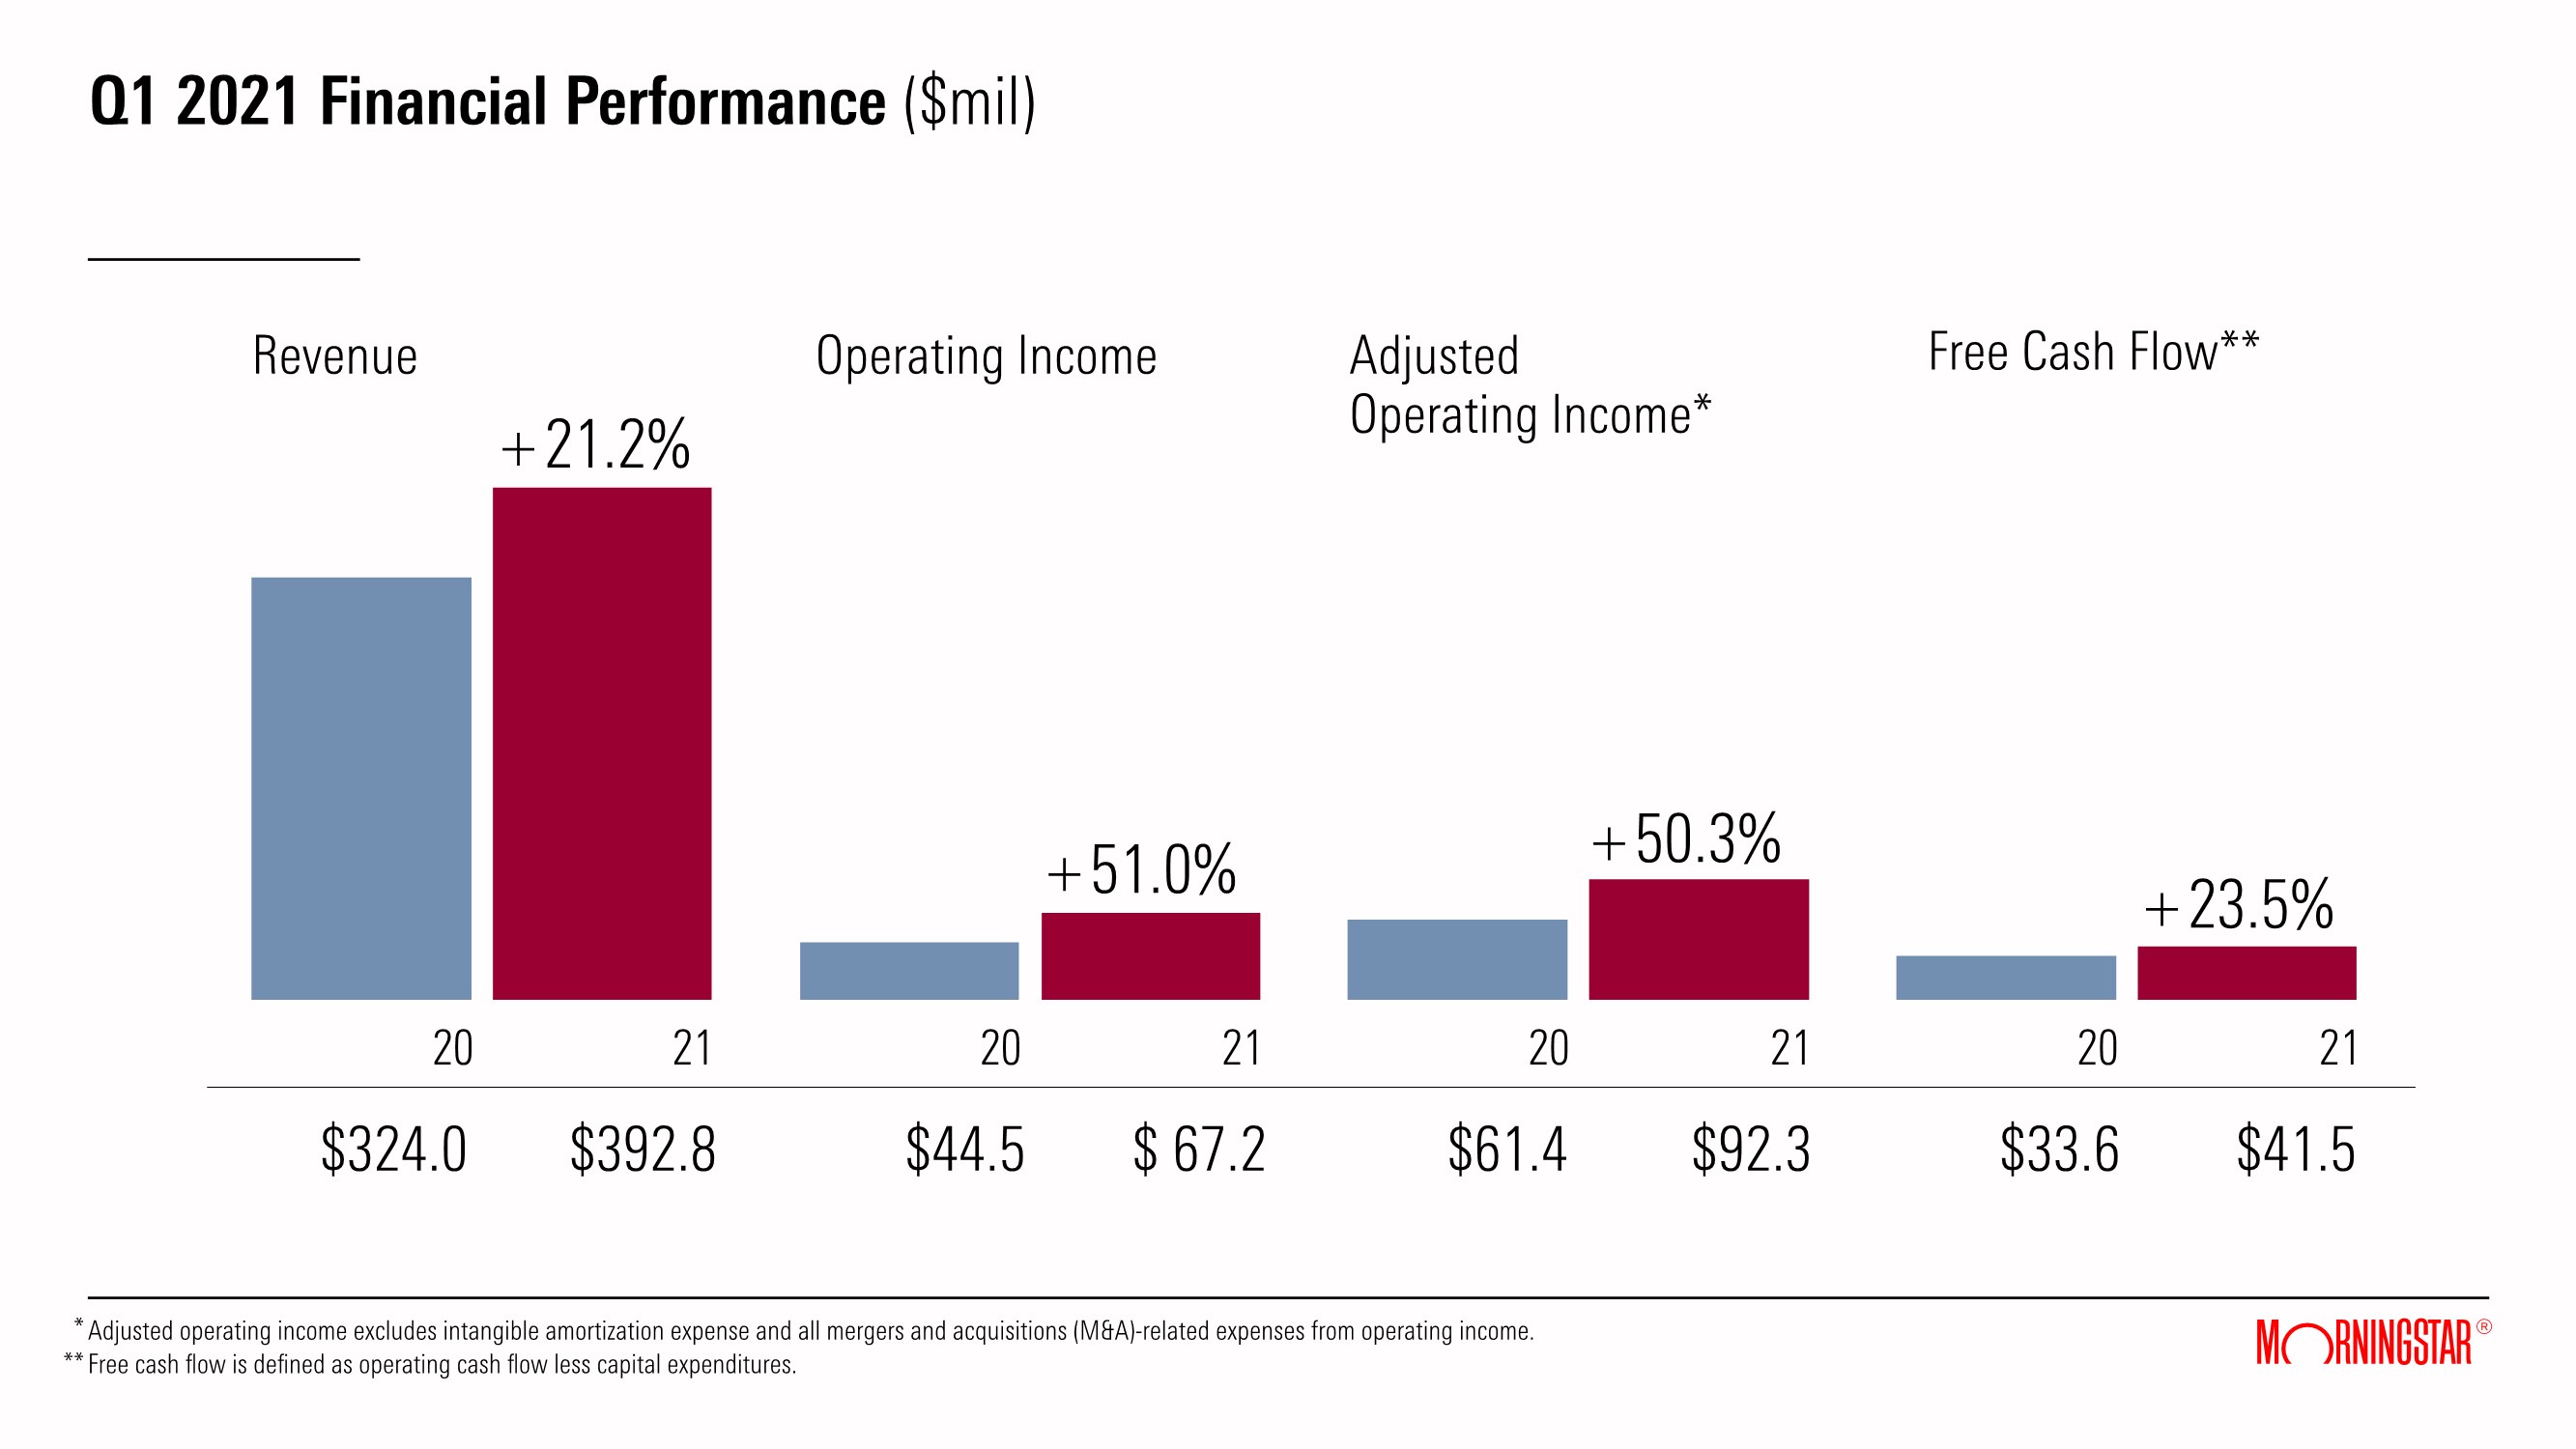
| Q1 2021 Financial Performance ($mil) $ 67.2 $44.5 21 20 $92.3 +21.2% +51.0% +50.3% 21 20 $392.8 $324.0 21 20 $61.4 $41.5 +23.5% 21 20 $33.6 Adjusted operating income excludes intangible amortization expense and all mergers and acquisitions (M&A)-related expenses from operating income. Free cash flow is defined as operating cash flow less capital expenditures. Operating Income Free Cash Flow** Revenue Adjusted Operating Income* * ** |
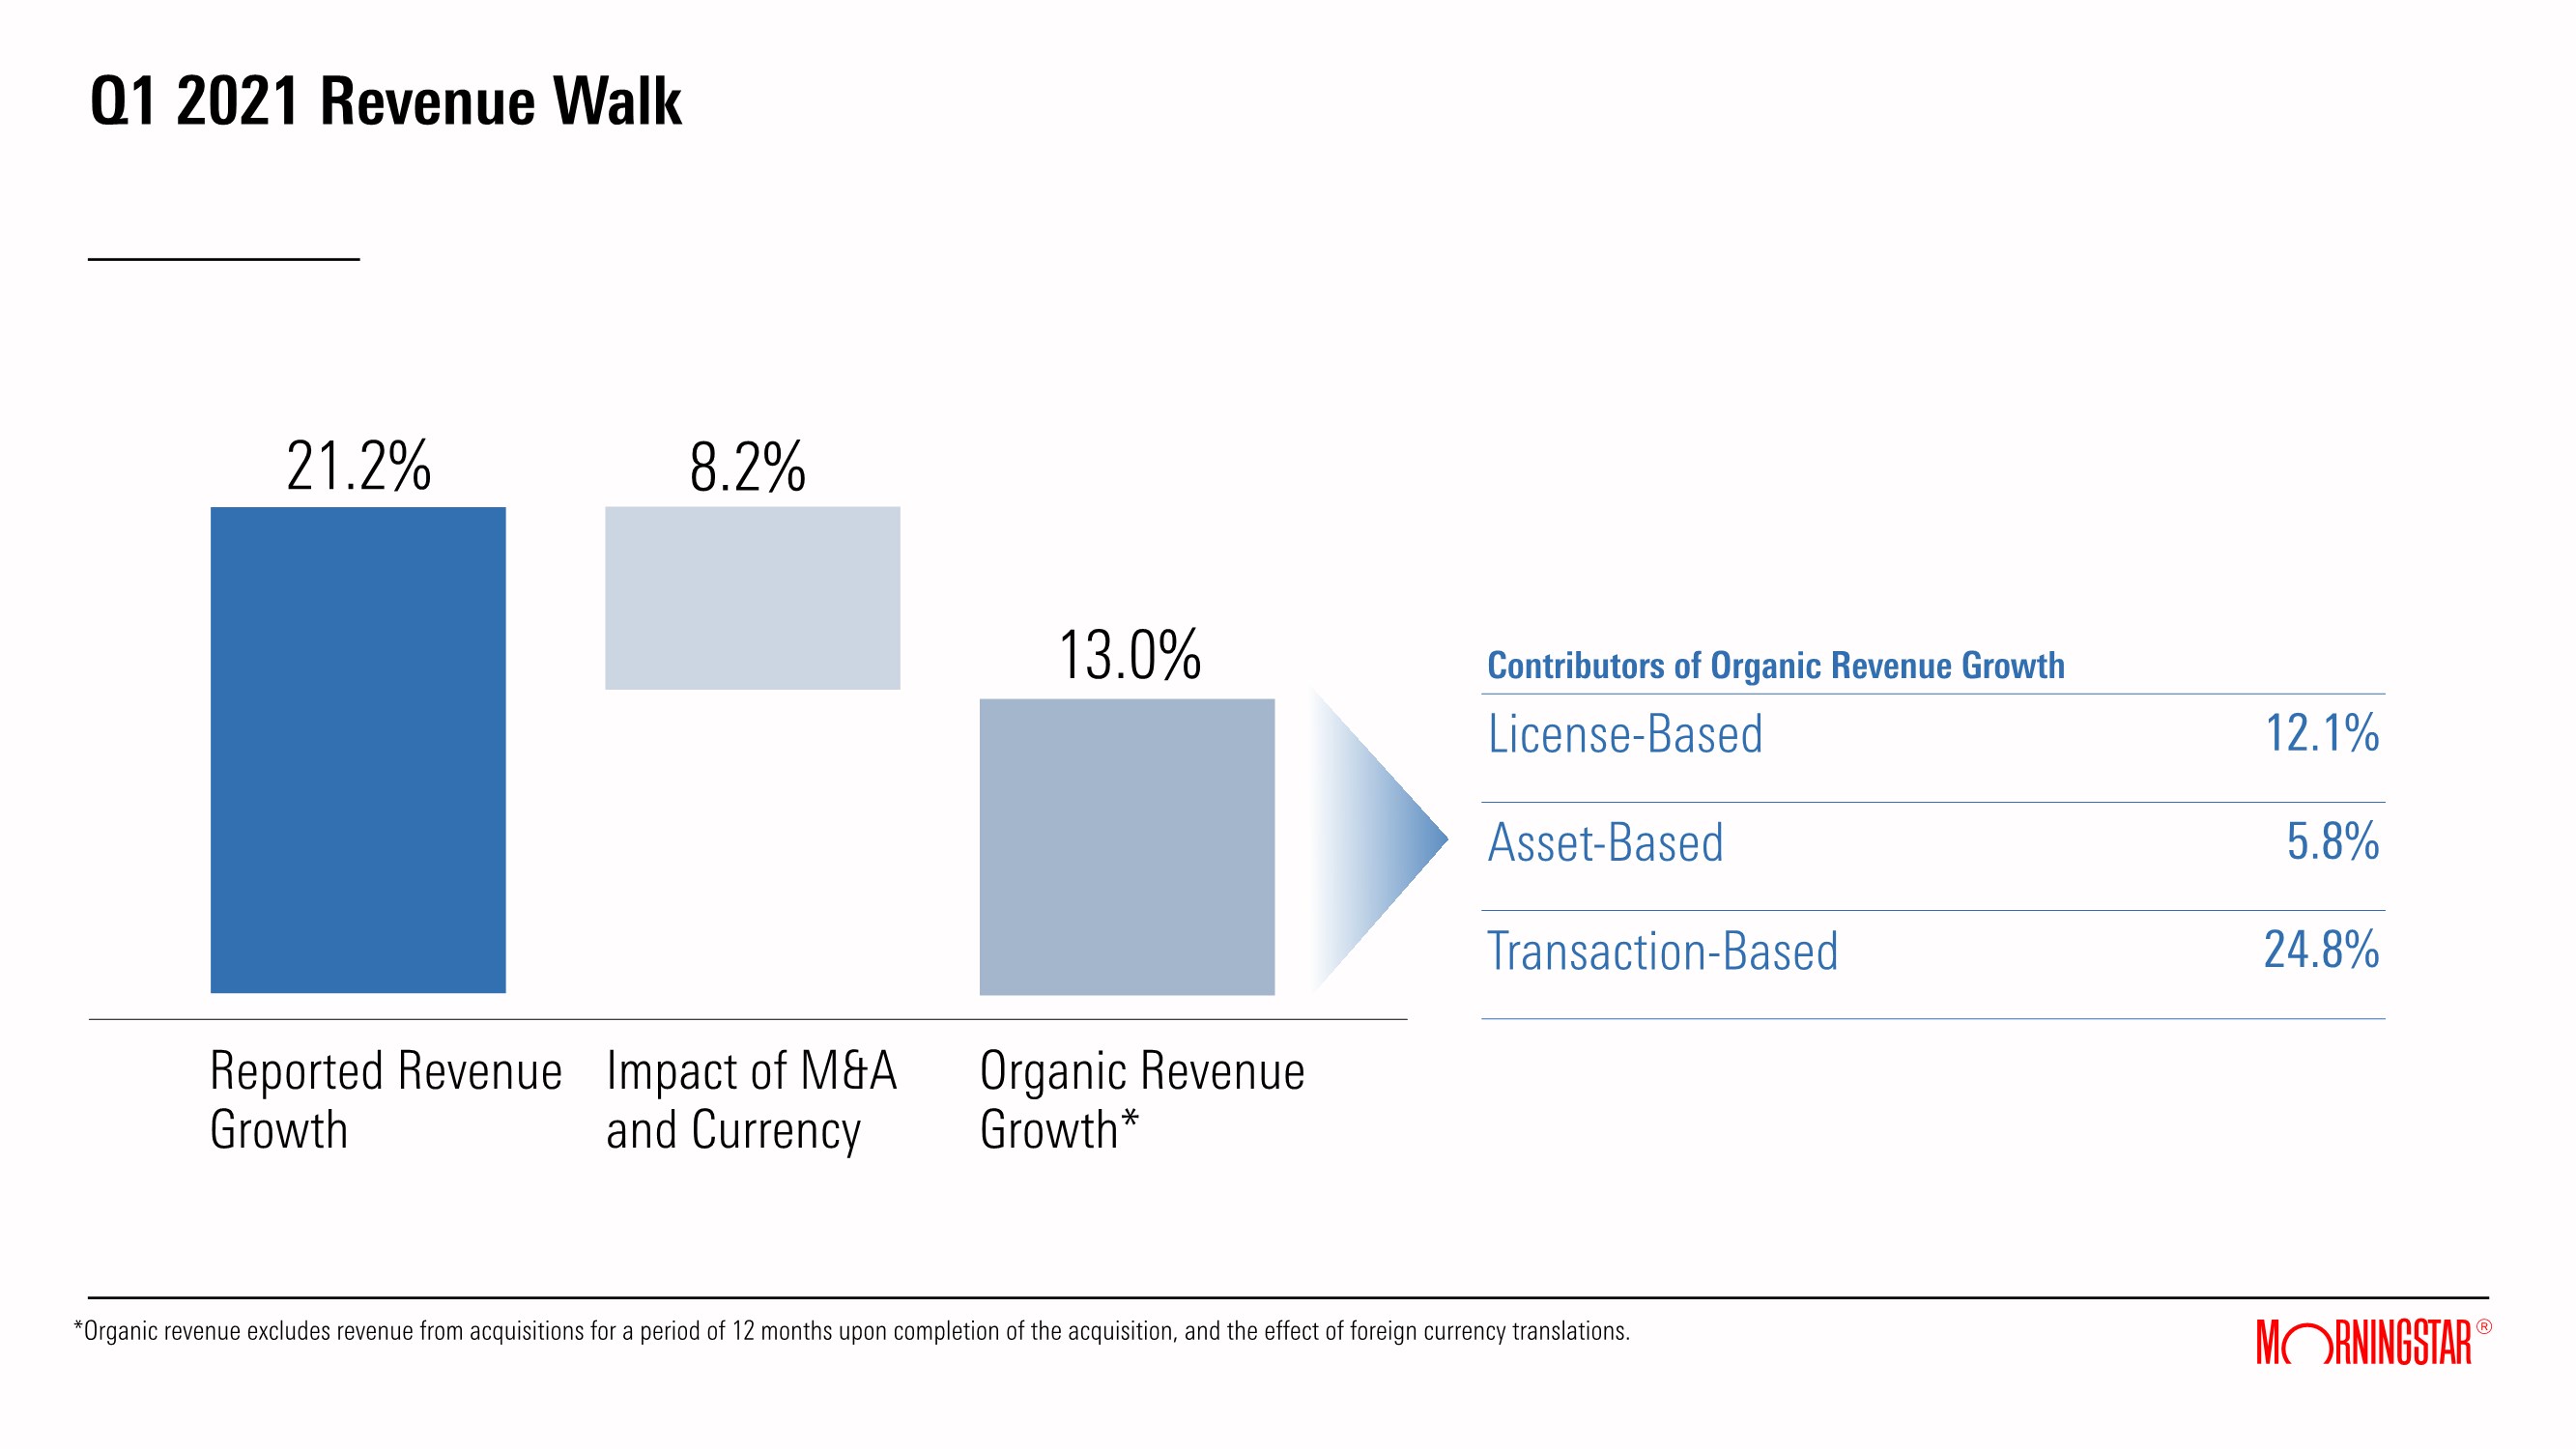
| Q1 2021 Revenue Walk *Organic revenue excludes revenue from acquisitions for a period of 12 months upon completion of the acquisition, and the effect of foreign currency translations. 21.2% Reported Revenue Growth Impact of M&A and Currency 13.0% 8.2% Contributors of Organic Revenue Growth License-Based 12.1% Asset-Based 5.8% Transaction-Based 24.8% Organic Revenue Growth* |
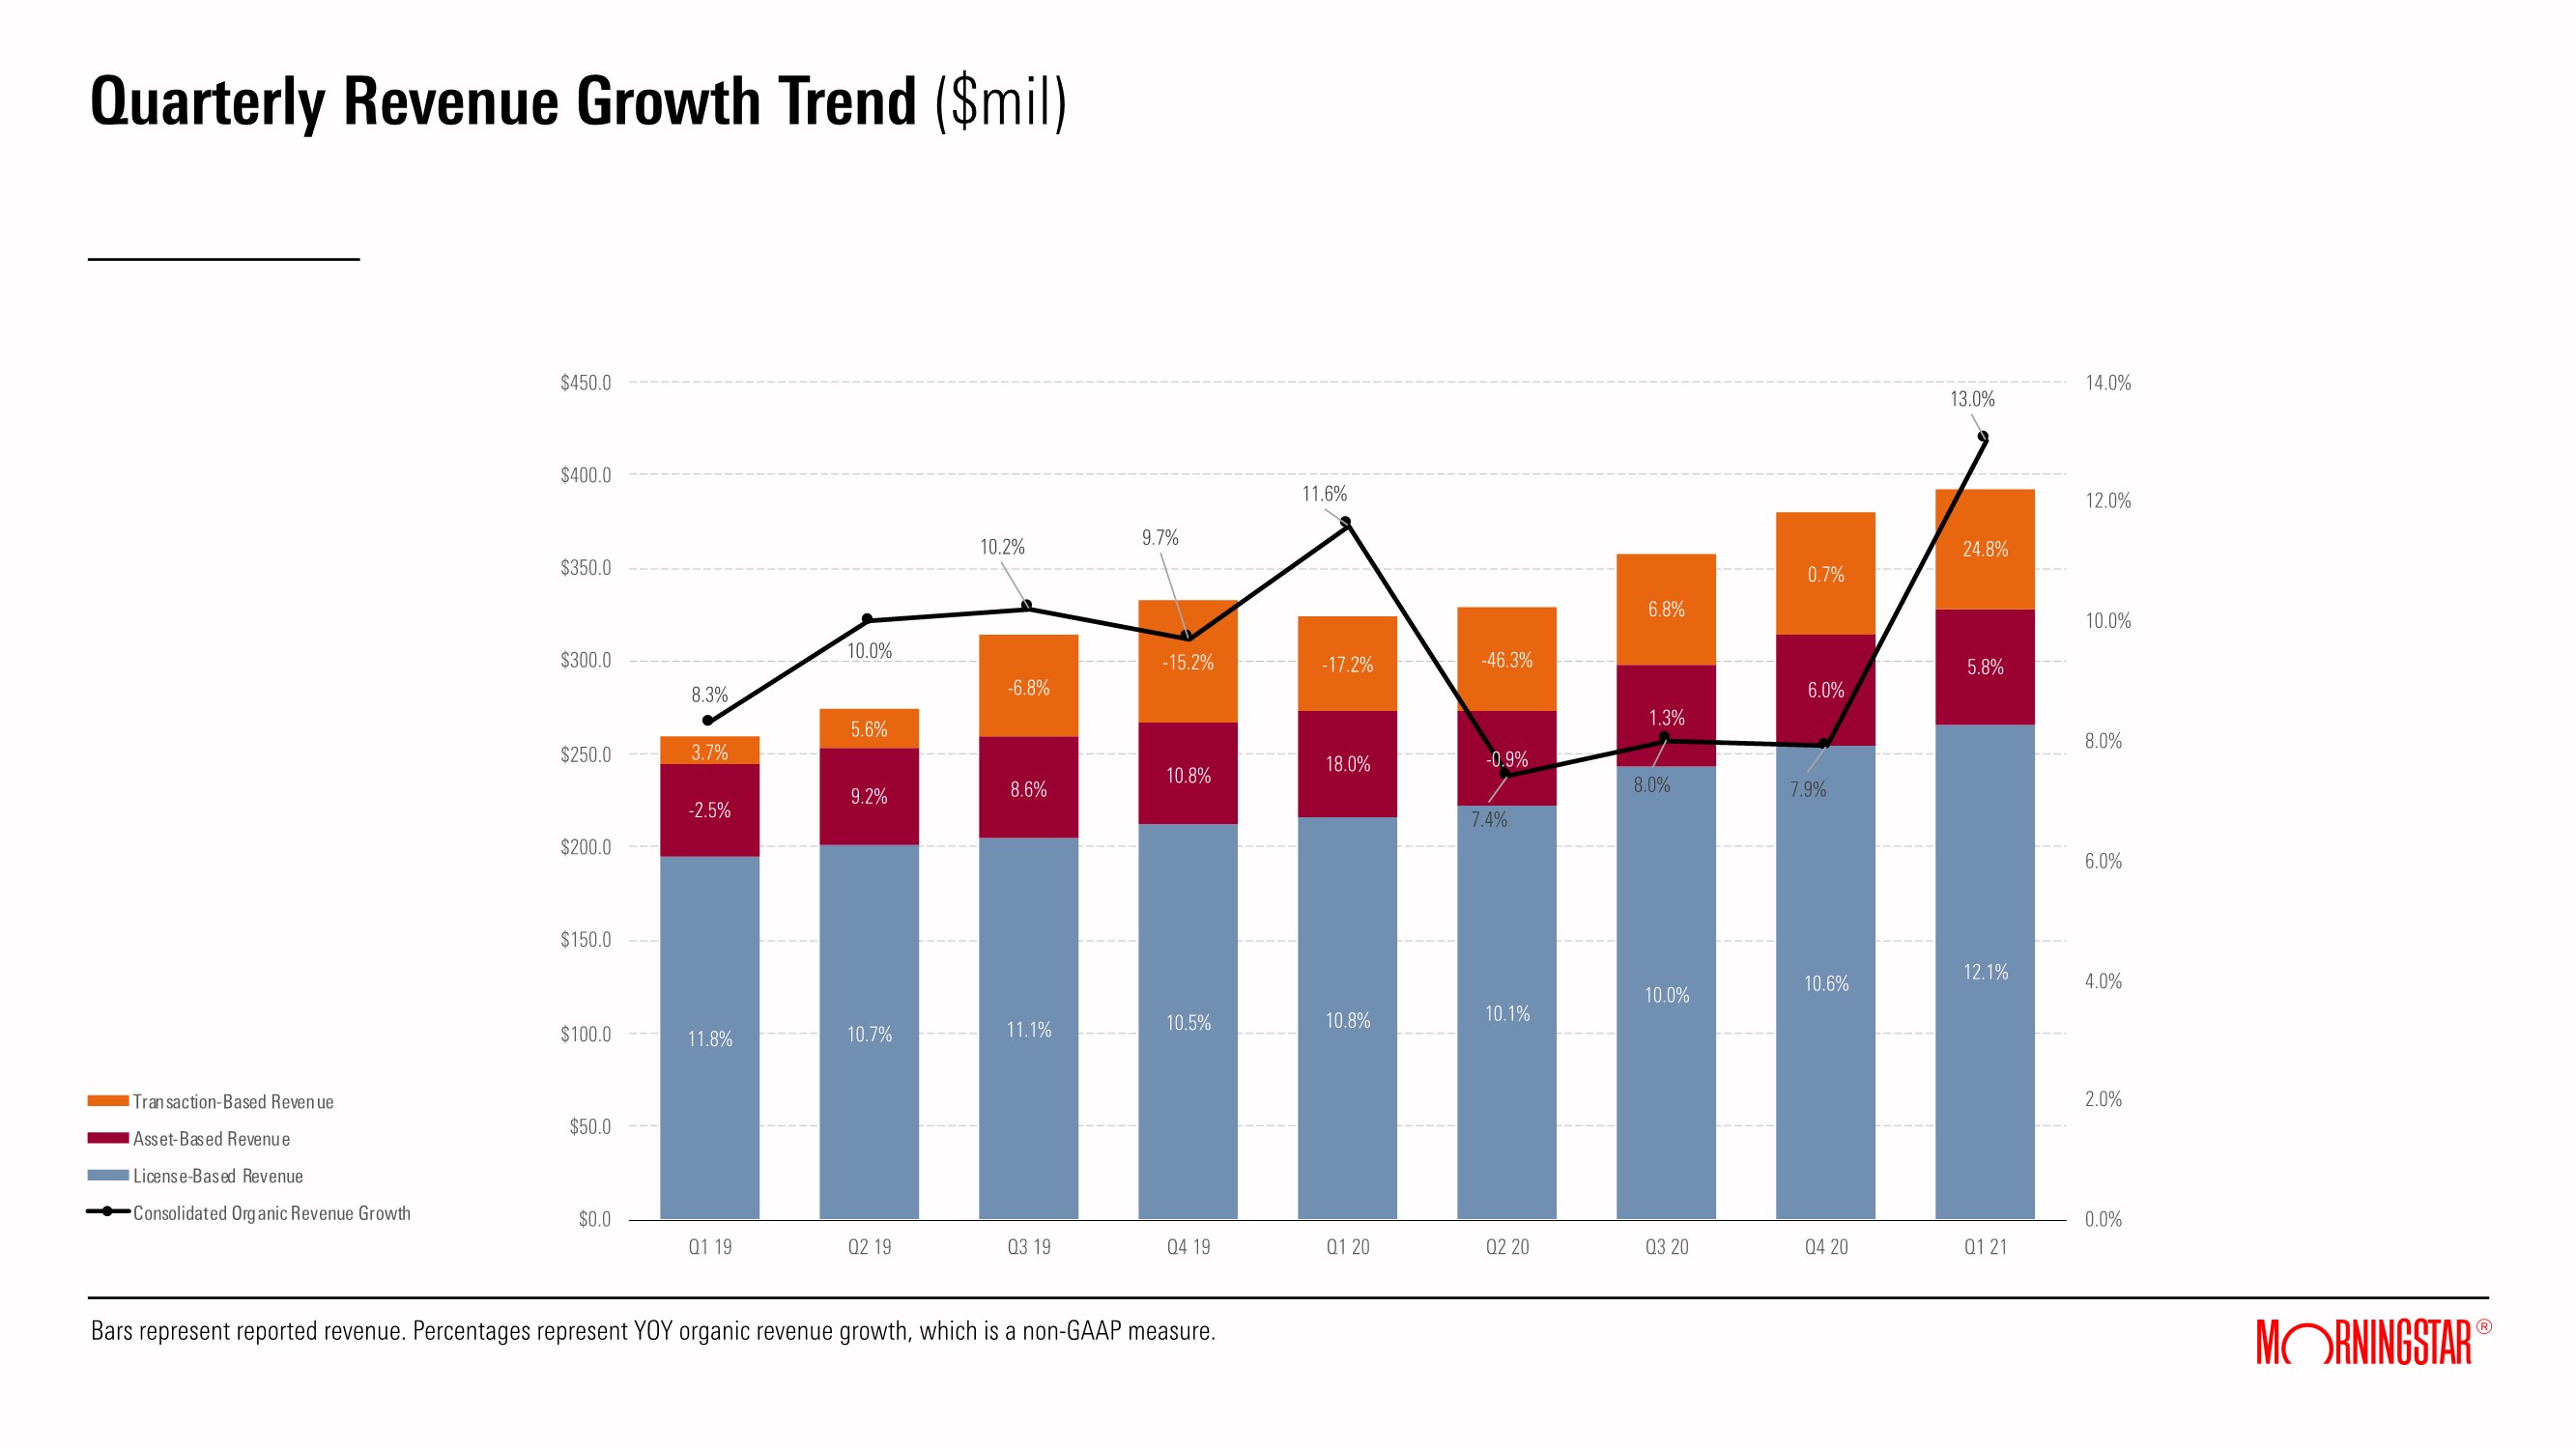
| Quarterly Revenue Growth Trend ($mil) Bars represent reported revenue. Percentages represent YOY organic revenue growth, which is a non-GAAP measure. 11.8% 10.7% 11.1% 10.5% 10.8% 10.1% 10.0% 10.6% 12.1% -2.5% 9.2% 8.6% 10.8% 18.0% -0.9% 1.3% 6.0% 5.8% 3.7% 5.6% -6.8% -15.2% -17.2% -46.3% 6.8% 0.7% 24.8% 8.3% 10.0% 10.2% 9.7% 11.6% 7.4% 8.0% 7.9% 13.0% 0.0% 2.0% 4.0% 6.0% 8.0% 10.0% 12.0% 14.0% $0.0 $50.0 $100.0 $150.0 $200.0 $250.0 $300.0 $350.0 $400.0 $450.0 Q1 19 Q2 19 Q3 19 Q4 19 Q1 20 Q2 20 Q3 20 Q4 20 Q1 21 Transaction-Based Revenue Asset-Based Revenue License Based Revenue Consolidated Organic Revenue Growth 11.8% 10.7% 11.1% 10.5% 10.8% 10.1% 10.0% 10.6% 12.1% -2.5% 9.2% 8.6% 10.8% 18.0% -0.9% 1.3% 6.0% 5.8% 3.7% 5.6% -6.8% -15.2% -17.2% -46.3% 6.8% 0.7% 24.8% 8.3% 10.0% 10.2% 9.7% 11.6% 7.4% 8.0% 7.9% 13.0% 0.0% 2.0% 4.0% 6.0% 8.0% 10.0% 12.0% 14.0% $0.0 $50.0 $100.0 $150.0 $200.0 $250.0 $300.0 $350.0 $400.0 $450.0 Q1 19 Q2 19 Q3 19 Q4 19 Q1 20 Q2 20 Q3 20 Q4 20 Q1 21 Transaction-Based Revenue Asset-Based Revenue License-Based Revenue Consolidated Organic Revenue Growth |
| Q1 2021 Revenue Drivers: License-Based Revenue Growth ($mil) +23.2% Reported +12.1% Organic 21 20 License-Based Revenue Drivers: PitchBook (+36.0%), Morningstar Data (+10.2%), and Morningstar Direct (+6.9%) were the primary contributors to license-based organic revenue growth in Q1 2021. Sustainalytics capitalized on robust demand for ESG data, research, and analytics, and green bond validations. Bars represent reported revenue. Organic revenue growth is a non-GAAP measure and excludes the contribution of Sustainalytics and other M&A. $216.0 $266.1 |
| License-Based Quarterly Trends PitchBook ($mil) 47.5% 53.0% 42.9% 40.2% 36.8% 32.6% 33.6% 36.0% 61.8% 61.4% 59.7% 67.5% 53.2% 48.3% 42.5% 38.5% 0.0% 10.0% 20.0% 30.0% 40.0% 50.0% 60.0% 70.0% 80.0% $0.0 $15.0 $30.0 $45.0 $60.0 $75.0 Q2 19 Q3 19 Q4 19 Q1 20 Q2 20 Q3 20 Q4 20 Q1 21 PitchBook Revenue YOY Organic Revenue Growth YOY License Growth 47.5% 53.0% 42.9% 40.2% 36.8% 32.6% 33.6% 36.0% 61.8% 61.4% 59.7% 67.5% 53.2% 48.3% 42.5% 38.5% 0.0% 10.0% 20.0% 30.0% 40.0% 50.0% 60.0% 70.0% 80.0% $0.0 $15.0 $30.0 $45.0 $60.0 $75.0 Q2 19 Q3 19 Q4 19 Q1 20 Q2 20 Q3 20 Q4 20 Q1 21 PitchBook Revenue YOY Organic Revenue Growth YOY License Growth 6.5% 5.5% 6.5% 6.5% 6.5% 5.5% 6.5% 6.9% 7.3% 6.2% 5.8% 3.9% 4.0% 4.0% 3.0% 3.1% 0.0% 1.0% 2.0% 3.0% 4.0% 5.0% 6.0% 7.0% 8.0% $0.0 $10.0 $20.0 $30.0 $40.0 $50.0 Q2 19 Q3 19 Q4 19 Q1 20 Q2 20 Q3 20 Q4 20 Q1 21 Morningstar Direct Revenue YOY Organic Revenue Growth YOY License Growth 6.5% 5.5% 6.5% 6.5% 6.5% 5.5% 6.5% 6.9% 7.3% 6.2% 5.8% 3.9% 4.0% 4.0% 3.0% 3.1% 0.0% 1.0% 2.0% 3.0% 4.0% 5.0% 6.0% 7.0% 8.0% $0.0 $10.0 $20.0 $30.0 $40.0 $50.0 Q2 19 Q3 19 Q4 19 Q1 20 Q2 20 Q3 20 Q4 20 Q1 21 Morningstar Direct Revenue YOY Organic Revenue Growth YOY License Growth Morningstar Direct ($mil) 54.3% 47.5% 53.2% 42.9% 40.2% 36.8% 32.6% 33.6% 36.0% 59.2% 61.8% 61.4% 59.7% 67.5% 53.2% 48.3% 42.5% 38.5% 0.0% 10.0% 20.0% 30.0% 40.0% 50.0% 60.0% 70.0% 80.0% $0.0 $15.0 $30.0 $45.0 $60.0 $75.0 Q1 19 Q2 19 Q3 19 Q4 19 Q1 20 Q2 20 Q3 20 Q4 20 Q1 21 PitchBook Revenue YOY Organic Revenue Growth YOY License Growth 10.0% 10.0% 10.3% 7.9% 6.5% 6.5% 5.5% 6.5% 6.9% 9.1% 7.3% 6.2% 5.8% 3.9% 4.0% 4.0% 3.0% 4.1% 0.0% 2.0% 4.0% 6.0% 8.0% 10.0% 12.0% $0.0 $10.0 $20.0 $30.0 $40.0 $50.0 Q1 19 Q2 19 Q3 19 Q4 19 Q1 20 Q2 20 Q3 20 Q4 20 Q1 21 Morningstar Direct Revenue YOY Organic Revenue Growth YOY License Growth |
| License-Based Quarterly Trends Advisor Workstation ($mil) -4.3% -1.7% 3.2% -2.4% -1.3% -1.7% 3.2% 3.9% -5.0% -4.0% -3.0% -2.0% -1.0% 0.0% 1.0% 2.0% 3.0% 4.0% 5.0% $0.0 $5.0 $10.0 $15.0 $20.0 $25.0 Q2 19 Q3 19 Q4 19 Q1 20 Q2 20 Q3 20 Q4 20 Q1 21 Advisor Workstation Revenue YOY Organic Revenue Growth Morningstar Data ($mil) 8.7% 8.6% 9.5% 8.9% 8.7% 8.6% 9.5% 10.2% 0.0% 2.0% 4.0% 6.0% 8.0% 10.0% 12.0% $0.0 $10.0 $20.0 $30.0 $40.0 $50.0 $60.0 Q2 19 Q3 19 Q4 19 Q1 20 Q2 20 Q3 20 Q4 20 Q1 21 Morningstar Data Revenue YOY Organic Revenue Growth 9.2% 10.8% 7.2% 6.6% 8.9% 8.7% 8.6% 9.5% 10.2% 0.0% 2.0% 4.0% 6.0% 8.0% 10.0% 12.0% $0.0 $10.0 $20.0 $30.0 $40.0 $50.0 $60.0 Q1 19 Q2 19 Q3 19 Q4 19 Q1 20 Q2 20 Q3 20 Q4 20 Q1 21 Morningstar Data Revenue YOY Organic Revenue Growth 1.7% -1.0% -5.6% -0.6% -2.4% -4.3% -1.7% 3.2% 3.9% -10.0% -8.0% -6.0% -4.0% -2.0% 0.0% 2.0% 4.0% 6.0% 8.0% 10.0% $0.0 $5.0 $10.0 $15.0 $20.0 $25.0 Q1 19 Q2 19 Q3 19 Q4 19 Q1 20 Q2 20 Q3 20 Q4 20 Q1 21 Advisor Workstation Revenue YOY Organic Revenue Growth |
| Q1 2021 Revenue Drivers: Asset-Based Revenue Growth ($mil) Bars represent reported revenue. Organic revenue growth is a non-GAAP measure. Asset-Based Revenue Drivers: Workplace Solutions (+18.9%) and Morningstar Indexes (+20.0%) were the primary contributors to asset-based organic revenue growth in Q1 2021. Investment Management (-6.1%) organic revenue decline resulted primarily from the impact of previously- disclosed client losses. + 7.3% Reported + 5.8% Organic 21 20 $57.2 $61.4 |
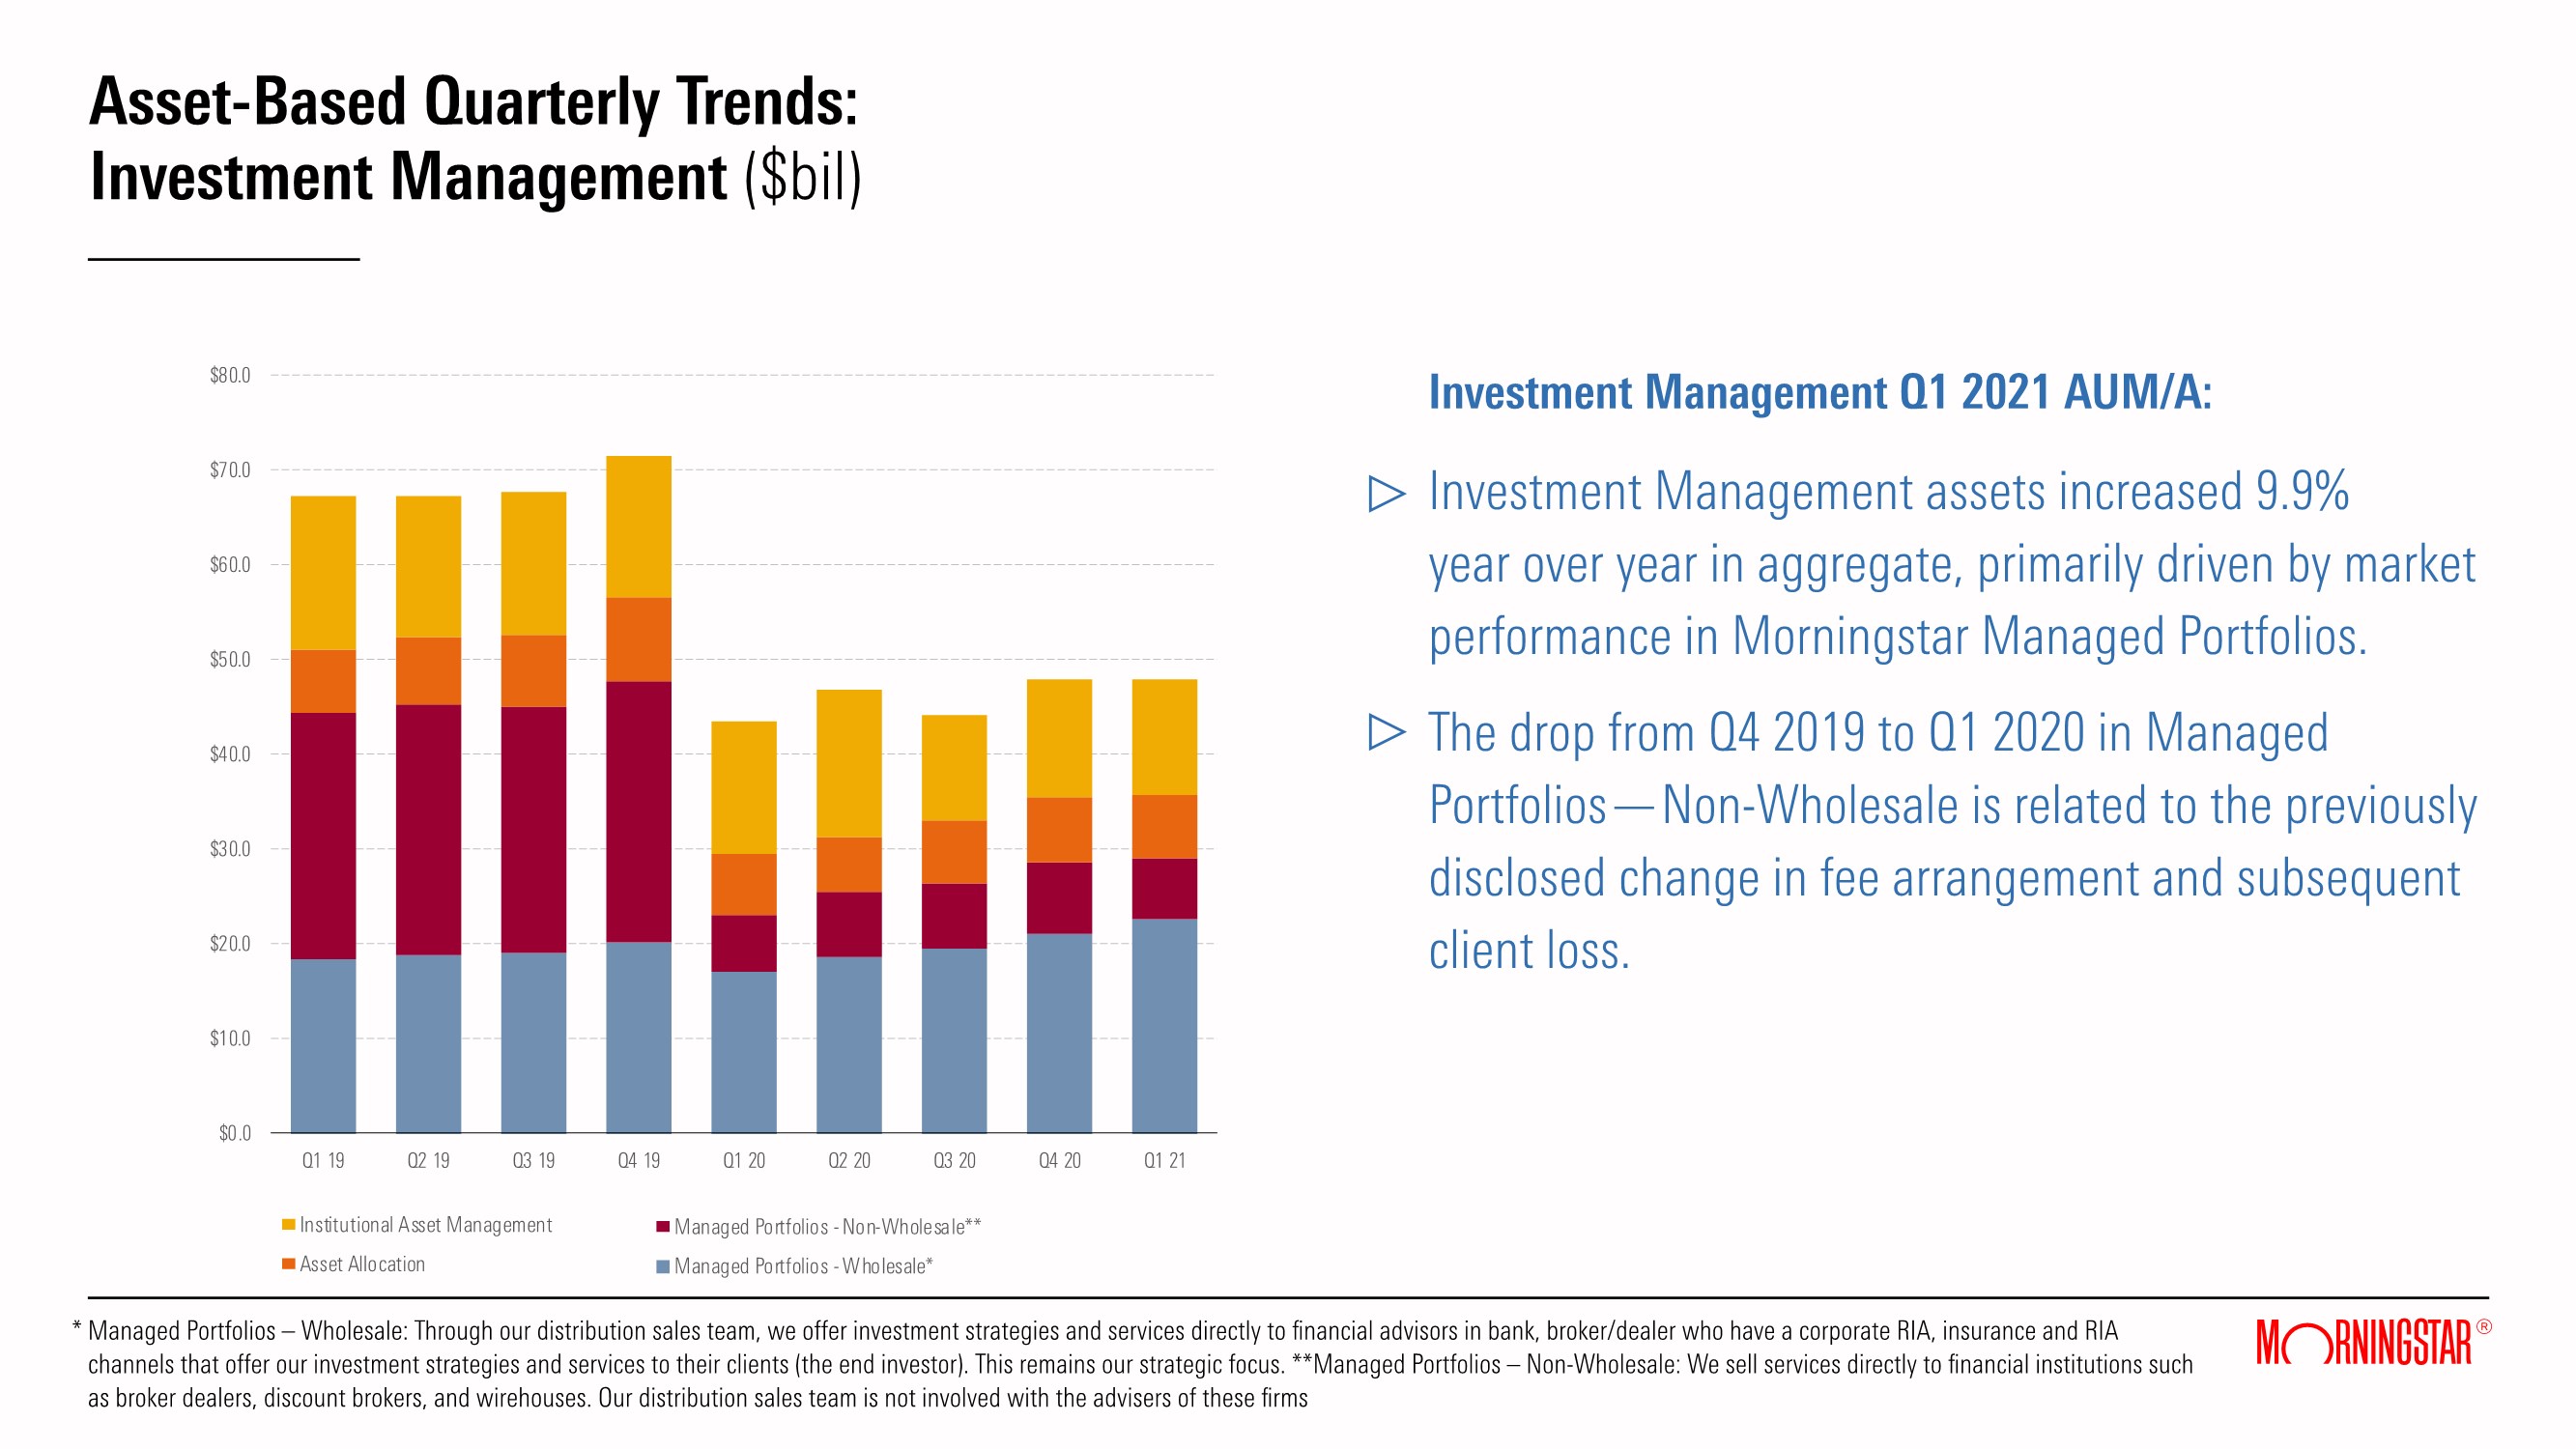
| Asset-Based Quarterly Trends: Investment Management ($bil) Investment Management Q1 2021 AUM/A: Investment Management assets increased 9.9% year over year in aggregate, primarily driven by market performance in Morningstar Managed Portfolios. The drop from Q4 2019 to Q1 2020 in Managed Portfolios—Non-Wholesale is related to the previously disclosed change in fee arrangement and subsequent client loss. $0.0 $10.0 $20.0 $30.0 $40.0 $50.0 $60.0 $70.0 $80.0 Q2 19 Q3 19 Q4 19 Q1 20 Q2 20 Q3 20 Q4 20 Q1 21 Institutional Asset Management Asset Allocation Managed Portfolios - Nonwholesale** Managed Portfolios - Wholesale* Managed Portfolios – Wholesale: Through our distribution sales team, we offer investment strategies and services directly to financial advisors in bank, broker/dealer who have a corporate RIA, insurance and RIA channels that offer our investment strategies and services to their clients (the end investor). This remains our strategic focus. **Managed Portfolios – Non-Wholesale: We sell services directly to financial institutions such as broker dealers, discount brokers, and wirehouses. Our distribution sales team is not involved with the advisers of these firms * $0.0 $10.0 $20.0 $30.0 $40.0 $50.0 $60.0 $70.0 $80.0 Q1 19 Q2 19 Q3 19 Q4 19 Q1 20 Q2 20 Q3 20 Q4 20 Q1 21 Institutional Asset Management Asset Allocation Managed Portfolios - Nonwholesale** Managed Portfolios - Wholesale* $0.0 $10.0 $20.0 $30.0 $40.0 $50.0 $60.0 $70.0 $80.0 Q1 19 Q2 19 Q3 19 Q4 19 Q1 20 Q2 20 Q3 20 Q4 20 Q1 21 Institutional Asset Management Asset Allocation Managed Portfolios - Non-Wholesale** Managed Portfolios - Wholesale* $0.0 $10.0 $20.0 $30.0 $40.0 $50.0 $60.0 $70.0 $80.0 Q1 19 Q2 19 Q3 19 Q4 19 Q1 20 Q2 20 Q3 20 Q4 20 Q1 21 Institutional Asset Management Asset Allocation Managed Portfolios - Non-Wholesale** Managed Portfolios - Wholesale* |
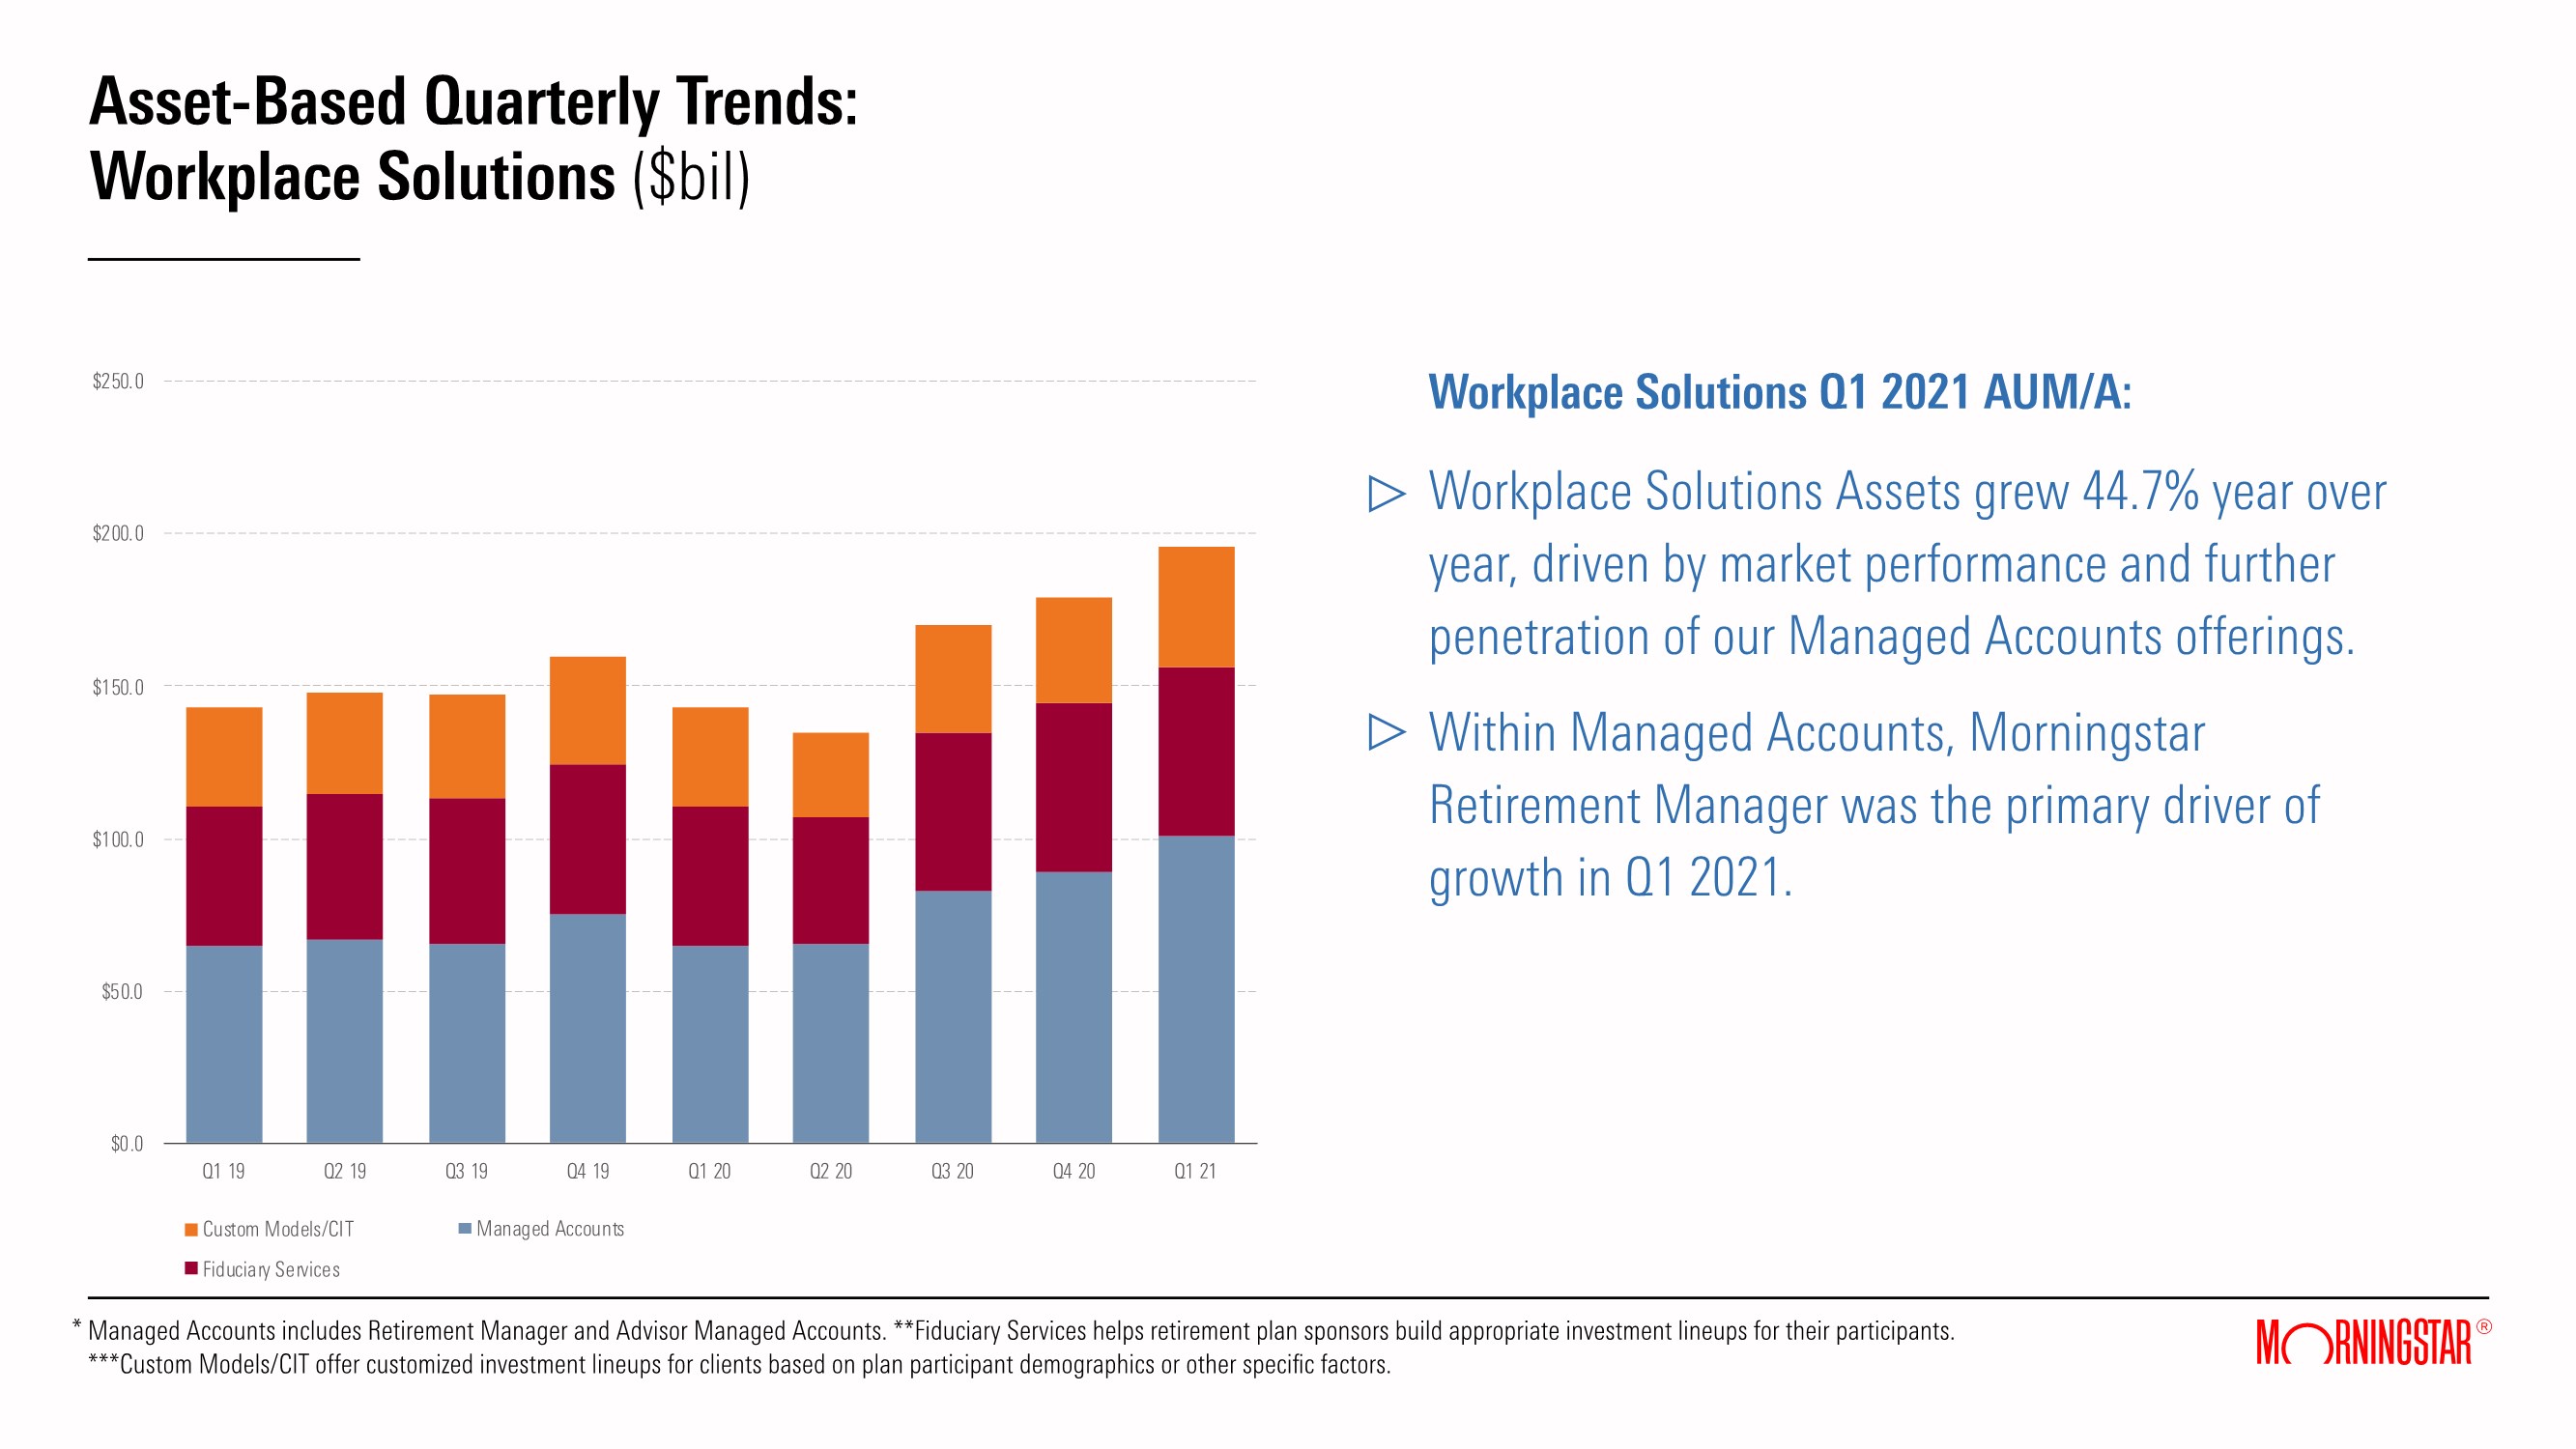
| Asset-Based Quarterly Trends: Workplace Solutions ($bil) Workplace Solutions Q1 2021 AUM/A: Workplace Solutions Assets grew 44.7% year over year, driven by market performance and further penetration of our Managed Accounts offerings. Within Managed Accounts, Morningstar Retirement Manager was the primary driver of growth in Q1 2021. Managed Accounts includes Retirement Manager and Advisor Managed Accounts. **Fiduciary Services helps retirement plan sponsors build appropriate investment lineups for their participants. ***Custom Models/CIT offer customized investment lineups for clients based on plan participant demographics or other specific factors. $0.0 $50.0 $100.0 $150.0 $200.0 $250.0 Q2 19 Q3 19 Q4 19 Q1 20 Q2 20 Q3 20 Q4 20 Q1 21 Custom Models/CIT Fiduciary Services Managed Accounts $0.0 $50.0 $100.0 $150.0 $200.0 $250.0 Q2 19 Q3 19 Q4 19 Q1 20 Q2 20 Q3 20 Q4 20 Q1 21 Custom Models/CIT Fiduciary Services Managed Accounts * $0.0 $50.0 $100.0 $150.0 $200.0 $250.0 Q1 19 Q2 19 Q3 19 Q4 19 Q1 20 Q2 20 Q3 20 Q4 20 Q1 21 Custom Models/CIT Fiduciary Services Managed Accounts |
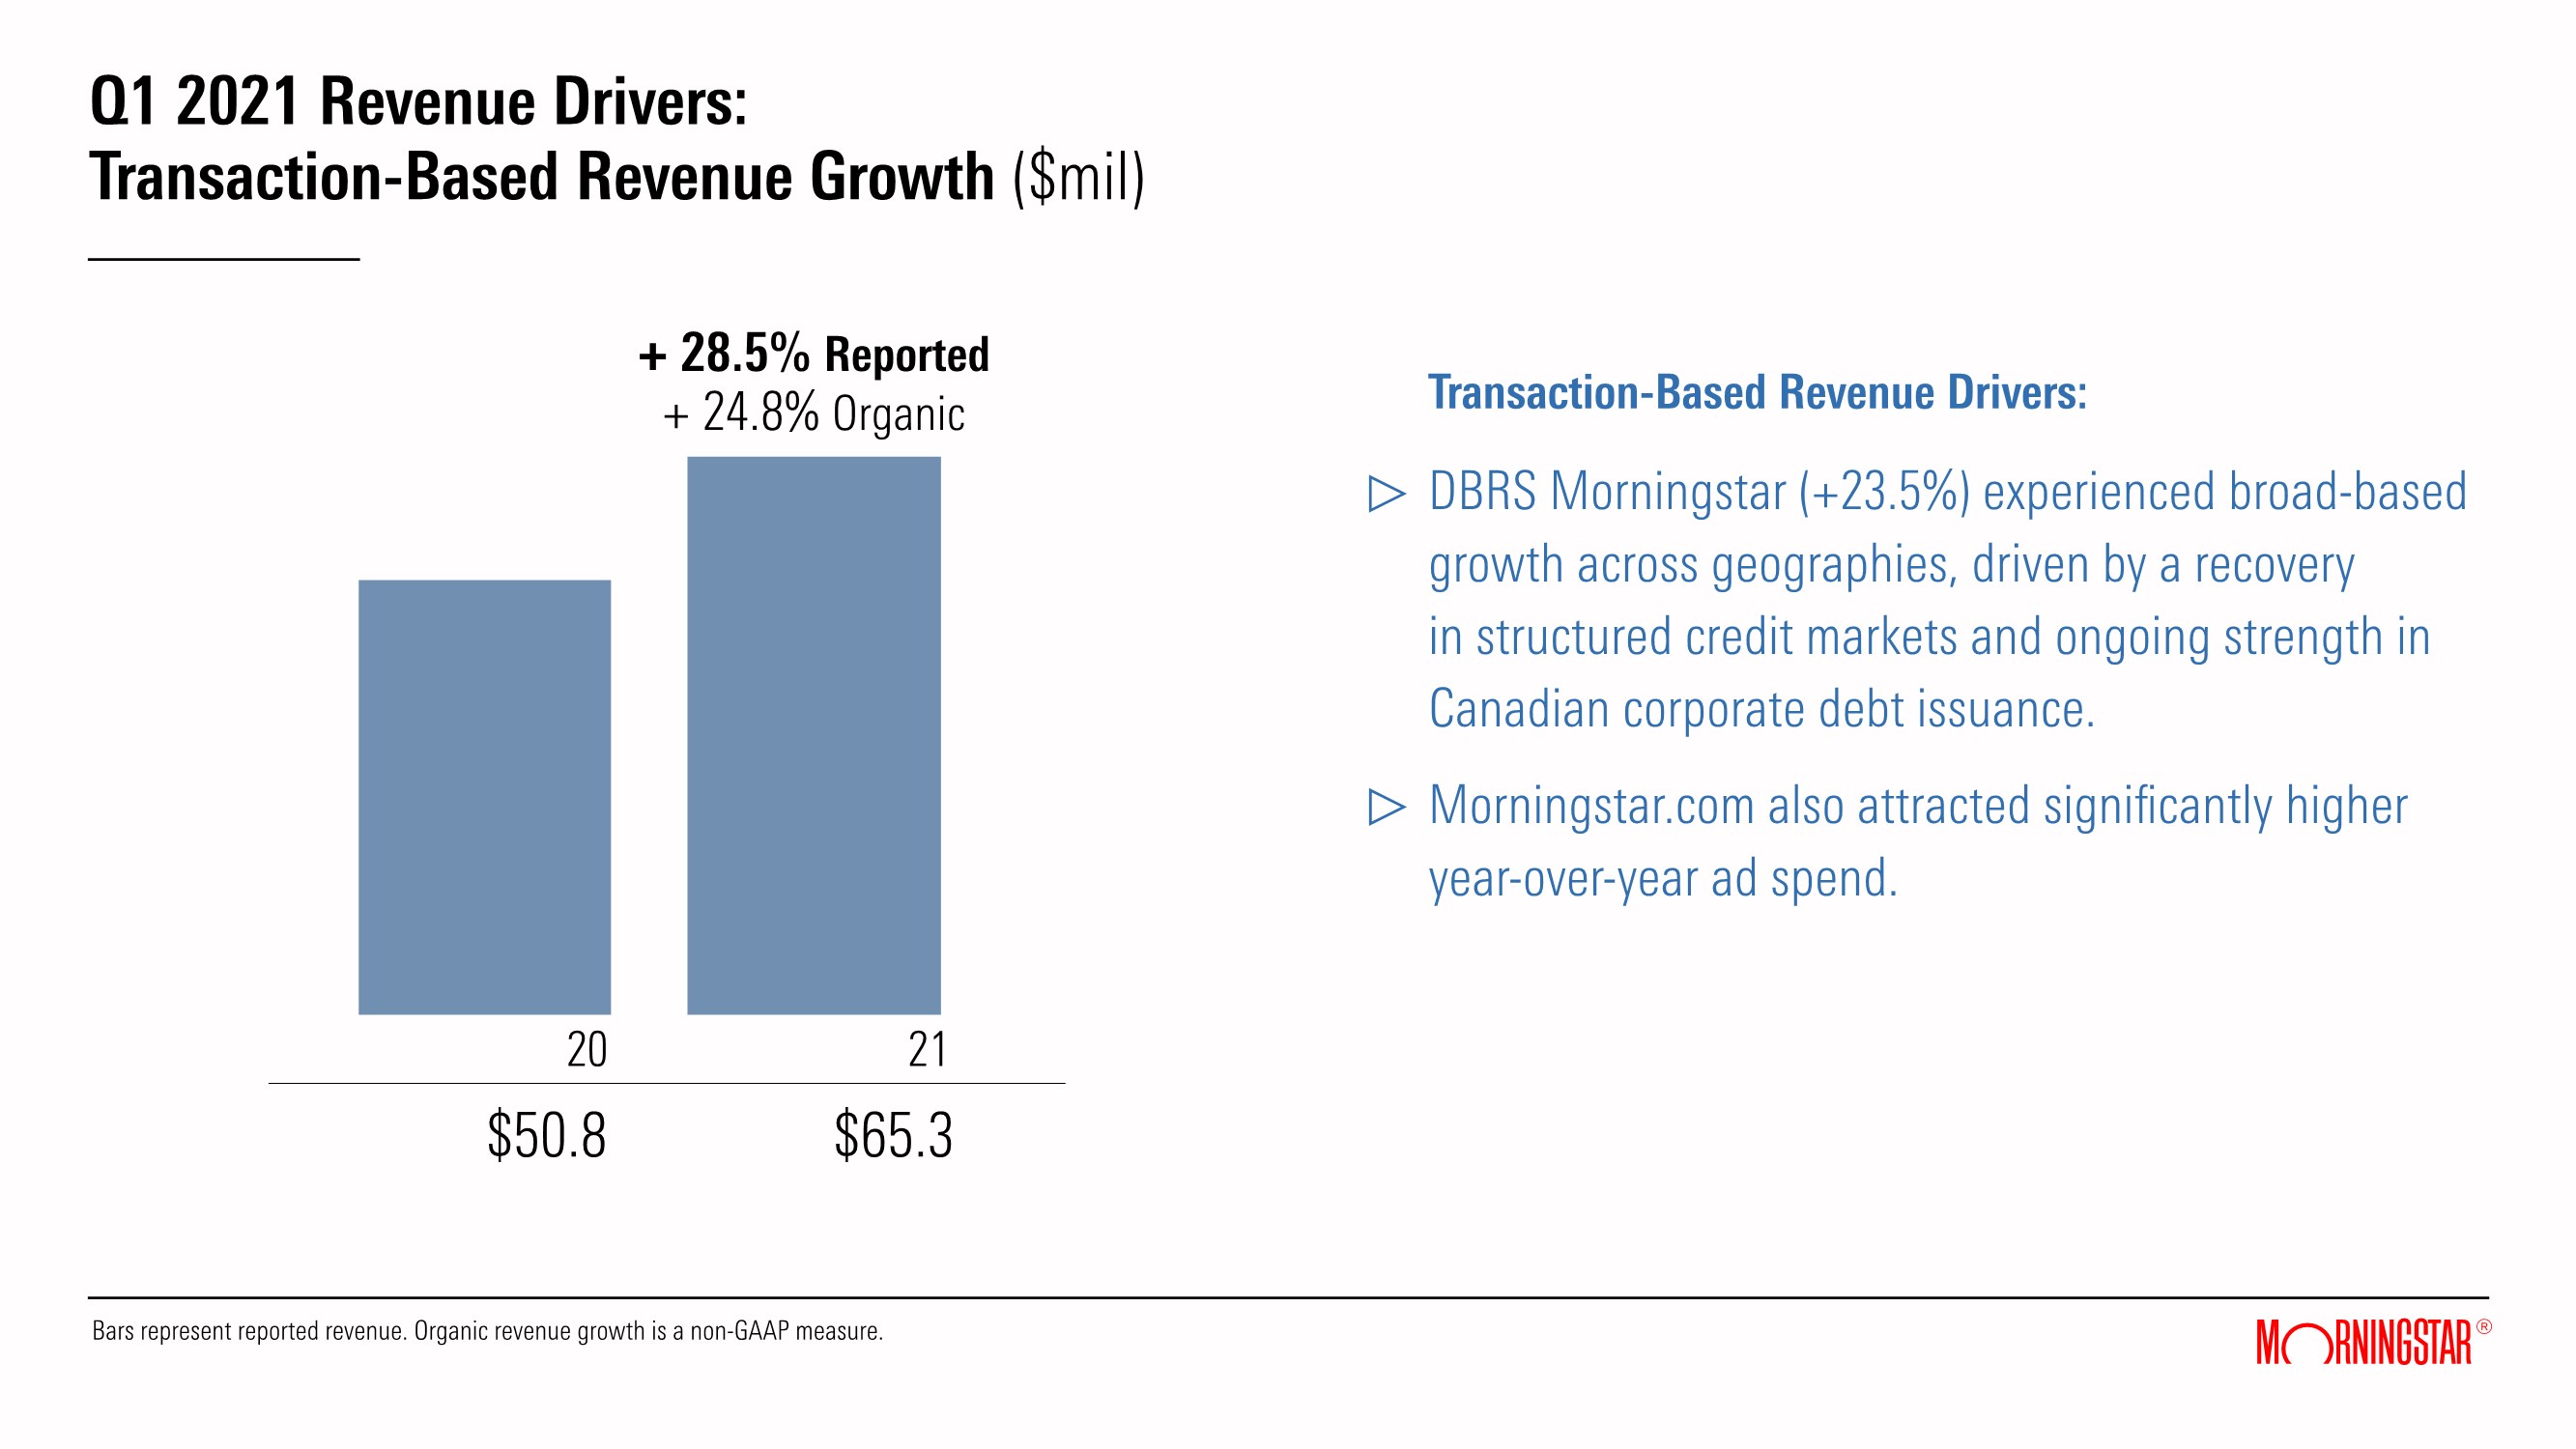
| Q1 2021 Revenue Drivers: Transaction-Based Revenue Growth ($mil) Bars represent reported revenue. Organic revenue growth is a non-GAAP measure. Transaction-Based Revenue Drivers: DBRS Morningstar (+23.5%) experienced broad-based growth across geographies, driven by a recovery in structured credit markets and ongoing strength in Canadian corporate debt issuance. Morningstar.com also attracted significantly higher year-over-year ad spend. + 28.5% Reported + 24.8% Organic 21 20 $50.8 $65.3 |
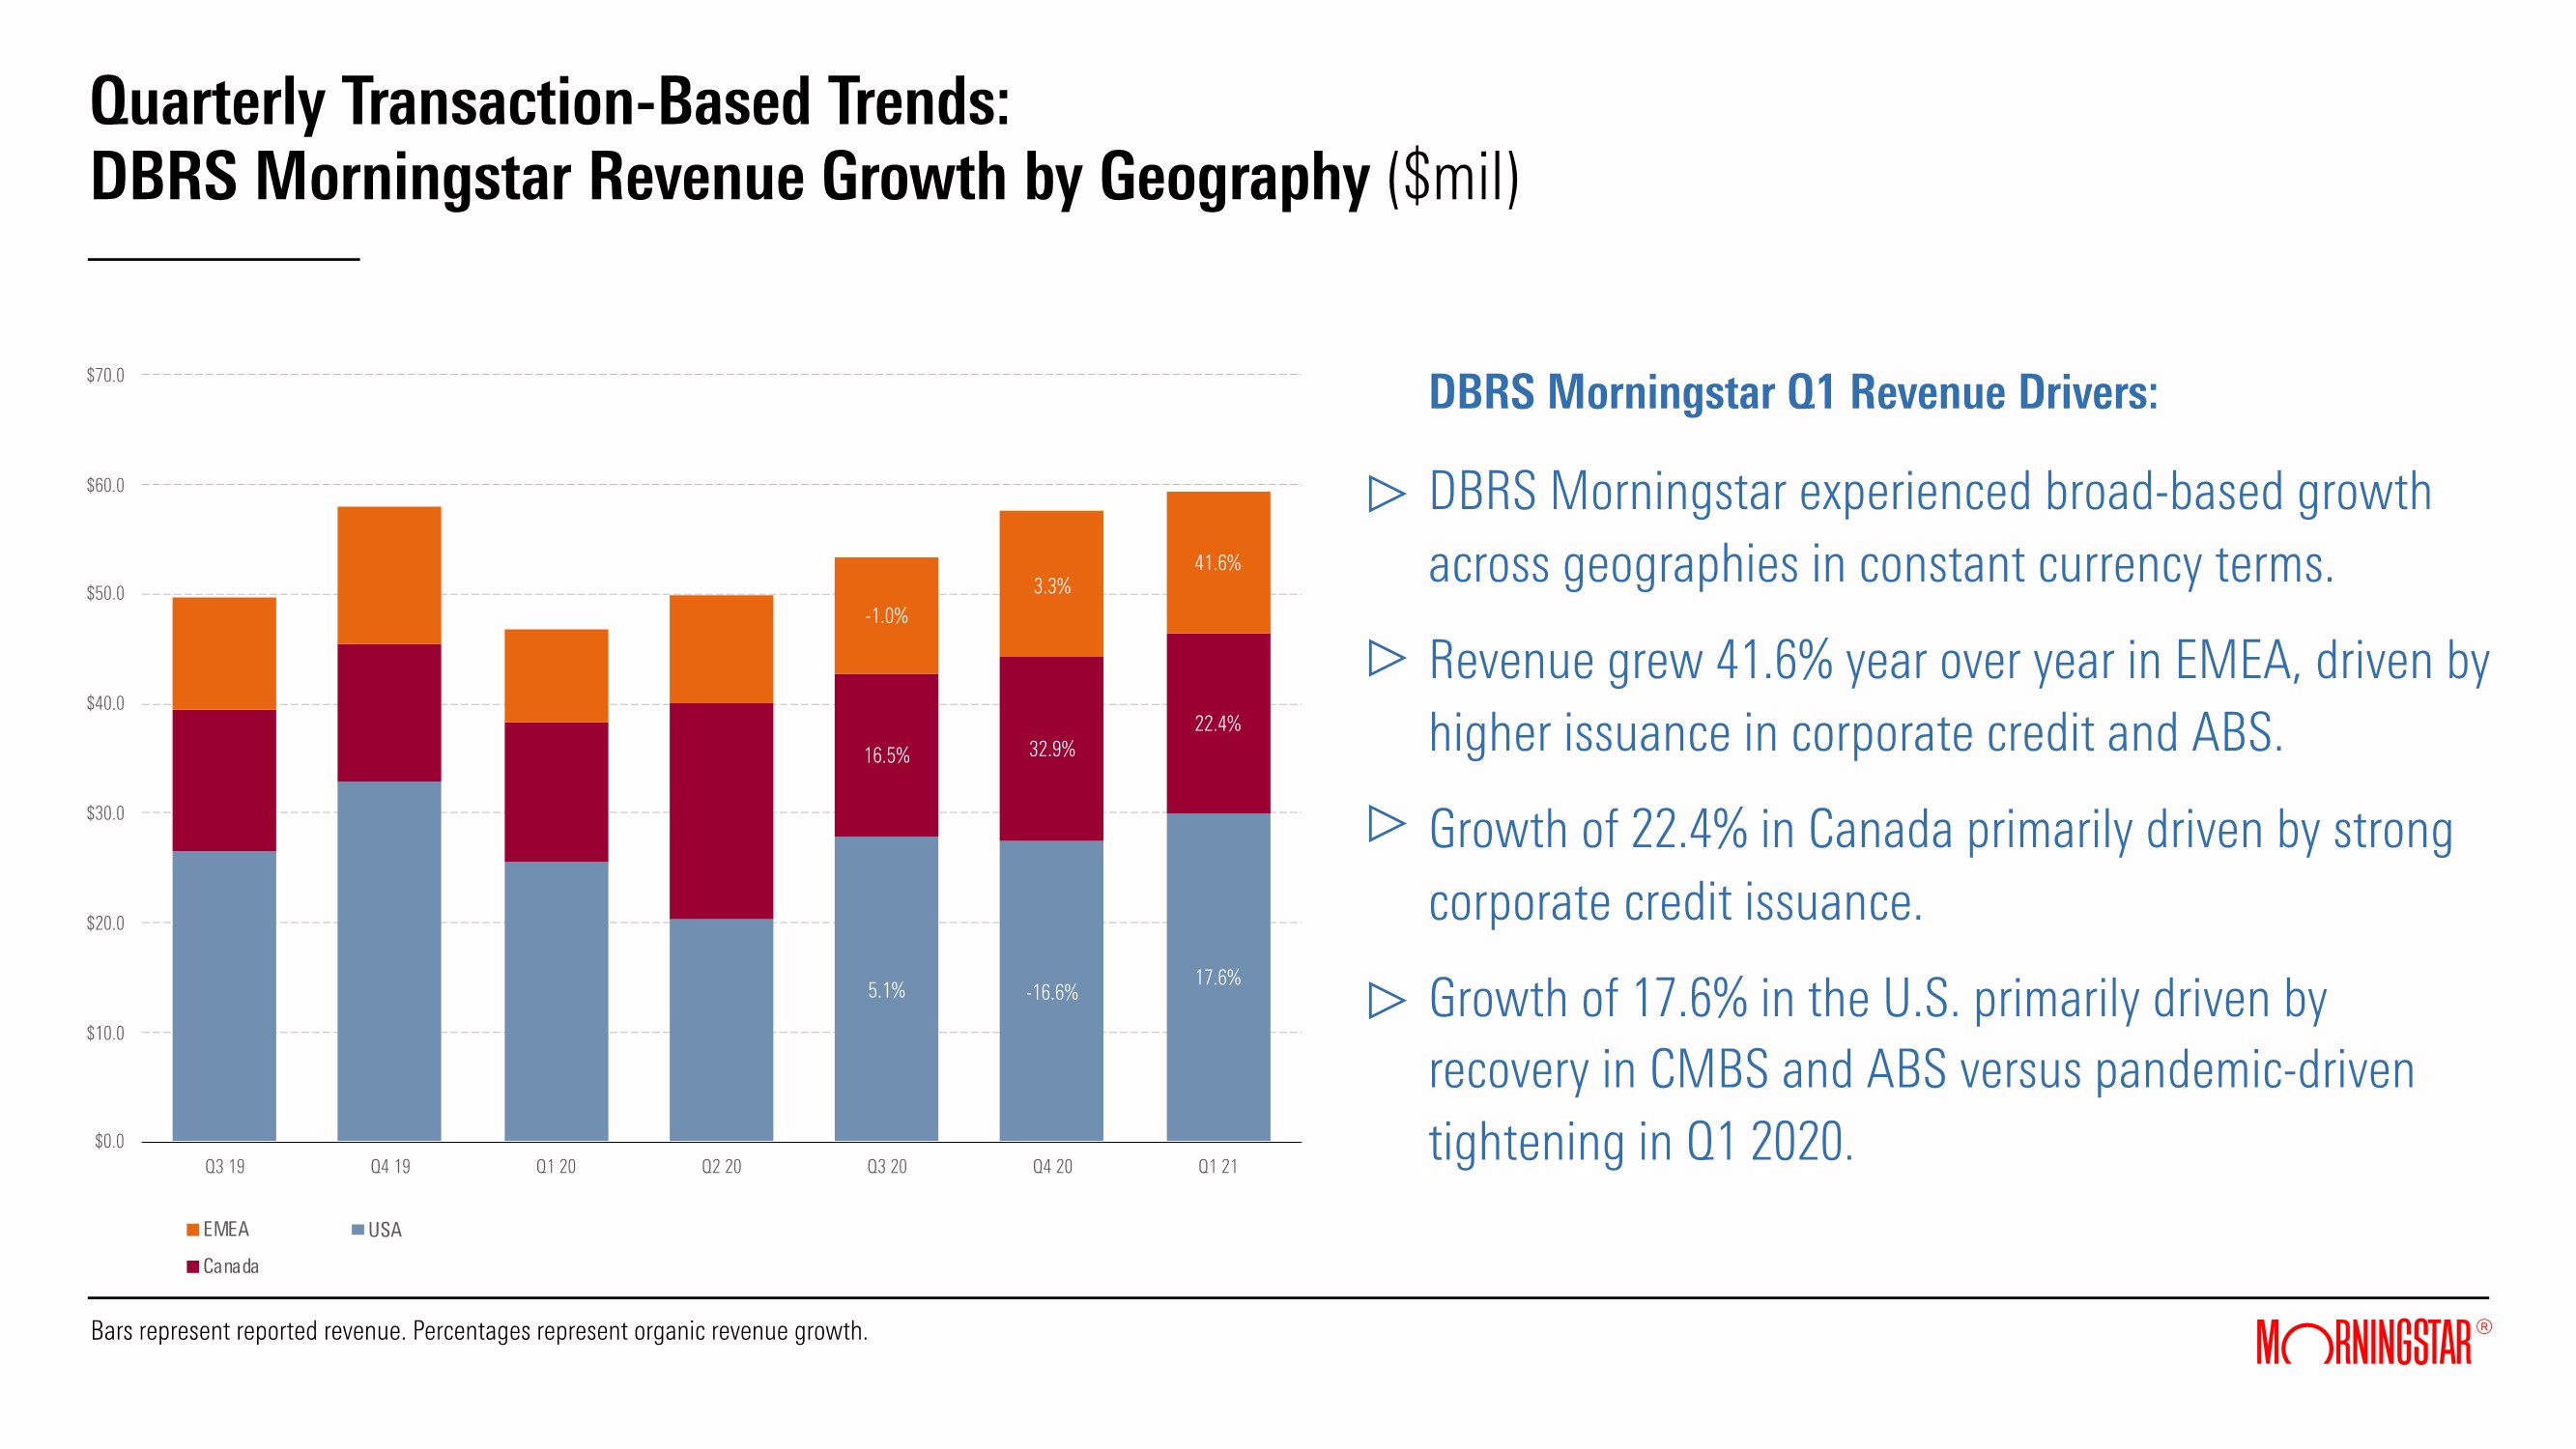
| Quarterly Transaction-Based Trends: DBRS Morningstar Revenue Growth by Geography ($mil) 5.1% 6.7% 17.6% 15.4% 34.6% 29.4% 3.3% --16.6% 52.0% $0.0 $10.0 $20.0 $30.0 $40.0 $50.0 $60.0 $70.0 Q3 19 Q4 19 Q1 20 Q2 20 Q3 20 Q4 20 Q1 21 EMEA Canada USA DBRS Morningstar Q1 Revenue Drivers: DBRS Morningstar experienced broad-based growth across geographies in constant currency terms. Revenue grew 41.6% year over year in EMEA, driven by higher issuance in corporate credit and ABS. Growth of 22.4% in Canada primarily driven by strong corporate credit issuance. Growth of 17.6% in the U.S. primarily driven by recovery in CMBS and ABS versus pandemic-driven tightening in Q1 2020. 5.1% 6.7% 17.6% 15.4% 34.6% 29.4% 3.3% --16.6% 52.0% $0.0 $10.0 $20.0 $30.0 $40.0 $50.0 $60.0 $70.0 Q3 19 Q4 19 Q1 20 Q2 20 Q3 20 Q4 20 Q1 21 EMEA Canada USA 5.1% -16.6% 17.6% 16.5% 32.9% 22.4% -1.0% 3.3% 41.6% $0.0 $10.0 $20.0 $30.0 $40.0 $50.0 $60.0 $70.0 Q3 19 Q4 19 Q1 20 Q2 20 Q3 20 Q4 20 Q1 21 EMEA Canada USA Bars represent reported revenue. Percentages represent organic revenue growth. |
| Quarterly Transaction-Based Trends: DBRS Morningstar Revenue by Asset Class ($mil) DBRS Morningstar Q1 2021 Revenue Drivers: Category mix in Q1 2021 was 64% Structured Finance vs 36% Fundamental Ratings. Continued momentum in Canadian corporate debt issuance and demand for global financial institution ratings. Recovery in structured credit markets was the primary driver of revenue growth in the quarter, led by higher CMBS and ABS issuance. Recurring revenue represented 36.9% of consolidated total. *Fundamental Ratings (Corporate, Financial Institutions, Sovereign) & Other **Structured Finance (Asset-Backed Securities, Commercial Mortgage-Backed Securities, Residential Mortgage-Backed Securities) $0.0 $10.0 $20.0 $30.0 $40.0 $50.0 $60.0 $70.0 Q3 19 Q4 19 Q1 20 Q2 20 Q3 20 Q4 20 Q1 21 Fundamental Ratings Structured Finance Ratings $0.0 $10.0 $20.0 $30.0 $40.0 $50.0 $60.0 $70.0 Q3 19 Q4 19 Q1 20 Q2 20 Q3 20 Q4 20 Q1 21 Fundamental Ratings Structured Finance Ratings |
| Q1 2021 Operating Margins Adjusted Operating Margin Operating Margin 21 20 +17.1% +23.6% 21 20 Adjusted operating margin is a non-GAAP financial measure. +13.7% +18.9% Operating Margin Drivers: Higher revenue across product areas with leverage in license-based and transaction-based areas. Revenue growth outpaced expense growth adjusted for M&A-related expenses. Expense growth driven by higher salary and benefits, commissions, mutual fund operating expenses and facilities costs. Favorable expense benefits from lower travel and higher capitalized software development. |
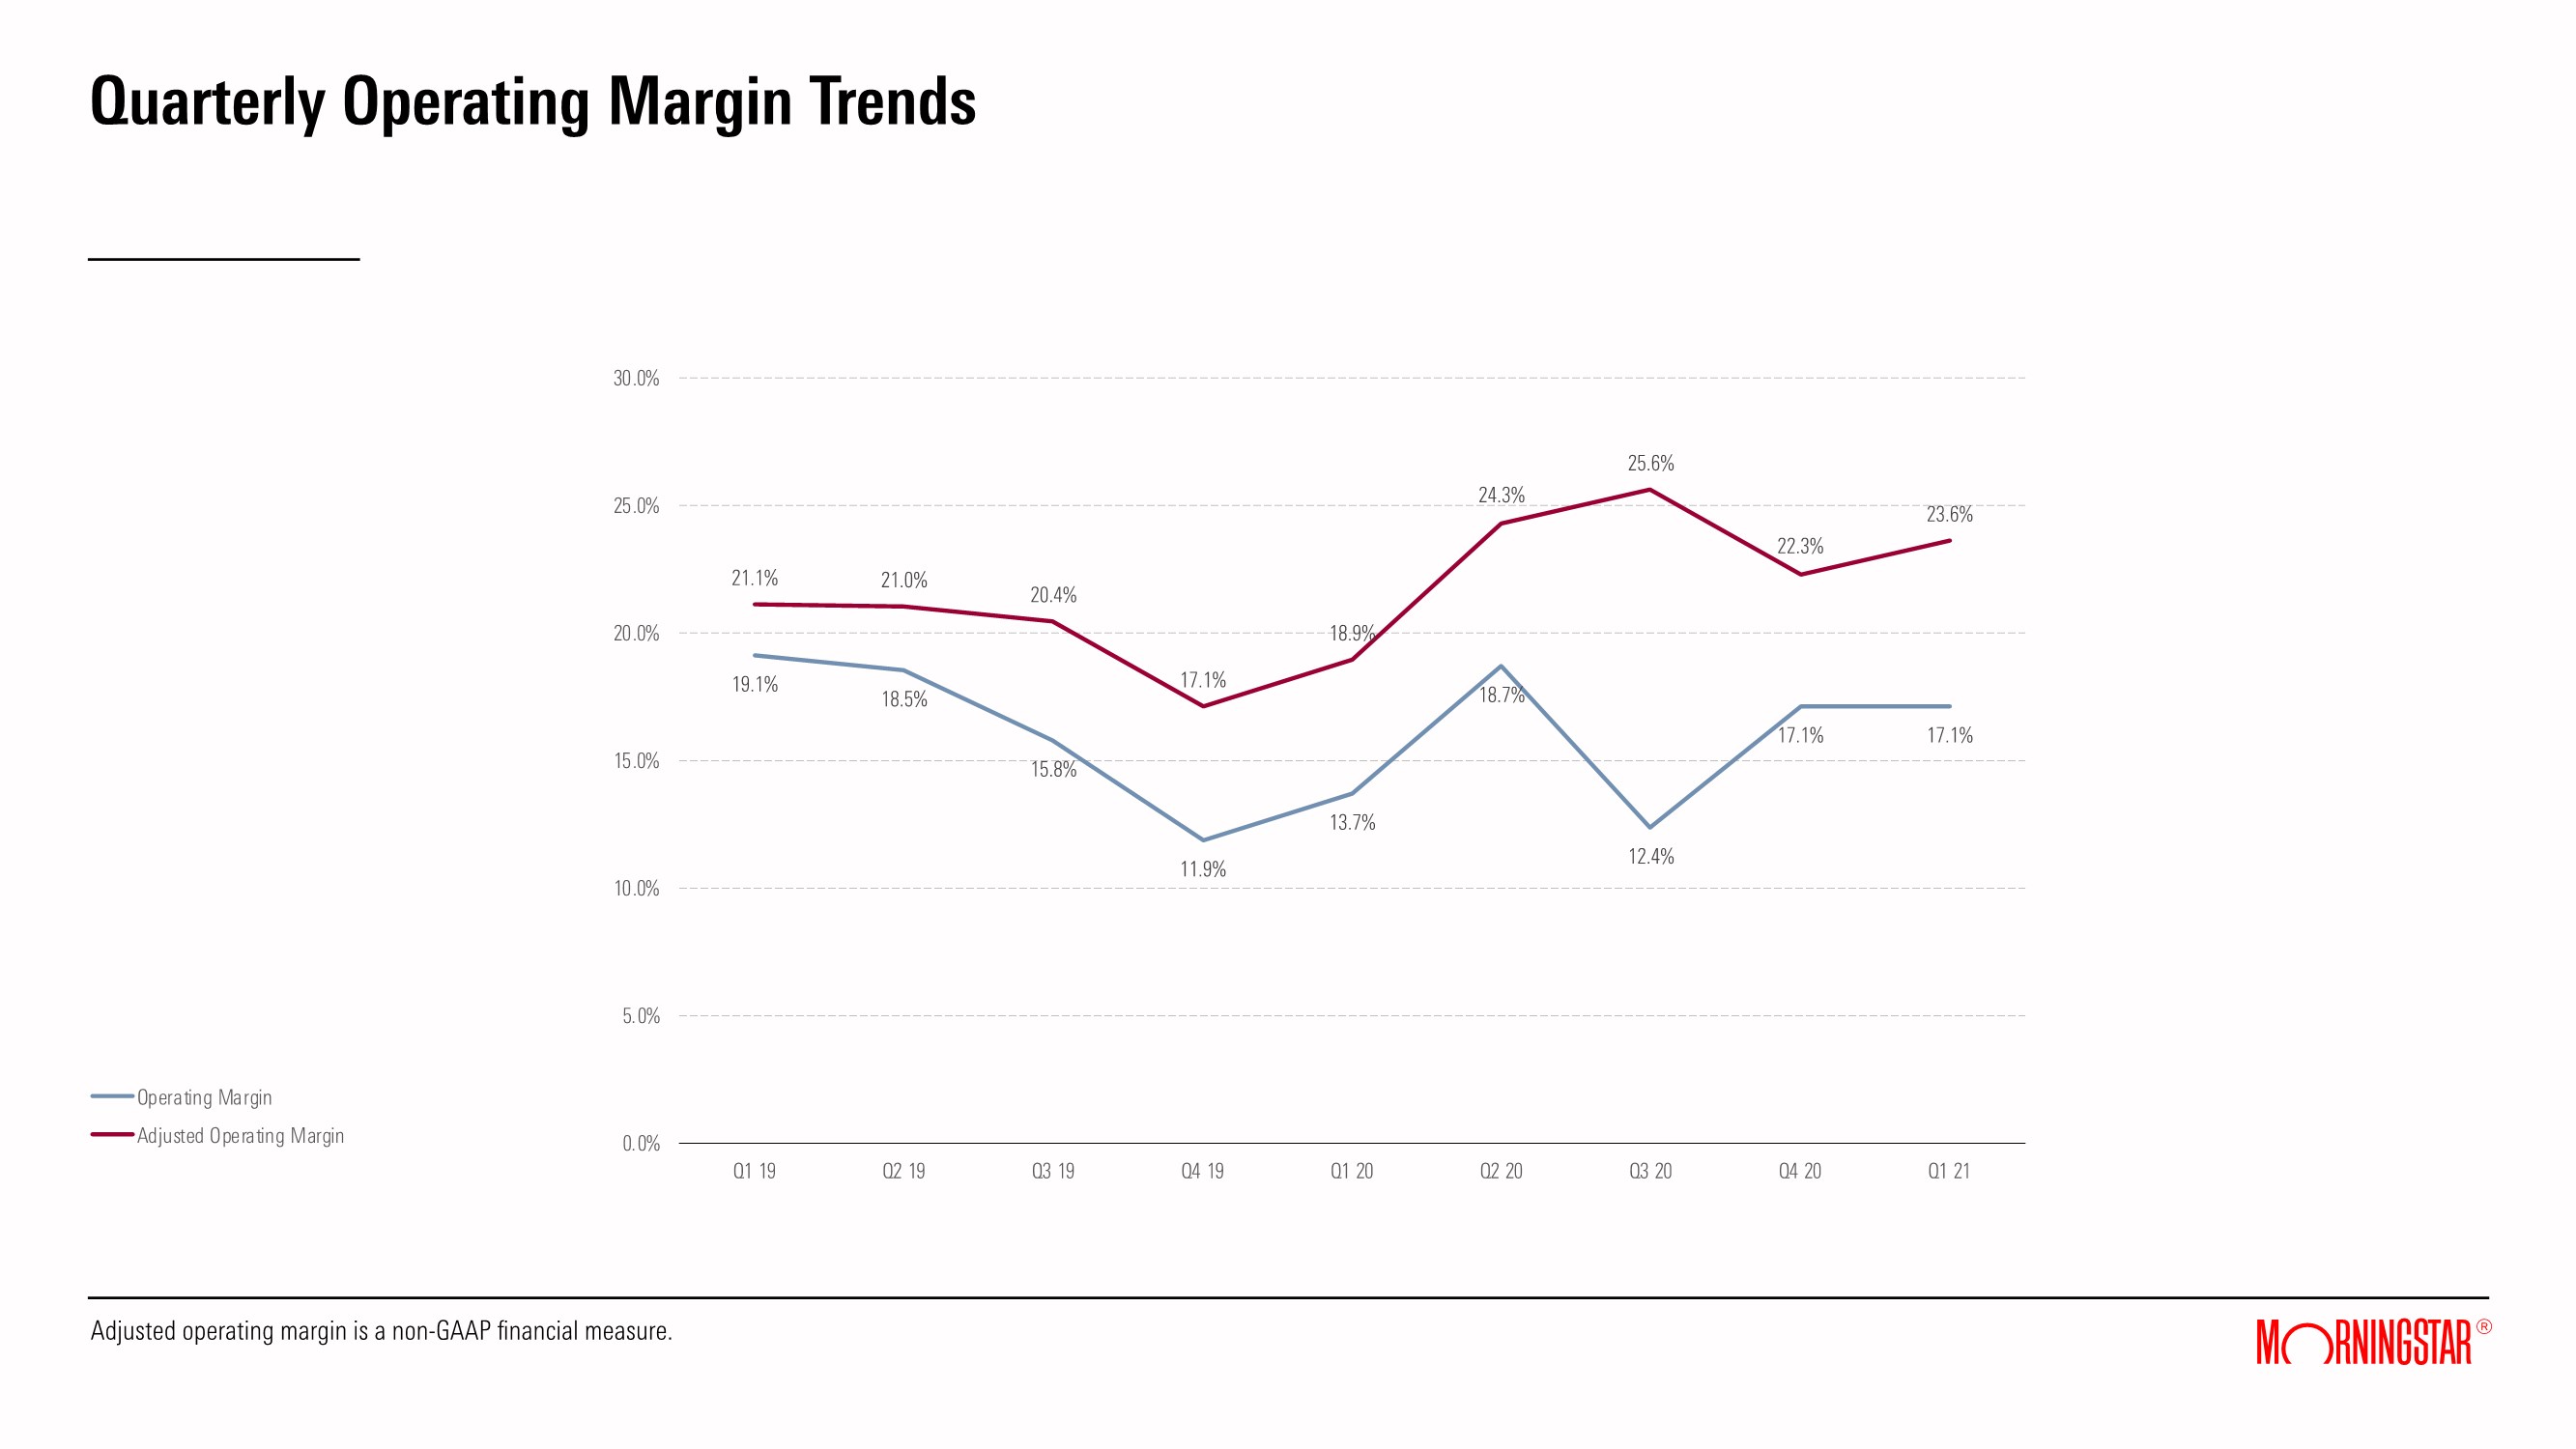
| Quarterly Operating Margin Trends Adjusted operating margin is a non-GAAP financial measure. 19.1% 18.5% 15.8% 11.9% 13.7% 18.7% 12.4% 17.1% 17.1% 21.1% 21.0% 20.4% 17.1% 18.9% 24.3% 25.6% 22.3% 23.6% 0.0% 5.0% 10.0% 15.0% 20.0% 25.0% 30.0% Q1 19 Q2 19 Q3 19 Q4 19 Q1 20 Q2 20 Q3 20 Q4 20 Q1 21 Operating Margin Adjusted Operating Margin 19.1% 18.5% 15.8% 11.9% 13.7% 18.7% 12.4% 17.1% 17.1% 21.1% 21.0% 20.4% 17.1% 18.9% 24.3% 25.6% 22.3% 23.6% 0.0% 5.0% 10.0% 15.0% 20.0% 25.0% 30.0% Q1 19 Q2 19 Q3 19 Q4 19 Q1 20 Q2 20 Q3 20 Q4 20 Q1 21 Operating Margin Adjusted Operating Margin |
| Q1 2021 Cash Flow and Capital Allocation ($mil) 2 ($mil) Debt Repayment 45.0 CapEx 22.7 Dividends 13.5 Equity Method Investments 5.2 Q1 21 Q1 21 $64.2 $41.5 Operating Cash Flow Free Cash Flow Capital Allocation Total capital deployed in Q1 2021 is higher than operating cash flow due to use of excess cash on hand to repay debt. |
| Reconciliation from Reported to Organic Revenue Growth *License-based revenue grew 9.9% in Q3 2019 when excluding a $10.5 million non-recurring revenue benefit from prior period results. |

| Reconciliation from Reported to Organic Revenue Growth |
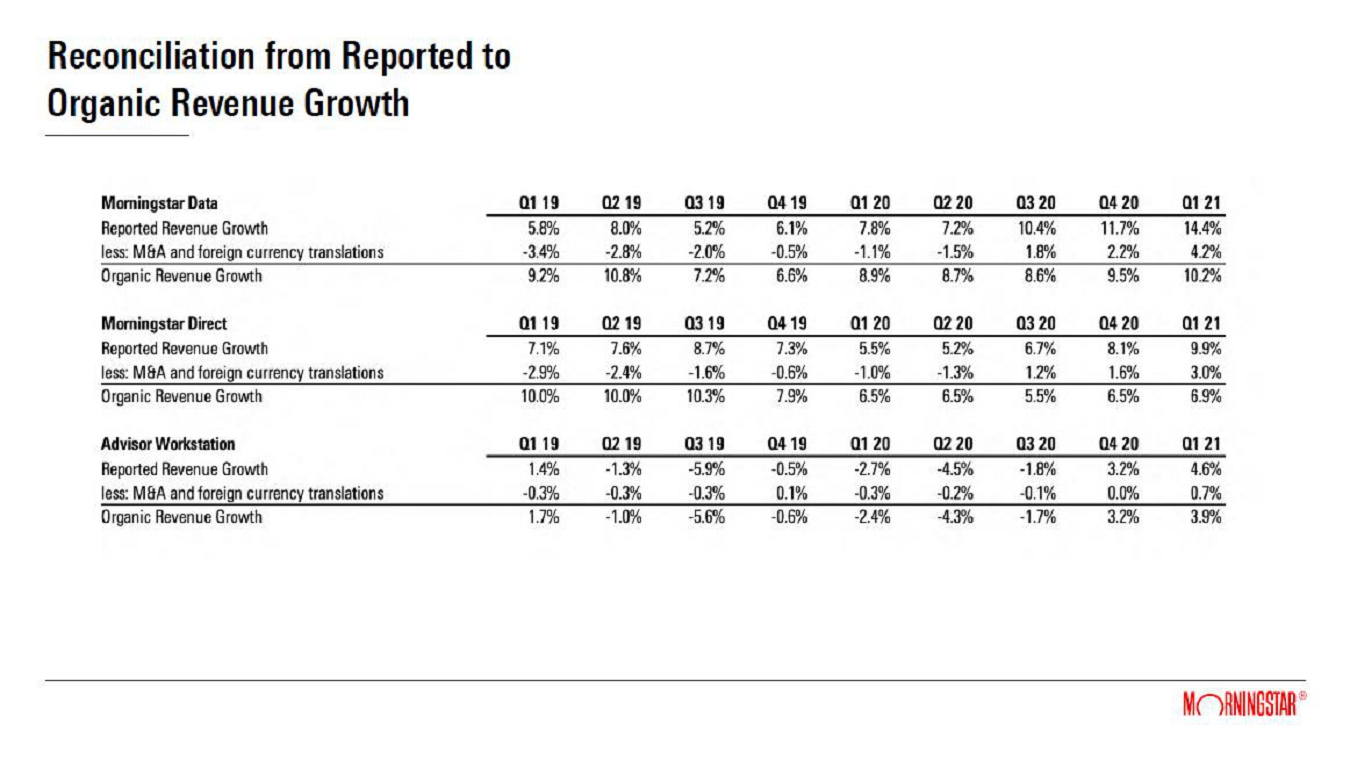
| Reconciliation from Reported to Organic Revenue Growth |
| Reconciliation from Operating to Adjusted Operating Margin |
|

Serious News for Serious Traders! Try StreetInsider.com Premium Free!
You May Also Be Interested In
- Morningstar (MORN) Reports Q1 EPS of $1.73
- New Morningstar Report Sheds Light on Rapid Expansion of Active ETFs
- Morningstar, Inc. Reports First-Quarter 2024 Financial Results
Create E-mail Alert Related Categories
SEC FilingsRelated Entities
Morningstar, Inc.Sign up for StreetInsider Free!
Receive full access to all new and archived articles, unlimited portfolio tracking, e-mail alerts, custom newswires and RSS feeds - and more!
