

Form 8-K MedMen Enterprises, Inc. For: Sep 23
 Tweet
Tweet Share
Share
UNITED STATES
SECURITIES AND EXCHANGE COMMISSION
Washington, D.C. 20549
FORM 8-K
CURRENT REPORT
PURSUANT TO SECTION 13 OR 15(d) OF THE SECURITIES EXCHANGE ACT OF 1934
Date of report (Date of earliest event reported) September 23, 2021
MEDMEN ENTERPRISES INC
(Exact Name of Registrant as Specified in Its Charter)
British Columbia
(State or Other Jurisdiction of Incorporation)
| 000-56199 | 98-1431779 | |
| (Commission File Number) | (IRS Employer Identification No.) |
| 10115 Jefferson Boulevard, Culver City, CA | 90232 | |
| (Address of Principal Executive Offices) | (Zip Code) |
(424) 330-2082
(Registrant’s Telephone Number, Including Area Code)
(Former Name or Former Address, if Changed Since Last Report)
Check the appropriate box below if the Form 8-K filing is intended to simultaneously satisfy the filing obligation of the registrant under any of the following provisions (see General Instruction A.2. below):
| ☐ | Written communications pursuant to Rule 425 under the Securities Act (17 CFR 230.425) |
| ☐ | Soliciting material pursuant to Rule 14a-12 under the Exchange Act (17 CFR 240.14a-12) |
| ☐ | Pre-commencement communications pursuant to Rule 14d-2(b) under the Exchange Act (17 CFR 240.14d-2(b)) |
| ☐ | Pre-commencement communications pursuant to Rule 13e-4(c) under the Exchange Act (17 CFR 240.13e-4(c)) |
Securities registered pursuant to Section 12(b) of the Act:
| Title of each class | Trading Symbols | Name of each exchange on which registered | ||
Indicate by check mark whether the registrant is an emerging growth company as defined in Rule 405 of the Securities Act of 1933 (17 CFR §230.405) or Rule 12b-2 of the Securities Exchange Act of 1934 (17 CFR §240.12b-2).
Emerging growth company ☒
If an emerging growth company, indicate by check mark if the registrant has elected not to use the extended transition period for complying with any new or revised financial accounting standards provided pursuant to Section 13(a) of the Exchange Act. ☐
Item 2.02 Results of Operations and Financial Condition.
On September 23, 2021, MedMen Enterprises Inc. issued a press release announcing certain financial results for the period ended June 26, 2021. The Company also posted on its website an investor presentation. Copies of the press release and investor presentation are attached hereto as Exhibits 99.1 and 99.2, respectively, and the information therein is incorporated herein by reference.
The information contained in this Item 2.02 and in the accompanying Exhibits 99.1 and 99.2 shall not be deemed filed for purposes of Section 18 of the Securities Exchange Act of 1934, as amended (the “Exchange Act”) , or incorporated by reference in any filing under the Exchange Act or the Securities Act of 1933, as amended (the “Securities Act”), except as shall be expressly set forth by specific reference in such filing.
Item 7.01 Regulation FD Disclosure.
The information under Item 2.02, above, is incorporated herein by reference.
The information reported under Items 2.02 and 7.01 in this Current Report on Form 8-K, including Exhibits 99.1 and 99.2 attached hereto, shall not be deemed filed for purposes of Section 18 of the Exchange Act or otherwise subject to the liabilities of that section, nor shall it be deemed incorporated by reference in any filing under the Securities Act or the Exchange Act, regardless of any general incorporation language in such filing.
Item 9.01 Financial Statements and Exhibits.
| (d) | Exhibits |
| Exhibit Number |
Description | |
| 99.1 | Press Release dated September 23, 2021. | |
| 99.2 | Investor Presentation dated September 23, 2021 |
| 1 |
SIGNATURES
Pursuant to the requirements of the Securities Exchange Act of 1934, the registrant has duly caused this report to be signed on its behalf by the undersigned hereunto duly authorized.
| MEDMEN ENTERPRISES INC | ||
| Date: September 23, 2021 | By: | /s/ Reece Fulgham |
| Name: | Reece Fulgham | |
| Title: | Chief Financial Officer | |
| 2 |
Exhibit 99.1
PRESS RELEASE
MEDMEN
REPORTS 55% YEAR-OVER-YEAR QUARTERLY REVENUE GROWTH
AND SECOND CONSECUTIVE QUARTER OF GROWTH IN BOTH REVENUE AND
RETAIL ADJUSTED EBITDA
Company
Continues to Execute Against MedMen 2.0 Growth Plan, Fueled by Recent Capital
Infusion and Partnerships with Tilray and Serruya Private
Equity
Q4 2021 Highlights
| ● | Fourth quarter revenue was $42.0 million, up 55.4% year-over-year and up 18.5% from the previous quarter |
| ● | Subsequent to quarter end, Company announced transformative capital raise and restructuring of senior secured convertible note facility |
LOS ANGELES (September 23, 2021) — MedMen Enterprises Inc. (“MedMen” or the “Company”) (CSE: MMEN) (OTCQX: MMNFF), a premier cannabis retailer with operations across the United States, today released its consolidated financial results for its fourth quarter of 2021 and for the fiscal year ended June 26, 2021. All financial information in this press release is reported in U.S. dollars, unless otherwise indicated.
“The past quarter was pivotal for MedMen, defined by increased sales and EBITDA profitability at our retail stores, as well as our cultivation and manufacturing facilities,” said Tom Lynch, Chairman and Chief Executive Officer of MedMen. “We set a new record for quarterly revenue at MedMen, driven by broad-based increases in traffic and frequency of transactions across nearly all of our retail locations. Strength in California accelerated during the quarter, with revenue up 24.4% sequentially. Additionally, our improved operating results have helped us shore up our balance sheet and attract strong partners in Tilray and Serruya. As previously announced, we amended the terms of our secured debt to extend the maturity to 2028, reduced restrictive covenants and eliminated cash debt service requirements. Additionally, we added $100.0 million of new capital subsequent to the end of the fourth quarter via private placement.”
Continued Lynch, “MedMen’s mission is to be the best-in-class cannabis retailer, and we are positioning ourselves to achieve this goal through focus, experience, improved financials and continuing to deliver the industry’s premier in-store experience. Over the next several quarters, we plan to both accelerate our growth and improve EBITDA profitability as we leverage our national brand recognition into opening new stores in Florida, California, Massachusetts, Arizona and Illinois.”
Fourth Quarter Financial Highlights:
| ● | Revenue 1: Net revenue across MedMen's continuing operations in California, Nevada, Illinois, Arizona and Florida was $42.0 million for the fourth quarter, up 55.4% year-over-year and 18.5% sequentially, reflective of Arizona’s return to continuing operations. |
| ● | Gross Margin Rate and Retail Gross Margin Rate 2: Company-wide Gross Margin Rate was 46.9% in the fourth quarter, compared to 40.5% in the previous quarter, driven by the Company’s increased gross margin at its cultivation and manufacturing facilities. Retail Gross Margin Rate was 54.9% in the fourth quarter, compared to 55.6% in the previous quarter. |
| ● | SG&A Expenses: General and administrative expenses were $33.5 million in the fourth quarter, a 13.7% decrease from the same period last year. |
| ● | Corporate SG&A 2: Corporate SG&A excluding store pre-opening costs totaled $12.1 million in the fourth quarter, a 9.7% increase from the previous quarter. The $12.1 million in the fourth quarter marks a 19.1% decrease from the same period last year. |
| ● | Net Loss: Net loss was $46.2 million compared to a net loss of $9.7 million in the previous quarter, which prior quarter included a $32.7 million tax provision benefit. |
| ● | Retail Adjusted EBITDA Margin Rate2: Retail Adjusted EBITDA Margin Rate from continuing operations was 22.0% for the fourth quarter. |
Full Year 2021 Financial Highlights:
| ● | Revenue 1: Net revenue across MedMen's continuing operations in California, Nevada, Illinois, Arizona and Florida was $145.1 million for fiscal year 2021, down 6.6% from the prior year, reflecting the impact of COVID-19, particularly during the first half of the fiscal year and in the Las Vegas and California markets. |
| ● | Gross Margin Rate and Retail Gross Margin Rate2: Company-wide gross margin rate was 46.4% in fiscal year 2021 compared to 35.6% in the previous year, driven by a focus on retail optimization and improvements in supply chain, cultivation and manufacturing facilities. Retail gross margin rate was 54.7% for fiscal year 2021 compared to 49.6% in the previous year. |
| ● | SG&A Expenses: General and administrative expenses totaled $125.7 million in fiscal 2021, a 38.2% decrease from the previous year. |
| ● | Corporate SG&A 2: Corporate SG&A excluding store pre-opening costs totaled $42.6 million in fiscal year 2021, a 52.0% decrease from the previous year total of $88.8 million. |
| ● | Net Loss: Net loss was $157.6 million for fiscal year 2021 compared to a net loss of $526.5 million in the previous year, which prior year included an impairment charge of $246.7 million. |
| ● | Retail Adjusted EBITDA Margin Rate2: Retail Adjusted EBITDA Margin Rate from continuing operations was 20.0% for fiscal year 2021. |
| (1) | The Company executed definitive investment agreements to complete a majority investment in New York, subject to regulatory approval. New York operations are classified as discontinued operations. Arizona was reclassified to continuing operations during the fourth quarter. |
| (2) | Retail Gross Margin Rate, Corporate SG&A and Retail Adjusted EBITDA Margin are non-GAAP financial measures as described below. |
| 2 |
Balance Sheet:
As of June 26, 2021, the Company had total assets of $472.5 million, including cash and cash equivalents of $11.9 million.
Capital Markets and Financing:
| ● | Equity Private Placements: During the fourth quarter, the Company raised $10.0 million in additional gross proceeds through a private placement transaction with an institutional investor. Subsequent to the quarter, on August 17, 2021 the Company announced that investors, led by Serruya Private Equity, purchased $100.0 million of units, which consisted of 416,666,640 Class B Subordinate Voting Shares of MedMen and five-year warrants to purchase 104,166,660 Shares at an exercise price of $0.288 per share. Proceeds from the private placement will allow MedMen to expand its operations in key markets such as California, Florida, Illinois, Arizona and Massachusetts, and identify and accelerate further growth opportunities across the United States. |
| ● | Senior Secured Convertible Financing: Subsequent to the fourth quarter, on August 17, 2021, a newly formed limited partnership established by Tilray, Inc. and entities affiliated with Serruya Private Equity acquired a majority of the outstanding senior secured convertible notes (the “Notes”) and warrants of MedMen previously held by certain funds affiliated with Gotham Green Partners, LLC and other funds (collectively, “GGP”) pursuant to a senior secured convertible facility (the “Facility”). In connection with this transaction, the parties to the Facility extended the maturity date of the Notes to 2028, eliminated any cash interest payable and instead provided for paid-in-kind interest, eliminated certain repricing provisions that apply to the Notes and the warrants, eliminated and revised certain restrictive covenants and amended the minimum liquidity covenant, all of which provide MedMen the flexibility to execute on its growth priorities and explore additional strategic opportunities. |
Operations by Market:
| ● | California: California revenue across 12 store locations totaled $25.2 million for the fourth quarter, a 24.4% sequential increase from third quarter. |
| ● | Nevada: The Company’s three locations in Nevada saw accelerating results as tourism improved during the fourth quarter, driving a 44.1% sequential increase in fourth quarter revenue. |
| ● | Florida: The Company’s five stores in Florida reported a 10.9% sequential revenue increase. Subsequent to the end of the quarter the Company opened an additional store in Orlando. |
| ● | Illinois: The Company’s flagship store in Oak Park was the highest-revenue store in the Company’s national portfolio for fiscal year 2021. The Company’s second location in Morton Grove is expected to open in the spring of 2022. |
| 3 |
| ● | Massachusetts: The Company expects to open its Fenway Park store during the fiscal second quarter, subject to regulatory approval, and continues to progress towards opening its Newton location. |
| ● | Arizona: The Talking Stick store reported a 16.9% sequential increase in sales to $2.5 million for the fourth quarter. Wholesale sales increased 97.9% year-over-year to $1.3 million. |
| ● | New York: The Company previously announced a definitive investment agreement with Ascend Wellness Holdings (AWH) involving all four New York MedMen locations where, subject to regulatory approval, MedMen will no longer hold a controlling interest in its New York operations. Currently MedMen operates these four medical dispensaries in the state. |
Non-GAAP Financial Information:
This press release includes certain non-GAAP financial measures as defined by the U.S. Securities and Exchange Commission (the “SEC”). Management believes that these non-GAAP financial measures assess the Company’s ongoing business in a manner that allows for meaningful comparisons and analysis of trends in the business, as they facilitate comparing financial results across accounting periods and to those of peer companies. These non-GAAP financial measures exclude certain material non-cash items and certain other adjustments the Company believes are not reflective of its ongoing operations and performance. Management uses non-GAAP financial measures, in addition to GAAP financial measures, to understand and compare operating results across accounting periods, for financial and operational decision-making, for planning and forecasting purposes and to evaluate the Company’s financial performance. Management believes that these non-GAAP financial measures enhance investors’ understanding of the Company’s financial and operating performance from period to period and enable investors to evaluate the Company’s operating results and future prospects in the same manner as management. Reconciliations of these non-GAAP financial measures to the most directly comparable financial measure calculated and presented in accordance with GAAP are included in the financial schedules attached to this press release. This information should be considered as supplemental in nature and not as a substitute for, or superior to, any measure of performance prepared in accordance with GAAP.
Definitions
Retail Gross Margin (Non-GAAP): Retail Gross Margin (Non-GAAP) is reconciled to consolidated gross margin as follows: consolidated revenue less non-retail revenue reduced by consolidated cost of goods sold less non-retail cost of goods sold, divided by consolidated revenue less non-retail revenue.
Retail Gross Margin Rate (Non-GAAP): Retail Gross Margin (Non-GAAP) divided by Retail Revenue (Non-GAAP).
Retail Revenue (Non-GAAP): Consolidated revenue less non-retail revenue, such as wholesale revenue. These non-GAAP measures provide a standalone basis of the Company’s performance as a cannabis retailer in the U.S. considering the Company’s long-term viability is correlated with cash flows provided by or used in retail operations.
| 4 |
Retail Adjusted EBITDA Margin from Continuing Operations (Non-GAAP): Retail Gross Margin (Non-GAAP) less direct store operating expenses, including rent, payroll, security, insurance, office supplies and payment processing fees, local cannabis and excise taxes, distribution expenses, and inventory adjustments. This non-GAAP measure provides a standalone basis of the Company’s performance as a cannabis retailer in the U.S. considering the Company’s long-term viability is correlated with cash flows provided by or used in retail operations.
Retail Adjusted EBITDA Margin Rate from Continuing Operations (Non-GAAP): Retail Adjusted EBITDA Margin (Non-GAAP) divided by Retail Revenue (Non-GAAP).
Corporate SG&A (Non-GAAP): Selling, general and administrative expenses related to the Company’s corporate functions. This non-GAAP measure represents scalable expenditures that are not directly correlated with the Company’s retail operations.
Webcast and Calling Information:
At 5:00 p.m. Eastern, MedMen will host a conference call and audio webcast with Chief Executive Officer, Tom Lynch, Chief Financial Officer, Reece Fulgham, and Chief Operating Officer, Tim Bossidy, to discuss the results in further detail.
A live audio webcast of the call will be available on the Events and Presentations section of MedMen’s website at: https://investors.medmen.com/events-and-presentations/default.aspx and will be archived for replay.
The call may also be accessed by calling in as follows:
Toll Free Dial-In Number: (844) 559-7829
International Dial-In Number: (647) 689-5387
Conference ID: 2626798
ABOUT MEDMEN:
MedMen is a cannabis retailer with flagship locations in California, Nevada, Arizona, Illinois and Florida. MedMen offers a robust selection of high-quality products, including MedMen-owned brands LuxLyte, and MedMen Red through its premium retail stores, proprietary delivery service, as well as curbside and in-store pick up. MedMen Buds, the Company’s loyalty program, provides exclusive access to promotions, product drops and content. MedMen believes that a world where cannabis is legal and regulated is safer, healthier, and happier. Learn more about MedMen at www.medmen.com.
| 5 |
Cautionary Note Regarding Forward-Looking Information and Statements
This press release contains certain “forward-looking information” within the meaning of applicable Canadian securities legislation and may also contain statements that may constitute “forward-looking statements” within the meaning of the safe harbor provisions of the United States Private Securities Litigation Reform Act of 1995. Such forward-looking information and forward-looking statements are not representative of historical facts or information or current condition, but instead represent only MedMen’s beliefs and assumptions regarding future events, plans or objectives, many of which, by their nature, are inherently uncertain and outside of MedMen’s control. Generally, such forward-looking information or forward-looking statements can be identified by the use of forward-looking terminology such as “target of”, “objectives”, “plans”, “expects” or “does not expect”, “is expected”, “budget”, “scheduled”, “estimates”, “forecasts”, “intends”, “anticipates” or “does not anticipate”, or “believes”, or variations of such words and phrases or may contain statements that certain actions, events or results “may”, “could”, “would”, “might” or “will be taken”, “will continue”, “will occur” or “will be achieved”. The forward-looking information and forward-looking statements contained herein may include, but are not limited to, statements regarding plans to accelerate growth and improve EBITDA profitability, expectations regarding the timing and results of the Company’s focus on retail operations, continued cost cutting efforts, and other considerations that could impact maintaining positive Adjusted EBITDA or achieving company-wide profitability.
This forward-looking information is based on certain assumptions made by management and other factors used by management in developing such information.
Although MedMen believes that the assumptions and factors used in preparing, and the expectations contained in, the forward-looking information and statements are reasonable, undue reliance should not be placed on such information and statements, and no assurance or guarantee can be given that such forward-looking information and statements will prove to be accurate, as actual results and future events could differ materially from those anticipated in such information and statements. Risks, uncertainties and other factors which may cause the actual results, performance or achievements of the Company, as applicable, to be materially different from any future results, performance or achievements expressed or implied by such forward-looking information and statements include, among others: uncertain and changing U.S. regulatory landscape and enforcement related to cannabis, including political risks; risks and uncertainties related to the outbreak of COVID-19 and the impact it may have on the global economy and retail sector and regulations, particularly the cannabis retail sector in the states in which the Company operates and if there is any resurgence of the pandemic in the future, the ability to raise sufficient capital to advance the business of the Company and to fund planned operating and capital expenditures and acquisitions; achieving the anticipated results of the Company’s strategic plans; dependence in large part on the ability to obtain or renew government permits and licenses for its current and contemplated operations; the Company’s limited operating history; inability to effectively manage growth; increasing competition in the industry and those other risk factors discussed in the Company's reports filed with the SEC, and other continuous disclosure filings, all available under the Company’s profile on www.sedar.com and www.sec.gov. The forward-looking information and forward-looking statements contained in this press release are made as of the date of this press release, and MedMen does not undertake to update any forward-looking information and/or forward-looking statements that are contained or referenced herein, except in accordance with applicable securities laws. All subsequent written and oral forward-looking information and statements attributable to MedMen or persons acting on its behalf are expressly qualified in its entirety by this notice.
| 6 |
MEDMEN ENTERPRISES INC.
AUDITED CONSOLIDATED BALANCE SHEETS
AS OF JUNE 26, 2021 AND JUNE 27, 2020
(Amounts Expressed in United States Dollars)
| June 26, | June 27, | |||||||
| ($ in Millions) | 2021 | 2020 | ||||||
| ASSETS | ||||||||
| Cash and Cash Equivalents | $ | 11.9 | $ | 9.6 | ||||
| Assets Held for Sale | 49.0 | 70.6 | ||||||
| Other Current Assets | 35.8 | 38.8 | ||||||
| Operating Lease Right-of-Use Assets | 77.4 | 100.4 | ||||||
| Property and Equipment, Net | 137.8 | 166.0 | ||||||
| Intangible Assets, Net | 115.4 | 140.1 | ||||||
| Goodwill | 32.9 | 32.9 | ||||||
| Other Non-Current Assets | 12.3 | 16.0 | ||||||
| TOTAL ASSETS | $ | 472.5 | $ | 574.3 | ||||
| LIABILITIES, MEZZANINE EQUITY AND SHAREHOLDERS’ EQUITY | ||||||||
| Liabilities Held for Sale | $ | 33.0 | $ | 43.4 | ||||
| Other Current Liabilities | 142.7 | 141.6 | ||||||
| Other Non-Current Liabilities | 50.0 | 46.1 | ||||||
| Lease Liabilities, Current and Non-Current | 138.5 | 184.7 | ||||||
| Notes Payable, Current and Non-Current | 191.1 | 169.0 | ||||||
| Senior Secured Convertible Credit Facility | 170.8 | 166.4 | ||||||
| TOTAL LIABILITIES | 726.1 | 751.2 | ||||||
| TOTAL MEZZANINE EQUITY AND SHAREHOLDERS’ EQUITY | (253.6 | ) | (176.9 | ) | ||||
| TOTAL LIABILITIES, MEZZANINE EQUITY AND SHAREHOLDERS’ EQUITY | $ | 472.5 | $ | 574.3 | ||||
| 7 |
MEDMEN ENTERPRISES INC.
CONSOLIDATED STATEMENTS OF OPERATIONS
THREE MONTHS AND YEAR ENDED JUNE 26, 2021 AND JUNE 27, 2020
(Amounts Expressed in United States Dollars)
| Three Months Ended | Year Ended | |||||||||||||||
| June 26, | June 27, | June 26, | June 27, | |||||||||||||
| ($ in Millions, except for Per Share and Share Amounts) | 2021 | 2020 | 2021 | 2020 | ||||||||||||
| (unaudited) | (unaudited) | |||||||||||||||
| Revenue | $ | 42.0 | $ | 27.3 | $ | 145.1 | $ | 155.3 | ||||||||
| Cost of Goods Sold | 22.3 | 16.3 | 77.8 | 99.9 | ||||||||||||
| Gross Profit | 19.7 | 11.0 | 67.3 | 55.4 | ||||||||||||
| Expenses: | ||||||||||||||||
| Selling, General and Administrative | 33.5 | 38.8 | 125.7 | 203.4 | ||||||||||||
| Depreciation and Amortization | 6.1 | 15.0 | 31.1 | 37.7 | ||||||||||||
| Other Operating Income (Expenses) | 1.8 | 222.8 | (21.9 | ) | 246.6 | |||||||||||
| Total Expenses | 41.4 | 276.6 | 134.9 | 487.7 | ||||||||||||
| Loss from Operations | (21.7 | ) | (265.6 | ) | (67.6 | ) | (432.3 | ) | ||||||||
| Other Expense (Income): | ||||||||||||||||
| Other Expense, net | 10.0 | 0.9 | 40.0 | 31.8 | ||||||||||||
| Interest Expense | 10.0 | 12.9 | 36.6 | 34.2 | ||||||||||||
| Interest Income | - | - | (0.6 | ) | (0.8 | ) | ||||||||||
| Total Other Expense | 20.0 | 13.8 | 76.0 | 65.2 | ||||||||||||
| Loss from Continuing Operations Before Provision for Income Taxes | (41.7 | ) | (279.4 | ) | (143.6 | ) | (497.5 | ) | ||||||||
| Provision for Income Tax (Expense) Benefit | 0.3 | (17.4 | ) | (1.8 | ) | 40.9 | ||||||||||
| Net Loss from Continuing Operations | (41.4 | ) | (296.8 | ) | (145.4 | ) | (456.6 | ) | ||||||||
| Net Income (Loss) from Discontinued Operations, Net of Taxes | (4.8 | ) | (21.0 | ) | (12.2 | ) | (69.9 | ) | ||||||||
| Net Loss | (46.2 | ) | (317.8 | ) | (157.6 | ) | (526.5 | ) | ||||||||
| Net Income (Loss) Attributable to Non-Controlling Interest | (7.3 | ) | (161.0 | ) | (33.5 | ) | (279.3 | ) | ||||||||
| Net Loss Attributable to Shareholders of MedMen Enterprises Inc. | $ | (38.9 | ) | $ | (156.8 | ) | $ | (124.1 | ) | $ | (247.2 | ) | ||||
| Income (Loss) Per Share - Basic and Diluted: | ||||||||||||||||
| From Continuing Operations Attributable to Shareholders of MedMen Enterprises Inc. | $ | (0.05 | ) | $ | (0.39 | ) | $ | (0.22 | ) | $ | (0.66 | ) | ||||
| From Discontinued Operations Attributable to Shareholders of MedMen Enterprises Inc. | $ | (0.01 | ) | $ | (0.06 | ) | $ | (0.02 | ) | $ | (0.26 | ) | ||||
| Weighted-Average Shares Outstanding - Basic and Diluted | 677,278,189 | 352,737,255 | 530,980,011 | 270,418,842 | ||||||||||||
| 8 |
MEDMEN ENTERPRISES INC.
AUDITED CONSOLIDATED STATEMENTS OF CASH FLOWS
YEAR ENDED JUNE 26, 2021 AND JUNE 27, 2020
(Amounts Expressed in United States Dollars)
| Year Ended | ||||||||
| June 26, | June 27, | |||||||
| ($ in Millions) | 2021 | 2020 | ||||||
| Net Cash Used in Operating Activities | $ | (59.7 | ) | $ | (109.7 | ) | ||
| Net Cash Provided by (Used in) Investing Activities | 11.2 | (19.3 | ) | |||||
| Net Cash Provided by Financing Activities | 50.7 | 107.1 | ||||||
| Net Decrease in Cash and Cash Equivalents | 2.3 | (21.9 | ) | |||||
| Cash Included in Assets Held for Sale | - | (0.7 | ) | |||||
| Cash and Cash Equivalents, Beginning of Period | 9.6 | 32.2 | ||||||
| Cash and Cash Equivalents, End of Period | $ | 11.9 | $ | 9.6 | ||||
| 9 |
MEDMEN ENTERPRISES INC.
NON-GAAP RECONCILIATION
THREE MONTHS AND YEAR ENDED JUNE 26, 2021 AND JUNE 27, 2020
(Amounts Expressed in United States Dollars)
| Three Months Ended | Year Ended | |||||||||||||||
| June 26, | June 27, | June 26, | June 27, | |||||||||||||
| ($ in Millions) | 2021 | 2020 | 2021 | 2020 | ||||||||||||
| Net Loss | $ | (46.2 | ) | $ | (317.8 | ) | $ | (157.6 | ) | $ | (526.5 | ) | ||||
| Less: Net Loss from Discontinued Operations, Net of Taxes | 4.8 | 21.0 | 12.2 | 69.9 | ||||||||||||
| Add (Deduct) Impact of: | ||||||||||||||||
| Net Interest and Other Financing Costs | 9.9 | 12.9 | 35.9 | 33.5 | ||||||||||||
| Provision for Income Taxes | (0.3 | ) | 17.4 | 1.8 | (40.9 | ) | ||||||||||
| Amortization and Depreciation | 18.7 | 17.2 | 58.6 | 45.3 | ||||||||||||
| Total Adjustments | 28.3 | 47.5 | 96.3 | 37.9 | ||||||||||||
| EBITDA from Continuing Operations (Non-GAAP) | $ | (13.1 | ) | $ | (249.3 | ) | $ | (49.1 | ) | $ | (418.7 | ) | ||||
| EBITDA from Continuing Operations (Non-GAAP) | $ | (13.1 | ) | $ | (249.3 | ) | $ | (49.1 | ) | $ | (418.7 | ) | ||||
| Add (Deduct) Impact of: | ||||||||||||||||
| Transaction Costs & Restructuring Costs | 3.0 | 5.2 | 11.0 | 27.6 | ||||||||||||
| Share-Based Compensation | 1.0 | (0.4 | ) | 3.8 | 10.4 | |||||||||||
| Other Non-Cash Operating Costs | (0.6 | ) | 221.8 | (11.7 | ) | 268.0 | ||||||||||
| Total Adjustments | $ | 3.4 | $ | 226.6 | $ | 3.1 | $ | 306.0 | ||||||||
| Adjusted EBITDA from Continuing Operations (Non-GAAP) | $ | (9.7 | ) | $ | (22.7 | ) | $ | (46.0 | ) | $ | (112.7 | ) | ||||
| 10 |
MEDMEN ENTERPRISES INC.
NON-GAAP RECONCILIATIONS
(Amounts Expressed in United States Dollars)
| Fiscal Quarter Ended | Fiscal Year Ended | |||||||||||||||
| June 26, | March 27, | June 26, | June 27, | |||||||||||||
| ($ in Millions) | 2021 | 2021 | 2021 | 2020 | ||||||||||||
| Consolidated Revenue from Continuing Operations | $ | 42.0 | $ | 35.4 | $ | 145.1 | $ | 155.3 | ||||||||
| Less: Cultivation & Wholesale Revenue | (1.3 | ) | (1.6 | ) | (4.3 | ) | (3.3 | ) | ||||||||
| Retail Revenue from Continuing Operations | $ | 40.7 | $ | 33.8 | $ | 140.8 | $ | 152.0 | ||||||||
| Consolidated Cost of Goods Sold from Continuing Operations | $ | 22.3 | $ | 21.1 | $ | 77.9 | $ | 99.9 | ||||||||
| Less: Cultivation & Wholesale Cost of Goods Sold | (3.9 | ) | (6.1 | ) | (14.9 | ) | (22.9 | ) | ||||||||
| Retail Cost of Goods Sold from Continuing Operations | $ | 18.4 | $ | 15.0 | $ | 63.0 | $ | 77.2 | ||||||||
| Retail Gross Margin (Non-GAAP) | $ | 22.3 | $ | 18.8 | $ | 77.8 | $ | 74.8 | ||||||||
| Retail Gross Margin Rate (Non-GAAP) | 55 | % | 56 | % | 55 | % | 49 | % | ||||||||
| Fiscal Quarter Ended | Fiscal Year Ended | |||||||||||||||
| June 26, | March 27, | June 26, | June 27, | |||||||||||||
| ($ in Millions) | 2021 | 2021 | 2021 | 2020 | ||||||||||||
| Net Loss | $ | (46.2 | ) | $ | (9.7 | ) | $ | (157.6 | ) | $ | (526.5 | ) | ||||
| Net (Income) Loss from Discontinued Operations, Net of Taxes | 4.8 | (6.9 | ) | 12.2 | 69.9 | |||||||||||
| Provision for Income Tax (Benefit) Expense | (0.3 | ) | (32.7 | ) | 1.8 | (40.9 | ) | |||||||||
| Other Expense | 20.0 | 22.7 | 76.0 | 65.2 | ||||||||||||
| Excluded Items | 1.8 | 3.0 | (21.9 | ) | 246.6 | |||||||||||
| Loss from Operations Before Excluded Items | $ | (19.9 | ) | $ | (23.6 | ) | $ | (89.5 | ) | $ | (185.7 | ) | ||||
| Non-Retail Gross Margin | (2.6 | ) | (4.5 | ) | (10.6 | ) | (19.4 | ) | ||||||||
| Non-Retail Operating Expenses | (26.2 | ) | (27.3 | ) | (107.0 | ) | (172.2 | ) | ||||||||
| Non-Retail EBITDA Margin | (28.8 | ) | (31.8 | ) | (117.6 | ) | (191.6 | ) | ||||||||
| Retail Adjusted EBITDA Margin from Continuing Operations (Non-GAAP) | $ | 8.9 | $ | 8.2 | $ | 28.1 | $ | 5.9 | ||||||||
| Retail Adjusted EBITDA Margin Rate (Non-GAAP) | 22 | % | 24 | % | 20 | % | 4 | % | ||||||||
| Retail Adjusted EBITDA Margin from Discontinued Operations | 0.7 | 0.3 | 1.1 | (2.5 | ) | |||||||||||
| Total Retail Adjusted EBITDA Margin (Non-GAAP) | $ | 9.6 | $ | 8.5 | $ | 29.2 | $ | 3.4 | ||||||||
| Total Retail Adjusted EBITDA Margin Rate (Non-GAAP) | 21 | % | 22 | % | 19 | % | 22 | % | ||||||||
| Fiscal Quarter Ended | Fiscal Year Ended | |||||||||||||||
| June 26, | March 27, | June 26, | June 27, | |||||||||||||
| ($ in Millions) | 2021 | 2021 | 2021 | 2020 | ||||||||||||
| Payroll | $ | 4.7 | $ | 3.5 | $ | 16.0 | $ | 35.6 | ||||||||
| General & Administrative | 1.0 | 1.1 | 4.1 | 10.3 | ||||||||||||
| Insurance | 0.3 | 0.7 | 2.4 | 5.3 | ||||||||||||
| Professional Fees | 5.4 | 5.2 | 17.1 | 20.1 | ||||||||||||
| Rent | 0.2 | 0.5 | 1.7 | 4.1 | ||||||||||||
| Other | 0.5 | - | 1.3 | 13.4 | ||||||||||||
| Corporate SG&A | $ | 12.1 | $ | 11.0 | $ | 42.6 | $ | 88.8 | ||||||||
| Add: Store Pre-Opening Costs | 4.7 | 5.4 | 20.5 | 16.3 | ||||||||||||
| Corporate SG&A as a Component of Adjusted EBITDA from Continuing Operations (Non-GAAP) | $ | 16.8 | $ | 16.4 | $ | 63.1 | $ | 105.1 | ||||||||
| 11 |
SOURCE: MedMen Enterprises
MEDIA CONTACT:
Lisa Weser, [email protected]
INVESTOR RELATIONS CONTACT:
Morry Brown, [email protected]
| 12 |
Exhibit 99.2

MedMen Corporate Presentation Premier Retail Cannabis

Disclaimer IMPORTANT: YOU MUST READ THE FOLLOWING BEFORE CONTINUING The information contained in this presentation has been prepared by MedMen Enterprises Inc. (“MedMen” or “the Company”) and contains information pertaining to the business, operations, assets and prospects of the Company. The information contained in this presentation (a) is provided as at the date hereof, unless otherwise stated, and is subject to change without notice, (b) does not purport to contain all the information that may be necessary or desirable to fully and accurately evaluate an investment in the Company, and (c) is not to be considered as a recommendation by the Company that any person make an investment in MedMen. Other than as may be required by applicable laws, the Company is under no obligation to update any information included in this presentation. An investment in the securities of the Company is speculative and involves a number of risks. Other than as may be authorized by the Company upon request, this presentation may not be reproduced, in whole or in part, in any form or forwarded or further distributed to any other person. Any forwarding, distribution or reproduction of this presentation in whole or in part is unauthorized. The Company takes no responsibility for, and provides no assurance as to the reliability of, any information that others may give readers of this presentation. FORWARD - LOOKING INFORMATION AND RISK ACKNOWLEDGEMENTS This document contains certain “forward - looking information” within the meaning of applicable Canadian securities legislation an d may also contain statements that may constitute “forward - looking statements” within the meaning of the safe harbor provisions of the United States Private Securities Litigation Reform Act of 1995. Such forward - looking information and forward - looking statements are not representative of historical facts or information or current condition, but instead represent only MedMen’s beliefs and assumptions regarding future events, plans or objectives, many of which, by their nature, are inherently uncertain and outsid e o f MedMen’s control. Generally, such forward - looking information or forward - looking statements can be identified by the use of forward - looking terminology such as “target of”, “objectives”, “plans”, “expects” or “does not expect”, “is expected”, “budget”, “sch edu led”, “estimates”, “forecasts”, “intends”, “anticipates” or “does not anticipate”, or “believes”, or variations of such words an d phrases or may contain statements that certain actions, events or results “may”, “could”, “would”, “might” or “will be taken”, “will continu e”, “will occur” or “will be achieved”. The forward - looking information and forward - looking statements contained herein may include , but are not limited to, expectations regarding the timing and results of the Company’s focus on retail operations, continued cost cutting ef forts, and other considerations that could impact plans to open new stores in California in 2021, in Florida in 2021 and 2022 , i n Massachusetts in 2021 and 2022 and plans to expand MedMen Red, Arizona operations or Florida operations. This forward - looking information is based on certain assumptions made by management and other factors used by management in deve loping such information. Although MedMen believes that the assumptions and factors used in preparing, and the expectations contained in, the forward - look ing information and statements are reasonable, undue reliance should not be placed on such information and statements, and no assurance or guarantee can be given that such forward - looking information and statements will prove to be accurate, as actual re sults and future events could differ materially from those anticipated in such information and statements. Risks, uncertainti es and other factors which may cause the actual results, performance or achievements of the Company, as applicable, to be materially diffe ren t from any future results, performance or achievements expressed or implied by such forward - looking information and statements include, among others: uncertain and changing U.S. regulatory landscape and enforcement related to cannabis, including politi cal risks; risks and uncertainties related to the recent outbreak of COVID - 19 and the impact it may have on the global economy and retail sector, particularly the cannabis retail sector in the states in which the Company operates and on regulation of the Company’ s a ctivities in the states in which it operates, particularly if there is any resurgence of the pandemic in the future, the abil ity to raise sufficient capital to advance the business of the Company and to fund planned operating and capital expenditures and acquisitions; achie vin g the anticipated results of the Company’s strategic plans; dependence in large part on the ability to obtain or renew govern men t permits and licenses for its current and contemplated operations; the Company’s limited operating history; inability to effectively m ana ge growth; and increasing competition in the industry. The forward - looking information and forward - looking statements contained in this press release are made as of the date of this press release, and MedMen does not undertake to update any forward - looking informa tion and/or forward - looking statements that are contained or referenced herein, except in accordance with applicable securities laws. All subsequent written and oral forward - looking information and statements attributable to MedMen or persons acting on its behal f are expressly qualified in its entirety by this notice. NON - GAAP FINANCIAL AND PERFORMANCE MEASURES In addition to providing financial measurements based on GAAP, the Company provides additional financial metrics that are not prepared in accordance with GAAP . Management uses non - GAAP financial measures, in addition to GAAP financial measures, to understand and compare operating results across accounting periods, for financial and operational decision - making, for planning and forecasting purposes and to evaluate the Company’s financial performance . Examples of such non - GAAP financial measures include Retail Adjusted EBITDA, Retail Adjusted EBITDA Rate, Adjusted EBITDA and Corporate SG&A . Management believes that these non - GAAP financial measures reflect the Company’s ongoing business in a manner that allows for meaningful comparisons and analysis of trends in the business, as they facilitate comparing financial results across accounting periods and to those of peer companies . Management also believes that these non - GAAP financial measures enable investors to evaluate the Company’s operating results and future prospects in the same manner as management . These non - GAAP financial measures may also exclude expenses and gains that may be unusual in nature, infrequent or not reflective of the Company’s ongoing operating results . As there are no standardized methods of calculating these non - GAAP measures, the Company’s methods may differ from those used by others, and accordingly, the use of these measures may not be directly comparable to similarly titled measures used by others . Accordingly, these non - GAAP measures are intended to provide additional information and should not be considered in isolation or as a substitute for measures of performance prepared in accordance with GAAP . Please refer to the Company’s MD&A filed for fiscal 2021 for further details and for reconciliation to GAAP measures. MARKET DATA AND INDUSTRY FORECASTS Market data and industry forecasts used in this presentation were obtained from government or other industry publications, various publicly available sources or based on estimates derived from such publications and reports and management's knowledge of, and experience in, the markets in which the Company operates. Government and industry publications and reports generally indicate that they have obtained their information from sources believed to be reliable, but do not guarantee the accuracy and completeness of their information. Actual outcomes may vary materially from those forecast in such reports or publications, and the prospect for material variation can be expected to increase as the length of the forecast period increases. Although the Company believes that these sources are generally reliable, the accuracy and completeness of such information is not guaranteed and have not been independently verified by the Company and as such the Company does not make any representation as to the accuracy of such information. Further, market and industry data is subject to variations and cannot be verified due to limits on the availability and reliability of data inputs, the voluntary nature of the data gathering process and other limitations and uncertainties inherent in any statistical survey. See also “ Forward - Looking Information and Risk Acknowledgments". CURRENCY All references to $ or “dollar” in this presentation are references to USD, unless otherwise indicated. CANNABIS - RELATED ACTIVITIES ARE ILLEGAL UNDER U.S. FEDERAL LAWS The U.S. Federal Controlled Substances Act classifies “marihuana” as a Schedule I drug. Accordingly, cannabis - related activities, including without limitation, the cultivation, manufacture, importation, possession, use or distribution of cannabis and cannabis products are illegal under U.S. federal law. Strict compliance with state and local laws with respect to cannabis will neither absolve the Company of liability under U.S. federal law, nor will it provide a defense to any federal prosecution which may be brought against the Company with respect to adult - use or recreational cannabis. Any such proceedings brought against the Company may adversely affect the Company’s operations and financial performance. [ 1 ]

MedMen Snapshot

MEDMEN OWNS KEY LICENSES IN ESTABLISHED AND RAPIDLY - SCALING CANNABIS MARKETS ACROSS THE UNITED STATES Expansive, Strategic License Footprint MedMen currently holds 22 2 retail licenses in highly - strategic locations across the United States SELECTED DISPENSARIES FINANCIAL EXECUTION 3 LOS ANGELES, CA 1 LOS ANGELES, CA OAK PARK, IL FT. LAUDERDALE, FL PENSACOLA, FL LAS VEGAS, NV Source: Company management 1. Abbot Kinney location currently under Management Agreement 2. Excludes Florida as retail is uncapped; excludes New York locations and Evanston location under management agreement; include s p rovisional licenses in Massachusetts, as well as LAX and Abbot Kinney locations under management agreements 3. As reported in Company’s MD&A filings. Retail Adjusted EBITDA is a non - GAAP financial measure. See “Non - GAAP Financial and Perfo rmance Measures.” ~2.1 million total retail visits in FY2021 ~250,000 average monthly visits to MedMen.com [ 3 ] $42 million revenue in Q4 2021 18.5% sequential increase $9 million retail adjusted EBITDA (continuing ops) 22.0% retail adjusted EBITDA margin (continuing ops)

Inviting Space Open Layout Visual Collateral Premier Retail Destination for Discovery, Quality and Service MEDMEN OFFERS AN ELEVATED CANNABIS RETAIL EXPERIENCE, PROVIDING EDUCATION, CURATION AND TRANSPARENCY 1,000+ SKUs Across California Curated Retail Experience Highly - Trained “Cannasseurs” Provide a Luxury Retail Experience 4.5 Star 2 Average Customer Rating ~$90 3 Average Transaction Size Technology - Enabled iPads, Mobile Check - out MedMen has established itself as the premier retail experience in the cannabis sector, combining a unique, high - end design aesthetic with an expansive product offering and exceptional customer service ~72% 1 Customer Conversion Rate Source: Company management 1. FY2021 figures in - store 2. Reflects weighted average Google rating over ~5300 reviews as of September 2021 3. Represents FY2021 [ 4 ]

Amongst select peers, MedMen has consistently been the most searched for cannabis company in the United States over the last two years Nationally Recognized Brand ▪ MedMen’s roots are in marketing, branding and creative design – the Company pioneered large - scale advertising to help de - stigmatize cannabis in the U.S. ▪ The Company’s stores are the first and only elevated dispensary experience with sleek branding, an innovative retail aesthetic and quality product offerings ▪ MedMen generates strong brand loyalty versus “what's closest”, driving high conversion rates and greater average transaction size relative to peers ▪ Received numerous awards, including Los Angeles Magazine’s Readers Picks for Best Dispensaries in 2021, High Times’ Top Ten Dispensary in Los Angeles and Green State’s leading dispensary for “Excellence in Service” MedMen is one of the most recognized consumer brands per Google Trends data in the burgeoning U.S. cannabis industry SELECT ADVERTISING CAMPAIGNS BRAND BACKGROUND CANNABIS COMPANY WEB SEARCHES OVER TIME Source: Company management, Google Trends 0 25 50 75 100 3/10/2019 6/21/2019 10/2/2019 1/13/2020 4/25/2020 8/6/2020 11/17/2020 2/28/2021 MedMen Trulieve Cresco Labs Green Thumb Industries Verano Holdings [ 5 ]
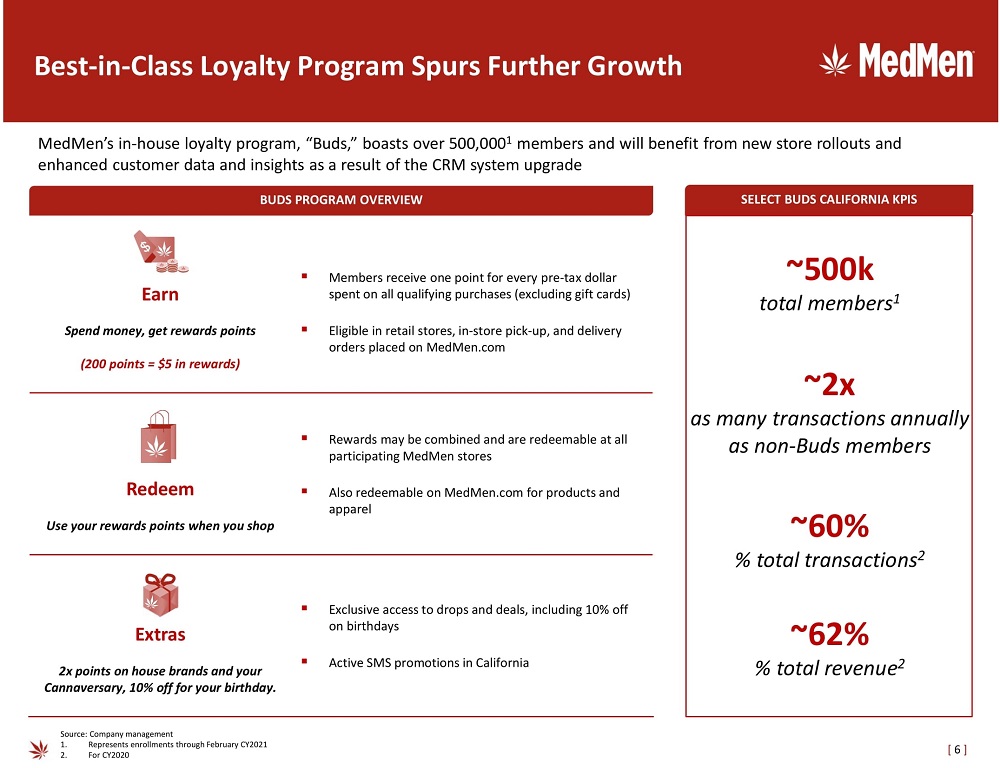
Earn Spend money, get rewards points (200 points = $5 in rewards) ▪ Members receive one point for every pre - tax dollar spent on all qualifying purchases (excluding gift cards) ▪ Eligible in retail stores, in - store pick - up, and delivery orders placed on MedMen.com Redeem Use your rewards points when you shop ▪ Rewards may be combined and are redeemable at all participating MedMen stores ▪ Also redeemable on MedMen.com for products and apparel Extras 2x points on house brands and your Cannaversary, 10% off for your birthday. ▪ Exclusive access to drops and deals, including 10% off on birthdays ▪ Active SMS promotions in California Best - in - Class Loyalty Program Spurs Further Growth SELECT BUDS CALIFORNIA KPIS MedMen’s in - house loyalty program, “Buds,” boasts over 500,000 1 members and will benefit from new store rollouts and enhanced customer data and insights as a result of the CRM system upgrade ~60% % total transactions 2 ~62% % total revenue 2 BUDS PROGRAM OVERVIEW ~500k total members 1 ~2x as many transactions annually as non - Buds members Source: Company management 1. Represents enrollments through February CY2021 2. For CY2020 [ 6 ]

Financial Highlights

Q4 2021 Financial Performance RETAIL KPI’S 1 CORPORATE KPI’S 1 $40.7 million retail revenue 20.2% sequential increase $42.0 million total revenue 55.4% YoY improvement $25.2 million CA retail revenue 24.4% sequential increase $12.1 million corporate SG&A 19.1% YoY improvement $8.9 million retail adjusted EBITDA 8.6% sequential increase $(9.7) million adjusted EBITDA 57.3% YoY improvement Source: Company management Note: --- Excludes discontinued operations in New York 1. As reported in Company’s MD&A filings. Retail Adjusted EBITDA is a non - GAAP financial measure. See “Non - GAAP Financial and Perfo rmance Measures.” $(4.7) million attributable to pre - opening expense [ 8 ]
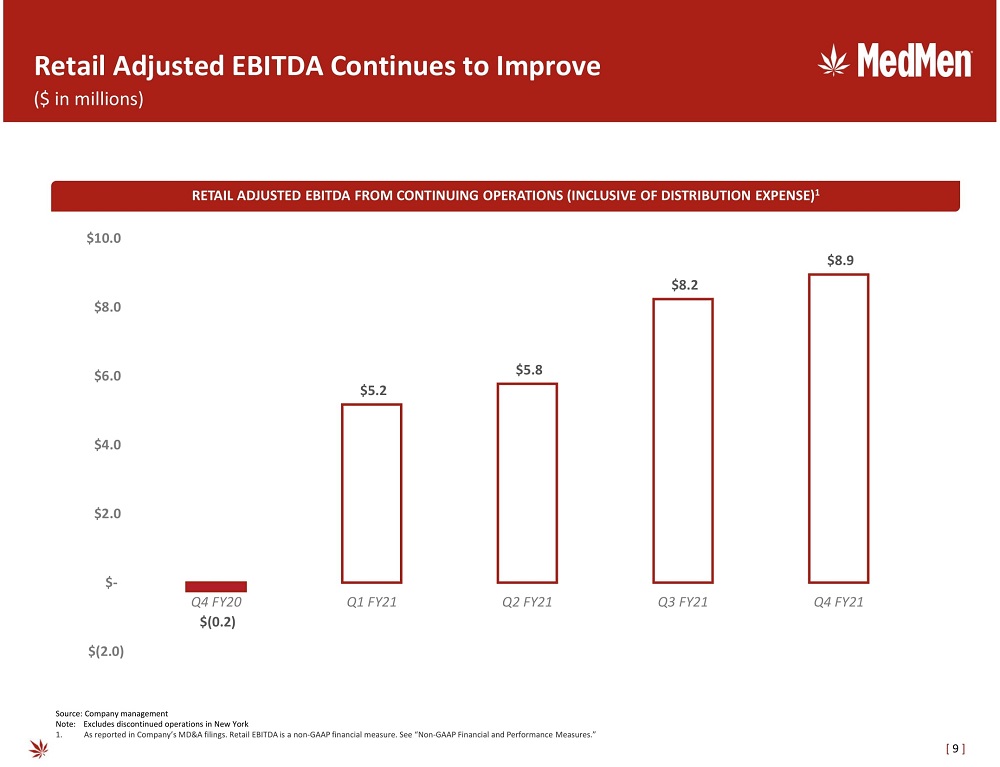
Retail Adjusted EBITDA Continues to Improve RETAIL ADJUSTED EBITDA FROM CONTINUING OPERATIONS (INCLUSIVE OF DISTRIBUTION EXPENSE) 1 Source: Company management Note: --- Excludes discontinued operations in New York 1. As reported in Company’s MD&A filings. Retail EBITDA is a non - GAAP financial measure. See “Non - GAAP Financial and Performance Me asures.” $(0.2) $5.2 $5.8 $8.2 $8.9 $(2.0) $- $2.0 $4.0 $6.0 $8.0 $10.0 Q4 FY20 Q1 FY21 Q2 FY21 Q3 FY21 Q4 FY21 ($ in millions) [ 9 ]

MedMen Markets

l Overview of MedMen California Operations ▪ MedMen has the largest retail footprint in the ~$4.4bn 1 legal California market, with some of the most attractive retail locations in the state — The Company currently operates 12 locations in California and has 14 licenses, with plans to open two new stores in the Bay Area in the next several quarters • New stores are in highly - trafficked locations in San Francisco, including Union Street, adjacent to the Marina District — MedMen successfully launched delivery in August 2019; delivery, pick - up and online ordering supplemented retail traffic and supported revenue during COVID - 19 • > 100,000 deliveries completed since inception • Omni - channel approach will continue to drive higher ADS and operating leverage ▪ There are significant channels for sustained growth for MedMen in California — Augmented in - store product assortment and higher delivery penetration — Increased operating leverage as topline continues to expand — Continued transition from illicit market to legal market and streamlined regulations / tax code — Highly - accretive tuck - ins Source: Company management, population data per 2019 US Census estimates 1. 2021 estimates from ArcView Market Research State of the Legal Cannabis Markets 2020 – 8th Edition 2. Abbot Kinney and LAX dispensaries currently under Management Agreements MedMen is the most recognized dispensary brand based on Google Trend data in the mature California cannabis market and has set the standard for a premier retail experience MEDMEN CALIFORNIA OPERATION OVERVIEW LOCATION OVERVIEW MedMen plans to open three new dispensaries in the Bay Area in CY2021 San Diego Greater Los Angeles Area Greater Bay Area (San Francisco, Oakland & San Jose) Currently Operational Coming On - Line F Y2022 Greater LA Greater LA Greater Bay Area San Diego Abbot Kinney 2 Long Beach Central San Jose Kearny Mesa Beverly Hills Santa Ana Emeryville Torrey Pines DTLA Venice Beach Union LAX Airport 2 West Hollywood Sutter Residential Area Pop. (MM) Greater Los Angeles 18.7 Greater Bay Area 9.7 San Diego 1.4 Not yet open [ 11 ] 7.8

$2.9 $4.4 $5.3 $6.3 $7.6 2019A 2020A 2021P 2022P 2023P California is the Largest Legal Cannabis Market Globally California is the heartbeat of the U.S. cannabis industry and is the largest legal cannabis market in the world, with $4.4bn in legal cannabis sales estimated in 2021 and a total addressable market of ~$22.0bn 1. 2021 estimates from ArcView Market Research State of the Legal Cannabis Markets 2020 – 8th Edition 2. New Frontier estimates that in CY2020, 80% of cannabis sales in California were via the illicit market, 2019 3. Marathon Strategies Report, 2014 4. Bloomberg, “California Defies Doom with No. 1 US Economy,” 2021 5. Population data per 2019 US Census estimates MARKET COMMENTARY ▪ Legal adult - use sales first began in 2018 and the state quickly became the largest legal cannabis market in the world, with ~$2.5bn in 2018 sales — The legal market continues to grow at a faster pace than originally anticipated, with legal sales totaling ~$4.4bn in CY2021 1 — Total cannabis market estimated to be >$20bn 2 in CY2021, representing substantial opportunity for sustained legal market growth ▪ California is still significantly underpenetrated when compared to other cannabis markets and industries — ~15 dispensaries per 1mm residents vs. ~165 in Oregon 1 — ~1,000 licensed dispensaries vs. ~13,000 licensed liquor stores 3 ▪ Recent proposed changes to the cannabis regulatory authority and tax code aim to further expand the share of the legal market in California — Merging the three state regulatory departments into one regulatory body (planned to be complete in 2021) — Suspending further tax hikes and lowering the excise tax KEY CALIFORNIA MARKET METRICS 5 ANNUAL LEGAL CANNABIS SALES (US$ BN) 1 ▪ State Population age 21+: ~ 28mm ▪ Annual Tourists (2019 est.): ~ 290mm ▪ 10 - 20 Dispensaries per 1mm Residents vs. ~150+ in Oregon, Oklahoma, Colorado 1 ▪ Licensed Operators: >10,000, with ~2,500 active licenses 1 The California market is more than 2x the size of the four states that legalized adult - use in 2020 by population and ~3x by sales AZ MT NJ SD 20%+ of national legal cannabis spending 1 5 th largest economy in the world 4 Inclusive of illicit market, the total cannabis market in California is estimated to be >$20bn in 2020 2 [ 12 ] $2.9 $3.6 $4.4 $5.2 $6.0

Significant Room for Sustained Growth Operators in California have historically faced significant challenges, such as high taxes and lack of local approval; howeve r, these challenges are beginning to be addressed, providing significant upside in the world’s largest legal cannabis market NOTABLE CATALYSTS FOR GROWTH ▪ After launching adult - use sales in 2018, California became the first U.S. market to see legal sales shrink after expanding access to all adults ▪ Operators have traditionally faced several challenges: — Onerous tax regime, with legal sales often being taxed 35%+ 1 — Complex regulatory regime and high compliance costs — Lack of local buy - in, with only ~30% of all counties opting to allow legal retail cannabis activity as of CY2020 2 — Increased illicit market enforcement on the local and state level will continue to increase legal market share statewide ▪ As challenges are mitigated, several clear channels for growth exist: — Reduction of illicit market — Streamlining of regulatory bodies and tax code — Expansion of delivery / on premise consumption destinations — Increased licensing opportunities and dispensary openings 1. According to Marijuana Business Daily, tax rates on the retail sale of cannabis in California can be as high as 35%, inclusiv e o f excise tax and state and city taxes 2. Public Health Institute’s Getting It Right From the Start cannabis research initiative 3. New Frontier estimates that in CY2020, 80% of cannabis sales in California were via the illicit market, 2019 4. 2021 estimates from ArcView Market Research State of the Legal Cannabis Markets 2020 – 8th Edition 2019 LEGAL CANNABIS SALES PER CAPITA (US$) 4 California’s per capita taxable cannabis sales in 2019 were less than half the per capita sales in other mature markets such as Washington, Oregon and Colorado Estimated illicit market share Estimated legal market share Due to high taxes, a restrictive regulatory system and high compliance costs, the illicit market still controls significant CA cannabis market share 3 ~1,000 number of CA licensed dispensaries ~13,000 number of CA licensed liquor stores $51.8 $244.3 $161.0 $140.2 California Colorado Oregon Washington 80.0% 20.0% [ 13 ]

Overview of MedMen Florida Operations MEDMEN FLORIDA OPERATION OVERVIEW ▪ MedMen operates a portfolio of some of the best located dispensaries in the state — MedMen holds a vertical state license and has received dispensary authorizations for 9 locations, with 6 locations currently operational, including: Downtown West Palm Beach and Fort Lauderdale — The Company has a clear plan and capital allocated to open an additional 9 dispensaries in the state within the next ~6 months, bringing the total to 15 — In 2020, MedMen signed a brand partnership with BellRock Brands, Inc. (“BellRock”), providing MedMen an exclusive license for certain Mary’s Medicinals and Dixie Brands products in Florida; MedMen is in active negotiations for further partnerships ▪ The Company operates a sealed greenhouse cultivation facility in Eustis, Florida that is currently undergoing substantial capital investment and expansion — Phase 1 expansion will see the facility increase its total canopy to ~40,000 sq. ft., while adding processing and manufacturing capabilities, including edibles manufacturing — The facility currently produces ~8,000lbs and can produce ~22,000lbs annually once Phase 1 expansion is complete — MedMen’s flower is sold for a premium in the market, with packaged flower being sold for ~$5,100 / lbs 2 on average in CY2020 ▪ MedMen is well positioned to take advantage of Florida’s attractive market dynamics, with a strong, recognizable brand and an established and growing footprint — With no cap on licenses, a strong brand in an extremely competitive marketplace is highly strategic Source: Company financials, Equity research, ArcView Market Research 1. Miami Standard News, 2021 2. Average retail value of MedMen packaged flower MedMen has an established and scaling position in Florida, the third largest cannabis market in the US, with plans to invest in and expand both retail and cultivation footprints 1 LOCATION OVERVIEW Jacksonville Tampa Fort Lauderdale Orlando Pensacola MedMen currently operates 6 dispensaries and one cultivation facility, with plans to expand to 15 dispensaries throughout Florida Miami Coming On - Line CY2022 Eustis Cultivation Facility Currently Operational Coming On - Line CY2021 [ 14 ]
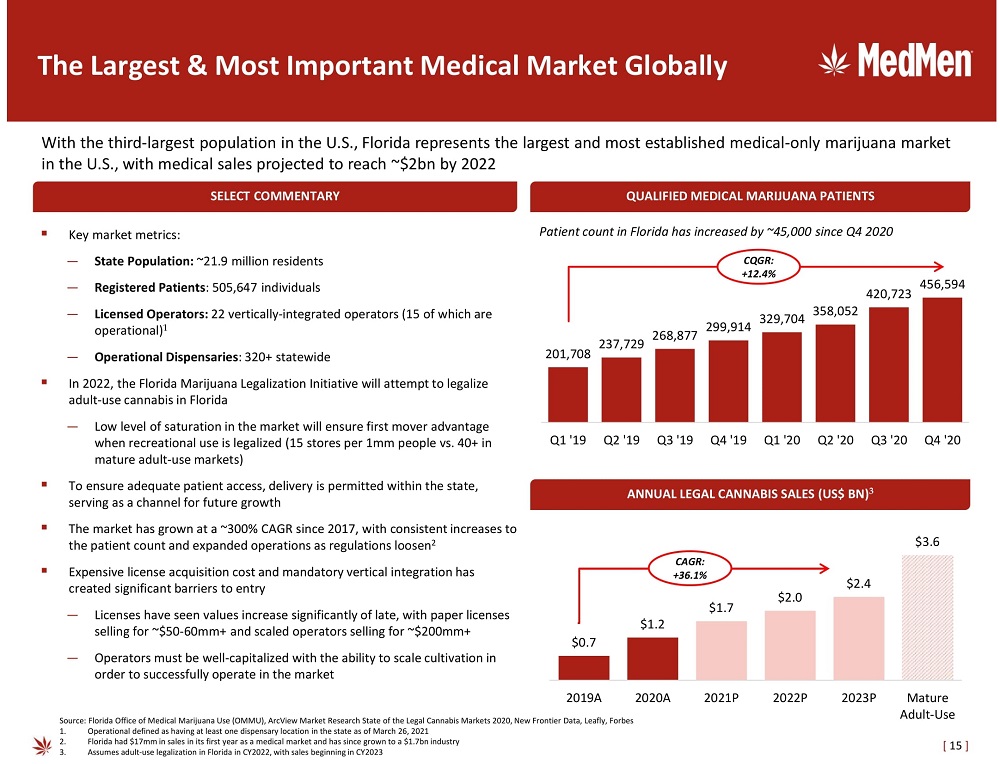
▪ Key market metrics: — State Population: ~21.9 million residents — Registered Patients : 505,647 individuals — Licensed Operators: 22 vertically - integrated operators (15 of which are operational) 1 — Operational Dispensaries : 320+ statewide ▪ In 2022, the Florida Marijuana Legalization Initiative will attempt to legalize adult - use cannabis in Florida — Low level of saturation in the market will ensure first mover advantage when recreational use is legalized (15 stores per 1mm people vs. 40+ in mature adult - use markets) ▪ To ensure adequate patient access, delivery is permitted within the state, serving as a channel for future growth ▪ The market has grown at a ~300% CAGR since 2017, with consistent increases to the patient count and expanded operations as regulations loosen 2 ▪ Expensive license acquisition cost and mandatory vertical integration has created significant barriers to entry — Licenses have seen values increase significantly of late, with paper licenses selling for ~$50 - 60mm+ and scaled operators selling for ~$200mm+ — Operators must be well - capitalized with the ability to scale cultivation in order to successfully operate in the market The Largest & Most Important Medical Market Globally With the third - largest population in the U.S., Florida represents the largest and most established medical - only marijuana market in the U.S., with medical sales projected to reach ~$2bn by 2022 Source: Florida Office of Medical Marijuana Use (OMMU), ArcView Market Research State of the Legal Cannabis Markets 2020, New Fr ontier Data, Leafly, Forbes 1. Operational defined as having at least one dispensary location in the state as of March 26, 2021 2. Florida had $17mm in sales in its first year as a medical market and has since grown to a $1.7bn industry 3. Assumes adult - use legalization in Florida in CY2022, with sales beginning in CY2023 SELECT COMMENTARY QUALIFIED MEDICAL MARIJUANA PATIENTS CQGR: + 12.4 % ANNUAL LEGAL CANNABIS SALES (US$ BN) 3 CAGR: +36.1% Patient count in Florida has increased by ~45,000 since Q4 2020 201,708 237,729 268,877 299,914 329,704 358,052 420,723 456,594 Q1 '19 Q2 '19 Q3 '19 Q4 '19 Q1 '20 Q2 '20 Q3 '20 Q4 '20 $0.7 $1.2 $1.7 $2.0 $2.4 $3.6 2019A 2020A 2021P 2022P 2023P Mature Adult-Use [ 15 ]

White Fire 30.8% 0.08% 35.7% Lemon Skunk 25.6% 0.04% 30.1% Peach Crescendo 24.0% 0.05% 28.5% Premium Production and Delivery are Key Differentiators MedMen will be able to further differentiate from competition with a premium flower offering and the introduction of MedMen’s in - house delivery operation that has proven itself in the competitive California market PREMIUM CULTIVATION IN FLORIDA ▪ Environmental factors make growing premium flower consistently a challenge in Florida — Significant infrastructure, investment and scale are necessary to ensure the correct conditions are met to grow a premium product while keeping consumer price points palatable ▪ MedMen is uniquely positioned to supply its dispensaries with premium flower on a consistent basis via its Eustis facility — Product coming out of Eustis consistently meets California market benchmarks for premium product — After the completion of the Eustis expansion, MedMen will be able to consistently supply 15 dispensaries with a product assortment reflective of the Company’s California roots DELIVERY THC Content CBD Content Total Cannabinoids SELECT STRAIN DETAIL ▪ Implementing a delivery operation in the Florida market will be a significant growth lever for MedMen — Will broaden overall footprint by accessing customers in a wider range than dispensary footprint alone ▪ MedMen has a successful and established delivery service in the highly competitive California market that will translate well to Florida ▪ Secular tailwinds further support the delivery thesis — Vertical integration requirements mean that most operators deliver to patients but quality is sporadic and service limited — COVID - 19 has accelerated consumer shifts towards delivery: for the past year, cannabis deliveries have been permitted 24/7 Source: Company management, Certificate of Analysis from recent sample testing for strains identified [ 16 ]
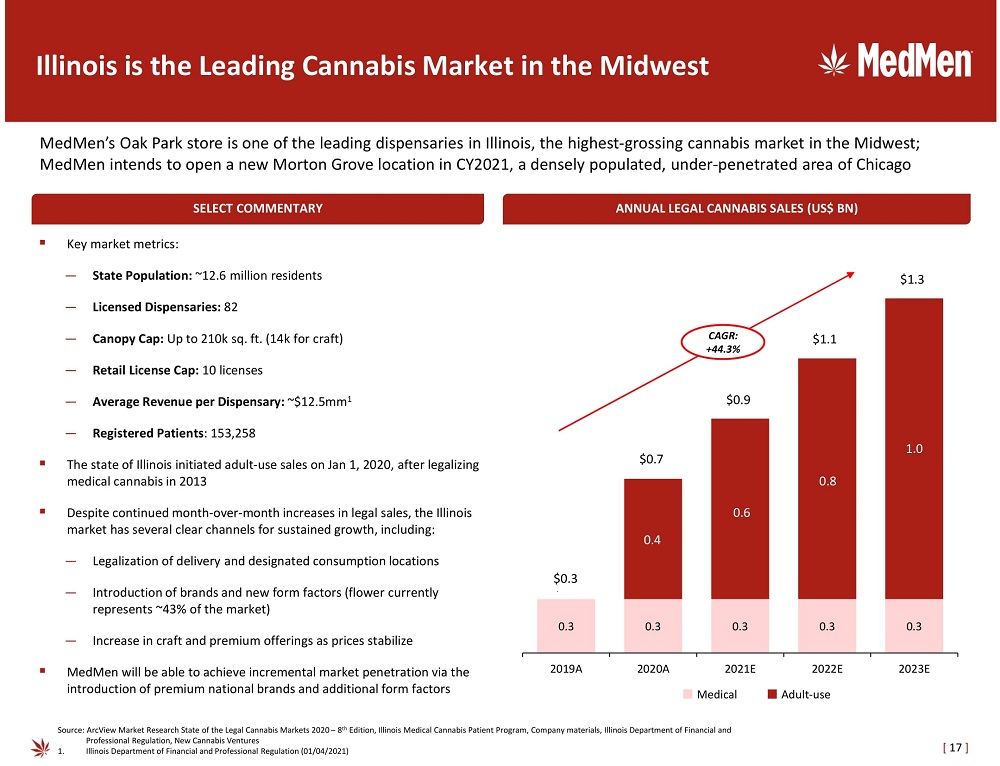
0.3 0.3 0.3 0.3 0.3 0.7 1.0 1.3 1.7 $0.3 $1.0 $1.3 $1.6 $2.0 2019A 2020A 2021E 2022E 2023E Illinois is the Leading Cannabis Market in the Midwest MedMen’s Oak Park store is one of the leading dispensaries in Illinois, the highest - grossing cannabis market in the Midwest; MedMen intends to open a new Morton Grove location in CY2021, a densely populated, under - penetrated area of Chicago Source: ArcView Market Research State of the Legal Cannabis Markets 2020 – 8 th Edition, Illinois Medical Cannabis Patient Program, Company materials, Illinois Department of Financial and • Professional Regulation, New Cannabis Ventures 1. Illinois Department of Financial and Professional Regulation (01/04/2021) SELECT COMMENTARY ▪ Key market metrics: — State Population: ~12.6 million residents — Licensed Dispensaries: 82 — Canopy Cap: Up to 210k sq. ft. (14k for craft) — Retail License Cap: 10 licenses — Average Revenue per Dispensary: ~$12.5mm 1 — Registered Patients : 153,258 ▪ The state of Illinois initiated adult - use sales on Jan 1, 2020, after legalizing medical cannabis in 2013 ▪ Despite continued month - over - month increases in legal sales, the Illinois market has several clear channels for sustained growth, including: — Legalization of delivery and designated consumption locations — Introduction of brands and new form factors (flower currently represents ~43% of the market) — Increase in craft and premium offerings as prices stabilize ▪ MedMen will be able to achieve incremental market penetration via the introduction of premium national brands and additional form factors ANNUAL LEGAL CANNABIS SALES (US$ BN) Adult - use Medical CAGR: +44.3% [ 17 ] $0.3 $0.7 $0.9 $1.1 $1.3 0.4 0.6 0.8 1.0

▪ MedMen’s Fenway dispensary will be a prime, high - traffic location adjacent to the home of the Boston Red Sox, Fenway Park — 80+ Red Sox games per year with an average attendance of ~36,000 people — Blocks away from Boston University (~34,000 students) and less than a ten minute drive from Northeastern University (~20,000 students) • Closest dispensary to either institution — Boston has strict zoning rules (e.g., 0.5 mile anti - clustering and 1500’ school distancing) making the locations highly defensible ▪ The Newton location is located within an affluent Boston area, Chestnut Hill, home of Boston College and the Chestnut Hill Mall ▪ MedMen does not own or operate a cultivation facility in Massachusetts and therefore will sell third - party flower and product MA Dispensaries in High - Traffic, Affluent Locations SIGNIFICANT REVENUE DRIVERS MedMen has licenses to open two of the most well - located dispensaries in the limited - license Massachusetts market with its Fenway and Newton locations; Fenway is anticipated to open in August 2021 and Newton is anticipated to open in CY2022 ADULT - USE DISPENSARIES IN FENWAY AREA Company Distance to Fenway Park Est. Driving Time to Fenway Park 0.2 miles 1 minute 1.6 miles 6 minutes 2.5 miles 8 minutes 2.8 miles 10 minutes 3.6 miles 13 minutes Source: Company financials, Leafly MedMen Dispensary [ 18 ] MedMen Dispensary NEWTON AREA DETAIL

Nevada Dispensaries Also Ideally Located SELECT COMMENTARY MedMen’s three Las Vegas dispensaries are strategically located near McCarran International Airport, UNLV, the Las Vegas Stri p and historic downtown Las Vegas PARADISE AREA DETAIL DOWNTOWN AREA DETAIL SPRING VALLEY AREA DETAIL Rainbow Sunset Mall ▪ MedMen’s Paradise dispensary is located adjacent to UNLV and walking distance to the Las Vegas Strip — Las Vegas receives ~50mm tourists annually and UNLV has 28,000 students ▪ MedMen’s Downtown location is centrally located near a high traffic retail area and the cultural hub of Las Vegas ▪ The Company recently signed an agreement to offload operations and a significant portion of operating costs associated with their Mustang cultivation facility in exchange for a guaranteed supply of premium cannabis — Especially important in Nevada where flower market prices have been highly volatile ▪ Following a successful re - launch of its MedMen RED brand in California, MedMen plans to re - launch its MedMen RED line in Nevada in CY2021 NEVADA LEGAL SALES TO GROW AT AN ESTIMATED 14% CAGR (US$ BN) Source: ArcView Market Research State of the Legal Cannabis Markets 2020 – 8 th Edition, Department of Health and Human Services Nevada Division of Public and Behavioral Health (DPBH), • Equity research, Marijuana Business Daily MedMen Dispensary [ 19 ] $2.9 $4.4 $5.3 $6.3 $7.6 2019A 2020A 2021P 2022P 2023P $0.7 $0.9 $1.0 $1.1 $1.2

Arizona is a Limited License, Rapidly Growing Market MESA CULTIVATION FACILITY MARKET OVERVIEW ▪ The Arizona market is highly attractive given the scarcity of adult - use licenses, scalability of cultivation and the projected size and significance of the market within the broader cannabis industry o Arizona is projected to be a ~$1.5bn cannabis market by 2025 o Arizona has an adult population of ~4 million, annual tourist visits of ~50 million and a well - established, well - penetrated medical cannabis population o No state - level cap on canopy size and cultivation facilities are allowed to be moved ▪ The launch of Arizona’s adult - use cannabis program positions the state to be one of the key high - growth U.S. cannabis markets for the foreseeable future o Proposition 207 was approved with over 60% of the vote in November 2020 and the state has been highly efficient in vetting and approving adult - use licenses for already established medical operators ▪ MedMen AZ has an established retail location in Scottsdale that currently serves both medical and adult - use customers and a cultivation / processing operation in Mesa o The dispensary is located in the highly - populated Maricopa County, next to numerous entertainment destinations such as TopGolf, Talking Stick Resort and MLB spring training facilities o The Company is in an active search for a secondary cultivation / manufacturing facility to further support its strong wholesale sales [ 20 ] Source: Arizona Department of Health Services, The Arcview Group, Company information, Marijuana Business Daily SCOTTSDALE RETAIL LOCATION

Capital Markets Overview

Capital Markets Overview (CSE: MMEN; OTCQX: MMNFF) Source: Company management Note: For information regarding convertible securities, exchangeable and exercisable securities, refer to Company’s MD&A in t he most recent reporting quarter 1. Each redeemable share or unit is redeemable for one MedMen Enterprises Inc. Class B Subordinate Voting Share [ 22 ] Class of Shares as of September 15, 2021 Share Count MedMen Enterprises Class B Subordinate Shares 1,193,505,976 MedMen Enterprises Super Voting Shares 0 MM Can USA Redeemable Shares 1 91,247,378 MM Enterprises USA Redeemable Units 725,017 Total Basic Shares Outstanding 1,285,478,371
Serious News for Serious Traders! Try StreetInsider.com Premium Free!
You May Also Be Interested In
- Belite Bio Announces $25 Million Registered Direct Offering
- New Exhibition 'Global Travelers' by Carole A. Feuerman: Master of Superrealism
- HRT Class Action Notice: Robbins LLP Reminds Stockholders of the Lead Plaintiff Deadline in the HireRight Holdings Corp. Class Action
Create E-mail Alert Related Categories
SEC FilingsSign up for StreetInsider Free!
Receive full access to all new and archived articles, unlimited portfolio tracking, e-mail alerts, custom newswires and RSS feeds - and more!
