

Form 8-K Match Group, Inc. For: Aug 02
 Tweet
Tweet Share
ShareUNITED STATES
SECURITIES AND EXCHANGE COMMISSION
Washington, DC 20549
FORM 8-K
CURRENT REPORT
Pursuant to Section 13 OR 15(d) of The Securities Exchange Act of 1934
Date of Report (Date of earliest event reported): August 2, 2022
(Exact name of registrant as specified in its charter)
| (State or other jurisdiction of incorporation) | (Commission File Number) | (IRS Employer Identification No.) | ||||||
(Address of principal executive offices) (Zip Code)
Registrant’s telephone number, including area code: (214 ) 576-9352
Check the appropriate box below if the Form 8-K filing is intended to simultaneously satisfy the filing obligation of the registrant under any of the following provisions (see General Instruction A.2. below):
| Securities registered pursuant to Section 12(b) of the Act: | ||||||||||||||
| Title of each class | Trading Symbol | Name of exchange on which registered | ||||||||||||
| (Nasdaq Global Select Market) | ||||||||||||||
Indicate by check mark whether the registrant is an emerging growth company as defined in Rule 405 of the Securities Act of 1933 (§230.405 of this chapter) or Rule 12b-2of the Securities Exchange Act of 1934 (§240.12b-2 of this chapter).
Emerging growth company ☐
If an emerging growth company, indicate by check mark if the registrant has elected not to use the extended transition period for complying with any new or revised financial accounting standards provided pursuant to Section 13(a) of the Exchange Act. ☐
Item 2.02. Results of Operations and Financial Condition.
Item 7.01. Regulation FD Disclosure.
On August 2, 2022, Match Group, Inc. (“Match Group”) published a shareholder letter, which included results for the quarter ended June 30, 2022. The full text of the shareholder letter, which is posted on the “Investor Relations” section of Match Group’s website at https://ir.mtch.com and appears in Exhibit 99.1 hereto, is incorporated herein by reference.
Exhibit 99.1 is being furnished under both Item 2.02 “Results of Operations and Financial Condition” and Item 7.01 “Regulation FD Disclosure.”
Item 9.01. Financial Statements and Exhibits.
(d) Exhibits
Exhibit Number | Description | ||||
| 104 | Inline XBRL for the cover page of this Current Report on Form 8-K | ||||
SIGNATURE
Pursuant to the requirements of the Securities Exchange Act of 1934, the registrant has duly caused this report to be signed on its behalf by the undersigned hereunto duly authorized.
| MATCH GROUP, INC. | ||||||||
| By: | /s/ Gary Swidler | |||||||
| Gary Swidler | ||||||||
| Chief Operating Officer and Chief Financial Officer | ||||||||
Date: August 2, 2022
Exhibit 99.1
Letter to
Shareholders
Q2 2022 | August 2, 2022
Second Quarter 2022 Financial Highlights
• | Total Revenue grew 12% over the prior year quarter to $795 million (19% growth on foreign exchange (“FX”) neutral basis). | • | Tinder Direct Revenue grew 13% over the prior year quarter driven by 14% Payers growth to 10.9 million partially offset by RPP decline of 1%. | ||||||||||||||
• | Operating loss of $10 million driven by a $217 million impairment of intangibles relating to the Hyperconnect acquisition. | • | All Other Brands collectively grew Direct Revenue 12% year-over-year, driven by 10% RPP growth and 2% Payers growth to 5.5 million. | ||||||||||||||
• | Adjusted Operating Income was $286 million, an increase of 9% over the prior year quarter, representing an Adjusted Operating Income Margin of 36%. | ||||||||||||||||
• | Year-to-date 2022 Operating Cash Flow and Free Cash Flow were $20 million and negative $7 million, respectively, both impacted by the final payment of $441 million related to the previously disclosed Tinder litigation settlement. | ||||||||||||||||
• | Payers increased 10% to 16.4 million, up from 15.0 million in the prior year quarter. | ||||||||||||||||
• | RPP increased 3% over the prior year quarter to $15.86. | ||||||||||||||||
 1
11 Q2’22 operating loss includes a $217 million impairment of intangibles relating to the Hyperconnect acquisition.
 | 2 | |||||||
Dear Shareholders,
The second quarter of 2022 was an exciting one for Match Group. We’ve spent the past two months visiting our offices in LA, New York, Vancouver, Dallas, Seoul, and Paris to connect in person with teams across the organization. Our goal was to meet with as many employees as possible and hear directly from them about how recent business trends and our brands’ strategic plans position Match Group to deliver on our mission to make meaningful connections through our portfolio of brands. We all learned a lot from these conversations and look forward to leveraging these insights as we drive the business forward.
With the addition of BK’s fresh perspectives to the management team, we’ve decided to take a different approach to the content and structure of this letter. We wanted to introduce BK’s key leadership philosophies, share some findings from his first two months in the role, and highlight the steps he’s already taken to help navigate the business through the challenging operating environment. As we continue to refine our longer-term strategy for the business, we look forward to keeping you updated on these plans in the coming months.
While there is work to be done, we’re confident that the future is bright for Match Group. It is clear that we have an experienced global team and a fantastic business, and we're excited about our growth opportunities ahead. We’re optimistic that we’ll unlock further growth and extend our winning track record for many years to come.
Sincerely,
 |  | ||||
| Bernard Kim | Gary Swidler | ||||
| Chief Executive Officer | Chief Operating Officer & Chief Financial Officer | ||||
| 3 | |||||||
Observations from BK (62 Days In)
It’s certainly been an invigorating last few weeks, learning as much as possible from each office visit, seeing just how much talent we have around the world, and reveling at the overall joy that results when our users make meaningful connections – which is truly the reason why we are all here.
After many years in various management roles in the technology sector, I’ve developed several leadership tenets that I believe are key to driving success: be authentic, lead with conviction, bet on people, be collaborative but decisive, and push to win!
Since I joined the company, Gary, the rest of the management team and I have had deep and honest discussions around the opportunities and challenges for the business. It’s been great to see that we are closely aligned on what’s working, what requires change, and what we can do to best capitalize on our opportunities. And importantly, we share the same conviction that there are significant opportunities ahead for Match Group.
Our goal is to inspire our brands to optimize everything we do and build the best teams internally to deliver the finest services externally. The team and I are moving forward with a greater sense of urgency to execute against our strategic objectives, while having fun and delivering on our mission.
I’m still settling into my role, but I wanted to share some initial thoughts and ideas on our business. These are not my full plans as I’ll need a few more months to build our longer-term strategy, but I think they illustrate the direction in which we’re headed to ensure a bright future for this company.

Match Group is rare in that each of our brands has a unique culture and key talent. One of my underlying leadership tenets is to bet on people, and I think there’s a huge opportunity to increase collaboration across our portfolio, learn more from one another, and truly unite the team to accelerate our growth. I intend to challenge our teams to work in new ways and leverage our cross-portfolio knowledge to strengthen outcomes across the business.

| 4 | |||||||
The mission of this company – making meaningful connections – is so powerful, and each of our brands brings this to life in a different way. It serves as a key differentiator for us and is a critical part of what has made us so successful. Looking ahead, we’re focused on continuing to support this mission and put the user at the center of everything we do.
I’ve also been impressed with all the great CSR work we’ve done, as summarized in our Annual Impact Report. I intend to continue to invest in these areas, and particularly when it comes to making our communities safer. As we move forward, rest assured that Match Group remains committed to leading in the safety and well-being of our users.

It’s apparent that there’s significant runway remaining for our businesses in all of our markets. More than half of singles in developed markets such as the U.S. and Western Europe have yet to try dating apps. In APAC and other parts of the world, an even larger percentage of people have yet to try them and, even though cultural barriers and stigma are higher, these regions present an enormous opportunity for growth. While we can grow our user base globally, we also can expand the portion of our user base which pays for our products, which today is just above 15%. I’ve spent my career driving à la carte monetization in free-to-play gaming, and I’m excited to bring those learnings and expertise to our brands to drive more value. I’m confident that there is significant opportunity in this area for Match Group, including the ability to more fully monetize power users.
 2
2Although the overall market opportunity remains substantial, the current environment is presenting some unique trends related to consumer behavior. While people have generally moved past lockdowns and entered a more normal way of life, their willingness to try online dating products for the first time hasn’t yet returned to pre-pandemic levels. We are still seeing higher engagement from pre-existing users compared to before the pandemic. In order to see new user growth return to pre-pandemic levels, I will be challenging the teams to make bigger strides in product innovation to drive more first-time adoption of our products. This will include incorporating innovative dating features such as live streaming video and “alibi” dating products to capture a larger pool of users.
2 Match 2021 surveys and research. Percent of respondents that have ever used a dating app or site (single,
and not in a relationship), excluding China.
| 5 | |||||||
The largest untapped market opportunity for us is in APAC, and we expanded our presence there with the acquisition of Hyperconnect®. I met with the team in Seoul in June and found them to be passionate and innovative technologists who move quickly and are very willing to try new things. There’s no question that buying Hyperconnect while the world was shut down due to COVID slowed integration and our ability to work together to drive their growth. The Azar® app, which is the larger service, has begun to show some improvement via the introduction of new features, and we have begun to turn more attention to the Hakuna® app as well. I’m optimistic that together with the team we can return Hyperconnect to reasonable levels of growth, despite what is clearly a tougher and more competitive market for video than before or even during the pandemic.
I’m also impressed by the work Hyperconnect has done to integrate their audio and video technologies into other Match Group brands, including at Meetic®, Match®, and Pairs™. By leveraging Hyperconnect technologies, we’re able to achieve cost efficiency, better customization, and faster time to market, and I believe there is much more we can do on this front. I’m looking forward to collaborating with the Hyperconnect team, generating deeper synergies, and implementing their technologies further and faster across Match Group’s brands.

I believe a metaverse dating experience is important to capture the next generation of users, and Hyperconnect has been innovating in this area. However, given uncertainty about the ultimate contours of the metaverse and what will or won’t work, as well as the more challenging operating environment, I’ve instructed the Hyperconnect team to iterate but not invest heavily in metaverse at this time. We’ll continue to evaluate this space carefully, and we will consider moving forward at the appropriate time when we have more clarity on the overall opportunity and feel we have a service that is well-positioned to succeed.

After launching 10 years ago, the Tinder® brand and the patented Swipe® feature remain iconic on a global basis, and there is incredible runway for this business in all of its markets. Over these past few quarters, Tinder has continued to iterate on Explore™, including the launch of Music Mode™ and Blind Date, and we continue to believe there is much more opportunity for leveraging Explore. However, over that same period, we have not been able to realize the monetization successes that we typically deliver. Tinder’s current revenue growth expectations for the second half of the year are below our original expectations as a result of disappointing execution on several optimizations and new product initiatives. I believe Tinder's overall product execution and velocity can be improved and that we need to do more to excite our user base to drive top of funnel growth.
| 6 | |||||||
Today we’re announcing the departure of Tinder CEO Renate Nyborg, and I have made some changes to the management team and structure that I am confident will help deliver Tinder’s full potential. While we search for a permanent Tinder CEO, I will oversee a newly formed team of executives who will manage day-to-day operations and will ensure the Tinder organization is well coordinated, ships great new features at increased velocity, and delivers on Tinder’s promise. I’ll be fully embedded within the team at our main Tinder office in LA to oversee business progress until the search is complete.
The leaders I’ve put in place at Tinder are all executives that have either been extremely successful within Match Group or that I've known for many years. I’ve been impressed by how this group has been working together already and am confident that they will drive growth through innovation and service enhancements across the board. The team includes:
– Faye Iosotaluno, Tinder’s Chief Operating Officer. Formerly Match Group’s Chief Strategy Officer, Faye will work to ensure better coordination and execution across Tinder’s operations.
– Mark van Ryswyk, Tinder’s Chief Product Officer. Mark is an experienced gaming executive and product and team leader who I’ve known for more than 15 years and joined the company in early June.
– Melissa Hobley, Tinder’s Chief Marketing Officer. Melissa was formerly OkCupid’s CMO and will help drive top of funnel expansion and enhance brand perception. Melissa was on the 2022 Forbes List of the world’s most entrepreneurial CMOs.
– Tom Jacques, Tinder’s Chief Technology Officer. Tom has worked in engineering at Match Group for more than 11 years and has been Tinder’s CTO for the last 5 years.
I’ve also asked Amarnath Thombre, CEO of Match Group Americas, to advise Faye, Mark, Melissa, and Tom on Tinder product roadmap and growth drivers. Amarnath has more than 15 years' experience across Match Group. He was heavily involved in Tinder’s key successes, especially in designing high impact monetization features such as the Boost® feature and Tinder Gold subscription, and more recently has overseen the phenomenal success of Hinge® following our acquisition.
In the near-term, the Tinder product roadmap remains focused on some of the key initiatives we previously laid out including to better serve our female users. To that end, we’ll be rolling out a new subscription package based on curated recommendations that we believe will appeal particularly to women. We also plan to introduce several features to get users’ friends more involved, such as a new patented Swipe Party™ feature, increasing the utility of Tinder and expanding its TAM. Additionally, we intend to introduce a shorter-term subscription package, which we think will appeal to newer Tinder users and drive incremental revenue.

| 7 | |||||||
After seeing mixed results from testing Tinder Coins, we’ve decided to take a step back and re-examine that initiative so that it can more effectively contribute to Tinder’s revenue. We also intend to do more thinking about virtual goods to ensure that they can be a real driver for Tinder’s next leg of growth and help us unlock the untapped power users on the platform. I’m confident that in the second half of 2022 the re-prioritization of the product roadmap, the new team and the gaming experience Mark and I bring will enable Tinder to make meaningful product progress and position it to achieve growth rates in 2023 and beyond that are more consistent with our aspirations.

I’ve been really impressed with the Hinge team, their culture, and the differentiated platform they’ve built, which serves intentioned daters so well. The team has relentlessly innovated, keeping the service fresh and engaging, and I’m confident that’s going to enable them to continue pulling ahead of the competition.
The team prides itself on living up to their brand promise of “Designed to be Deleted®.” They want users to try the app, match, go on great dates, and then delete the app. That’s how the product is structured, and it’s been a very successful formula. There’s no doubt Hinge is a particularly bright spot in our portfolio, with significant global growth potential.

The recent release of the local German product is seeing strong early momentum. In the coming quarters, I’d like to see Hinge expand internationally at a faster clip. The initial plan was to launch a new language/market each quarter, but we’re accelerating that so Hinge will launch in two new markets every quarter. The next few quarters will be devoted to launching across the rest of Europe and India. After that, Hinge will set their sights on further expansion in APAC and the rest of the world.
On the monetization front, the team is building an array of new features and is planning to launch a second subscription tier by the end of 2022. Hinge remains focused on delivering ~$300 million in revenue this year, which would represent growth of ~50% over 2021.
| 8 | |||||||

There are two strategies for the remaining brands in our portfolio that Match Group has been executing on with particular success over the past few years.
The first strategy is to maximize cash flow and be disciplined with costs, especially marketing spend. This is the case at several of our Established Brands such as Match and Match Affinity™, Meetic, OkCupid®, and Plenty of Fish®. While these brands saw some tailwinds from government stimulus and a less competitive marketing environment during the height of COVID, I expect that they will remain challenged for increased growth in the near-term. As such, I expect us to maintain strict ROI and cost discipline in these businesses while developing longer-term growth strategies.
The second strategy, which has been very successful within the Emerging Brands portfolio, has been to add new apps that serve key demographic groups. We’ve done so for the Black community with the BLK® app and the Hispanic community with the Chispa™ app, and we now have moved onto the Christian community with the Upward® app and single parents with the Stir® app. Collectively, these new brands are expected to add ~$75 million of revenue to the company in 2022, compared to zero revenue three years ago. In addition, we’ve experienced much success in adding live streaming to our Plenty of Fish business, which is our first successful foray into monetization beyond dating and has demonstrated to us the value in monetizing power users.
A few weeks ago, we closed the acquisition of The League®, which enables us to serve a new vertical of highly ambitious, career-oriented singles. We’ve never offered an ultra premium product that caters to this valuable niche market. We’re confident we can generate synergies by bringing The League onto our platform. We have a track record with prior dating acquisitions of maximizing value by leveraging our expertise in marketing and monetization, and there is plenty of opportunity to grow The League’s small but avid user base and its overall revenue. We’re thrilled to welcome The League CEO, Amanda Bradford, and her team to the Match Group family.
| 9 | |||||||

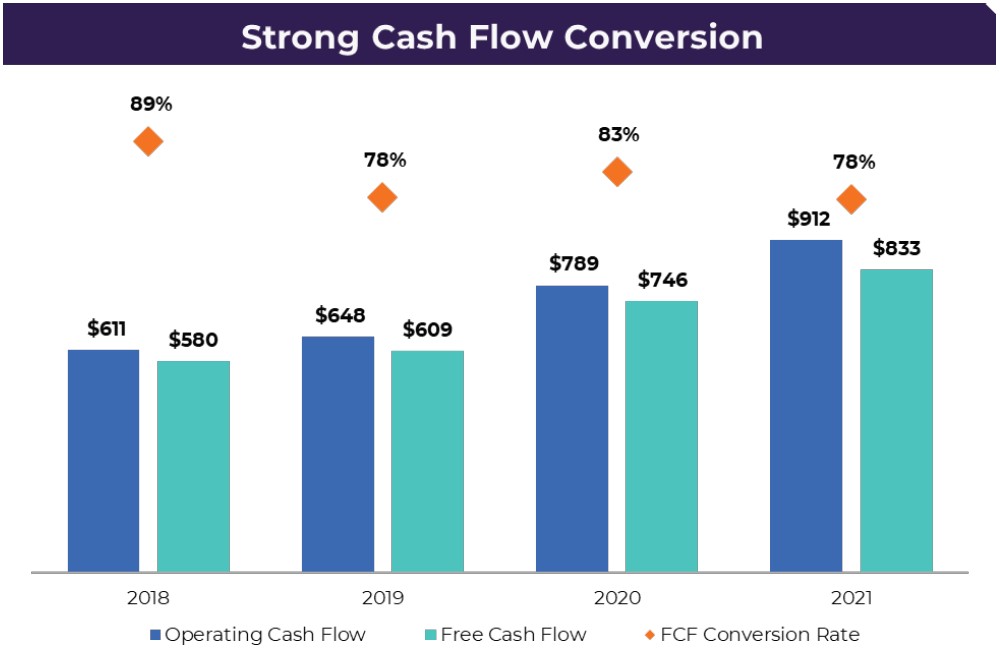
Our portfolio generates significant free cash flow (“FCF”), with limited capex and strong Adjusted Operating Income to FCF conversion rates. FCF conversion rates have been 78% or better consistently since 2018, and we expect FCF conversion to be at similar levels in 2022 (excluding the Tinder litigation settlement).
In all environments, but especially in the currently challenging one we are all facing, we expect to remain laser-focused on cost discipline. We’ve reduced our hiring plans for 2022 and have also cut back on marketing spend where it made sense to do so. We have a strong margin profile and see further upside as App Store fee relief takes hold globally, particularly in response to the Digital Markets Act becoming effective in Europe in early 2023. We also remain very disciplined in terms of stock-based compensation ("SBC"), with our estimated SBC expense/revenue ratio of ~7% for 2022 being among the lowest in our peer group.
We remain committed to maintaining a strong balance sheet and to being steadfast stewards of our capital. We’ve delivered on our promise to de-lever to 3x net leverage, and favor conservative leverage levels, especially in light of current macroeconomic headwinds and uncertainty.
The company’s stated capital allocation policy is to first, invest organically in our business; second, to continue to pursue opportunistic M&A to fill gaps in our portfolio or add technologies that would enhance the overall portfolio; and third, to return capital to shareholders. We’re focused on identifying acquisition targets that would enhance our growth and are profitable or have a very clear path to profitability. In the absence of these types of transactions, we may return capital to shareholders. Since announcing our buyback authorization in early May, we’ve bought back about three million shares, and we expect to continue repurchases, especially given the market dislocation we are currently experiencing.
| 10 | |||||||
Business Trends and Financial Outlook
Q2 2022 Performance
In the second quarter, Total Revenue was $795 million, up 12% year-over-year, driven by a 10% increase in Payers and a 3% increase in RPP. On an FX neutral basis, Total Revenue was $842 million, up 19% year-over-year. Europe grew Total Revenue 6% year-over-year but 19% on an FX neutral basis. APAC and Other grew Total Revenue 32% year-over-year, but 49% on an FX neutral basis. Company RPP was up 9% overall on an FX neutral basis.
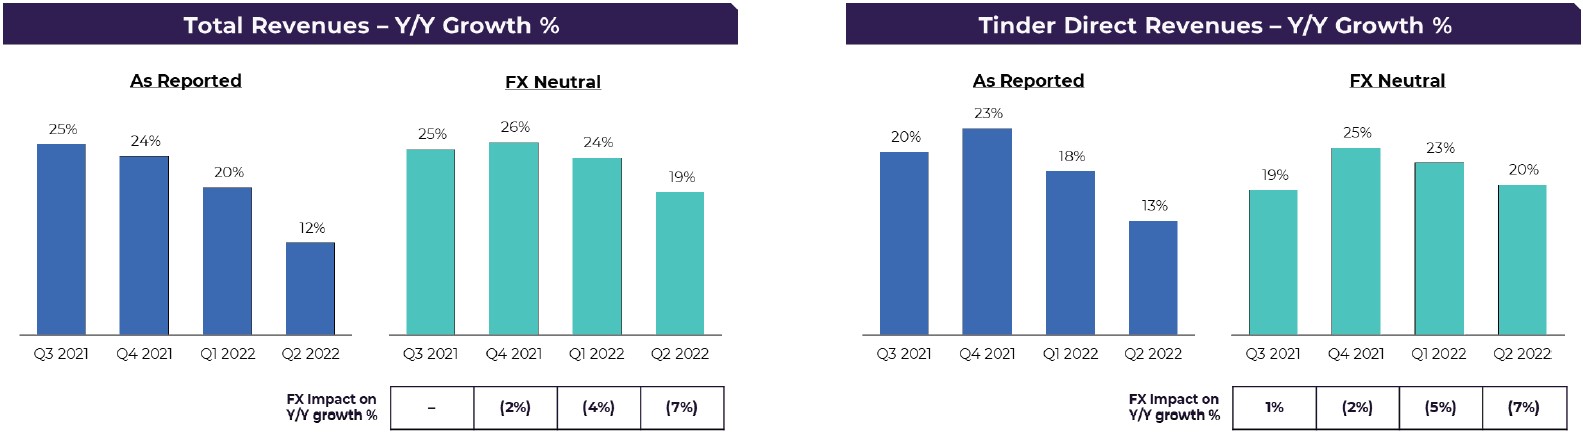
Tinder grew Direct Revenue 13% year-over-year, driven by Payers growth of 14% while RPP fell by 1%. Direct Revenue growth would have been 20% year-over-year and RPP would have been up 5% year-over-year on an FX neutral basis. All Other Brands grew Direct Revenue 12% year-over-year driven by 10% RPP growth and 2% Payers growth. Hinge, BLK and Chispa all performed strongly, while a number of the Established Brands including Match and Match Affinity, Meetic, OkCupid, and Plenty of Fish saw revenue and Payer declines year-over-year.
Our Q2 Operating Loss was $10 million impacted by a $217 million write down of the intangibles related to the Azar and Hakuna trade names due to a lower financial outlook for the two apps, including FX impacts, as well as applying a higher discount rate.
Our Q2 Adjusted Operating Income was $286 million, up 9% year-over-year, for 36% margins. This included a $5 million initial escrow amount related to the litigation with Google. We remained cautious on expenses, with overall marketing spend down $13 million year-over-year (excluding Hyperconnect), although we continued to invest in Product and Development, especially at Tinder and Hinge.
Overall Business Trends
The business is facing a number of factors that are impacting our performance and outlook. The most notable is the strengthening of the U.S. dollar against several major global currencies, including the Euro, Japanese Yen, Turkish Lira and British Pound. This has caused a $74 million year-over-year revenue headwind year-to-date, and we expect it will be a significant headwind in 2H 2022 as well.
Focusing on our business trends, our Established Brands benefited from a more efficient marketing environment during COVID, which drove incremental growth, and from consumers’ receipt of government stimulus payments, which helped support monetization. In 2H 2021 almost all of our businesses benefited as COVID vaccines became widely available, and people started to increase their social activity. We are not seeing a similar surge of activity in 2022. Moreover, in Q3 2021, Tinder implemented several optimizations around merchandising and paywalls, which led to a record number
| 11 | |||||||
of Payer net adds and strong revenue in that quarter. We are now lapping those tougher comparables without the anticipated benefits from the previously mentioned Tinder initiatives planned for 2H 2022.
Additionally, we are seeing some weakness in our live streaming business and the Japanese market has yet to show meaningful recovery following the lifting of COVID restrictions. Though our Pairs app saw an initial surge of new users coming out of lockdowns and throughout the Golden Week holiday, the trends have been short-lived as COVID cases have risen once again, and we have not seen a sustained improvement in revenue momentum in that market.
Financial Outlook
We expect muted top-line growth in the second half of 2022. Our Q3 Total Revenue outlook of $790 to $800 million is essentially flat year-over-year. We expect FX to have an 8-point impact on year-over-year revenue growth in Q3. For Tinder, we expect year-over-year Direct Revenue growth to be in the mid single-digits (low teens on an FX neutral basis). We expect Hinge, BLK, and Chispa to continue to perform strongly and help offset declines at the Established Brands.
Our Q3 Adjusted Operating Income outlook is $255 to $260 million, implying a margin of 32% at the midpoints. This includes an $8 million ongoing quarterly escrow payment related to the Google litigation (up to $40 million in aggregate). We expect higher overall app store fees, reduced year-over-year sales and marketing spend, and lower year-over-year growth in product and development spend compared to Q2 2022 as we begin to see the effects of a pullback in hiring.
| Total Revenue | Adjusted Operating Income | |||||||||||||
| Q3 2022 | $790 to $800 million | $255 to $260 million | ||||||||||||
We need some time for the new Tinder team to improve execution and see how they deliver on their product roadmap. We’re optimistic that the changes we’ve made at Tinder will lead to improved product execution and velocity, monetization wins, and enhanced user growth.
In Q4, we expect limited improvement in year-over-year top-line growth rates compared to Q3 with the teams focused on execution against the current product initiatives leading into 2023. We expect margins to improve modestly as we remain disciplined on marketing spend and hiring. We’re confident that Tinder and the overall company top-line growth rates will accelerate as 2023 progresses.
| 12 | |||||||
Conference Call
Match Group will audiocast a conference call to answer questions regarding its second quarter financial results on Wednesday, August 3, 2022 at 8:30 a.m. Eastern Time. This call will include the disclosure of certain information, including forward-looking information, which may be material to an investor’s understanding of Match Group’s business. The live audiocast will be open to the public on Match Group’s investor relations website at https://ir.mtch.com.
| 13 | |||||||
Financial Results
Revenue
| Three Months Ended June 30, | |||||||||||||||||
| 2022 | 2021 | Change | |||||||||||||||
| (In thousands, except RPP) | |||||||||||||||||
| Direct Revenue: | |||||||||||||||||
| Americas | $ | 408,730 | $ | 374,388 | 9% | ||||||||||||
| Europe | 208,471 | 196,542 | 6% | ||||||||||||||
| APAC and Other | 162,952 | 123,392 | 32% | ||||||||||||||
| Total Direct Revenue | 780,153 | 694,322 | 12% | ||||||||||||||
| Indirect Revenue | 14,360 | 13,438 | 7% | ||||||||||||||
| Total Revenue | $ | 794,513 | $ | 707,760 | 12% | ||||||||||||
| Payers | |||||||||||||||||
| Americas | 8,225 | 7,901 | 4% | ||||||||||||||
| Europe | 4,564 | 4,332 | 5% | ||||||||||||||
| APAC and Other | 3,606 | 2,736 | 32% | ||||||||||||||
| Total Payers | 16,395 | 14,969 | 10% | ||||||||||||||
| Revenue Per Payer (“RPP”) | |||||||||||||||||
| Americas | $ | 16.56 | $ | 15.79 | 5% | ||||||||||||
| Europe | $ | 15.23 | $ | 15.12 | 1% | ||||||||||||
| APAC and Other | $ | 15.06 | $ | 15.03 | —% | ||||||||||||
| Total RPP | $ | 15.86 | $ | 15.46 | 3% | ||||||||||||
Growth in Payers was driven by Tinder across all geographies. Hinge, Chispa, Upward, and BLK contributed to the growth in Payers in the Americas. The acquisition of Hyperconnect contributed to Payer growth in APAC and Other. There were decreases in Payers at Plenty of Fish, Match, Meetic, and OkCupid in the Americas and Europe. Americas RPP increased primarily due to increases in subscriptions and à la carte purchases at Tinder and Hinge. Europe RPP was unfavorably impacted by the strength of the U.S. Dollar relative to the Euro and British Pound, while APAC and Other RPP was unfavorably impacted by the strength of the U.S. Dollar relative to the Japanese Yen and Turkish Lira.
| 14 | |||||||
Operating (Loss) Income and Adjusted Operating Income
| Three Months Ended June 30, | |||||||||||||||||
| 2022 | 2021 | Change | |||||||||||||||
| (In thousands) | |||||||||||||||||
| Operating (Loss) Income | $ | (10,081) | $ | 209,914 | NM | ||||||||||||
| Operating (Loss) Income Margin | (1 | %) | 30 | % | (30.9) points | ||||||||||||
| Adjusted Operating Income | $ | 285,713 | $ | 262,613 | 9% | ||||||||||||
| Adjusted Operating Income Margin | 36 | % | 37 | % | (1.1) points | ||||||||||||
________________________
NM = not meaningful
Operating Costs and Expenses
| Q2 2022 | % of Revenue | Q2 2021 | % of Revenue | Change | |||||||||||||||||||||||||
| (In thousands) | |||||||||||||||||||||||||||||
| Cost of revenue | $ | 240,840 | 30% | $ | 193,099 | 27% | 25% | ||||||||||||||||||||||
| Selling and marketing expense | 125,679 | 16% | 128,918 | 18% | (3)% | ||||||||||||||||||||||||
| General and administrative expense | 110,638 | 14% | 113,393 | 16% | (2)% | ||||||||||||||||||||||||
| Product development expense | 86,410 | 11% | 52,133 | 7% | 66% | ||||||||||||||||||||||||
| Depreciation | 11,488 | 1% | 10,061 | 1% | 14% | ||||||||||||||||||||||||
| Impairment and amortization of intangibles | 229,539 | 29% | 242 | —% | NM | ||||||||||||||||||||||||
| Total operating costs and expenses | $ | 804,594 | 101% | $ | 497,846 | 70% | 62% | ||||||||||||||||||||||
Total operating costs and expenses increased 62% year-over-year, with approximately 86% of the total increase resulting from increased operating costs from the acquisition of Hyperconnect, subsequent amortization expense, and the $217 million impairment of related intangible assets. The impairment stemmed from a decline in projections related to a lower outlook for the business, including FX impacts in certain of Hyperconnect’s key markets, as well as the use of increased discount rates.
Excluding Hyperconnect: Cost of revenue increased 14% year-over-year primarily due to an increase in in-app purchase fees, which included a $5 million escrow amount related to our litigation regarding the Google Play store. Total selling and marketing expense decreased $13 million year-over-year as we reduced marketing spend in the current environment. General and administrative expense increased 3% year-over-year primarily due to increases in employee compensation and travel expenses, partially offset by a decrease in professional fees. Product development expense increased 51% year-over-year primarily due to increased engineering headcount at Tinder and Hinge.
| 15 | |||||||
Liquidity and Capital Resources
For the six months ended June 30, 2022, we generated operating cash flow of $20 million and Free Cash Flow of negative $7 million, both of which were impacted by the final settlement payment of $441 million related to Rad, et al. v. IAC/InterActiveCorp, et al. and related arbitrations during the second quarter.
During the quarter ended June 30, 2022, we repurchased 2.9 million shares of our common stock for $216 million on a trade date basis at an average price of $73.30. Between July 1, 2022 and July 5, 2022, we repurchased an additional 0.2 million shares for $17 million on a trade date basis at an average price of $71.10. As of August 1, 2022, 9.3 million shares remain available for repurchase under our previously announced share repurchase program.
As of June 30, 2022, we had $473 million in cash and cash equivalents and short-term investments and $3.9 billion of long-term debt, including $1.2 billion of Exchangeable Senior Notes. Our $750 million revolving credit facility was undrawn as of June 30, 2022. Match Group’s trailing twelve-month leverage3 as of June 30, 2022 is 3.5x on a gross basis and 3.0x on a net basis.
Income Taxes
In the second quarter of 2022, Match Group recorded an income tax benefit of $8 million compared to an income tax expense of $37 million in the second quarter of 2021.
3 Leverage is calculated utilizing the non-GAAP measure Adjusted Operating Income as the denominator. For a reconciliation of the non-GAAP measure for the period presented, see page 24.
| 16 | |||||||
GAAP Financial Statements
Consolidated Statement of Operations
| Three Months Ended June 30, | Six Months Ended June 30, | ||||||||||||||||||||||
| 2022 | 2021 | 2022 | 2021 | ||||||||||||||||||||
| (In thousands, except per share data) | |||||||||||||||||||||||
| Revenue | $ | 794,513 | $ | 707,760 | $ | 1,593,144 | $ | 1,375,372 | |||||||||||||||
| Operating costs and expenses: | |||||||||||||||||||||||
| Cost of revenue (exclusive of depreciation shown separately below) | 240,840 | 193,099 | 477,076 | 372,554 | |||||||||||||||||||
| Selling and marketing expense | 125,679 | 128,918 | 277,567 | 273,906 | |||||||||||||||||||
| General and administrative expense | 110,638 | 113,393 | 211,343 | 201,058 | |||||||||||||||||||
| Product development expense | 86,410 | 52,133 | 165,204 | 107,709 | |||||||||||||||||||
| Depreciation | 11,488 | 10,061 | 21,985 | 20,518 | |||||||||||||||||||
Impairment and amortization of intangibles | 229,539 | 242 | 242,232 | 455 | |||||||||||||||||||
| Total operating costs and expenses | 804,594 | 497,846 | 1,395,407 | 976,200 | |||||||||||||||||||
| Operating (loss) income | (10,081) | 209,914 | 197,737 | 399,172 | |||||||||||||||||||
| Interest expense | (35,623) | (32,219) | (70,519) | (64,057) | |||||||||||||||||||
| Other income (expense), net | 5,291 | (355) | 6,109 | (1,674) | |||||||||||||||||||
(Loss) earnings from continuing operations, before tax | (40,413) | 177,340 | 133,327 | 333,441 | |||||||||||||||||||
Income tax benefit (provision) | 8,048 | (37,320) | 14,915 | (19,573) | |||||||||||||||||||
Net (loss) earnings from continuing operations | (32,365) | 140,020 | 148,242 | 313,868 | |||||||||||||||||||
Earnings from discontinued operations, net of tax | — | 509 | — | 509 | |||||||||||||||||||
Net (loss) earnings | (32,365) | 140,529 | 148,242 | 314,377 | |||||||||||||||||||
Net loss attributable to noncontrolling interests | 507 | 366 | 433 | 768 | |||||||||||||||||||
Net (loss) earnings attributable to Match Group, Inc. shareholders | $ | (31,858) | $ | 140,895 | $ | 148,675 | $ | 315,145 | |||||||||||||||
Net (loss) earnings per share from continuing operations: | |||||||||||||||||||||||
Basic | $ | (0.11) | $ | 0.52 | $ | 0.52 | $ | 1.17 | |||||||||||||||
Diluted | $ | (0.11) | $ | 0.46 | $ | 0.50 | $ | 1.04 | |||||||||||||||
Net (loss) earnings per share attributable to Match Group, Inc. shareholders: | |||||||||||||||||||||||
| Basic | $ | (0.11) | $ | 0.52 | $ | 0.52 | $ | 1.17 | |||||||||||||||
| Diluted | $ | (0.11) | $ | 0.46 | $ | 0.50 | $ | 1.04 | |||||||||||||||
| Basic shares outstanding | 285,126 | 271,254 | 284,794 | 269,959 | |||||||||||||||||||
| Diluted shares outstanding | 285,126 | 311,087 | 298,698 | 310,856 | |||||||||||||||||||
| Stock-based compensation expense by function: | |||||||||||||||||||||||
| Cost of revenue | $ | 1,558 | $ | 1,012 | $ | 3,107 | $ | 2,001 | |||||||||||||||
| Selling and marketing expense | 2,166 | 3,087 | 3,819 | 4,352 | |||||||||||||||||||
| General and administrative expense | 30,032 | 27,580 | 53,931 | 46,060 | |||||||||||||||||||
| Product development expense | 21,011 | 10,717 | 36,205 | 20,099 | |||||||||||||||||||
| Total stock-based compensation expense | $ | 54,767 | $ | 42,396 | $ | 97,062 | $ | 72,512 | |||||||||||||||
| 17 | |||||||
Consolidated Balance Sheet
| June 30, 2022 | December 31, 2021 | ||||||||||
| (In thousands) | |||||||||||
| ASSETS | |||||||||||
| Cash and cash equivalents | $ | 463,686 | $ | 815,384 | |||||||
| Short-term investments | 9,240 | 11,818 | |||||||||
| Accounts receivable, net | 182,320 | 188,482 | |||||||||
| Other current assets | 149,567 | 202,568 | |||||||||
| Total current assets | 804,813 | 1,218,252 | |||||||||
| Property and equipment, net | 168,761 | 163,256 | |||||||||
| Goodwill | 2,281,606 | 2,411,996 | |||||||||
| Intangible assets, net | 479,389 | 771,697 | |||||||||
| Deferred income taxes | 310,073 | 334,937 | |||||||||
| Other non-current assets | 149,136 | 163,150 | |||||||||
| TOTAL ASSETS | $ | 4,193,778 | $ | 5,063,288 | |||||||
| LIABILITIES AND SHAREHOLDERS’ EQUITY | |||||||||||
| LIABILITIES | |||||||||||
| Current maturities of long-term debt, net | $ | 58,782 | $ | 99,927 | |||||||
| Accounts payable | 15,200 | 37,871 | |||||||||
| Deferred revenue | 259,149 | 262,131 | |||||||||
| Accrued expenses and other current liabilities | 294,555 | 768,366 | |||||||||
| Total current liabilities | 627,686 | 1,168,295 | |||||||||
| Long-term debt, net of current maturities | 3,832,534 | 3,829,421 | |||||||||
| Income taxes payable | 12,273 | 13,842 | |||||||||
| Deferred income taxes | 63,572 | 130,261 | |||||||||
| Other long-term liabilities | 109,814 | 116,051 | |||||||||
| Redeemable noncontrolling interest | — | 1,260 | |||||||||
| Commitment and contingencies | |||||||||||
| SHAREHOLDERS’ EQUITY | |||||||||||
| Common stock | 286 | 283 | |||||||||
| Additional paid-in capital | 8,165,983 | 8,164,216 | |||||||||
| Retained deficit | (7,995,839) | (8,144,514) | |||||||||
| Accumulated other comprehensive loss | (407,837) | (223,754) | |||||||||
| Treasury stock | (215,538) | — | |||||||||
| Total Match Group, Inc. shareholders’ equity | (452,945) | (203,769) | |||||||||
| Noncontrolling interests | 844 | 7,927 | |||||||||
| Total shareholders’ equity | (452,101) | (195,842) | |||||||||
| TOTAL LIABILITIES AND SHAREHOLDERS’ EQUITY | $ | 4,193,778 | $ | 5,063,288 | |||||||
| 18 | |||||||
Consolidated Statement of Cash Flows
| Six Months Ended June 30, | |||||||||||
| 2022 | 2021 | ||||||||||
| (In thousands) | |||||||||||
| Cash flows from operating activities attributable to continuing operations: | |||||||||||
| Net earnings | $ | 148,242 | $ | 314,377 | |||||||
Add back: earnings from discontinued operations, net of tax | — | (509) | |||||||||
| Net earnings from continuing operations | $ | 148,242 | $ | 313,868 | |||||||
Adjustments to reconcile net earnings from continuing operations to net cash provided by operating activities attributable to continuing operations: | |||||||||||
| Stock-based compensation expense | 97,062 | 72,512 | |||||||||
| Depreciation | 21,985 | 20,518 | |||||||||
| Impairment and amortization of intangibles | 242,232 | 455 | |||||||||
| Deferred income taxes | (32,663) | (20,731) | |||||||||
| Other adjustments, net | 1,693 | 7,407 | |||||||||
| Changes in assets and liabilities | |||||||||||
| Accounts receivable | 934 | (103,127) | |||||||||
| Other assets | 30,562 | 32,622 | |||||||||
| Accounts payable and other liabilities | (476,056) | (17,320) | |||||||||
| Income taxes payable and receivable | (15,089) | 18,899 | |||||||||
| Deferred revenue | 1,062 | 25,712 | |||||||||
| Net cash provided by operating activities attributable to continuing operations | 19,964 | 350,815 | |||||||||
| Cash flows from investing activities attributable to continuing operations: | |||||||||||
| Net cash used in business combinations, net of cash acquired | — | (840,869) | |||||||||
| Capital expenditures | (27,305) | (32,392) | |||||||||
| Other, net | 1,787 | (255) | |||||||||
| Net cash used in investing activities attributable to continuing operations | (25,518) | (873,516) | |||||||||
| Cash flows from financing activities attributable to continuing operations: | |||||||||||
Payments to settle exchangeable notes | (94,252) | — | |||||||||
Proceeds from the settlement of exchangeable note hedges | 52,623 | — | |||||||||
Payments to settle warrants related to exchangeable notes | (7,482) | — | |||||||||
| Debt issuance costs | — | (851) | |||||||||
| Proceeds from issuance of common stock pursuant to stock-based awards | 16,356 | 37,333 | |||||||||
Withholding taxes paid on behalf of employees on net settled stock-based awards | (101,089) | (11,380) | |||||||||
| Purchase of treasury stock | (190,980) | — | |||||||||
| Purchase of noncontrolling interests | (10,554) | (1,473) | |||||||||
| Other, net | 10 | — | |||||||||
Net cash (used in) provided by financing activities attributable to continuing operations | (335,368) | 23,629 | |||||||||
Total cash used in continuing operations | (340,922) | (499,072) | |||||||||
Net cash used in operating activities attributable to discontinued operations | — | — | |||||||||
| Net cash used in investing activities attributable to discontinued operations | — | — | |||||||||
| Net cash used in financing activities attributable to discontinued operations | — | — | |||||||||
Total cash used in discontinued operations | — | — | |||||||||
| Effect of exchange rate changes on cash, cash equivalents, and restricted cash | (10,786) | (3,636) | |||||||||
| Net decrease in cash, cash equivalents, and restricted cash | (351,708) | (502,708) | |||||||||
| Cash, cash equivalents, and restricted cash at beginning of period | 815,512 | 739,302 | |||||||||
| Cash, cash equivalents, and restricted cash at end of period | $ | 463,804 | $ | 236,594 | |||||||
| 19 | |||||||
Earnings Per Share
The following tables set forth the computation of the basic and diluted earnings per share attributable to Match Group shareholders:
| Three Months Ended June 30, | |||||||||||||||||||||||
| 2022 | 2021 | ||||||||||||||||||||||
| Basic | Diluted | Basic | Diluted | ||||||||||||||||||||
| (In thousands, except per share data) | |||||||||||||||||||||||
| Numerator | |||||||||||||||||||||||
| Net (loss) earnings from continuing operations | $ | (32,365) | $ | (32,365) | $ | 140,020 | $ | 140,020 | |||||||||||||||
Net loss attributable to noncontrolling interests | 507 | 507 | 366 | 366 | |||||||||||||||||||
Impact from subsidiaries’ dilutive securities of continuing operations | — | — | — | (388) | |||||||||||||||||||
| Interest on dilutive Exchangeable Senior Notes, net of tax | — | — | — | 4,075 | |||||||||||||||||||
Net (loss) earnings from continuing operations attributable to Match Group, Inc. shareholders | $ | (31,858) | $ | (31,858) | $ | 140,386 | $ | 144,073 | |||||||||||||||
| Earnings from discontinued operations, net of tax | $ | — | $ | — | $ | 509 | $ | 509 | |||||||||||||||
| Net earnings from discontinued operations attributable to shareholders | — | — | 509 | 509 | |||||||||||||||||||
Net (loss) earnings attributable to Match Group, Inc. shareholders | $ | (31,858) | $ | (31,858) | $ | 140,895 | $ | 144,582 | |||||||||||||||
| Denominator | |||||||||||||||||||||||
| Weighted average basic shares outstanding | 285,126 | 285,126 | 271,254 | 271,254 | |||||||||||||||||||
Dilutive securities | — | — | — | 14,671 | |||||||||||||||||||
| Dilutive shares from Exchangeable Senior Notes, if-converted | — | — | — | 25,162 | |||||||||||||||||||
Denominator for (loss) earnings per share—weighted average shares | 285,126 | 285,126 | 271,254 | 311,087 | |||||||||||||||||||
| (Loss) earnings per share: | |||||||||||||||||||||||
| (Loss) earnings per share from continuing operations | $ | (0.11) | $ | (0.11) | $ | 0.52 | $ | 0.46 | |||||||||||||||
| Earnings per share from discontinued operations, net of tax | $ | — | $ | — | $ | 0.00 | $ | 0.00 | |||||||||||||||
| (Loss) earnings per share attributable to Match Group, Inc. shareholders | $ | (0.11) | $ | (0.11) | $ | 0.52 | $ | 0.46 | |||||||||||||||
| 20 | |||||||
| Six Months Ended June 30, | |||||||||||||||||||||||
| 2022 | 2021 | ||||||||||||||||||||||
| Basic | Diluted | Basic | Diluted | ||||||||||||||||||||
| (In thousands, except per share data) | |||||||||||||||||||||||
| Numerator | |||||||||||||||||||||||
Net earnings from continuing operations | $ | 148,242 | $ | 148,242 | $ | 313,868 | $ | 313,868 | |||||||||||||||
Net loss attributable to noncontrolling interests | 433 | 433 | 768 | 768 | |||||||||||||||||||
Impact from subsidiaries’ dilutive securities of continuing operations | — | (153) | — | (428) | |||||||||||||||||||
| Interest on dilutive Exchangeable Senior Notes, net of tax | — | 2,218 | — | 8,150 | |||||||||||||||||||
Net earnings from continuing operations attributable to Match Group, Inc. shareholders | $ | 148,675 | $ | 150,740 | $ | 314,636 | $ | 322,358 | |||||||||||||||
| Earnings from discontinued operations, net of tax | $ | — | $ | — | $ | 509 | $ | 509 | |||||||||||||||
| Net earnings from discontinued operations attributable to shareholders | — | — | 509 | 509 | |||||||||||||||||||
Net earnings attributable to Match Group, Inc. shareholders | $ | 148,675 | $ | 150,740 | $ | 315,145 | $ | 322,867 | |||||||||||||||
| Denominator | |||||||||||||||||||||||
| Weighted average basic shares outstanding | 284,794 | 284,794 | 269,959 | 269,959 | |||||||||||||||||||
Dilutive securities | — | 5,949 | — | 15,735 | |||||||||||||||||||
| Dilutive shares from Exchangeable Senior Notes, if-converted | — | 7,955 | — | 25,162 | |||||||||||||||||||
| Denominator for earnings per share—weighted average shares | 284,794 | 298,698 | 269,959 | 310,856 | |||||||||||||||||||
Earnings per share: | |||||||||||||||||||||||
Earnings per share from continuing operations | $ | 0.52 | $ | 0.50 | $ | 1.17 | $ | 1.04 | |||||||||||||||
| Earnings per share from discontinued operations, net of tax | $ | — | $ | — | $ | 0.00 | $ | 0.00 | |||||||||||||||
Earnings per share attributable to Match Group, Inc. shareholders | $ | 0.52 | $ | 0.50 | $ | 1.17 | $ | 1.04 | |||||||||||||||
| 21 | |||||||
Trended Metrics
| 2020 | 2021 | 2022 | Year Ended December 31, | ||||||||||||||||||||||||||||||||||||||||||||||||||||||||||||||||||||
| Q1 | Q2 | Q3 | Q4 | Q1 | Q2 | Q3 | Q4 | Q1 | Q2 | 2020 | 2021 | ||||||||||||||||||||||||||||||||||||||||||||||||||||||||||||
Revenue (in millions, rounding differences may occur) | |||||||||||||||||||||||||||||||||||||||||||||||||||||||||||||||||||||||
| Direct Revenue | |||||||||||||||||||||||||||||||||||||||||||||||||||||||||||||||||||||||
| Americas | $ | 281.2 | $ | 298.7 | $ | 336.8 | $ | 331.2 | $ | 344.3 | $ | 374.4 | $ | 393.6 | $ | 399.8 | $ | 400.0 | $ | 408.7 | $ | 1,248.0 | $ | 1,512.1 | |||||||||||||||||||||||||||||||||||||||||||||||
| Europe | 156.5 | 154.1 | 181.6 | 188.0 | 189.1 | 196.5 | 217.7 | 218.5 | 215.3 | 208.5 | 680.1 | 821.8 | |||||||||||||||||||||||||||||||||||||||||||||||||||||||||||
| APAC and Other | 97.1 | 94.0 | 109.8 | 115.7 | 121.9 | 123.4 | 174.4 | 169.3 | 168.5 | 163.0 | 416.6 | 589.0 | |||||||||||||||||||||||||||||||||||||||||||||||||||||||||||
| Total Direct Revenue | 534.8 | 546.7 | 628.3 | 634.9 | 655.2 | 694.3 | 785.7 | 787.6 | 783.8 | 780.2 | 2,344.7 | 2,922.9 | |||||||||||||||||||||||||||||||||||||||||||||||||||||||||||
| Indirect Revenue | 9.8 | 8.7 | 11.5 | 16.5 | 12.4 | 13.4 | 16.1 | 18.4 | 14.8 | 14.4 | 46.5 | 60.4 | |||||||||||||||||||||||||||||||||||||||||||||||||||||||||||
| Total Revenue | $ | 544.6 | $ | 555.5 | $ | 639.8 | $ | 651.4 | $ | 667.6 | $ | 707.8 | $ | 801.8 | $ | 806.1 | $ | 798.6 | $ | 794.5 | $ | 2,391.3 | $ | 2,983.3 | |||||||||||||||||||||||||||||||||||||||||||||||
Payers (in thousands) | |||||||||||||||||||||||||||||||||||||||||||||||||||||||||||||||||||||||
| Americas | 6,691 | 6,836 | 7,455 | 7,469 | 7,595 | 7,901 | 8,309 | 8,230 | 8,159 | 8,225 | 7,113 | 8,009 | |||||||||||||||||||||||||||||||||||||||||||||||||||||||||||
| Europe | 3,899 | 3,830 | 4,154 | 4,229 | 4,255 | 4,332 | 4,710 | 4,660 | 4,732 | 4,564 | 4,028 | 4,489 | |||||||||||||||||||||||||||||||||||||||||||||||||||||||||||
| APAC and Other | 2,417 | 2,339 | 2,417 | 2,463 | 2,567 | 2,736 | 3,284 | 3,359 | 3,443 | 3,606 | 2,409 | 2,987 | |||||||||||||||||||||||||||||||||||||||||||||||||||||||||||
| Total Payers | 13,007 | 13,005 | 14,026 | 14,161 | 14,417 | 14,969 | 16,303 | 16,249 | 16,334 | 16,395 | 13,550 | 15,485 | |||||||||||||||||||||||||||||||||||||||||||||||||||||||||||
| RPP | |||||||||||||||||||||||||||||||||||||||||||||||||||||||||||||||||||||||
| Americas | $ | 14.01 | $ | 14.56 | $ | 15.06 | $ | 14.78 | $ | 15.11 | $ | 15.79 | $ | 15.79 | $ | 16.19 | $ | 16.34 | $ | 16.56 | $ | 14.62 | $ | 15.73 | |||||||||||||||||||||||||||||||||||||||||||||||
| Europe | $ | 13.38 | $ | 13.41 | $ | 14.57 | $ | 14.81 | $ | 14.81 | $ | 15.12 | $ | 15.41 | $ | 15.63 | $ | 15.17 | $ | 15.23 | $ | 14.07 | $ | 15.25 | |||||||||||||||||||||||||||||||||||||||||||||||
| APAC and Other | $ | 13.39 | $ | 13.40 | $ | 15.15 | $ | 15.66 | $ | 15.83 | $ | 15.03 | $ | 17.71 | $ | 16.80 | $ | 16.32 | $ | 15.06 | $ | 14.41 | $ | 16.43 | |||||||||||||||||||||||||||||||||||||||||||||||
| Total RPP | $ | 13.71 | $ | 14.01 | $ | 14.93 | $ | 14.95 | $ | 15.15 | $ | 15.46 | $ | 16.06 | $ | 16.16 | $ | 16.00 | $ | 15.86 | $ | 14.42 | $ | 15.73 | |||||||||||||||||||||||||||||||||||||||||||||||
Note: Our ability to eliminate duplicate Payers at a brand level for periods prior to Q2 2020 is impacted by data privacy requirements which require that we anonymize data after 12 months, therefore Payer data for those periods is likely overstated. Additionally, as Payers is a component of the RPP calculation, RPP is likely commensurately understated for these same periods due to these data privacy limitations.
| 22 | |||||||
Reconciliations of GAAP to Non-GAAP Measures
Reconciliation of Net (Loss) Earnings to Adjusted Operating Income
| Three Months Ended June 30, | Six Months Ended June 30, | ||||||||||||||||||||||
| 2022 | 2021 | 2022 | 2021 | ||||||||||||||||||||
| (Dollars in thousands) | |||||||||||||||||||||||
Net (loss) earnings attributable to Match Group, Inc. shareholders | $ | (31,858) | $ | 140,895 | $ | 148,675 | $ | 315,145 | |||||||||||||||
Add back: | |||||||||||||||||||||||
Net loss attributable to noncontrolling interests | (507) | (366) | (433) | (768) | |||||||||||||||||||
| Earnings from discontinued operations, net of tax | — | (509) | — | (509) | |||||||||||||||||||
Income tax (benefit) provision | (8,048) | 37,320 | (14,915) | 19,573 | |||||||||||||||||||
Other (income) expense, net | (5,291) | 355 | (6,109) | 1,674 | |||||||||||||||||||
Interest expense | 35,623 | 32,219 | 70,519 | 64,057 | |||||||||||||||||||
Operating (loss) income | (10,081) | 209,914 | 197,737 | 399,172 | |||||||||||||||||||
| Stock-based compensation expense | 54,767 | 42,396 | 97,062 | 72,512 | |||||||||||||||||||
| Depreciation | 11,488 | 10,061 | 21,985 | 20,518 | |||||||||||||||||||
Impairment and amortization of intangibles | 229,539 | 242 | 242,232 | 455 | |||||||||||||||||||
| Adjusted Operating Income | $ | 285,713 | $ | 262,613 | $ | 559,016 | $ | 492,657 | |||||||||||||||
| Revenue | $ | 794,513 | $ | 707,760 | $ | 1,593,144 | $ | 1,375,372 | |||||||||||||||
| Operating (loss) income margin | (1 | %) | 30 | % | 12 | % | 29 | % | |||||||||||||||
| Adjusted Operating Income margin | 36 | % | 37 | % | 35 | % | 36 | % | |||||||||||||||
| 23 | |||||||
Reconciliation of Net Earnings to Adjusted Operating Income used in Free Cash Flow
| For the years ended December 31, | |||||||||||||||||||||||
| 2018 | 2019 | 2020 | 2021 | ||||||||||||||||||||
| (Dollars in thousands) | |||||||||||||||||||||||
| Net earnings attributable to Match Group, Inc. shareholders | $ | 636,910 | $ | 453,838 | $ | 162,329 | $ | 277,723 | |||||||||||||||
Add back: | |||||||||||||||||||||||
| Net earnings (loss) attributable to noncontrolling interests | 130,786 | 112,689 | 59,280 | (1,169) | |||||||||||||||||||
| (Earnings) loss from discontinued operations, net of tax | (306,643) | (49,187) | 366,070 | (509) | |||||||||||||||||||
| Income tax provision (benefit) | 14,472 | 15,080 | 43,273 | (19,897) | |||||||||||||||||||
| Other (income) expense, net | (7,510) | 2,026 | (15,861) | 465,038 | |||||||||||||||||||
Interest expense | 81,454 | 111,008 | 130,624 | 130,493 | |||||||||||||||||||
Operating income | 549,469 | 645,454 | 745,715 | 851,679 | |||||||||||||||||||
| Stock-based compensation expense | 66,031 | 89,724 | 102,268 | 146,816 | |||||||||||||||||||
| Depreciation | 34,827 | 34,355 | 41,271 | 41,402 | |||||||||||||||||||
Impairment and amortization of intangibles | 1,318 | 8,727 | 7,525 | 28,559 | |||||||||||||||||||
Acquisition-related contingent consideration fair value adjustments | 320 | — | — | — | |||||||||||||||||||
| Adjusted Operating Income | $ | 651,965 | $ | 778,260 | $ | 896,779 | $ | 1,068,456 | |||||||||||||||
Reconciliation of Net Earnings to Adjusted Operating Income used in Leverage Ratios
| Twelve months ended | |||||
| 6/30/2022 | |||||
| (In thousands) | |||||
| Net earnings attributable to Match Group, Inc. shareholders | $ | 111,253 | |||
Add back: | |||||
| Net loss attributable to noncontrolling interests | (834) | ||||
| Income tax benefit | (54,385) | ||||
| Other expense, net | 457,255 | ||||
Interest expense | 136,955 | ||||
Operating Income | 650,244 | ||||
| Stock-based compensation expense | 171,366 | ||||
| Depreciation | 42,869 | ||||
Impairment and amortization of intangibles | 270,336 | ||||
| Adjusted Operating Income | $ | 1,134,815 | |||
| 24 | |||||||
Reconciliation of Operating Cash Flow from Continuing Operations to Free Cash Flow
| Six Months Ended June 30, | |||||||||||
| 2022 | 2021 | ||||||||||
| (In thousands) | |||||||||||
| Net cash provided by operating activities from continuing operations | $ | 19,964 | $ | 350,815 | |||||||
| Capital expenditures | (27,305) | (32,392) | |||||||||
| Free Cash Flow | $ | (7,341) | $ | 318,423 | |||||||
| For the years ended December 31, | |||||||||||||||||||||||
| 2018 | 2019 | 2020 | 2021 | ||||||||||||||||||||
| (In thousands) | |||||||||||||||||||||||
| Net cash provided by operating activities from continuing operations | $ | 611,455 | $ | 647,989 | $ | 788,552 | $ | 912,499 | |||||||||||||||
| Capital expenditures | (31,397) | (39,035) | (42,376) | (79,971) | |||||||||||||||||||
| Free Cash Flow | $ | 580,058 | $ | 608,954 | $ | 746,176 | $ | 832,528 | |||||||||||||||
| Adjusted Operating Income | $ | 651,965 | $ | 778,260 | $ | 896,779 | $ | 1,068,456 | |||||||||||||||
| Free Cash Flow Conversion Rate | 89 | % | 78 | % | 83 | % | 78 | % | |||||||||||||||
Reconciliation of Forecasted Operating Income to Adjusted Operating Income
| Three Months Ended September 30, 2022 | |||||
| (In millions) | |||||
Operating Income | $184 to $189 | ||||
| Stock-based compensation expense | 51 | ||||
| Depreciation and amortization of intangibles | 20 | ||||
| Adjusted Operating Income | $255 to $260 | ||||
| 25 | |||||||
Reconciliation of GAAP Revenue to Non-GAAP Revenue, Excluding Foreign Exchange Effects
| Three Months Ended June 30, | Six Months Ended June 30, | ||||||||||||||||||||||||||||||||||||||||||||||
| 2022 | $ Change | % Change | 2021 | 2022 | $ Change | % Change | 2021 | ||||||||||||||||||||||||||||||||||||||||
| (Dollars in millions, rounding differences may occur) | |||||||||||||||||||||||||||||||||||||||||||||||
| Revenue, as reported | $ | 794.5 | $ | 86.8 | 12% | $ | 707.8 | $ | 1,593.1 | $ | 217.8 | 16% | $ | 1,375.4 | |||||||||||||||||||||||||||||||||
| Foreign exchange effects | 47.8 | 74.0 | |||||||||||||||||||||||||||||||||||||||||||||
| Revenue, excluding foreign exchange effects | $ | 842.3 | $ | 134.6 | 19% | $ | 707.8 | $ | 1,667.1 | $ | 291.7 | 21% | $ | 1,375.4 | |||||||||||||||||||||||||||||||||
| Americas Direct Revenue, as reported | $ | 408.7 | $ | 34.3 | 9% | $ | 374.4 | $ | 808.7 | $ | 90.1 | 13% | $ | 718.7 | |||||||||||||||||||||||||||||||||
| Foreign exchange effects | 1.3 | 1.6 | |||||||||||||||||||||||||||||||||||||||||||||
Americas Direct Revenue, excluding foreign exchange effects | $ | 410.0 | $ | 35.6 | 10% | $ | 374.4 | $ | 810.3 | $ | 91.7 | 13% | $ | 718.7 | |||||||||||||||||||||||||||||||||
| Europe Direct Revenue, as reported | $ | 208.5 | $ | 11.9 | 6% | $ | 196.5 | $ | 423.8 | $ | 38.2 | 10% | $ | 385.6 | |||||||||||||||||||||||||||||||||
| Foreign exchange effects | 25.3 | 39.1 | |||||||||||||||||||||||||||||||||||||||||||||
| Europe Direct Revenue, excluding foreign exchange effects | $ | 233.7 | $ | 37.2 | 19% | $ | 196.5 | $ | 462.9 | $ | 77.3 | 20% | $ | 385.6 | |||||||||||||||||||||||||||||||||
| APAC and Other Direct Revenue, as reported | $ | 163.0 | $ | 39.6 | 32% | $ | 123.4 | $ | 331.5 | $ | 86.2 | 35% | $ | 245.3 | |||||||||||||||||||||||||||||||||
| Foreign exchange effects | 20.7 | 32.4 | |||||||||||||||||||||||||||||||||||||||||||||
| APAC and Other Direct Revenue, excluding foreign exchange effects | $ | 183.6 | $ | 60.2 | 49% | $ | 123.4 | $ | 363.9 | $ | 118.7 | 48% | $ | 245.3 | |||||||||||||||||||||||||||||||||
Reconciliation of GAAP Revenue to Non-GAAP Revenue, Excluding Foreign Exchange Effects (Revenue Per Payer)
| Three Months Ended June 30, | Six Months Ended June 30, | ||||||||||||||||||||||||||||||||||||||||||||||
| 2022 | $ Change | % Change | 2021 | 2022 | $ Change | % Change | 2021 | ||||||||||||||||||||||||||||||||||||||||
| RPP, as reported | $ | 15.86 | $ | 0.40 | 3% | $ | 15.46 | $ | 15.93 | $ | 0.62 | 4% | $ | 15.31 | |||||||||||||||||||||||||||||||||
| Foreign exchange effects | 0.96 | 0.74 | |||||||||||||||||||||||||||||||||||||||||||||
| RPP, excluding foreign exchange effects | $ | 16.82 | $ | 1.36 | 9% | $ | 15.46 | $ | 16.67 | $ | 1.36 | 9% | $ | 15.31 | |||||||||||||||||||||||||||||||||
| Americas RPP, as reported | $ | 16.56 | $ | 0.77 | 5% | $ | 15.79 | $ | 16.45 | $ | 0.99 | 6% | $ | 15.46 | |||||||||||||||||||||||||||||||||
| Foreign exchange effects | 0.05 | 0.04 | |||||||||||||||||||||||||||||||||||||||||||||
| Americas RPP, excluding foreign exchange effects | $ | 16.61 | $ | 0.82 | 5% | $ | 15.79 | $ | 16.49 | $ | 1.03 | 7% | $ | 15.46 | |||||||||||||||||||||||||||||||||
| Europe RPP, as reported | $ | 15.23 | 0.11 | 1% | $ | 15.12 | $ | 15.20 | 0.23 | 2% | $ | 14.97 | |||||||||||||||||||||||||||||||||||
| Foreign exchange effects | 1.84 | 0.79 | |||||||||||||||||||||||||||||||||||||||||||||
| Europe RPP, excluding foreign exchange effects | $ | 17.07 | $ | 1.95 | 13% | $ | 15.12 | $ | 15.99 | $ | 1.02 | 7% | $ | 14.97 | |||||||||||||||||||||||||||||||||
| APAC and Other RPP, as reported | $ | 15.06 | $ | 0.03 | —% | $ | 15.03 | $ | 15.68 | $ | 0.26 | 2% | $ | 15.42 | |||||||||||||||||||||||||||||||||
| Foreign exchange effects | 1.92 | 1.53 | |||||||||||||||||||||||||||||||||||||||||||||
| APAC and Other RPP, excluding foreign exchange effects | $ | 16.98 | $ | 1.95 | 13% | $ | 15.03 | $ | 17.21 | $ | 1.79 | 12% | $ | 15.42 | |||||||||||||||||||||||||||||||||
| 26 | |||||||
Reconciliation of GAAP Revenue to Non-GAAP Revenue, Excluding Foreign Exchange Effects
| Total Revenue | Tinder Direct Revenue | ||||||||||||||||||||||||||||||||||||||||||||||
| (Dollars in millions, rounding differences may occur) | |||||||||||||||||||||||||||||||||||||||||||||||
| Three Months Ended June 30, | Three Months Ended June 30, | ||||||||||||||||||||||||||||||||||||||||||||||
| 2022 | $ Change | % Change | 2021 | 2022 | $ Change | % Change | 2021 | ||||||||||||||||||||||||||||||||||||||||
| Revenue, as reported | $ | 794.5 | $ | 86.8 | 12% | $ | 707.8 | $ | 449.1 | $ | 50.4 | 13% | $ | 398.7 | |||||||||||||||||||||||||||||||||
| Foreign exchange effects | 47.8 | 29.2 | |||||||||||||||||||||||||||||||||||||||||||||
| Revenue, excluding foreign exchange effects | $ | 842.3 | $ | 134.6 | 19% | $ | 707.8 | $ | 478.3 | $ | 79.6 | 20% | $ | 398.7 | |||||||||||||||||||||||||||||||||
| Three Months Ended March 31, | Three Months Ended March 31, | ||||||||||||||||||||||||||||||||||||||||||||||
| 2022 | $ Change | % Change | 2021 | 2022 | $ Change | % Change | 2021 | ||||||||||||||||||||||||||||||||||||||||
| Revenue, as reported | $ | 798.6 | $ | 131.0 | 20% | $ | 667.6 | $ | 441.0 | $ | 67.7 | 18% | $ | 373.3 | |||||||||||||||||||||||||||||||||
| Foreign exchange effects | 26.2 | 17.7 | |||||||||||||||||||||||||||||||||||||||||||||
| Revenue, excluding foreign exchange effects | $ | 824.8 | $ | 157.2 | 24% | $ | 667.6 | $ | 458.7 | $ | 85.4 | 23% | $ | 373.3 | |||||||||||||||||||||||||||||||||
| Three Months Ended December 31, | Three Months Ended December 31, | ||||||||||||||||||||||||||||||||||||||||||||||
| 2021 | $ Change | % Change | 2020 | 2021 | $ Change | % Change | 2020 | ||||||||||||||||||||||||||||||||||||||||
| Revenue, as reported | $ | 806.1 | $ | 154.7 | 24% | $ | 651.4 | $ | 443.7 | $ | 82.5 | 23% | $ | 361.2 | |||||||||||||||||||||||||||||||||
| Foreign exchange effects | 11.9 | 7.2 | |||||||||||||||||||||||||||||||||||||||||||||
| Revenue, excluding foreign exchange effects | $ | 817.9 | $ | 166.5 | 26% | $ | 651.4 | $ | 450.9 | $ | 89.7 | 25% | $ | 361.2 | |||||||||||||||||||||||||||||||||
| Three Months Ended September 30, | Three Months Ended September 30, | ||||||||||||||||||||||||||||||||||||||||||||||
| 2021 | $ Change | % Change | 2020 | 2021 | $ Change | % Change | 2020 | ||||||||||||||||||||||||||||||||||||||||
| Revenue, as reported | $ | 801.8 | $ | 162.1 | 25% | $ | 639.8 | $ | 434.0 | $ | 73.0 | 20% | $ | 360.9 | |||||||||||||||||||||||||||||||||
| Foreign exchange effects | (3.8) | (3.5) | |||||||||||||||||||||||||||||||||||||||||||||
| Revenue, excluding foreign exchange effects | $ | 798.1 | $ | 158.4 | 25% | $ | 639.8 | $ | 430.5 | $ | 69.5 | 19% | $ | 360.9 | |||||||||||||||||||||||||||||||||
| 27 | |||||||
Dilutive Securities
Match Group has various tranches of dilutive securities. The table below details these securities and their potentially dilutive impact (shares in millions; rounding differences may occur).
| Average Exercise Price | 7/29/2022 | ||||||||||
| Share Price | $73.31 | ||||||||||
| Absolute Shares | 283.0 | ||||||||||
| Vested Options | $20.46 | 2.6 | |||||||||
| Unvested Options and Awards | |||||||||||
| Unvested Options | $33.62 | 0.1 | |||||||||
| RSUs and subsidiary denominated equity awards | 5.8 | ||||||||||
| Total Dilution - Unvested Options and Awards | 5.9 | ||||||||||
| Outstanding Warrants | |||||||||||
| Warrants expiring on January 1, 2023 (1.9 million outstanding) | $68.22 | 0.1 | |||||||||
| Warrants expiring on September 15, 2026 (6.6 million outstanding) | $134.76 | — | |||||||||
| Warrants expiring on April 15, 2030 (6.8 million outstanding) | $134.82 | — | |||||||||
| Total Dilution - Outstanding Warrants | 0.1 | ||||||||||
| Total Dilution | 8.6 | ||||||||||
| % Dilution | 2.9% | ||||||||||
| Total Diluted Shares Outstanding | 291.6 | ||||||||||
The dilutive securities presentation above is calculated using the methods and assumptions described below; these are different from GAAP dilution, which is calculated based on the treasury stock method.
Options — The table above assumes the option exercise price is used to repurchase Match Group shares.
RSUs and subsidiary denominated equity awards — The table above assumes RSUs are fully dilutive. All performance-based and market-based awards reflect the expected shares that will vest based on current performance or market estimates. The table assumes no change in the fair value estimate of the subsidiary denominated equity awards from the values used for GAAP purposes at June 30, 2022.
Exchangeable Senior Notes — The Company has three series of Exchangeable Senior Notes outstanding. In the event of an exchange, each series of Exchangeable Senior Notes can be settled in cash, shares, or a combination of cash and shares. At the time of each Exchangeable Senior Notes issuance, the Company purchased call options with a strike price equal to the exchange price of each series of Exchangeable Senior Notes (“Note Hedge”), which can be used to offset the dilution of each series of the Exchangeable Senior Notes. No dilution is reflected in the table above for any of the Exchangeable Senior Notes, of which only the 2022 Exchangeable Notes are currently exchangeable, because it is the Company’s intention to settle the Exchangeable Senior Notes with cash equal to the face amount of the notes; any shares issued would be offset by shares received upon exercise of the Note Hedge.
Warrants — At the time of the issuance of each series of Exchangeable Senior Notes, the Company also sold warrants for the number of shares with the strike prices reflected in the table above. The cash generated from the exercise of the warrants is assumed to be used to repurchase Match Group shares and the resulting net dilution, if any, is reflected in the table above.
| 28 | |||||||
Non-GAAP Financial Measures
Match Group reports Adjusted Operating Income, Adjusted Operating Income Margin, Free Cash Flow, Free Cash Flow Conversion Rate, and Revenue Excluding Foreign Exchange Effects, all of which are supplemental measures to U.S. generally accepted accounting principles (“GAAP”). The Adjusted Operating Income, Adjusted Operating Income Margin, Free Cash Flow, and Free Cash Flow Conversion Rate measures are among the primary metrics by which we evaluate the performance of our business, on which our internal budget is based and by which management is compensated. Revenue Excluding Foreign Exchange Effects provides a comparable framework for assessing the performance of our business without the effect of exchange rate differences when compared to prior periods. We believe that investors should have access to the same set of tools that we use in analyzing our results. These non-GAAP measures should be considered in addition to results prepared in accordance with GAAP, but should not be considered a substitute for or superior to GAAP results. Match Group endeavors to compensate for the limitations of the non-GAAP measures presented by providing the comparable GAAP measures and descriptions of the reconciling items, including quantifying such items, to derive the non-GAAP measures. We encourage investors to examine the reconciling adjustments between the GAAP and non-GAAP measures, which we describe below. Interim results are not necessarily indicative of the results that may be expected for a full year.
Definitions of Non-GAAP Measures
Adjusted Operating Income is defined as operating (loss) income excluding: (1) stock-based compensation expense; (2) depreciation; and (3) acquisition-related items consisting of (i) amortization of intangible assets and impairments of goodwill and intangible assets, if applicable, and (ii) gains and losses recognized on changes in the fair value of contingent consideration arrangements, as applicable. We believe Adjusted Operating Income is useful to analysts and investors as this measure allows a more meaningful comparison between our performance and that of our competitors. The above items are excluded from our Adjusted Operating Income measure because they are non-cash in nature. Adjusted Operating Income has certain limitations because it excludes certain expenses.
Adjusted Operating Income Margin is defined as Adjusted Operating Income divided by revenues. We believe Adjusted Operating Income Margin is useful for analysts and investors as this measure allows a more meaningful comparison between our performance and that of our competitors. Adjusted Operating Income margin has certain limitations in that it does not take into account the impact to our consolidated statement of operations of certain expenses.
Free Cash Flow is defined as net cash provided by operating activities, less capital expenditures. We believe Free Cash Flow is useful to investors because it represents the cash that our operating businesses generate, before taking into account non-operational cash movements. Free Cash Flow has certain limitations in that it does not represent the total increase or decrease in the cash balance for the period, nor does it represent the residual cash flow for discretionary expenditures. Therefore, we think it is important to evaluate Free Cash Flow along with our consolidated statement of cash flows.
We look at Free Cash Flow as a measure of the strength and performance of our businesses, not for valuation purposes. In our view, applying “multiples” to Free Cash Flow is inappropriate because it is subject to timing, seasonality and one-time events. We manage our business for cash and we think it is of utmost importance to maximize cash – but our primary valuation metric is Adjusted Operating Income.
Free Cash Flow Conversion Rate is defined as Free Cash Flow divided by Adjusted Operating Income. We believe Free Cash Flow Conversion Rate is useful for analysts and investors as this measure allows for a more meaningful comparison between our performance and that of our competitors. Free Cash Flow Conversion Rate has certain limitations in that it does not represent the total increase or decrease in the cash balance for the quarter, it does not represent the residual cash flow for discretionary expenditures, and it does not take into account the impact of certain expenses to our consolidated statement of operations.
Revenue Excluding Foreign Exchange Effects is calculated by translating current period revenues using prior period exchange rates. The percentage change in Revenue Excluding Foreign Exchange Effects is calculated by determining the change in current period revenues over prior period revenues where current period revenues are translated using prior period exchange rates. We believe the impact of foreign exchange rates on Match Group, due to its global reach, may be an important factor in understanding period over period comparisons if movement in rates is significant. Since our results are reported in U.S. dollars, international revenues are favorably impacted
| 29 | |||||||
as the U.S. dollar weakens relative to other currencies, and unfavorably impacted as the U.S. dollar strengthens relative to other currencies. We believe the presentation of revenue excluding foreign exchange effects in addition to reported revenue helps improve the ability to understand Match Group’s performance because it excludes the impact of foreign currency volatility that is not indicative of Match Group’s core operating results.
Non-Cash Expenses That Are Excluded From Our Non-GAAP Measures
Stock-based compensation expense consists principally of expense associated with the grants of stock options, RSUs, performance-based RSUs and market-based awards. These expenses are not paid in cash, and we include the related shares in our fully diluted shares outstanding using the treasury stock method; however, performance-based RSUs and market-based awards are included only to the extent the applicable performance or market condition(s) have been met (assuming the end of the reporting period is the end of the contingency period). To the extent stock-based awards are settled on a net basis, we remit the required tax-withholding amounts from our current funds.
Depreciation is a non-cash expense relating to our property and equipment and is computed using the straight-line method to allocate the cost of depreciable assets to operations over their estimated useful lives, or, in the case of leasehold improvements, the lease term, if shorter.
Amortization of intangible assets and impairments of goodwill and intangible assets are non-cash expenses related primarily to acquisitions. At the time of an acquisition, the identifiable definite-lived intangible assets of the acquired company, such as customer lists, trade names and technology, are valued and amortized over their estimated lives. Value is also assigned to (i) acquired indefinite-lived intangible assets, which consist of trade names and trademarks, and (ii) goodwill, which are not subject to amortization. An impairment is recorded when the carrying value of an intangible asset or goodwill exceeds its fair value. We believe that intangible assets represent costs incurred by the acquired company to build value prior to acquisition and the related amortization and impairment charges of intangible assets or goodwill, if applicable, are not ongoing costs of doing business.
Gains and losses recognized on changes in the fair value of contingent consideration arrangements are accounting adjustments to report contingent consideration liabilities at fair value. These adjustments can be highly variable and are excluded from our assessment of performance because they are considered non-operational in nature and, therefore, are not indicative of current or future performance or the ongoing cost of doing business.
Additional Definitions
Americas includes North America, Central America, South America, and the Caribbean islands.
Europe includes continental Europe, the British Isles, Iceland, Greenland, and Russia, but excludes Turkey (which is included in APAC and Other).
APAC and Other includes Asia, Australia, the Pacific islands, the Middle East, and Africa.
Direct Revenue is revenue that is received directly from end users of our services and includes both subscription and à la carte revenue.
Indirect Revenue is revenue that is not received directly from end users of our services, substantially all of which is advertising revenue.
Payers are unique users at a brand level in a given month from whom we earned Direct Revenue. When presented as a quarter-to-date or year-to-date value, Payers represents the average of the monthly values for the respective period presented. At a consolidated level, duplicate Payers may exist when we earn revenue from the same individual at multiple brands in a given month, as we are unable to identify unique individuals across brands in the Match Group portfolio.
Revenue Per Payer (“RPP”) is the average monthly revenue earned from a Payer and is Direct Revenue for a period divided by the Payers in the period, further divided by the number of months in the period.
Leverage on a gross basis is calculated as principal debt balance divided by Adjusted Operating Income for the period referenced.
Leverage on a net basis is calculated as principal debt balance less cash and cash equivalents and short-term investments divided by Adjusted Operating Income for the period referenced.
| 30 | |||||||
Other Information
Safe Harbor Statement Under the Private Securities Litigation Reform Act of 1995
This letter and our conference call, which will be held at 8:30 a.m. Eastern Time on August 3, 2022, may contain “forward-looking statements” within the meaning of the Private Securities Litigation Reform Act of 1995. All statements that are not historical facts are “forward looking statements.” The use of words such as “anticipates,” “estimates,” “expects,” “plans” and “believes,” among others, generally identify forward-looking statements. These forward-looking statements include, among others, statements relating to: Match Group’s future financial performance, Match Group’s business prospects and strategy, anticipated trends, and other similar matters. These forward-looking statements are based on management’s current expectations and assumptions about future events, which are inherently subject to uncertainties, risks and changes in circumstances that are difficult to predict. Actual results could differ materially from those contained in these forward-looking statements for a variety of reasons, including, among others: competition, our ability to maintain user rates on our higher monetizing services, our ability to attract users to our services through cost-effective marketing and related efforts, foreign currency exchange rate fluctuations, our ability to distribute our services through third parties and offset related fees, the integrity and scalability of our systems and infrastructure (and those of third parties) and our ability to adapt ours to changes in a timely and cost-effective manner, our ability to protect our systems from cyberattacks and to protect personal and confidential user information, risks relating to certain of our international operations and acquisitions, certain risks relating to our relationship with IAC post-separation, the impact of the outbreak of COVID-19 coronavirus, the risks inherent in separating Match Group from IAC, including uncertainties related to, among other things, the expected benefits of the separation, any litigation arising out of or relating to the transaction, the tax treatment of the transaction, and the impact of the separation on the businesses of Match Group, and uncertainties related to the acquisition of Hyperconnect, including, among other things, the expected benefits of the transaction, any litigation arising out of or relating to the transaction, and the impact of the transaction on the businesses of Match Group. Certain of these and other risks and uncertainties are discussed in Match Group’s filings with the Securities and Exchange Commission. Other unknown or unpredictable factors that could also adversely affect Match Group’s business, financial condition and results of operations may arise from time to time. In light of these risks and uncertainties, these forward-looking statements may not prove to be accurate. Accordingly, you should not place undue reliance on these forward-looking statements, which only reflect the views of Match Group management as of the date of this letter. Match Group does not undertake to update these forward-looking statements.
About Match Group
Match Group (NASDAQ: MTCH), through its portfolio companies, is a leading provider of digital technologies designed to help people make meaningful connections. Our global portfolio of brands includes Tinder®, Match®, Hinge®, Meetic®, OkCupid®, Pairs™, PlentyOfFish®, OurTime®, Azar®, Hakuna Live™, and more, each built to increase our users’ likelihood of connecting with others. Through our trusted brands, we provide tailored services to meet the varying preferences of our users. Our services are available in over 40 languages to our users all over the world.
Contact Us
Tanny Shelburne Match Group Investor Relations ir@match.com | Justine Sacco Match Group Corporate Communications matchgroupPR@match.com | ||||
Match Group 8750 North Central Expressway, Suite 1400, Dallas, TX 75231, (214) 576-9352 https://mtch.com | |||||
| 31 | |||||||
Serious News for Serious Traders! Try StreetInsider.com Premium Free!
You May Also Be Interested In
- Hinge Introduces Hidden Words to Give Daters Curated Control of Comments
- GWM Holds Global Press Conference, Demonstrating Determination to Develop Globally
- Match Group Releases Annual Impact Report
Create E-mail Alert Related Categories
SEC FilingsSign up for StreetInsider Free!
Receive full access to all new and archived articles, unlimited portfolio tracking, e-mail alerts, custom newswires and RSS feeds - and more!
