

Form 8-K JANUS HENDERSON GROUP For: May 04
 Tweet
Tweet Share
ShareExhibit 99.1

Janus Henderson Group plc Reports First Quarter 2022 Results
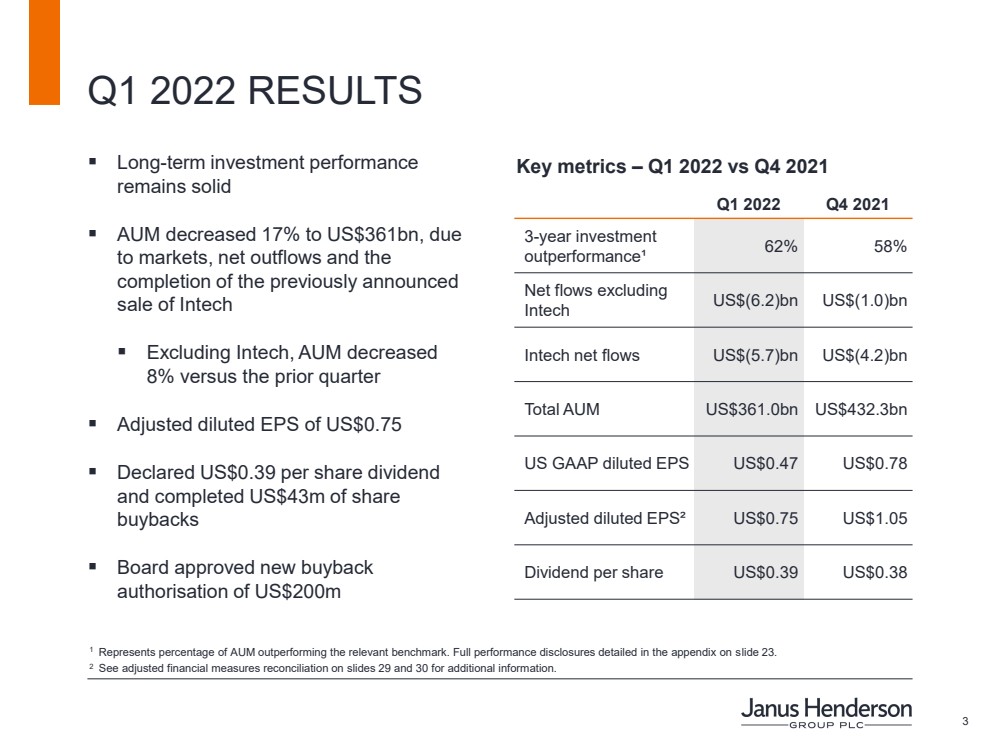
| ● | First quarter 2022 operating income was US$124.6 million; first quarter 2022 adjusted operating income was US$178.8 million |
| ● | Completed US$43 million of share buybacks during the first quarter |
| ● | Board declared 3% increase of quarterly dividend to US$0.39 per share and approved authorisation of US$200 million of buybacks through April 2023 |
| ● | Closed the previously announced sale of our Quantitative Equities subsidiary, Intech Investment Management LLC (‘Intech’), on 31 March 2022 |
LONDON — Janus Henderson Group plc (NYSE/ASX: JHG; ‘Janus Henderson’, ‘JHG’, ‘the Group’) published its first quarter 2022 results for the period ended 31 March 2022.
First quarter 2022 operating income was US$124.6 million compared to US$157.6 million in the fourth quarter 2021 and US$192.5 million in the first quarter 2021. Adjusted operating income, adjusted for one-time, acquisition and transaction related costs, was US$178.8 million in the first quarter 2022 compared to US$239.7 million in the fourth quarter 2021 and US$201.5 million in the first quarter 2021.
First quarter 2022 diluted earnings per share of US$0.47 compared to US$0.78 in the fourth quarter 2021 and US$0.88 in the first quarter 2021. Adjusted diluted earnings per share of US$0.75 in the first quarter 2022 compared to US$1.05 in the fourth quarter 2021 and compared to US$0.91 in the first quarter 2021.
Roger Thompson, Interim Chief Executive Officer and Chief Financial Officer of Janus Henderson Group plc, stated:
“In an ongoing challenging market environment which is impacting our outlook and flows, our first quarter results reflect solid long-term investment performance, robust financials, although down on the prior quarter, and continued capital return to shareholders. We returned US$107 million through dividends and share buybacks in the first quarter, and we are pleased to announce a 3% dividend increase and a new US$200 million share buyback authorisation to be completed prior to next year’s annual shareholder meeting.
“We are excited to have Ali Dibadj begin as CEO next month, and while we transition to a new CEO, we continue to make progress on delivering our strategic initiatives, including closing the sale of Intech.”
Page | 1
SUMMARY OF FINANCIAL RESULTS (unaudited) (in US$ millions, except per share data or as noted)
The Group presents its financial results in US$ and in accordance with accounting principles generally accepted in the United States of America (‘US GAAP’ or ‘GAAP’). However, JHG management evaluates the profitability of the Group and its ongoing operations using additional non-GAAP financial measures. Management uses these performance measures to evaluate the business, and adjusted values are consistent with internal management reporting. See ‘Reconciliation of non-GAAP financial information’ below for additional information.
| | Three months ended | | ||||
| | 31 Mar | | 31 Dec | | 31 Mar | |
|
| 2022 |
| 2021 |
| 2021 | |
GAAP basis: |
|
|
|
|
| |
|
Revenue |
| 620.0 |
| 697.2 |
| 644.0 |
|
Operating expenses |
| 495.4 |
| 539.6 |
| 451.5 |
|
Operating income |
| 124.6 |
| 157.6 |
| 192.5 |
|
Operating margin |
| 20.1 | % | 22.6 | % | 29.9 | % |
Net income attributable to JHG |
| 78.7 |
| 132.5 |
| 155.5 |
|
Diluted earnings per share |
| 0.47 |
| 0.78 |
| 0.88 |
|
| | | | | | | |
Adjusted basis: |
| | | |
| |
|
Revenue |
| 478.2 |
| 549.9 |
| 516.6 |
|
Operating expenses |
| 299.4 |
| 310.2 |
| 315.1 |
|
Operating income |
| 178.8 |
| 239.7 |
| 201.5 |
|
Operating margin |
| 37.4 | % | 43.6 | % | 39.0 | % |
Net income attributable to JHG |
| 125.8 |
| 180.1 |
| 161.5 |
|
Diluted earnings per share |
| 0.75 |
| 1.05 |
| 0.91 |
|
DIVIDEND AND SHARE BUYBACK
On 3 May 2022, the Board declared a first quarter dividend in respect of the three months ended 31 March 2022 of US$0.39 per share. Shareholders on the register on the record date of 16 May 2022 will be paid the dividend on 31 May 2022. Janus Henderson does not offer a dividend reinvestment plan.
As part of the US$200 million on-market buyback programme approved by the Board in July 2021, JHG purchased approximately 1.3 million of its ordinary shares on the New York Stock Exchange (‘NYSE’) and its CHESS Depositary Interests (‘CDIs’) on the Australian Securities Exchange (‘ASX’) in the first quarter, for a total outlay of US$43.3 million.
Additionally, on 3 May 2022, and subject to formally appointing a corporate broker, the Board authorised JHG to commence a new on-market buyback programme, on a date to be determined and announced by JHG. The Group intends to spend up to US$200 million to buy its ordinary shares on the NYSE and its CDIs on the ASX prior to our 2023 Annual General Meeting of Shareholders. Further information regarding the proposed on-market buyback programme will be announced immediately prior to its finalisation and formal launch.
Net tangible assets per share
US$ |
| 31 Mar 2022 |
| 31 Dec 2021 |
Net tangible assets / (liabilities) per ordinary share |
| 4.16 |
| 4.41 |
Net tangible assets are defined by the ASX as being total assets less intangible assets less total liabilities ranking ahead of, or equally with, claims of ordinary shares.
Page | 2
AUM AND FLOWS (in US$ billions)
FX reflects movement in AUM resulting from changes in foreign currency rates as non-US$ denominated AUM is translated into US$. Redemptions include impact of client switches.
Total Group comparative AUM and flows
| | Three months ended | ||||
| | 31 Mar | | 31 Dec | | 31 Mar |
|
| 2022 |
| 2021 |
| 2021 |
Opening AUM |
| 432.3 |
| 419.3 |
| 401.6 |
Sales |
| 17.9 |
| 19.3 |
| 20.7 |
Redemptions |
| (29.8) |
| (24.5) |
| (24.0) |
Net sales / (redemptions) |
| (11.9) |
| (5.2) |
| (3.3) |
Market / FX |
| (31.1) |
| 18.2 |
| 6.8 |
Reclassifications and disposals1 | | (28.3) | | — | | — |
Closing AUM |
| 361.0 |
| 432.3 |
| 405.1 |
| 1 | Disposals relate to the sale of Intech, and reclassifications relate to a reclassification of existing funds from Quantitative Equities to Equities. |
Quarterly AUM and flows by capability
|
| |
| |
| |
| |
| Total excl |
| |
| |
| | | | Fixed | | | | | | Quantitative | | Quantitative | | |
| | Equities | | Income | | Multi-Asset | | Alternatives | | Equities | | Equities | | Total |
AUM 31 Mar 2021 | | 224.9 | | 79.5 | | 49.5 | | 9.9 | | 363.8 | | 41.3 | | 405.1 |
Sales |
| 8.6 |
| 5.9 |
| 2.4 |
| 1.3 |
| 18.2 |
| 0.2 |
| 18.4 |
Redemptions |
| (10.5) |
| (6.0) |
| (1.9) |
| (1.0) |
| (19.4) |
| (1.5) |
| (20.9) |
Net sales / (redemptions) |
| (1.9) |
| (0.1) |
| 0.5 |
| 0.3 |
| (1.2) |
| (1.3) |
| (2.5) |
Market / FX |
| 17.1 |
| 1.1 |
| 3.2 |
| 0.2 |
| 21.6 |
| 3.4 |
| 25.0 |
AUM 30 Jun 2021 |
| 240.1 |
| 80.5 |
| 53.2 |
| 10.4 |
| 384.2 |
| 43.4 |
| 427.6 |
Sales |
| 7.5 |
| 4.7 |
| 2.6 |
| 1.1 |
| 15.9 |
| 0.1 |
| 16.0 |
Redemptions |
| (10.1) |
| (4.0) |
| (1.8) |
| (0.8) |
| (16.7) |
| (4.5) |
| (21.2) |
Net sales / (redemptions) | | (2.6) |
| 0.7 |
| 0.8 |
| 0.3 |
| (0.8) |
| (4.4) |
| (5.2) |
Market / FX |
| (1.3) |
| (1.7) |
| (0.1) |
| (0.1) |
| (3.2) |
| 0.1 |
| (3.1) |
AUM 30 Sep 2021 |
| 236.2 |
| 79.5 |
| 53.9 |
| 10.6 |
| 380.2 |
| 39.1 |
| 419.3 |
Sales |
| 8.1 |
| 5.6 |
| 4.3 |
| 1.2 |
| 19.2 |
| 0.1 |
| 19.3 |
Redemptions |
| (11.3) |
| (5.5) |
| (2.2) |
| (1.2) |
| (20.2) |
| (4.3) |
| (24.5) |
Net sales / (redemptions) |
| (3.2) |
| 0.1 |
| 2.1 |
| — |
| (1.0) |
| (4.2) |
| (5.2) |
Market / FX |
| 11.3 |
| — |
| 3.7 |
| 0.1 |
| 15.1 |
| 3.1 |
| 18.2 |
AUM 31 Dec 2021 |
| 244.3 |
| 79.6 |
| 59.7 |
| 10.7 |
| 394.3 |
| 38.0 |
| 432.3 |
Sales |
| 8.5 |
| 6.0 |
| 2.3 |
| 0.9 |
| 17.7 |
| 0.2 |
| 17.9 |
Redemptions |
| (12.3) |
| (6.0) |
| (4.5) |
| (1.1) |
| (23.9) |
| (5.9) |
| (29.8) |
Net sales / (redemptions) |
| (3.8) |
| — |
| (2.2) |
| (0.2) |
| (6.2) |
| (5.7) |
| (11.9) |
Market / FX |
| (20.5) |
| (4.1) |
| (3.6) |
| (0.2) |
| (28.4) |
| (2.7) |
| (31.1) |
Reclassification and disposals1 |
| 1.3 |
| — |
| — |
| — |
| 1.3 |
| (29.6) |
| (28.3) |
AUM 31 Mar 2022 |
| 221.3 |
| 75.5 |
| 53.9 |
| 10.3 |
| 361.0 |
| — |
| 361.0 |
| 1 | Disposals relate to the sale of Intech, and reclassifications relate to a reclassification of existing funds from Quantitative Equities to Equities. |
Average AUM by capability
| | Three months ended | ||||
| | 31 Mar | | 31 Dec | | 31 Mar |
|
| 2022 |
| 2021 |
| 2021 |
Equities |
| 222.9 |
| 243.0 |
| 223.6 |
Fixed Income |
| 77.5 |
| 79.8 |
| 80.9 |
Multi-Asset |
| 54.5 |
| 57.3 |
| 48.7 |
Quantitative Equities |
| 31.2 |
| 38.7 |
| 41.5 |
Alternatives |
| 10.6 |
| 10.6 |
| 10.6 |
Total |
| 396.7 |
| 429.4 |
| 405.3 |
Page | 3
INVESTMENT PERFORMANCE
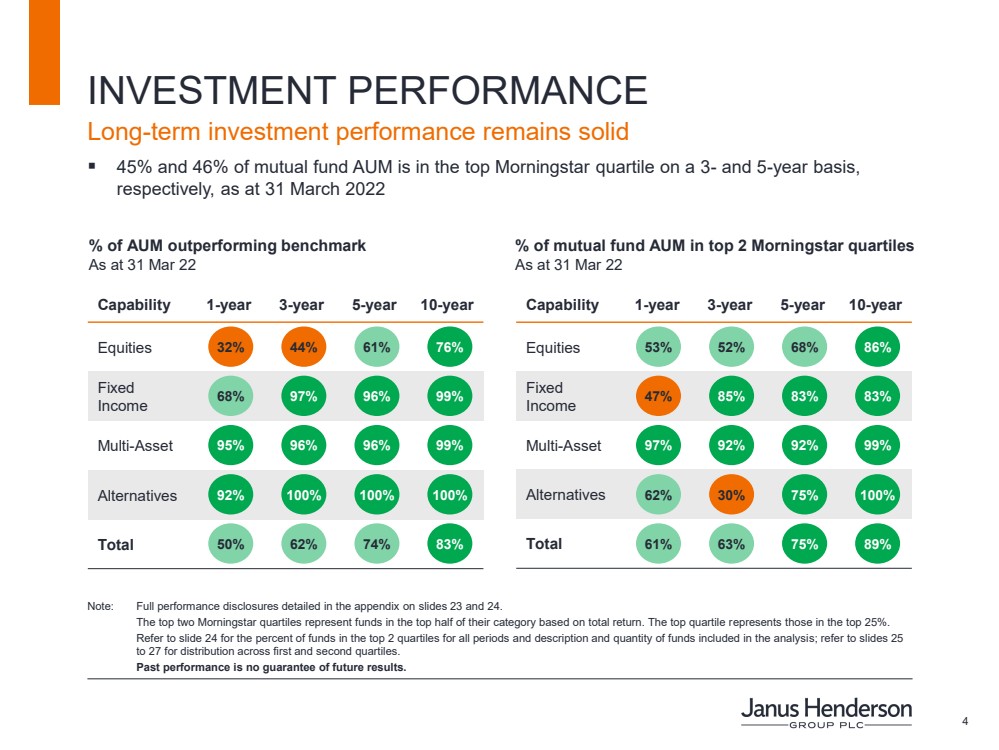
% of AUM outperforming benchmark (at 31 March 2022)
Capability |
| 1-year |
| 3-year |
| 5-year |
| 10-year |
|
Equities |
| 32 | % | 44 | % | 61 | % | 76 | % |
Fixed Income |
| 68 | % | 97 | % | 96 | % | 99 | % |
Multi-Asset |
| 95 | % | 96 | % | 96 | % | 99 | % |
Alternatives |
| 92 | % | 100 | % | 100 | % | 100 | % |
Total |
| 50 | % | 62 | % | 74 | % | 83 | % |
Outperformance is measured based on composite performance gross of fees vs primary benchmark, except where a strategy has no benchmark index or corresponding composite in which case the most relevant metric is used: (1) composite gross of fees vs zero for absolute return strategies, (2) fund net of fees vs primary index or (3) fund net of fees vs Morningstar peer group average or median. Non-discretionary and separately managed account assets are included with a corresponding composite where applicable.
Cash management vehicles, ETF-enhanced beta strategies, Managed CDOs, Private Equity funds and custom non-discretionary accounts with no corresponding composite are excluded from the analysis. Excluded assets represent 5% of AUM as at 31 March 2022. Capabilities defined by Janus Henderson.
% of mutual fund AUM in top 2 Morningstar quartiles (at 31 March 2022)
Capability |
| 1-year |
| 3-year |
| 5-year |
| 10-year |
|
Equities |
| 53 | % | 52 | % | 68 | % | 86 | % |
Fixed Income |
| 47 | % | 85 | % | 83 | % | 83 | % |
Multi-Asset |
| 97 | % | 92 | % | 92 | % | 99 | % |
Alternatives |
| 62 | % | 30 | % | 75 | % | 100 | % |
Total |
| 61 | % | 63 | % | 75 | % | 89 | % |
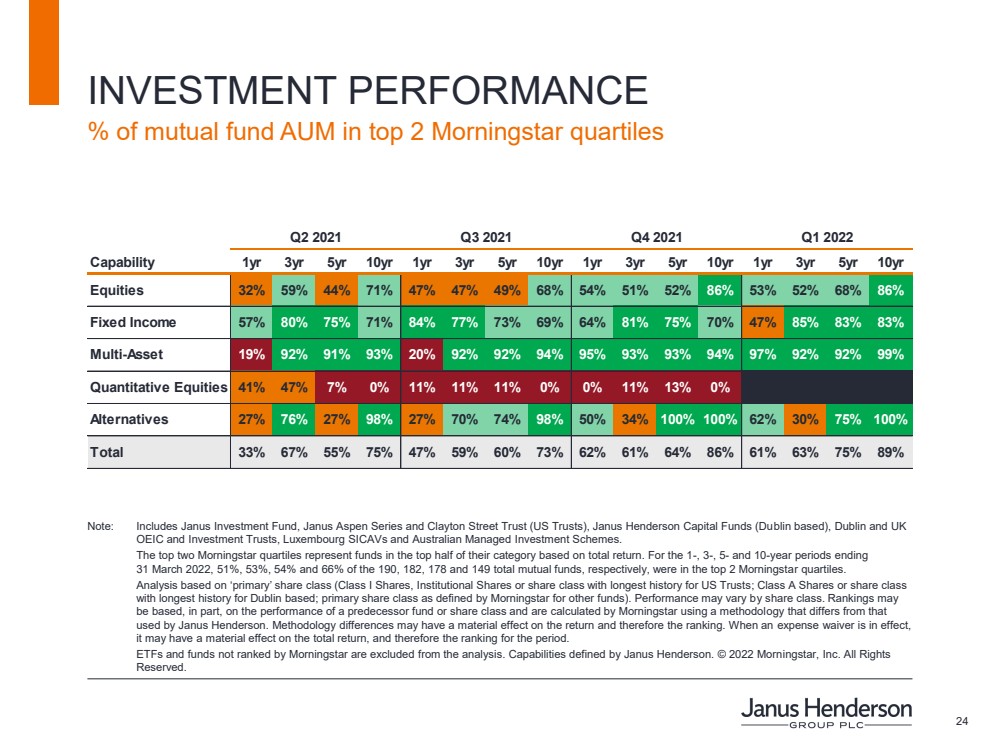
Includes Janus Investment Fund, Janus Aspen Series and Clayton Street Trust (US Trusts), Janus Henderson Capital Funds (Dublin based), Dublin and UK OEIC and Investment Trusts, Luxembourg SICAVs and Australian Managed Investment Schemes. The top two Morningstar quartiles represent funds in the top half of their category based on total return. For the 1-, 3-, 5- and 10-year periods ending 31 March 2022, 51%, 53%, 54% and 66% of the 190, 182, 178 and 149 total mutual funds, respectively, were in the top 2 Morningstar quartiles.
Analysis based on ‘primary’ share class (Class I Shares, Institutional Shares or share class with longest history for US Trusts; Class A Shares or share class with longest history for Dublin based; primary share class as defined by Morningstar for other funds). Performance may vary by share class. Rankings may be based, in part, on the performance of a predecessor fund or share class and are calculated by Morningstar using a methodology that differs from that used by Janus Henderson. Methodology differences may have a material effect on the return and therefore the ranking. When an expense waiver is in effect, it may have a material effect on the total return, and therefore the ranking for the period.
ETFs and funds not ranked by Morningstar are excluded from the analysis. Capabilities defined by Janus Henderson. © 2021 Morningstar, Inc. All Rights Reserved.
SECOND QUARTER 2022 RESULTS
Janus Henderson intends to publish its second quarter 2022 results on 28 July 2022.
Page | 4
FIRST QUARTER 2022 RESULTS BRIEFING INFORMATION
Interim Chief Executive Officer and Chief Financial Officer Roger Thompson will present these results on 4 May 2022 on a conference call and webcast to be held at 8am EDT, 1pm BST, 10pm AEST.
Those wishing to participate should call:
United Kingdom | 0808 189 6484 (toll free) |
United States | 844 200 6205 (toll free) |
Australia | 02 7908 3093 (this is not toll free) |
All other countries | +1 929 526 1599 (this is not toll free) |
Conference ID | 823583 |
Access to the webcast and accompanying slides will be available via the investor relations section of Janus Henderson’s website (ir.janushenderson.com).
About Janus Henderson
Janus Henderson Group is a leading global active asset manager dedicated to helping investors achieve long-term financial goals through a broad range of investment solutions, including equities, fixed income, multi-asset and alternative asset class strategies.
At 31 March 2022, Janus Henderson had approximately US$361 billion in assets under management, more than 2,000 employees, and offices in 23 cities worldwide. Headquartered in London, the company is listed on the NYSE and the ASX.
Investor enquiries: | | Media enquiries: |
Jim Kurtz | | Stephen Sobey |
Co-Head Investor Relations (US) | | Head of Media Relations +44 (0)20 7818 2523 |
| ||
| | |
Melanie Horton | | Sarah Johnson |
Co-Head Investor Relations (Non-US) | | Director, Media Relations & Corp Comms |
+44 (0)20 7818 2905 | | +1 720 364 0708 |
| ||
| | |
Or | | United Kingdom: Edelman Smithfield |
| | Latika Shah |
Investor Relations | | +44 (0)7950 671 948 |
| ||
| | |
| | Andrew Wilde |
| | +44 (0)7786 022 022 |
| | |
| | |
| | Asia Pacific: Honner |
| | Craig Morris |
| | +61 2 8248 3757 |
| | |
| | |
| | |
| | |
| | |
Page | 5
FINANCIAL DISCLOSURES
Condensed consolidated statements of comprehensive income (unaudited)
| | Three months ended | ||||
| | 31 Mar | | 31 Dec | | 31 Mar |
(in US$ millions, except per share data or as noted) |
| 2022 |
| 2021 |
| 2021 |
Revenue: | | | | | | |
Management fees |
| 514.0 |
| 565.9 |
| 514.9 |
Performance fees |
| (8.4) |
| 7.7 |
| 17.0 |
Shareowner servicing fees |
| 62.4 |
| 68.3 |
| 60.8 |
Other revenue | | 52.0 |
| 55.3 |
| 51.3 |
Total revenue |
| 620.0 |
| 697.2 |
| 644.0 |
| | | | | | |
Operating expenses: | | | | | | |
Employee compensation and benefits |
| 164.6 |
| 160.1 |
| 174.6 |
Long-term incentive plans |
| 51.4 |
| 42.7 |
| 53.5 |
Distribution expenses |
| 141.8 |
| 147.3 |
| 127.4 |
Investment administration |
| 14.8 |
| 12.9 |
| 12.6 |
Marketing |
| 7.4 |
| 11.3 |
| 6.2 |
General, administrative and occupancy |
| 73.1 |
| 77.6 |
| 63.0 |
Impairment of goodwill and intangible assets | | 32.8 | | 77.5 | | 3.6 |
Depreciation and amortisation |
| 9.5 |
| 10.2 |
| 10.6 |
Total operating expenses |
| 495.4 |
| 539.6 |
| 451.5 |
| | | | | | |
Operating income |
| 124.6 |
| 157.6 |
| 192.5 |
| | | | | | |
Interest expense |
| (3.2) |
| (3.2) |
| (3.2) |
Investment gains (losses), net |
| (32.2) |
| (7.3) |
| 1.6 |
Other non-operating income (expense), net |
| (7.8) |
| 8.0 |
| (0.1) |
Income before taxes |
| 81.4 |
| 155.1 |
| 190.8 |
Income tax provision |
| (22.8) |
| (29.6) |
| (43.1) |
Net income |
| 58.6 |
| 125.5 |
| 147.7 |
Net loss attributable to noncontrolling interests |
| 20.1 |
| 7.0 |
| 7.8 |
Net income attributable to JHG |
| 78.7 |
| 132.5 |
| 155.5 |
Less: allocation of earnings to participating stock-based awards |
| (2.0) |
| (3.6) |
| (4.8) |
Net income attributable to JHG common shareholders |
| 76.7 |
| 128.9 |
| 150.7 |
| | | | | | |
Basic weighted-average shares outstanding (in millions) |
| 164.0 |
| 165.6 |
| 171.0 |
Diluted weighted-average shares outstanding (in millions) |
| 164.5 |
| 166.2 |
| 171.8 |
| | | | | | |
Diluted earnings per share (in US$) |
| 0.47 |
| 0.78 |
| 0.88 |
Page | 6
Reconciliation of non-GAAP financial information
In addition to financial results reported in accordance with GAAP, we compute certain financial measures using non-GAAP components, as defined by the SEC. These measures are not in accordance with, or a substitute for, GAAP, and our financial measures may be different from non-GAAP financial measures used by other companies. We have provided a reconciliation of our non-GAAP components to the most directly comparable GAAP components. The following are reconciliations of US GAAP revenue, operating expenses, operating income, net income attributable to JHG and diluted earnings per share to adjusted revenue, adjusted operating expenses, adjusted operating income, adjusted net income attributable to JHG and adjusted diluted earnings per share.
| | Three months ended | | ||||
| | 31 Mar | | 31 Dec | | 31 Mar | |
(in US$ millions, except per share data or as noted) |
| 2022 |
| 2021 |
| 2021 | |
Reconciliation of revenue to adjusted revenue | | | | | | | |
Revenue |
| 620.0 |
| 697.2 |
| 644.0 |
|
Management fees1 | | (57.0) | | (56.5) | | (46.8) | |
Shareowner servicing fees1 | | (52.2) | | (56.2) | | (50.0) | |
Other revenue1 |
| (32.6) |
| (34.6) |
| (30.6) |
|
Adjusted revenue |
| 478.2 |
| 549.9 |
| 516.6 |
|
| | | | | | | |
Reconciliation of operating expenses to adjusted operating expenses | | ||||||
Operating expenses |
| 495.4 |
| 539.6 |
| 451.5 |
|
Long-term incentive plans2 |
| (13.0) |
| 0.1 |
| 0.1 |
|
Distribution expenses1 | | (141.8) | | (147.3) | | (127.4) | |
General, administration and occupancy2 |
| (6.5) |
| (2.6) |
| (3.6) |
|
Impairment of goodwill and intangible assets3 | | (32.8) |
| (77.5) |
| (3.6) | |
Depreciation and amortisation3 |
| (1.9) |
| (2.1) |
| (1.9) |
|
Adjusted operating expenses |
| 299.4 |
| 310.2 |
| 315.1 |
|
| | | | | | | |
Adjusted operating income |
| 178.8 |
| 239.7 |
| 201.5 |
|
| | | | | | | |
Operating margin | | 20.1 | % | 22.6 | % | 29.9 | % |
Adjusted operating margin |
| 37.4 | % | 43.6 | % | 39.0 | % |
| | | | | | | |
Reconciliation of net income attributable to JHG to adjusted net income attributable to JHG | |||||||
Net income attributable to JHG |
| 78.7 |
| 132.5 |
| 155.5 |
|
Long-term incentive plans2 |
| 13.0 |
| (0.1) |
| (0.1) |
|
General, administration and occupancy2 |
| 6.5 |
| 2.6 |
| 3.6 |
|
Impairment of goodwill and intangible assets3 | | 32.8 |
| 77.5 |
| 3.6 |
|
Depreciation and amortisation3 |
| 1.9 |
| 2.1 |
| 1.9 |
|
Investment gains (losses), net4 |
| — |
| — |
| 0.2 |
|
Other non-operating income (expense), net4 |
| 7.5 |
| (9.1) |
| (1.8) |
|
Income tax provision5 |
| (14.6) |
| (25.4) |
| (1.4) |
|
Adjusted net income attributable to JHG |
| 125.8 |
| 180.1 |
| 161.5 |
|
Less: allocation of earnings to participating stock-based awards |
| (3.2) |
| (5.0) |
| (5.0) |
|
Adjusted net income attributable to JHG common shareholders |
| 122.6 |
| 175.1 |
| 156.5 |
|
| | | | | | | |
Weighted-average diluted common shares outstanding – diluted (two class) (in millions) |
| 164.5 |
| 166.2 |
| 171.8 |
|
Diluted earnings per share (two class) (in US$) |
| 0.47 |
| 0.78 |
| 0.88 |
|
Adjusted diluted earnings per share (two class) (in US$) |
| 0.75 |
| 1.05 |
| 0.91 |
|
Page | 7
| 2 | Adjustments for the three months ended 31 March 2022 consist primarily of long-term incentive plan expense associated with accelerated vesting of awards related to the retirement of our CEO and CIO, deal costs associated with the sale of Intech and rent expense for subleased office space. Adjustments for the three months ended 31 March 2021 and 31 December 2021 consist primarily of rent expense for subleased office space. JHG management believes these costs are not representative of the ongoing operations of the Group. |
| 3 | Investment management contracts have been identified as a separately identifiable intangible asset arising on the acquisition of subsidiaries and businesses. Such contracts are recognised at the net present value of the expected future cash flows arising from the contracts at the date of acquisition. For segregated mandate contracts, the intangible asset is amortised on a straight-line basis over the expected life of the contracts. In addition, the adjustment for the three months ended 31 March 2022 includes an out-of-period incremental goodwill impairment charge, and the adjustments for the three months ended 31 March 2021 and 31 December 2021 include impairment charges of certain mutual fund investment management agreements and trademarks. JHG management believes these non-cash and acquisition-related costs are not representative of the ongoing operations of the Group. |
| 4 | Adjustments primarily represent contingent consideration adjustments associated with prior acquisitions. In addition, the adjustment for the three months ended 31 March 2022 includes a one-time charge related to the sale of Intech. JHG management believes these costs are not representative of the ongoing operations of the Group. |
| 5 | The tax impact of the adjustments is calculated based on the applicable US or foreign statutory tax rate as it relates to each adjustment. Certain adjustments are either not taxable or not tax-deductible. |
Condensed consolidated balance sheets (unaudited)
| | 31 Mar | | 31 Dec |
(in US$ millions) |
| 2022 |
| 2021 |
Assets: |
|
|
|
|
Cash and cash equivalents |
| 800.8 | | 1,107.3 |
Investment securities |
| 419.3 | | 451.4 |
Property, equipment and software, net |
| 54.6 | | 63.3 |
Intangible assets and goodwill, net |
| 3,805.7 | | 3,917.0 |
Assets of consolidated variable interest entities |
| 259.6 | | 264.3 |
Other assets |
| 1,083.3 | | 924.2 |
Total assets |
| 6,423.3 |
| 6,727.5 |
| | | | |
Liabilities, redeemable noncontrolling interests and equity: |
|
|
|
|
Long-term debt |
| 309.7 | | 310.4 |
Deferred tax liabilities, net |
| 617.0 | | 619.2 |
Liabilities of consolidated variable interest entities |
| 2.5 | | 2.6 |
Other liabilities |
| 839.5 | | 968.7 |
Redeemable noncontrolling interests |
| 150.7 | | 163.4 |
Total equity |
| 4,503.9 | | 4,663.2 |
Total liabilities, redeemable noncontrolling interests and equity | | 6,423.3 | | 6,727.5 |
Condensed consolidated statements of cash flows (unaudited)
| | Three months ended | ||||
| | 31 Mar | | 31 Dec | | 31 Mar |
(in US$ millions) |
| 2022 |
| 2021 |
| 2021 |
Cash provided by (used for): |
|
|
|
|
|
|
Operating activities |
| (57.5) | | 281.2 | | 25.8 |
Investing activities |
| (16.9) | | (17.5) | | 23.4 |
Financing activities |
| (214.8) | | (90.7) | | (322.5) |
Effect of exchange rate changes |
| (16.0) | | 1.0 | | 1.8 |
Net change during period |
| (305.2) | | 174.0 | | (271.5) |
Page | 8
STATUTORY DISCLOSURES
Associates and joint ventures
At 31 March 2022, the Group holds interests in the following associates and joint ventures managed through shareholder agreements with third party investors, accounted for under the equity method:
| ● | LongTail Alpha LLC ownership 20% |
Basis of preparation
In the opinion of management of Janus Henderson Group plc, the condensed consolidated financial statements contain all normal recurring adjustments necessary to fairly present the financial position, results of operations and cash flows of JHG in accordance with US GAAP. Such financial statements have been prepared in accordance with the instructions to Form 10-Q pursuant to the rules and regulations of the SEC. Certain information and footnote disclosures normally included in financial statements prepared in accordance with GAAP have been condensed or omitted pursuant to such rules and regulations. The financial statements should be read in conjunction with the annual consolidated financial statements and notes presented in Janus Henderson Group’s Annual Report on Form 10-K for the year ended 31 December 2021, on file with the SEC (Commission file no. 001-38103). Events subsequent to the balance sheet date have been evaluated for inclusion in the financial statements through the issuance date and are included in the notes to the condensed consolidated financial statements.
Corporate governance principles and recommendations
In the opinion of the Directors, the financial records of the Group have been properly maintained, and the Condensed Consolidated Financial Statements comply with the appropriate accounting standards and give a true and fair view of the financial position and performance of the Group. This opinion has been formed on the basis of a sound system of risk management and internal control which is operating effectively.
Page | 9
FORWARD-LOOKING STATEMENTS DISCLAIMER
Past performance is no guarantee of future results. Investing involves risk, including the possible loss of principal and fluctuation of value.
This document includes statements concerning potential future events involving Janus Henderson Group plc that could differ materially from the events that actually occur. The differences could be caused by a number of factors, including those factors identified in Janus Henderson Group’s Annual Report on Form 10-K for the fiscal year ended 31 December 2021 and in other filings or furnishings made by the Company with the Securities and Exchange Commission from time to time (Commission file no. 001-38103), including those that appear under headings such as ‘Risk Factors’ and ‘Management’s Discussion and Analysis of Financial Condition and Results of Operations’. Many of these factors are beyond the control of JHG and its management. Any forward-looking statements contained in this document are as at the date on which such statements were made. Janus Henderson Group undertakes no obligation to publicly update or revise any forward-looking statements after the date they are made, whether as a result of new information, future events or otherwise, except as required by law.
Annualised, pro forma, projected and estimated numbers are used for illustrative purposes only, are not forecasts and may not reflect actual results.
The information, statements and opinions contained in this document do not constitute a public offer under any applicable legislation or an offer to sell or solicitation of any offer to buy any securities or financial instruments or any advice or recommendation with respect to such securities or other financial instruments.
Not all products or services are available in all jurisdictions.
Mutual funds in the US are distributed by Janus Henderson Distributors US LLC.
Please consider the charges, risks, expenses and investment objectives carefully before investing. For a US fund prospectus or, if available, a summary prospectus containing this and other information, please contact your investment professional or call 800.668.0434. Read it carefully before you invest or send money.
Janus Henderson is a trademark of Janus Henderson Group plc or one of its subsidiaries.
© Janus Henderson Group plc.
Page | 10
| Wednesday 4 May 2022 FIRST QUARTER 2022 RESULTS Roger Thompson Interim Chief Executive Officer Chief Financial Officer |
| BUSINESS AND FINANCIAL UPDATE |

| 3 1 Represents percentage of AUM outperforming the relevant benchmark. Full performance disclosures detailed in the appendix on s li de 23. 2 See adjusted financial measures reconciliation on slides 29 and 30 for additional information. Key metrics – Q1 2022 vs Q4 2021 Q1 2022 RESULTS ▪ Long - term investment performance remains solid ▪ AUM decreased 17% to US$361bn, due to markets, net outflows and the completion of the previously announced sale of Intech ▪ Excluding Intech, AUM decreased 8% versus the prior quarter ▪ Adjusted diluted EPS of US$0.75 ▪ Declared US$0.39 per share dividend and completed US$43m of share buybacks ▪ Board approved new buyback authorisation of US$200m Q1 2022 Q4 2021 3 - year investment out performance ¹ 62% 58% Net flows excluding Intech US$(6.2)bn US$(1.0)bn Intech net flows US$(5.7)bn US$(4.2)bn Total AUM US$361.0bn US$432.3bn US GAAP diluted EPS US$0.47 US$0.78 Adjusted diluted EPS² US$0.75 US$1.05 D ividend per share US$0.39 US$0.38 |
| 4 Note: Full performance disclosures detailed in the appendix on slides 23 and 24. The top two Morningstar quartiles represent funds in the top half of their category based on total return. The top quartile r ep resents those in the top 25%. Refer to slide 24 for the percent of funds in the top 2 quartiles for all periods and description and quantity of funds included in the analysi s; refer to slides 25 to 27 for distribution across first and second quartiles. Past performance is no guarantee of future results. INVESTMENT PERFORMANCE % of mutual fund AUM in top 2 Morningstar quartiles As at 31 Mar 22 % of AUM outperforming benchmark As at 31 Mar 22 ▪ 45% and 46% of mutual fund AUM is in the top Morningstar quartile on a 3 - and 5 - year basis, respectively, as at 31 March 2022 Long - term investment performance remains solid Capability 1 - year 3 - year 5 - year 10 - year Equities Fixed Income Multi - Asset Alternatives Total Capability 1 - year 3 - year 5 - year 10 - year Equities Fixed Income Multi - Asset Alternatives Total 74% 62% 50% 100% 100% 92% 96% 96% 95% 96% 97% 68% 61% 44% 32% 75% 63% 61% 75% 30% 62% 92% 92% 97% 83% 85% 47% 68% 52% 53% 83% 100% 99% 99% 76% 89% 100% 99% 83% 86% |
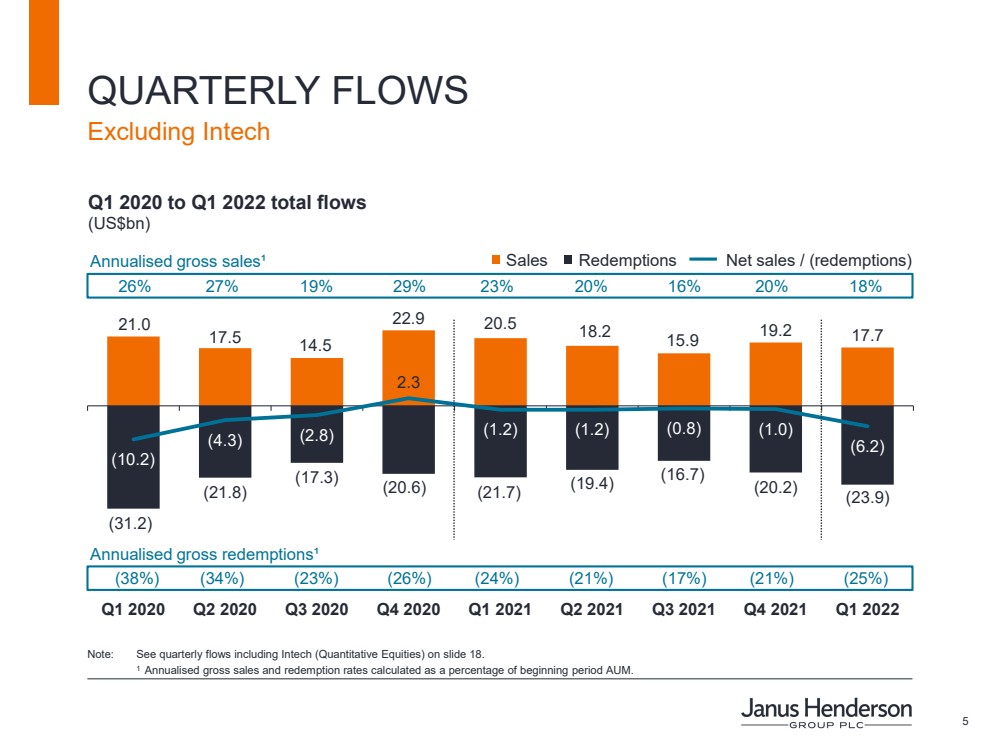
| 5 21.0 17.5 14.5 22.9 20.5 18.2 15.9 19.2 17.7 (31.2) (21.8) (17.3) (20.6) (21.7) (19.4) (16.7) (20.2) (23.9) (10.2) (4.3) (2.8) 2.3 (1.2) (1.2) (0.8) (1.0) (6.2) Q1 2020 Q2 2020 Q3 2020 Q4 2020 Q1 2021 Q2 2021 Q3 2021 Q4 2021 Q1 2022 Q1 2020 to Q1 2022 total flows (US$bn) Redemptions Sales Net sales / (redemptions) 26% 27% 19% 29% 23% 20% 16% 20% 18% Annualised gross sales¹ Annualised gross redemptions¹ QUARTERLY FLOWS Excluding Intech (38%) (34%) (23%) (26%) (24%) (21%) (17%) (21%) (25%) Note: See quarterly flows including Intech (Quantitative Equities) on slide 18. 1 Annualised gross sales and redemption rates calculated as a percentage of beginning period AUM. |
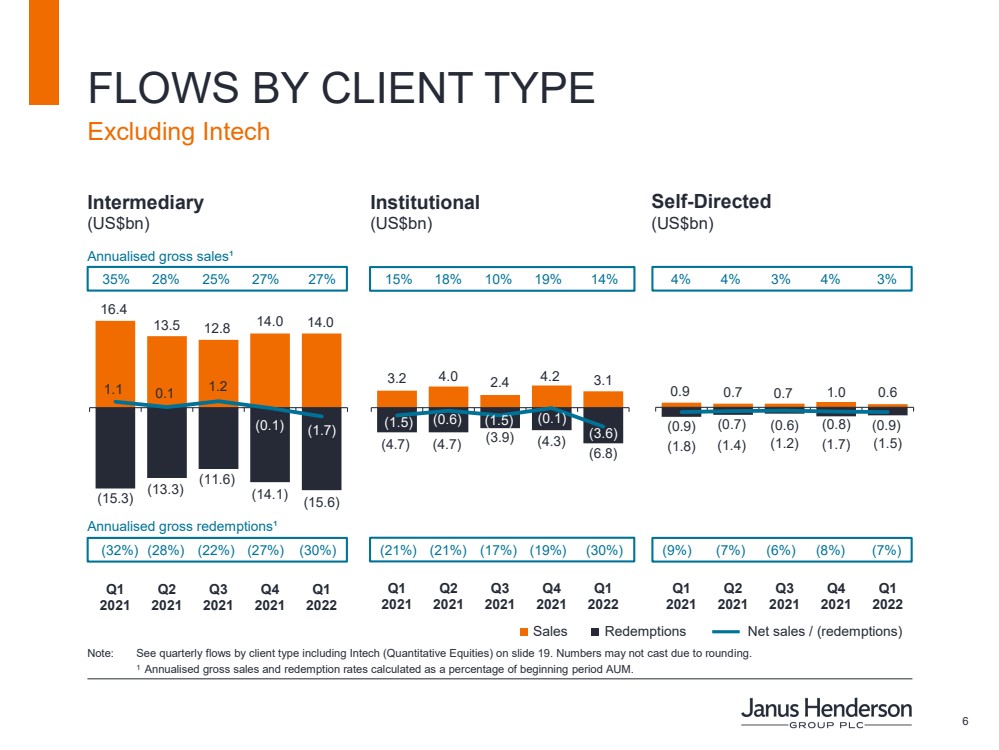
| 6 3.2 4.0 2.4 4.2 3.1 (4.7) (4.7) (3.9) (4.3) (6.8) (1.5) (0.6) (1.5) (0.1) (3.6) Q1 2021 Q2 2021 Q3 2021 Q4 2021 Q1 2022 16.4 13.5 12.8 14.0 14.0 (15.3) (13.3) (11.6) (14.1) (15.6) 1.1 0.1 1.2 (0.1) (1.7) Q1 2021 Q2 2021 Q3 2021 Q4 2021 Q1 2022 0.9 0.7 0.7 1.0 0.6 (1.8) (1.4) (1.2) (1.7) (1.5) (0.9) (0.7) (0.6) (0.8) (0.9) Q1 2021 Q2 2021 Q3 2021 Q4 2021 Q1 2022 Intermediary (US$bn) FLOWS BY CLIENT TYPE Redemptions Sales Net sales / (redemptions) Institutional (US$bn) 15% 18% 10% 19% 14% 35% 28% 25% 27% 27% 4% 4% 3% 4% 3% (21%) (21%) (17%) (19%) (30%) (32%) (28%) (22%) (27%) (30%) (9%) (7%) (6%) (8%) (7%) Annualised gross redemptions¹ Annualised gross sales¹ Self - Directed (US$bn) Excluding Intech Note: See quarterly flows by client type including Intech (Quantitative Equities) on slide 19. Numbers may not cast due to round ing. 1 Annualised gross sales and redemption rates calculated as a percentage of beginning period AUM. |
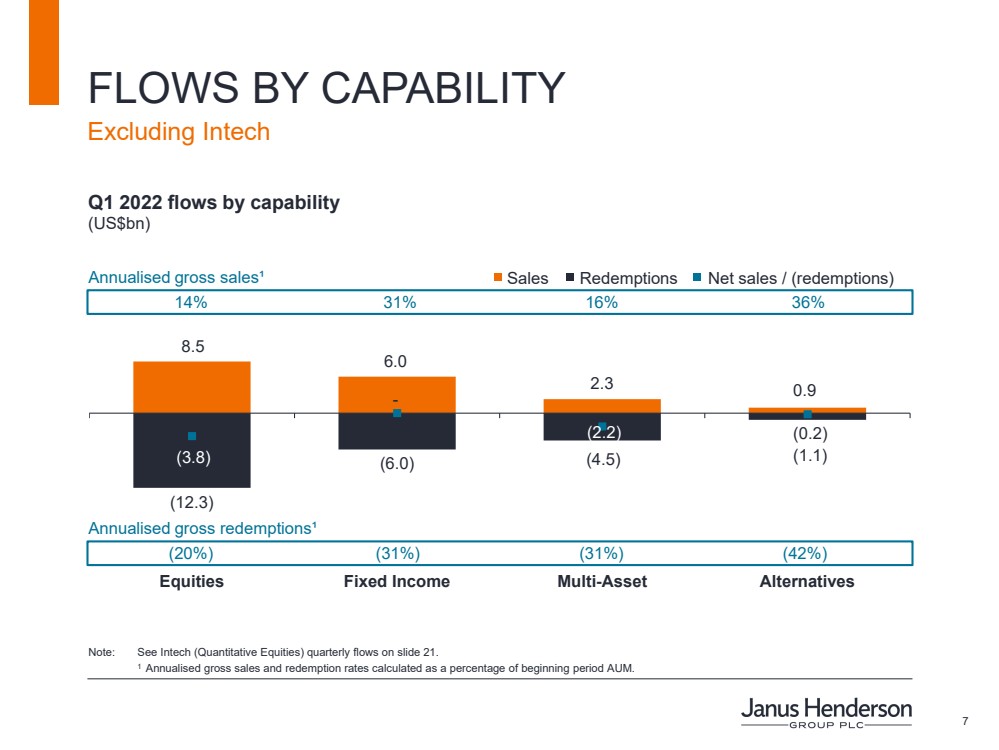
| 7 FLOWS BY CAPABILITY Excluding Intech 8.5 6.0 2.3 0.9 (12.3) (6.0) (4.5) (1.1) (3.8) - (2.2) (0.2) Equities Fixed Income Multi-Asset Alternatives Annualised gross sales¹ Redemptions Sales Net sales / (redemptions) 14% 31% 16% 36% Annualised gross redemptions¹ (20%) (31%) (31%) (42%) Q1 2022 flows by capability (US$bn) Note: See Intech (Quantitative Equities) quarterly flows on slide 21. 1 Annualised gross sales and redemption rates calculated as a percentage of beginning period AUM. |
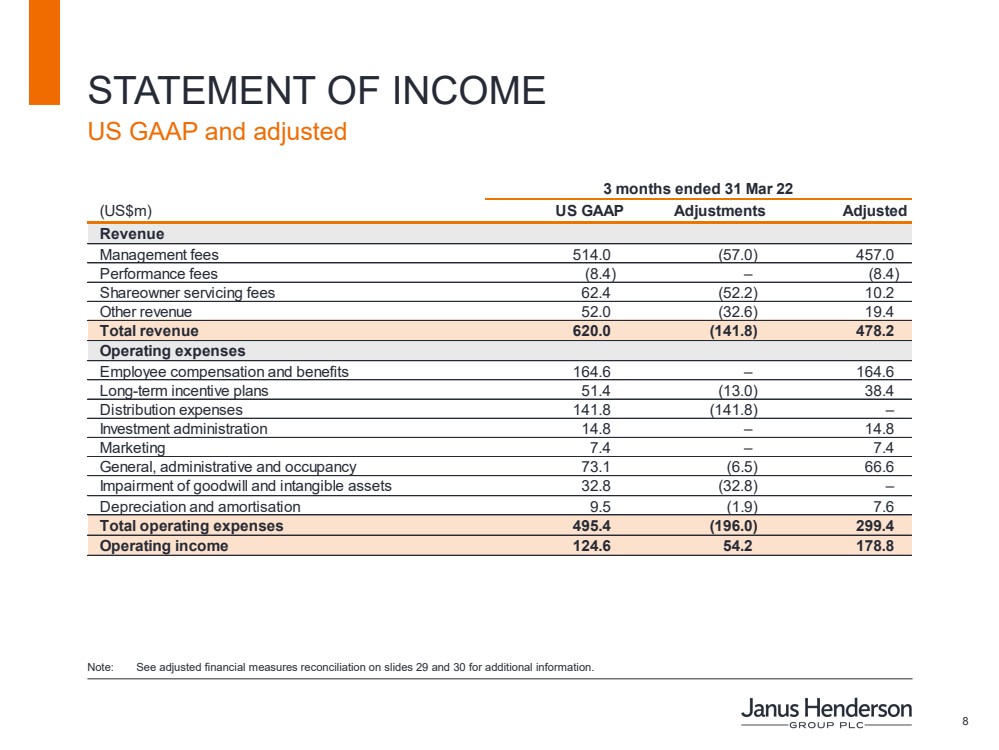
| 8 STATEMENT OF INCOME US GAAP and adjusted Note: See adjusted financial measures reconciliation on slides 29 and 30 for additional information. US GAAP Adjustments Adjusted Revenue Management fees 514.0 (57.0) 457.0 Performance fees (8.4) – (8.4) Shareowner servicing fees 62.4 (52.2) 10.2 Other revenue 52.0 (32.6) 19.4 Total revenue 620.0 (141.8) 478.2 Operating expenses Employee compensation and benefits 164.6 – 164.6 Long-term incentive plans 51.4 (13.0) 38.4 Distribution expenses 141.8 (141.8) – Investment administration 14.8 – 14.8 Marketing 7.4 – 7.4 General, administrative and occupancy 73.1 (6.5) 66.6 Impairment of goodwill and intangible assets 32.8 (32.8) – Depreciation and amortisation 9.5 (1.9) 7.6 Total operating expenses 495.4 (196.0) 299.4 Operating income 124.6 54.2 178.8 (US$m) 3 months ended 31 Mar 22 |
| 9 (US$, except margin data) Q1 2022 Q4 2021 Change Q1 2022 vs Q4 2021 Q1 2021 Change Q1 2022 vs Q1 2021 Average AUM 396.7bn 429.4bn (8%) 405.3bn (2%) Total revenue 620.0m 697.2m (11%) 644.0m (4%) Operating income 124.6m 157.6m (21%) 192.5m (35%) Operating margin 20.1% 22.6% (2.5ppt) 29.9% (9.8ppt) US GAAP diluted EPS 0.47 0.78 (40%) 0.88 (47%) Adjusted revenue 478.2m 549.9m (13%) 516.6m (7%) Adjusted operating income 178.8m 239.7m (25%) 201.5m (11%) Adjusted operating margin 37.4% 43.6% (6.2ppt) 39.0% (1.6ppt) Adjusted diluted EPS 0.75 1.05 (29%) 0.91 (18%) SUMMARY FINANCIAL RESULTS US GAAP and adjusted Note: See adjusted financial measures reconciliation on slides 29 and 30 for additional information. |

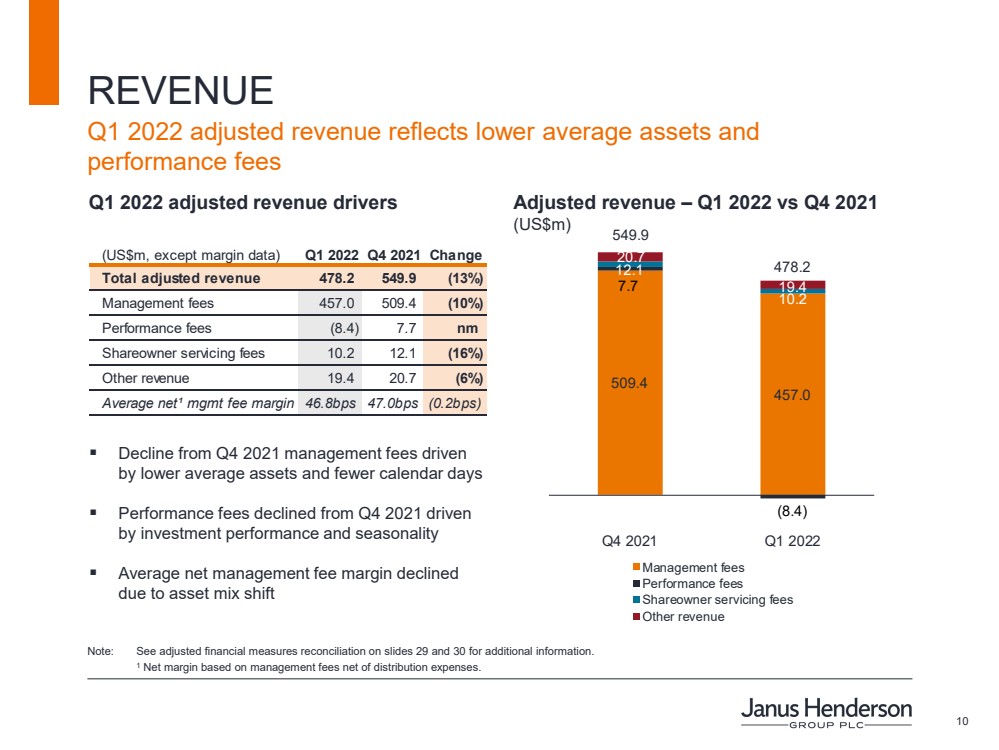
| 10 REVENUE Q1 2022 adjusted revenue reflects lower average assets and performance fees Note: See adjusted financial measures reconciliation on slides 29 and 30 for additional information. 1 Net margin based on management fees net of distribution expenses. Adjusted revenue – Q1 2022 vs Q4 2021 (US$m) Q1 2022 adjusted revenue drivers ▪ Decline from Q4 2021 management fees driven by lower average assets and fewer calendar days ▪ Performance fees declined from Q4 2021 driven by investment performance and seasonality ▪ Average net management fee margin declined due to asset mix shift 457.0 509.4 (8.4) 7.7 10.2 12.1 19.4 20.7 478.2 549.9 Q1 2022 Q4 2021 Management fees Performance fees Shareowner servicing fees Other revenue (US$m, except margin data) Q1 2022 Q4 2021 Change Total adjusted revenue 478.2 549.9 (13%) Management fees 457.0 509.4 (10%) Performance fees (8.4) 7.7 nm Shareowner servicing fees 10.2 12.1 (16%) Other revenue 19.4 20.7 (6%) Average net¹ mgmt fee margin 46.8bps 47.0bps (0.2bps) |
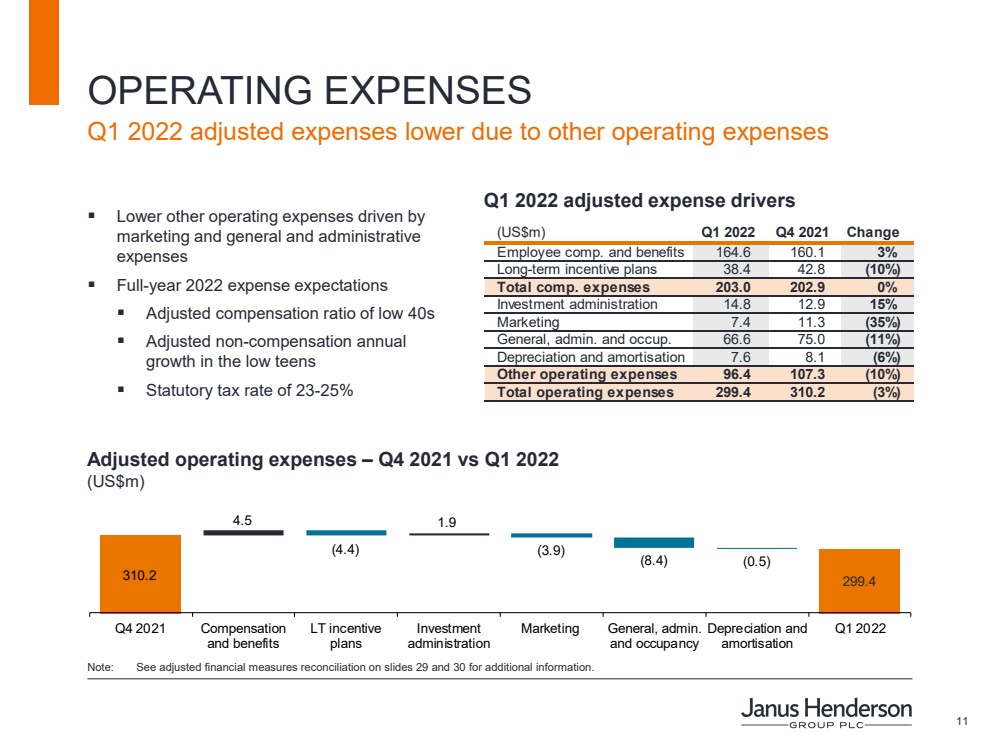
| 11 ▪ Lower other operating expenses driven by marketing and general and administrative expenses ▪ Full - year 2022 expense expectations ▪ Adjusted compensation ratio of low 40s ▪ Adjusted non - compensation annual growth in the low teens ▪ Statutory tax rate of 23 - 25% OPERATING EXPENSES Adjusted operating expenses – Q4 2021 vs Q1 2022 (US$m) 299.4 (4.4) (3.9) (8.4) (0.5) 310.2 4.5 1.9 Q4 2021 Compensation and benefits LT incentive plans Investment administration Marketing General, admin. and occupancy Depreciation and amortisation Q1 2022 (US$m) Q1 2022 Q4 2021 Change Employee comp. and benefits 164.6 160.1 3% Long-term incentive plans 38.4 42.8 (10%) Total comp. expenses 203.0 202.9 0% Investment administration 14.8 12.9 15% Marketing 7.4 11.3 (35%) General, admin. and occup. 66.6 75.0 (11%) Depreciation and amortisation 7.6 8.1 (6%) Other operating expenses 96.4 107.3 (10%) Total operating expenses 299.4 310.2 (3%) Q1 2022 adjusted expenses lower due to other operating expenses Q1 2022 adjusted expense drivers Note: See adjusted financial measures reconciliation on slides 29 and 30 for additional information. |
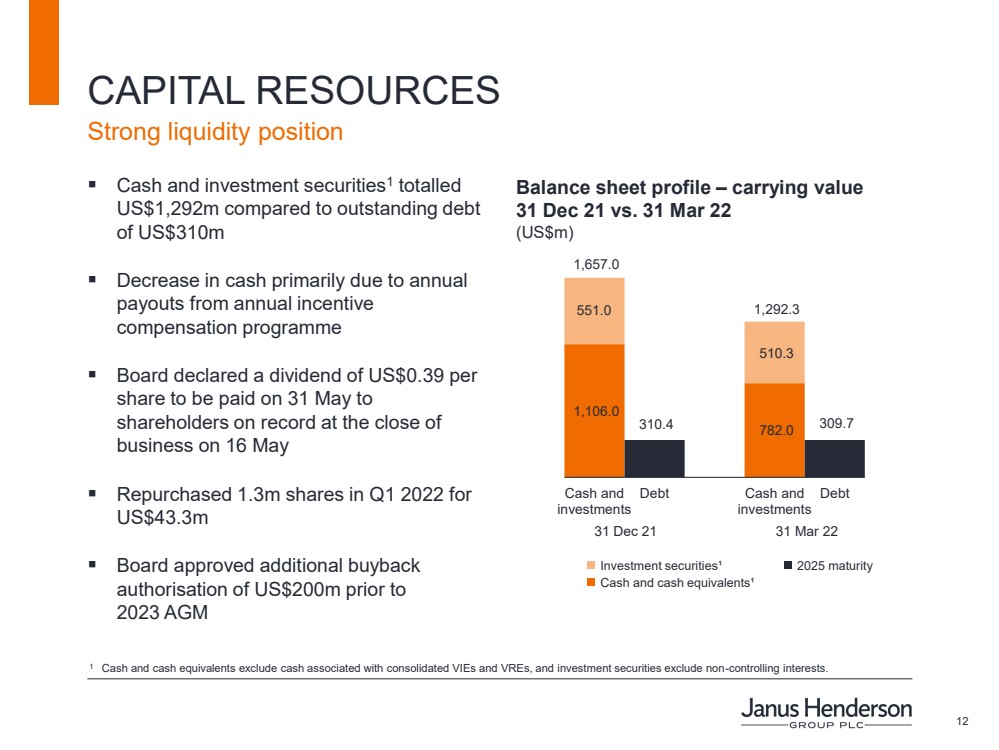
| 12 CAPITAL RESOURCES Strong liquidity position ▪ Cash and investment securities 1 totalled US$1,292m compared to outstanding debt of US$310m ▪ Decrease in cash primarily due to annual payouts from annual incentive compensation programme ▪ Board declared a dividend of US$0.39 per share to be paid on 31 May to shareholders on record at the close of business on 16 May ▪ Repurchased 1.3m shares in Q1 2022 for US$43.3m ▪ Board approved additional buyback authorisation of US$200m prior to 2023 AGM 1,106.0 782.0 551.0 510.3 1,657.0 1,292.3 310.4 309.7 Cash and investments Debt Cash and investments Debt Balance sheet profile – carrying value 31 Dec 21 vs. 31 Mar 22 (US$m) Investment securities¹ Cash and cash equivalents¹ 2025 maturity 31 Mar 22 31 Dec 21 1 Cash and cash equivalents exclude cash associated with consolidated VIEs and VREs, and investment securities exclude non - control ling interests. |
| Q&A |

| APPENDIX |
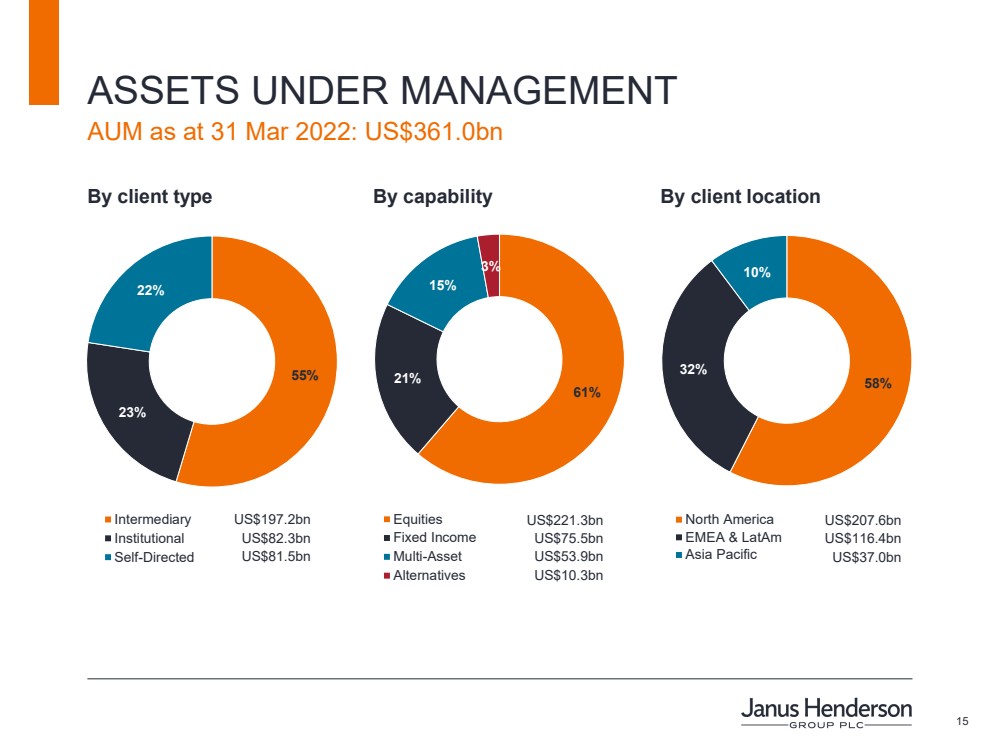
| 15 ASSETS UNDER MANAGEMENT AUM as at 31 Mar 2022: US$361.0bn 61% 21% 15% 3% Equities Fixed Income Multi-Asset Alternatives 55% 23% 22% Intermediary Institutional Self-Directed 58% 32% 10% North America EMEA & LatAm Asia Pacific By client type By capability By client location US$221.3bn US$75.5bn US$53.9bn US$10.3bn US$197.2bn US$82.3bn US$81.5bn US$207.6bn US$116.4bn US$37.0bn |
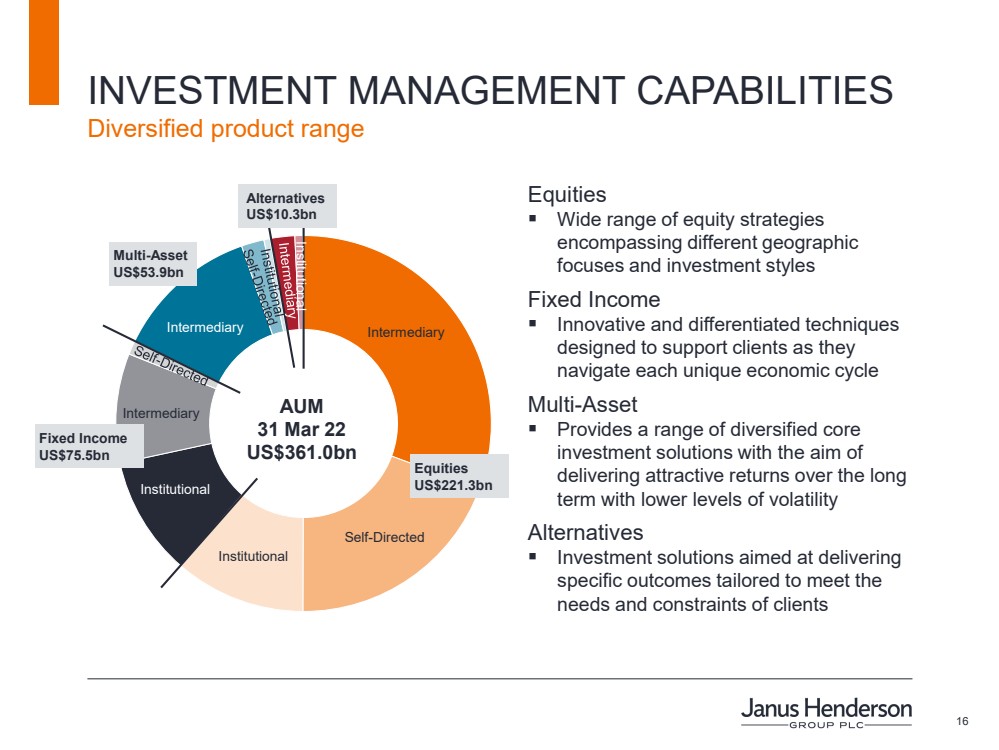
| 16 INVESTMENT MANAGEMENT CAPABILITIES Diversified product range Equities US$221.3bn AUM 31 Mar 22 US$361.0bn Fixed Income US$75.5bn Multi - Asset US$53.9bn Self - Directed Intermediary Institutional Institutional Institutional Alternatives US$10.3bn Intermediary Equities ▪ Wide range of equity strategies encompassing different geographic focuses and investment styles Fixed Income ▪ Innovative and differentiated techniques designed to support clients as they navigate each unique economic cycle Multi - Asset ▪ Provides a range of diversified core investment solutions with the aim of delivering attractive returns over the long term with lower levels of volatility Alternatives ▪ Investment solutions aimed at delivering specific outcomes tailored to meet the needs and constraints of clients Intermediary |
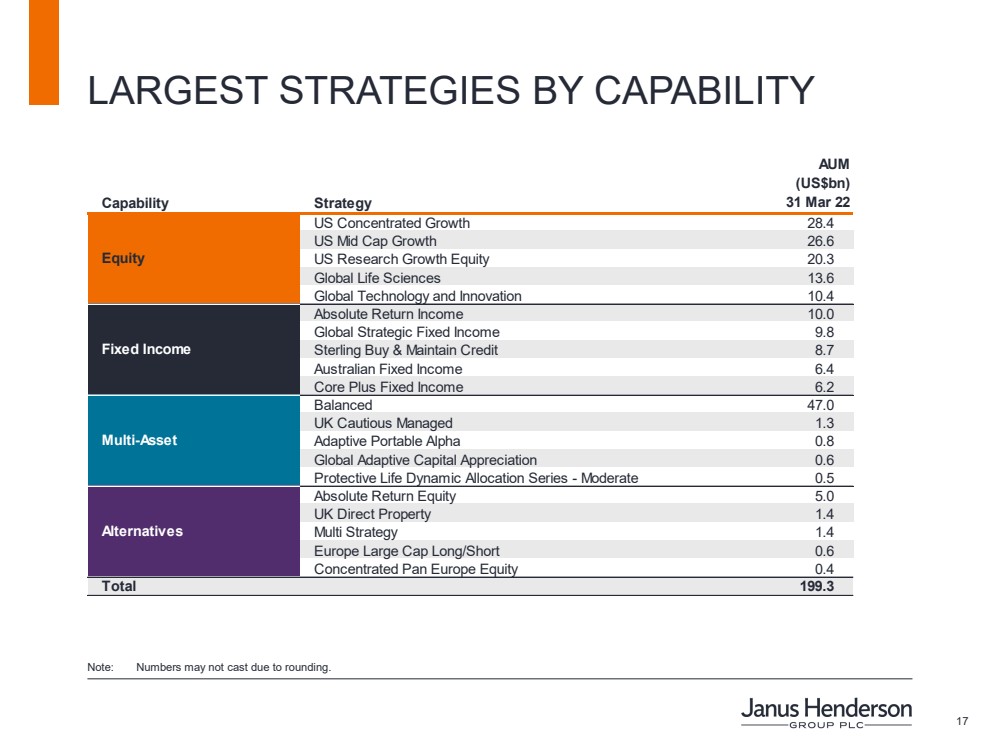
| 17 Capability Strategy AUM (US$bn) 31 Mar 22 US Concentrated Growth 28.4 US Mid Cap Growth 26.6 US Research Growth Equity 20.3 Global Life Sciences 13.6 Global Technology and Innovation 10.4 Absolute Return Income 10.0 Global Strategic Fixed Income 9.8 Sterling Buy & Maintain Credit 8.7 Australian Fixed Income 6.4 Core Plus Fixed Income 6.2 Balanced 47.0 UK Cautious Managed 1.3 Adaptive Portable Alpha 0.8 Global Adaptive Capital Appreciation 0.6 Protective Life Dynamic Allocation Series - Moderate 0.5 Absolute Return Equity 5.0 UK Direct Property 1.4 Multi Strategy 1.4 Europe Large Cap Long/Short 0.6 Concentrated Pan Europe Equity 0.4 Total 199.3 Equity Fixed Income Multi-Asset Alternatives LARGEST STRATEGIES BY CAPABILITY Note: Numbers may not cast due to rounding. |
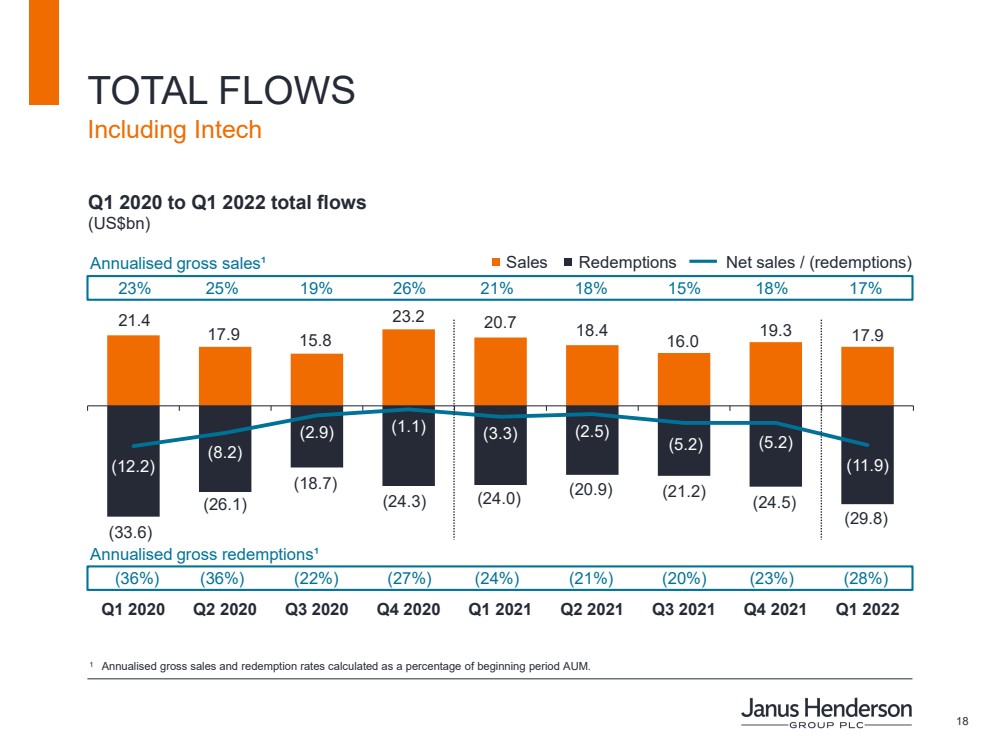
| 18 21.4 17.9 15.8 23.2 20.7 18.4 16.0 19.3 17.9 (33.6) (26.1) (18.7) (24.3) (24.0) (20.9) (21.2) (24.5) (29.8) (12.2) (8.2) (2.9) (1.1) (3.3) (2.5) (5.2) (5.2) (11.9) Q1 2020 Q2 2020 Q3 2020 Q4 2020 Q1 2021 Q2 2021 Q3 2021 Q4 2021 Q1 2022 Q1 2020 to Q1 2022 total flows (US$bn) Redemptions Sales Net sales / (redemptions) 23% 25% 19% 26% 21% 18% 15% 18% 17% Annualised gross sales¹ Annualised gross redemptions¹ 1 Annualised gross sales and redemption rates calculated as a percentage of beginning period AUM. TOTAL FLOWS (36%) (36%) (22%) (27%) (24%) (21%) (20%) (23%) (28%) Including Intech |
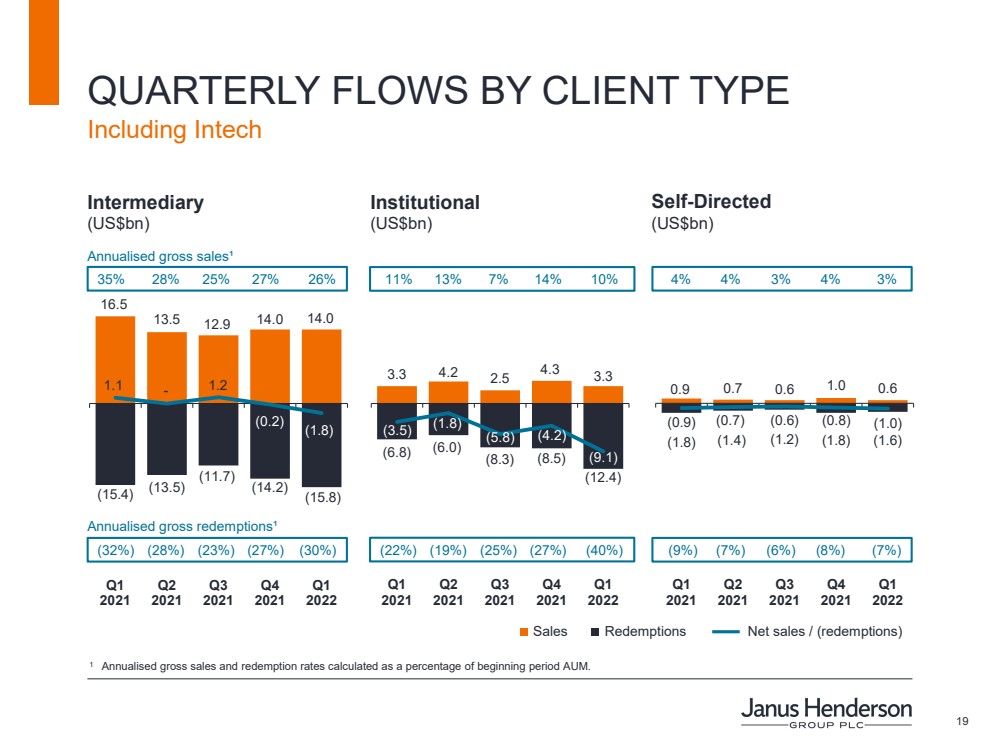
| 19 3.3 4.2 2.5 4.3 3.3 (6.8) (6.0) (8.3) (8.5) (12.4) (3.5) (1.8) (5.8) (4.2) (9.1) Q1 2021 Q2 2021 Q3 2021 Q4 2021 Q1 2022 16.5 13.5 12.9 14.0 14.0 (15.4) (13.5) (11.7) (14.2) (15.8) 1.1 - 1.2 (0.2) (1.8) Q1 2021 Q2 2021 Q3 2021 Q4 2021 Q1 2022 0.9 0.7 0.6 1.0 0.6 (1.8) (1.4) (1.2) (1.8) (1.6) (0.9) (0.7) (0.6) (0.8) (1.0) Q1 2021 Q2 2021 Q3 2021 Q4 2021 Q1 2022 Intermediary (US$bn) 1 Annualised gross sales and redemption rates calculated as a percentage of beginning period AUM. QUARTERLY FLOWS BY CLIENT TYPE Redemptions Sales Net sales / (redemptions) Institutional (US$bn) 11% 13% 7% 14% 10% 35% 28% 25% 27% 26% 4% 4% 3% 4% 3% (22%) (19%) (25%) (27%) (40%) (32%) (28%) (23%) (27%) (30%) (9%) (7%) (6%) (8%) (7%) Annualised gross redemptions¹ Annualised gross sales¹ Self - Directed (US$bn) Including Intech |
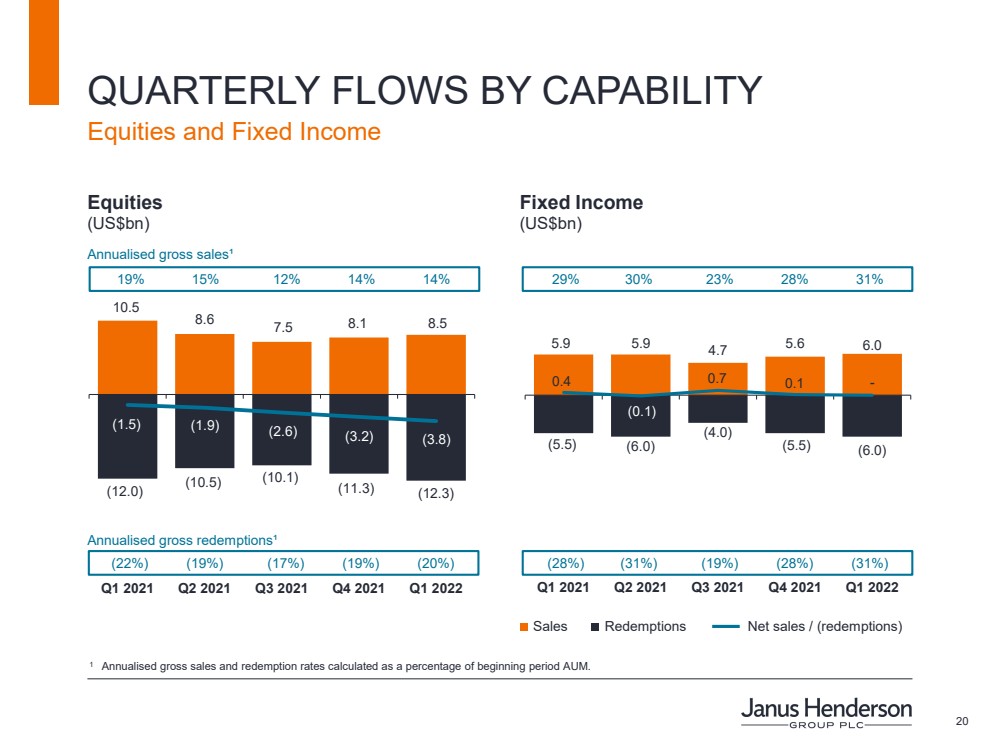
| 20 10.5 8.6 7.5 8.1 8.5 (12.0) (10.5) (10.1) (11.3) (12.3) (1.5) (1.9) (2.6) (3.2) (3.8) Q1 2021 Q2 2021 Q3 2021 Q4 2021 Q1 2022 Equities (US$bn) 1 Annualised gross sales and redemption rates calculated as a percentage of beginning period AUM. QUARTERLY FLOWS BY CAPABILITY Equities and Fixed Income 5.9 5.9 4.7 5.6 6.0 (5.5) (6.0) (4.0) (5.5) (6.0) 0.4 (0.1) 0.7 0.1 - Q1 2021 Q2 2021 Q3 2021 Q4 2021 Q1 2022 (22%) (19%) (17%) (19%) (20%) Redemptions Sales Net sales / (redemptions) Annualised gross redemptions¹ 19% 15% 12% 14% 14% 29% 30% 23% 28% 31% (28%) (31%) (19%) (28%) (31%) Fixed Income (US$bn) Annualised gross sales¹ |
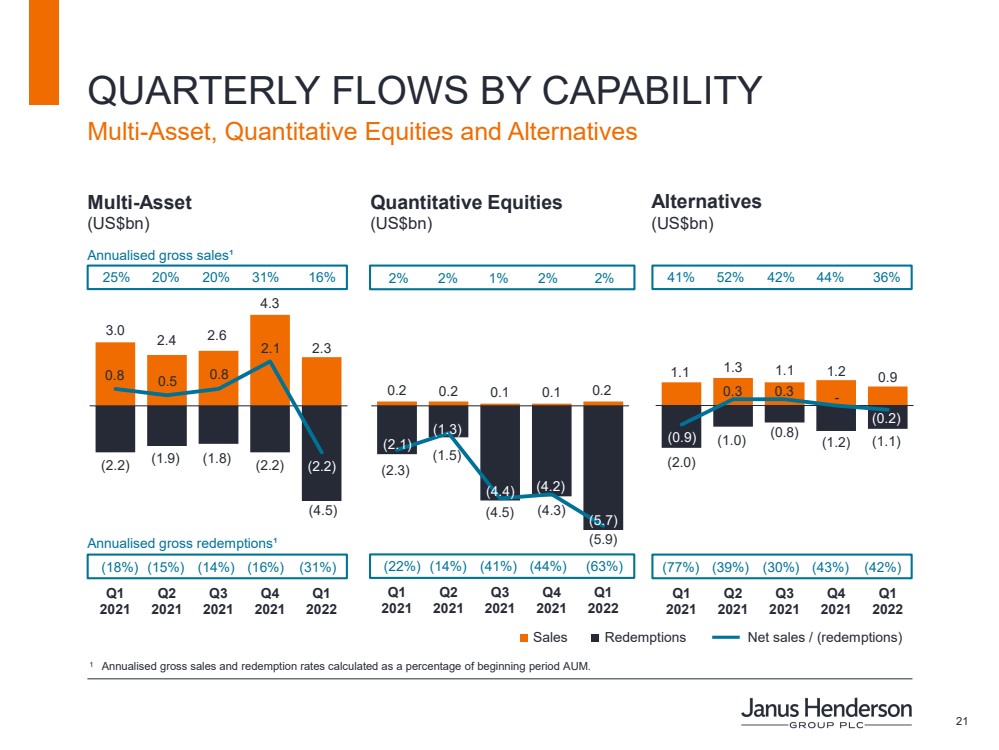
| 21 0.2 0.2 0.1 0.1 0.2 (2.3) (1.5) (4.5) (4.3) (5.9) (2.1) (1.3) (4.4) (4.2) (5.7) Q1 2021 Q2 2021 Q3 2021 Q4 2021 Q1 2022 3.0 2.4 2.6 4.3 2.3 (2.2) (1.9) (1.8) (2.2) (4.5) 0.8 0.5 0.8 2.1 (2.2) Q1 2021 Q2 2021 Q3 2021 Q4 2021 Q1 2022 1.1 1.3 1.1 1.2 0.9 (2.0) (1.0) (0.8) (1.2) (1.1) (0.9) 0.3 0.3 - (0.2) Q1 2021 Q2 2021 Q3 2021 Q4 2021 Q1 2022 Multi - Asset (US$bn) 1 Annualised gross sales and redemption rates calculated as a percentage of beginning period AUM. QUARTERLY FLOWS BY CAPABILITY Multi - Asset, Quantitative Equities and Alternatives Redemptions Sales Net sales / (redemptions) Quantitative Equities (US$bn) 2% 2% 1% 2% 2% 25% 20% 20% 31% 16% 41% 52% 42% 44% 36% (22%) (14%) (41%) (44%) (63%) (18%) (15%) (14%) (16%) (31%) (77%) (39%) (30%) (43%) (42%) Annualised gross redemptions¹ Annualised gross sales¹ Alternatives (US$bn) |
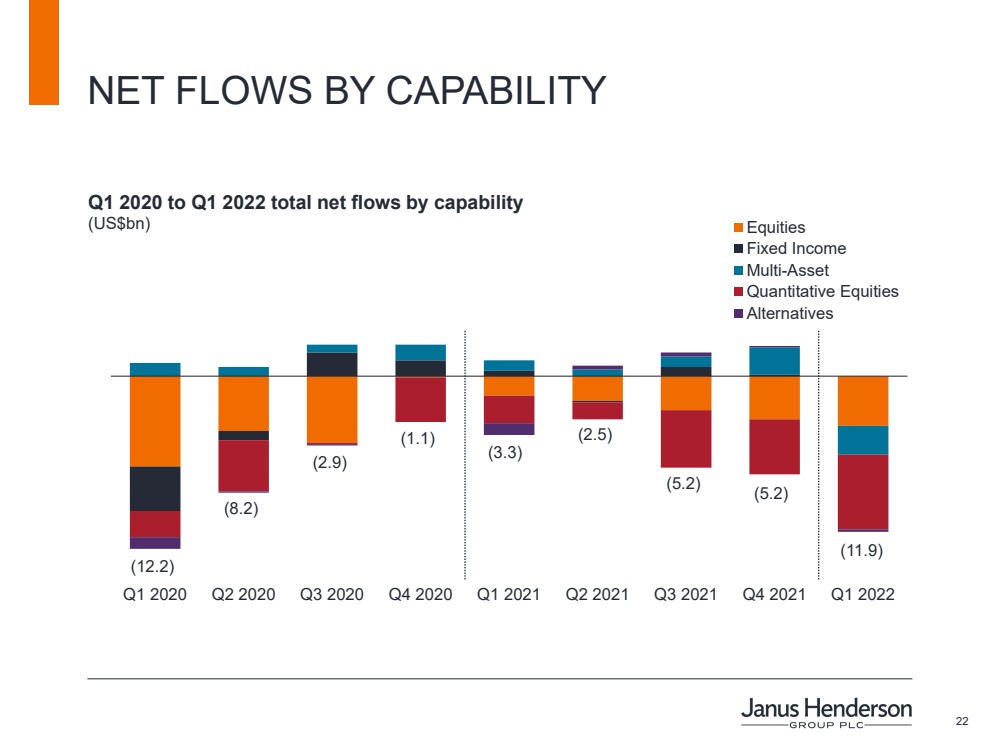
| 22 Q1 2020 Q2 2020 Q3 2020 Q4 2020 Q1 2021 Q2 2021 Q3 2021 Q4 2021 Q1 2022 Equities Fixed Income Multi-Asset Quantitative Equities Alternatives Q1 2020 to Q1 2022 total net flows by capability (US$bn) NET FLOWS BY CAPABILITY (12.2) (8.2) (2.9) (1.1) (3.3) (2.5) (5.2) (5.2) (11.9) |
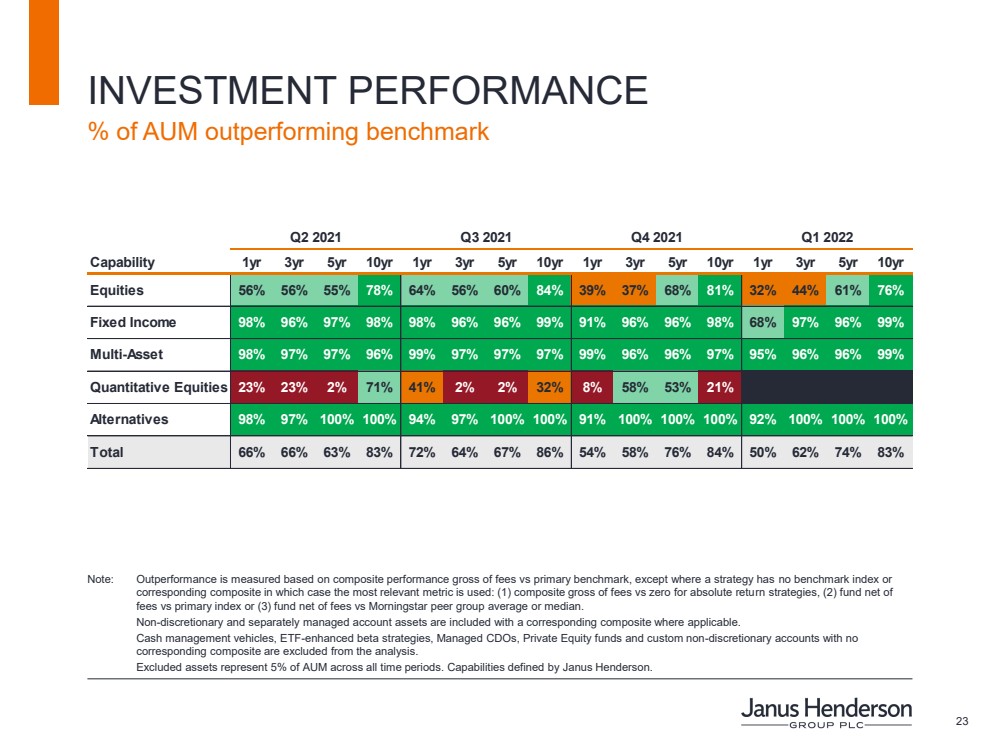
| 23 Note: Outperformance is measured based on composite performance gross of fees vs primary benchmark, except where a strategy has no benchmark index or corresponding composite in which case the most relevant metric is used: (1) composite gross of fees vs zero for absolute retu rn strategies, (2) fund net of fees vs primary index or (3) fund net of fees vs Morningstar peer group average or median. Non - discretionary and separately managed account assets are included with a corresponding composite where applicable. Cash management vehicles, ETF - enhanced beta strategies, Managed CDOs, Private Equity funds and custom non - discretionary account s with no corresponding composite are excluded from the analysis. Excluded assets represent 5% of AUM across all time periods. Capabilities defined by Janus Henderson. INVESTMENT PERFORMANCE % of AUM outperforming benchmark Capability 1yr 3yr 5yr 10yr 1yr 3yr 5yr 10yr 1yr 3yr 5yr 10yr 1yr 3yr 5yr 10yr Equities 56% 56% 55% 78% 64% 56% 60% 84% 39% 37% 68% 81% 32% 44% 61% 76% Fixed Income 98% 96% 97% 98% 98% 96% 96% 99% 91% 96% 96% 98% 68% 97% 96% 99% Multi-Asset 98% 97% 97% 96% 99% 97% 97% 97% 99% 96% 96% 97% 95% 96% 96% 99% Quantitative Equities 23% 23% 2% 71% 41% 2% 2% 32% 8% 58% 53% 21% Alternatives 98% 97% 100% 100% 94% 97% 100% 100% 91% 100% 100% 100% 92% 100% 100% 100% Total 66% 66% 63% 83% 72% 64% 67% 86% 54% 58% 76% 84% 50% 62% 74% 83% Q2 2021 Q3 2021 Q4 2021 Q1 2022 |
| 24 INVESTMENT PERFORMANCE Note: Includes Janus Investment Fund, Janus Aspen Series and Clayton Street Trust (US Trusts), Janus Henderson Capital Funds (Du blin based), Dublin and UK OEIC and Investment Trusts, Luxembourg SICAVs and Australian Managed Investment Schemes. The top two Morningstar quartiles represent funds in the top half of their category based on total return. For the 1 - , 3 - , 5 - a nd 10 - year periods ending 31 March 2022, 51%, 53%, 54% and 66% of the 190, 182, 178 and 149 total mutual funds, respectively, were in the top 2 Morningsta r quartiles. Analysis based on ‘primary’ share class (Class I Shares, Institutional Shares or share class with longest history for US Trusts ; Class A Shares or share class with longest history for Dublin based; primary share class as defined by Morningstar for other funds). Performance may vary b y s hare class. Rankings may be based, in part, on the performance of a predecessor fund or share class and are calculated by Morningstar using a methodol ogy that differs from that used by Janus Henderson. Methodology differences may have a material effect on the return and therefore the ranking. When an exp ense waiver is in effect, it may have a material effect on the total return, and therefore the ranking for the period. ETFs and funds not ranked by Morningstar are excluded from the analysis. Capabilities defined by Janus Henderson. © 2022 Morn in gstar, Inc. All Rights Reserved. % of mutual fund AUM in top 2 Morningstar quartiles Capability 1yr 3yr 5yr 10yr 1yr 3yr 5yr 10yr 1yr 3yr 5yr 10yr 1yr 3yr 5yr 10yr Equities 32% 59% 44% 71% 47% 47% 49% 68% 54% 51% 52% 86% 53% 52% 68% 86% Fixed Income 57% 80% 75% 71% 84% 77% 73% 69% 64% 81% 75% 70% 47% 85% 83% 83% Multi-Asset 19% 92% 91% 93% 20% 92% 92% 94% 95% 93% 93% 94% 97% 92% 92% 99% Quantitative Equities 41% 47% 7% 0% 11% 11% 11% 0% 0% 11% 13% 0% Alternatives 27% 76% 27% 98% 27% 70% 74% 98% 50% 34% 100% 100% 62% 30% 75% 100% Total 33% 67% 55% 75% 47% 59% 60% 73% 62% 61% 64% 86% 61% 63% 75% 89% Q2 2021 Q3 2021 Q4 2021 Q1 2022 |
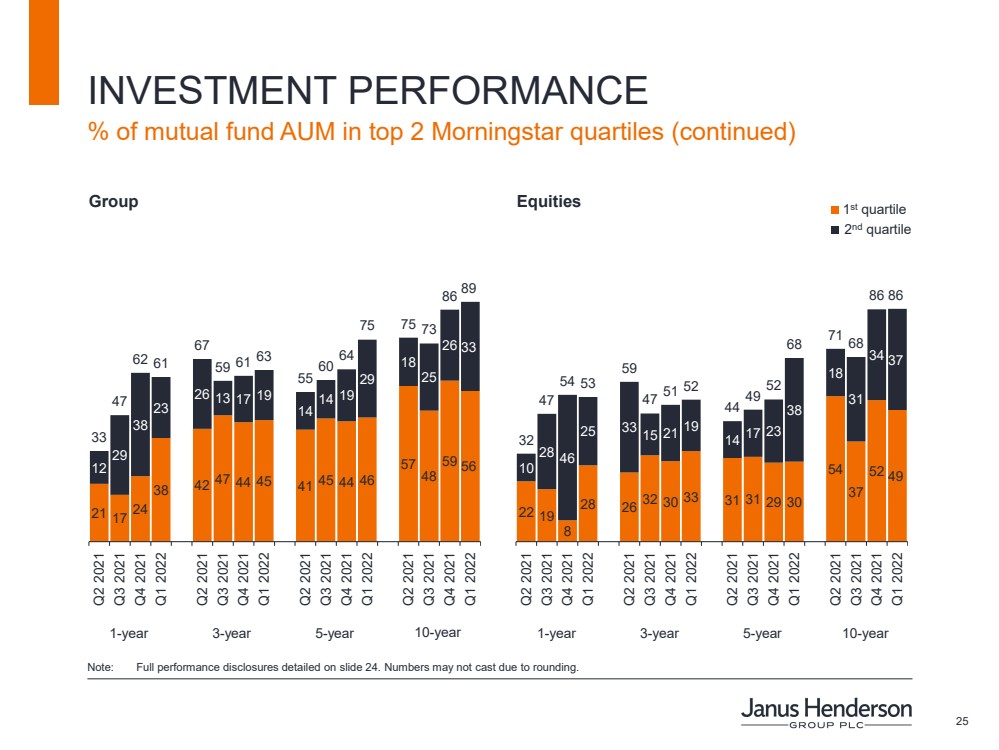
| 25 INVESTMENT PERFORMANCE % of mutual fund AUM in top 2 Morningstar quartiles (continued) Group 21 17 24 38 42 47 44 45 41 45 44 46 57 48 59 56 12 29 38 23 26 13 17 19 14 14 19 29 18 25 26 33 33 47 62 61 67 59 61 63 55 60 64 75 75 73 86 89 Q2 2021 Q3 2021 Q4 2021 Q1 2022 Q2 2021 Q3 2021 Q4 2021 Q1 2022 Q2 2021 Q3 2021 Q4 2021 Q1 2022 Q2 2021 Q3 2021 Q4 2021 Q1 2022 Equities 22 19 8 28 26 32 30 33 31 31 29 30 54 37 52 49 10 28 46 25 33 15 21 19 14 17 23 38 18 31 34 37 32 47 54 53 59 47 51 52 44 49 52 68 71 68 86 86 Q2 2021 Q3 2021 Q4 2021 Q1 2022 Q2 2021 Q3 2021 Q4 2021 Q1 2022 Q2 2021 Q3 2021 Q4 2021 Q1 2022 Q2 2021 Q3 2021 Q4 2021 Q1 2022 2 nd quartile 1 st quartile 1 - year 3 - year 5 - year 10 - year 1 - year 3 - year 5 - year 10 - year Note: Full performance disclosures detailed on slide 24. Numbers may not cast due to rounding. |
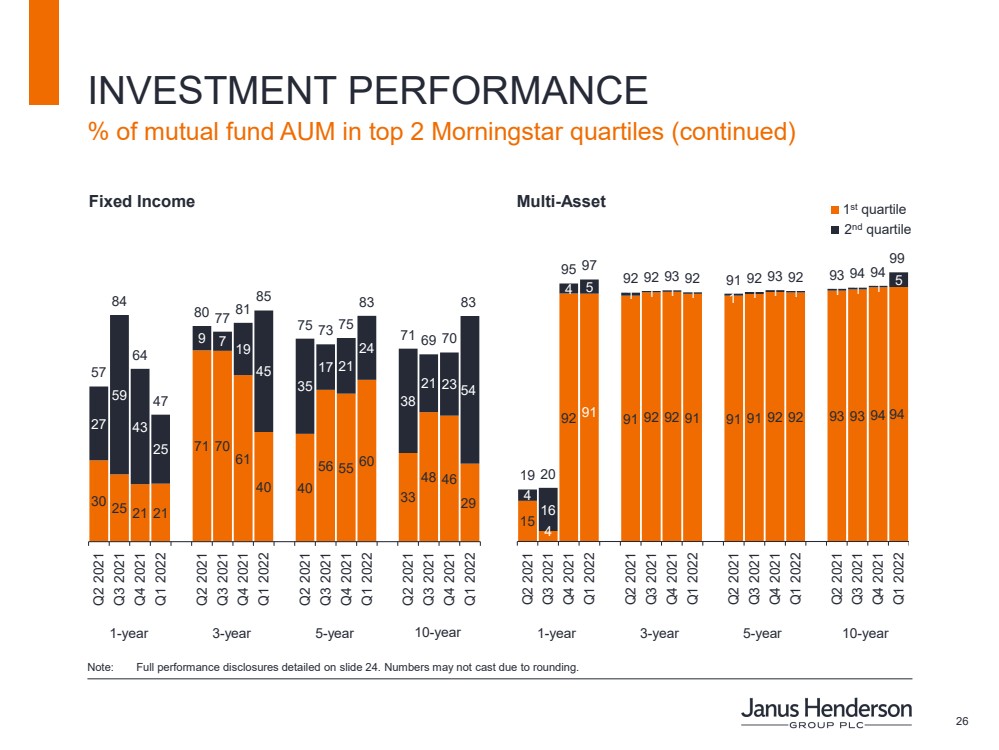
| 26 INVESTMENT PERFORMANCE % of mutual fund AUM in top 2 Morningstar quartiles (continued) 2 nd quartile 1 st quartile Fixed Income Multi - Asset 30 25 21 21 71 70 61 40 40 56 55 60 33 48 46 29 27 59 43 25 9 7 19 45 35 17 21 24 38 21 23 54 57 84 64 47 80 77 81 85 75 73 75 83 71 69 70 83 Q2 2021 Q3 2021 Q4 2021 Q1 2022 Q2 2021 Q3 2021 Q4 2021 Q1 2022 Q2 2021 Q3 2021 Q4 2021 Q1 2022 Q2 2021 Q3 2021 Q4 2021 Q1 2022 15 4 92 91 91 92 92 91 91 91 92 92 93 93 94 94 4 16 4 5 1 1 1 1 1 1 1 1 1 1 1 5 19 20 95 97 92 92 93 92 91 92 93 92 93 94 94 99 Q2 2021 Q3 2021 Q4 2021 Q1 2022 Q2 2021 Q3 2021 Q4 2021 Q1 2022 Q2 2021 Q3 2021 Q4 2021 Q1 2022 Q2 2021 Q3 2021 Q4 2021 Q1 2022 1 - year 3 - year 5 - year 10 - year 1 - year 3 - year 5 - year 10 - year Note: Full performance disclosures detailed on slide 24. Numbers may not cast due to rounding. |
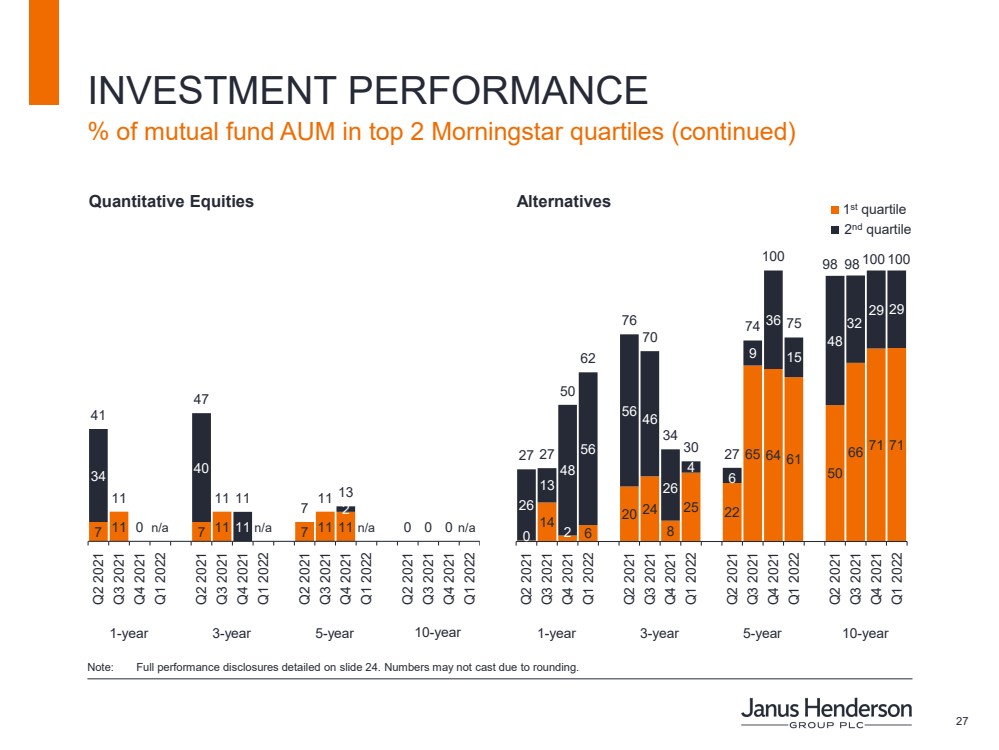
| 27 7 11 7 11 7 11 11 34 40 11 2 41 11 0 n/a 47 11 11 n/a 7 11 13 n/a 0 0 0 n/a Q2 2021 Q3 2021 Q4 2021 Q1 2022 Q2 2021 Q3 2021 Q4 2021 Q1 2022 Q2 2021 Q3 2021 Q4 2021 Q1 2022 Q2 2021 Q3 2021 Q4 2021 Q1 2022 0 14 2 6 20 24 8 25 22 65 64 61 50 66 71 71 26 13 48 56 56 46 26 4 6 9 36 15 48 32 29 29 27 27 50 62 76 70 34 30 27 74 100 75 98 98 100 100 Q2 2021 Q3 2021 Q4 2021 Q1 2022 Q2 2021 Q3 2021 Q4 2021 Q1 2022 Q2 2021 Q3 2021 Q4 2021 Q1 2022 Q2 2021 Q3 2021 Q4 2021 Q1 2022 INVESTMENT PERFORMANCE % of mutual fund AUM in top 2 Morningstar quartiles (continued) Quantitative Equities Alternatives 2 nd quartile 1 st quartile 1 - year 3 - year 5 - year 10 - year 1 - year 3 - year 5 - year 10 - year Note: Full performance disclosures detailed on slide 24. Numbers may not cast due to rounding. |
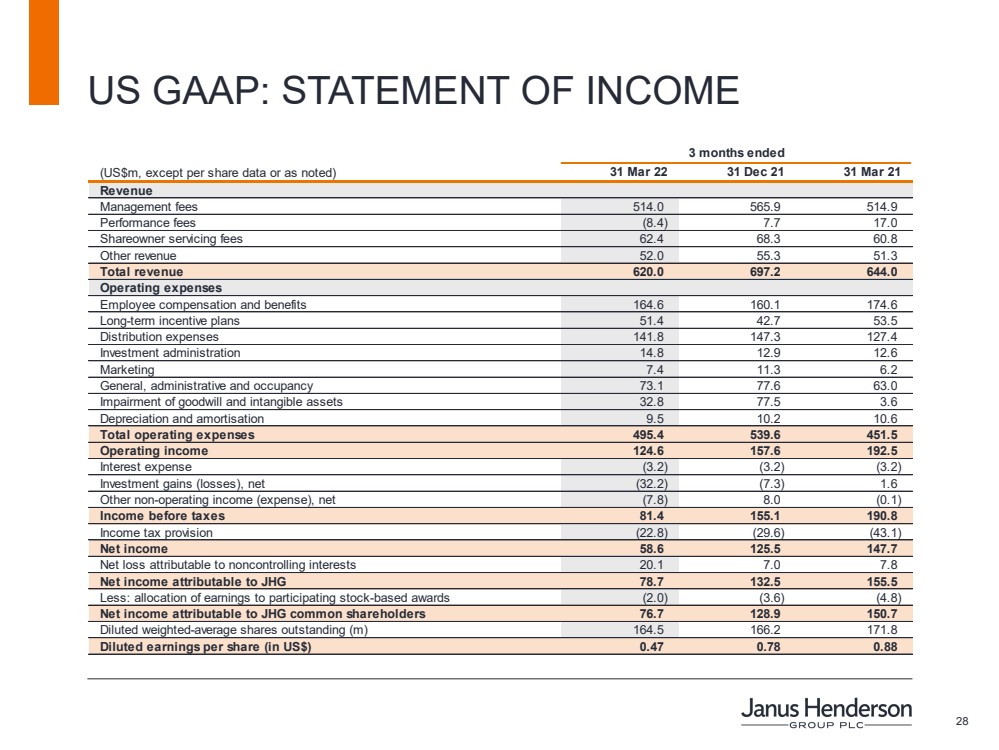
| 28 US GAAP: STATEMENT OF INCOME (US$m, except per share data or as noted) 31 Mar 22 31 Dec 21 31 Mar 21 Revenue Management fees 514.0 565.9 514.9 Performance fees (8.4) 7.7 17.0 Shareowner servicing fees 62.4 68.3 60.8 Other revenue 52.0 55.3 51.3 Total revenue 620.0 697.2 644.0 Operating expenses Employee compensation and benefits 164.6 160.1 174.6 Long-term incentive plans 51.4 42.7 53.5 Distribution expenses 141.8 147.3 127.4 Investment administration 14.8 12.9 12.6 Marketing 7.4 11.3 6.2 General, administrative and occupancy 73.1 77.6 63.0 Impairment of goodwill and intangible assets 32.8 77.5 3.6 Depreciation and amortisation 9.5 10.2 10.6 Total operating expenses 495.4 539.6 451.5 Operating income 124.6 157.6 192.5 Interest expense (3.2) (3.2) (3.2) Investment gains (losses), net (32.2) (7.3) 1.6 Other non-operating income (expense), net (7.8) 8.0 (0.1) Income before taxes 81.4 155.1 190.8 Income tax provision (22.8) (29.6) (43.1) Net income 58.6 125.5 147.7 Net loss attributable to noncontrolling interests 20.1 7.0 7.8 Net income attributable to JHG 78.7 132.5 155.5 Less: allocation of earnings to participating stock-based awards (2.0) (3.6) (4.8) Net income attributable to JHG common shareholders 76.7 128.9 150.7 Diluted weighted-average shares outstanding (m) 164.5 166.2 171.8 Diluted earnings per share (in US$) 0.47 0.78 0.88 3 months ended |
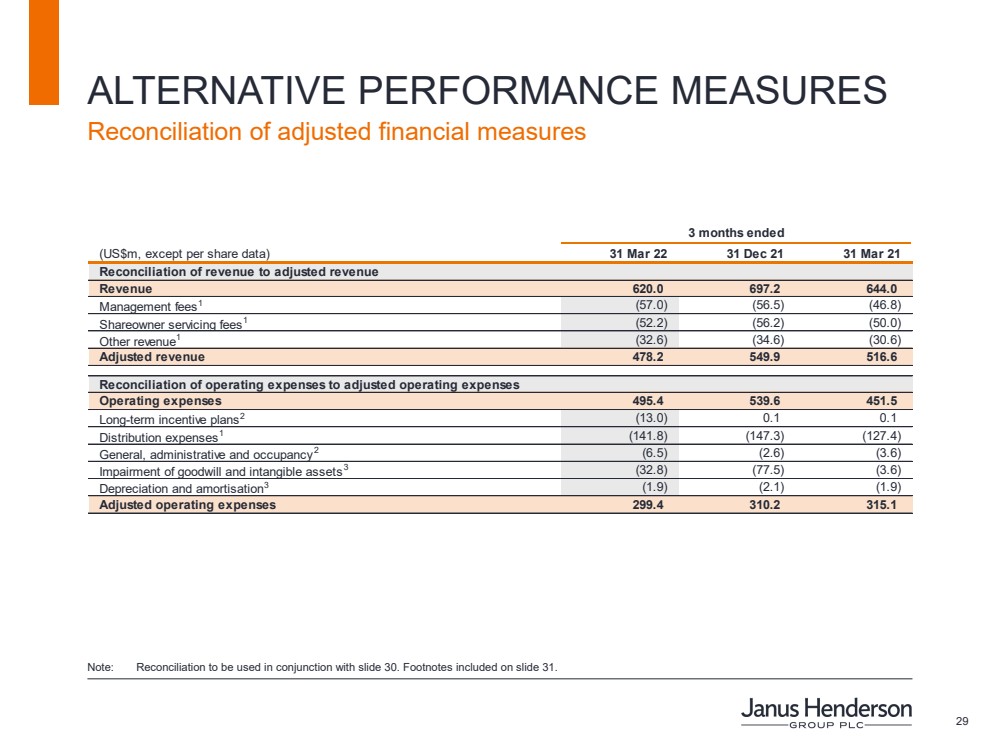
| 29 ALTERNATIVE PERFORMANCE MEASURES Reconciliation of adjusted financial measures Note: Reconciliation to be used in conjunction with slide 30. Footnotes included on slide 31. (US$m, except per share data) 31 Mar 22 31 Dec 21 31 Mar 21 Reconciliation of revenue to adjusted revenue Revenue 620.0 697.2 644.0 Management fees 1 (57.0) (56.5) (46.8) Shareowner servicing fees 1 (52.2) (56.2) (50.0) Other revenue 1 (32.6) (34.6) (30.6) Adjusted revenue 478.2 549.9 516.6 Reconciliation of operating expenses to adjusted operating expenses Operating expenses 495.4 539.6 451.5 Long-term incentive plans 2 (13.0) 0.1 0.1 Distribution expenses 1 (141.8) (147.3) (127.4) General, administrative and occupancy 2 (6.5) (2.6) (3.6) Impairment of goodwill and intangible assets 3 (32.8) (77.5) (3.6) Depreciation and amortisation 3 (1.9) (2.1) (1.9) Adjusted operating expenses 299.4 310.2 315.1 3 months ended |
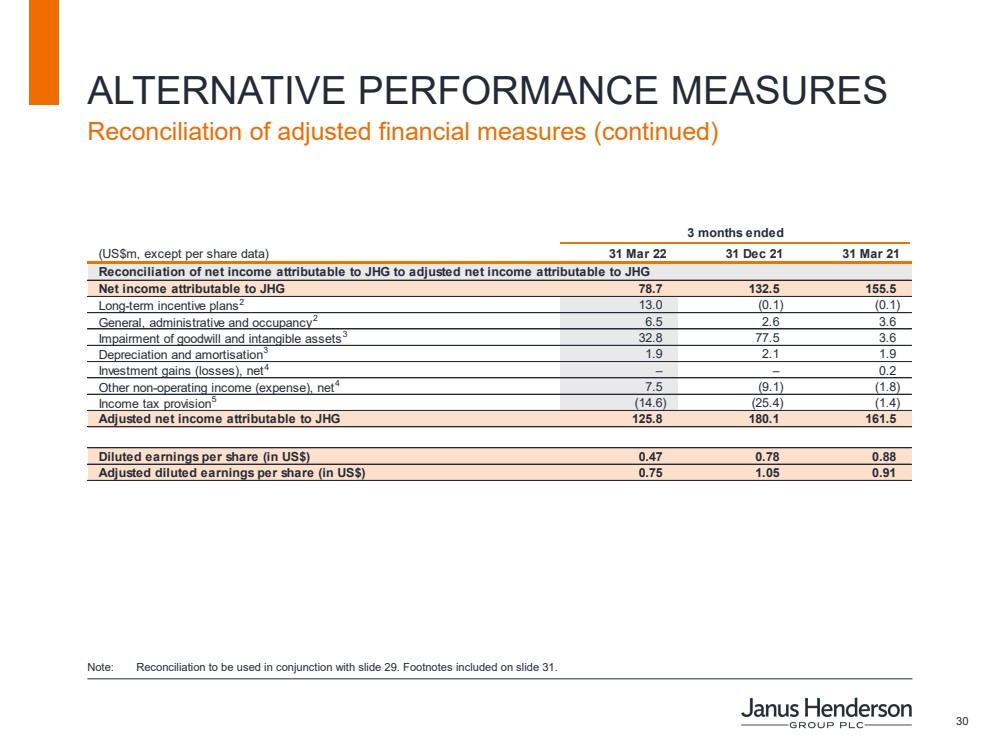
| 30 ALTERNATIVE PERFORMANCE MEASURES Reconciliation of adjusted financial measures (continued) (US$m, except per share data) 31 Mar 22 31 Dec 21 31 Mar 21 Reconciliation of net income attributable to JHG to adjusted net income attributable to JHG Net income attributable to JHG 78.7 132.5 155.5 Long-term incentive plans 2 13.0 (0.1) (0.1) General, administrative and occupancy 2 6.5 2.6 3.6 Impairment of goodwill and intangible assets 3 32.8 77.5 3.6 Depreciation and amortisation 3 1.9 2.1 1.9 Investment gains (losses), net 4 – – 0.2 Other non-operating income (expense), net 4 7.5 (9.1) (1.8) Income tax provision 5 (14.6) (25.4) (1.4) Adjusted net income attributable to JHG 125.8 180.1 161.5 Diluted earnings per share (in US$) 0.47 0.78 0.88 Adjusted diluted earnings per share (in US$) 0.75 1.05 0.91 3 months ended Note: Reconciliation to be used in conjunction with slide 29. Footnotes included on slide 31. |
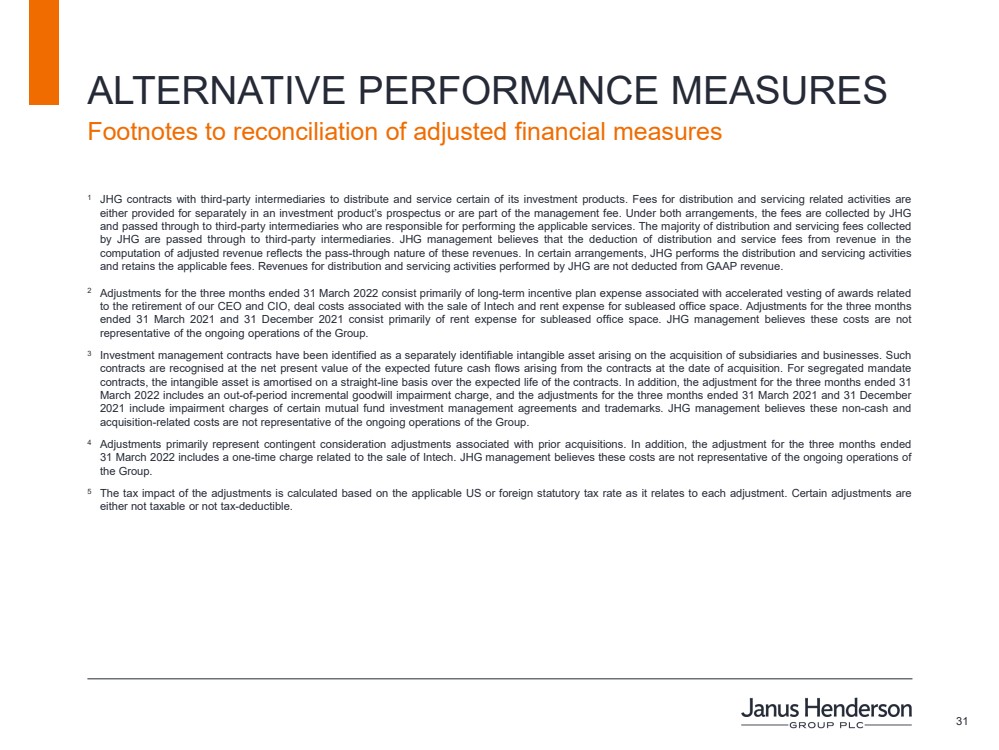
| 31 ALTERNATIVE PERFORMANCE MEASURES Footnotes to reconciliation of adjusted financial measures 1 JHG contracts with third - party intermediaries to distribute and service certain of its investment products .. Fees for distribution and servicing related activities are either provided for separately in an investment product’s prospectus or are part of the management fee .. Under both arrangements, the fees are collected by JHG and passed through to third - party intermediaries who are responsible for performing the applicable services .. The majority of distribution and servicing fees collected by JHG are passed through to third - party intermediaries .. JHG management believes that the deduction of distribution and service fees from revenue in the computation of adjusted revenue reflects the pass - through nature of these revenues .. In certain arrangements, JHG performs the distribution and servicing activities and retains the applicable fees .. Revenues for distribution and servicing activities performed by JHG are not deducted from GAAP revenue .. 2 Adjustments for the three months ended 31 March 2022 consist primarily of long - term incentive plan expense associated with accelerated vesting of awards related to the retirement of our CEO and CIO, deal costs associated with the sale of Intech and rent expense for subleased office space .. Adjustments for the three months ended 31 March 2021 and 31 December 2021 consist primarily of rent expense for subleased office space .. JHG management believes these costs are not representative of the ongoing operations of the Group .. 3 Investment management contracts have been identified as a separately identifiable intangible asset arising on the acquisition of subsidiaries and businesses .. Such contracts are recognised at the net present value of the expected future cash flows arising from the contracts at the date of acquisition .. For segregated mandate contracts, the intangible asset is amortised on a straight - line basis over the expected life of the contracts .. In addition, the adjustment for the three months ended 31 March 2022 includes an out - of - period incremental goodwill impairment charge, and the adjustments for the three months ended 31 March 2021 and 31 December 2021 include impairment charges of certain mutual fund investment management agreements and trademarks .. JHG management believes these non - cash and acquisition - related costs are not representative of the ongoing operations of the Group .. 4 Adjustments primarily represent contingent consideration adjustments associated with prior acquisitions .. In addition, the adjustment for the three months ended 31 March 2022 includes a one - time charge related to the sale of Intech .. JHG management believes these costs are not representative of the ongoing operations of the Group .. 5 The tax impact of the adjustments is calculated based on the applicable US or foreign statutory tax rate as it relates to each adjustment .. Certain adjustments are either not taxable or not tax - deductible .. |
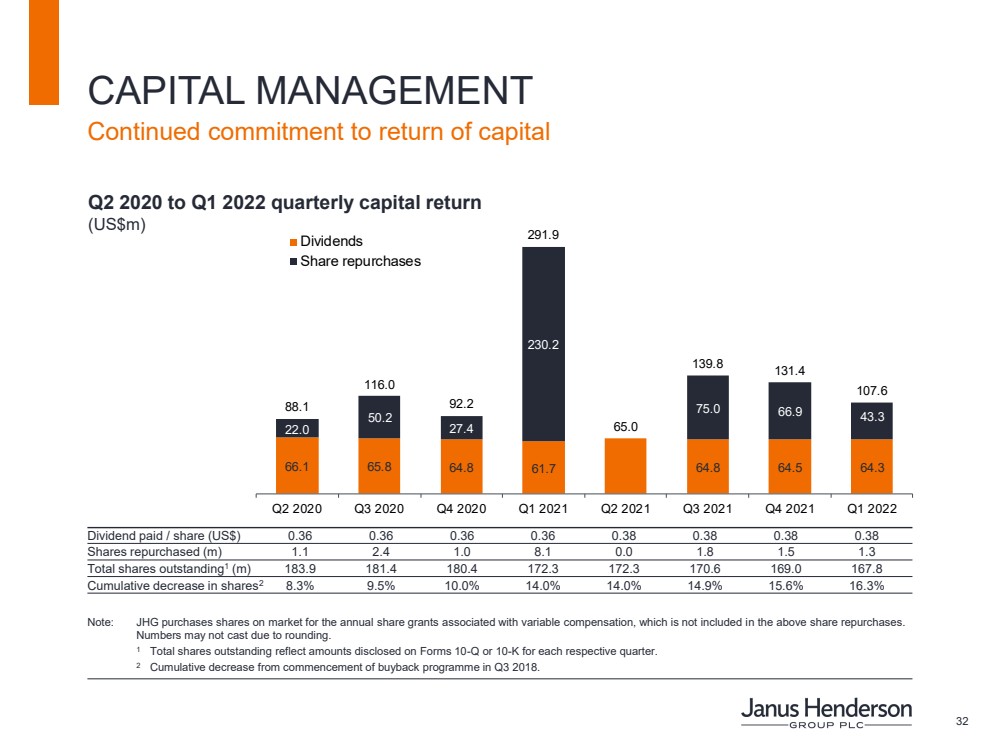
| 32 CAPITAL MANAGEMENT Note: JHG purchases shares on market for the annual share grants associated with variable compensation, which is not included i n the above share repurchases. Numbers may not cast due to rounding. 1 Total shares outstanding reflect amounts disclosed on Forms 10 - Q or 10 - K for each respective quarter. 2 Cumulative decrease from commencement of buyback programme in Q3 2018. Continued commitment to return of capital Dividend paid / share (US$) 0.36 0.36 0.36 0.36 0.38 0.38 0.38 0.38 Shares repurchased (m) 1.1 2.4 1.0 8.1 0.0 1.8 1.5 1.3 Total shares outstanding 1 (m) 183.9 181.4 180.4 172.3 172.3 170.6 169.0 167.8 Cumulative decrease in shares 2 8.3% 9.5% 10.0% 14.0% 14.0% 14.9% 15.6% 16.3% Q2 2020 to Q1 2022 quarterly capital return (US$m) 66.1 65.8 64.8 61.7 64.8 64.5 64.3 22.0 50.2 27.4 230.2 75.0 66.9 43.3 88.1 116.0 92.2 291.9 65.0 139.8 131.4 107.6 Q2 2020 Q3 2020 Q4 2020 Q1 2021 Q2 2021 Q3 2021 Q4 2021 Q1 2022 Dividends Share repurchases |
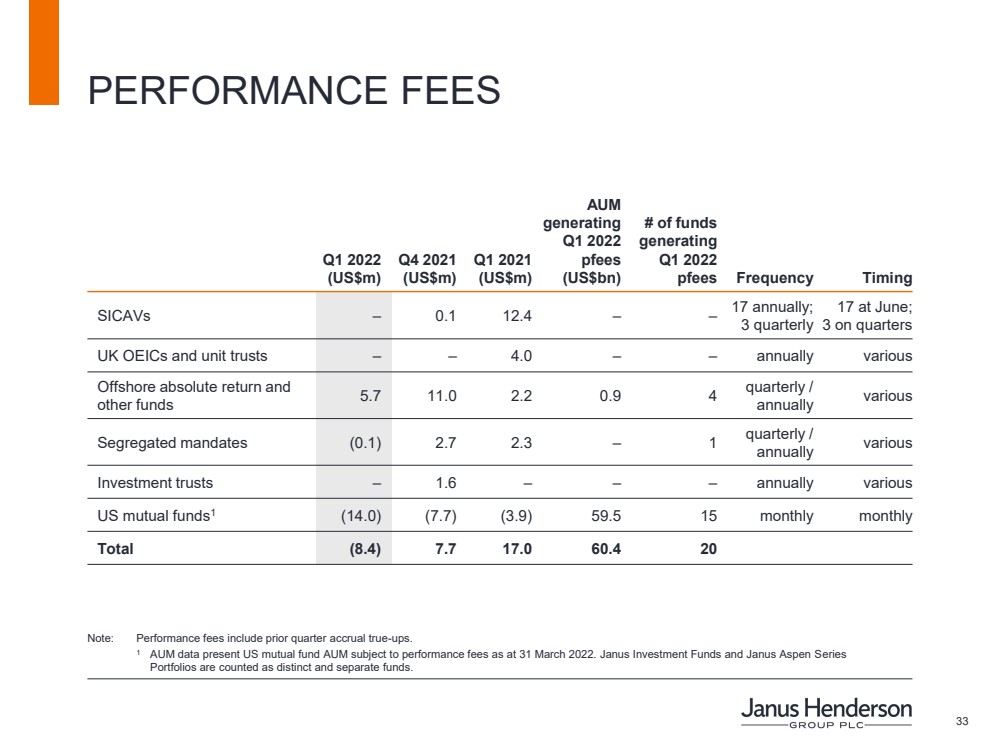
| 33 PERFORMANCE FEES Note: Performance fees include prior quarter accrual true - ups. 1 AUM data present US mutual fund AUM subject to performance fees as at 31 March 2022. Janus Investment Funds and Janus Aspen S eri es Portfolios are counted as distinct and separate funds. Q1 2022 (US$m) Q4 2021 (US$m) Q1 2021 (US$m) AUM generating Q1 2022 pfees (US$bn) # of funds generating Q1 2022 pfees Frequency Timing SICAVs – 0.1 12.4 – – 17 annually; 3 quarterly 17 at June; 3 on quarters UK OEICs and unit trusts – – 4.0 – – annually various Offshore absolute return and other funds 5.7 11.0 2.2 0.9 4 quarterly / annually various Segregated mandates (0.1) 2.7 2.3 – 1 quarterly / annually various Investment trusts – 1.6 – – – annually various US mutual funds 1 (14.0) (7.7) (3.9) 59.5 15 monthly monthly Total (8.4) 7.7 17.0 60.4 20 |
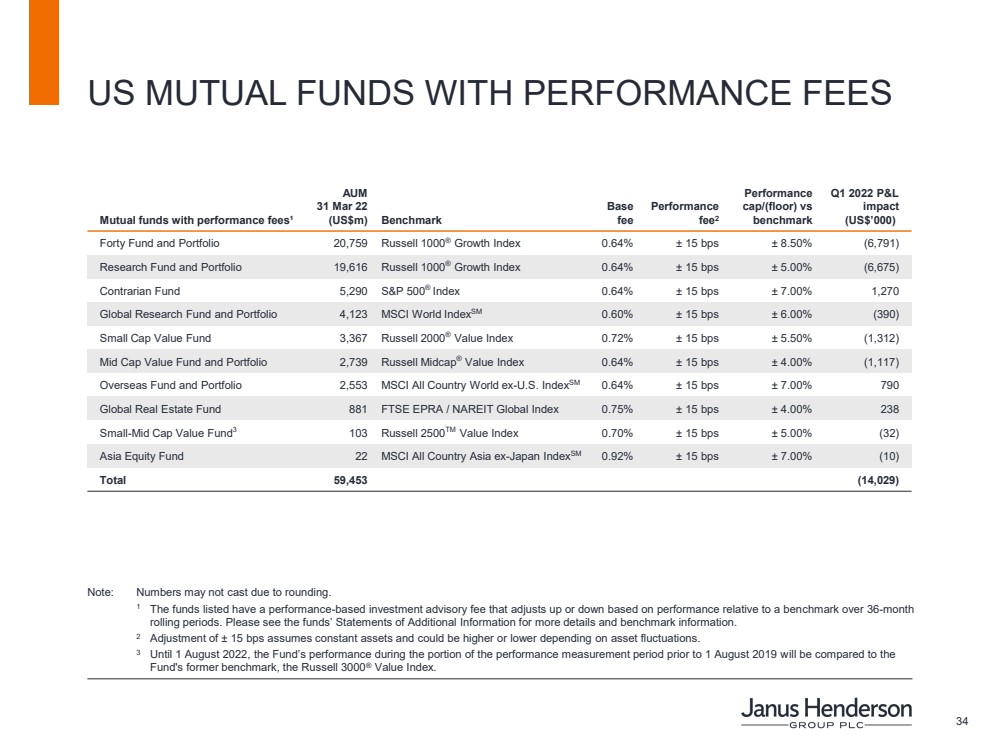
| 34 US MUTUAL FUNDS WITH PERFORMANCE FEES Note: Numbers may not cast due to rounding. 1 The funds listed have a performance - based investment advisory fee that adjusts up or down based on performance relative to a ben chmark over 36 - month rolling periods. Please see the funds’ Statements of Additional Information for more details and benchmark information. 2 Adjustment of ± 15 bps assumes constant assets and could be higher or lower depending on asset fluctuations. 3 Until 1 August 2022, the Fund’s performance during the portion of the performance measurement period prior to 1 August 2019 w il l be compared to the Fund's former benchmark, the Russell 3000 ® Value Index. Mutual funds with performance fees¹ AUM 31 Mar 22 (US$m) Benchmark Base fee Performance fee 2 Performance cap/(floor) vs benchmark Q1 2022 P&L impact (US$’000) Forty Fund and Portfolio 20,759 Russell 1000 ® Growth Index 0.64% ± 15 bps ± 8.50% (6,791) Research Fund and Portfolio 19,616 Russell 1000 ® Growth Index 0.64% ± 15 bps ± 5.00% (6,675) Contrarian Fund 5,290 S&P 500 ® Index 0.64% ± 15 bps ± 7.00% 1,270 Global Research Fund and Portfolio 4,123 MSCI World Index SM 0.60% ± 15 bps ± 6.00% (390) Small Cap Value Fund 3,367 Russell 2000 ® Value Index 0.72% ± 15 bps ± 5.50% (1,312) Mid Cap Value Fund and Portfolio 2,739 Russell Midcap ® Value Index 0.64% ± 15 bps ± 4.00% (1,117) Overseas Fund and Portfolio 2,553 MSCI All Country World ex - U.S. Index SM 0.64% ± 15 bps ± 7.00% 790 Global Real Estate Fund 881 FTSE EPRA / NAREIT Global Index 0.75% ± 15 bps ± 4.00% 238 Small - Mid Cap Value Fund 3 103 Russell 2500 TM Value Index 0.70% ± 15 bps ± 5.00% (32) Asia Equity Fund 22 MSCI All Country Asia ex - Japan Index SM 0.92% ± 15 bps ± 7.00% (10) Total 59,453 (14,029) |
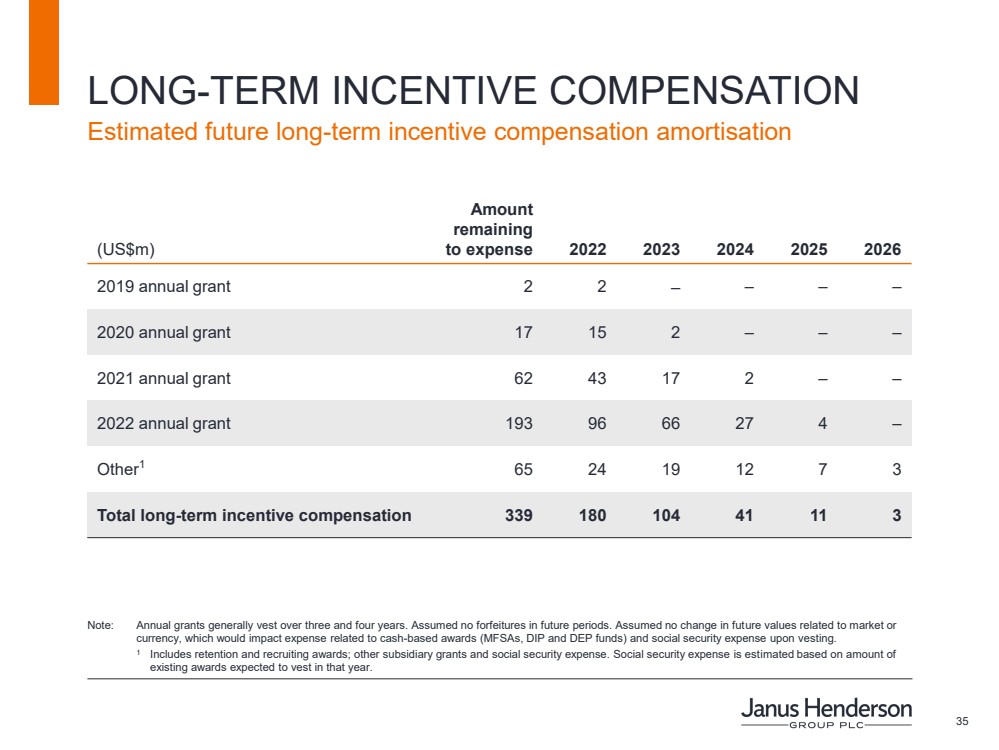
| 35 LONG - TERM INCENTIVE COMPENSATION Note: Annual grants generally vest over three and four years. Assumed no forfeitures in future periods. Assumed no change in fut ure values related to market or currency, which would impact expense related to cash - based awards (MFSAs, DIP and DEP funds) and social security expense upon ve sting. 1 Includes retention and recruiting awards; other subsidiary grants and social security expense. Social security expense is est ima ted based on amount of existing awards expected to vest in that year. Estimated future long - term incentive compensation amortisation (US$ m) Amount remaining to expense 2022 2023 2024 2025 2026 2019 annual grant 2 2 – – – – 2020 annual grant 17 15 2 – – – 2021 annual grant 62 43 17 2 – – 2022 annual grant 193 96 66 27 4 – Other 1 65 24 19 12 7 3 Total long - term incentive compensation 339 180 104 41 11 3 |
| 36 CONTACTS Investor enquiries Melanie Horton Co - Head Investor Relations (Non - US) +44 (0)20 7818 2905 [email protected] Jim Kurtz Co - Head Investor Relations (US) +1 303 336 4529 [email protected] Investor Relations [email protected] Media enquiries Stephen Sobey +44 (0)20 7818 2523 [email protected] Sarah Johnson +1 720 364 0708 [email protected] United Kingdom: Edelman Smithfield Latika Shah +44 (0)7950 671 948 [email protected] Andrew Wilde +44 (0)7786 022 022 [email protected] Asia Pacific: Honner Craig Morris +61 2 8248 3757 [email protected] |

| 201 Bishopsgate London EC2M 3AE United Kingdom www.janushenderson.com Contact us Past performance is no guarantee of future results. Investing involves risk, including the possible loss of principal and flu ctu ation of value. Forward - looking information This presentation includes statements concerning potential future events involving Janus Henderson Group plc that could diffe r m aterially from the events that actually occur. The differences could be caused by a number of factors, including those factors identified in Jan us Henderson Group’s Annual Report on Form 10 - K for the fiscal year ended 31 December 2021 and the Company’s other filings and furnishings with the S ecurities and Exchange Commission (Commission file no. 001 - 38103), including those that appear under headings such as ‘Risk Factors’ and ‘Mana gement’s Discussion and Analysis of Financial Condition and Results of Operations’. Many of these factors are beyond the control of th e C ompany and its management. Any forward - looking statements contained in this presentation are as of the date on which such statements were made. The Company assumes no duty to update them, even if experience, unexpected events, or future changes make it clear that any projected res ult s expressed or implied therein will not be realised. Annualised, pro forma, projected and estimated numbers are used for illustrative purpos es only, are not forecasts and may not reflect actual results. No public offer The information, statements and opinions contained in this presentation do not constitute a public offer under any applicable le gislation or an offer to sell or solicitation of any offer to buy any securities or financial instruments or any advice or recommendation with respect to such securities or other financial instruments. Not all products or services are available in all jurisdictions. Various account minimums or other eligibility qualifications ap ply depending on the investment strategy, vehicle or investor jurisdiction. Mutual funds in the US distributed by Janus Henderson Distributors US LLC .. Please consider the charges, risks, expenses and investment objectives carefully before investing. For a US fund prospectus or, if available, a summary prospectus containing this and other information, please contact your investment professional or call 800.668.0434. Read it carefully before you invest or send money. Janus Henderson is a trademark of Janus Henderson Group plc. © Janus Henderson Group plc. |
Serious News for Serious Traders! Try StreetInsider.com Premium Free!
You May Also Be Interested In
- Janus Henderson Group (JHG) PT Raised to $35 at JPMorgan
- Janus Henderson Group Plc. (JHG:AU) (JHG) PT Raised to AUD35 at JPMorgan
- Janus Henderson Group (JHG) PT Raised to $33 at Morgan Stanley
Create E-mail Alert Related Categories
SEC FilingsRelated Entities
Henderson GroupSign up for StreetInsider Free!
Receive full access to all new and archived articles, unlimited portfolio tracking, e-mail alerts, custom newswires and RSS feeds - and more!
