

Form 8-K Independence Contract For: Jan 20
 Tweet
Tweet Share
ShareExhibit 99.1
| Investor Presentation January 20 , 2022 |
| 2 Preliminary Matters Various statements contained in this presentation, including those that express a belief, expectation or intention, as well a s t hose that are not statements of historical fact, are forward - looking statements. These forward - looking statements may include projections and estimates concerning the timing and success of specific projects and our future revenues, income and capital spending. Our forward - looking statements are generally accompanied by words such as “ estimate, ” “ project, ” “ predict, ” “ believe, ” “ expect, ” “ anticipate, ” “ potential, ” “ plan, ” “ goal, ” “ will ” or other words that convey the uncertainty of future events or outcomes. The forward - looking statements in this presentation speak only as of the da te of this presentation; we disclaim any obligation to update these statements unless required by law, and we caution you not to rely on them unduly. We have based these forward - looking statements on our current expectations and assumptions about future events. While our management considers these expectations and assumptions to be reasonable, they are inherently subject to significan t b usiness, economic, competitive, regulatory and other risks, contingencies and uncertainties, most of which are difficult to predict and many of which are beyond our control. These and o the r important factors, including those discussed under “ Risk Factors ” and “ Management ’ s Discussion and Analysis of Financial Condition and Results of Operations ” included in the Company ’ s filings with the Securities and Exchange Commission, including the Company ’ s Annual Report on Form 10 - K, may cause our actual results, performance or achievements to differ materially from any future res ults, performance or achievements expressed or implied by these forward - looking statements. These risks, contingencies and uncertainties include, but are not limited to, the following : • inability to predict the duration or magnitude of the effects of the COVID - 19 pandemic on our business, operations, and financial condition and when or if worldwide oil demand will stabilize and begin to improve ; • decline in or substantial volatility of crude oil and natural gas commodity prices • a sustained decrease in domestic spending by the oil and natural gas exploration and production industry ; • fluctuation of our operating results and volatility of our industry ; • inability to maintain or increase pricing of our contract drilling services, or early termination of any term contract for which early termination compensation is not paid ; • our backlog of term contracts declining rapidly ; • the loss of any of our customers, financial distress or management changes of potential customers or failure to obtain contract renewals and additional customer contracts for our drilling services ; • overcapacity and competition in our industry ; • an increase in interest rates and deterioration in the credit markets ; • our inability to comply with the financial and other covenants in debt agreements that we may enter into as a result of reduced revenues and financial performance ; • unanticipated costs, delays and other difficulties in executing our long - term growth strategy ; • the loss of key management personnel ; • new technology that may cause our drilling methods or equipment to become less competitive ; • labor costs or shortages of skilled workers ; • the loss of or interruption in operations of one or more key vendors ; • the effect of operating hazards and severe weather on our rigs, facilities, business, operations and financial results, and limitations on our insurance coverage ; • increased regulation of drilling in unconventional formations ; • the incurrence of significant costs and liabilities in the future resulting from our failure to comply with new or existing environmental regulations or an accidental release of hazardous substances into the environment ; and • the potential failure by us to establish and maintain effective internal control over financial reporting .. All forward - looking statements are necessarily only estimates of future results, and there can be no assurance that actual resul ts will not differ materially from expectations, and, therefore, you are cautioned not to place undue reliance on such statements. Any forward - looking statements are qualified in their entirety by refe rence to the factors discussed throughout this presentation and in the Company’s filings with the Securities and Exchange Commission, including the Company’s Annual Report on Form 10 - K. Further, any forward - looking statement speaks only as of the date of this presentation, and we undertake no obligation to update any forward - looking statement to reflect events or circumstances after th e date on which the statement is made or to reflect the occurrence of unanticipated events. Adjusted Net Income or Loss, EBITDA and adjusted EBITDA are supplemental non - GAAP financial measures that are used by management and external users of the Company’s financial statements, such as industry analysts, investors, lenders and rating agencies. The Company’s management believes adjusted Net Income or Los s, EBITDA and adjusted EBITDA are useful because such measures allow the Company and its stockholders to more effectively evaluate its operating performance and compare the result s o f its operations from period to period and against its peers without regard to its financing methods or capital structure. See non - GAAP financial measures at the end of this presentation for a full reconciliation of Net Income or Loss to adjusted Net Income or Loss, EBITDA and adjusted EBITDA. |
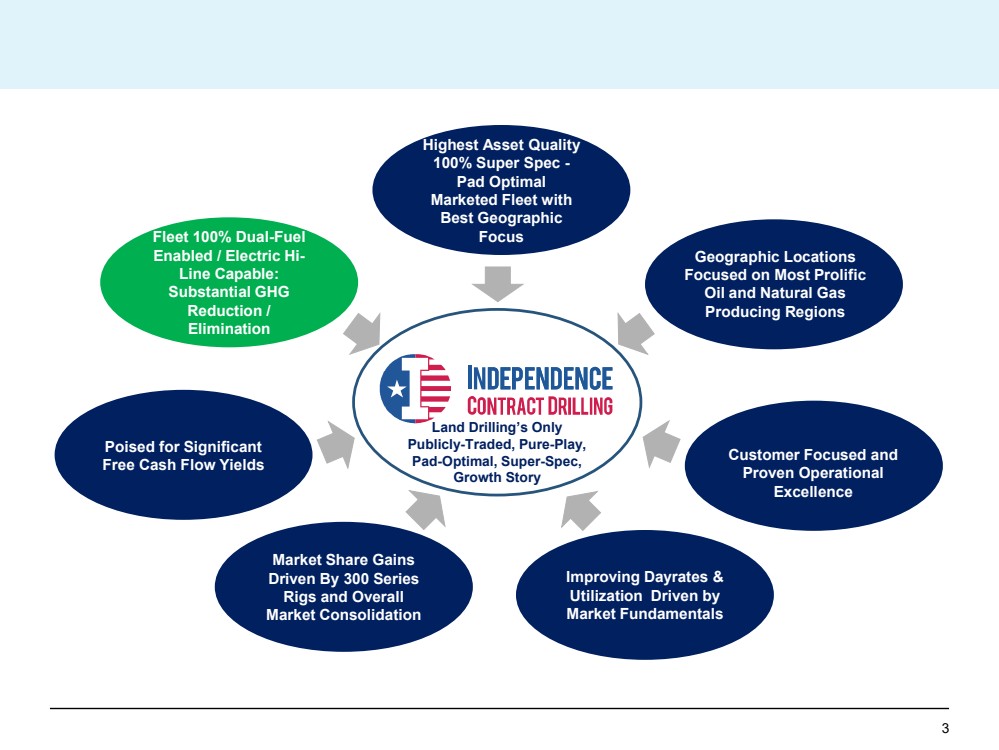
| 3 Land Drilling’s Only Publicly - Traded, Pure - Play, Pad - Optimal, Super - Spec, Growth Story Highest Asset Quality 100 % Super Spec - Pad Optimal Marketed Fleet with Best Geographic Focus Improving Dayrates & Utilization Driven by Market Fundamentals Market Share Gains Driven By 300 Series Rigs and Overall Market Consolidation Poised for Significant Free Cash Flow Yields Fleet 100% Dual - Fuel Enabled / Electric Hi - Line Capable: Substantial GHG Reduction / Elimination Customer Focused and Proven Operational Excellence Geographic Locations Focused on Most Prolific Oil and Natural Gas Producing Regions |
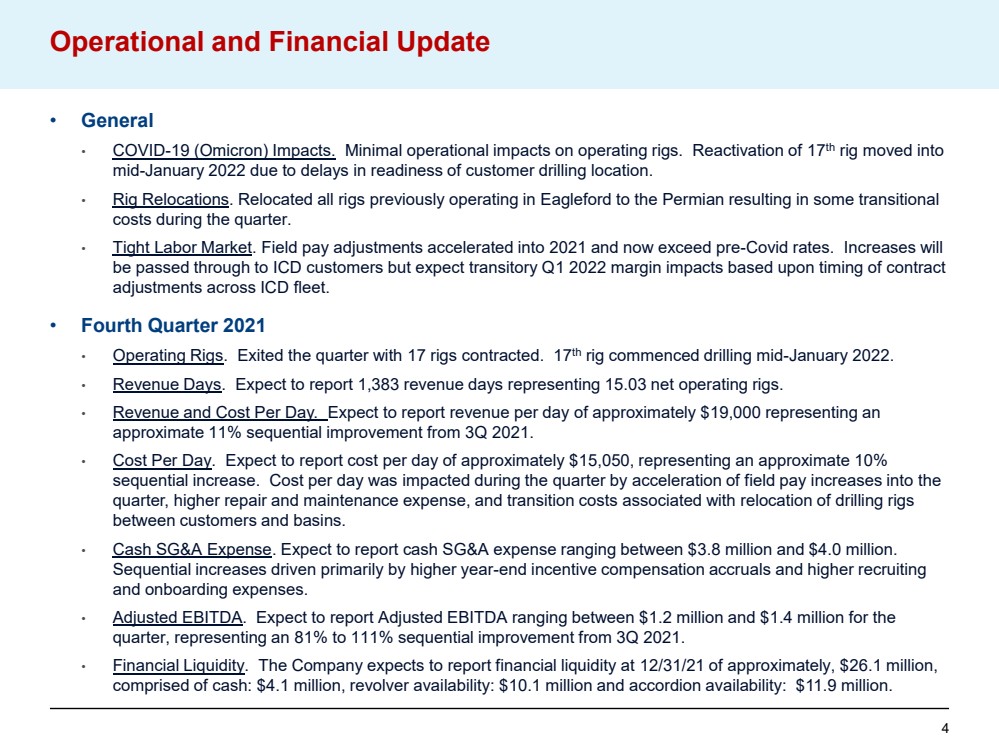
| 4 • General • COVID - 19 (Omicron) Impacts. Minimal operational impacts on operating rigs. Reactivation of 17 th rig moved into mid - January 2022 due to delays in readiness of customer drilling location. • Rig Relocations .. Relocated all rigs previously operating in Eagleford to the Permian resulting in some transitional costs during the quarter. • Tight Labor Market .. Field pay adjustments accelerated into 2021 and now exceed pre - Covid rates. Increases will be passed through to ICD customers but expect transitory Q 1 2022 margin impacts based upon timing of contract adjustments across ICD fleet. • Fourth Quarter 2021 • Operating Rigs .. Exited the quarter with 17 rigs contracted. 17 th rig commenced drilling mid - January 2022 .. • Revenue Days .. Expect to report 1,383 revenue days representing 15.03 net operating rigs. • Revenue and Cost Per Day. Expect to report revenue per day of approximately $ 19,000 representing an approximate 11 % sequential improvement from 3 Q 2021 .. • Cost Per Day .. Expect to report cost per day of approximately $ 15,050 , representing an approximate 10 % sequential increase. Cost per day was impacted during the quarter by acceleration of field pay increases into the quarter, higher repair and maintenance expense, and transition costs associated with relocation of drilling rigs between customers and basins. • Cash SG&A Expense .. Expect to report cash SG&A expense ranging between $ 3.8 million and $ 4.0 million. Sequential increases driven primarily by higher year - end incentive compensation accruals and higher recruiting and onboarding expenses. • Adjusted EBITDA .. Expect to report Adjusted EBITDA ranging between $ 1.2 million and $ 1.4 million for the quarter, representing an 81 % to 111 % sequential improvement from 3 Q 2021 .. • Financial Liquidity .. The Company expects to report financial liquidity at 12 / 31 / 21 of approximately, $ 26.1 million, comprised of cash: $ 4.1 million, revolver availability: $ 10.1 million and accordion availability: $ 11.9 million. Operational and Financial Update |
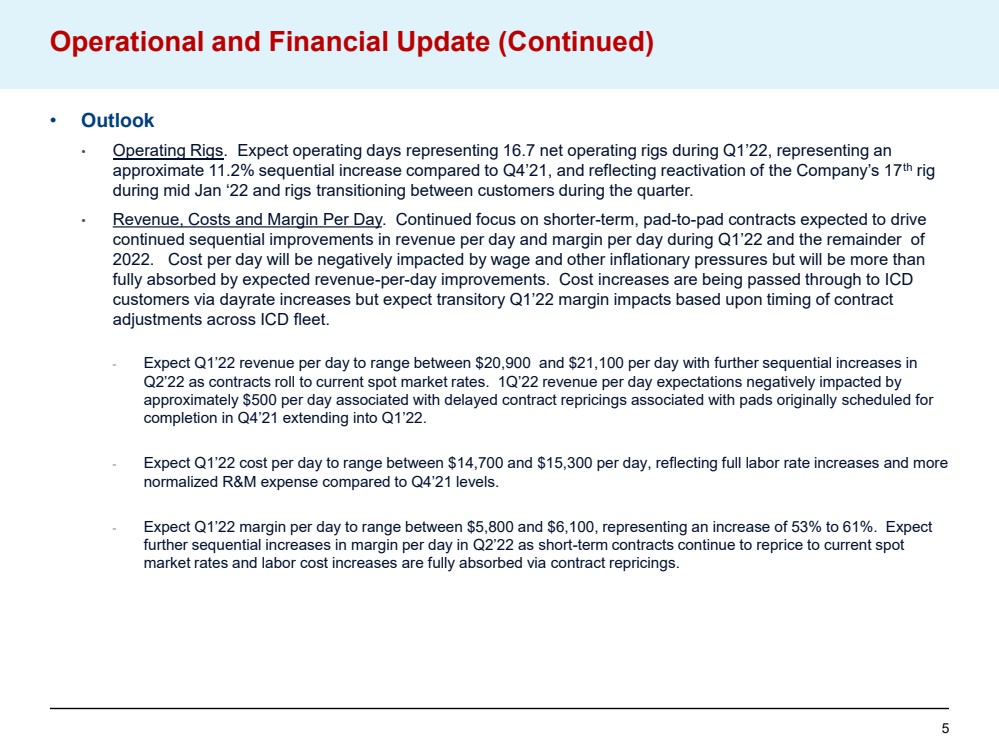
| 5 • Outlook • Operating Rigs .. Expect operating days representing 16.7 net operating rigs during Q1’22, representing an approximate 11.2% sequential increase compared to Q4’21, and reflecting reactivation of the Company’s 17 th rig during mid Jan ‘22 and rigs transitioning between customers during the quarter. • Revenue, Costs and Margin Per Day .. Continued focus on shorter - term, pad - to - pad contracts expected to drive continued sequential improvements in revenue per day and margin per day during Q1’22 and the remainder of 2022. Cost per day will be negatively impacted by wage and other inflationary pressures but will be more than fully absorbed by expected revenue - per - day improvements. Cost increases are being passed through to ICD customers via dayrate increases but expect transitory Q1’22 margin impacts based upon timing of contract adjustments across ICD fleet. - Expect Q1’22 revenue per day to range between $20,900 and $21,100 per day with further sequential increases in Q2’22 as contracts roll to current spot market rates. 1Q’22 revenue per day expectations negatively impacted by approximately $500 per day associated with delayed contract repricings associated with pads originally scheduled for completion in Q4’21 extending into Q1’22. - Expect Q1’22 cost per day to range between $14,700 and $15,300 per day, reflecting full labor rate increases and more normalized R&M expense compared to Q4’21 levels. - Expect Q1’22 margin per day to range between $5,800 and $6,100, representing an increase of 53% to 61%. Expect further sequential increases in margin per day in Q2’22 as short - term contracts continue to reprice to current spot market rates and labor cost increases are fully absorbed via contract repricings .. Operational and Financial Update (Continued) |
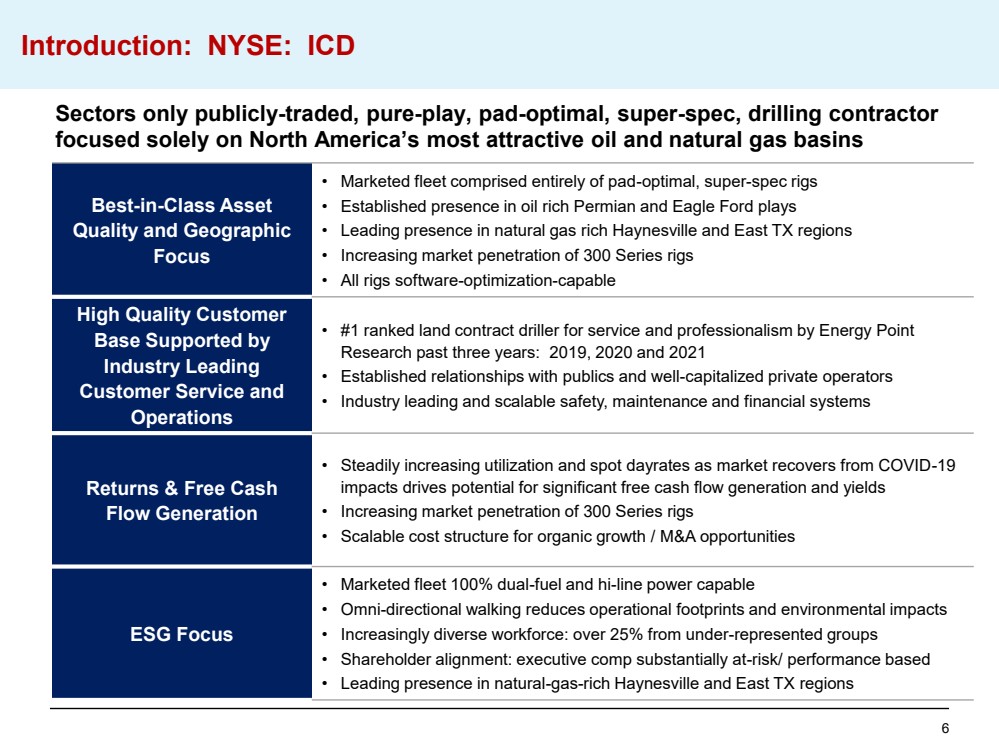
| 6 Introduction: NYSE: ICD Best - in - Class Asset Quality and Geographic Focus • Marketed fleet comprised entirely of pad - optimal, super - spec rigs • Established presence in oil rich Permian and Eagle Ford plays • Leading presence in natural gas rich Haynesville and East TX regions • Increasing market penetration of 300 Series rigs • All rigs software - optimization - capable High Quality Customer Base Supported by Industry Leading Customer Service and Operations • #1 ranked land contract driller for service and professionalism by Energy Point Research past three years: 2019, 2020 and 2021 • Established relationships with publics and well - capitalized private operators • Industry leading and scalable safety, maintenance and financial systems Returns & Free Cash Flow Generation • Steadily increasing utilization and spot dayrates as market recovers from COVID - 19 impacts drives potential for significant free cash flow generation and yields • Increasing market penetration of 300 Series rigs • Scalable cost structure for organic growth / M&A opportunities ESG Focus • Marketed fleet 100% dual - fuel and hi - line power capable • Omni - directional walking reduces operational footprints and environmental impacts • Increasingly diverse workforce: over 25% from under - represented groups • Shareholder alignment: executive comp substantially at - risk/ performance based • Leading presence in natural - gas - rich Haynesville and East TX regions Sectors only publicly - traded, pure - play, pad - optimal, super - spec, drilling contractor focused solely on North America’s most attractive oil and natural gas basins |
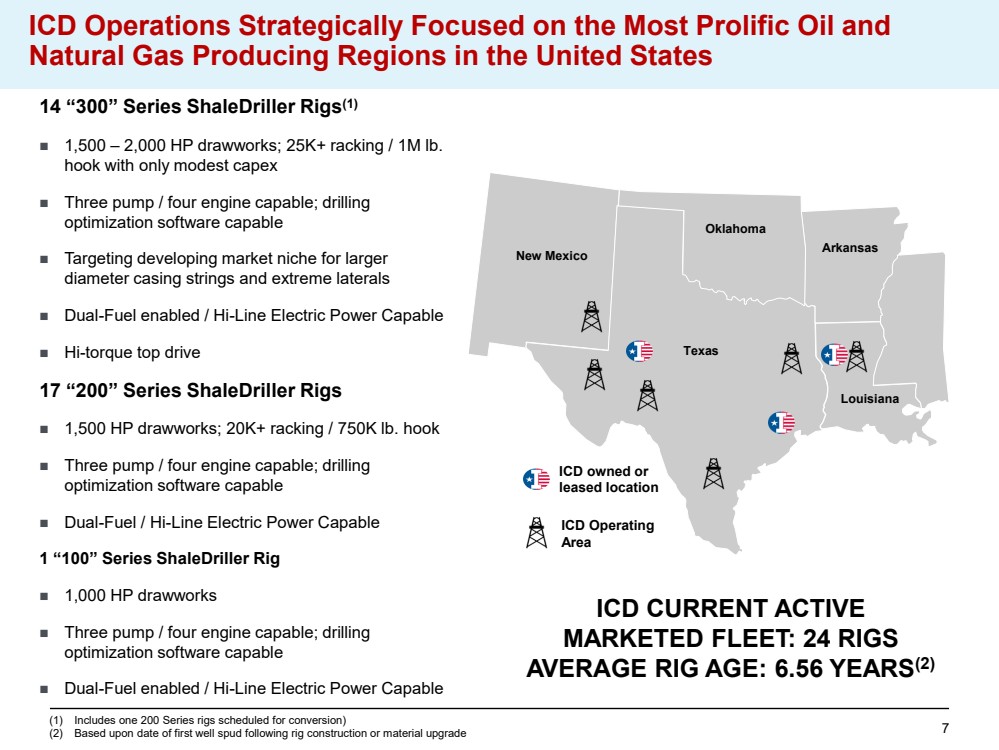
| 7 14 “300” Series ShaleDriller Rigs (1) ◼ 1,500 – 2,000 HP drawworks; 25K+ racking / 1M lb. hook with only modest capex ◼ Three pump / four engine capable; drilling optimization software capable ◼ Targeting developing market niche for larger diameter casing strings and extreme laterals ◼ Dual - Fuel enabled / Hi - Line Electric Power Capable ◼ Hi - torque top drive 17 “200” Series ShaleDriller Rigs ◼ 1,500 HP drawworks; 20K+ racking / 750K lb. hook ◼ Three pump / four engine capable; drilling optimization software capable ◼ Dual - Fuel / Hi - Line Electric Power Capable 1 “100” Series ShaleDriller Rig ◼ 1,000 HP drawworks ◼ Three pump / four engine capable; drilling optimization software capable ◼ Dual - Fuel enabled / Hi - Line Electric Power Capable ICD Operations Strategically Focused on the Most Prolific Oil and Natural Gas Producing Regions in the United States Texas Oklahoma Arkansas Louisiana New Mexico ICD owned or leased location ICD Operating Area (1) Includes one 200 Series rigs scheduled for conversion) (2) Based upon date of first well spud following rig construction or material upgrade ICD CURRENT ACTIVE MARKETED FLEET: 24 RIGS AVERAGE RIG AGE: 6.56 YEARS (2) |
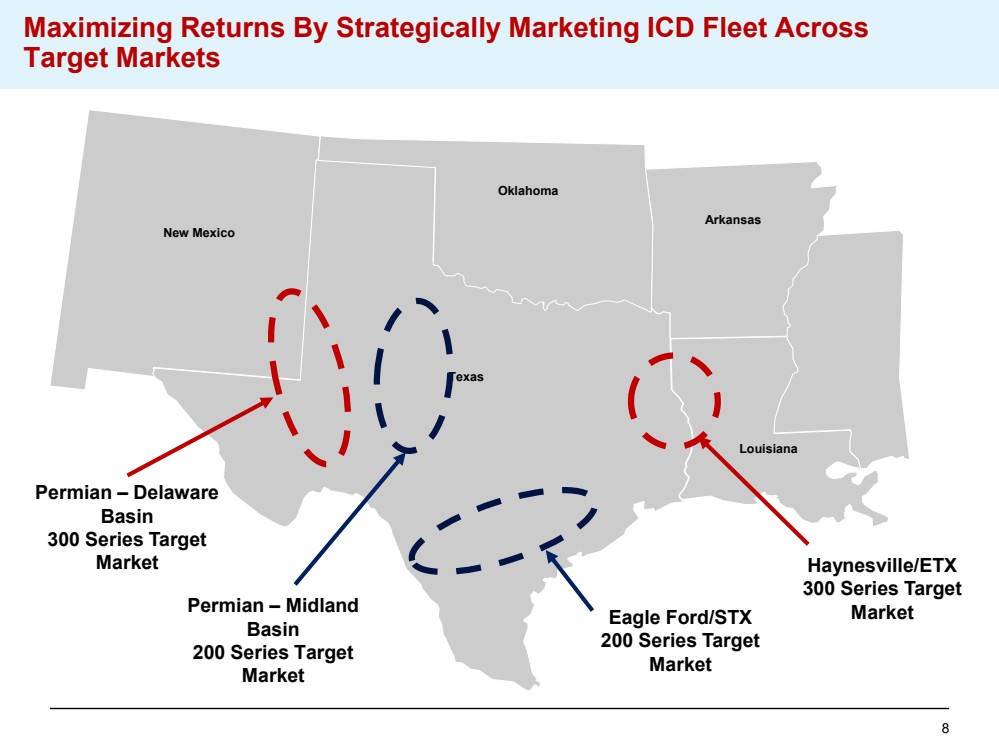
| 8 Maximizing Returns By Strategically Marketing ICD Fleet Across Target Markets Texas Oklahoma Arkansas Louisiana New Mexico Haynesville/ETX 300 Series Target Market Permian – Delaware Basin 300 Series Target Market Permian – Midland Basin 200 Series Target Market Eagle Ford/STX 200 Series Target Market |
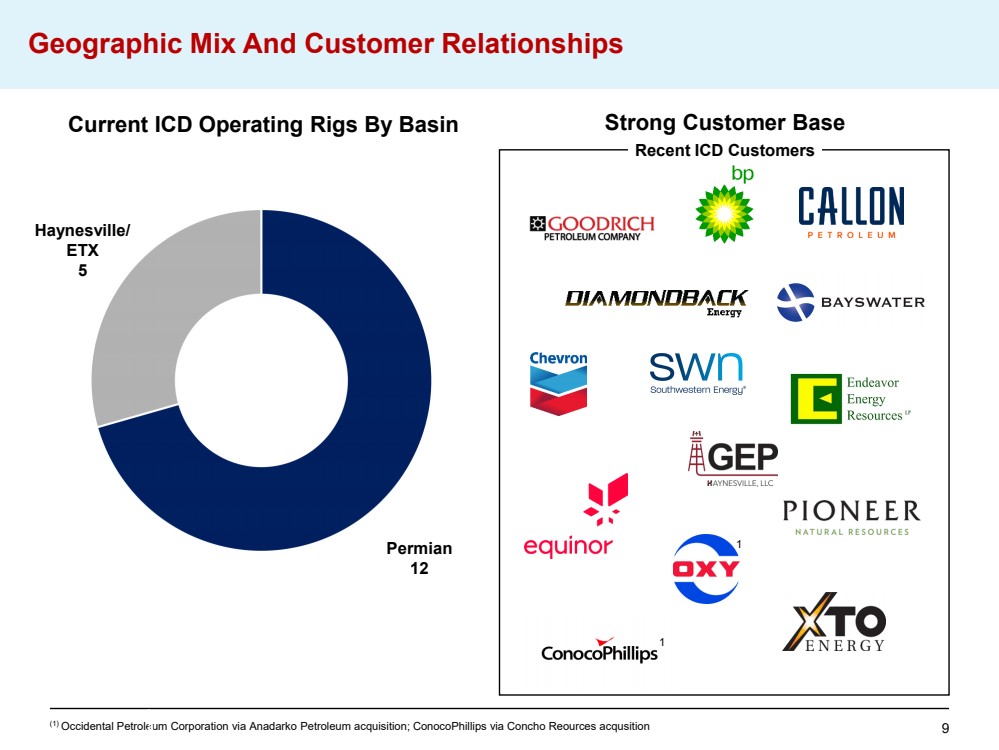
| 9 Geographic Mix And Customer Relationships Recent ICD Customers Strong Customer Base Current ICD Operating Rigs By Basin ( 1 ) Occidental Petroleum Corporation via Anadarko Petroleum acquisition; ConocoPhillips via Concho Reources acqusition P e r m i a n 7 Permian 12 Haynesville/ ETX 5 1 1 |
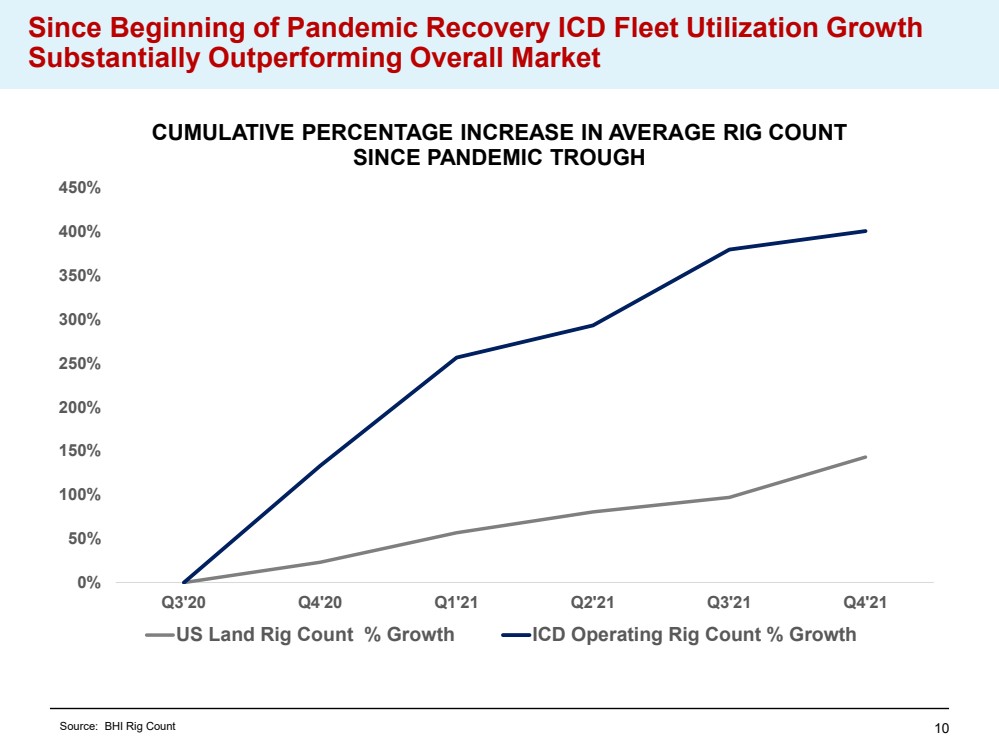
| 10 0% 50% 100% 150% 200% 250% 300% 350% 400% 450% Q3'20 Q4'20 Q1'21 Q2'21 Q3'21 Q4'21 CUMULATIVE PERCENTAGE INCREASE IN AVERAGE RIG COUNT SINCE PANDEMIC TROUGH US Land Rig Count % Growth ICD Operating Rig Count % Growth Since Beginning of Pandemic Recovery ICD Fleet Utilization Growth Substantially Outperforming Overall Market Source: BHI Rig Count |
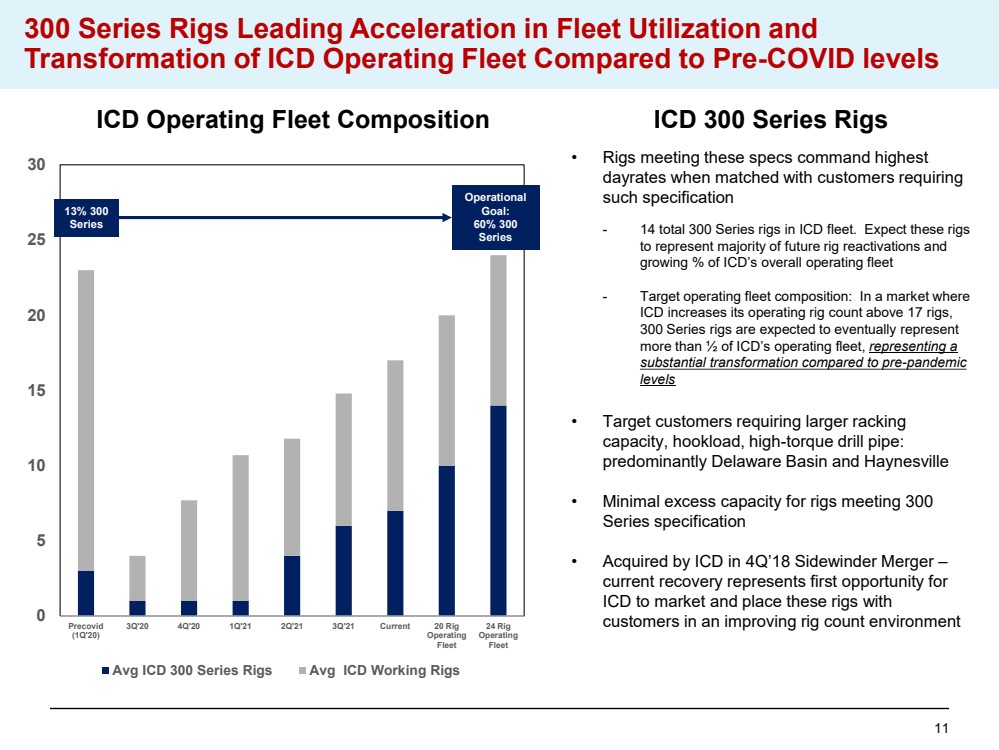
| 11 0 5 10 15 20 25 30 Precovid (1Q'20) 3Q'20 4Q'20 1Q'21 2Q'21 3Q'21 Current 20 Rig Operating Fleet 24 Rig Operating Fleet Avg ICD 300 Series Rigs Avg ICD Working Rigs Operational Goal: 60% 300 Series 300 Series Rigs Leading Acceleration in Fleet Utilization and Transformation of ICD Operating Fleet Compared to Pre - COVID levels ICD Operating Fleet Composition ICD 300 Series Rigs • Rigs meeting these specs command highest dayrates when matched with customers requiring such specification - 14 total 300 Series rigs in ICD fleet. Expect these rigs to represent majority of future rig reactivations and growing % of ICD ’ s overall operating fleet - Target operating fleet composition: In a market where ICD increases its operating rig count above 17 rigs, 300 Series rigs are expected to eventually represent more than ½ of ICD ’ s operating fleet, representing a substantial transformation compared to pre - pandemic levels • Target customers requiring larger racking capacity, hookload, high - torque drill pipe: predominantly Delaware Basin and Haynesville • Minimal excess capacity for rigs meeting 300 Series specification • Acquired by ICD in 4 Q ’ 18 Sidewinder Merger – current recovery represents first opportunity for ICD to market and place these rigs with customers in an improving rig count environment 13% 300 Series |
| 12 ICD Performance Meeting and Exceeding Customer Expectations ICD has been the #1 ranked U.S. Land Driller for Service and Professionalism for the past four years by Energy Point Research’s independent customer survey Independence Contract Drilling was one of only three land drillers recognized in 2021 by Energy Point Research in the Overall Total Satisfaction category of its customer survey. |
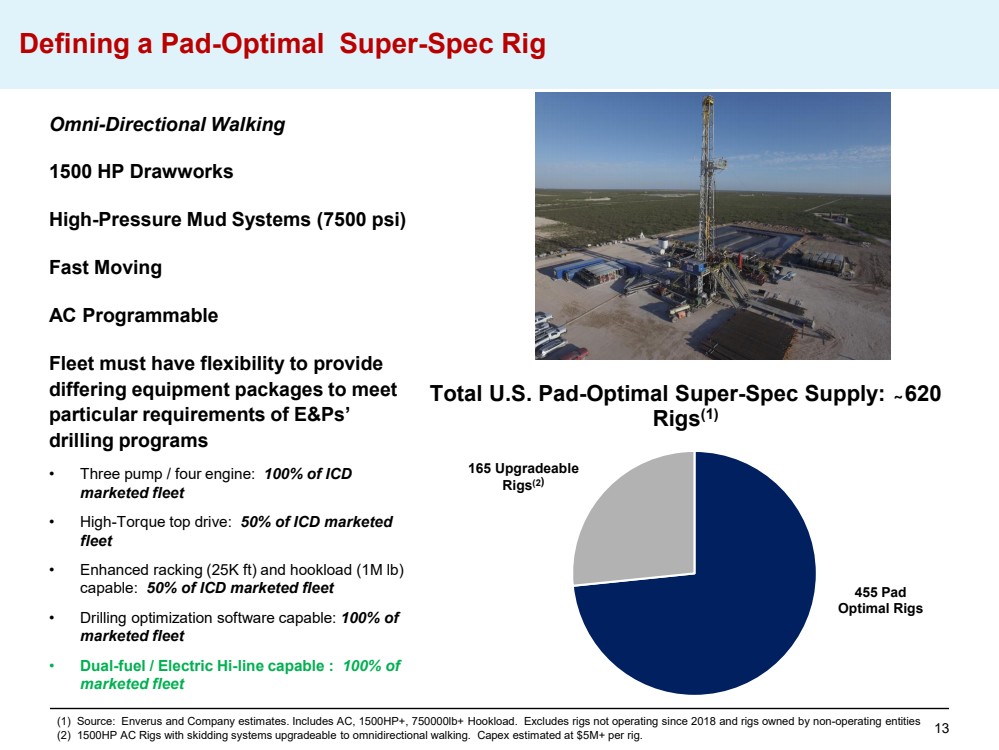
| 13 Defining a Pad - Optimal Super - Spec Rig Omni - Directional Walking 1500 HP Drawworks High - Pressure Mud Systems (7500 psi) Fast Moving AC Programmable Fleet must have flexibility to provide differing equipment packages to meet particular requirements of E&Ps’ drilling programs • Three pump / four engine: 100% of ICD marketed fleet • High - Torque top drive: 50% of ICD marketed fleet • Enhanced racking (25K ft) and hookload (1M lb) capable: 50% of ICD marketed fleet • Drilling optimization software capable: 100% of marketed fleet • Dual - fuel / Electric Hi - line capable : 100% of marketed fleet Total U.S. Pad - Optimal Super - Spec Supply: ̴ 620 Rigs ( 1 ) 455 Pad Optimal Rigs 165 Upgradeable Rigs (2 ) ( 1 ) Source: Enverus and Company estimates. Includes AC, 1500 HP+, 750000 lb+ Hookload. Excludes rigs not operating since 2018 and rigs owned by non - operating entities ( 2 ) 1500 HP AC Rigs with skidding systems upgradeable to omnidirectional walking. Capex estimated at $ 5 M+ per rig. |
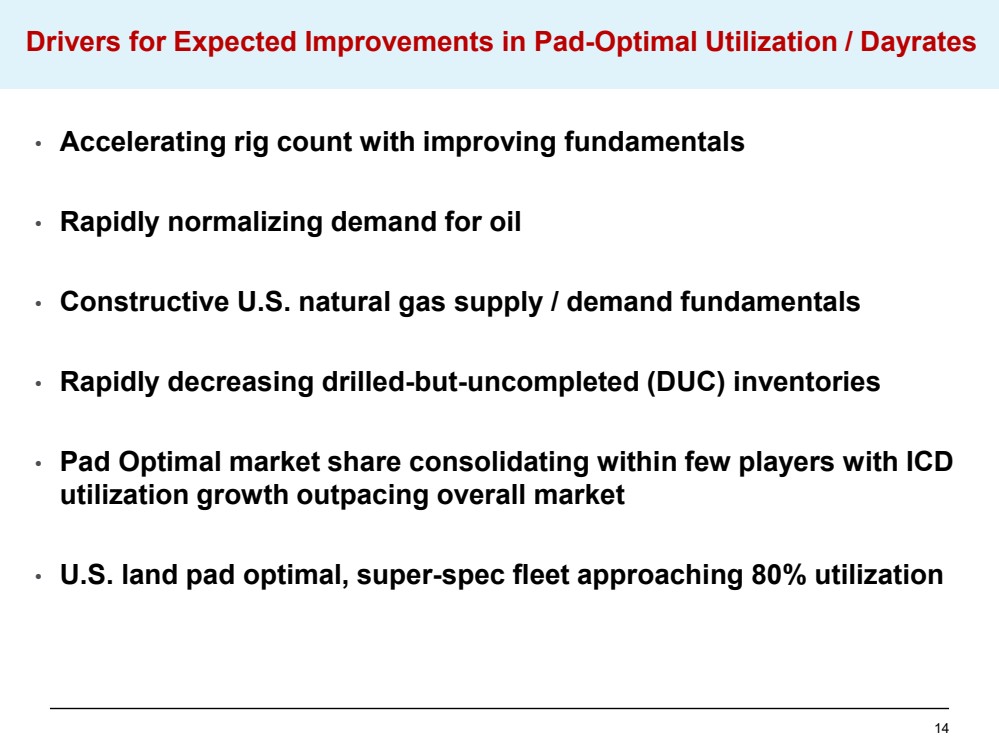
| 14 Drivers for Expected Improvements in Pad - Optimal Utilization / Dayrates • Accelerating rig count with improving fundamentals • Rapidly normalizing demand for oil • Constructive U.S. natural gas supply / demand fundamentals • Rapidly decreasing drilled - but - uncompleted (DUC) inventories • Pad Optimal market share consolidating within few players with ICD utilization growth outpacing overall market • U.S. land pad optimal, super - spec fleet approaching 80% utilization |
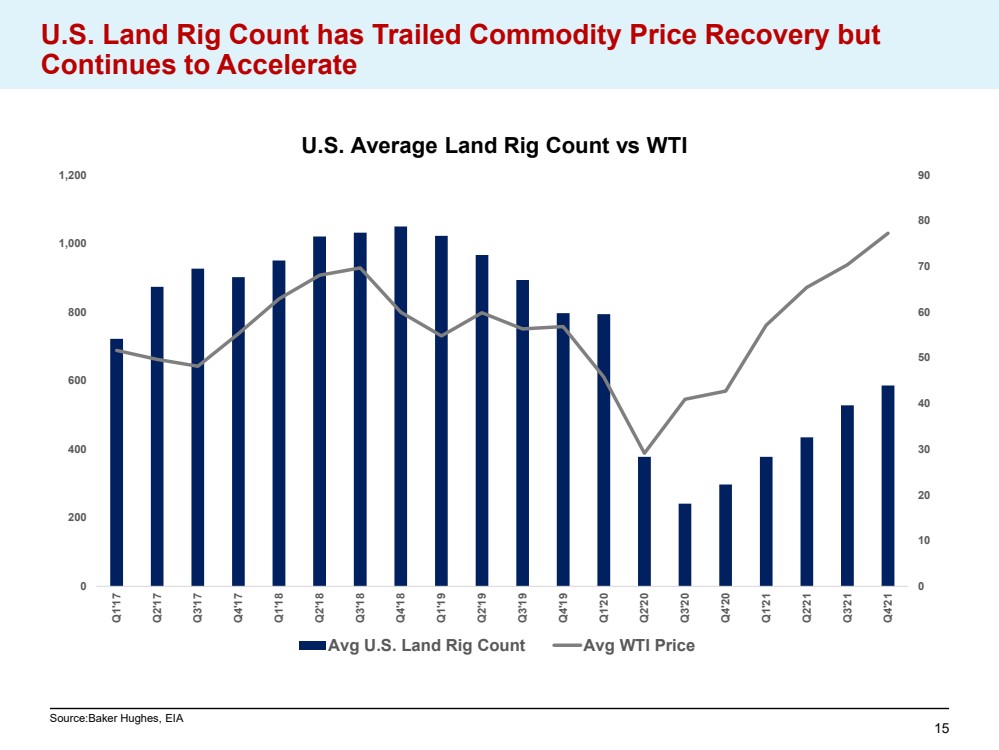
| 15 U.S. Land Rig Count has Trailed Commodity Price Recovery but Continues to Accelerate 0 10 20 30 40 50 60 70 80 90 0 200 400 600 800 1,000 1,200 Q1'17 Q2'17 Q3'17 Q4'17 Q1'18 Q2'18 Q3'18 Q4'18 Q1'19 Q2'19 Q3'19 Q4'19 Q1'20 Q2'20 Q3'20 Q4'20 Q1'21 Q2'21 Q3'21 Q4'21 U.S. Average Land Rig Count vs WTI Avg U.S. Land Rig Count Avg WTI Price Source:Baker Hughes, EIA |
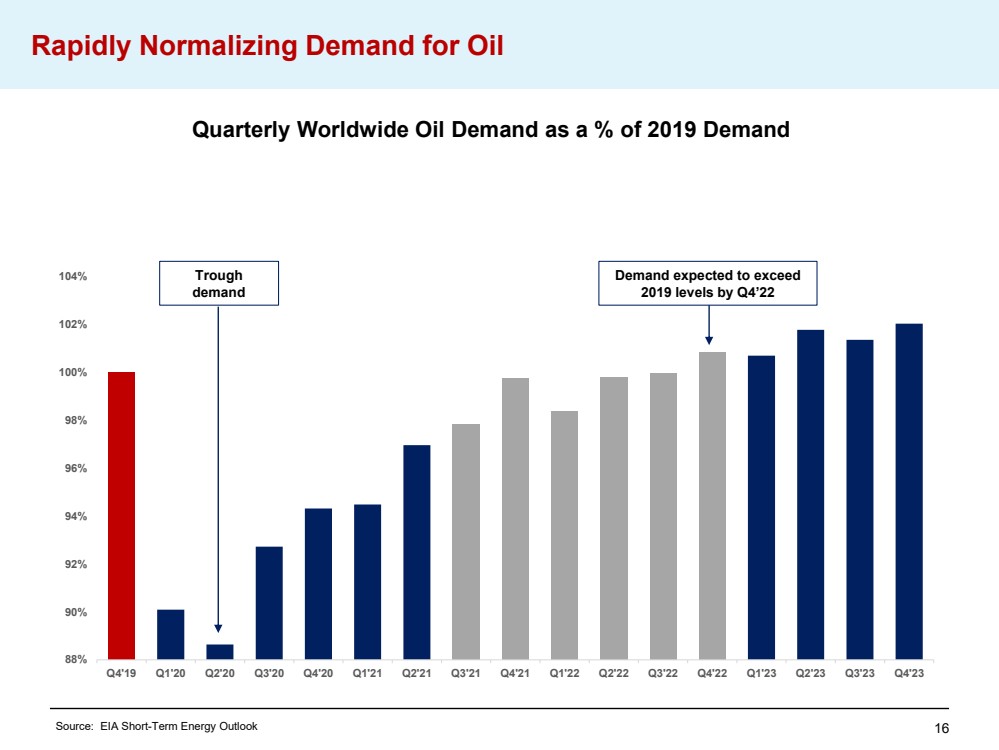
| 16 Rapidly Normalizing Demand for Oil Source: EIA Short - Term Energy Outlook 88% 90% 92% 94% 96% 98% 100% 102% 104% Q4'19 Q1'20 Q2'20 Q3'20 Q4'20 Q1'21 Q2'21 Q3'21 Q4'21 Q1'22 Q2'22 Q3'22 Q4'22 Q1'23 Q2'23 Q3'23 Q4'23 Quarterly Worldwide Oil Demand as a % of 2019 Demand Trough demand Demand expected to exceed 2019 levels by Q4’22 |
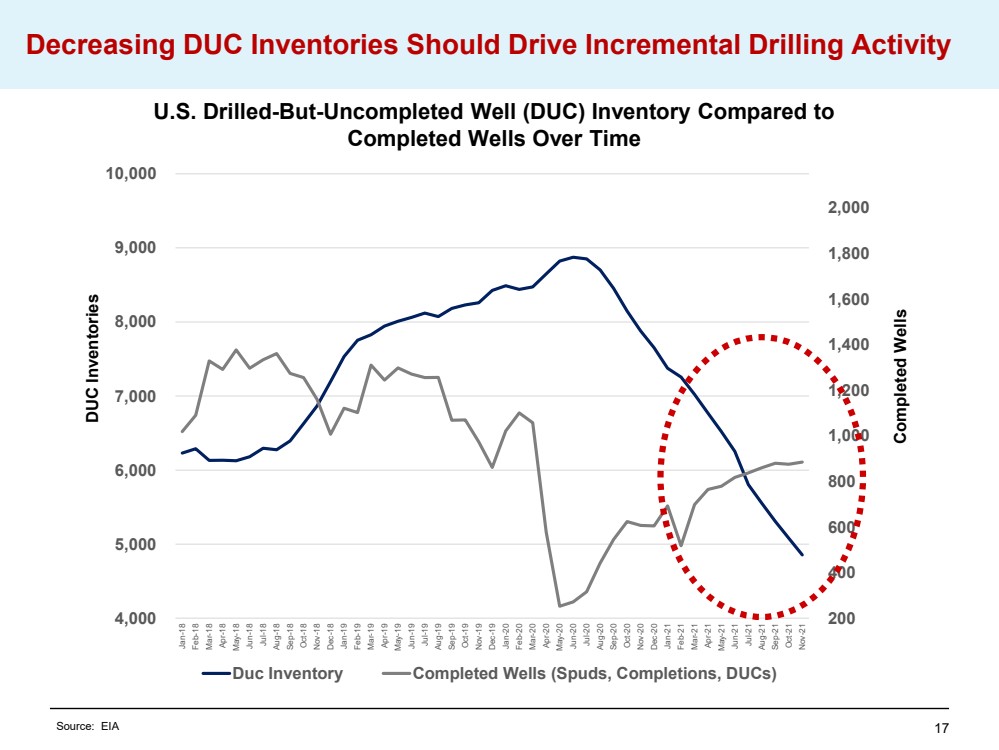
| 17 Decreasing DUC Inventories Should Drive Incremental Drilling Activity 200 400 600 800 1,000 1,200 1,400 1,600 1,800 2,000 4,000 5,000 6,000 7,000 8,000 9,000 10,000 Jan-18 Feb-18 Mar-18 Apr-18 May-18 Jun-18 Jul-18 Aug-18 Sep-18 Oct-18 Nov-18 Dec-18 Jan-19 Feb-19 Mar-19 Apr-19 May-19 Jun-19 Jul-19 Aug-19 Sep-19 Oct-19 Nov-19 Dec-19 Jan-20 Feb-20 Mar-20 Apr-20 May-20 Jun-20 Jul-20 Aug-20 Sep-20 Oct-20 Nov-20 Dec-20 Jan-21 Feb-21 Mar-21 Apr-21 May-21 Jun-21 Jul-21 Aug-21 Sep-21 Oct-21 Nov-21 Duc Inventory Completed Wells (Spuds, Completions, DUCs) U.S. Drilled - But - Uncompleted Well (DUC) Inventory Compared to Completed Wells Over Time DUC Inventories Completed Wells Source: EIA |
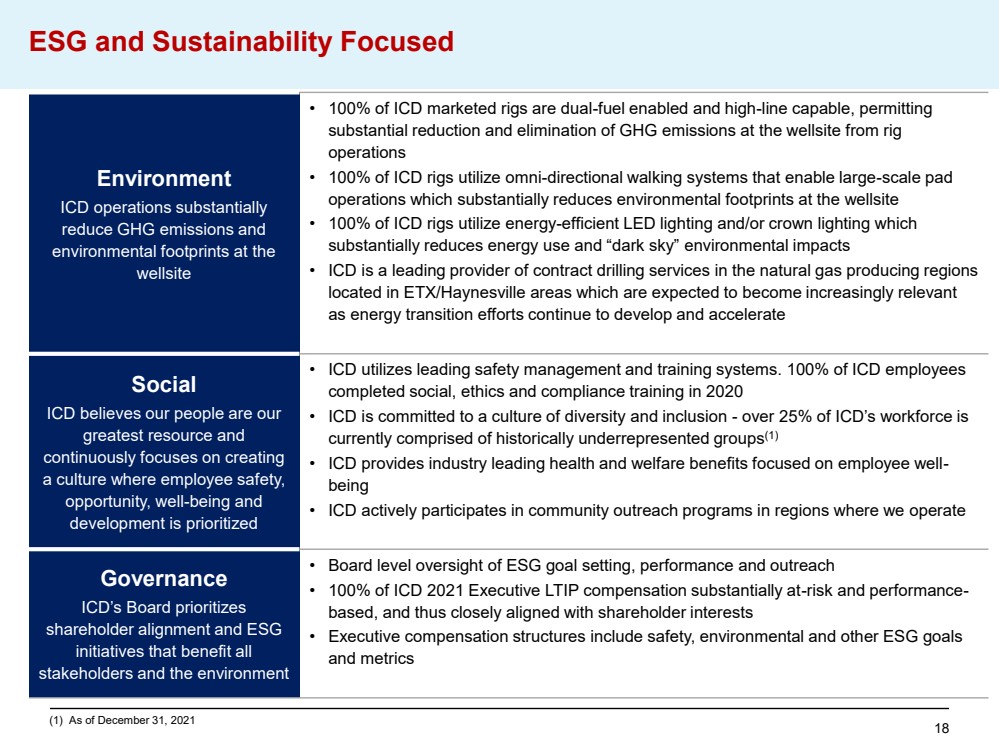
| 18 ESG and Sustainability Focused Environment ICD operations substantially reduce GHG emissions and environmental footprints at the wellsite • 100% of ICD marketed rigs are dual - fuel enabled and high - line capable, permitting substantial reduction and elimination of GHG emissions at the wellsite from rig operations • 100% of ICD rigs utilize omni - directional walking systems that enable large - scale pad operations which substantially reduces environmental footprints at the wellsite • 100% of ICD rigs utilize energy - efficient LED lighting and/or crown lighting which substantially reduces energy use and “dark sky” environmental impacts • ICD is a leading provider of contract drilling services in the natural gas producing regions located in ETX/Haynesville areas which are expected to become increasingly relevant as energy transition efforts continue to develop and accelerate Social ICD believes our people are our greatest resource and continuously focuses on creating a culture where employee safety, opportunity, well - being and development is prioritized • ICD utilizes leading safety management and training systems. 100% of ICD employees completed social, ethics and compliance training in 2020 • ICD is committed to a culture of diversity and inclusion - over 25% of ICD’s workforce is currently comprised of historically underrepresented groups (1) • ICD provides industry leading health and welfare benefits focused on employee well - being • ICD actively participates in community outreach programs in regions where we operate Governance ICD’s Board prioritizes shareholder alignment and ESG initiatives that benefit all stakeholders and the environment • Board level oversight of ESG goal setting, performance and outreach • 100% of ICD 2021 Executive LTIP compensation substantially at - risk and performance - based, and thus closely aligned with shareholder interests • Executive compensation structures include safety, environmental and other ESG goals and metrics (1) As of December 31, 2021 |
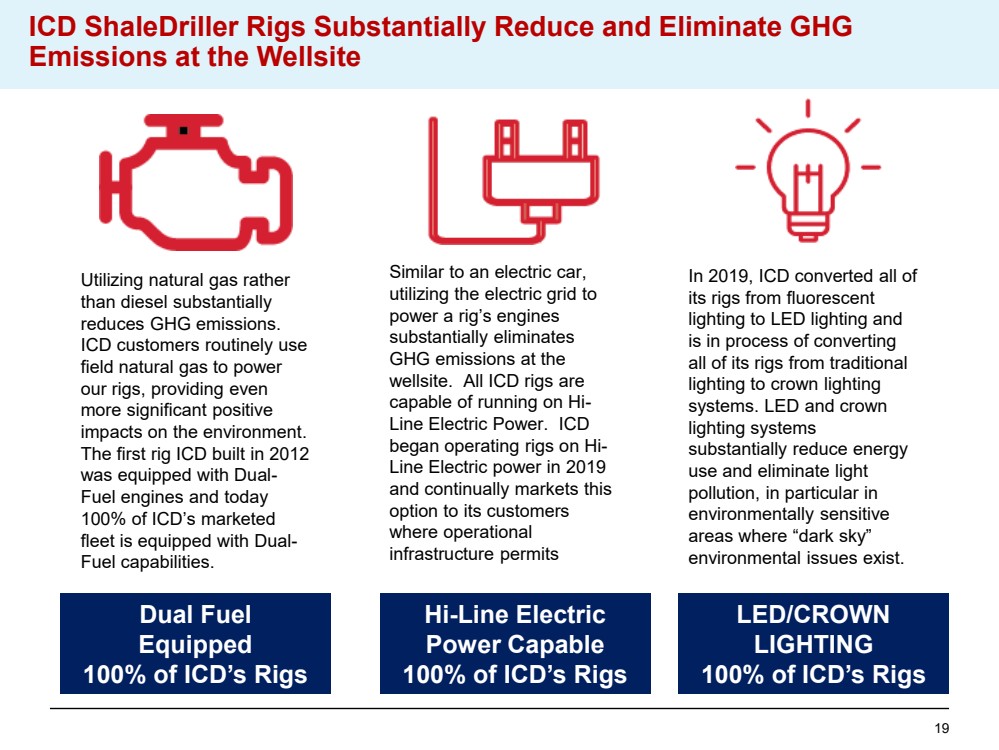
| 19 ICD ShaleDriller Rigs Substantially Reduce and Eliminate GHG Emissions at the Wellsite Utilizing natural gas rather than diesel substantially reduces GHG emissions. ICD customers routinely use field natural gas to power our rigs, providing even more significant positive impacts on the environment. The first rig ICD built in 2012 was equipped with Dual - Fuel engines and today 100 % of ICD ’ s marketed fleet is equipped with Dual - Fuel capabilities. Dual Fuel Equipped 100% of ICD’s Rigs Similar to an electric car, utilizing the electric grid to power a rig ’ s engines substantially eliminates GHG emissions at the wellsite. All ICD rigs are capable of running on Hi - Line Electric Power. ICD began operating rigs on Hi - Line Electric power in 2019 and continually markets this option to its customers where operational infrastructure permits Hi - Line Electric Power Capable 100% of ICD’s Rigs LED/CROWN LIGHTING 100% of ICD’s Rigs In 2019, ICD converted all of its rigs from fluorescent lighting to LED lighting and is in process of converting all of its rigs from traditional lighting to crown lighting systems. LED and crown lighting systems substantially reduce energy use and eliminate light pollution, in particular in environmentally sensitive areas where “dark sky” environmental issues exist. |
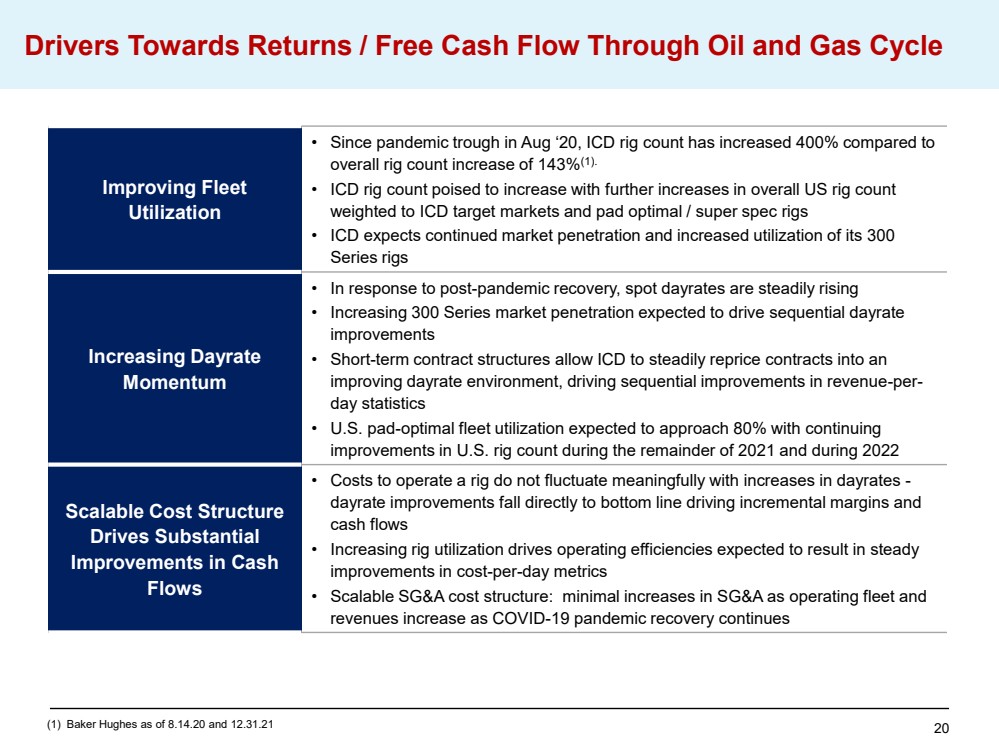
| 20 Drivers Towards Returns / Free Cash Flow Through Oil and Gas Cycle Improving Fleet Utilization • Since pandemic trough in Aug ‘20, ICD rig count has increased 400% compared to overall rig count increase of 143% (1). • ICD rig count poised to increase with further increases in overall US rig count weighted to ICD target markets and pad optimal / super spec rigs • ICD expects continued market penetration and increased utilization of its 300 Series rigs Increasing Dayrate Momentum • In response to post - pandemic recovery, spot dayrates are steadily rising • Increasing 300 Series market penetration expected to drive sequential dayrate improvements • Short - term contract structures allow ICD to steadily reprice contracts into an improving dayrate environment, driving sequential improvements in revenue - per - day statistics • U.S. pad - optimal fleet utilization expected to approach 80% with continuing improvements in U.S. rig count during the remainder of 2021 and during 2022 Scalable Cost Structure Drives Substantial Improvements in Cash Flows • Costs to operate a rig do not fluctuate meaningfully with increases in dayrates - dayrate improvements fall directly to bottom line driving incremental margins and cash flows • Increasing rig utilization drives operating efficiencies expected to result in steady improvements in cost - per - day metrics • Scalable SG&A cost structure: minimal increases in SG&A as operating fleet and revenues increase as COVID - 19 pandemic recovery continues ( 1 ) Baker Hughes as of 8.14.20 and 12.31.21 |
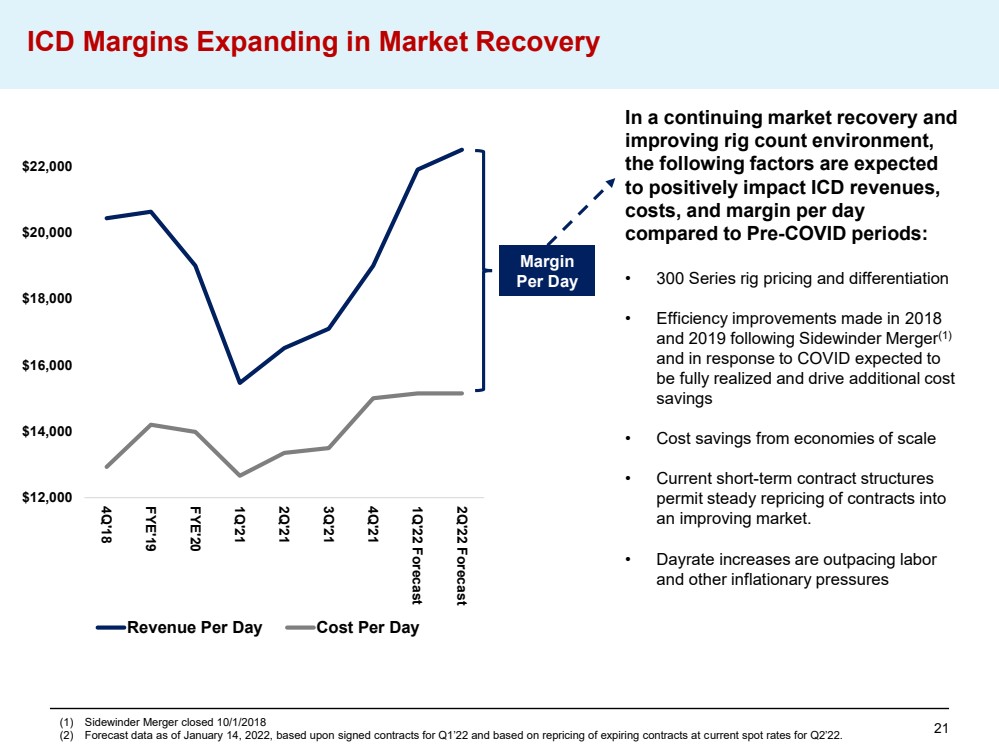
| 21 ICD Margins Expanding in Market Recovery In a continuing market recovery and improving rig count environment, the following factors are expected to positively impact ICD revenues, costs, and margin per day compared to Pre - COVID periods: • 300 Series rig pricing and differentiation • Efficiency improvements made in 2018 and 2019 following Sidewinder Merger ( 1 ) and in response to COVID expected to be fully realized and drive additional cost savings • Cost savings from economies of scale • Current short - term contract structures permit steady repricing of contracts into an improving market. • Dayrate increases are outpacing labor and other inflationary pressures $12,000 $14,000 $16,000 $18,000 $20,000 $22,000 4Q'18 FYE'19 FYE'20 1Q'21 2Q'21 3Q'21 4Q'21 1Q'22 Forecast 2Q'22 Forecast Revenue Per Day Cost Per Day (1) Sidewinder Merger closed 10/1/2018 (2) Forecast data as of January 14, 2022, based upon signed contracts for Q1’22 and based on repricing of expiring contracts at c urr ent spot rates for Q2’22. Margin Per Day |
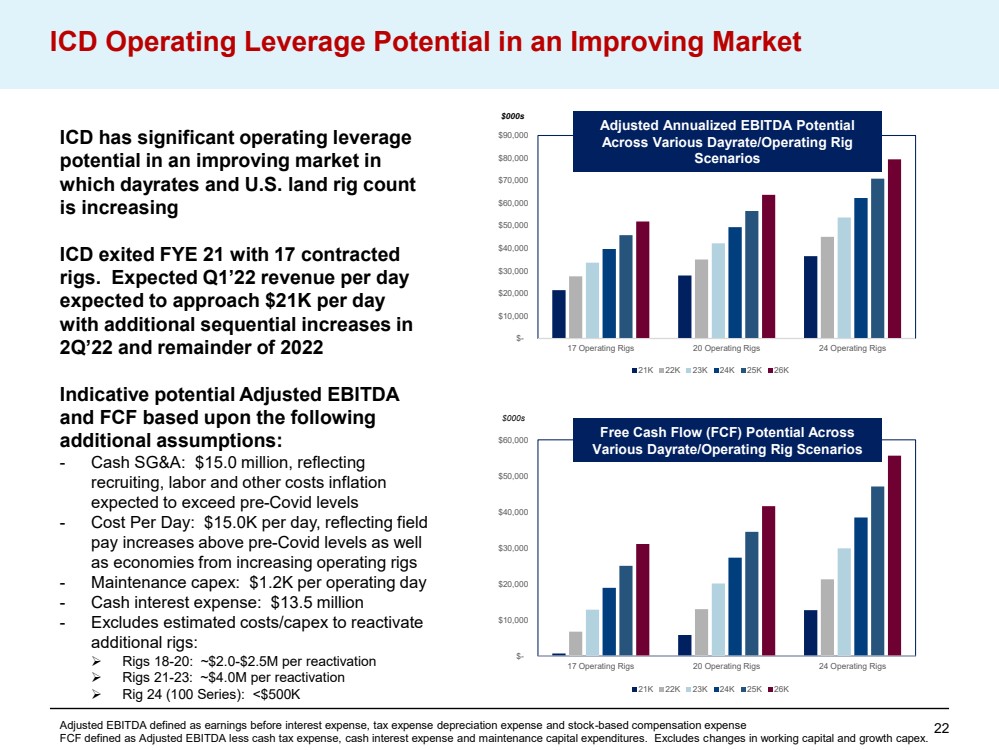
| 22 $- $10,000 $20,000 $30,000 $40,000 $50,000 $60,000 $70,000 $80,000 $90,000 17 Operating Rigs 20 Operating Rigs 24 Operating Rigs 21K 22K 23K 24K 25K 26K ICD Operating Leverage Potential in an Improving Market $- $10,000 $20,000 $30,000 $40,000 $50,000 $60,000 17 Operating Rigs 20 Operating Rigs 24 Operating Rigs 21K 22K 23K 24K 25K 26K Adjusted Annualized EBITDA Potential Across Various Dayrate /Operating Rig Scenarios Free Cash Flow (FCF) Potential Across Various Dayrate /Operating Rig Scenarios ICD has significant operating leverage potential in an improving market in which dayrates and U.S. land rig count is increasing ICD exited FYE 21 with 17 contracted rigs. Expected Q1’22 revenue per day expected to approach $21K per day with additional sequential increases in 2Q’22 and remainder of 2022 Indicative potential Adjusted EBITDA and FCF based upon the following additional assumptions: - Cash SG&A: $15.0 million, reflecting recruiting, labor and other costs inflation expected to exceed pre - Covid levels - Cost Per Day: $15.0K per day, reflecting field pay increases above pre - Covid levels as well as economies from increasing operating rigs - Maintenance capex: $1.2K per operating day - Cash interest expense: $13.5 million - Excludes estimated costs/capex to reactivate additional rigs: ➢ Rigs 18 - 20: ~$2.0 - $2.5M per reactivation ➢ Rigs 21 - 23: ~$4.0M per reactivation ➢ Rig 24 (100 Series): <$500K Adjusted EBITDA defined as earnings before interest expense, tax expense depreciation expense and stock - based compensation expen se FCF defined as Adjusted EBITDA less cash tax expense, cash interest expense and maintenance capital expenditures. Excludes c han ges in working capital and growth capex. $000s $000s |
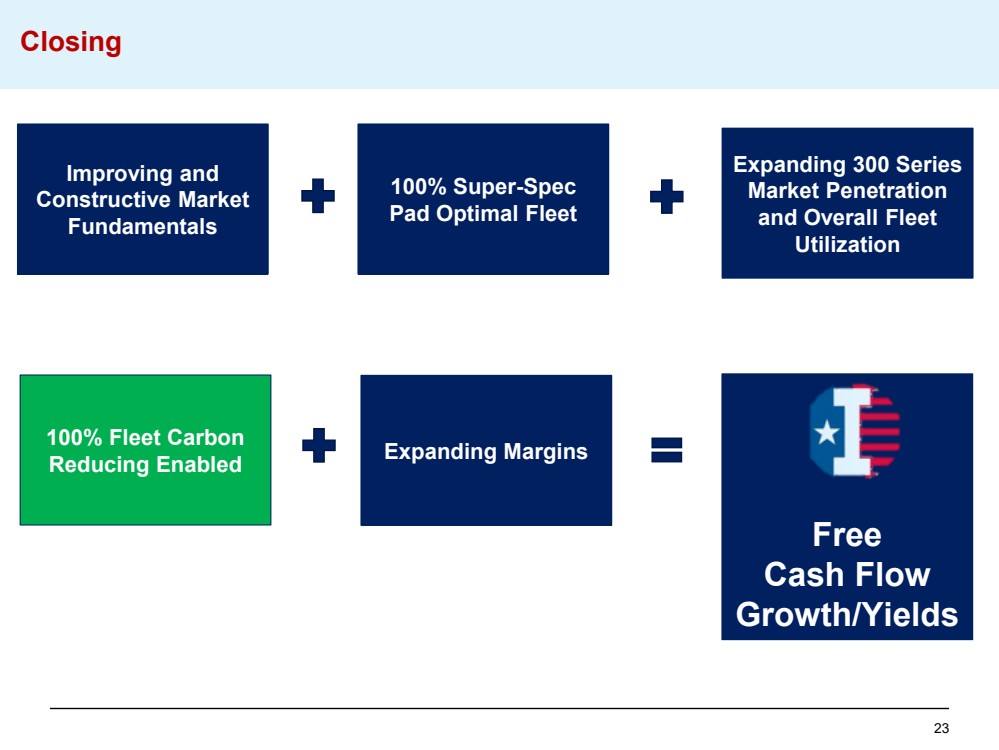
| 23 Closing Improving and Constructive Market Fundamentals 100 % Super - Spec Pad Optimal Fleet Expanding 300 Series Market Penetration and Overall Fleet Utilization Free Cash Flow Growth/Yields 100% Fleet Carbon Reducing Enabled Expanding Margins |
| 24 |

Serious News for Serious Traders! Try StreetInsider.com Premium Free!
You May Also Be Interested In
- Independence Contract Drilling, Inc. Announces Timing of First Quarter 2024 Financial Results and Conference Call
- Paul Mueller Company Announces Its First Quarter Earnings of 2024
- QDEL Class Action Alert: Robbins LLP Reminds Stockholders of the Lead Plaintiff Deadline in the Class Action Lawsuit Against QuidelOrtho Corporation
Create E-mail Alert Related Categories
SEC FilingsSign up for StreetInsider Free!
Receive full access to all new and archived articles, unlimited portfolio tracking, e-mail alerts, custom newswires and RSS feeds - and more!
