

Form 8-K Home Point Capital Inc. For: May 06
 Tweet
Tweet Share
Share|
Delaware
|
001-39964
|
90-1116426
|
|
(State or other jurisdiction of incorporation)
|
(Commission File Number)
|
(IRS Employer Identification No.)
|
| ☐ |
Written communications pursuant to Rule 425 under the Securities Act (17 CFR 230.425)
|
| ☐ |
Soliciting material pursuant to Rule 14a−12 under the Exchange Act (17 CFR 240.14a−12)
|
| ☐ |
Pre−commencement communications pursuant to Rule 14d−2(b) under the Exchange Act (17 CFR 240.14d−2(b))
|
| ☐ |
Pre−commencement communications pursuant to Rule 13e−4(c) under the Exchange Act (17 CFR 240.13e− 4(c))
|
|
Title of each class
|
Trading Symbol
|
Name of each exchange on which registered
|
||
|
Common Stock, par value
$0.0000000072 per share
|
HMPT
|
The Nasdaq Stock Market LLC
(The Nasdaq Global Select Market)
|
| Item 2.02 |
| Item 8.01 |
Other Events.
|
| Item 9.01 |
Financial Statements and Exhibits.
|
|
(d)
|
Exhibits.
|
|
Exhibit No.
|
Description
|
|
|
Earnings release dated May 6, 2021.
|
||
|
Investor presentation materials dated May 6, 2021.
|
||
|
Supplemental Financial Information.
|
|
HOME POINT CAPITAL INC.
|
||
|
Date: May 6, 2021
|
||
|
By:
|
/s/ Mark E. Elbaum
|
|
|
Name:
|
Mark E. Elbaum
|
|
|
Title:
|
Chief Financial Officer
|
|
|
($mm, except per share values)
|
For the quarter ended
|
|||||||||||
|
3/31/2021
|
12/31/2020
|
3/31/2020
|
||||||||||
|
Total Funded Origination Volume
|
$
|
29,426
|
$
|
23,956
|
$
|
8,165
|
||||||
|
Total Fallout Adjusted Lock Volume
|
23,553
|
21,151
|
10,526
|
|||||||||
|
Gain on sale margin (bps)1
|
128
|
200
|
97
|
|||||||||
|
Servicing portfolio - Units
|
409,075
|
359,323
|
255,817
|
|||||||||
|
Servicing portfolio - UPB
|
$
|
109,923
|
$
|
91,483
|
$
|
57,905
|
||||||
|
Total revenue, net
|
$
|
422.0
|
$
|
453.9
|
$
|
67.6
|
||||||
|
Origination segment direct expenses
|
157.8
|
153.6
|
51.8
|
|||||||||
|
Servicing segment direct expenses
|
18.7
|
18.3
|
13.3
|
|||||||||
|
Corporate expenses
|
50.5
|
51.1
|
18.9
|
|||||||||
|
Total expenses
|
227.0
|
223.0
|
84.0
|
|||||||||
|
Net income (loss)
|
149.0
|
184.5
|
(10.6
|
)
|
||||||||
|
Net income (loss) per share2
|
$
|
1.07
|
$
|
1.33
|
$
|
(0.08
|
)
|
|||||
|
(1) Calculated as gain on sale, net, divided by Fallout Adjusted Lock Volume. We previously calculated gain on sale margin as gain on sale, net, divided by Total Funded Origination Volume. We
believe that the calculation of gain on sale margin presented herein aligns more closely with when revenue is recognized under U.S. GAAP and we intend to use such presentation on a go-forward basis. For reference, we have also made available
supplemental financial information, which includes the calculation of gain on sale margin as presented herein for each of the historical quarterly periods beginning with the quarter ended December 31, 2019, which is available free of charge on
the Securities and Exchange Commission’s website at www.sec.gov and on our website at investors.homepoint.com.
|
|
(2) On January 21, 2021, Home Point Capital effected a stock split of its outstanding common stock pursuant to which the 100 outstanding shares were split into 1,388,601.11 shares each, for a
total of 138,860,103 shares of outstanding common stock. As a result, all amounts relating to per share amounts have been retroactively adjusted to reflect this stock split.
|
| • |
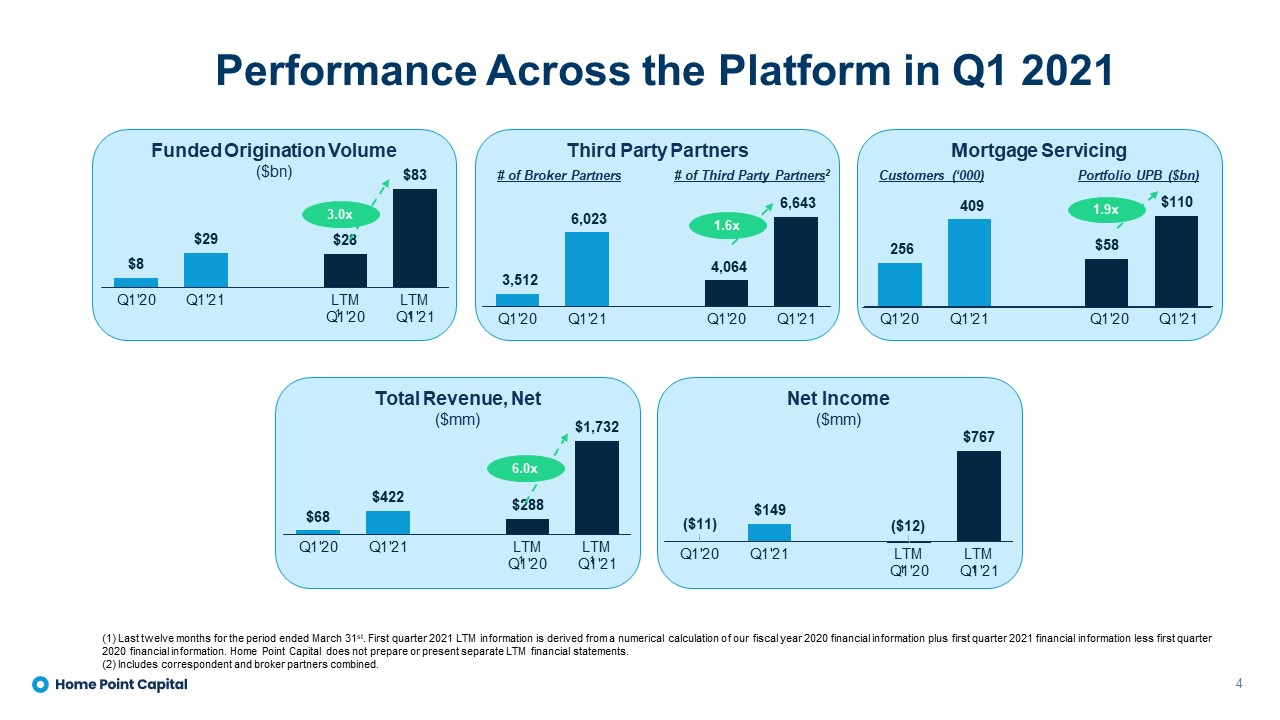
Quarterly funded origination volume of $29 billion, more than tripling volume from the first quarter of 2020, and up 23% versus the fourth quarter of 2020.
|
| • |
Total revenue, net of $422 million, a 525% increase from the prior year quarter, and a 7% decrease from the fourth quarter of 2020. Revenue for the first quarter of 2021 includes a $102 million net mark-to-market gain in the fair value of
the Company’s mortgage servicing rights (MSR) portfolio, as a result of the significant increase in interest rates during the quarter.
|
| • |
Gain on sale margin of 128 basis points, up from 97 basis points in the first quarter of 2020, and down from 200 basis points in the fourth quarter of 2020.
|
| • |
Net income of $149 million (or $1.07 per share), compared to a net loss of $11 million (or a loss of $0.08 per share) year-over-year, and compared to $184 million (or $1.33 per share) in the fourth quarter of 2020. Adjusted net income1,
excluding the $77 million after-tax mark-to-market gain on the MSR portfolio for the first quarter of 2021, was $72 million (or $0.52 per share).
|
| • |
Broker Partners totaled 6,023 as of March 31, 2021, a 72% increase from the end of the first quarter of 2020, and a 12% increase from year-end 2020.
|
| • |
Servicing customers of 409,075 at the end of the first quarter of 2021, a 60% increase from the end of the first quarter of 2020, and a 14% increase from year-end 2020.
|
| • |
Servicing portfolio unpaid principal balance (UPB) of $109.9 billion as of March 31, 2021, up 90% from the end of the first quarter of 2020, and up 14% from year-end 2020.
|
| ($mm) | For the quarter ended | |||||||||||
|
3/31/2021
|
12/31/2020
|
3/31/2020
|
||||||||||
|
Gain on loans, net
|
$
|
301.2
|
$
|
422.2
|
$
|
102.6
|
||||||
|
Loan fee income
|
44.1
|
35.5
|
12.0
|
|||||||||
|
Loan servicing fees
|
(0.0
|
)
|
(1.5
|
)
|
(0.6
|
)
|
||||||
|
Interest income, net
|
1.3
|
(0.2
|
)
|
0.5
|
||||||||
|
Total Origination segment revenue
|
346.6
|
455.9
|
114.6
|
|||||||||
|
Directly attributable expense
|
(157.8
|
)
|
(153.6
|
)
|
(51.8
|
)
|
||||||
|
Contribution margin
|
$
|
188.8
|
$
|
302.3
|
$
|
62.7
|
||||||
|
Key Performance Indicators1
|
For the quarter ended
|
|||||||||||
|
3/31/2021
|
12/31/2020
|
3/31/2020
|
||||||||||
|
Total Funded Origination Volume
|
$
|
29,426
|
$
|
23,956
|
$
|
8,165
|
||||||
|
Total Fallout Adjusted Lock Volume
|
$
|
23,553
|
$
|
21,151
|
$
|
10,526
|
||||||
|
Total Gain on Sale Margin (bps)2
|
128
|
200
|
97
|
|||||||||
|
Origination Volume by Purpose:
|
||||||||||||
|
Purchase
|
20.4
|
%
|
29.5
|
%
|
39.3
|
%
|
||||||
|
Refinance
|
79.6
|
%
|
70.5
|
%
|
60.7
|
%
|
||||||
|
Third Party Partners:
|
||||||||||||
|
Number of Broker Partners
|
6,023
|
5,372
|
3,512
|
|||||||||
|
Number of Correspondent Partners
|
620
|
604
|
552
|
|||||||||
|
(1) See Appendix for additional volume and gain on sale information by channel.
|
|
(2) Calculated as gain on sale, net, divided by Fallout Adjusted Lock Volume. We previously calculated gain on sale margin as gain on sale, net, divided by Total Funded Origination Volume. We
believe that the calculation of gain on sale margin presented herein aligns more closely with when revenue is recognized under U.S. GAAP and we intend to use such presentation on a go-forward basis. For reference, we have also made available
supplemental financial information, which includes the calculation of gain on sale margin as presented herein for each of the historical quarterly periods beginning with the quarter ended December 31, 2019, which is available free of charge on
the Securities and Exchange Commission’s website at www.sec.gov and on our website at investors.homepoint.com.
|
|
($mm)
|
For the quarter ended
|
|||||||||||
|
3/31/2021
|
12/31/2020
|
3/31/2020
|
||||||||||
|
Gain on loans, net
|
$
|
-
|
$
|
(0.0
|
)
|
$
|
-
|
|||||
|
Loan servicing fees
|
70.3
|
55.8
|
43.8
|
|||||||||
|
Interest income, net
|
0.3
|
0.3
|
5.3
|
|||||||||
|
Other income
|
0.1
|
0.1
|
0.1
|
|||||||||
|
Total Servicing segment revenue
|
70.7
|
56.2
|
49.1
|
|||||||||
|
Directly attributable expense
|
(18.7
|
)
|
(18.3
|
)
|
(13.3
|
)
|
||||||
|
Primary Margin
|
52.0
|
37.9
|
35.9
|
|||||||||
|
Change in MSR fair value: amortization
|
(89.2
|
)
|
(71.9
|
)
|
(36.2
|
)
|
||||||
|
Change in MSR fair value: mark-to-market, net of hedge
|
102.0
|
17.2
|
(55.4
|
)
|
||||||||
|
Contribution margin
|
$
|
64.9
|
$
|
(16.8
|
)
|
$
|
(55.7
|
)
|
||||
|
Key Performance Indicators
|
For the quarter ended1 | |
||||||||||
|
3/31/2021
|
12/31/2020
|
3/31/2020
|
||||||||||
|
MSR servicing portfolio - UPB
|
$
|
109,923
|
$
|
91,483
|
$
|
57,905
|
||||||
|
Average MSR servicing portfolio - UPB
|
$
|
100,703
|
$
|
83,305
|
$
|
56,041
|
||||||
|
MSR servicing portfolio - Units
|
409,075
|
359,323
|
255,817
|
|||||||||
|
Weighted average coupon rate
|
3.19
|
%
|
3.41
|
%
|
3.94
|
%
|
||||||
|
60+ days delinquent, incl. forbearance
|
2.7
|
%
|
4.4
|
%
|
1.7
|
%
|
||||||
|
60+ days delinquent, excl. forbearance
|
1.0
|
%
|
1.5
|
%
|
NA
|
|||||||
|
MSR multiple
|
3.8
|
x
|
2.9
|
x
|
2.6
|
x
|
||||||
|
(1) Figures as of period end, except “Average MSR servicing portfolio - UPB” which is average for the period.
|
|
($mm)
|
As of
|
|||||||||||
|
3/31/2021
|
12/31/2020
|
3/31/2020
|
||||||||||
|
Cash and cash equivalents
|
$
|
219.3
|
$
|
165.2
|
$
|
35.8
|
||||||
|
Mortgage servicing rights (at fair value)
|
1,156.4
|
748.5
|
475.9
|
|||||||||
|
Warehouse lines of credit
|
4,847.4
|
3,005.4
|
1,621.2
|
|||||||||
|
Term debt and other borrowings, net
|
888.4
|
454.0
|
429.2
|
|||||||||
|
Total shareholders’ equity
|
782.3
|
927.5
|
463.7
|
|||||||||
|
($mm, except per share values)
|
For the quarter ended
|
|||||||||||
|
3/31/2021
|
12/31/2020
|
3/31/2020
|
||||||||||
|
Gain on loans, net
|
$
|
301.2
|
$
|
422.2
|
$
|
102.6
|
||||||
|
Loan fee income
|
44.1
|
35.5
|
12.0
|
|||||||||
|
Interest income
|
25.5
|
17.8
|
15.8
|
|||||||||
|
Interest expense
|
(32.9
|
)
|
(21.7
|
)
|
(15.9
|
)
|
||||||
|
Interest (expense), net
|
(7.4
|
)
|
(3.9
|
)
|
(0.1
|
)
|
||||||
|
Loan servicing fees
|
70.4
|
54.3
|
43.2
|
|||||||||
|
Change in FV of MSR
|
12.9
|
(54.7
|
)
|
(91.5
|
)
|
|||||||
|
Other income
|
0.8
|
0.6
|
1.4
|
|||||||||
|
Total revenue, net
|
422.0
|
453.9
|
67.6
|
|||||||||
|
Compensation and benefits
|
153.6
|
151.8
|
53.0
|
|||||||||
|
Loan expense
|
22.4
|
16.8
|
6.8
|
|||||||||
|
Loan servicing expense
|
8.1
|
8.0
|
8.0
|
|||||||||
|
Occupancy and equipment
|
8.6
|
7.7
|
5.3
|
|||||||||
|
General and administrative
|
22.2
|
24.1
|
7.2
|
|||||||||
|
Depreciation and amortization
|
2.8
|
1.4
|
1.5
|
|||||||||
|
Other expense
|
9.3
|
13.2
|
2.2
|
|||||||||
|
Total Expenses
|
227.0
|
223.0
|
84.0
|
|||||||||
|
Pre-tax income
|
195.0
|
230.9
|
(16.4
|
)
|
||||||||
|
Pre-tax margin
|
46
|
%
|
51
|
%
|
NM
|
|||||||
|
Income tax expense (benefit)
|
50.1
|
49.2
|
(3.5
|
)
|
||||||||
|
Income from equity method investment
|
4.2
|
2.8
|
2.3
|
|||||||||
|
Net income (loss)
|
$
|
149.0
|
$
|
184.5
|
$
|
(10.6
|
)
|
|||||
|
Net margin
|
35
|
%
|
41
|
%
|
NM
|
|||||||
|
Basic and diluted earnings per share1:
|
||||||||||||
|
Basic net income (loss) per share
|
$
|
1.07
|
$
|
1.33
|
$
|
(0.08
|
)
|
|||||
|
Diluted total net income (loss) per share
|
1.06
|
1.31
|
(0.08
|
)
|
||||||||
|
Basic weighted average common stock outstanding (mm)
|
138.9
|
138.9
|
127.4 | |||||||||
|
Diluted weighted average common stock outstanding (mm)
|
139.7
|
140.3
|
127.4 | |||||||||
|
Adjusted income statement metrics2:
|
||||||||||||
|
Adjusted revenue
|
$
|
324.2
|
$
|
440.7
|
$
|
125.3
|
||||||
|
Adjusted net income
|
72.7
|
170.9
|
33.0
|
|||||||||
|
Adjusted net margin
|
22
|
%
|
39
|
%
|
26
|
%
|
||||||
|
(1) On January 21, 2021, Home Point Capital effected a stock split of its outstanding common stock pursuant to which the 100 outstanding shares were
split into 1,388,601.11 shares each, for a total of 138,860,103 shares of outstanding common stock. As a result, all amounts relating to per share amounts have been retroactively adjusted to reflect this stock split.
|
|
(2) Non-GAAP measures. See non-GAAP reconciliation for a reconciliation of each measure to the nearest GAAP measure.
|
|
($mm)
|
As of
|
|||||||||||
|
3/31/2021
|
12/31/2020
|
3/31/2020
|
||||||||||
|
Assets:
|
||||||||||||
|
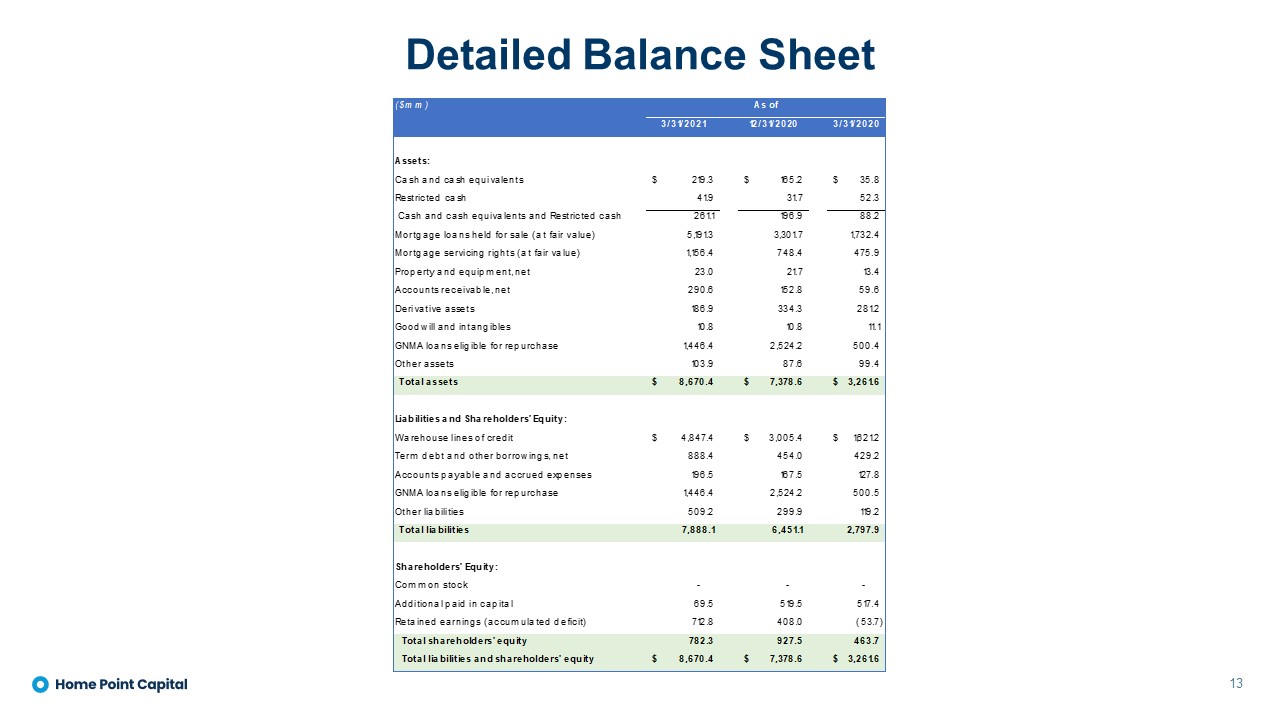
Cash and cash equivalents
|
$
|
219.3
|
$
|
165.2
|
$
|
35.8
|
||||||
|
Restricted cash
|
41.9
|
31.7
|
52.3
|
|||||||||
|
Cash and cash equivalents and Restricted cash
|
261.1
|
196.9
|
88.2
|
|||||||||
|
Mortgage loans held for sale (at fair value)
|
5,191.3
|
3,301.7
|
1,732.4
|
|||||||||
|
Mortgage servicing rights (at fair value)
|
1,156.4
|
748.4
|
475.9
|
|||||||||
|
Property and equipment, net
|
23.0
|
21.7
|
13.4
|
|||||||||
|
Accounts receivable, net
|
290.6
|
152.8
|
59.6
|
|||||||||
|
Derivative assets
|
186.9
|
334.3
|
281.2
|
|||||||||
|
Goodwill and intangibles
|
10.8
|
10.8
|
11.1
|
|||||||||
|
GNMA loans eligible for repurchase
|
1,446.4
|
2,524.2
|
500.4
|
|||||||||
|
Other assets
|
103.9
|
87.6
|
99.4
|
|||||||||
|
Total assets
|
$
|
8,670.4
|
$
|
7,378.6
|
$
|
3,261.6
|
||||||
|
Liabilities and Shareholders’ Equity:
|
||||||||||||
|
Warehouse lines of credit
|
$
|
4,847.4
|
$
|
3,005.4
|
$
|
1,621.2
|
||||||
|
Term debt and other borrowings, net
|
888.4
|
454.0
|
429.2
|
|||||||||
|
Accounts payable and accrued expenses
|
196.5
|
167.5
|
127.8
|
|||||||||
|
GNMA loans eligible for repurchase
|
1,446.4
|
2,524.2
|
500.5
|
|||||||||
|
Other liabilities
|
509.2
|
299.9
|
119.2
|
|||||||||
|
Total liabilities
|
7,888.1
|
6,451.1
|
2,797.9
|
|||||||||
|
Shareholders’ Equity:
|
||||||||||||
|
Common stock
|
-
|
-
|
-
|
|||||||||
|
Additional paid in capital
|
69.5
|
519.5
|
517.4
|
|||||||||
|
Retained earnings (accumulated deficit)
|
712.8
|
408.0
|
(53.7
|
)
|
||||||||
|
Total shareholders’ equity
|
782.3
|
927.5
|
463.7
|
|||||||||
|
Total liabilities and shareholders’ equity
|
$
|
8,670.4
|
$
|
7,378.6
|
$
|
3,261.6
|
||||||
|
($mm)
|
For the quarter ended
|
|||||||||||
|
3/31/2021
|
12/31/2020
|
3/31/2020
|
||||||||||
|
Funded Origination Volume by Channel
|
||||||||||||
|
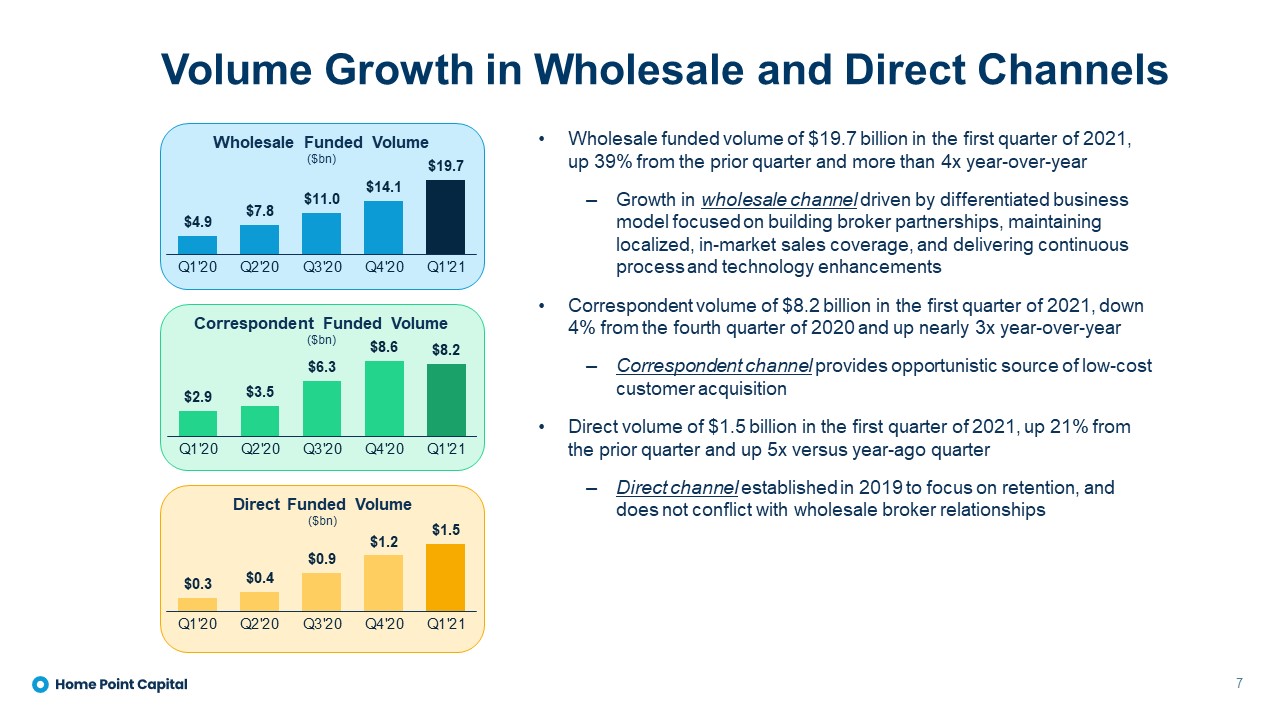
Wholesale
|
$
|
19,668
|
$
|
14,130
|
$
|
4,947
|
||||||
|
Correspondent
|
8,243
|
8,576
|
2,926
|
|||||||||
|
Direct
|
1,515
|
1,249
|
293
|
|||||||||
|
Total Funded Origination Volume
|
$
|
29,426
|
$
|
23,956
|
$
|
8,165
|
||||||
|
Fallout Adjusted Lock Volume by Channel
|
||||||||||||
|
Wholesale
|
$
|
16,140
|
$
|
13,705
|
$
|
6,963
|
||||||
|
Correspondent
|
6,673
|
6,608
|
3,228
|
|||||||||
|
Direct
|
740
|
839
|
335
|
|||||||||
|
Total Fallout Adjusted Lock Volume
|
$
|
23,553
|
$
|
21,151
|
$
|
10,526
|
||||||
|
Gain on Sale Margin by Channel (bps)1
|
||||||||||||
|
Wholesale
|
152
|
234
|
187
|
|||||||||
|
Correspondent
|
33
|
31
|
66
|
|||||||||
|
Direct
|
362
|
399
|
435
|
|||||||||
|
Total Gain on Sale Margin by Channel
|
125
|
177
|
158
|
|||||||||
|
Other2
|
3
|
22
|
(60
|
)
|
||||||||
|
Total Gain on Sale Margin (bps)
|
128
|
200
|
97
|
|||||||||
|
(1) Calculated as gain on sale, net, divided by Fallout Adjusted Lock Volume. We previously calculated gain on sale margin as gain on sale, net, divided by Total Funded Origination Volume. We
believe that the calculation of gain on sale margin presented herein aligns more closely with when revenue is recognized under U.S. GAAP and we intend to use such presentation on a go-forward basis. For reference, we have also made available
supplemental financial information, which includes the calculation of gain on sale margin as presented herein for each of the historical quarterly periods beginning with the quarter ended December 31, 2019, which is available free of charge on
the Securities and Exchange Commission’s website at www.sec.gov and on our website at investors.homepoint.com.
|
|
(2) Includes realized and unrealized gains/(losses) on locks and mortgage loans held for sale, net hedging results, the provision for the representation and warranty reserve, and differences between modeled and
actual pull-through.
|
|
RECONCILIATION OF ADJUSTED REVENUE TO TOTAL REVENUE, NET
|
||||||||||||
|
($mm)
|
For the quarter ended
|
|||||||||||
|
|
3/31/2021
|
12/31/2020
|
3/31/2020
|
|||||||||
|
|
||||||||||||
|
Total revenue, net
|
$
|
422.0
|
$
|
455.0
|
$
|
67.6
|
||||||
|
Income from equity method investment
|
4.2
|
2.8
|
2.3
|
|||||||||
|
Change in fair value of MSR, net of hedge
|
(102.0
|
)
|
(17.2
|
)
|
55.4
|
|||||||
|
Adjusted revenue
|
$
|
324.2
|
$
|
440.7
|
$
|
125.3
|
||||||
|
RECONCILIATION OF ADJUSTED NET INCOME TO TOTAL NET INCOME (LOSS)
|
||||||||||||
|
($mm)
|
For the quarter ended
|
|||||||||||
|
|
3/31/2021
|
12/31/2020
|
3/31/2020
|
|||||||||
|
|
||||||||||||
|
Total net income (loss)
|
$
|
149.0
|
$
|
184.4
|
$
|
(10.5
|
)
|
|||||
|
Change in fair value of MSR, net of hedge
|
(102.0
|
)
|
(17.2
|
)
|
55.4
|
|||||||
|
Income tax effect of change in fair value of MSR, net of hedge
|
25.7
|
3.7
|
(11.8
|
)
|
||||||||
|
Adjusted net income
|
$
|
72.7
|
$
|
170.9
|
$
|
33.0
|
||||||
|
RECONCILIATION OF ADJUSTED NET MARGIN TO NET MARGIN
|
||||||||||||
|
($mm)
|
For the quarter ended
|
|||||||||||
|
|
3/31/2021
|
12/31/2020
|
3/31/2020
|
|||||||||
|
Total revenue, net
|
$
|
422.0
|
$
|
455.1
|
$
|
67.6
|
||||||
|
Total net income (loss)
|
149.0
|
184.5
|
(10.5
|
)
|
||||||||
|
Net margin
|
35
|
%
|
41
|
%
|
NM
|
|||||||
|
Adjusted revenue
|
$
|
324.2
|
$
|
440.7
|
$
|
125.3
|
||||||
|
Adjusted net income
|
72.7
|
170.9
|
33.0
|
|||||||||
|
Adjusted net margin
|
22
|
%
|
39
|
%
|
26
|
%
|
||||||


Home Point Capital Inc.
First Quarter 2021 Earnings
Supplemental Financial Data
May 6, 2021

To provide investors with information in addition to our results as determined under Generally Accepted Accounting Principles (“GAAP”), we disclose Adjusted revenue, Adjusted net Income, and Adjusted net margin as “non-GAAP measures,” which management believes provide useful information to investors. These measures are not financial measures calculated in accordance with GAAP and should not be considered as a substitute for revenue, net income, or any other operating performance measure calculated in accordance with GAAP, and may not be comparable to a similarly titled measure reported by other companies.
We define Adjusted revenue as Total net revenue exclusive of the impact of the change in fair value of MSRs related to changes in valuation inputs and assumptions, net of MSRs hedge and adjusted for Income from equity method investment.
We define Adjusted net income as Net income (loss) exclusive of the impact of the change in fair value of MSRs related to changes in valuation inputs and assumptions, net of MSRs hedge.
We exclude changes in fair value of MSRs, net of hedge from each of Adjusted revenue and Adjusted net income (loss) as they add volatility and are not indicative of the Company’s operating performance or results of operation. This adjustment does not include changes in fair value of MSRs due to realization of cash flows, which remain in each of Adjusted revenue and Adjusted net income (loss). Realization of cash flows occurs when cash is collected as customers make scheduled payments, partial prepayments of principal, or pay their mortgage in full.
We define Adjusted net margin by dividing Adjusted net income by Adjusted revenue.
|
Home Point Capital Inc.
|
|
Condensed Consolidated Statements of Income and Non-GAAP Measurements
|
|
(Unaudited)
|
|
($ amounts in thousands)
|
|
Q1 2021
|
Q4 2020
|
Q3 2020
|
Q2 2020
|
Q1 2020
|
Q4 2019
|
|||||||||||||||||||
|
Revenue:
|
||||||||||||||||||||||||
|
Gain on loans, net
|
$
|
301,228
|
$
|
422,158
|
$
|
503,344
|
$
|
356,871
|
$
|
102,563
|
$
|
64,006
|
||||||||||||
|
Loan fee income
|
44,115
|
35,488
|
28,205
|
20,394
|
12,031
|
12,284
|
||||||||||||||||||
|
Interest income
|
25,577
|
17,811
|
14,709
|
11,812
|
15,849
|
16,700
|
||||||||||||||||||
|
Interest expense
|
(32,935
|
)
|
(21,734
|
)
|
(17,559
|
)
|
(14,373
|
)
|
(15,913
|
)
|
(16,008
|
)
|
||||||||||||
|
Interest Income (expense), net
|
(7,358
|
)
|
(3,922
|
)
|
(2,850
|
)
|
(2,561
|
)
|
(65
|
)
|
692
|
|||||||||||||
|
Loan servicing fees
|
70,338
|
54,328
|
48,350
|
42,308
|
43,246
|
40,139
|
||||||||||||||||||
|
Change in fair value of mortgage servicing rights
|
12,848
|
(54,728
|
)
|
(66,749
|
)
|
(72,248
|
)
|
(91,527
|
)
|
(21,966
|
)
|
|||||||||||||
|
Other income
|
801
|
568
|
498
|
260
|
1,380
|
1,568
|
||||||||||||||||||
|
Total revenue, net
|
421,972
|
453,891
|
510,798
|
345,024
|
67,629
|
96,724
|
||||||||||||||||||
|
Expenses:
|
||||||||||||||||||||||||
|
Compensation and benefits
|
153,642
|
151,784
|
117,177
|
81,334
|
52,950
|
51,626
|
||||||||||||||||||
|
Loan expense
|
22,418
|
16,827
|
11,861
|
9,920
|
6,800
|
5,444
|
||||||||||||||||||
|
Loan servicing expense
|
8,093
|
8,044
|
6,481
|
8,308
|
7,953
|
5,143
|
||||||||||||||||||
|
Occupancy and equipment
|
8,555
|
7,732
|
7,391
|
5,543
|
5,320
|
4,201
|
||||||||||||||||||
|
General and administrative
|
22,244
|
24,086
|
12,073
|
9,078
|
7,222
|
6,720
|
||||||||||||||||||
|
Depreciation and amortization
|
2,761
|
1,369
|
1,236
|
1,427
|
1,499
|
1,523
|
||||||||||||||||||
|
Other expenses
|
9,336
|
13,177
|
7,093
|
2,755
|
2,238
|
1,529
|
||||||||||||||||||
|
Total expenses
|
227,049
|
223,019
|
163,312
|
118,366
|
83,982
|
76,187
|
||||||||||||||||||
|
Income (Loss) before income tax
|
194,923
|
230,872
|
347,486
|
226,658
|
(16,353
|
)
|
20,537
|
|||||||||||||||||
|
Income tax expense (benefit)
|
50,117
|
49,248
|
93,294
|
59,501
|
(3,489
|
)
|
4,580
|
|||||||||||||||||
|
Income from equity method investments
|
4,163
|
2,844
|
9,870
|
1,864
|
2,316
|
110
|
||||||||||||||||||
|
Net income (loss)
|
$
|
148,969
|
$
|
184,468
|
$
|
264,062
|
$
|
169,022
|
$
|
(10,548
|
)
|
$
|
16,067
|
|
Home Point Capital Inc.
|
|
Origination Segment
|
|
(Unaudited)
|
|
($ amounts in thousands)
|
|
Q1 2021
|
Q4 2020
|
Q3 2020
|
Q2 2020
|
Q1 2020
|
Q4 2019
|
|||||||||||||||||||
|
Revenue:
|
||||||||||||||||||||||||
|
Gain on loans, net
|
$
|
301,228
|
$
|
422,198
|
$
|
503,344
|
$
|
356,871
|
$
|
102,563
|
$
|
64,794
|
||||||||||||
|
Loan fee income
|
44,115
|
35,488
|
28,205
|
20,394
|
12,031
|
12,284
|
||||||||||||||||||
|
Loan servicing fees
|
(8
|
)
|
(1,517
|
)
|
236
|
(1,656
|
)
|
(562
|
)
|
(387
|
)
|
|||||||||||||
|
Interest Income (expense), net
|
1,288
|
(228
|
)
|
318
|
960
|
526
|
461
|
|||||||||||||||||
|
Total Origination segment revenue
|
346,623
|
455,941
|
532,103
|
376,569
|
114,558
|
77,152
|
||||||||||||||||||
|
Directly attributable expense
|
157,817
|
153,635
|
107,356
|
72,130
|
51,830
|
48,073
|
||||||||||||||||||
|
Contribution margin
|
$
|
188,806
|
$
|
302,306
|
$
|
424,747
|
$
|
304,439
|
$
|
62,728
|
$
|
29,079
|
|
Home Point Capital Inc.
|
|
Servicing Segment
|
|
(Unaudited)
|
|
($ amounts in thousands)
|
|
Home Point Capital Inc.
|
|
Condensed Consolidated Balance Sheets
|
|
(Unaudited)
|
|
($ amounts in thousands)
|
|
Q1 2021
|
Q4 2020
|
Q3 2020
|
Q2 2020
|
Q1 2020
|
Q4 2019
|
|||||||||||||||||||
|
Assets:
|
||||||||||||||||||||||||
|
Cash and cash equivalents
|
$
|
219,285
|
$
|
165,230
|
$
|
271,587
|
$
|
127,395
|
$
|
35,844
|
$
|
30,630
|
||||||||||||
|
Restricted cash
|
41,863
|
31,663
|
41,907
|
48,937
|
52,308
|
51,101
|
||||||||||||||||||
|
Cash and cash equivalents and Restricted cash
|
261,148
|
196,893
|
313,494
|
176,332
|
88,152
|
81,731
|
||||||||||||||||||
|
Mortgage loans held for sale (at fair value)
|
5,191,261
|
3,301,694
|
2,281,835
|
1,904,174
|
1,732,384
|
1,554,230
|
||||||||||||||||||
|
Mortgage servicing rights (at fair value)
|
1,156,357
|
748,457
|
583,263
|
499,782
|
475,870
|
575,035
|
||||||||||||||||||
|
Property and equipment, net
|
23,027
|
21,710
|
18,595
|
15,623
|
13,422
|
12,051
|
||||||||||||||||||
|
Accounts receivable, net
|
290,555
|
152,845
|
79,320
|
45,185
|
59,631
|
57,872
|
||||||||||||||||||
|
Derivative assets
|
186,909
|
334,323
|
284,359
|
244,058
|
281,237
|
40,544
|
||||||||||||||||||
|
Goodwill and intangibles
|
10,789
|
10,789
|
10,789
|
10,789
|
11,106
|
11,935
|
||||||||||||||||||
|
GNMA loans eligible for repurchase
|
1,446,495
|
2,524,240
|
2,919,881
|
2,351,249
|
500,460
|
499,207
|
||||||||||||||||||
|
Other assets
|
103,850
|
87,622
|
83,897
|
77,110
|
99,377
|
76,162
|
||||||||||||||||||
|
Total assets
|
$
|
8,670,391
|
$
|
7,378,573
|
$
|
6,575,434
|
$
|
5,324,301
|
$
|
3,261,639
|
$
|
2,908,767
|
||||||||||||
|
Liabilities and Shareholders’ Equity:
|
||||||||||||||||||||||||
|
Liabilities:
|
||||||||||||||||||||||||
|
Warehouse lines of credit
|
$
|
4,847,431
|
$
|
3,005,415
|
$
|
2,092,477
|
$
|
1,767,511
|
$
|
1,621,236
|
$
|
1,478,183
|
||||||||||||
|
Term debt and other borrowings, net
|
888,437
|
454,022
|
374,090
|
348,901
|
429,226
|
424,958
|
||||||||||||||||||
|
Accounts payable and accrued expenses
|
196,542
|
167,532
|
313,887
|
132,839
|
127,823
|
39,739
|
||||||||||||||||||
|
GNMA loans eligible for repurchase
|
1,446,495
|
2,524,240
|
2,919,881
|
2,351,249
|
500,460
|
499,207
|
||||||||||||||||||
|
Other liabilities
|
509,189
|
299,890
|
132,333
|
90,746
|
119,110
|
56,368
|
||||||||||||||||||
|
Total liabilities
|
7,888,094
|
6,451,099
|
5,832,668
|
4,691,246
|
2,797,856
|
2,498,455
|
||||||||||||||||||
|
Shareholders’ Equity:
|
||||||||||||||||||||||||
|
Common stock
|
-
|
-
|
-
|
-
|
-
|
-
|
||||||||||||||||||
|
Additional paid-in capital
|
69,451
|
519,510
|
363,354
|
517,702
|
517,449
|
454,861
|
||||||||||||||||||
|
Retained earnings (accumulated deficit)
|
712,846
|
407,964
|
379,411
|
115,353
|
(53,665
|
)
|
(44,549
|
)
|
||||||||||||||||
|
Total shareholders’ equity
|
782,297
|
927,474
|
742,765
|
633,055
|
463,784
|
410,312
|
||||||||||||||||||
|
Total liabilities and shareholders’ equity
|
$
|
8,670,391
|
$
|
7,378,573
|
$
|
6,575,434
|
$
|
5,324,301
|
$
|
3,261,639
|
$
|
2,908,767
|
|
Home Point Capital Inc.
|
|
Key Performance Indicators (KPIs)
|
|
Q1 2021
|
Q4 2020
|
Q3 2020
|
Q2 2020
|
Q1 2020
|
Q4 2019
|
||||||||||||||||||||||||
|
Origination Volume by Channel ($ thousands)
|
|||||||||||||||||||||||||||||
|
Wholesale
|
$
|
19,668,264
|
$
|
14,130,341
|
$
|
10,982,207
|
$
|
7,844,172
|
$
|
4,946,545
|
$
|
4,541,560
|
|||||||||||||||||
|
Correspondent
|
8,243,380
|
8,575,794
|
6,280,149
|
3,490,965
|
2,925,706
|
3,538,842
|
|||||||||||||||||||||||
|
Direct
|
1,514,287
|
1,249,459
|
851,980
|
431,714
|
292,812
|
196,020
|
|||||||||||||||||||||||
|
Total Originations
|
$
|
29,425,931
|
$
|
23,955,593
|
$
|
18,114,336
|
$
|
11,766,851
|
$
|
8,165,063
|
$
|
8,276,422
|
|||||||||||||||||
|
Fallout Adjusted Lock Volume by Channel ($ thousands)
|
|||||||||||||||||||||||||||||
|
Wholesale
|
$
|
16,139,923
|
$
|
13,704,506
|
$
|
11,242,589
|
$
|
8,170,570
|
$
|
6,962,668
|
$
|
3,634,264
|
|||||||||||||||||
|
Correspondent
|
6,673,059
|
6,607,574
|
6,547,672
|
4,694,408
|
3,227,697
|
3,324,317
|
|||||||||||||||||||||||
|
Direct
|
739,796
|
838,727
|
799,514
|
591,015
|
335,386
|
136,219
|
|||||||||||||||||||||||
|
Total Fallout Adjusted Lock Volume
|
$
|
23,552,778
|
$
|
21,150,807
|
$
|
18,589,775
|
$
|
13,455,993
|
$
|
10,525,750
|
$
|
7,094,799
|
|||||||||||||||||
|
Gain on Sale Margin ($ thousands)
|
|||||||||||||||||||||||||||||
|
Wholesale
|
$
|
245,050
|
$
|
321,105
|
$
|
359,512
|
$
|
252,534
|
$
|
130,171
|
$
|
42,402
|
|||||||||||||||||
|
Correspondent
|
22,162
|
20,207
|
40,431
|
50,163
|
21,412
|
13,489
|
|||||||||||||||||||||||
|
Direct
|
26,758
|
33,451
|
33,564
|
25,943
|
14,579
|
6,872
|
|||||||||||||||||||||||
|
Total Gain on Sale Margin by Channel
|
293,971
|
374,764
|
433,507
|
328,641
|
166,162
|
62,762
|
|||||||||||||||||||||||
|
Other1
|
7,272
|
47,394
|
69,838
|
28,230
|
(63,598
|
)
|
1,244
|
||||||||||||||||||||||
|
Total Gain on Sale Margin
|
$
|
301,243
|
$
|
422,158
|
$
|
503,344
|
$
|
356,871
|
$
|
102,563
|
$
|
64,006
|
|||||||||||||||||
|
Gain on Sale Margin (bps)2
|
|||||||||||||||||||||||||||||
|
Wholesale
|
152
|
234
|
320
|
309
|
187
|
117
|
|||||||||||||||||||||||
|
Correspondent
|
33
|
31
|
62
|
107
|
66
|
41
|
|||||||||||||||||||||||
|
Direct
|
362
|
399
|
420
|
439
|
435
|
504
|
|||||||||||||||||||||||
|
Total Gain on Sale Margin by Channel
|
125
|
177
|
233
|
244
|
158
|
88
|
|||||||||||||||||||||||
|
Other1
|
3
|
22
|
38
|
21
|
(60
|
)
|
2
|
||||||||||||||||||||||
|
Total Gain on Sale Margin
|
128
|
200
|
271
|
265
|
97
|
90
|
|||||||||||||||||||||||
|
Market Share for the period ended3
|
|||||||||||||||||||||||||||||
|
Overall share of origination market
|
2.3
|
%4
|
1.9
|
%
|
1.6
|
%
|
1.2
|
%
|
1.2
|
%
|
1.1
|
%
|
|||||||||||||||||
|
Share of wholesale channel
|
NA4
|
8.2
|
%
|
7.3
|
%
|
6.2
|
%
|
4.7
|
%
|
4.5
|
%
|
||||||||||||||||||
|
Origination Volume by Purpose
|
|||||||||||||||||||||||||||||
|
Purchase
|
20.4
|
%
|
29.5
|
%
|
29.0
|
%
|
30.7
|
%
|
39.3
|
%
|
44.3
|
%
|
|||||||||||||||||
|
Refinance
|
79.6
|
%
|
70.5
|
%
|
71.0
|
%
|
69.3
|
%
|
60.7
|
%
|
55.7
|
%
|
|||||||||||||||||
|
Third Party Partners
|
|||||||||||||||||||||||||||||
|
Number of Broker Partners
|
6,023
|
5,372
|
4,921
|
4,338
|
3,512
|
3,085
|
|||||||||||||||||||||||
|
Number of Correspondent Sellers
|
620
|
604
|
594
|
580
|
552
|
537
|
|||||||||||||||||||||||
|
Mortgage Servicing
|
|||||||||||||||||||||||||||||
|
MSR Servicing Portfolio - UPB (end of period)
|
$
|
109,922,914
|
$
|
91,482,967
|
$
|
75,127,985
|
$
|
64,160,826
|
$
|
57,904,789
|
$
|
52,600,547
|
|||||||||||||||||
|
Average MSR Servicing Portfolio - UPB
|
$
|
100,702,940
|
$
|
83,305,476
|
$
|
69,644,405
|
$
|
61,032,808
|
$
|
56,041,430
|
$
|
52,479,793
|
|||||||||||||||||
|
MSR Servicing Portfolio - Units
|
409,075
|
359,323
|
310,729
|
276,357
|
255,817
|
236,362
|
|||||||||||||||||||||||
|
Weighted average coupon rate
|
3.19
|
%
|
3.41
|
%
|
3.63
|
%
|
3.82
|
%
|
3.94
|
%
|
4.01
|
%
|
|||||||||||||||||
|
60+ days delinquent, incl. forbearance
|
2.7
|
%
|
4.4
|
%
|
6.6
|
%
|
7.8
|
%
|
1.7
|
%
|
1.7
|
%
|
|||||||||||||||||
|
60+ days delinquent, excl. forbearance
|
1.0
|
%
|
1.5
|
%
|
2.6
|
%
|
1.4
|
%
|
NA
|
NA
|
|||||||||||||||||||
|
MSR Multiple
|
3.84
|
x
|
2.85
|
x
|
2.57
|
x
|
2.51
|
x
|
2.61
|
x
|
3.43
|
||||||||||||||||||
|
Home Point Capital Inc.
|
|
GAAP to Non-GAAP Reconciliations
|
|
(Unaudited)
|
|
($ amounts in thousands)
|
|
Q1 2021
|
Q4 2020
|
Q3 2020
|
Q2 2020
|
Q1 2020
|
Q4 2019
|
|||||||||||||||||||
|
Reconciliation of Adjusted Revenue to Total Revenue, Net
|
||||||||||||||||||||||||
|
Total revenue, net
|
$
|
421,972
|
$
|
455,007
|
$
|
510,798
|
$
|
345,024
|
$
|
67,629
|
$
|
96,722
|
||||||||||||
|
Income from equity method investment
|
4,163
|
2,844
|
9,870
|
1,864
|
2,316
|
110
|
||||||||||||||||||
|
Change in FV of MSR, net of hedge
|
(102,020
|
)
|
(17,173
|
)
|
11,817
|
31,111
|
55,375
|
(10,445
|
)
|
|||||||||||||||
|
Adjusted revenue
|
$
|
324,115
|
$
|
440,678
|
$
|
532,485
|
$
|
377,999
|
$
|
125,319
|
$
|
86,387
|
||||||||||||
|
Reconciliation of Adjusted Net Income (Loss) to Total Net Income (Loss)
|
||||||||||||||||||||||||
|
Total net income (loss)
|
$
|
148,969
|
$
|
184,397
|
$
|
264,062
|
$
|
169,022
|
$
|
(10,548
|
)
|
$
|
16,067
|
|||||||||||
|
Change in FV of MSR, net of hedge
|
(102,020
|
)
|
(17,173
|
)
|
11,817
|
31,111
|
55,375
|
(10,445
|
)
|
|||||||||||||||
|
Income tax effect of change in FV of MSR
|
25,709
|
3,664
|
(3,173
|
)
|
(8,167
|
)
|
(11,814
|
)
|
2,329
|
|||||||||||||||
|
Adjusted net income
|
$
|
72,658
|
$
|
170,889
|
$
|
272,706
|
$
|
191,965
|
$
|
33,012
|
$
|
7,952
|
||||||||||||
|
Reconciliation of Adjuted Net Margin to Net Margin
|
||||||||||||||||||||||||
|
Total revenue, net
|
$
|
421,972
|
$
|
455,007
|
$
|
510,798
|
$
|
345,024
|
$
|
67,629
|
$
|
96,722
|
||||||||||||
|
Total net income (loss)
|
148,969
|
184,397
|
264,062
|
169,022
|
(10,548
|
)
|
16,067
|
|||||||||||||||||
|
Net margin
|
35
|
%
|
41
|
%
|
52
|
%
|
49
|
%
|
NM
|
17
|
%
|
|||||||||||||
|
Adjusted revenue
|
$
|
324,115
|
$
|
440,678
|
$
|
532,485
|
$
|
377,999
|
$
|
125,319
|
$
|
86,387
|
||||||||||||
|
Adjusted net income
|
72,658
|
170,889
|
272,706
|
191,965
|
33,012
|
7,952
|
||||||||||||||||||
|
Adjusted net margin
|
22
|
%
|
39
|
%
|
51
|
%
|
51
|
%
|
26
|
%
|
9
|
%
|
||||||||||||
Serious News for Serious Traders! Try StreetInsider.com Premium Free!
You May Also Be Interested In
- CIDARA Therapeutics ALERT: Bragar Eagel & Squire, P.C. is Investigating Cidara Therapeutics, Inc. on Behalf of Cidara Therapeutics Stockholders and Encourages Investors to Contact the Firm
- ROSEN, NATIONAL TRIAL LAWYERS, Encourages Northern Genesis Acquisition Corp. n/k/a The Lion Electric Company Investors to Secure Counsel Before Important Deadline in Securities Class Action – NGA
- Perk Labs Announces Closing of Non-Brokered Private Placements
Create E-mail Alert Related Categories
SEC FilingsSign up for StreetInsider Free!
Receive full access to all new and archived articles, unlimited portfolio tracking, e-mail alerts, custom newswires and RSS feeds - and more!
