

Form 8-K Compass, Inc. For: May 12
 Tweet
Tweet Share
Share
UNITED STATES
SECURITIES AND EXCHANGE COMMISSION
WASHINGTON, D.C. 20549
FORM 8-K
CURRENT REPORT
Pursuant to Section 13 or 15(d)
of the Securities Exchange Act of 1934
Date of Report (Date of earliest event reported): May 12, 2021
Compass, Inc.
(Exact name of Registrant as Specified in Its Charter)
| Delaware | 001-40291 | 30-0751604 | ||
| (State or Other Jurisdiction of Incorporation) |
(Commission File Number) |
(IRS Employer Identification No.) | ||
| 90 Fifth Avenue, 3rd Floor New York, New York |
10011 | |||
| (Address of Principal Executive Offices) | (Zip Code) | |||
Registrant’s Telephone Number, Including Area Code: (212) 913-9058
Not Applicable
(Former Name or Former Address, if Changed Since Last Report)
Check the appropriate box below if the Form 8-K filing is intended to simultaneously satisfy the filing obligation of the registrant under any of the following provisions (see General Instructions A.2. below):
| ☐ | Written communications pursuant to Rule 425 under the Securities Act (17 CFR 230.425) |
| ☐ | Soliciting material pursuant to Rule 14a-12 under the Exchange Act (17 CFR 240.14a-12) |
| ☐ | Pre-commencement communications pursuant to Rule 14d-2(b) under the Exchange Act (17 CFR 240.14d-2(b)) |
| ☐ | Pre-commencement communications pursuant to Rule 13e-4(c) under the Exchange Act (17 CFR 240.13e-4(c)) |
Securities registered pursuant to Section 12(b) of the Act:
| Title of Each Class |
Trading Symbol |
Name of Each Exchange on Which Registered | ||
| Class A Common Stock, $0.00001 par value per share | COMP | The New York Stock Exchange |
Indicate by check mark whether the registrant is an emerging growth company as defined in Rule 405 of the Securities Act of 1933 (§ 230.405 of this chapter) or Rule 12b-2 of the Securities Exchange Act of 1934 (§ 240.12b-2 of this chapter).
Emerging growth company ☐
If an emerging growth company, indicate by check mark if the registrant has elected not to use the extended transition period for complying with any new or revised financial accounting standards provided pursuant to Section 13(a) of the Exchange Act. ☐
| Item 2.02. | Results of Operations and Financial Condition. |
On May 12, 2021, Compass, Inc. (“Compass”) issued a press release (the “Press Release”) and will hold a conference call announcing its financial results for the quarter ended March 31, 2021. Compass also issued a letter to its stockholders announcing its financial results for the quarter ended March 31, 2021 (the “Shareholder Letter”). Copies of the Press Release and Shareholder Letter are furnished as Exhibits 99.1 and 99.2, respectively, to this Current Report on Form 8-K.
The information furnished with this Item 2.02, including Exhibits 99.1 and 99.2, shall not be deemed “filed” for purposes of Section 18 of the Securities Exchange Act of 1934, as amended (the “Exchange Act”), or otherwise subject to the liabilities of that section, nor shall it be deemed incorporated by reference into any other filing under the Securities Act of 1933, as amended, or the Exchange Act, except as expressly set forth by specific reference in such a filing.
Compass is making reference to non-GAAP financial information in the Press Release, the Shareholder Letter and the conference call. A reconciliation of GAAP to non-GAAP results is provided in the Press Release and the Shareholder Letter, each as attached to this Current Report on Form 8-K.
The Company uses its Investor Relations website (https://investors.compass.com/overview/default.aspx), its Twitter feed (@Compass), Facebook page, LinkedIn page, Instagram account and YouTube channel, as well as Robert Reffkin’s Twitter feed (@RobReffkin) and Instagram account (@robreffkin), as a means of disclosing material non-public information and for complying with its disclosure obligations under Regulation FD.
| Item 9.01 | Financial Statements and Exhibits. |
(d) Exhibits.
| Exhibit Number |
Exhibit Title or Description | |
| 99.1 | Press Release, dated May 12, 2021, regarding the Registrant’s results for the quarter ended March 31, 2021 | |
| 99.2 | Letter to Shareholders, dated May 12, 2021 | |
SIGNATURES
Pursuant to the requirements of the Securities Exchange Act of 1934, as amended, the Registrant has duly caused this report to be signed on its behalf by the undersigned thereunto duly authorized.
| COMPASS, INC. | ||||||
| Date: May 12, 2021 | By: | /s/ Kristen Ankerbrandt | ||||
| Kristen Ankerbrandt | ||||||
| Chief Financial Officer | ||||||
Exhibit 99.1

Compass Reports 80% Revenue Growth in First Quarter
as a Public Company
Strong Operational and Platform Results Yield Market Share Gains
1Q21 Financial Highlights:
| • | Revenue of $1.1 billion, up 80% year-over-year |
| • | GAAP Net Loss of $212 million includes a one-time non-cash charge of $149 million for stock-based compensation in connection with the Company’s IPO. Excluding this charge, Non-GAAP Net Loss was $64 million,1 an improvement of $69 million year-over-year. |
| • | GAAP Net Loss margin of (19.1%), compared to (21.4%) in 1Q20 |
| • | Adjusted EBITDA of $(31) million, compared to $(102) million in 1Q20 |
| • | Adjusted EBITDA margin was (2.7%) of revenue in 1Q21, compared to (16.5%) in 1Q20, an improvement of 13.8 percentage points |
1Q21 Operational Highlights:
| • | Average Number of Principal Agents of 9,812, up 20% year-over-year |
| • | Total Transactions of 40,268, up 67% year-over-year, faster than the 14% transaction growth for the residential real estate market |
| • | Total Transactions per Average Principal Agent up 39% year-over-year |
| • | Gross Transaction Value (“GTV”) of $43.8 billion, up 75% year-over-year |
| • | Compass national market share was 5.2% in 1Q21, up from 3.8% in 1Q20 |
1Q21 Platform Highlights:
| • | Total sessions on platform increased 120% year-over-year |
| • | Ratio of daily active users to weekly active users (“DAU/WAU”) was 69%, up 7 percentage points from the prior year period |
| • | New product introductions included Business Tracker, an enhanced Likely to Sell tool, and transaction management via the acquisition of Glide in early May |
Guidance for 2Q21 and FY2021:
| • | 2Q21: Revenue of $1.5 - $1.6 billion. Adjusted EBITDA of $(10) - $10 million. |
| • | FY2021: Revenue of $5.35 - $5.55 billion. Adjusted EBITDA of $(245) - $(225) million. |
New York, NY - May 12, 2021 - Compass, Inc. (NYSE: COMP), a leading real estate technology company, today announced financial results for the first quarter ending March 31, 2021. The company delivered strong revenue growth and improving Adjusted EBITDA as agents increasingly utilized Compass’ proprietary platform to better serve their clients and grow their businesses. In addition, the company is providing guidance for the second quarter of 2021 and for the full year 2021.
| 1 | For the three months ended March 31, 2021, Non-GAAP Net Loss of $63.9 million represents Net Loss of $212.4 million adjusted for a one-time acceleration of stock-based compensation expense of $148.5 million in connection with the IPO. |
“I am thrilled by Compass’ outstanding first quarter financial and operational results, our first as a public company. In Q1, we executed against our growth strategy, thoughtfully expanded our business geographically and added new functionality to our end-to-end platform for agents,” said Robert Reffkin, Founder, Chairman and CEO of Compass. “Throughout the quarter our platform has allowed Compass agents to close more transactions and sell homes in fewer days than the industry average. Our platform is driving these outsized results as it helps our agents grow their business. This can be seen in our results as we grew faster than the residential real estate market. While the market grew transactions by 14% in Q1, Compass grew Total Transactions by 67% and transactions per principal agent by 39%.”
Financial Highlights
| • | Revenue increased by 80% year-over-year to $1.1 billion in 1Q21, and showed Compass agents’ ability to gain share in a robust housing market. |
| • | GAAP Net Loss of $212 million includes a one-time non-cash charge of $149 million for stock-based compensation in connection with the Company’s IPO. Excluding this charge, Non-GAAP Net Loss was $64 million, an improvement of $69 million year-over-year. |
| • | GAAP Net Loss margin was (19.1%), compared to (21.4%) in 1Q20 |
| • | Adjusted EBITDA of $(31) million, compared to $(102) million in 1Q20. |
| • | Adjusted EBITDA margin was (2.7%) of revenue in 1Q21, compared to (16.5%) in 1Q20, an improvement of 13.8 percentage points |
| • | Commissions and Other related expense (“C&O”) was $942 million in 1Q21, or 84.6% of revenue, which includes a one-time non-cash charge for stock-based compensation in connection with the Company’s IPO. Non-GAAP C&O, excluding stock-based compensation, was $898 million, or 80.6% of revenue, an improvement of 80 basis points compared to 1Q20.2 |
Operational Highlights
| • | Average Number of Principal Agents in 1Q21 was 9,812, an increase of 602 from 4Q20 and 1,661 from 1Q20. The increase in average principal agents was 20% compared to 1Q20. The principal agent additions came in both new and existing markets. |
| 2 | A reconciliation of GAAP to Non-GAAP financial statement line items can be found within the financial statement tables included within this press release. |
| • | Compass agents closed 40,268 Total Transactions in 1Q21, up 67% year-over-year, faster than the 14% transaction growth for the residential real estate market.3 This was the highest number of transactions for a first quarter in Compass’ history and was the third highest quarterly level of transactions ever. Transactions per Principal Agent increased 39% year-over-year. |
| • | GTV of $43.8 billion increased by 75% year-over-year.4 This was a record for a first quarter, reflecting strong transaction volume, higher average transaction values, and higher productivity per principal agent. |
| • | In 1Q21, Compass entered 3 new markets (Rhode Island, Delaware, and Tampa, FL), bringing total markets served to 47 at the end of the quarter. |
| • | Compass national market share5 was 5.2% in 1Q21, up from 3.8% in 1Q20. |
Platform Highlights
| • | In 1Q21, total sessions on the platform grew by 120% year-over-year as both agents and their clients saw the advantages of discovering, collaborating, and transacting for home purchases and sales in a digital setting. |
| • | Ratio of daily active users to weekly active users (“DAU/WAU”) was 69%, up 7 percentage points from the prior year period. |
| • | 91% of our agent teams used our proprietary technology platform weekly, up 5 percentage points from the prior year period. |
| • | New product introductions included Business Tracker and enhancements to Likely to Sell among others. |
| • | Business Tracker is a “digital whiteboard” where agents can manage every transaction they are currently working on in one place. It provides agents with a single view of their pipeline, from leads to active clients to closed deals. |
| • | Likely to Sell is Compass’ AI-powered recommendation engine, which predicts properties that are likely to sell in the future. It works directly with our agents’ CRM and incorporates data like property details, listing and pricing history, mortgage status, location and demographics to assign a “likely to sell” rating for a property in the next 12 months. Agents are then alerted to reach out to their highest scoring contacts, helping them to win the listing before the competition. |
| • | In May 2021, Compass acquired Glide, a fast-growing software services business, to accelerate our ability to offer critical transaction management tools to Compass and non-Compass agents across the U.S. |
| 3 | We calculate Total Transactions by taking the sum of all transactions closed on the Compass platform in which our agent represented the buyer or seller in the purchase or sale of a home (excluding rental transactions). We include a single transaction twice when one or more Compass agents represent both the buyer and seller in any given transaction. 14% figure based on NAR data as of March 2021. |
| 4 | Gross Transaction Value is the sum of all closing sale prices for homes transacted by agents on the Compass platform (excluding rental transactions). We include the value of a single transaction twice when our agents serve both the home buyer and home seller in the transaction. |
| 5 | We calculate our market share by dividing our Gross Transaction Value, or the total dollar value of transactions closed by agents on our platform, by two times (to account for the sell-side and buy-side of each transaction) the aggregate dollar value of U.S. existing home sales as reported by NAR. |
Guidance
| • | 2Q21 Revenue of $1.5 billion to $1.6 billion. |
| • | 2Q21 Adjusted EBITDA of $(10) million to $10 million. |
| • | FY2021 Revenue of $5.35 billion to $5.55 billion. |
| • | FY2021 Adjusted EBITDA of $(245) million to $(225) million. |
We have not reconciled our guidance for Adjusted EBITDA to GAAP Net Loss because stock-based compensation expense cannot be reasonably calculated or predicted at this time. Accordingly, a reconciliation is not available without unreasonable effort.
Conference Call Information
Management will conduct a conference call to discuss the first quarter results and outlook for 2021 at 4:30 PM ET on May 12, 2021. The conference call will be accessible via the Internet on the Compass Investor Relations website https://investors.compass.com. You can also access the audio webcast via the following link: Compass Inc. 1Q21 Earnings Conference Call.
An audio recording of the conference call will be available for replay shortly after the call’s completion. To access the replay, visit the Events and Presentations section on the Compass Investor Relations website at https://investors.compass.com.
Safe Harbor Statement
This press release includes forward-looking statements, which are statements other than statements of historical facts, and statements in the future tense. These statements include, but are not limited to, statements regarding the future performance of Compass and its market opportunity, including expected financial results for the second quarter and full year of 2021, expectations regarding the impact of the COVID-19 pandemic on our business and industry, and expectations for our future investment in our business. Accordingly, actual results could differ materially or such uncertainties could cause adverse effects on our results. Forward-looking statements are based upon various estimates and assumptions, as well as information known to Compass as of the date of this press release, and are subject to risks and uncertainties, including but not limited to: general economic conditions, the health of the U.S. real estate industry, and risks generally incident to the ownership of residential real estate, including seasonal and cyclical trends; our ability to attract new agents and retain current agents or increase agents’ utilization of our platform; our rapid growth and rate of growth; our net losses and ability to achieve or sustain profitability in the future; our ability to innovate and continuously improve and expand our platform; the impact of the COVID-19 pandemic on our business; our ability to compete successful in the markets in which we operate; the effect of monetary policies of the federal government and its agencies; any decreases in our gross commission income or the percentage of commissions that we collect; our ability to expand our business and offer additional adjacent services; fluctuation of our quarterly results and other operating metrics; our ability to successfully complete acquisitions and integrate target companies; the effect of the claims, lawsuits, government investigations and other proceedings that we are subject to from time to time; our ability to protect our intellectual property rights; and other general market, political, economic, and business conditions. Actual results could differ materially from those predicted or implied, and reported results should not be considered as an indication of future performance. Additionally, these forward-looking statements, particularly our guidance, involve
risks, uncertainties and assumptions, including those related to the impacts of COVID-19 on our clients’ spending decisions. Significant variation from the assumptions underlying our forward-looking statements could cause our actual results to vary, and the impact could be significant.
Additional risks and uncertainties that could affect our financial results are included under the caption “Risk Factors” in our Prospectus filed with the SEC on April 1, 2021 and our other SEC filings, which are available on the Investor Relations page of our website at https://investors.compass.com/ and on the SEC website at www.sec.gov. Additional information will also be set forth in our Quarterly Report on Form 10-Q for the three months ended March 31, 2021 when filed. All forward-looking statements contained herein are based on information available to us as of the date hereof, and we do not assume any obligation to update these statements as a result of new information or future events.
Undue reliance should not be placed on the forward-looking statements in this press release. These statements are based on information available to Compass on the date hereof, and Compass assumes no obligation to update such statements.
Non-GAAP Financial Measures
To supplement our condensed consolidated financial statements, which are prepared in accordance with GAAP, we present Non-GAAP Net Loss, Non-GAAP Commissions and Other related expense (“Non-GAAP C&O”), Adjusted EBITDA and Adjusted EBITDA margin, which are non-GAAP financial measures, in this press release. Our use of non-GAAP financial measures has limitations as an analytical tool, and these measures should not be considered in isolation or as a substitute for analysis of financial results as reported under GAAP. Compass uses Non-GAAP Net Loss, Non-GAAP C&O, Adjusted EBITDA and Adjusted EBITDA Margin in conjunction with GAAP measures as part of our overall assessment of our performance, including the preparation of our annual operating budget and quarterly forecasts, to evaluate the effectiveness of our business strategies and to communicate with our board of directors concerning our financial performance. We believe Non-GAAP Net Loss, Non-GAAP C&O, Adjusted EBITDA and Adjusted EBITDA Margin are also helpful to investors, analysts and other interested parties because they can assist in providing a more consistent and comparable overview of our operations across our historical financial periods. Non-GAAP Net Loss, Non-GAAP C&O, Adjusted EBITDA and Adjusted EBITDA Margin have limitations as analytical tools, therefore you should not consider them in isolation or as substitutes for analysis of our results as reported under GAAP. Because of these limitations, you should consider Non-GAAP Net Loss, Non-GAAP C&O, Adjusted EBITDA and Adjusted EBITDA Margin alongside other financial performance measures, including net loss and our other GAAP results. In evaluating Non-GAAP Net Loss, Non-GAAP C&O, Adjusted EBITDA and Adjusted EBITDA Margin, you should be aware that in the future we may incur expenses that are the same as or similar to some of the adjustments reflected in this press release. Our presentation of Non-GAAP Net Loss, Non-GAAP C&O, Adjusted EBITDA and Adjusted EBITDA Margin should not be construed to imply that our future results will be unaffected by the types of items excluded from the calculation of Non-GAAP Net Loss, Non-GAAP C&O, Adjusted EBITDA and Adjusted EBITDA Margin. Non-GAAP Net Loss, Non-GAAP C&O, Adjusted EBITDA and Adjusted EBITDA Margin are not presented in accordance with GAAP and the use of these terms varies from others in our industry.
Reconciliations of these non-GAAP measures has been provided in the financial statement tables included in this press release and investors are encouraged to review these reconciliations.
About Compass
Founded in 2012, Compass is a leading real estate technology company, providing an end-to-end platform that empowers its residential real estate agents to deliver exceptional service to seller and buyer clients. The platform includes an integrated suite of cloud-based software for customer relationship management, marketing, client service, brokerage services and other critical functionality, all custom-built for the real estate industry. Compass agents utilize the platform to grow their business, save time and manage their business more effectively. For more information on how Compass empowers real estate agents, one of the largest groups of small business owners in the country, please visit www.compass.com.
Investor Contact
Ben Barrett
Media Contact
Chris O’Brien
212 913 9058 | 90 Fifth Avenue, New York, New York 10011 | compass.com
Compass, Inc.
Condensed Consolidated Balance Sheets
(In millions, unaudited)
| March 31, 2021 | December 31, 2020 | |||||||
| Assets |
||||||||
| Current assets |
||||||||
| Cash and cash equivalents |
$ | 329.6 | $ | 440.1 | ||||
| Accounts receivable, net of allowance |
58.3 | 54.8 | ||||||
| Compass Concierge receivables, net of allowance |
48.3 | 49.5 | ||||||
| Other current assets |
66.0 | 54.9 | ||||||
|
|
|
|
|
|||||
| Total current assets |
502.2 | 599.3 | ||||||
| Property and equipment, net |
144.2 | 141.7 | ||||||
| Operating lease right-of-use assets |
436.6 | 426.6 | ||||||
| Intangible assets, net |
79.2 | 45.6 | ||||||
| Goodwill |
154.5 | 119.8 | ||||||
| Other non-current assets |
50.5 | 32.1 | ||||||
|
|
|
|
|
|||||
| Total assets |
$ | 1,367.2 | $ | 1,365.1 | ||||
|
|
|
|
|
|||||
| Liabilities, Convertible Preferred Stock and Stockholders’ Deficit |
|
|||||||
| Current liabilities |
||||||||
| Accounts payable |
$ | 39.9 | $ | 36.6 | ||||
| Commissions payable |
55.3 | 62.0 | ||||||
| Accrued expenses and other current liabilities |
128.2 | 106.8 | ||||||
| Current lease liabilities |
73.3 | 68.1 | ||||||
| Concierge credit facility |
10.2 | 8.4 | ||||||
|
|
|
|
|
|||||
| Total current liabilities |
306.9 | 281.9 | ||||||
| Non-current lease liabilities |
441.8 | 435.9 | ||||||
| Other non-current liabilities |
26.7 | 23.5 | ||||||
|
|
|
|
|
|||||
| Total liabilities |
775.4 | 741.3 | ||||||
| Convertible preferred stock |
1,419.1 | 1,486.7 | ||||||
| Stockholders’ Deficit |
||||||||
| Common stock |
— | — | ||||||
| Additional paid-in capital |
486.0 | 238.0 | ||||||
| Accumulated deficit |
(1,313.3 | ) | (1,100.9 | ) | ||||
|
|
|
|
|
|||||
| Total stockholders’ deficit |
(827.3 | ) | (862.9 | ) | ||||
|
|
|
|
|
|||||
| Total liabilities, convertible preferred stock and stockholders’ deficit |
$ | 1,367.2 | $ | 1,365.1 | ||||
|
|
|
|
|
|||||
Compass, Inc.
Condensed Consolidated Statements of Operations
(In millions, except share and per share data, unaudited)
| Three Months Ended March 31, |
||||||||
| 2021 | 2020 | |||||||
| Revenue |
$ | 1,113.9 | $ | 619.9 | ||||
| Operating expenses: |
||||||||
| Commissions and other related expense (1) |
942.2 | 508.8 | ||||||
| Sales and marketing (1) |
111.3 | 106.5 | ||||||
| Operations and support (1) |
70.0 | 61.1 | ||||||
| Research and development (1) |
96.6 | 38.8 | ||||||
| General and administrative (1) |
92.9 | 26.5 | ||||||
| Depreciation and amortization |
13.5 | 12.4 | ||||||
|
|
|
|
|
|||||
| Total operating expenses |
1,326.5 | 754.1 | ||||||
|
|
|
|
|
|||||
| Loss from operations |
(212.6 | ) | (134.2 | ) | ||||
| Investment income, net |
— | 1.5 | ||||||
| Interest expense |
(0.5 | ) | — | |||||
|
|
|
|
|
|||||
| Loss before income taxes |
(213.1 | ) | (132.7 | ) | ||||
| Benefit from income taxes |
0.7 | — | ||||||
|
|
|
|
|
|||||
| Net loss |
$ | (212.4 | ) | $ | (132.7 | ) | ||
|
|
|
|
|
|||||
| Net loss per share attributable to common shareholders, basic and diluted |
$ | (1.67 | ) | $ | (1.22 | ) | ||
|
|
|
|
|
|||||
| Weighted-average shares used in computing net loss per share attributable to common stockholders, basic and diluted |
126,917,284 | 108,764,426 | ||||||
|
|
|
|
|
|||||
| (1) | Total stock-based compensation expense included in the condensed consolidated statements of operations is as follows (in millions): |
| Three Months Ended March 31, 2021 | Three Months Ended March 31, 2020 |
|||||||||||||||
| IPO Related Expense |
Other Expense | Total | ||||||||||||||
| Commissions and other related expense |
$ | 41.7 | $ | 2.9 | $ | 44.6 | $ | 4.1 | ||||||||
| Sales and marketing |
1.8 | 7.2 | 9.0 | 2.9 | ||||||||||||
| Operations and support |
3.1 | 1.9 | 5.0 | 0.8 | ||||||||||||
| Research and development |
46.9 | 2.6 | 49.5 | 0.5 | ||||||||||||
| General and administrative |
55.0 | 4.4 | 59.4 | 2.8 | ||||||||||||
|
|
|
|
|
|
|
|
|
|||||||||
| Total stock-based compensation expense |
$ | 148.5 | $ | 19.0 | $ | 167.5 | $ | 11.1 | ||||||||
|
|
|
|
|
|
|
|
|
|||||||||
Compass, Inc.
Condensed Consolidated Statements of Cash Flows
(In millions, unaudited)
| Three Months Ended March 31, | ||||||||
| 2021 | 2020 | |||||||
| Operating Activities |
||||||||
| Net loss |
$ | (212.4 | ) | $ | (132.7 | ) | ||
| Adjustments to reconcile net loss to net cash used in operating activities: |
||||||||
| Depreciation and amortization |
13.5 | 12.4 | ||||||
| Stock-based compensation |
167.5 | 11.1 | ||||||
| Change in acquisition related contingent consideration |
(3.2 | ) | 0.7 | |||||
| Bad debt expense |
3.0 | 6.3 | ||||||
| Amortization of debt issuance costs |
0.3 | — | ||||||
| Changes in operating assets and liabilities: |
||||||||
| Accounts receivable |
(2.0 | ) | (8.1 | ) | ||||
| Compass Concierge receivables |
(0.7 | ) | (60.8 | ) | ||||
| Other current assets |
(10.7 | ) | 3.8 | |||||
| Other non-current assets |
(7.4 | ) | (4.2 | ) | ||||
| Operating lease right-of-use assets and operating lease liabilities |
1.1 | 11.8 | ||||||
| Accounts payable |
(3.9 | ) | (5.4 | ) | ||||
| Commissions payable |
(7.9 | ) | 1.5 | |||||
| Accrued expenses and other liabilities |
15.5 | (4.1 | ) | |||||
|
|
|
|
|
|||||
| Net cash used in operating activities |
(47.3 | ) | (167.7 | ) | ||||
|
|
|
|
|
|||||
| Investing Activities |
||||||||
| Proceeds from sales and maturities of marketable securities |
— | 17.3 | ||||||
| Capital expenditures |
(10.0 | ) | (9.3 | ) | ||||
| Payments for acquisitions, net of cash acquired |
(59.2 | ) | (0.3 | ) | ||||
|
|
|
|
|
|||||
| Net cash (used in) provided by investing activities |
(69.2 | ) | 7.7 | |||||
|
|
|
|
|
|||||
| Financing Activities |
||||||||
| Proceeds from issuance of convertible preferred stock, net of issuance costs |
— | 1.0 | ||||||
| Proceeds from exercise and early exercise of stock options |
14.4 | 0.2 | ||||||
| Proceeds from drawdowns on Concierge credit facility |
6.3 | — | ||||||
| Repayments of drawdowns on Concierge credit facility |
(4.5 | ) | — | |||||
| Payments of contingent consideration related to acquisitions |
(6.3 | ) | — | |||||
| Payments of debt issuance costs for the Revolving Credit and Guaranty Agreement |
(1.4 | ) | — | |||||
| Payments of deferred offering costs |
(2.5 | ) | — | |||||
|
|
|
|
|
|||||
| Net cash provided by financing activities |
6.0 | 1.2 | ||||||
|
|
|
|
|
|||||
| Net decrease in cash and cash equivalents |
(110.5 | ) | (158.8 | ) | ||||
| Cash and cash equivalents at beginning of period |
440.1 | 491.7 | ||||||
|
|
|
|
|
|||||
| Cash and cash equivalents at end of period |
$ | 329.6 | $ | 332.9 | ||||
|
|
|
|
|
|||||
Compass, Inc.
Net Loss to Adjusted EBITDA Reconciliation
(In millions, unaudited)
| Three Months Ended March 31, |
||||||||
| 2021 | 2020 | |||||||
| Net loss |
$ | (212.4 | ) | $ | (132.7 | ) | ||
| Adjusted to exclude the following: |
|
|||||||
| Depreciation and amortization |
13.5 | 12.4 | ||||||
| Investment income, net |
— | (1.5 | ) | |||||
| Interest expense |
0.5 | — | ||||||
| Stock-based compensation |
167.5 | 11.1 | ||||||
| Benefit from income taxes |
(0.7 | ) | — | |||||
| Restructuring charges (1) |
— | 6.6 | ||||||
| Acquisition-related expenses (2) |
1.0 | 2.0 | ||||||
|
|
|
|
|
|||||
| Adjusted EBITDA |
$ | (30.6 | ) | $ | (102.1 | ) | ||
|
|
|
|
|
|||||
| (1) | For the three months ended March 31, 2020, restructuring charges included $5.4 million in severance expense and $1.2 million in lease termination costs. The Company did not recognize any restructuring charges during the three months ended March 31, 2021. |
| (2) | For the three months ended March 31, 2021 and 2020, acquisition-related expenses includes a $(3.2) million gain and a $0.7 million loss, respectively, as a result of changes in the fair value of contingent consideration and $4.2 million and $1.3 million, respectively, in expenses related to acquisition consideration treated as compensation expense over the underlying retention periods. |
Compass, Inc.
Reconciliation of GAAP Operating Expenses to Non-GAAP Operating Expenses
(In millions, unaudited)
| Three Months Ended March 31, 2021 | ||||||||||||||||||||
| Commissions and other related expense |
Sales and marketing |
Operations and support |
Research and development |
General and administrative |
||||||||||||||||
| GAAP Basis |
$ | 942.2 | $ | 111.3 | $ | 70.0 | $ | 96.6 | $ | 92.9 | ||||||||||
| Adjusted to exclude the following: |
||||||||||||||||||||
| Stock-based compensation |
(44.6 | ) | (9.0 | ) | (5.0 | ) | (49.5 | ) | (59.4 | ) | ||||||||||
| Acquisition-related expenses |
— | — | (1.0 | ) | — | — | ||||||||||||||
|
|
|
|
|
|
|
|
|
|
|
|||||||||||
| Non-GAAP Basis |
$ | 897.6 | $ | 102.3 | $ | 64.0 | $ | 47.1 | $ | 33.5 | ||||||||||
|
|
|
|
|
|
|
|
|
|
|
|||||||||||
| Three Months Ended March 31, 2020 | ||||||||||||||||||||
| Commissions and other related expense |
Sales and marketing |
Operations and support |
Research and development |
General and administrative |
||||||||||||||||
| GAAP Basis |
$ | 508.8 | $ | 106.5 | $ | 61.1 | $ | 38.8 | $ | 26.5 | ||||||||||
| Adjusted to exclude the following: |
||||||||||||||||||||
| Stock-based compensation |
(4.1 | ) | (2.9 | ) | (0.8 | ) | (0.5 | ) | (2.8 | ) | ||||||||||
| Restructuring charges |
— | (2.7 | ) | (2.8 | ) | (0.7 | ) | (0.4 | ) | |||||||||||
| Acquisition-related expenses |
— | — | (2.0 | ) | — | — | ||||||||||||||
|
|
|
|
|
|
|
|
|
|
|
|||||||||||
| Non-GAAP Basis |
$ | 504.7 | $ | 100.9 | $ | 55.5 | $ | 37.6 | $ | 23.3 | ||||||||||
|
|
|
|
|
|
|
|
|
|
|
|||||||||||
Exhibit 99.2

2 0 2 1 Q 1
SHAREHOLDER LET TER
2 0 2 1 Q 1 S H A R E H O L D E R L E T T E R 2
TABLE OF CONTENTS
1Q21 HIGHLIGHTS 3
LET TER FROM ROBERT 4
INVESTMENT OVERVIEW 5 FINANCIAL UPDATE 7 OPERATIONAL UPDATE 10
PL ATFORM UPDATE 13
BAL ANCE SHEET AND CASH FLOW 16 STATEMENT UPDATE
GUIDANCE 17
FINANCIAL TABLES 18
202 1 Q 1 S H A R E H O L D E R L E T T E R 3
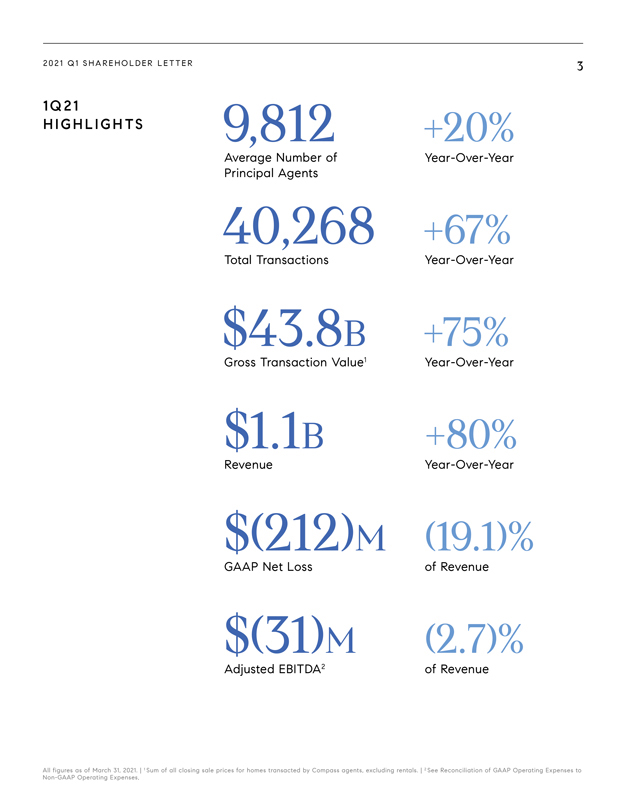
1Q21
HIGHLIGHTS 9,812 +20%
Average Number of Year-Over-Year Principal Agents
40,268 +67%
Total Transactions Year-Over-Year
$43.8b +75%
Gross Transaction Value1 Year-Over-Year
$1.1b +80%
Revenue Year-Over-Year
$(212)m (19.1)%
GAAP Net Loss of Revenue
$(31)m (2.7)%
Adjusted EBITDA2 of Revenue
All figures as of March 31, 2021. | 1 Sum of all closing sale prices for homes transacted by Compass agents, excluding rentals. | 2 See Reconciliation of GAAP Operating
Expenses to Non-GAAP Operating Expenses

2021 Q1 SHAREHOLDER LETTER
LETTER FROM ROBERT
REFFKIN
Dear Shareholders:
I started Compass because of my mom, Ruth.
For the majority of my life, my mom channeled her entrepreneurial energy into a career as a real estate agent. I saw the pride she took in helping her clients
navigate one of the most important transactions of their lives. I also saw that she was turning a lifetime of relationships into a strong book of business, and as an independent contractor, becoming a true business owner.
Over the years, despite her hard work, I saw my mother struggle to grow her business because she didn’t have the right tools or support. The brokerage model was originally
designed to be a one-stop shop for everything an agent needed. But as software transformed every industry, brokerage firms failed to keep up and she had to rely more and more on disjointed, disconnected tools from third parties — a CRM, email
newsletters, digital ads, home valuation tools, transaction management software. Each year, while technology was enabling most professionals to accomplish more, her work as a real estate agent was becoming increasingly complex, time-consuming, and
difficult.
I vowed to create a company that would do better for agents like my mom. Agents deserve better. Agents, of which there are more than 2 million in the
U.S. alone, are small business owners who play a vital role in the real estate transaction, advising their clients on one of the biggest economic decisions most people ever make.
But despite their uniquely strategic position in a $2 trillion industry, agents remain remarkably underserved. There are over 86,000 brokerage firms in the U.S. and the
overwhelming majority have neither the technological expertise nor the capital to build the software and services their agents need to thrive.
The traditional
brokerage firm model provided agents with support and services in the pre-internet era. In a world increasingly powered by technology, Compass is creating the agent support and services platform of the future. A cloud-native, mobile, AI-powered
platform that simplifies the experience for everyone and empowers all agent workflows — prospecting, listing, pricing, marketing, searching, touring, collaborating with buyers and sellers, managing offers and the transaction closing, and more.
Our ambition is to provide agents everything they need to serve their clients, grow their business, and realize their entrepreneurial potential, all in one place.
Simple, seamless, and integrated. We are replacing today’s complex, paper-driven home-buying and selling process with an all-digital, end-to-end platform that empowers real estate agents to deliver an exceptional experience to every buyer and
seller.
To help us achieve these goals, Compass went public on April 1, 2021, listing on the New York Stock Exchange under the ticker symbol “COMP.” I am
so excited to be on this new stage of the journey, and look forward to sharing our results with you today and in the future.
2021 Q1 SHAREHOLDER LETTER
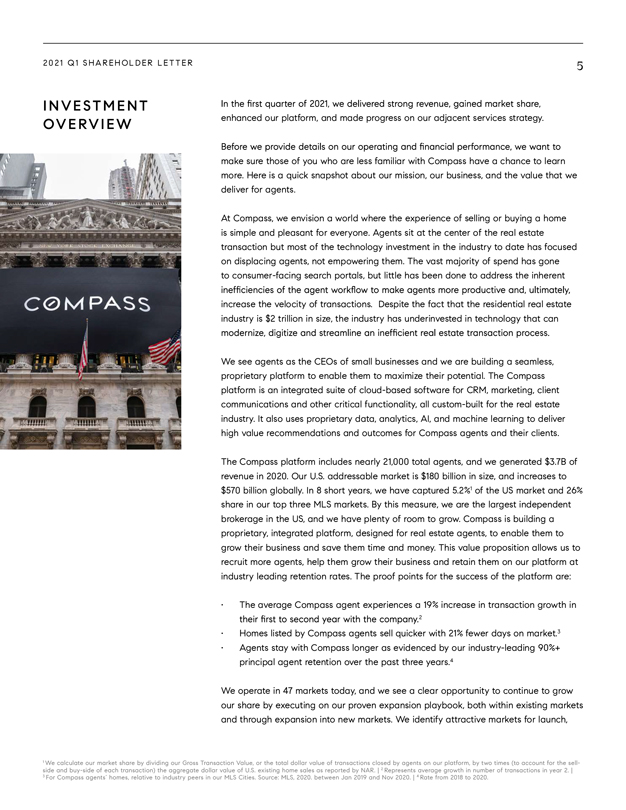
INVESTMENT OVERVIEW
[Graphic Appears Here]
In the first quarter of 2021, we delivered strong
revenue, gained market share,
enhanced our platform, and made progress on our adjacent services strategy.
Before we provide details on our operating and financial performance, we want to make sure those of you who are less familiar with Compass have a chance to learn more. Here is a
quick snapshot about our mission, our business, and the value that we deliver for agents.
At Compass, we envision a world where the experience of selling or buying
a home is simple and pleasant for everyone. Agents sit at the center of the real estate transaction but most of the technology investment in the industry to date has focused on displacing agents, not empowering them. The vast majority of spend has
gone to consumer-facing search portals, but little has been done to address the inherent inefficiencies of the agent workflow to make agents more productive and, ultimately, increase the velocity of transactions. Despite the fact that the
residential real estate industry is $2 trillion in size, the industry has underinvested in technology that can modernize, digitize and streamline an inefficient real estate transaction process.
We see agents as the CEOs of small businesses and we are building a seamless, proprietary platform to enable them to maximize their potential. The Compass platform is an integrated
suite of cloud-based software for CRM, marketing, client communications and other critical functionality, all custom-built for the real estate industry. It also uses proprietary data, analytics, AI, and machine learning to deliver high value
recommendations and outcomes for Compass agents and their clients.
The Compass platform includes nearly 21,000 total agents, and we generated $3.7B of revenue in
2020. Our U.S. addressable market is $180 billion in size, and increases to $570 billion globally. In 8 short years, we have captured 5.2%1 of the US market and 26% share in our top three MLS markets. By this measure, we are the largest independent
brokerage in the US, and we have plenty of room to grow. Compass is building a proprietary, integrated platform, designed for real estate agents, to enable them to grow their business and save them time and money. This value proposition allows us to
recruit more agents, help them grow their business and retain them on our platform at industry leading retention rates. The proof points for the success of the platform are:
• The average Compass agent experiences a 19% increase in transaction growth in their first to second year with the company.2
• Homes listed by Compass agents sell quicker with 21% fewer days on market.3
•
Agents stay with Compass longer as evidenced by our industry-leading 90%+ principal agent retention over the past three years.4
We operate in 47 markets today, and
we see a clear opportunity to continue to grow our share by executing on our proven expansion playbook, both within existing markets and through expansion into new markets. We identify attractive markets for launch,
1 We calculate our market share by dividing our Gross Transaction Value, or the total dollar value of transactions closed by agents on our platform, by two times (to account for
the sell-side and buy-side of each transaction) the aggregate dollar value of U.S. existing home sales as reported by NAR. | 2 Represents average growth in number of transactions in year 2. | 3 For Compass agents’ homes, relative to industry
peers in our MLS Cities. Source: MLS, 2020. between Jan 2019 and Nov 2020. | 4 Rate from 2018 to 2020.
2021 Q1 SHAREHOLDER LETTER
INVESTMENT
OVERVIEW
utilize our enterprise sales team to recruit agents, and then expand our operations
over time. Expansion in existing markets is incredibly cost efficient as we are able to leverage existing infrastructure, personnel and our agent network. We will continue to enter into new markets and expand in existing markets following this
playbook. We also use alternative models like Compass Anywhere to provide a more tailored offering for key customer segments in order to accelerate expansion in a cost efficient manner.
Our extensive network of top performing agents and their transactions create a unique opportunity to expand our business beyond the transaction to capture more spend in the real
estate ecosystem. Today, we offer services in title & escrow and digital marketing, and plan to provide mortgage and other adjacent services in the future. with the addition of KVS Title, which we acquired in the first quarter, Compass’
closing services portfolio now includes operations in California, Florida, Washington state, Maryland, Virginia, and Washington DC. We believe that adjacent services will be a major growth driver as we continue to expand geographically and expand
our portfolio of services. Our adjacent services business allows us to provide a more comprehensive offering to our agents and their clients, while also generating more revenue opportunity for Compass.
We are translating our agent-centric approach into strong and consistent revenue growth with a clear path to profitability. This is reflected in our strong first quarter results,
including:
Revenue increased by 80% year-over-year to $1.1 billion in 1Q21, showing Compass’ ability to gain share in a robust housing market
GAAP Net Loss of $212 million includes a one-time non-cash charge of $149 million for stock-based compensation in connection with the Company’s IPO. Excluding this charge,
Non-GAAP Net Loss was $64 million1, an improvement of $69 million year-over-year.
- GAAP Net Loss margin of (19.1%), compared to (21.4%) in 1Q20
Adjusted EBITDA of $(31) million, compared to $(102) million in 1Q20
- Adjusted EBITDA
represented (2.7%) of revenue in 1Q21, compared to (16.5%) in 1Q20, an improvement of 13.8 percentage points
GAAP Commissions and Other related expense
(“C&O”) was $942 million in 1Q21, or 84.6% of revenue, which includes a one-time non-cash charge for stock-based compensation in connection with the Company’s IPO. Non-GAAP C&O, excluding stock-based compensation, was $898
million, or 80.6% of revenue, an improvement of 80 basis points compared to the prior year.
We will continue to invest in the platform, grow our agent base, expand
into new geographies, and enter new businesses in the real estate ecosystem to drive our long-term success. As we scale our business through expansion of our agent base and the suite of services that we offer, we believe our investments in the
platform will drive our business to profitability. We will continuously augment and improve our platform with new product introductions and with strategic acquisitions like the recently announced Glide Labs, to further spin the flywheel and provide
our agents and Compass with the tools for future success.
1 For the three months ended March 31, 2021, Non-GAAP Net Loss of $63.9 million represents Net Loss of
$212.4 million adjusted for a one-time acceleration of stock-based compensation expense of $148.5 million in connection with the IPO.
2021 Q1 SHAREHOLDER LETTER
1Q21
FINANCIAL
UPDATE
REVENUE
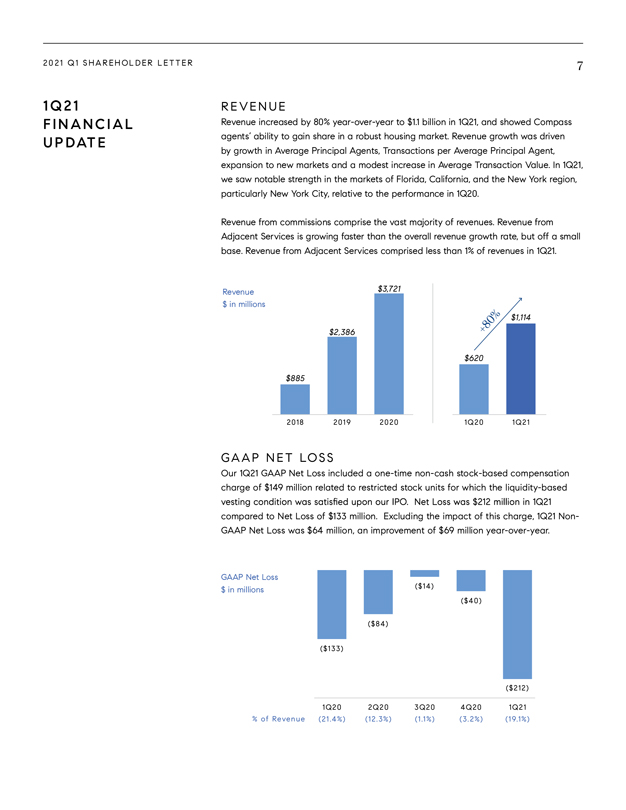
Revenue increased by 80% year-over-year to $1.1 billion in 1Q21, and showed Compass
agents’ ability to gain share in a robust housing market. Revenue growth was driven by growth in Average Principal Agents, Transactions per Average Principal Agent, expansion to new markets and a modest increase in Average Transaction Value. In
1Q21, we saw notable strength in the markets of Florida, California, and the New York region, particularly New York City, relative to the performance in 1Q20.
Revenue from commissions comprise the vast majority of revenues. Revenue from Adjacent Services is growing faster than the overall revenue growth rate, but off a
small base. Revenue from Adjacent Services comprised less than 1% of revenues in 1Q21.
GAAP NET LOSS
Our 1Q21 GAAP Net Loss included a one-time non-cash stock-based compensation charge of $149 million related to restricted stock units for which the liquidity-based vesting
condition was satisfied upon our IPO. Net Loss was $212 million in 1Q21 compared to Net Loss of $133 million. Excluding the impact of this charge, 1Q21 Non-GAAP Net Loss was $64 million, an improvement of $69 million year-over-year.
2021 Q1 SHAREHOLDER LETTER 8
1Q21 FINANCIAL UPDATE
ADJUSTED EBITDA1
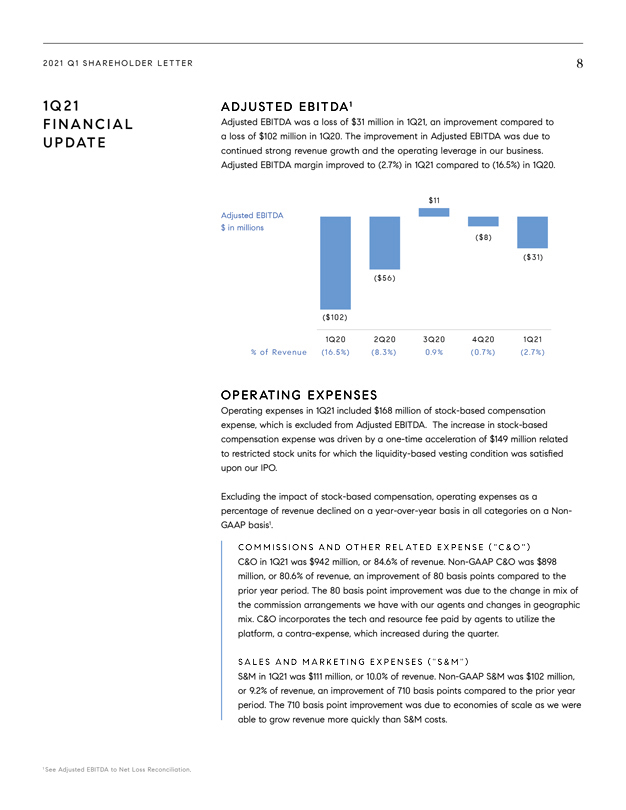
Adjusted EBITDA was a loss of $31 million in 1Q21, an
improvement compared to a loss of $102 million in 1Q20. The improvement in Adjusted EBITDA was due to continued strong revenue growth and the operating leverage in our business. Adjusted EBITDA margin improved to (2.7%) in 1Q21 compared to
(16.5%) in 1Q20.
$11
Adjusted EBITDA $ in millions
($8)
($31)
($56)
($102)
1Q20 2Q20 3Q20 4Q20 1Q21 % of Revenue (16.5%) (8.3%) 0.9% (0.7%) (2.7%)
OPERATING
EXPENSES
Operating expenses in 1Q21 included $168 million of stock-based compensation expense, which is excluded from Adjusted EBITDA. The increase in
stock-based compensation expense was driven by a one-time acceleration of $149 million related to restricted stock units for which the liquidity-based vesting condition was satisfied upon our IPO.
Excluding the impact of stock-based compensation, operating expenses as a percentage of revenue declined on a year-over-year basis in all categories on a Non-GAAP basis1.
COMMISSIONS AND OTHER RELATED EXPENSE (“C&O”)
C&O in 1Q21 was $942 million, or 84.6% of revenue. Non-GAAP C&O was $898 million, or 80.6% of revenue, an improvement of
80 basis points compared to the prior year period. The 80 basis point improvement was due to the change in mix of the commission arrangements we have with our agents and changes in geographic mix. C&O incorporates the tech and resource fee paid
by agents to utilize the platform, a contra-expense, which increased during the quarter.
SALES AND MARKETING EXPENSES (“S&M”)
S&M in 1Q21 was $111 million, or 10.0% of revenue. Non-GAAP S&M was $102 million, or 9.2% of revenue, an improvement of
710 basis points compared to the prior year period. The 710 basis point improvement was due to economies of scale as we were able to grow revenue more quickly than S&M costs.
1 See Adjusted EBITDA to Net Loss Reconciliation
2021 Q1 SHAREHOLDER LETTER 9
OPERATIONS AND
SUPPORT EXPENSES (“O&S”)
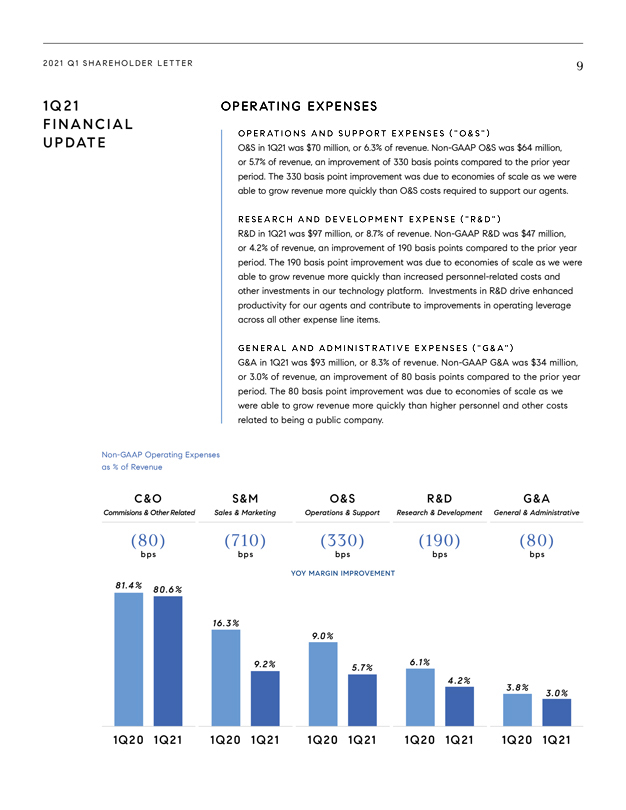
O&S in 1Q21 was $70 million, or 6.3% of revenue. Non-GAAP O&S was
$64 million, or 5.7% of revenue, an improvement of 330 basis points compared to the prior year period. The 330 basis point improvement was due to economies of scale as we were able to grow revenue more quickly than O&S costs required to
support our agents.
RESEARCH AND DEVELOPMENT EXPENSE (“R&D”)
R&D in 1Q21 was $97 million, or 8.7% of revenue. Non-GAAP R&D was $47 million, or 4.2% of revenue, an
improvement of 190 basis points compared to the prior year period. The 190 basis point improvement was due to economies of scale as we were able to grow revenue more quickly than increased personnel-related costs and other investments in our
technology platform. Investments in R&D drive enhanced productivity for our agents and contribute to improvements in operating leverage across all other expense line items.
GENERAL AND ADMINISTRATIVE EXPENSES (“G&A”)
G&A in 1Q21 was
$93 million, or 8.3% of revenue. Non-GAAP G&A was $34 million, or 3.0% of revenue, an improvement of 80 basis points compared to the prior year period. The 80 basis point improvement was due to
economies of scale as we were able to grow revenue more quickly than higher personnel and other costs related to being a public company.
OPERATING EXPENSES
1Q20 1Q21
C&O S&M O&S R&D G&A
(80) (710) (330) (190) (80)
bps bps bps bps bps
Sales & Marketing Operations & Support Research & Development General & Administrative
81 .4% 80.6%
16.3%
9.2%
9.0%
5.7%
6.1%
4.2%
3.8%
3.0%
1Q20 1Q21
1Q20 1Q21
1Q20 1Q21
1Q20 1Q21
Commisions & Other Related
YOY MARGIN IMPROVEMENT
Non-GAAP Operating Expenses
as % of Revenue
1Q21
FINANCIAL
UPDATE
2021 Q1 SHAREHOLDER LETTER
1Q21 In 1Q21,
we had 9,812 Average Principal Agents close 40,268 Total Transactions worth OPERATIONAL $43.8 billion of Gross Transaction Value.
UPDATE
AVERAGE NUMBER OF PRINCIPAL AGENTS
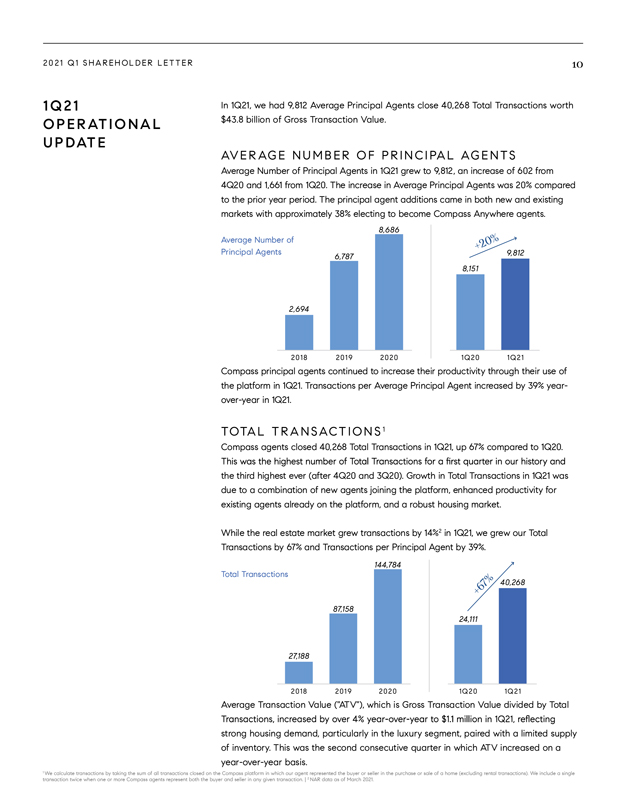
Average Number of Principal Agents in 1Q21 grew to 9,812,
an increase of 602 from 4Q20 and 1,661 from 1Q20. The increase in Average Principal Agents was 20% compared to the prior year period. The principal agent additions came in both new and existing markets with approximately 38% electing to become
Compass Anywhere agents.
Average Number of Principal Agents
Compass principal
agents continued to increase their productivity through their use of the platform in 1Q21. Transactions per Average Principal Agent increased by 39% year-over-year in 1Q21.
TOTAL TRANSACTIONS1
Compass agents closed 40,268 Total Transactions in 1Q21, up 67% compared
to 1Q20. This was the highest number of Total Transaction for a first quarter in our history and
the third highest ever (after 4Q20 and 3Q20). Growth in Total
Transactions in 1Q21 was due to a combination of new agents joining the platform, enhanced productivity for existing agents already on the platform, and a robust housing market.
While the real estate market grew transactions by 14%2 in 1Q21, we grew our Total Transactions by 67% and Transactions per Principal Agent by 39%.
Total Transactions
Average Transaction Value (“ATV”), which is Gross Transaction
Value divided by Total Transactions, increased by over 4% year-over-year to $1.1 million in 1Q21, reflecting
strong housing demand, particularly in the luxury
segment, paired with a limited supply of inventory. This was the second consecutive quarter in which ATV increased on a year-over-year basis.
1 We calculate
transactions by taking the sum of all transactions closed on the Compass platform in which our agent represented the buyer or seller in the purchase or sale of a home (excluding rental transactions). We include a single transaction twice when one or
more Compass agents represent both the buyer and seller in any given transaction. | 2 NAR data as of March 2021.
202 1 Q1 SHAREHOLDER L ET TER 11
GROSS TRANSACTION
VALUE1
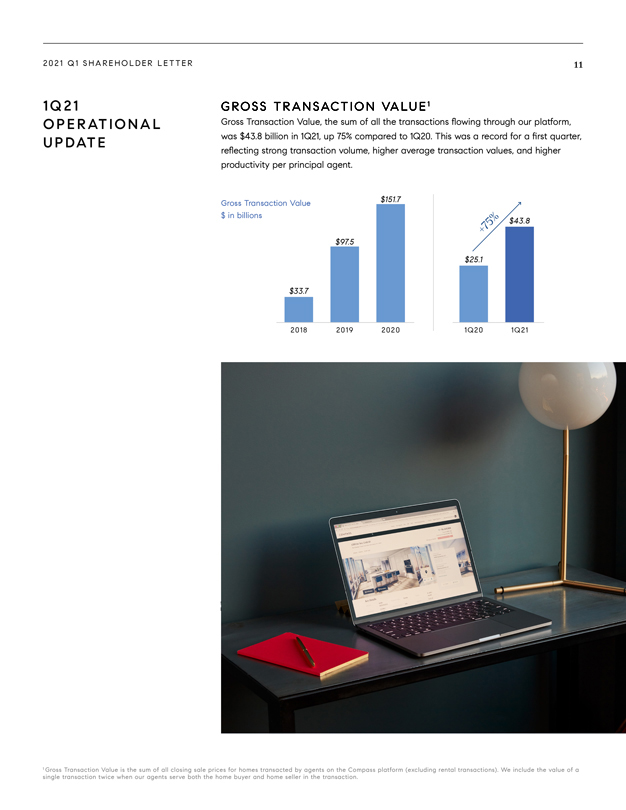
Gross Transaction Value, the sum of all the transactions flowing through our platform, was $43.8 billion in 1Q21, up 75% compared to 1Q20. This was a
record for a first quarter, reflecting strong transaction volume, higher average transaction values, and higher productivity per principal agent. 2018 2019 2020 1Q20 1Q21
$151.7
$25.1
$43.8
$97.5
$33.7
+75%
1 Gross Transaction Value is the sum of all closing sale prices for homes transacted by agents on the Compass platform (excluding rental transactions). We include
the value of a
single transaction twice when our agents serve both the home buyer and home seller in the transaction.
1
States: 20
Markets: 47
New
England
Chicago
New York
Philadelphia
Washington DC
South Florida
Atlanta
Nashville
Houston
Dallas
Austin
San Diego
Hawaii
Southern
California
San Francisco
Bay Area
Seattle Colorado
Baltimore
Rhode Island
Delaware
Tampa
States: 20
Markets: 47
New
England
Chicago
New York
Philadelphia
Washington DC
South Florida
Atlanta
Nashville
Houston
Dallas
Austin
San Diego
Hawaii
Southern
California
San Francisco
Bay Area
Seattle Colorado
Baltimore
Rhode Island
Delaware
Tampa
Gross Transaction Value
$ in billions
1Q21
OPERATIONAL
UPDATE
202 1 Q1 SHAREHOLDER L ET TER 12
ADJACENT SERVICES
We made significant progress in expanding our adjacent services business in 1Q21. Our extensive network of top performing agents and their transactions create an
opportunity to capture more spend in the real estate ecosystem adjacent to the transaction. Today, we offer services in title and escrow and digital marketing, and we plan to provide mortgage and other adjacent services in the future. In 1Q21, we
continued to expand our Title and Escrow business through organic growth and acquisition. In February 2021, we acquired KVS Title, a leading title company serving the Washington DC metropolitan area. With the addition of KVS Title, Compass’
closing services portfolio now operates in California, Florida, Washington state, Maryland, Virginia, and Washington DC. We expect to continue to scale our Title and Escrow business in existing geographies as well as enter into new markets going
forward.
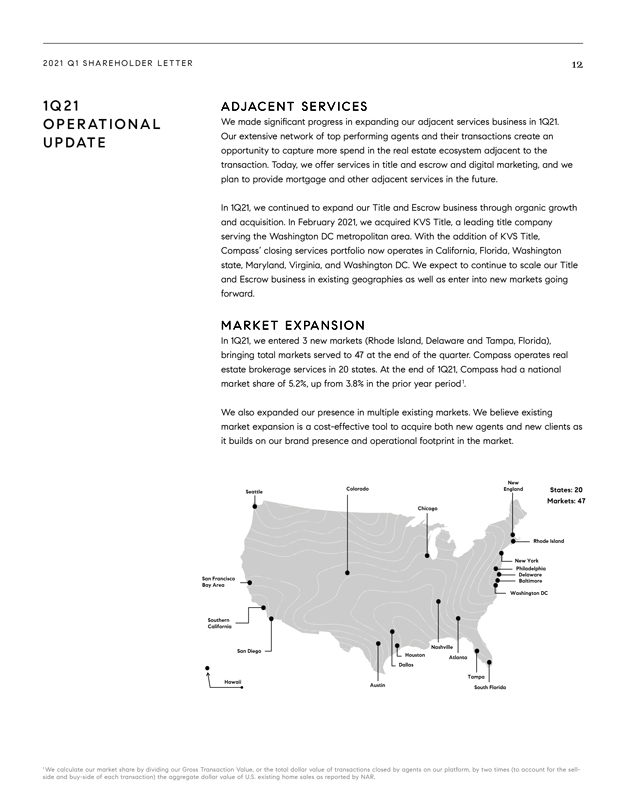
MARKET EXPANSION
In 1Q21, we entered 3 new markets (Rhode Island,
Delaware and Tampa, Florida), bringing total markets served to 47 at the end of the quarter. Compass operates real estate brokerage services in 20 states. At the end of 1Q21, Compass had a national market share of 5.2%, up from 3.8% in the prior
year period 1. We also expanded our presence in multiple existing markets. We believe existing market expansion is a cost-effective tool to acquire both new agents and new clients as it builds on our brand presence and operational footprint in the
market.
1
States: 20
Markets: 47
New
England
Chicago
New York
Philadelphia
Washington DC
South Florida
Atlanta
Nashville
Houston
Dallas
Austin
San Diego
Hawaii
Southern
California
San Francisco
Bay Area
Seattle Colorado
Baltimore
Rhode Island
Delaware
Tampa
States: 20
Markets: 47
New
England
Chicago
New York
Philadelphia
Washington DC
South Florida
Atlanta
Nashville
Houston
Dallas
Austin
San Diego
Hawaii
Southern
California
San Francisco
Bay Area
Seattle Colorado
Baltimore
Rhode Island
Delaware
Tampa
1 We calculate our market share by dividing our Gross Transaction Value, or the total
dollar value of transactions closed by agents on our platform, by two times (to account for the sellside
and buy-side of
each transaction) the aggregate dollar value of U.S. existing home sales as reported by NAR.
1Q21
OPERATIONAL
UPDATE
202 1 Q1 SHAREHOLDER L ET TER 13
OVERVIEW
Compass’ proprietary technology platform enables Compass agents to deliver an exceptional experience to buyer and seller clients. It makes our agents more
productive, allowing them to drive increased transaction volume by using technology to accelerate, automate, and simplify many of the routine tasks an agent performs on a daily basis. It also uses artificial intelligence and machine learning to
better analyze the data sets, yielding better outcomes for our agents and their clients. We continue to invest in the platform, adding new engineers to build out the depth and breadth of the platform for our agents. We currently employ over 850
engineers, designers and product managers in New York, Washington DC, Seattle, and Hyderabad. Usage on the platform continues to increase. In 1Q21, total sessions on the platform grew by 120% year-over-year as both agents and their clients saw the
advantages of discovering, collaborating, and transacting homes in a digital setting. In 1Q21, 91% of our agent teams used our proprietary technology platform weekly, up 5 percentage points from the prior year period. The ratio of daily active users
to weekly active users (“DAU/WAU”) was 69%, up 7 percentage points from the prior year period. We are also continuing to enhance the platform to create an increasingly differentiated experience for our agents, rapidly incorporating their
direct feedback. In 1Q21, new product introductions included Business Tracker and enhancements to Likely to Sell among many others.
Business Tracker allows agents
to visualize their entire pipeline—leads, buyers, and sellers, all from one place. Prior to Business Tracker, agents managed their pipeline on a piece of paper, but now can do it within the platform. They can view details about each
transaction, from list to contract to close. This saves agents time and reduces their reliance on staff or other third party software to compile.
+120%
91% 69% of Agent Teams Used Platform Weekly Ratio of DAU/WAU Year-Over-Year Growth in Total Sessions on Platform
1Q21
PLATFORM
UPDATE
202 1 Q1 SHAREHOLDER L ET TER 14
Likely to Sell,
our AI-powered recommendation engine, predicts which properties are most likely to sell. It incorporates data like property details, pricing history and mortgage status to rate how likely a property is to sell
in the next 12 months. Agents are then alerted to reach out to these contacts, helping them to win the listing before competing agents even know the property is in play. Likely To Sell recommendations result in a 61% higher win rate for our agents,
compared to properties we did not identify as likely to sell. Our platform is proprietary and built in-house, but we look for opportunities to accelerate our product roadmap when there is an opportunity to
acquire a technology that agents love. The acquisition of Glide, which closed last week, is a great example. Glide is a fastgrowing software services platform that provides Compass and non-Compass agents with
critical transaction management tools such as offer and transaction management, digitization of key forms, eSignature and digital disclosures. Glide is used by tens of thousands of real estate agents in California and we plan to expand its reach
among agents, both within and outside of Compass, to more states across the country.
1Q21
PLATFORM
UPDATE

2021 Q1 SHAREHOLDER LETTER 15
4
3
$675k
Team Members
Years at Compass
In Commissions in 2020
AGENT TESTIMONIAL: BEN PARAS
“Before joining Compass I was a top producing agent, but my old brokerage was not an early adopter of technology. I wanted to find quicker and more efficient ways to conduct
my business so I ended up spending a lot of money on external vendors. It became a big obstacle for me. And then when I came to Compass, I was like a kid in a candy store. With Compass, I now save a ton of time and am able to run my business more
proficiently. Everything is so seamless on the Compass platform, and it gives me reassurance that Compass is constantly evolving their technology to better support its agents. Their approach is to listen to what we need, not just to create a shiny
new toy. The platform is truly agent-focused, and I’ve been able to grow my business, get more time back, and provide more value to my clients because of it.”
AGENT
TESTIMONIAL
2021 Q1 SHAREHOLDER LETTER 16
CASH
At the end of 1Q21, Compass had cash and cash equivalents of $330 million. This amount does not incorporate aggregate proceeds raised in our initial public offering of
$450 million, net of fees, as that event occurred after quarter end.
DEBT
Compass currently has two credit facilities in place: a $75 million Concierge Credit Facility, and a $350 million Revolving Credit Facility. The
Concierge Credit Facility is a credit facility solely used to finance our Compass Concierge Program. At the end of 1Q21, the Concierge Credit Facility had drawn down $10 million and the Revolving Credit Facility had no amount outstanding.
FREE CASH FLOW1
Free Cash Flow is defined as Net Cash Used in Operating
Activities less capital expenditures. In 1Q21, Free Cash Flow was a loss of $57 million, an improvement of $120 million compared to a loss of $177 million in 1Q20.
CONCIERGE
Compass Concierge is a program in which we provide home sellers access to
interest-free capital to front the cost of home improvement services and is designed to increase the sale value of the home and decrease its time on market. Since inception, Concierge has been used on more than 17,500 projects with a total project
value through the end of 1Q21 of $470 million, yielding an average project size of approximately $26,000.
1 See Reconciliation of Operating Cash Flows to Free
Cash Flow
1Q21
BALANCE
SHEET &
CASH FLOW
STATEMENT
UPDATE
2021 Q1 SHAREHOLDER LETTER
GUIDANCE We expect 2021
to be a very strong year for the residential housing market and our agents.
Based on our current outlook, Compass expects:
• 2Q21 revenues of $1.5 billion to $1.6 billion. At the midpoint, this implies YOY growth of 127% in 2Q20. We expect the strong housing market to continue in 2Q20 as we lap
the COVID impact in the second quarter of last year.
• 2Q21 Adjusted EBITDA loss of $(10) million to $10 million. At the midpoint, this implies we are
breakeven for 2Q21. We expect to continue to drive operating leverage in the business.
• FY2021 revenues of $5.35 billion to $5.55 billion. At the midpoint,
this implies growth of 46% in FY 2021.
• FY2021 Adjusted EBITDA loss of $(245) million to $(225) million. At the midpoint, this implies an Adjusted EBITDA
margin of (4.3%). Given the momentum in our business, we see a compelling opportunity to continue investing to drive in future growth while also laying the groundwork for better unit economics and
expansion of adjacent services, where long-term Adjusted EBITDA margins are strong, as well as investment in R&D, to drive higher agent productivity and reduce the marginal
cost per agent. We expect these areas will support our
their clients, and substantially increase our total addressable market.
We have not reconciled our guidance for Adjusted EBITDA to Net Loss because stock-based compensation expense cannot be reasonably calculated or predicted at this time. Accordingly,
a reconciliation is not available without unreasonable effort.
202 1 Q1 SHAREHOLDER L ET TER 18
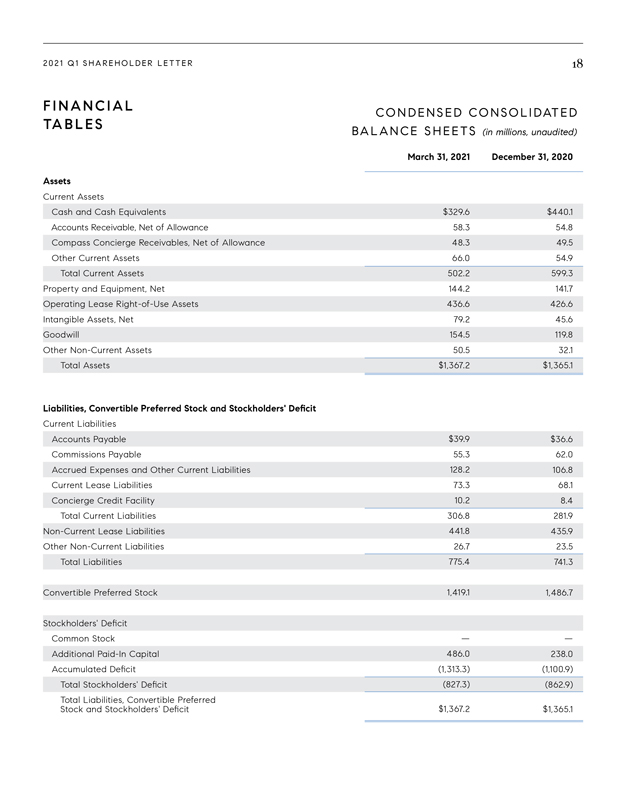
CONDENSED
CONSOLIDATED
BALANCE SHEETS (in millions, unaudited)
Assets
Current Assets
Cash and Cash Equivalents
Accounts Receivable, Net of Allowance
Compass Concierge Receivables, Net of Allowance
Other Current Assets
Total Current Assets
Property and Equipment, Net
Operating Lease Right-of-Use Assets
Intangible Assets, Net
Goodwill
Other Non-Current Assets
Total Assets
$329.6
58.3
48.3
66.0
502.2
144.2
436.6
79.2
154.5
50.5
$1,367.2
$440.1
54.8
49.5
54.9
599.3
141.7
426.6
45.6
119.8
32.1
$1,365.1
$39.9
55.3
128.2
73.3
10.2
306.8
441.8
26.7
775.4
1,419.1
—
486.0
(1,313.3)
(827.3)
$1,367.2
$36.6
62.0
106.8
68.1
8.4
281.9
435.9
23.5
741.3
1,486.7
—
238.0
(1,100.9)
(862.9)
$1,365.1
Liabilities, Convertible Preferred Stock and Stockholders’ Deficit
Current Liabilities
Accounts Payable
Commissions Payable
Accrued Expenses and Other Current Liabilities
Current Lease Liabilities
Concierge Credit Facility
Total Current Liabilities
Non-Current Lease
Liabilities
Other Non-Current Liabilities
Total Liabilities
Convertible Preferred Stock
Stockholders’ Deficit
Common Stock
Additional Paid-In Capital
Accumulated Deficit
Total Stockholders’ Deficit
Total Liabilities, Convertible Preferred
Stock and Stockholders’ Deficit
March 31, 2021 December 31,
2020
FINANCIAL
TABLES
2021 Q1 SHAREHOLDER LETTER
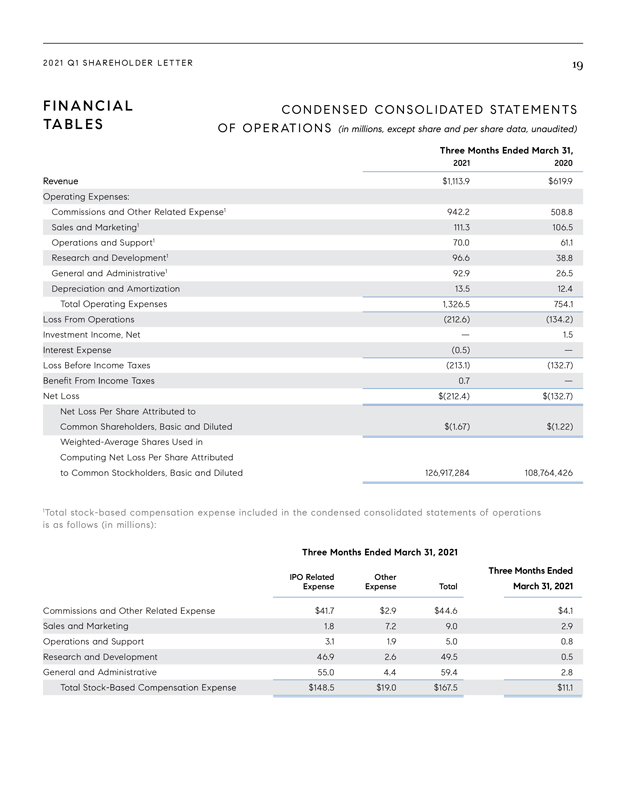
FINANCIAL CONDENSED
CONSOLIDATED STATEMENTS TABLES OF OPERATIONS
Three Months Ended March 31,
2021 2020
Revenue $1,113.9 $619.9
Commissions and Other Related Expenses 1 942.2 508.8 Sales and Marketing1 111.3 106.5 Operations and Support1 70.0 61.1 Research and Development1 96.6 38.8 General and
Administrative1 92.9 26.5 Depreciation and Amortization 13.5 12.4 1,326.5 754.1 Loss From Operations (212.6) (134.2) Investment Income, Net — 1.5 (0.5) —Loss Before Income Taxes (213.1) (132.7) 0.7 —Net Loss $(212.4) $(132.7) Net Loss
Per Share Attributed to Common Shareholders, Basic and Diluted $(1.67) $(1.22) Weighted-Average Shares Used in Computing Net Loss Per Share Attributed to Common Stockholders, Basic and Diluted $126,917,284 $108,764,426
1Total stock-based compensation expense included in the condensed consolidated statements of operations is as follows (in millions):
Three Months Ended March 31, 2021
IPO Related Other Three Months Ended
Expense Expense Total March 31, 2021
Commissions and Other Related $41.7 $2.9 $44.6 $4.1 Sales
and Marketing 1.8 7.2 9.0 2.9 Operations and Support 3.1 1.9 5.0 0.8 Research and Development 46.9 2.6 49.5 0.5 General and Administrative 55.0 4.4 59.4 2.8 $148.5 $19.0 $167.5 $11.1
202 1 Q1 SHAREHOLDER L ET TER 20
FINANCIAL
TABLES
CONDENSED CONSOLIDATED STATEMENTS
OF CASH FLOWS (in millions, unaudited)
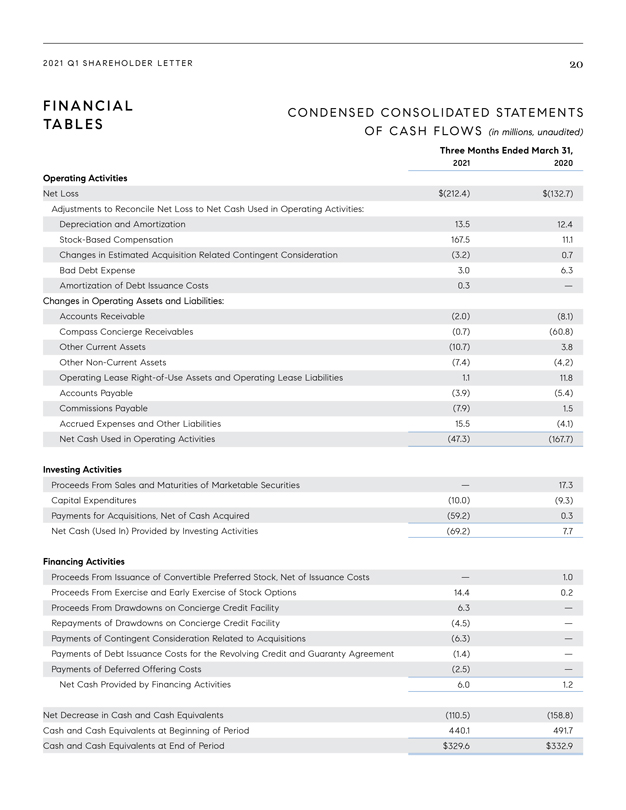
Operating Activities
Net Loss
Adjustments to Reconcile Net Loss to Net Cash Used in Operating Activities:
Depreciation and Amortization
Stock-Based Compensation
Changes in Estimated Acquisition Related Contingent Consideration
Bad Debt Expense
Amortization of Debt Issuance Costs
Changes in Operating Assets and Liabilities:
Accounts Receivable
Compass Concierge Receivables
Other Current Assets
Other Non-Current Assets
Operating Lease Right-of-Use Assets and Operating Lease Liabilities
Accounts Payable
Commissions Payable
Accrued Expenses and Other Liabilities
Net Cash Used in Operating Activities
Investing Activities
Proceeds From Sales and Maturities of Marketable Securities
Capital Expenditures
Payments for Acquisitions, Net of Cash Acquired
Net Cash (Used In) Provided by Investing Activities
Financing Activities
Proceeds From Issuance of Convertible Preferred Stock, Net of Issuance Costs
Proceeds From
Exercise and Early Exercise of Stock Options
Proceeds From Drawdowns on Concierge Credit Facility
Repayments of Drawdowns on Concierge Credit Facility
Payments of Contingent Consideration
Related to Acquisitions
Payments of Debt Issuance Costs for the Revolving Credit and Guaranty Agreement
Payments of Deferred Offering Costs
Net Cash Provided by Financing Activities
Net Decrease in Cash and Cash Equivalents
Cash and Cash Equivalents at Beginning of Period
Cash and Cash Equivalents at End of Period
$(212.4)
13.5
167.5
(3.2)
3.0
0.3
(2.0)
(0.7)
(10.7)
(7.4)
1.1
(3.9)
(7.9)
15.5
(47.3)
—
(10.0)
(59.2)
(69.2)
—
14.4
6.3
(4.5)
(6.3)
(1.4)
(2.5)
6.0
(110.5)
440.1
$329.6
$(132.7)
12.4
11.1
0.7
6.3
—
(8.1)
(60.8)
3.8
(4,2)
11.8
(5.4)
1.5
(4.1)
(167.7)
17.3
(9.3)
0.3
7.7
1.0
0.2
—
—
—
—
—
1.2
(158.8)
491.7
$332.9
2021
2020
Three Months Ended March 31,
2021 Q1 SHAREHOLDER LETTER
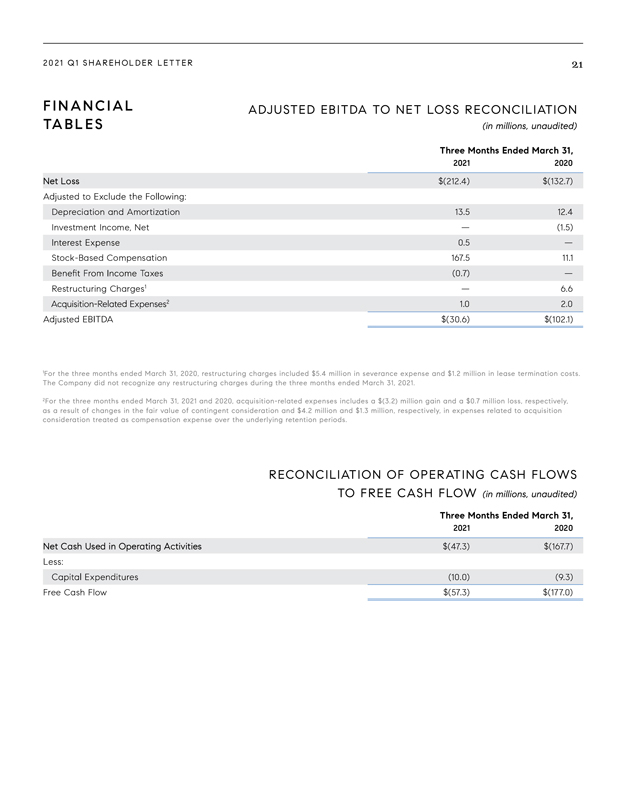
FINANCIAL ADJUSTED
EBITDA TO NET LOSS RECONCILIATION
TABLES
(in millions, unaudited)
Three Months Ended March 31,
2021 2020
Net Loss $(212.4) $(132.7)
Adjusted to Exclude the following:
Depreciation and Amortization 13.5 12.4 Investment Income, Net — (1.5) Interest Expense 0.5 — Stock-Based Compensation 167.5 11.1 Benefit From Income Taxes (0.7) —
Restructuring Charges1 — 6.6
2 1.0 2.0 Adjusted EBITDA $(30.6) $(102.1)
1For the three months ended March 31, 2020, restructuring charges included $5.4 million in severance expense and $1.2 million in lease termination costs. The
Company did not recognize any restructuring charges during the three months ended March 31, 2021.
2For the three months ended March 31, 2021 and 2020,
acquisition-related expenses includes a $(3.2) million gain and a $0.7 million loss, respectively, as a result of changes in the fair value of contingent consideration and $4.2 million and $1.3 million, respectively, in expenses related to
acquisition consideration treated as compensation expense over the underlying retention periods.
RECONCILIATION OF OPERATING CASH FLOWS TO FREE CASH FLOW
Three Months Ended March 31,
2021 2020
Net Cash Used in Operating Activities $(47.3) $(167.7)
Less: (10.0) (9.3)
Free Cash Flow $(57.3) $(177.0)
2021 Q1 SHAREHOLDER LETTER
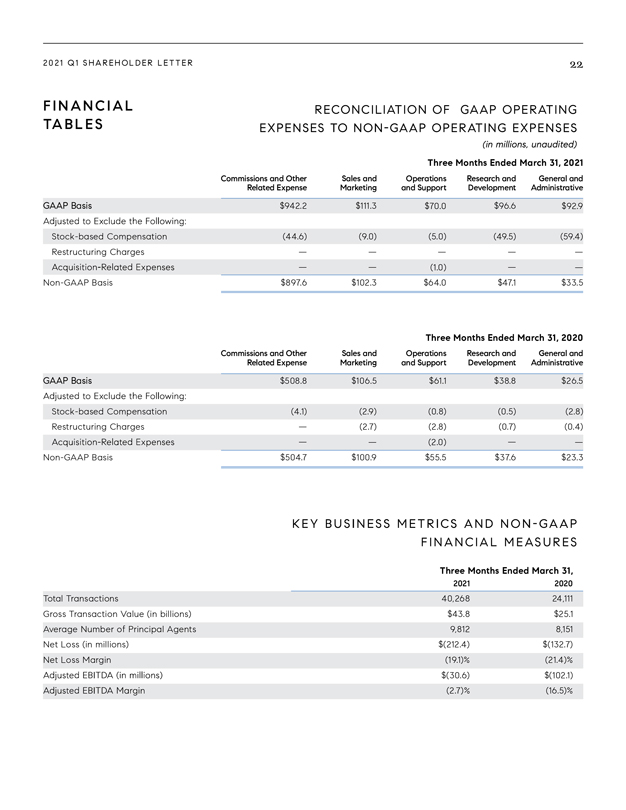
FINANCIAL
RECONCILIATION OF GAAP OPERATING
TABLES EXPENSES TO NON-GAAP OPERATING EXPENSES (IN MILLIONS, UNAUDITED)
Three Months Ended March 31, 2021
Commissions and Other Sales and Operations Research and
General and
Related Expense Marketing and Support Development Administrative
GAAP Basis $942.2 $111.3 $70.0 $96.6 $92.9 Adjusted to Exclude the Following:
Stock-based Compensation (44.6) (9.0) (5.0) (49.5) (59.4)
Restructuring
Charges — — — — —Acquisiton-Related Expenses
— — (1.0) — —
Non-GAAP Basis $897.6 $102.3 $64.0 $47.1 $33.5
Three Months Ended March 31, 2020
Commissions and Other Sales and Operations Research and General and
Related Expense Marketing
and Support Development Administrative
GAAP Basis $508.8 $106.5 $61.1 $38.8 $26.5
Stock-based Compensation (4.1) (2.9) (0.8) (0.5) (2.8)
Restructuring Charges — (2.7)
(2.8) (0.7) (0.4)
— — (2.0) — —
Non-GAAP Basis $504.7
$100.9 $55.5 $37.6 $23.3
FINANCIAL MEASURES
Three Months Ended March 31,
2021 2020 EXPENSES TO NON-GAAP OPERATING EXPENSES (IN MILLIONS, UNAUDITED Adjusted to Exclude the Following: Acquisiton-Related Expenses
Total Transactions 40,268 24,111 Gross Transaction Value (i n billions) $43.8 $25.1 Average Number of Principal Agents 9,812 8,151 Net Loss (in millions) $(212.4) $(132.7) Net Loss
Margin (19.1)% (21.4)% Adjusted EBITDA (IN MILLIONS) $(30.6) $(102.1) Adjusted EBITDA Margin (2.7)% (16.5)%
2021 Q1 SHAREHOLDER LETTER 23
LEGAL SAFE HARBOR
STATEMENT
DISCLAIMER This press release includes forward-looking statements, which are statements other than statements
of historical facts, and statements in the future tense. These statements include, but are not limited to, statements regarding the future performance of Compass and its market
opportunity, including expected financial results for the second quarter and full year of 2021, expectations regarding the impact of the COVID-19 pandemic on our business and industry, and expectations for our future investment in our business.
Accordingly, actual results could differ materially or such uncertainties could cause adverse effects on our results. Forward-looking statements are based upon various estimates and assumptions, as well as information known to Compass as of the date
of this press release, and are subject to risks and uncertainties, including but not limited to: general economic conditions, the health of the U.S. real estate industry, and risks generally incident to the ownership of residential real estate,
including seasonal and cyclical trends; our ability to attract new agents and retain current agents or increase agents’ utilization of our platform; our rapid growth and rate of growth; our net losses and ability to achieve or sustain
profitability in the future; our ability to innovate and continuously improve and expand our platform; the impact of the COVID-19 pandemic on our business; our ability to compete successful in the markets in which we operate; the effect of monetary
policies of the federal government and its agencies; any decreases in our gross commission income or the percentage of commissions that we collect; our ability to expand our business and offer additional adjacent services; fluctuation of our
quarterly results and other operating metrics; our ability to successfully complete acquisitions and integrate target companies; the effect of the claims, lawsuits, government investigations and other proceedings that we are subject to from time to
time; our ability to protect our intellectual property rights; and other general market, political, economic, and business conditions. Actual results could differ materially from those predicted or implied, and reported results should not be
considered as an indication of future performance. Additionally, these forward-looking statements, particularly our guidance, involve risks, uncertainties and assumptions, including those related to the impacts of COVID-19 on our clients’
spending decisions. Significant variation from the assumptions underlying our forward-looking statements could cause our actual results to vary, and the impact could be significant.
Additional risks and uncertainties that could affect our financial results are included under the caption “Risk Factors” in our Prospectus filed with the SEC on April 1,
2021 and our other SEC filings, which are available on the Investor Relations page of our website at investors.compass.com and on the SEC website at www.sec.gov. Additional information will also be set forth in our Quarterly Report on Form 10-Q for
the three months ended March 31, 2021 when filed. All forward-looking statements contained herein based on information available to us as of the date hereof, and we do not assume any obligation to update these statements as a result of new
information or future events.
Undue reliance should not be placed on the forward-looking statements in this press release. These statements are based on
information available to Compass on the date hereof, and Compass assumes no obligation to update such statements.
NON-GAAP FINANCIAL MEASURES
To supplement our condensed consolidated financial statements, which are prepared in accordance with GAAP, we present Non-GAAP Net Loss, Adjusted EBITDA, Adjusted EBITDA margin,
Free Cash Flow and Non-GAAP Operating Expenses, (collectively referred to as “Non-GAAP Financial Measures”), in this Shareholder Letter. Our use of Non-GAAP Financial Measures has limitations as an analytical tool, and these measures
should not be considered in isolation or as a substitute for analysis of financial results as reported under GAAP.
Compass uses Non-GAAP Financial Measures in
conjunction with GAAP measures as part of our overall assessment of our performance, including the preparation of our annual operating budget and quarterly forecasts, to evaluate the effectiveness of our business strategies and to communicate with
our board of directors concerning our financial performance.
2021 Q1 SHAREHOLDER LETTER
LEGAL DISCLAIMER
NON-GAAP FINANCIAL MEASURES (CONTINUED)
We believe Non-GAAP Financial
Measures are also helpful to investors, analysts and other interested parties
because they can assist in providing a more consistent and comparable overview of our
operations across our historical financial periods. Non-GAAP Financial Measures have limitations as analytical tools, therefore you should not consider them in isolation or as substitutes for analysis of our results as reported under GAAP. Because
of these limitations, you should consider Non-GAAP Financial Measures alongside other financial performance measures, including Net Loss and our other GAAP results. In evaluating Non-GAAP Financial Measures, you should be aware that in the future we
may incur expenses that are the same as or similar to some of the adjustments reflected in this Shareholder Letter. Our presentation of Non-GAAP Financial Measures should not be construed to imply that our future results will be unaffected by the
types of items excluded from the calculation of Non-GAAP Financial Measures. Non-GAAP Financial Measures are not presented in accordance with GAAP and the use of these terms varies from others in our industry.
Reconciliations of these Non-GAAP Financial Measures has been provided in the financial statement tables included in this Shareholder Letter and investors are encouraged to review
these reconciliations.
ABOUT COMPASS
Founded in 2012, Compass is a leading
real estate technology company, providing an end-to-end platform that empowers its residential real estate agents to deliver exceptional service to seller and buyer clients. The platform includes an integrated suite of cloud-based software for
customer relationship management, marketing, client service, brokerage services and other critical functionality, all custom-built for the real estate industry. Compass agents utilize the platform to grow their business, save time and manage their
business more effectively. For more information on how Compass empowers real estate agents, one of the largest groups of small business owners in the country, please visit www.compass.com.

2021 Q1 SHAREHOLDER LETTER compass.com
INVESTOR
CONTACT
Ben Barrett
646.621.3142
[email protected]
MEDIA CONTACT
Chris O’Brien
917.626.2345
[email protected]
COMPASS
Serious News for Serious Traders! Try StreetInsider.com Premium Free!
You May Also Be Interested In
- Galway Metals Announces Closing of Private Placement of Flow-Through Units
- Victory Sells Tahlo Lake Property in British Columbia
- CoTec Holdings Corp. Announces Initial Closing of Non-Brokered Private Placement
Create E-mail Alert Related Categories
SEC FilingsSign up for StreetInsider Free!
Receive full access to all new and archived articles, unlimited portfolio tracking, e-mail alerts, custom newswires and RSS feeds - and more!
