

Form 8-K CTO Realty Growth, Inc. For: Jul 29
 Tweet
Tweet Share
Share
Press Release
Contact:Matthew M. Partridge
Senior Vice President, Chief Financial Officer and Treasurer
(386) 944-5643
FOR IMMEDIATE RELEASE | CTO REALTY GROWTH REPORTS SECOND QUARTER 2021 OPERATING RESULTS |
DAYTONA BEACH, FL – July 29, 2021 – CTO Realty Growth, Inc. (NYSE: CTO) (the “Company” or “CTO”) today announced its operating results and earnings for the quarter ended June 30, 2021.
Select Highlights
Page 1
CEO Comments
“We are encouraged by our second quarter execution and the progress we are making in constructing a high-quality multi-tenant, retail-based portfolio,” commented John P. Albright, President and Chief Executive Officer of CTO Realty Growth. “We acquired a high-quality, class A, mixed use property in the Dallas market for $72.5 million and we continued to make good progress with the disposition of our single tenant assets, which totaled $61 million in the second quarter. The contract purchaser for the remaining Daytona Beach land holdings is in due diligence and we look forward to accretively reinvesting the expected proceeds into our core strategy. The combination of all of this activity, in addition to acquisition and disposition opportunities we anticipate materializing in the back half of the year, has us well-positioned to drive strong AFFO growth in 2022 as we execute on our diversified, retail-based investment strategy.”
Quarterly Financial Results Highlights
The tables below provide a summary of the Company’s operating results for the three months ended June 30, 2021:
(in thousands) | For the Three Months Ended June 30, 2021 |
| For the Three Months Ended June 30, 2020 | | Variance to Comparable Period in the Prior Year | ||||||
Income Properties | $ | 11,574 |
| $ | 11,473 | | $ | 101 | 0.9% | ||
Management Fee Income | $ | 752 | | $ | 695 | | $ | 57 | 8.2% | ||
Commercial Loan and Master Lease Investments | $ | 709 | $ | 835 | | $ | (126) | (15.1%) | |||
Real Estate Operations | $ | 1,248 |
| $ | 7 | | $ | 1,241 | | 17,728.6% | |
Total Revenues | $ | 14,283 |
| $ | 13,010 | | $ | 1,273 | | 9.8% | |
The increase in total revenue during the three months ended June 30, 2021 was primarily attributable to increased revenue from real estate operations related to the sale of subsurface interests.
(in thousands, except per share data) | For the Three Months Ended June 30, 2021 |
| For the Three Months Ended June 30, 2020 | | Variance to Comparable Period in the Prior Year | ||||
Net Income (Loss) | $ | (3,724) | | $ | 12,611 | | $ | (16,335) | (129.5%) |
Net Income (Loss) per diluted share | $ | (0.63) | | $ | 2.71 | | $ | (3.34) | (123.2%) |
FFO (1) | $ | 4,915 | | $ | 2,532 | | $ | 2,383 | 94.1% |
FFO per diluted share (1) | $ | 0.83 | | $ | 0.54 | | $ | 0.29 | 53.7% |
AFFO (1) | $ | 6,294 | | $ | 443 | | $ | 5,851 | 1,320.8% |
AFFO per diluted share (1) | $ | 1.07 | | $ | 0.10 | | $ | 0.97 | 970.0% |
Dividends Declared and Paid, per share | $ | 1.00 | $ | 0.25 | | $ | 0.75 | 300.0% | |
(1) | See the “Non-GAAP Financial Measures” section and tables at the end of this press release for a discussion and reconciliation of Net Income (Loss) to non-GAAP financial measures, including FFO, FFO per diluted share, AFFO and AFFO per diluted share. |
The net loss for the three months ended June 30, 2021 was primarily attributable to a non-cash impairment charge on the Company’s retained interest in the joint venture that currently holds approximately 1,600 acres of undeveloped land in Daytona Beach, Florida (the “Land JV”) of $16.5 million, or $2.11 per diluted share, net of the related income tax benefit. The non-cash impairment charge is a result of the executed agreement to sell the Land JV’s remaining holdings.
Additionally, during the three months ended June 30, 2021, the Company recognized gains on dispositions of income-producing properties totaling $4.7 million, or $0.80 per diluted share, in addition to a non-cash, unrealized gain of $3.4 million, or $0.57 per diluted share, on the mark-to-market of the Company’s investment in PINE due to the increase in the closing stock price of PINE during the quarter.
Page 2
Net Income (Loss) per diluted share, FFO per diluted share and AFFO per diluted share for the three months ended June 30, 2021 and the associated year-over-year comparisons include the dilutive effects of the Company’s previously announced special distribution that was intended to ensure that the Company distributed all of its previously undistributed earnings and profits attributable to taxable periods ended on or prior to December 31, 2019, as required in connection with the Company’s election to be taxable as a REIT commencing with its taxable year ended December 31, 2020. The Special Distribution was paid in the fourth quarter of 2020 through an aggregate of approximately $5.6 million in cash and the issuance of 1,198,963 shares of the Company’s common stock.
Year-to-Date Financial Results Highlights
The tables below provide a summary of the Company’s operating results for the six months ended June 30, 2021:
(in thousands) | For the Six Months Ended June 30, 2021 |
| For the Six Months Ended June 30, 2020 | | Variance to Comparable Period in the Prior Year | ||||||
Income Properties | $ | 23,023 |
| $ | 22,476 | | $ | 547 | 2.4% | ||
Management Fee Income | $ | 1,421 | | $ | 1,397 | | $ | 24 | 1.7% | ||
Commercial Loan and Master Lease Investments | $ | 1,410 | $ | 1,887 | | $ | (477) | (25.3%) | |||
Real Estate Operations | $ | 3,141 |
| $ | 88 | | $ | 3,053 | | 3,469.3% | |
Total Revenues | $ | 28,995 |
| $ | 25,848 | | $ | 3,147 | | 12.2% | |
The increase in total revenue during the six months ended June 30, 2021 was primarily attributable to increased revenue from real estate operations related to the sale of subsurface interests in addition to income produced by the Company’s recent income property acquisitions versus that of properties disposed of by the Company during the comparative period, offset by decreased revenue related to the timing of the Company’s investments in and dispositions of commercial loan and master lease investments.
(in thousands, except per share data) | For the Six Months Ended June 30, 2021 |
| For the Six Months Ended June 30, 2020 | | Variance to Comparable Period in the Prior Year | ||||
Net Income | $ | 4,061 | | $ | 349 | | $ | 3,712 | 1,063.61% |
Net Income per diluted share | $ | 0.69 | | $ | 0.07 | | $ | 0.62 | 885.7% |
FFO (1) | $ | 10,161 | | $ | 11,822 | | $ | (1,661) | (14.1%) |
FFO per diluted share (1) | $ | 1.73 | | $ | 2.52 | | $ | (0.79) | (31.3%) |
AFFO (1) | $ | 11,981 | | $ | 9,625 | | $ | 2,356 | 24.5% |
AFFO per diluted share (1) | $ | 2.03 | | $ | 2.06 | | $ | (0.03) | (1.5%) |
Dividends Declared and Paid, per share | $ | 2.00 | $ | 0.50 | | $ | 1.50 | 300.0% | |
(1) | See the “Non-GAAP Financial Measures” section and tables at the end of this press release for a discussion and reconciliation of Net Income to non-GAAP financial measures, including FFO, FFO per diluted share, AFFO and AFFO per diluted share. |
Net income for the six months ended June 30, 2021 includes gains on dispositions of income-producing properties totaling $5.4 million, or $0.92 per diluted share, in addition to a non-cash, unrealized gain of $8.2 million, or $1.40 per diluted share, on the mark-to-market of the Company’s investment in PINE due to the increase in the closing stock price of PINE during the period. Additionally, the Company recognized a non-cash impairment charge on the Company’s retained interest in the Land JV of $16.5 million, or $2.11 per diluted share, net of the related income tax benefit. The non-cash impairment charge is a result of the executed agreement to sell the Land JV’s remaining holdings.
Net Income per diluted share, FFO per diluted share and AFFO per diluted share for the six months ended June 30, 2021 and the associated year-over-year comparisons include the dilutive effects of the Company’s previously announced special distribution that was intended to ensure that the Company distributed all of its previously undistributed earnings and profits
Page 3
attributable to taxable periods ended on or prior to December 31, 2019, as required in connection with the Company’s election to be taxable as a REIT commencing with its taxable year ended December 31, 2020. The Special Distribution was paid in the fourth quarter of 2020 through an aggregate of approximately $5.6 million in cash and the issuance of 1,198,963 shares of the Company’s common stock.
Acquisitions
During the three months ended June 30, 2021, the Company acquired one multi-tenant, mixed use property for $72.5 million.
During the six months ended June 30, 2021, the Company acquired three multi-tenant retail-based properties for total acquisition volume of $111.0 million. These acquisitions represent a weighted average going-in cash cap rate of 8.5%.
Dispositions
During the three months ended June 30, 2021, the Company sold eight single tenant income properties for total disposition volume of $60.7 million, reflecting a weighted average exit cap rate of 7.1%. The sale of the properties generated aggregate gains of $4.6 million.
During the six months ended June 30, 2021, the Company sold ten, primarily single tenant income properties for total disposition volume of $65.5 million, reflecting a weighted average exit cap rate of 7.1%. The sale of the properties generated aggregate gains of $5.4 million.
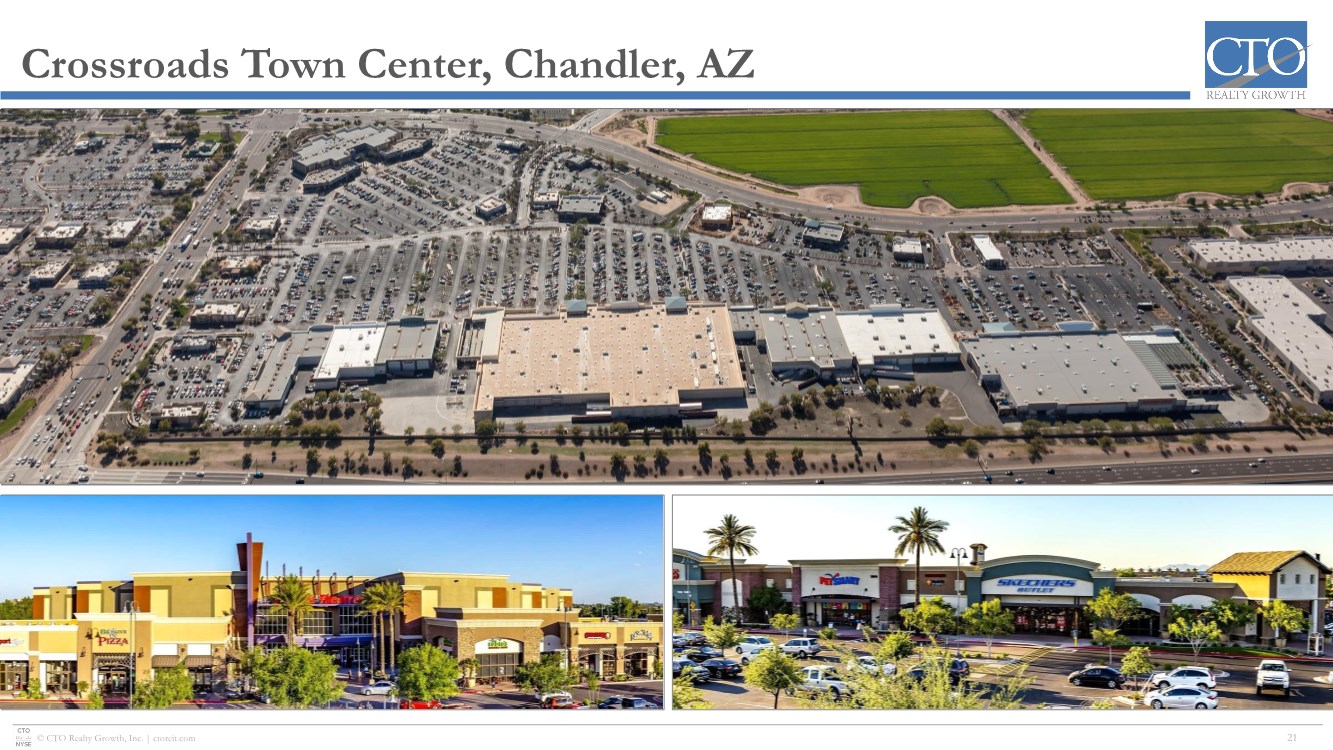
On July 14, 2021, the Company sold a property leased to Chick-fil-A for a sales price of $2.9 million, reflecting an exit cap rate of 4.5%. The property is an outparcel to Crossroads Towne Center, the Company’s multi-tenant income property located in Chandler, Arizona.
On July 27, 2021, the Company sold a property leased to JPMorgan Chase Bank for a sales price of $4.7 million, reflecting an exit cap rate of 4.6%. The property is also an outparcel to Crossroads Towne Center.
Income Property Portfolio
As of June 30, 2021, the Company’s portfolio had economic occupancy of 90.6% and physical occupancy of 90.4%.
The Company’s income property portfolio consisted of the following as of June 30, 2021:
Property Type |
| # of Properties |
| Square Feet |
| Weighted Average Remaining on Lease Term |
Single-Tenant (1) |
| 12 |
| 1,115 |
| 21.1 years |
Multi-Tenant |
| 8 |
| 1,566 |
| 6.3 years |
Total / Weighted Average Lease Term |
| 20 |
| 2,681 |
| 12.2 years |
| | | | | | |
% of Cash Rent attributable to Retail Tenants | 58% | | | |||
% of Cash Rent attributable to Office Tenants | 40% | | | |||
% of Cash Rent attributable to Hotel Ground Lease | 2% | | | |||
Square feet in thousands.
(1) | The 12 single-tenant properties include (i) a property leased to The Carpenter Hotel which is under a long-term ground lease and includes two tenant repurchase options and (ii) a property in Hialeah leased to a master tenant which includes three tenant repurchase options. Pursuant to FASB ASC Topic 842, Leases, the $16.3 and $21.0 million investments, respectively, have been recorded in the Company’s consolidated balance sheets as Commercial Loan and Master Lease Investments. |
Page 4
Operational Highlights
During the second quarter of 2021, CTO signed leases totaling 186,055 square feet. A summary of the Company’s leasing activity is as follows:
Retail |
| Square Feet | Weighted Average Lease Term | Cash Rent Per Square Foot | | Tenant Improvements | | Leasing Commissions | ||
New Leases | | 22.1 | | 9.9 years | | $ 21.08 | | $ 2,734 | | $ 146 |
Renewals & Extensions |
| 164.0 | | 5.3 years | | $ 8.98 | | 633 | | 23 |
Total / Weighted Average |
| 186.1 | | 6.4 years | | $ 10.42 | | $ 3,367 | | $ 169 |
In thousands except for per square foot and lease term data.
Land Joint Venture
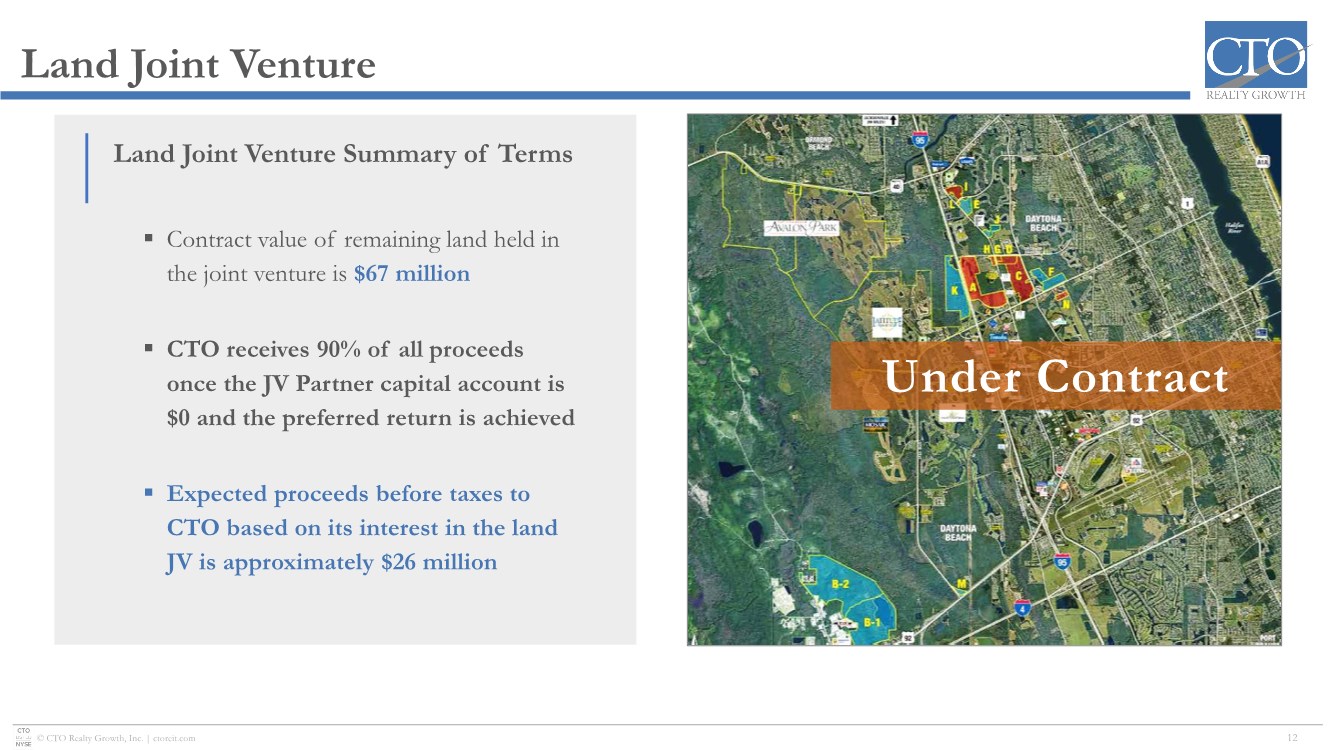
During the three months ended June 30, 2021, the Land JV entered into an agreement to sell its remaining land holdings, including any land previously under contract, for $67.0 million. The sale is anticipated to occur prior to the end of 2021.
Subsurface Interests
During the three months ended June 30, 2021, the Company sold approximately 9,300 acres of subsurface oil, gas and mineral rights for $0.7 million, resulting in a gain equal to the sales price.
During the six months ended June 30, 2021, the Company sold approximately 34,500 acres of subsurface oil, gas and mineral rights for $2.6 million, resulting in a gain on the sale of $2.5 million. As of June 30, 2021, the Company owns full or fractional subsurface oil, gas, and mineral interests underlying approximately 420,000 “surface” acres of land owned by others in 20 counties in Florida.
Capital Markets and Balance Sheet
During the three months ended June 30, 2021, the Company completed the following notable capital markets transactions:
| ◾ | On April 1, 2021, the Company filed a shelf registration statement on Form S-3, registering the possible issuance and sale of common stock, preferred stock, warrants, rights, and units with a maximum aggregate offering price of up to $350.0 million. |
| ◾ | On April 30, 2021, the Company implemented a $150.0 million “at-the-market” or ATM equity offering program (the “2021 ATM Program”) pursuant to which the Company may sell, from time to time, shares of the Company’s common stock. The Company was not active under the ATM Program during the six months ended June 30, 2021. |
| ◾ | On May 14, 2021, the Company repurchased $0.8 million aggregate principal amount of 2025 convertible senior notes. |
| ◾ | On June 28, 2021, the Company priced a public offering of 3,000,000 shares of its 6.375% Series A Cumulative Redeemable Preferred Stock at a public offering price of $25.00 per share. The offering closed on July 6, 2021 and generated total net proceeds to the Company of $72.4 million, which were utilized to pay down the Company’s revolving credit facility. |
| ◾ | On June 30, 2021, the Company’s $30.0 million mortgage note payable was assumed by PINE in connection with the Company’s sale of six net lease properties to PINE. |
Page 5
The following table provides a summary of the Company’s long-term debt, at face value, as of June 30, 2021:
| Principal |
| Interest Rate |
| Maturity Date | |
Revolving Credit Facility (1) |
| $100.0 million |
| 0.7325% + [1.35% – 1.95%] |
| May 2023 |
Revolving Credit Facility |
| $84.3 million |
| 30-day LIBOR + [1.35% - 1.95%] |
| May 2023 |
2025 Convertible Senior Notes |
| $61.7 million |
| 3.88% |
| April 2025 |
2026 Term Loan (2) |
| $65.0 million |
| 0.2200% + [1.35% – 1.95%] |
| March 2026 |
Total Debt / Weighted Average Interest Rate |
| $311.0 million |
| 2.27% |
|
|
(1) | Effective March 31, 2020, the Company utilized an interest rate swap to achieve a fixed LIBOR rate of 0.7325% plus the applicable spread on $100.0 million of the outstanding balance on the revolving credit facility. |
(2) | Effective March 10, 2021, the Company redesignated the interest rate swap that previously hedged $50.0 million of the outstanding balance on the revolving credit facility to $50.0 million principal balance on the term loan. |
Dividends
The Company paid a cash dividend for the second quarter of 2021 of $1.00 per share, on June 30, 2021 to stockholders of record as of the close of business on June 21, 2021.
The Company is revising its practice of declaring a quarterly cash common stock dividend concurrent with its quarterly earnings and instead anticipates announcing its quarterly cash common stock and Series A preferred stock dividends for the third quarter of 2021 and for future periods at the end of the second month of the respective quarter.
2021 Outlook
The Company has revised its outlook for 2021 to take into account the Company’s second quarter performance and the expected impact of the Company’s various investment activities and capital markets transactions, including the recent Series A preferred equity issuance.
The Company’s outlook for 2021, which does not include any potential tax expense or tax benefit related to the Company’s retained ownership in the Land JV, assumes continued improvement in economic activity, stable or positive business trends related to each of our tenants and other significant assumptions.
| 2021 Outlook | |||
| | | Low | High |
Acquisition of Income Producing Assets |
| $175.0 million | $225.0 million | |
Target Investment Initial Cash Yield |
| 7.25% | 7.50% | |
Disposition of Assets |
| $125.0 million | $150.0 million | |
Target Disposition Cash Yield |
| 5.75% | 6.25% | |
| | | | |
FFO Per Diluted Share | | | $3.65 | $3.85 |
AFFO Per Diluted Share | | | $4.00 | $4.20 |
| | | | |
Weighted Average Diluted Shares Outstanding | | | 6.0 million | 6.0 million |
Page 6
COVID-19 Pandemic
In March 2020, the World Health Organization declared the outbreak of the novel coronavirus as a pandemic (the “COVID-19 Pandemic”), which has spread throughout the United States. The impact of the COVID-19 Pandemic has evolved rapidly, with many jurisdictions taking drastic measures to limit the spread of the virus by instituting quarantines or lockdowns and imposing travel restrictions. Such actions have created significant disruptions to global supply chains, and adversely impacted several industries, including airlines, hospitality, retail and the broader real estate industry.
As a result of the approval of multiple COVID-19 vaccines for use and the distribution of such vaccines among the general population, a number of jurisdictions have reopened and loosened restrictions. However, wide disparities in vaccination rates and continued vaccine hesitancy, combined with the emergence of COVID-19 variants and surges in COVID-19 cases, could trigger the reinstatement of further restrictions. Such restrictions could include mandatory business shut-downs, travel restrictions, reduced business operations and social distancing requirements.
The future impact of the COVID-19 Pandemic on the real estate industry and the Company’s financial condition and results of operations is uncertain and cannot be predicted currently since it depends on several factors beyond the control of the Company, including, but not limited to: (i) the uncertainty surrounding the severity and duration of the COVID-19 Pandemic, including possible recurrences and differing economic and social impacts of the COVID-19 Pandemic in various regions of the United States; (ii) the effectiveness of the United States public health response; (iii) the COVID-19 Pandemic’s impact on the United States and global economies; (iv) the timing, scope and effectiveness of additional governmental responses to the COVID-19 Pandemic; (v) the availability of a treatment and effectiveness of vaccines approved for COVID-19 and the willingness of individuals to get vaccinated; (vi) changes in how certain types of commercial property are used while maintaining social distancing and other techniques intended to control the impact of COVID-19; (vii) the impact of phase out of economic stimulus measures, the inflationary pressure of economic stimulus, and the eventual halt and reversal by the U.S. Treasury of asset purchases; and (viii) the uneven impact on the Company’s tenants, real estate values and cost of capital.
2nd Quarter Earnings Conference Call & Webcast
The Company will host a conference call to present its operating results for the quarter ended June 30, 2021, on Friday, July 30, 2021, at 9:00 AM ET. Stockholders and interested parties may access the earnings call via teleconference or webcast:
Teleconference: USA (Toll Free)1-888-317-6003
International: 1-412-317-6061
Canada (Toll Free): 1-866-284-3684
Please dial in at least fifteen minutes prior to the scheduled start time and use the code 7119381 when prompted.
A webcast of the call can be accessed at: https://services.choruscall.com/links/cto210730.html.
To access the webcast, log on to the web address noted above or go to http://www.ctoreit.com and log in at the investor relations section. Please log in to the webcast at least ten minutes prior to the scheduled time of the Earnings Call.
About CTO Realty Growth, Inc.
CTO Realty Growth, Inc. is a publicly traded real estate investment trust that owns and operates a portfolio of high-quality, retail-based properties located primarily in higher growth markets in the United States. CTO also owns an approximate 16% interest in Alpine Income Property Trust, Inc. (NYSE: PINE), a publicly traded net lease REIT.
We encourage you to review our most recent investor presentation, which is available on our website at www.ctoreit.com.
Page 7
Safe Harbor
Certain statements contained in this press release (other than statements of historical fact) are forward-looking statements within the meaning of Section 27A of the Securities Act of 1933, as amended and Section 21E of the Securities Exchange Act of 1934, as amended. Forward-looking statements can typically be identified by words such as “believe,” “estimate,” “expect,” “intend,” “anticipate,” “will,” “could,” “may,” “should,” “plan,” “potential,” “predict,” “forecast,” “project,” and similar expressions, as well as variations or negatives of these words.
Although forward-looking statements are made based upon management’s present expectations and reasonable beliefs concerning future developments and their potential effect upon the Company, a number of factors could cause the Company’s actual results to differ materially from those set forth in the forward-looking statements. Such factors may include, but are not limited to: the Company’s ability to remain qualified as a REIT; the Company’s exposure to U.S. federal and state income tax law changes, including changes to the REIT requirements; general adverse economic and real estate conditions; the ultimate geographic spread, severity and duration of pandemics such as the recent outbreak of the novel coronavirus, actions that may be taken by governmental authorities to contain or address the impact of such pandemics, and the potential negative impacts of such pandemics on the global economy and the Company’s financial condition and results of operations; the inability of major tenants to continue paying their rent or obligations due to bankruptcy, insolvency or a general downturn in their business; the loss or failure, or decline in the business or assets of PINE or the venture formed when the Company sold its controlling interest in the entity that owned the Company’s remaining land portfolio, of which the Company has a retained interest; the completion of 1031 exchange transactions; the availability of investment properties that meet the Company’s investment goals and criteria; the uncertainties associated with obtaining required governmental permits and satisfying other closing conditions for planned acquisitions and sales; and the uncertainties and risk factors discussed in the Company’s Annual Report on Form 10-K for the fiscal year ended December 31, 2020 and other risks and uncertainties discussed from time to time in the Company’s filings with the U.S. Securities and Exchange Commission.
There can be no assurance that future developments will be in accordance with management’s expectations or that the effect of future developments on the Company will be those anticipated by management. Readers are cautioned not to place undue reliance on these forward-looking statements, which speak only as of the date of this press release. The Company undertakes no obligation to update the information contained in this press release to reflect subsequently occurring events or circumstances.
Non-GAAP Financial Measures
Our reported results are presented in accordance with GAAP. We also disclose Funds From Operations (“FFO”) and Adjusted Funds From Operations (“AFFO”), both of which are non-GAAP financial measures. We believe these two non-GAAP financial measures are useful to investors because they are widely accepted industry measures used by analysts and investors to compare the operating performance of REITs.
FFO and AFFO do not represent cash generated from operating activities and are not necessarily indicative of cash available to fund cash requirements; accordingly, they should not be considered alternatives to net income as a performance measure or cash flows from operating activities as reported on our statement of cash flows as a liquidity measure and should be considered in addition to, and not in lieu of, GAAP financial measures.
We compute FFO in accordance with the definition adopted by the Board of Governors of the National Association of Real Estate Investment Trusts, or NAREIT. NAREIT defines FFO as GAAP net income or loss adjusted to exclude extraordinary items (as defined by GAAP), net gain or loss from sales of depreciable real estate assets, impairment write-downs associated with depreciable real estate assets and real estate related depreciation and amortization, including the pro rata share of such adjustments of unconsolidated subsidiaries. The Company also excludes the gains or losses from sales of assets incidental to the primary business of the REIT which specifically include the sales of mitigation credits, impact fee credits, subsurface sales, and the land sales gains included in discontinued operations. To derive AFFO, we modify the NAREIT computation of FFO to include other adjustments to GAAP net income related to non-cash revenues and expenses such as straight-line rental revenue, amortization of deferred financing costs, amortization of capitalized lease incentives and above- and below-market lease related intangibles, and non-cash compensation. Such items may cause short-term fluctuations in net income
Page 8
but have no impact on operating cash flows or long-term operating performance. We use AFFO as one measure of our performance when we formulate corporate goals.
FFO is used by management, investors and analysts to facilitate meaningful comparisons of operating performance between periods and among our peers primarily because it excludes the effect of real estate depreciation and amortization and net gains on sales, which are based on historical costs and implicitly assume that the value of real estate diminishes predictably over time, rather than fluctuating based on existing market conditions. We believe that AFFO is an additional useful supplemental measure for investors to consider because it will help them to better assess our operating performance without the distortions created by other non-cash revenues or expenses. FFO and AFFO may not be comparable to similarly titled measures employed by other companies.
Page 9
CTO Realty Growth, Inc.
Consolidated Balance Sheets
(In thousands, except share and per share data)
|
| As of | ||||
|
| (Unaudited) |
| December 31, 2020 | ||
ASSETS |
|
|
|
|
|
|
Real Estate: |
|
|
|
|
|
|
Land, at cost |
| $ | 172,304 |
| $ | 166,512 |
Building and Improvements, at cost |
|
| 320,769 |
|
| 305,614 |
Other Furnishings and Equipment, at cost |
|
| 682 |
|
| 672 |
Construction in Process, at cost |
|
| 1,351 |
|
| 323 |
Total Real Estate, at cost |
|
| 495,106 |
|
| 473,121 |
Less, Accumulated Depreciation |
|
| (31,211) |
|
| (30,737) |
Real Estate—Net |
|
| 463,895 |
|
| 442,384 |
Land and Development Costs |
|
| 6,684 |
|
| 7,083 |
Intangible Lease Assets—Net |
|
| 71,470 |
|
| 50,176 |
Assets Held for Sale |
|
| 3,720 |
|
| 833 |
Investment in Joint Ventures |
|
| 32,497 |
|
| 48,677 |
Investment in Alpine Income Property Trust, Inc. |
|
| 38,794 |
|
| 30,574 |
Mitigation Credits |
|
| 2,621 |
|
| 2,622 |
Commercial Loan and Master Lease Investments |
|
| 38,884 |
|
| 38,320 |
Cash and Cash Equivalents |
|
| 4,701 |
|
| 4,289 |
Restricted Cash |
|
| 13,918 |
|
| 29,536 |
Refundable Income Taxes | | | 599 | | | 26 |
Deferred Income Taxes—Net | | | 473 | | | — |
Other Assets |
|
| 11,616 |
|
| 12,180 |
Total Assets |
| $ | 689,872 |
| $ | 666,700 |
LIABILITIES AND STOCKHOLDERS’ EQUITY |
|
| |
|
|
|
Liabilities: |
|
| |
|
|
|
Accounts Payable |
| $ | 1,332 |
| $ | 1,047 |
Accrued and Other Liabilities |
|
| 11,437 |
|
| 9,090 |
Deferred Revenue |
|
| 4,036 |
|
| 3,319 |
Intangible Lease Liabilities—Net |
|
| 22,459 |
|
| 24,163 |
Liabilities Held for Sale |
|
| 831 |
|
| 831 |
Deferred Income Taxes—Net |
|
| — |
|
| 3,521 |
Long-Term Debt |
|
| 304,886 |
|
| 273,830 |
Total Liabilities |
|
| 344,981 |
|
| 315,801 |
Commitments and Contingencies |
|
| |
|
|
|
Stockholders’ Equity: |
|
| |
|
|
|
Preferred Stock – 100,000,000 shares authorized; $0.01 par value, no shares issued or outstanding at June 30, 2021; 50,000 shares authorized; $100.00 par value, no shares issued or outstanding at December 31, 2020 | | | — |
|
| — |
Common Stock – 500,000,000 shares authorized; $0.01 par value, 5,955,154 shares issued and outstanding at June 30, 2021; 25,000,000 shares authorized; $1.00 par value, 7,310,680 shares issued and 5,915,756 shares outstanding at December 31, 2020 |
|
| 60 |
|
| 7,250 |
Treasury Stock – 0 shares at June 30, 2021 and 1,394,924 shares at December 31, 2020 |
|
| — |
|
| (77,541) |
Additional Paid-In Capital |
|
| 13,676 |
|
| 83,183 |
Retained Earnings |
|
| 331,895 |
|
| 339,917 |
Accumulated Other Comprehensive Loss |
|
| (740) |
|
| (1,910) |
Total Stockholders’ Equity |
|
| 344,891 |
|
| 350,899 |
Total Liabilities and Stockholders’ Equity |
| $ | 689,872 |
| $ | 666,700 |
Page 10
CTO Realty Growth, Inc.
Consolidated Statements of Operations
(Unaudited, in thousands, except share, per share and dividend data)
| Three Months Ended |
| Six Months Ended | ||||||||
Revenues |
|
|
|
|
|
|
|
|
|
|
|
Income Properties | $ | 11,574 | | $ | 11,473 | | $ | 23,023 | | $ | 22,476 |
Management Fee Income |
| 752 | |
| 695 | |
| 1,421 | |
| 1,397 |
Interest Income from Commercial Loan and Master Lease Investments |
| 709 | |
| 835 | |
| 1,410 | |
| 1,887 |
Real Estate Operations |
| 1,248 | |
| 7 | |
| 3,141 | |
| 88 |
Total Revenues |
| 14,283 | |
| 13,010 | |
| 28,995 | |
| 25,848 |
Direct Cost of Revenues |
| | |
| | |
| | |
| |
Income Properties |
| (2,787) | |
| (2,568) | |
| (5,704) | |
| (4,681) |
Real Estate Operations |
| (533) | |
| (57) | |
| (615) | |
| (1,581) |
Total Direct Cost of Revenues |
| (3,320) | |
| (2,625) | |
| (6,319) | |
| (6,262) |
General and Administrative Expenses |
| (2,665) | |
| (2,171) | |
| (5,797) | |
| (5,263) |
Impairment Charges |
| (16,527) | |
| — | |
| (16,527) | |
| (1,905) |
Depreciation and Amortization |
| (5,031) | |
| (5,021) | |
| (9,861) | |
| (9,573) |
Total Operating Expenses |
| (27,543) | |
| (9,817) | |
| (38,504) | |
| (23,003) |
Gain on Disposition of Assets |
| 4,732 | |
| 7,076 | |
| 5,440 | |
| 7,076 |
Gain (Loss) on Extinguishment of Debt |
| (641) | |
| 504 | |
| (641) | |
| 1,141 |
Other Gains and Income |
| 4,091 | |
| 7,580 | |
| 4,799 | |
| 8,217 |
Total Operating Income (Loss) |
| (9,169) | |
| 10,773 | |
| (4,710) | |
| 11,062 |
Investment and Other Income (Loss) |
| 3,903 | |
| 8,470 | |
| 9,235 | |
| (4,716) |
Interest Expense |
| (2,421) | |
| (2,453) | |
| (4,865) | |
| (5,906) |
Income (Loss) from Operations Before Income Tax Benefit (Expense) |
| (7,687) | |
| 16,790 | |
| (340) | |
| 440 |
Income Tax Benefit (Expense) |
| 3,963 | |
| (4,179) | |
| 4,401 | |
| (91) |
Net Income (Loss) | $ | (3,724) | | $ | 12,611 | | $ | 4,061 | | $ | 349 |
| | | | | | | | | | | |
Per Share Information: | | | | | | | | | | | |
Basic and Diluted | $ | (0.63) | | $ | 2.71 | | $ | 0.69 | | $ | 0.07 |
|
|
| |
|
| |
|
| |
|
|
Weighted Average Number of Common Shares: | | | | | | | | | | | |
Basic | | 5,898,280 | | | 4,653,627 | | | 5,888,735 | | | 4,682,511 |
Diluted | | 5,898,280 | | | 4,653,627 | | | 5,888,735 | | | 4,682,511 |
|
|
| |
|
| |
|
| |
|
|
Dividends Declared and Paid | $ | 1.00 | | $ | 0.25 | | $ | 2.00 | | $ | 0.50 |
Page 11
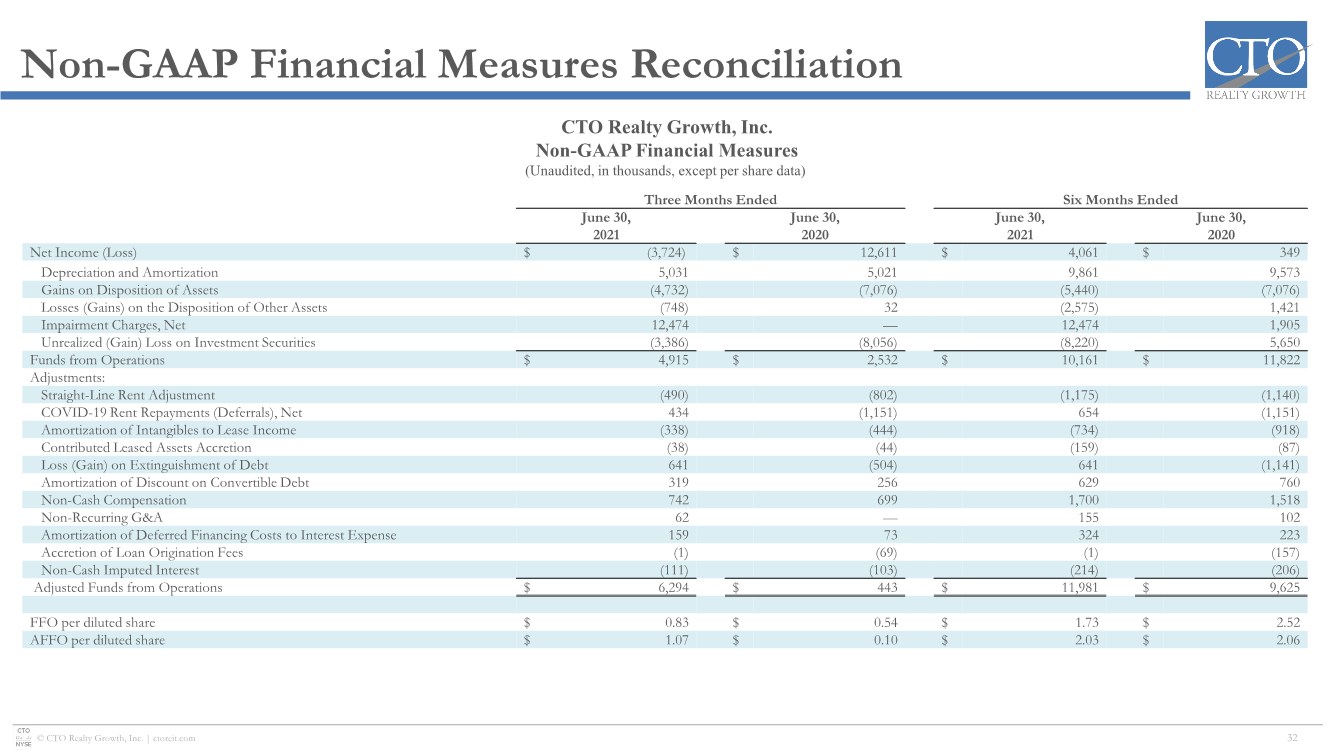
Non-GAAP Financial Measures
(Unaudited, in thousands, except per share data)
| Three Months Ended |
| Six Months Ended | ||||||||
Net Income (Loss) | $ | (3,724) |
| $ | 12,611 |
| $ | 4,061 |
| $ | 349 |
Depreciation and Amortization | 5,031 |
| 5,021 |
| 9,861 |
| 9,573 | ||||
Gains on Disposition of Assets |
| (4,732) |
|
| (7,076) |
|
| (5,440) |
|
| (7,076) |
Losses (Gains) on the Disposition of Other Assets |
| (748) |
|
| 32 |
|
| (2,575) |
|
| 1,421 |
Impairment Charges, Net |
| 12,474 |
|
| — |
|
| 12,474 |
|
| 1,905 |
Unrealized (Gain) Loss on Investment Securities |
| (3,386) |
|
| (8,056) |
|
| (8,220) |
|
| 5,650 |
Funds from Operations | $ | 4,915 | | $ | 2,532 | | $ | 10,161 | | $ | 11,822 |
Adjustments: |
| | | | | | | | | | |
Straight-Line Rent Adjustment |
| (490) |
|
| (802) |
|
| (1,175) |
|
| (1,140) |
COVID-19 Rent Repayments (Deferrals), Net |
| 434 |
|
| (1,151) |
|
| 654 |
|
| (1,151) |
Amortization of Intangibles to Lease Income |
| (338) |
|
| (444) |
|
| (734) |
|
| (918) |
Contributed Leased Assets Accretion |
| (38) |
|
| (44) |
|
| (159) |
|
| (87) |
Loss (Gain) on Extinguishment of Debt |
| 641 |
|
| (504) |
|
| 641 |
|
| (1,141) |
Amortization of Discount on Convertible Debt |
| 319 |
|
| 256 |
|
| 629 |
|
| 760 |
Non-Cash Compensation |
| 742 |
|
| 699 |
|
| 1,700 |
|
| 1,518 |
Non-Recurring G&A |
| 62 |
|
| — |
|
| 155 |
|
| 102 |
Amortization of Deferred Financing Costs to Interest Expense |
| 159 |
|
| 73 |
|
| 324 |
|
| 223 |
Accretion of Loan Origination Fees |
| (1) |
|
| (69) |
|
| (1) |
|
| (157) |
Non-Cash Imputed Interest |
| (111) |
|
| (103) |
|
| (214) |
|
| (206) |
Adjusted Funds from Operations | $ | 6,294 |
| $ | 443 |
| $ | 11,981 |
| $ | 9,625 |
| | | | | | | | | | | |
FFO per diluted share | $ | 0.83 |
| $ | 0.54 |
| $ | 1.73 |
| $ | 2.52 |
AFFO per diluted share | $ | 1.07 |
| $ | 0.10 |
| $ | 2.03 |
| $ | 2.06 |
Page 12
Exhibit 99.2
| Investor Presentation July 2021 REALTY GROWTH NYSE: CTO |

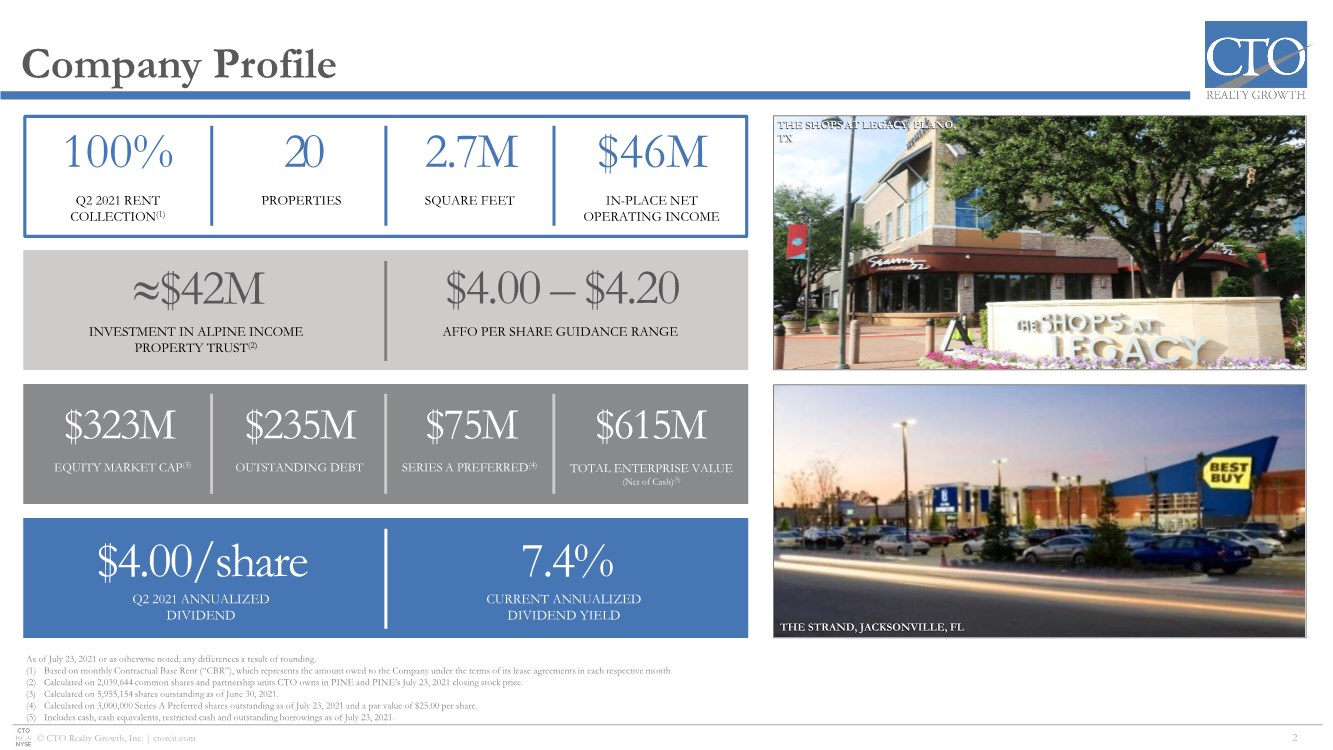
| © CTO Realty Growth, Inc. | ctoreit.com Company Profile 2 As of July 23, 2021 or as otherwise noted; any differences a result of rounding. (1) Based on monthly Contractual Base Rent (“CBR”), which represents the amount owed to the Company under the terms of its lease agreements in each respective month. (2) Calculated on 2,039,644 common shares and partnership units CTO owns in PINE and PINE’s July 23, 2021 closing stock price. (3) Calculated on 5,955,154 shares outstanding as of June 30, 2021. (4) Calculated on 3,000,000 Series A Preferred shares outstanding as of July 23, 2021 and a par value of $25.00 per share. (5) Includes cash, cash equivalents, restricted cash and outstanding borrowings as of July 23, 2021. $42M INVESTMENT IN ALPINE INCOME PROPERTY TRUST(2) $4.00 – $4.20 AFFO PER SHARE GUIDANCE RANGE 20 2.7M $46M PROPERTIES SQUARE FEET IN-PLACE NET OPERATING INCOME 100% Q2 2021 RENT COLLECTION(1) Q2 2021 ANNUALIZED DIVIDEND $4.00/share 7.4% CURRENT ANNUALIZED DIVIDEND YIELD THE STRAND, JACKSONVILLE, FL THE SHOPS AT LEGACY, PLANO, TX $323M $235M $615M EQUITY MARKET CAP(3) OUTSTANDING DEBT TOTAL ENTERPRISE VALUE (Net of Cash)(5) SERIES A PREFERRED(4) $75M |
| © CTO Realty Growth, Inc. | ctoreit.com Key Takeaways 3 Significant Discount to the Peer Group Meaningful potential upside in valuation as CTO has the lowest 2021E FFO multiple of its retail and diversified peer group. Earnings Growth Through Capital Recycling Strong, long-term track record of monetizing assets at favorable net investment spreads to drive accretive earnings growth and attractive risk-adjusted returns. Attractive Dividend and Improving Payout Ratio CTO pays a $1.00 quarterly cash dividend, representing a 7.4% in-place annualized yield and a quickly improving AFFO payout ratio driven by the monetization and reinvestment of low cap rate, single tenant properties and non-income producing assets. Differentiated Investment Strategy Diversified, retail-based investment strategy focused on value-add properties with strong real estate fundamentals in growing markets that can be acquired at meaningful discounts to replacement cost. High-Quality Portfolio in Faster Growing, Business Friendly Locations with Operational Upside Recently constructed real estate portfolio with a durable, stable tenant base located in faster growing, business friendly states such as Florida, Texas and Georgia, and with acquired vacancy that represents notable leasing and/or repositioning upside. Profitable External Investment Management External management of Alpine Income Property Trust, Inc. (NYSE: PINE), a high-growth, publicly traded, single tenant net lease REIT, provides excellent in-place cash flow and significant upside through the CTO’s 16% retained ownership position. Conservative Balance Sheet Balance sheet with ample liquidity, no near-term debt maturities and a demonstrated access to multiple capital sources provides financial stability and flexibility. As of July 29, 2021 or as otherwise noted. |
| © CTO Realty Growth, Inc. | ctoreit.com Year-to-Date 2021 Highlights 4 Accretive Investment Activity ▪ Under contract to sell the remaining land in the Daytona Beach Land Joint Venture for $67.0 million; total net proceeds to CTO expected to be $25.6 million before taxes ▪ Acquired 3 properties for $111.0 million at an 8.5% weighted-average going-in cash cap rate in submarkets of Salt Lake City, UT; Las Vegas, NV; and Dallas, TX ▪ Sold 10 properties (9 single tenant) for $65.5 million at a 7.1% weighted-average exit cap rate ▪ Sold 34,500 acres of subsurface interests for $2.6 million in the first half of 2021 ▪ Non-cash, unrealized gain of $8.2 million on the mark-to-market of the investment in PINE Attractive and Well-Performing Portfolio ▪ Collected an average of 100% of Contractual Base Rents for the first six months of 2021 ▪ Signed 318,100 SF of new leases, extensions and renewals in the first half of 2021 ▪ 91% occupied portfolio in high-growth, business friendly markets, with increasing occupancy driven by recent leasing activity ▪ 90% of Annualized Base Rent comes from metropolitan statistical areas with more than one million people Strong Financial Performance ▪ Reported Q2 2021 AFFO per share of $1.07 and year-to-date Q2 2021 AFFO per share of $2.03 ▪ Completed inaugural perpetual preferred 6.375% Series A equity issuance in July 2021, for net proceeds of $72.4 million ▪ Originated a new 5-year, $65 million term (Q1 $50 million; Q2 $15 million) loan at an initial interest rate of 1.70% ▪ Paid and announced a $1.00 per share regular quarterly cash dividend for Q1 2021 and Q2 2021, respectively As of July 29, 2021 or as otherwise noted; any differences a result of rounding. |
| © CTO Realty Growth, Inc. | ctoreit.com Experienced Management Team CTO Realty Growth is led by an experienced management team with meaningful shareholder alignment, deep industry relationships and a strong long-term track record. 5 John P. Albright President & Chief Executive Officer ▪ Former Co-Head and Managing Director of Archon Capital, a Goldman Sachs Company; Executive Director of Merchant Banking – Investment Management at Morgan Stanley; and Managing Director of Crescent Real Estate (NYSE: CEI) Daniel E. Smith Senior Vice President, General Counsel & Corporate Secretary ▪ Former Vice President and Associate General Counsel of Goldman Sachs & Co. and Senior Vice President and General Counsel of Crescent Real Estate (NYSE: CEI) Lisa M. Vorakoun Vice President & Chief Accounting Officer ▪ Former Assistant Finance Director for the City of DeLand, Florida and Audit Manager for James Moore & Company, an Accounting and Consulting Firm Helal A. Ismail Vice President – Investments ▪ Former Associate of Jefferies Real Estate Gaming and Lodging Investment Banking and Manager at B-MAT Homes, Inc. Matthew M. Partridge Senior Vice President, Chief Financial Officer & Treasurer ▪ Former Chief Operating Officer and Chief Financial Officer of Hutton; Executive Vice President, Chief Financial Officer and Secretary of Agree Realty Corporation (NYSE: ADC); and Vice President of Finance for Pebblebrook Hotel Trust (NYSE: PEB) Steven R. Greathouse Senior Vice President & Chief Investment Officer ▪ Former Director of Finance for N3 Real Estate; Senior Associate of Merchant Banking – Investment Management at Morgan Stanley; and Senior Associate at Crescent Real Estate (NYSE: CEI) E. Scott Bullock Vice President – Real Estate ▪ Former Managing Director of Corporate Development for International Speedway Corporation; Senior Development Manager of Crescent Resources LLC; Development Manager of Pritzker Realty Group, L.P.; and Project Engineer for Walt Disney Imagineering. |

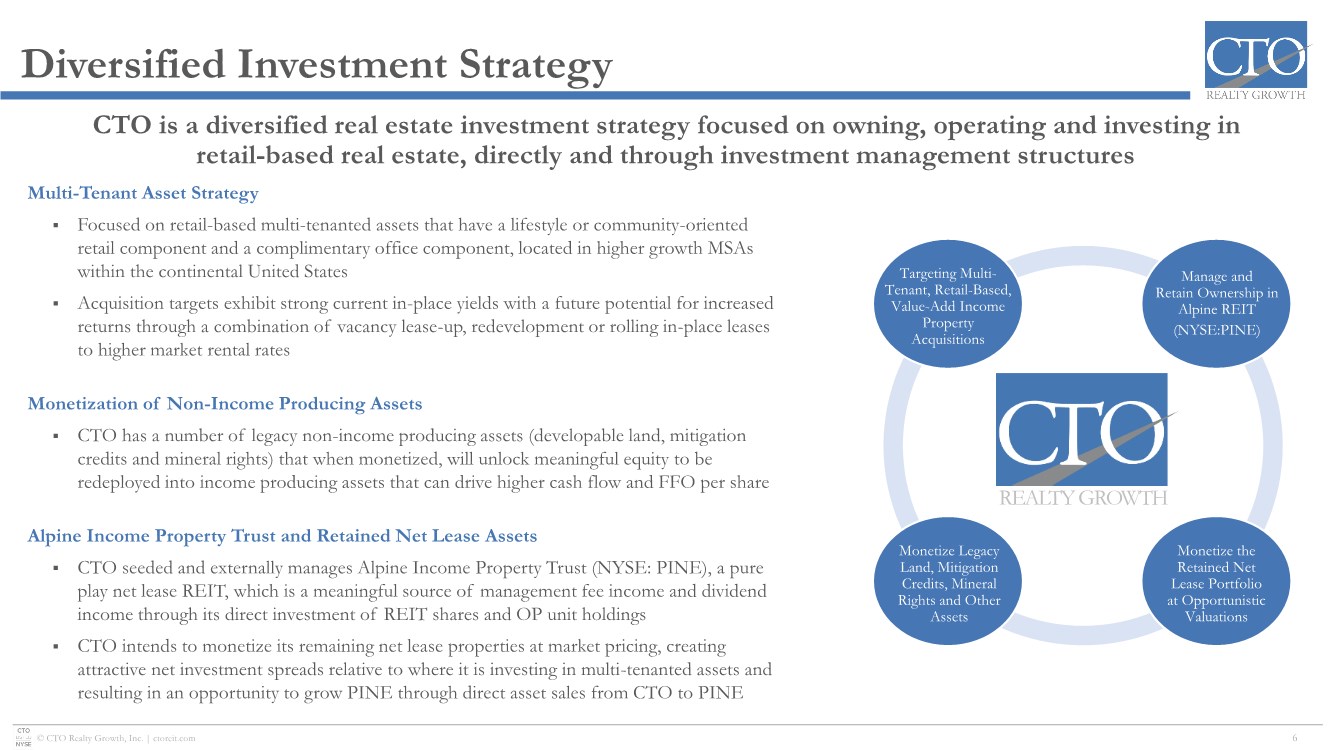
| © CTO Realty Growth, Inc. | ctoreit.com Diversified Investment Strategy 6 CTO is a diversified real estate investment strategy focused on owning, operating and investing in retail-based real estate, directly and through investment management structures Multi-Tenant Asset Strategy ▪ Focused on retail-based multi-tenanted assets that have a lifestyle or community-oriented retail component and a complimentary office component, located in higher growth MSAs within the continental United States ▪ Acquisition targets exhibit strong current in-place yields with a future potential for increased returns through a combination of vacancy lease-up, redevelopment or rolling in-place leases to higher market rental rates Monetization of Non-Income Producing Assets ▪ CTO has a number of legacy non-income producing assets (developable land, mitigation credits and mineral rights) that when monetized, will unlock meaningful equity to be redeployed into income producing assets that can drive higher cash flow and FFO per share Alpine Income Property Trust and Retained Net Lease Assets ▪ CTO seeded and externally manages Alpine Income Property Trust (NYSE: PINE), a pure play net lease REIT, which is a meaningful source of management fee income and dividend income through its direct investment of REIT shares and OP unit holdings ▪ CTO intends to monetize its remaining net lease properties at market pricing, creating attractive net investment spreads relative to where it is investing in multi-tenanted assets and resulting in an opportunity to grow PINE through direct asset sales from CTO to PINE REALTY GROWTH Targeting Multi- Tenant, Retail-Based, Value-Add Income Property Acquisitions Monetize Legacy Land, Mitigation Credits, Mineral Rights and Other Assets Monetize the Retained Net Lease Portfolio at Opportunistic Valuations Manage and Retain Ownership in Alpine REIT (NYSE:PINE) |
| © CTO Realty Growth, Inc. | ctoreit.com Real Estate Strategy CTO’s investment strategy is focused on generating relative outsized returns for our shareholders through a combination of accretive acquisitions and dispositions, asset-level value creation, acquiring at meaningful discounts to replacement cost, and sustainably growing organizational level cash flow. Diversified asset investment strategy Markets that project to have above-average job and population growth; states with favorable business climates Large single tenant asset portfolio identified for future disposition to fund new investments Primary focus on value-add retail and mixed-use properties with strong real estate fundamentals Seek properties with leasing or repositioning upside or highly stable assets with an identifiable opportunity to drive long-term, outsized risk-adjusted returns Acquiring at meaningful discounts to replacement cost and below market rents Miami Orlando Jacksonville Tampa Atlanta Nashville Charlotte Raleigh-Durham Washington, DC Dallas Houston Austin Denver Boulder Salt Lake City Las Vegas Reno Phoenix 7 |

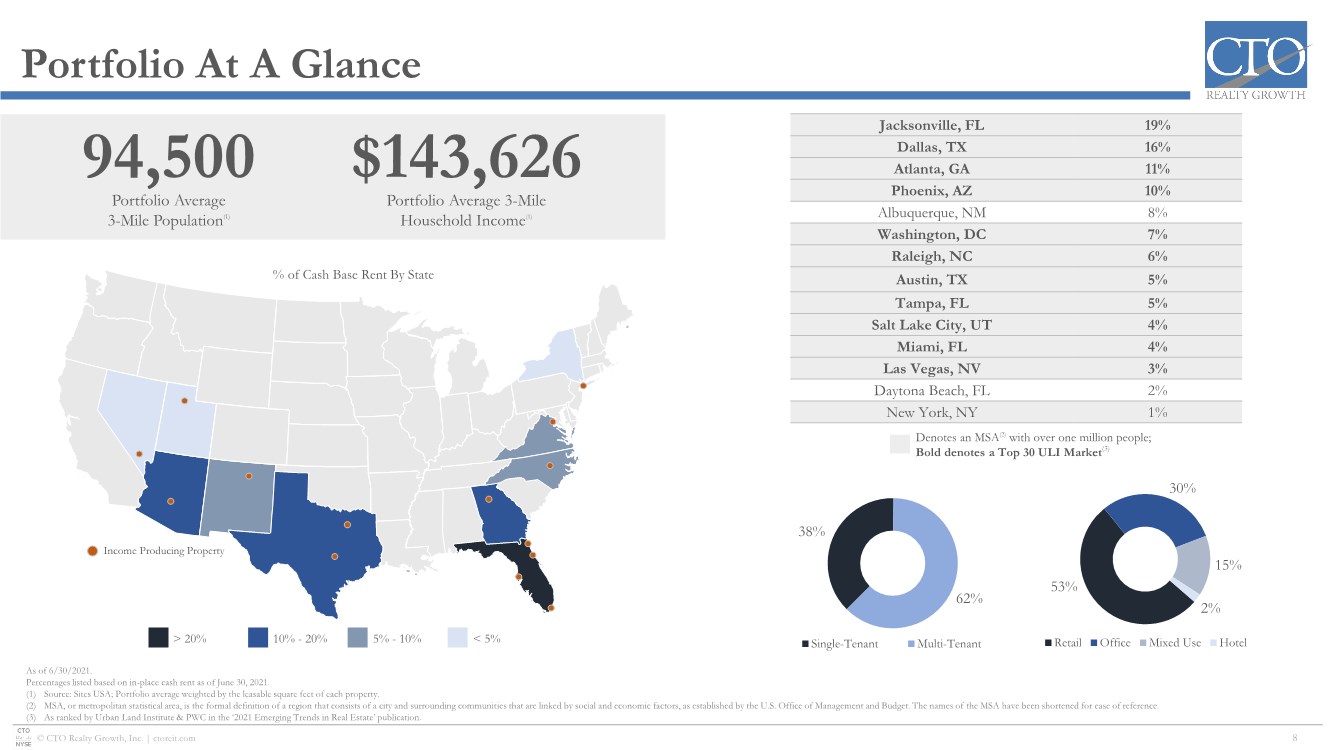
| © CTO Realty Growth, Inc. | ctoreit.com 53% 30% 15% 2% Retail Office Mixed Use Hotel Portfolio At A Glance 8 38% 62% Single-Tenant Multi-Tenant As of 6/30/2021. Percentages listed based on in-place cash rent as of June 30, 2021. (1) Source: Sites USA; Portfolio average weighted by the leasable square feet of each property. (2) MSA, or metropolitan statistical area, is the formal definition of a region that consists of a city and surrounding communities that are linked by social and economic factors, as established by the U.S. Office of Management and Budget. The names of the MSA have been shortened for ease of reference. (3) As ranked by Urban Land Institute & PWC in the ‘2021 Emerging Trends in Real Estate’ publication. Income Producing Property Jacksonville, FL 19% Dallas, TX 16% Atlanta, GA 11% Phoenix, AZ 10% Albuquerque, NM 8% Washington, DC 7% Raleigh, NC 6% Austin, TX 5% Tampa, FL 5% Salt Lake City, UT 4% Miami, FL 4% Las Vegas, NV 3% Daytona Beach, FL 2% New York, NY 1% > 20% 10% - 20% 5% - 10% < 5% Denotes an MSA(2) with over one million people; Bold denotes a Top 30 ULI Market(3) % of Cash Base Rent By State 94,500 Portfolio Average 3-Mile Population(1) $143,626 Portfolio Average 3-Mile Household Income(1) |
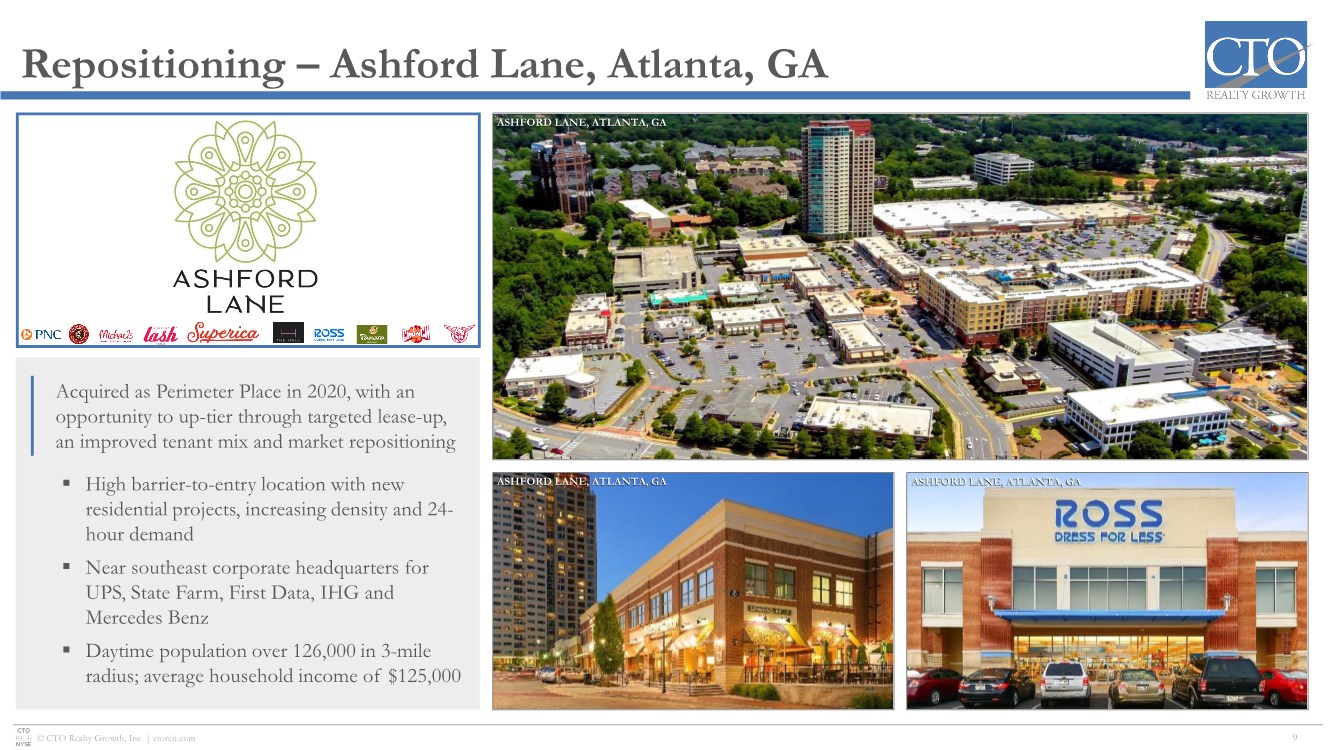
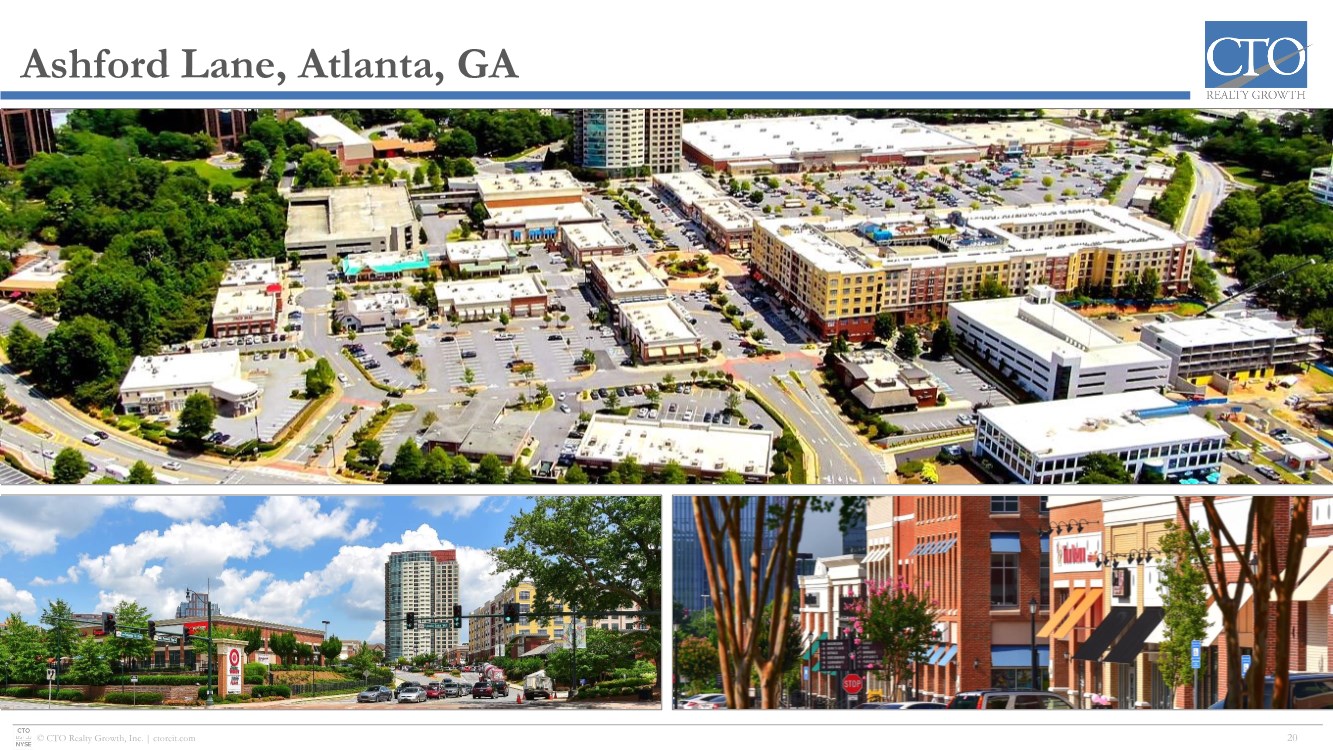
| © CTO Realty Growth, Inc. | ctoreit.com Repositioning – Ashford Lane, Atlanta, GA 9 Acquired as Perimeter Place in 2020, with an opportunity to up-tier through targeted lease-up, an improved tenant mix and market repositioning ▪ High barrier-to-entry location with new residential projects, increasing density and 24- hour demand ▪ Near southeast corporate headquarters for UPS, State Farm, First Data, IHG and Mercedes Benz ▪ Daytime population over 126,000 in 3-mile radius; average household income of $125,000 ASHFORD LANE, ATLANTA, GA ASHFORD LANE, ATLANTA, GA ASHFORD LANE, ATLANTA, GA T H E H A L L |
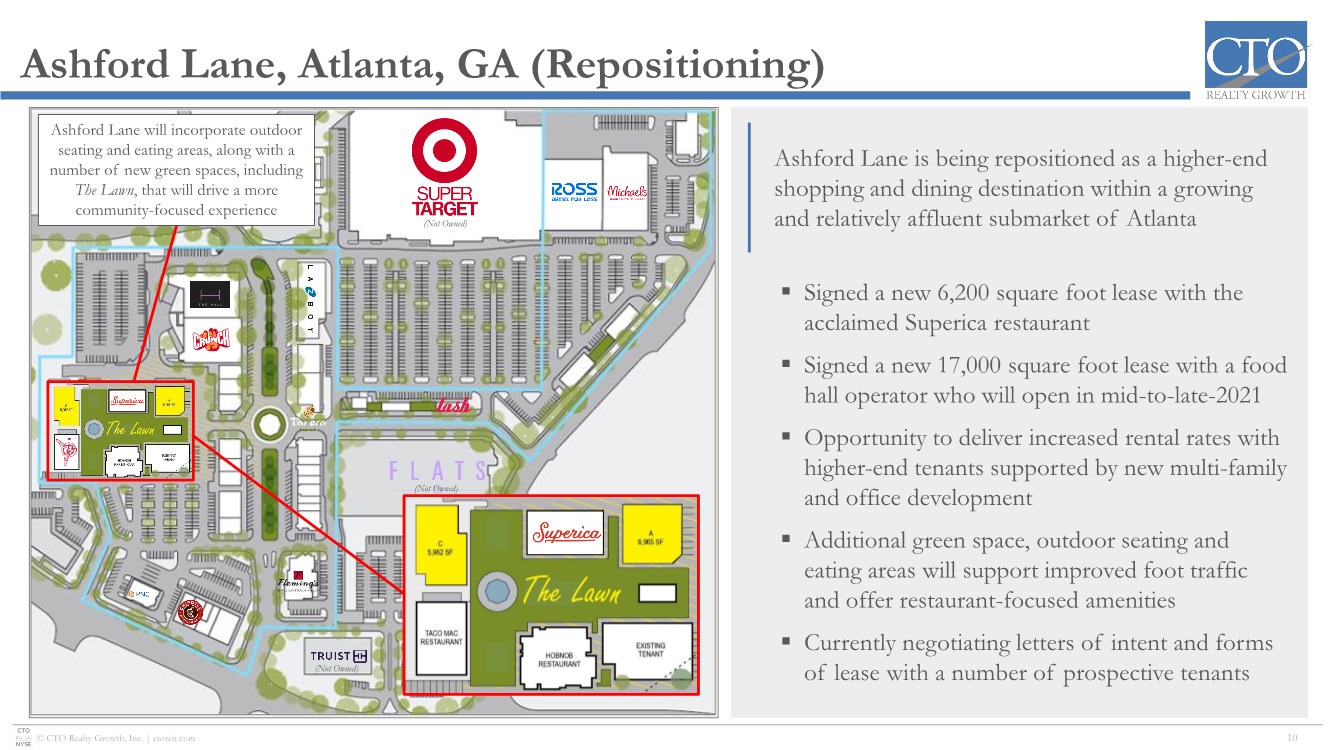
| © CTO Realty Growth, Inc. | ctoreit.com Ashford Lane, Atlanta, GA (Repositioning) 10 Ashford Lane will incorporate outdoor seating and eating areas, along with a number of new green spaces, including The Lawn, that will drive a more community-focused experience Ashford Lane is being repositioned as a higher-end shopping and dining destination within a growing and relatively affluent submarket of Atlanta ▪ Signed a new 6,200 square foot lease with the acclaimed Superica restaurant ▪ Signed a new 17,000 square foot lease with a food hall operator who will open in mid-to-late-2021 ▪ Opportunity to deliver increased rental rates with higher-end tenants supported by new multi-family and office development ▪ Additional green space, outdoor seating and eating areas will support improved foot traffic and offer restaurant-focused amenities ▪ Currently negotiating letters of intent and forms of lease with a number of prospective tenants (Not Owned) T H E H A L L (Not Owned) (Not Owned) |
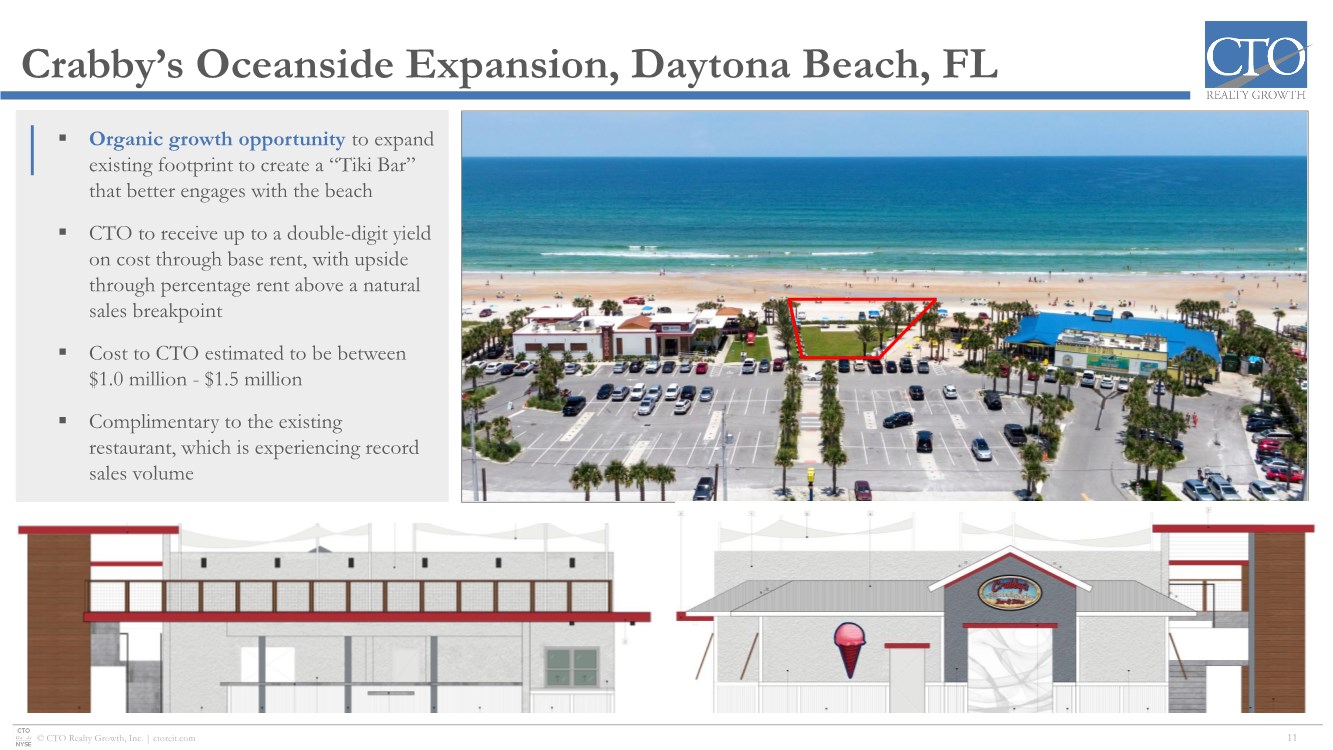
| © CTO Realty Growth, Inc. | ctoreit.com Crabby’s Oceanside Expansion, Daytona Beach, FL 11 ▪ Organic growth opportunity to expand existing footprint to create a “Tiki Bar” that better engages with the beach ▪ CTO to receive up to a double-digit yield on cost through base rent, with upside through percentage rent above a natural sales breakpoint ▪ Cost to CTO estimated to be between $1.0 million - $1.5 million ▪ Complimentary to the existing restaurant, which is experiencing record sales volume |
| © CTO Realty Growth, Inc. | ctoreit.com Land Joint Venture 12 Land Joint Venture Summary of Terms ▪ Contract value of remaining land held in the joint venture is $67 million ▪ CTO receives 90% of all proceeds once the JV Partner capital account is $0 and the preferred return is achieved ▪ Expected proceeds before taxes to CTO based on its interest in the land JV is approximately $26 million Under Contract |
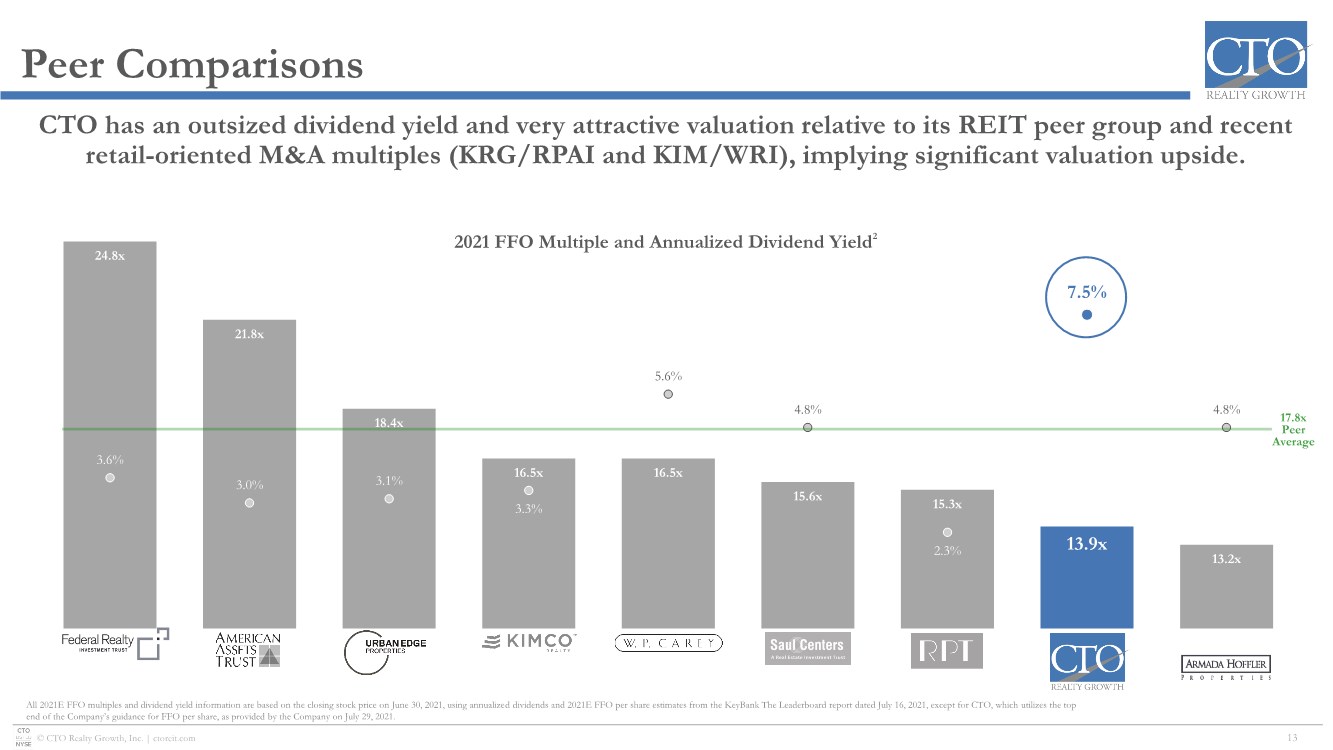
| © CTO Realty Growth, Inc. | ctoreit.com Peer Comparisons 13 24.8x 21.8x 18.4x 16.5x 16.5x 15.6x 15.3x 13.9x 13.2x 3.6% 3.0% 3.1% 3.3% 5.6% 4.8% 2.3% 7.5% 4.8% 0.00% 1.00% 2.00% 3.00% 4.00% 5.00% 6.00% 7.00% 8.00% 9.00% 10.00% 10.0x 11.0x 12.0x 13.0x 14.0x 15.0x 16.0x 17.0x 18.0x 19.0x 20.0x 21.0x 22.0x 23.0x 24.0x 25.0x 26.0x All 2021E FFO multiples and dividend yield information are based on the closing stock price on June 30, 2021, using annualized dividends and 2021E FFO per share estimates from the KeyBank The Leaderboard report dated July 16, 2021, except for CTO, which utilizes the top end of the Company’s guidance for FFO per share, as provided by the Company on July 29, 2021. CTO has an outsized dividend yield and very attractive valuation relative to its REIT peer group and recent retail-oriented M&A multiples (KRG/RPAI and KIM/WRI), implying significant valuation upside. 2021 FFO Multiple and Annualized Dividend Yield2 |
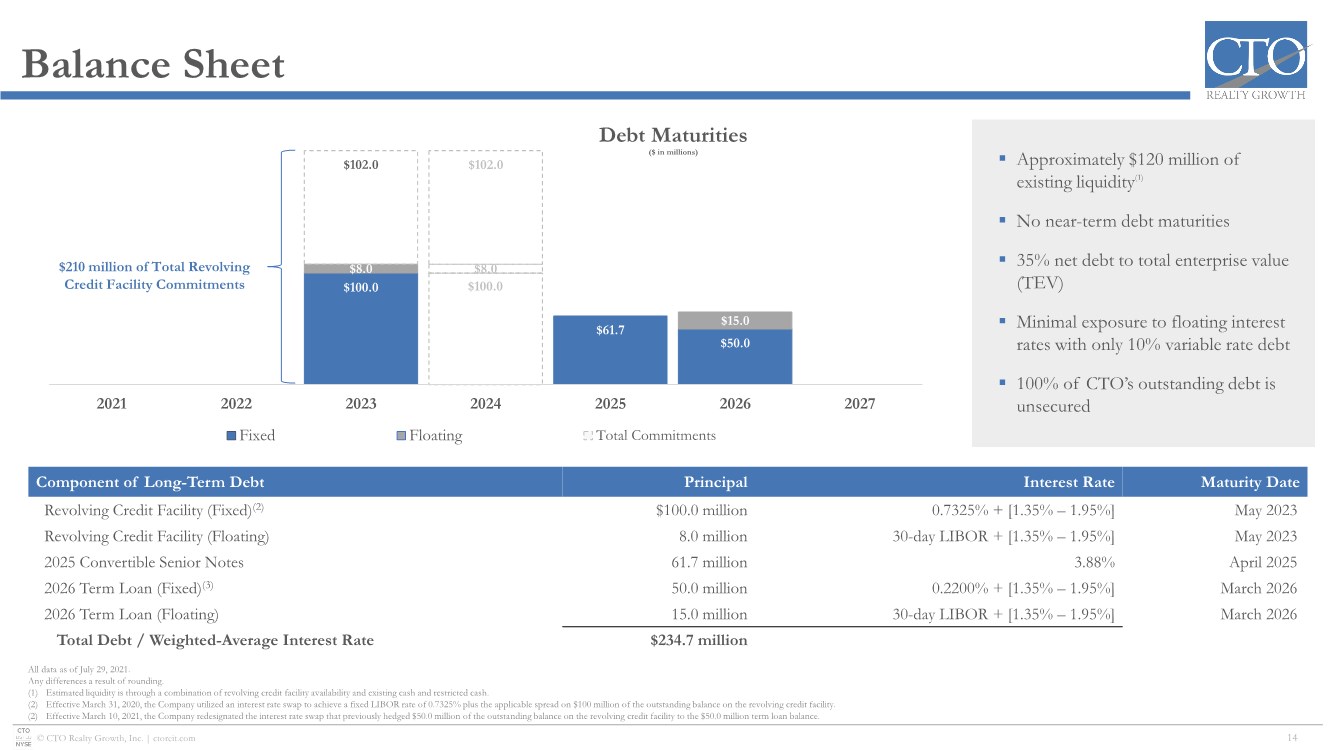
| © CTO Realty Growth, Inc. | ctoreit.com Balance Sheet 14 $100.0 $100.0 $61.7 $50.0 $8.0 $8.0 $15.0 $102.0 $102.0 2021 2022 2023 2024 2025 2026 2027 Fixed Floating Total Commitments Component of Long-Term Debt Principal Interest Rate Maturity Date Revolving Credit Facility (Fixed)(2) $100.0 million 0.7325% + [1.35% – 1.95%] May 2023 Revolving Credit Facility (Floating) 8.0 million 30-day LIBOR + [1.35% – 1.95%] May 2023 2025 Convertible Senior Notes 61.7 million 3.88% April 2025 2026 Term Loan (Fixed)(3) 50.0 million 0.2200% + [1.35% – 1.95%] March 2026 2026 Term Loan (Floating) 15.0 million 30-day LIBOR + [1.35% – 1.95%] March 2026 Total Debt / Weighted-Average Interest Rate $234.7 million All data as of July 29, 2021. Any differences a result of rounding. (1) Estimated liquidity is through a combination of revolving credit facility availability and existing cash and restricted cash. (2) Effective March 31, 2020, the Company utilized an interest rate swap to achieve a fixed LIBOR rate of 0.7325% plus the applicable spread on $100 million of the outstanding balance on the revolving credit facility. (2) Effective March 10, 2021, the Company redesignated the interest rate swap that previously hedged $50.0 million of the outstanding balance on the revolving credit facility to the $50.0 million term loan balance. Debt Maturities ($ in millions) ▪ Approximately $120 million of existing liquidity(1) ▪ No near-term debt maturities ▪ 35% net debt to total enterprise value (TEV) ▪ Minimal exposure to floating interest rates with only 10% variable rate debt ▪ 100% of CTO’s outstanding debt is unsecured $210 million of Total Revolving Credit Facility Commitments |
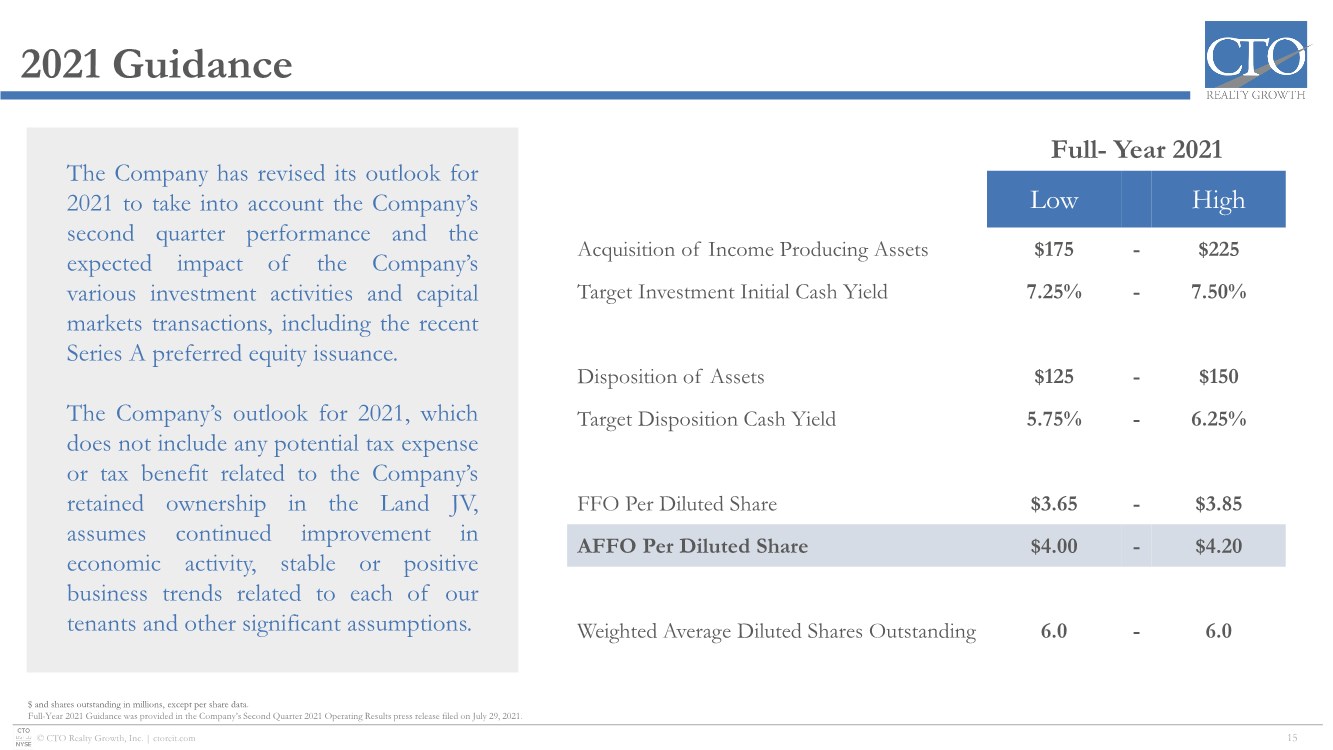
| © CTO Realty Growth, Inc. | ctoreit.com 2021 Guidance 15 $ and shares outstanding in millions, except per share data. Full-Year 2021 Guidance was provided in the Company’s Second Quarter 2021 Operating Results press release filed on July 29, 2021. Full- Year 2021 Low High Acquisition of Income Producing Assets $175 - $225 Target Investment Initial Cash Yield 7.25% - 7.50% Disposition of Assets $125 - $150 Target Disposition Cash Yield 5.75% - 6.25% FFO Per Diluted Share $3.65 - $3.85 AFFO Per Diluted Share $4.00 - $4.20 Weighted Average Diluted Shares Outstanding 6.0 - 6.0 The Company has revised its outlook for 2021 to take into account the Company’s second quarter performance and the expected impact of the Company’s various investment activities and capital markets transactions, including the recent Series A preferred equity issuance. The Company’s outlook for 2021, which does not include any potential tax expense or tax benefit related to the Company’s retained ownership in the Land JV, assumes continued improvement in economic activity, stable or positive business trends related to each of our tenants and other significant assumptions. |
| REALTY GROWTH NYSE: CTO Appendix |

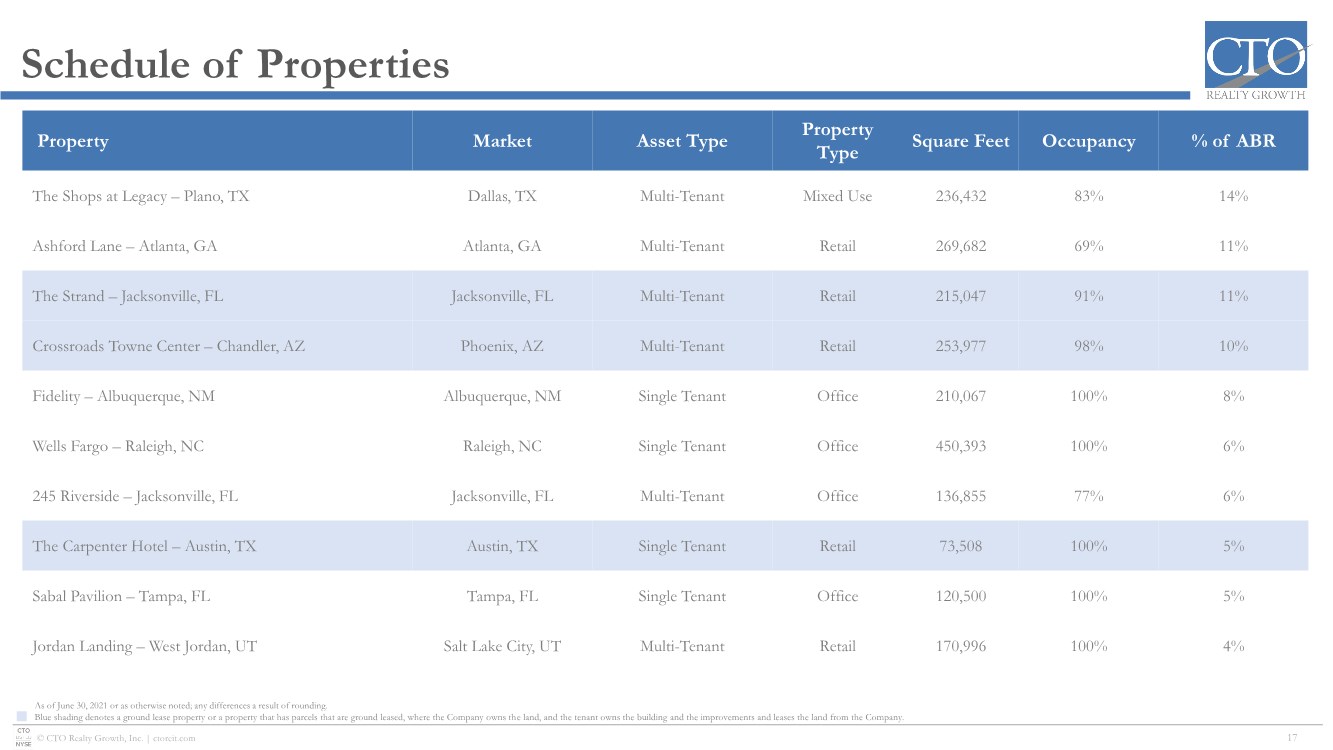
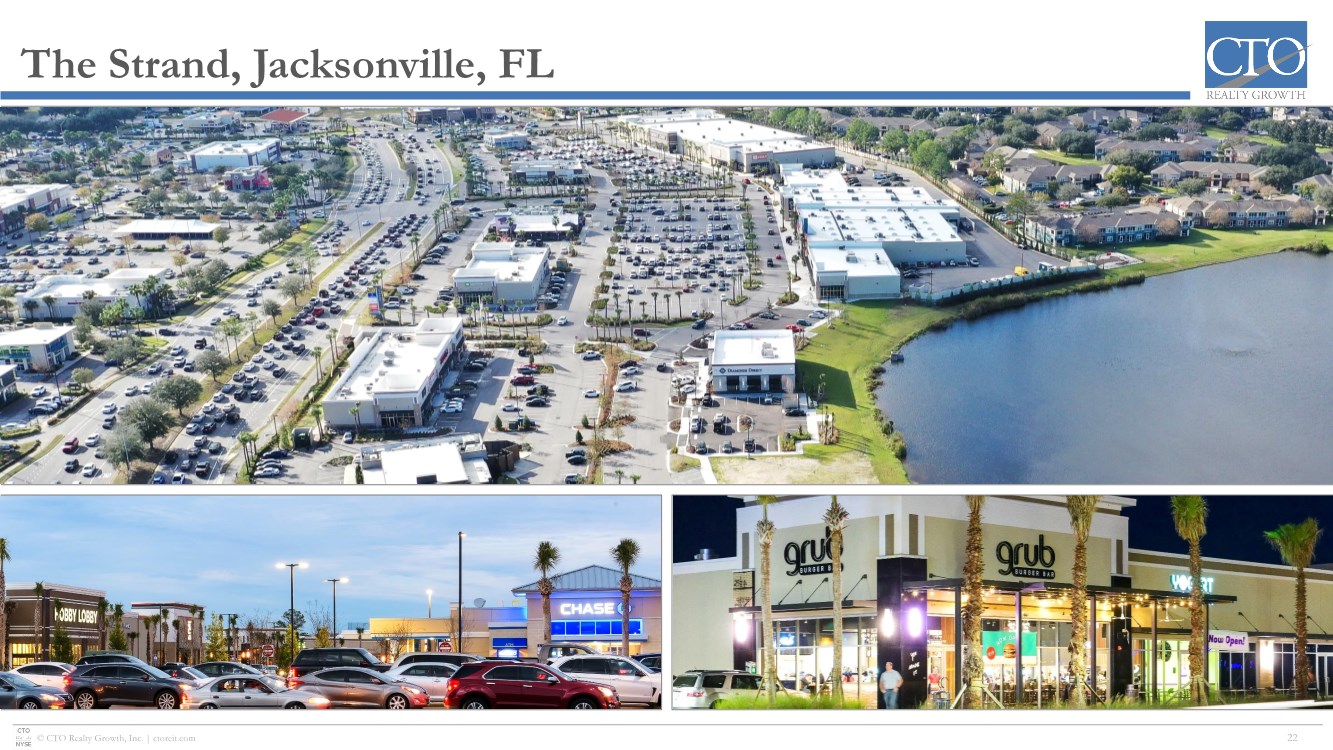
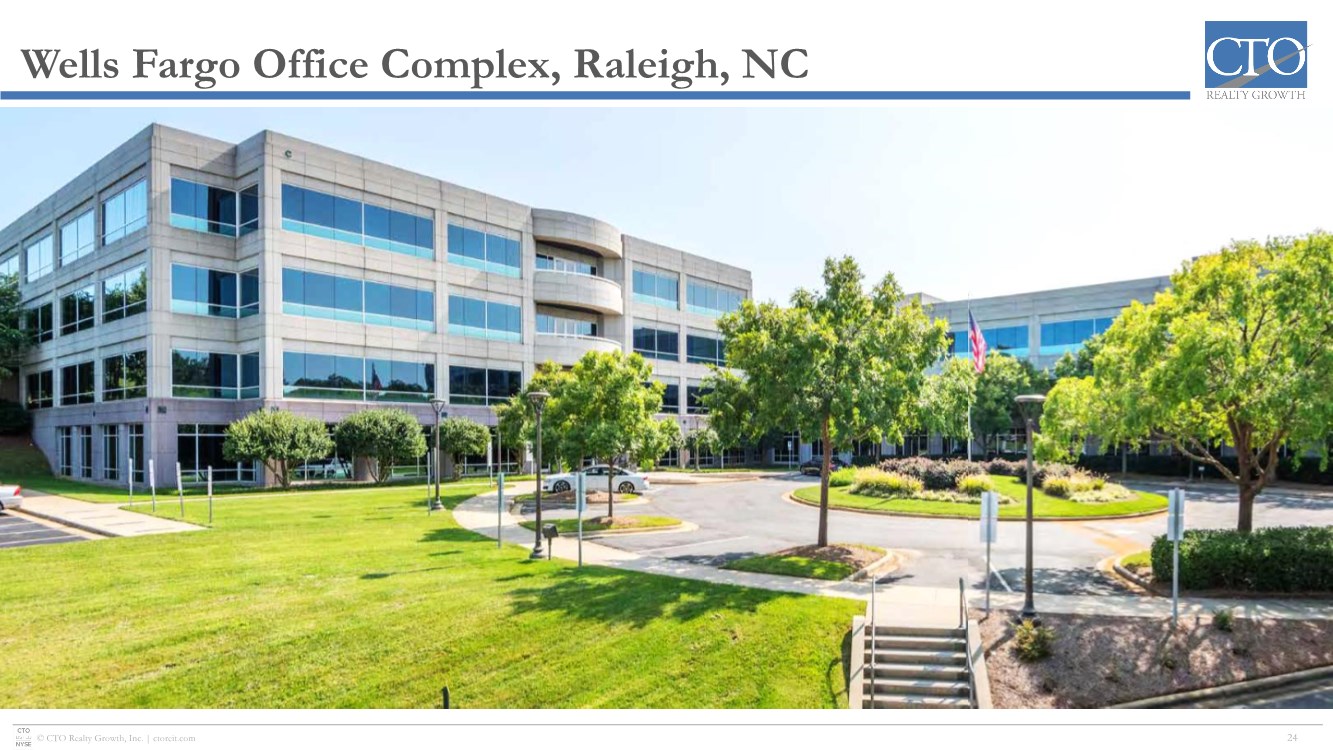
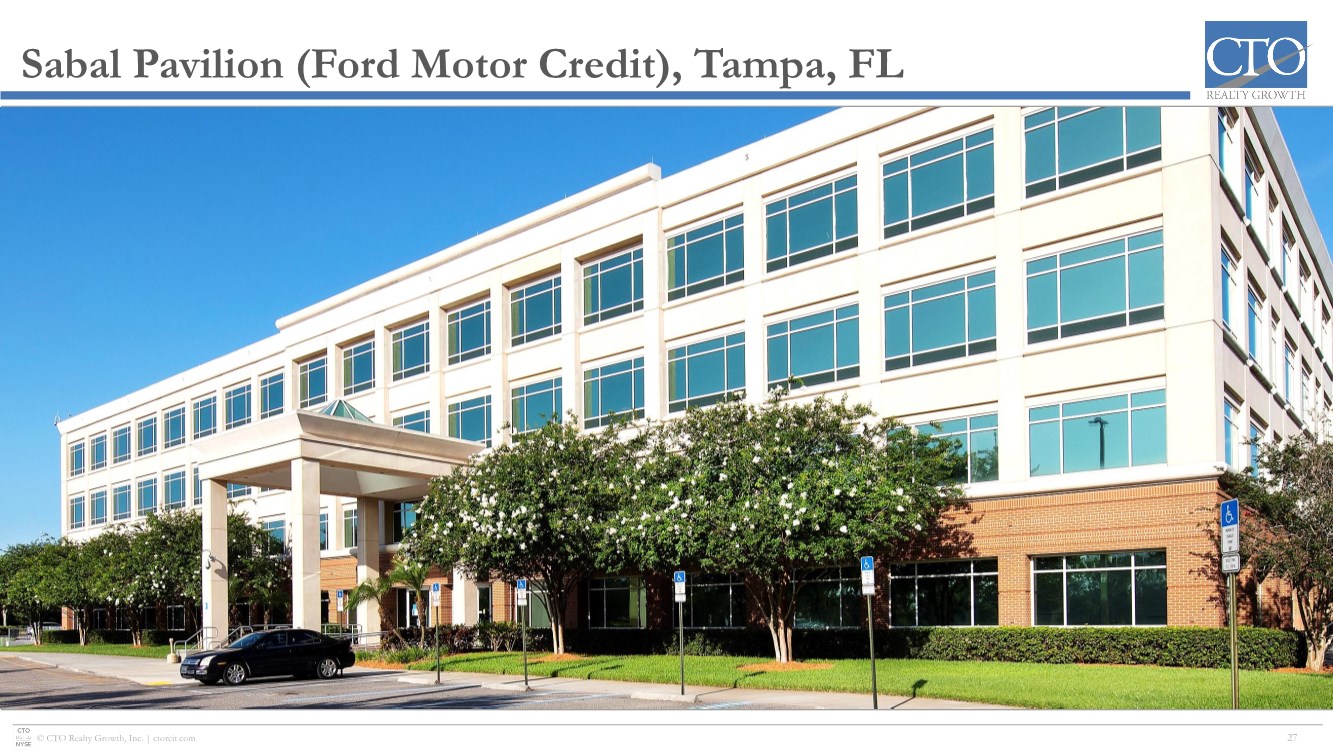
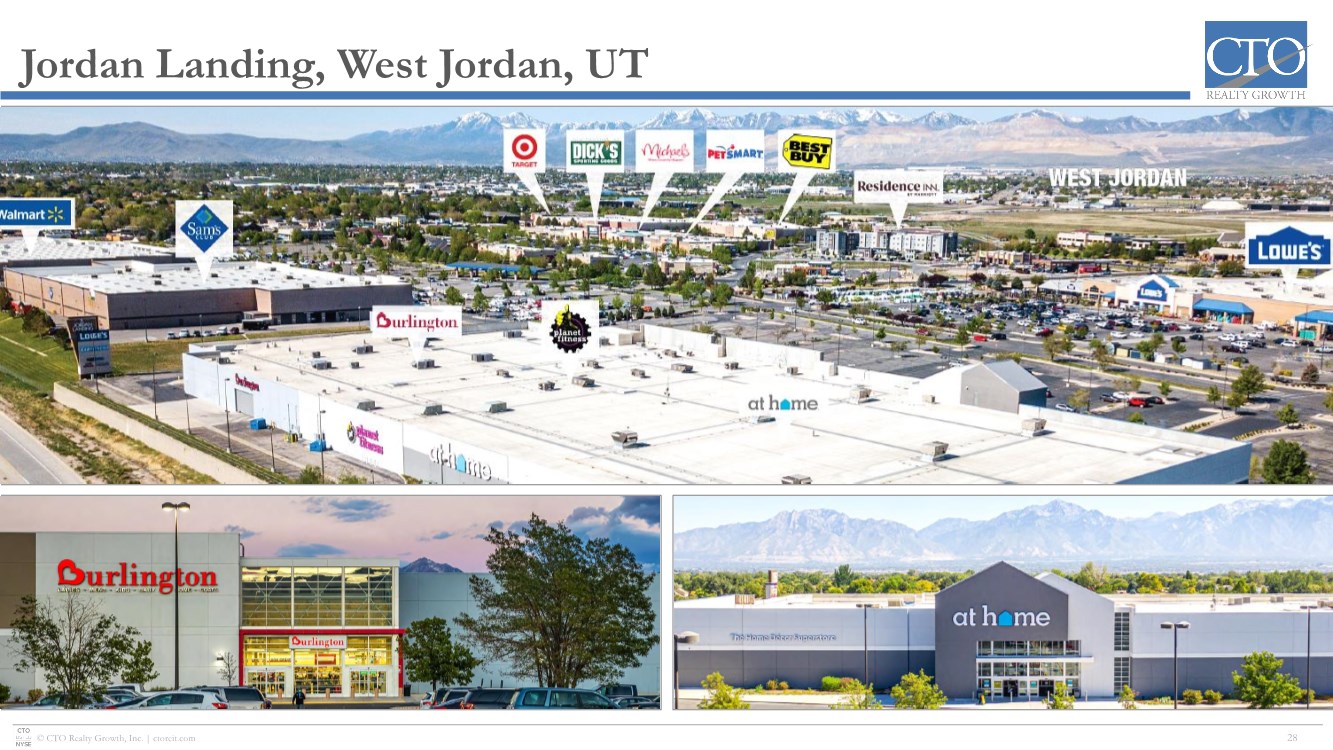
| © CTO Realty Growth, Inc. | ctoreit.com Schedule of Properties 17 Property Market Asset Type Property Type Square Feet Occupancy % of ABR The Shops at Legacy – Plano, TX Dallas, TX Multi-Tenant Mixed Use 236,432 83% 14% Ashford Lane – Atlanta, GA Atlanta, GA Multi-Tenant Retail 269,682 69% 11% The Strand – Jacksonville, FL Jacksonville, FL Multi-Tenant Retail 215,047 91% 11% Crossroads Towne Center – Chandler, AZ Phoenix, AZ Multi-Tenant Retail 253,977 98% 10% Fidelity – Albuquerque, NM Albuquerque, NM Single Tenant Office 210,067 100% 8% Wells Fargo – Raleigh, NC Raleigh, NC Single Tenant Office 450,393 100% 6% 245 Riverside – Jacksonville, FL Jacksonville, FL Multi-Tenant Office 136,855 77% 6% The Carpenter Hotel – Austin, TX Austin, TX Single Tenant Retail 73,508 100% 5% Sabal Pavilion – Tampa, FL Tampa, FL Single Tenant Office 120,500 100% 5% Jordan Landing – West Jordan, UT Salt Lake City, UT Multi-Tenant Retail 170,996 100% 4% As of June 30, 2021 or as otherwise noted; any differences a result of rounding. Blue shading denotes a ground lease property or a property that has parcels that are ground leased, where the Company owns the land, and the tenant owns the building and the improvements and leases the land from the Company. |
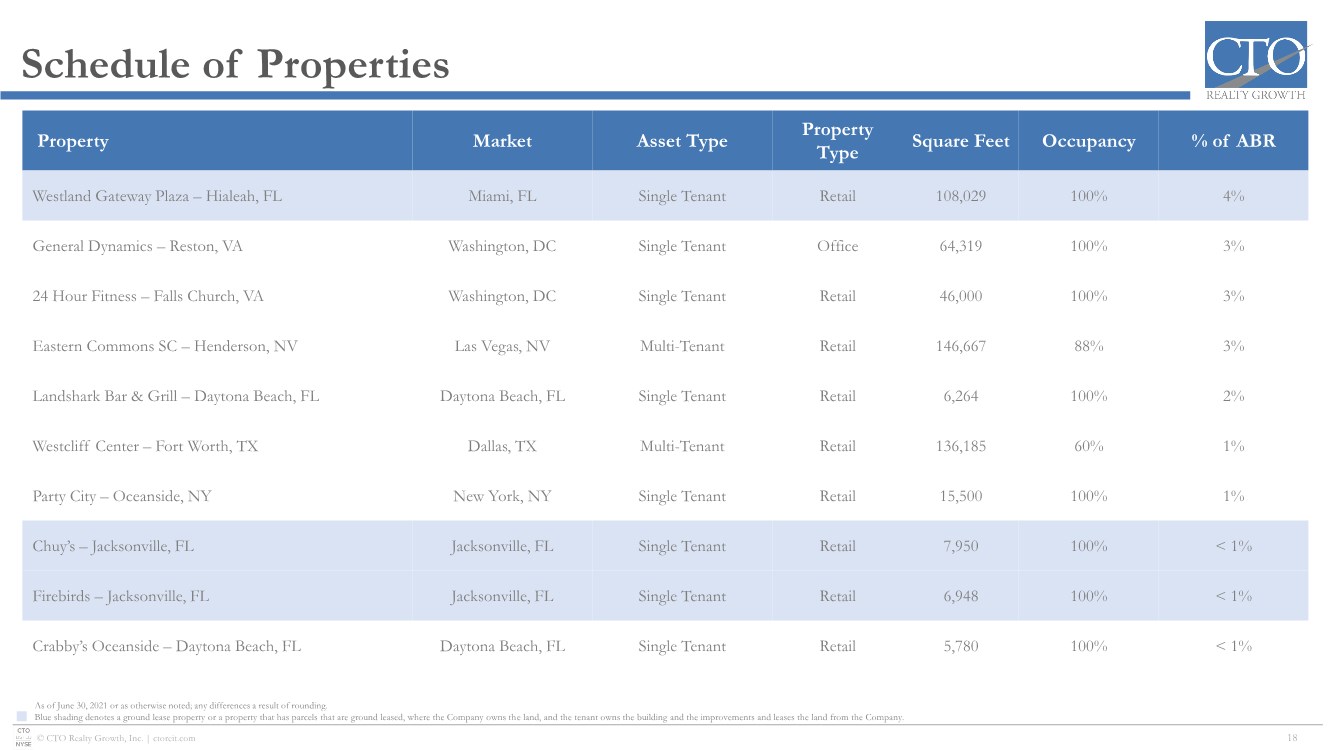
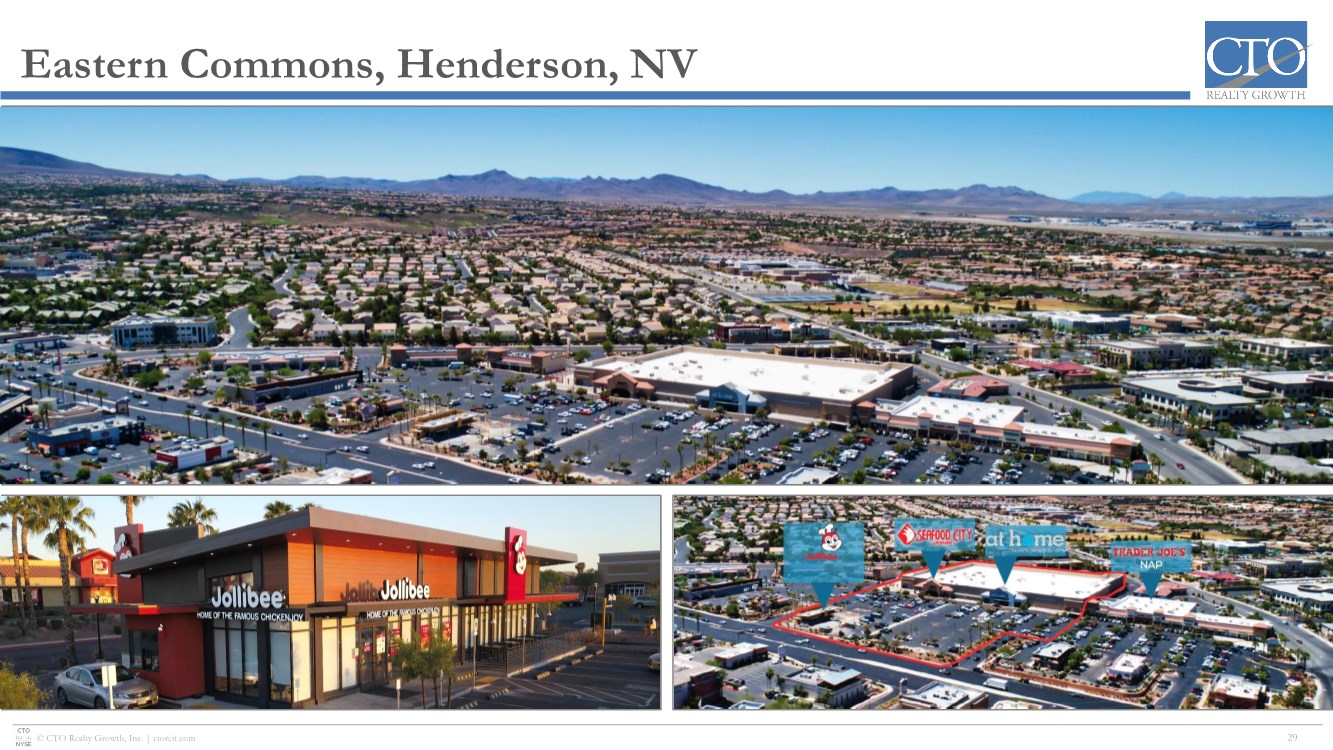
| © CTO Realty Growth, Inc. | ctoreit.com Schedule of Properties 18 Property Market Asset Type Property Type Square Feet Occupancy % of ABR Westland Gateway Plaza – Hialeah, FL Miami, FL Single Tenant Retail 108,029 100% 4% General Dynamics – Reston, VA Washington, DC Single Tenant Office 64,319 100% 3% 24 Hour Fitness – Falls Church, VA Washington, DC Single Tenant Retail 46,000 100% 3% Eastern Commons SC – Henderson, NV Las Vegas, NV Multi-Tenant Retail 146,667 88% 3% Landshark Bar & Grill – Daytona Beach, FL Daytona Beach, FL Single Tenant Retail 6,264 100% 2% Westcliff Center – Fort Worth, TX Dallas, TX Multi-Tenant Retail 136,185 60% 1% Party City – Oceanside, NY New York, NY Single Tenant Retail 15,500 100% 1% Chuy’s – Jacksonville, FL Jacksonville, FL Single Tenant Retail 7,950 100% < 1% Firebirds – Jacksonville, FL Jacksonville, FL Single Tenant Retail 6,948 100% < 1% Crabby’s Oceanside – Daytona Beach, FL Daytona Beach, FL Single Tenant Retail 5,780 100% < 1% As of June 30, 2021 or as otherwise noted; any differences a result of rounding. Blue shading denotes a ground lease property or a property that has parcels that are ground leased, where the Company owns the land, and the tenant owns the building and the improvements and leases the land from the Company. |
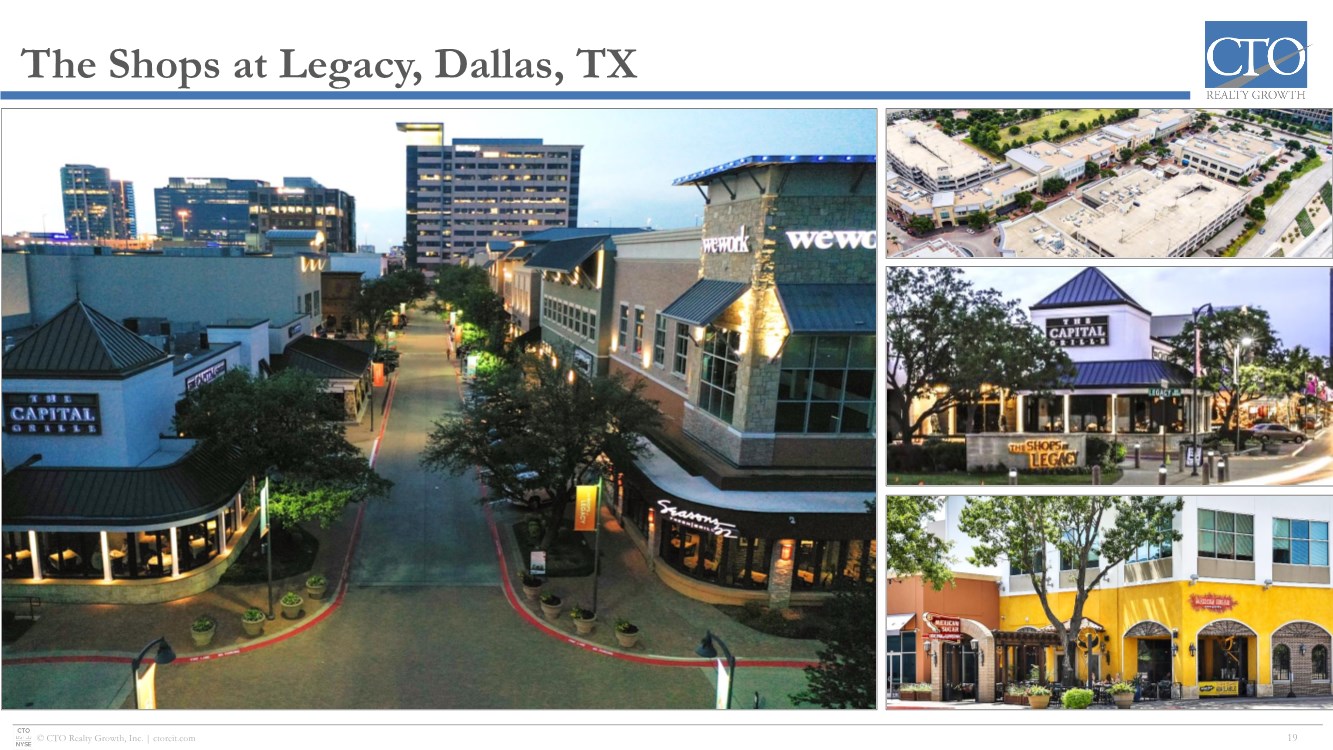
| © CTO Realty Growth, Inc. | ctoreit.com The Shops at Legacy, Dallas, TX 19 |
| © CTO Realty Growth, Inc. | ctoreit.com Ashford Lane, Atlanta, GA 20 |
| © CTO Realty Growth, Inc. | ctoreit.com Crossroads Town Center, Chandler, AZ 21 |
| © CTO Realty Growth, Inc. | ctoreit.com The Strand, Jacksonville, FL 22 |
| © CTO Realty Growth, Inc. | ctoreit.com Fidelity Office Complex, Albuquerque, NM 23 |

| © CTO Realty Growth, Inc. | ctoreit.com Wells Fargo Office Complex, Raleigh, NC 24 |
| © CTO Realty Growth, Inc. | ctoreit.com 245 Riverside Office Building, Jacksonville, FL 25 |

| © CTO Realty Growth, Inc. | ctoreit.com The Carpenter Hotel, Austin, TX (Ground Lease) 26 |

| © CTO Realty Growth, Inc. | ctoreit.com Sabal Pavilion (Ford Motor Credit), Tampa, FL 27 |
| © CTO Realty Growth, Inc. | ctoreit.com Jordan Landing, West Jordan, UT 28 |
| © CTO Realty Growth, Inc. | ctoreit.com Eastern Commons, Henderson, NV 29 |
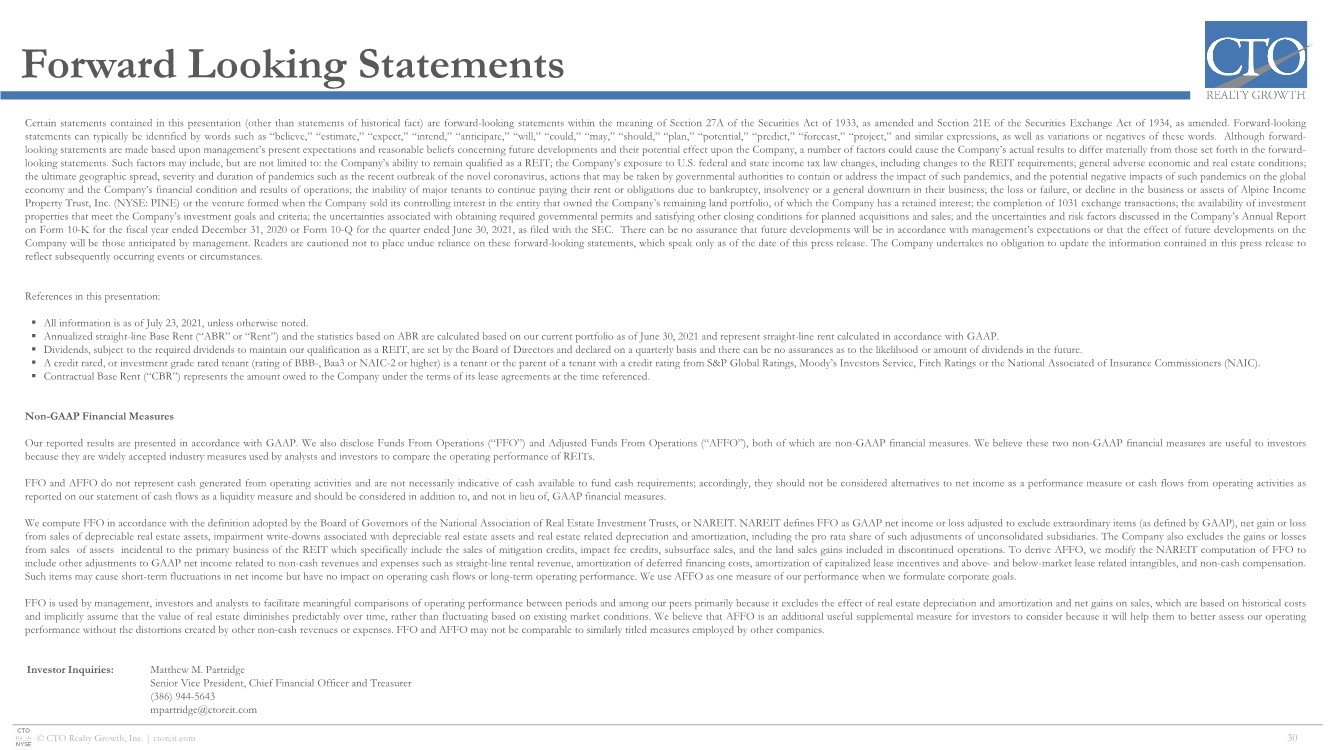
| © CTO Realty Growth, Inc. | ctoreit.com Forward Looking Statements 30 Certain statements contained in this presentation (other than statements of historical fact) are forward-looking statements within the meaning of Section 27A of the Securities Act of 1933, as amended and Section 21E of the Securities Exchange Act of 1934, as amended. Forward-looking statements can typically be identified by words such as “believe,” “estimate,” “expect,” “intend,” “anticipate,” “will,” “could,” “may,” “should,” “plan,” “potential,” “predict,” “forecast,” “project,” and similar expressions, as well as variations or negatives of these words. Although forward- looking statements are made based upon management’s present expectations and reasonable beliefs concerning future developments and their potential effect upon the Company, a number of factors could cause the Company’s actual results to differ materially from those set forth in the forward- looking statements. Such factors may include, but are not limited to: the Company’s ability to remain qualified as a REIT; the Company’s exposure to U.S. federal and state income tax law changes, including changes to the REIT requirements; general adverse economic and real estate conditions; the ultimate geographic spread, severity and duration of pandemics such as the recent outbreak of the novel coronavirus, actions that may be taken by governmental authorities to contain or address the impact of such pandemics, and the potential negative impacts of such pandemics on the global economy and the Company’s financial condition and results of operations; the inability of major tenants to continue paying their rent or obligations due to bankruptcy, insolvency or a general downturn in their business; the loss or failure, or decline in the business or assets of Alpine Income Property Trust, Inc.(NYSE: PINE) or the venture formed when the Company sold its controlling interest in the entity that owned the Company’s remaining land portfolio, of which the Company has a retained interest; the completion of 1031 exchange transactions; the availability of investment properties that meet the Company’s investment goals and criteria; the uncertainties associated with obtaining required governmental permits and satisfying other closing conditions for planned acquisitions and sales; and the uncertainties and risk factors discussed in the Company’s Annual Report on Form 10-K for the fiscal year ended December 31, 2020 or Form 10-Q for the quarter ended June 30, 2021, as filed with the SEC. There can be no assurance that future developments will be in accordance with management’s expectations or that the effect of future developments on the Company will be those anticipated by management. Readers are cautioned not to place undue reliance on these forward-looking statements, which speak only as of the date of this press release. The Company undertakes no obligation to update the information contained in this press release to reflect subsequently occurring events or circumstances. References in this presentation: ▪ All information is as of July 23, 2021, unless otherwise noted. ▪ Annualized straight-line Base Rent (“ABR” or “Rent”) and the statistics based on ABR are calculated based on our current portfolio as of June 30, 2021 and represent straight-line rent calculated in accordance with GAAP. ▪ Dividends, subject to the required dividends to maintain our qualification as a REIT, are set by the Board of Directors and declared on a quarterly basis and there can be no assurances as to the likelihood or amount of dividends in the future. ▪ A credit rated, or investment grade rated tenant (rating of BBB-, Baa3 or NAIC-2 or higher) is a tenant or the parent of a tenant with a credit rating from S&P Global Ratings, Moody’s Investors Service, Fitch Ratings or the National Associated of Insurance Commissioners (NAIC). ▪ Contractual Base Rent (“CBR”) represents the amount owed to the Company under the terms of its lease agreements at the time referenced. Non-GAAP Financial Measures Our reported results are presented in accordance with GAAP. We also disclose Funds From Operations (“FFO”) and Adjusted Funds From Operations (“AFFO”), both of which are non-GAAP financial measures. We believe these two non-GAAP financial measures are useful to investors because they are widely accepted industry measures used by analysts and investors to compare the operating performance of REITs. FFO and AFFO do not represent cash generated from operating activities and are not necessarily indicative of cash available to fund cash requirements; accordingly, they should not be considered alternatives to net income as a performance measure or cash flows from operating activities as reported on our statement of cash flows as a liquidity measure and should be considered in addition to, and not in lieu of, GAAP financial measures. We compute FFO in accordance with the definition adopted by the Board of Governors of the National Association of Real Estate Investment Trusts, or NAREIT. NAREIT defines FFO as GAAP net income or loss adjusted to exclude extraordinary items (as defined by GAAP), net gain or loss from sales of depreciable real estate assets, impairment write-downs associated with depreciable real estate assets and real estate related depreciation and amortization, including the pro rata share of such adjustments of unconsolidated subsidiaries. The Company also excludes the gains or losses from sales of assets incidental to the primary business of the REIT which specifically include the sales of mitigation credits, impact fee credits, subsurface sales, and the land sales gains included in discontinued operations. To derive AFFO, we modify the NAREIT computation of FFO to include other adjustments to GAAP net income related to non-cash revenues and expenses such as straight-line rental revenue, amortization of deferred financing costs, amortization of capitalized lease incentives and above- and below-market lease related intangibles, and non-cash compensation. Such items may cause short-term fluctuations in net income but have no impact on operating cash flows or long-term operating performance. We use AFFO as one measure of our performance when we formulate corporate goals. FFO is used by management, investors and analysts to facilitate meaningful comparisons of operating performance between periods and among our peers primarily because it excludes the effect of real estate depreciation and amortization and net gains on sales, which are based on historical costs and implicitly assume that the value of real estate diminishes predictably over time, rather than fluctuating based on existing market conditions. We believe that AFFO is an additional useful supplemental measure for investors to consider because it will help them to better assess our operating performance without the distortions created by other non-cash revenues or expenses. FFO and AFFO may not be comparable to similarly titled measures employed by other companies. Investor Inquiries: Matthew M. Partridge Senior Vice President, Chief Financial Officer and Treasurer (386) 944-5643 [email protected] |
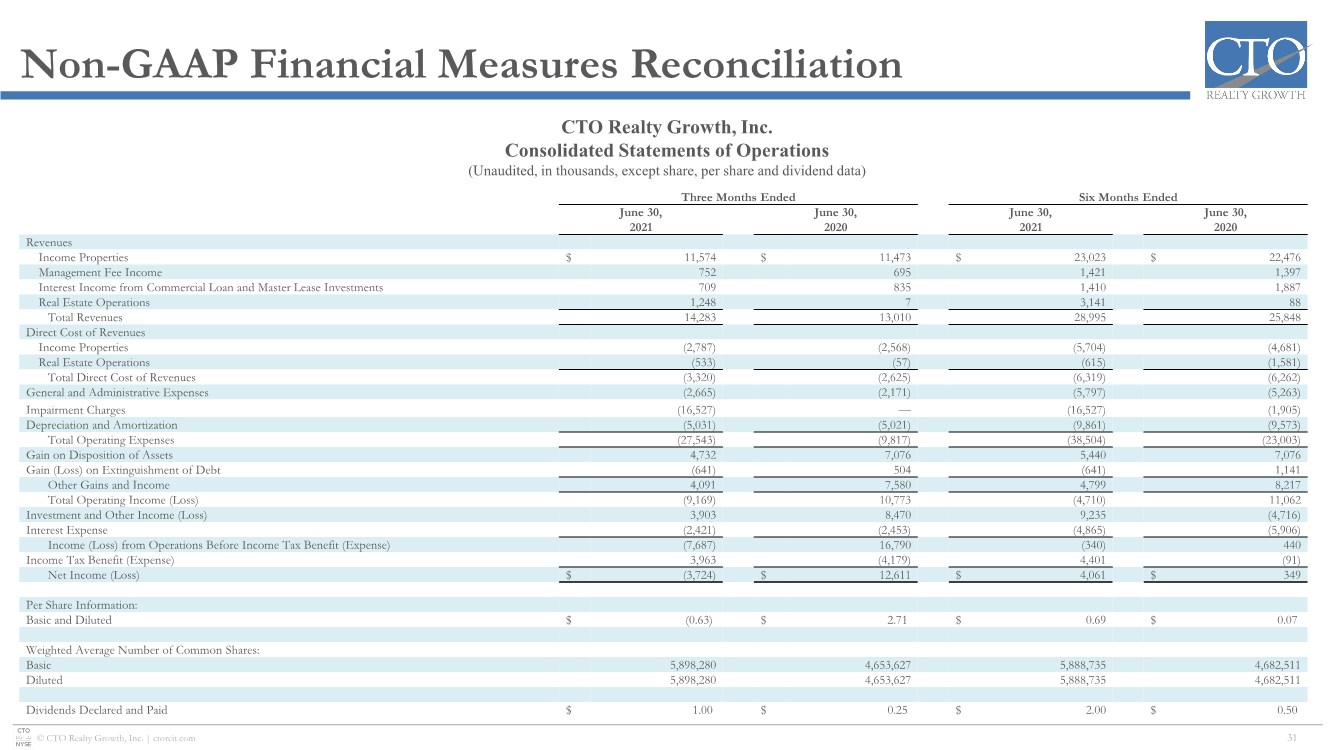
| © CTO Realty Growth, Inc. | ctoreit.com Non-GAAP Financial Measures Reconciliation 31 Three Months Ended Six Months Ended June 30, 2021 June 30, 2020 June 30, 2021 June 30, 2020 Revenues Income Properties $ 11,574 $ 11,473 $ 23,023 $ 22,476 Management Fee Income 752 695 1,421 1,397 Interest Income from Commercial Loan and Master Lease Investments 709 835 1,410 1,887 Real Estate Operations 1,248 7 3,141 88 Total Revenues 14,283 13,010 28,995 25,848 Direct Cost of Revenues Income Properties (2,787) (2,568) (5,704) (4,681) Real Estate Operations (533) (57) (615) (1,581) Total Direct Cost of Revenues (3,320) (2,625) (6,319) (6,262) General and Administrative Expenses (2,665) (2,171) (5,797) (5,263) Impairment Charges (16,527) —(16,527) (1,905) Depreciation and Amortization (5,031) (5,021) (9,861) (9,573) Total Operating Expenses (27,543) (9,817) (38,504) (23,003) Gain on Disposition of Assets 4,732 7,076 5,440 7,076 Gain (Loss) on Extinguishment of Debt (641) 504 (641) 1,141 Other Gains and Income 4,091 7,580 4,799 8,217 Total Operating Income (Loss) (9,169) 10,773 (4,710) 11,062 Investment and Other Income (Loss) 3,903 8,470 9,235 (4,716) Interest Expense (2,421) (2,453) (4,865) (5,906) Income (Loss) from Operations Before Income Tax Benefit (Expense) (7,687) 16,790 (340) 440 Income Tax Benefit (Expense) 3,963 (4,179) 4,401 (91) Net Income (Loss) $ (3,724) $ 12,611 $ 4,061 $ 349 Per Share Information: Basic and Diluted $ (0.63) $ 2.71 $ 0.69 $ 0.07 Weighted Average Number of Common Shares: Basic 5,898,280 4,653,627 5,888,735 4,682,511 Diluted 5,898,280 4,653,627 5,888,735 4,682,511 Dividends Declared and Paid $ 1.00 $ 0.25 $ 2.00 $ 0.50 CTO Realty Growth, Inc. Consolidated Statements of Operations (Unaudited, in thousands, except share, per share and dividend data) |
| © CTO Realty Growth, Inc. | ctoreit.com Non-GAAP Financial Measures Reconciliation 32 Three Months Ended Six Months Ended June 30, 2021 June 30, 2020 June 30, 2021 June 30, 2020 Net Income (Loss) $ (3,724) $ 12,611 $ 4,061 $ 349 Depreciation and Amortization 5,031 5,021 9,861 9,573 Gains on Disposition of Assets (4,732) (7,076) (5,440) (7,076) Losses (Gains) on the Disposition of Other Assets (748) 32 (2,575) 1,421 Impairment Charges, Net 12,474 — 12,474 1,905 Unrealized (Gain) Loss on Investment Securities (3,386) (8,056) (8,220) 5,650 Funds from Operations $ 4,915 $ 2,532 $ 10,161 $ 11,822 Adjustments: Straight-Line Rent Adjustment (490) (802) (1,175) (1,140) COVID-19 Rent Repayments (Deferrals), Net 434 (1,151) 654 (1,151) Amortization of Intangibles to Lease Income (338) (444) (734) (918) Contributed Leased Assets Accretion (38) (44) (159) (87) Loss (Gain) on Extinguishment of Debt 641 (504) 641 (1,141) Amortization of Discount on Convertible Debt 319 256 629 760 Non-Cash Compensation 742 699 1,700 1,518 Non-Recurring G&A 62 — 155 102 Amortization of Deferred Financing Costs to Interest Expense 159 73 324 223 Accretion of Loan Origination Fees (1) (69) (1) (157) Non-Cash Imputed Interest (111) (103) (214) (206) Adjusted Funds from Operations $ 6,294 $ 443 $ 11,981 $ 9,625 FFO per diluted share $ 0.83 $ 0.54 $ 1.73 $ 2.52 AFFO per diluted share $ 1.07 $ 0.10 $ 2.03 $ 2.06 CTO Realty Growth, Inc. Non-GAAP Financial Measures (Unaudited, in thousands, except per share data) |
| REALTY GROWTH NYSE: CTO CRABBY’S OCEANSIDE & LANDSHARK BAR & GRILL, DAYTONA BEACH, FL |
Exhibit 99.3
| Supplemental Disclosure Quarter Ended June 30, 2021 |

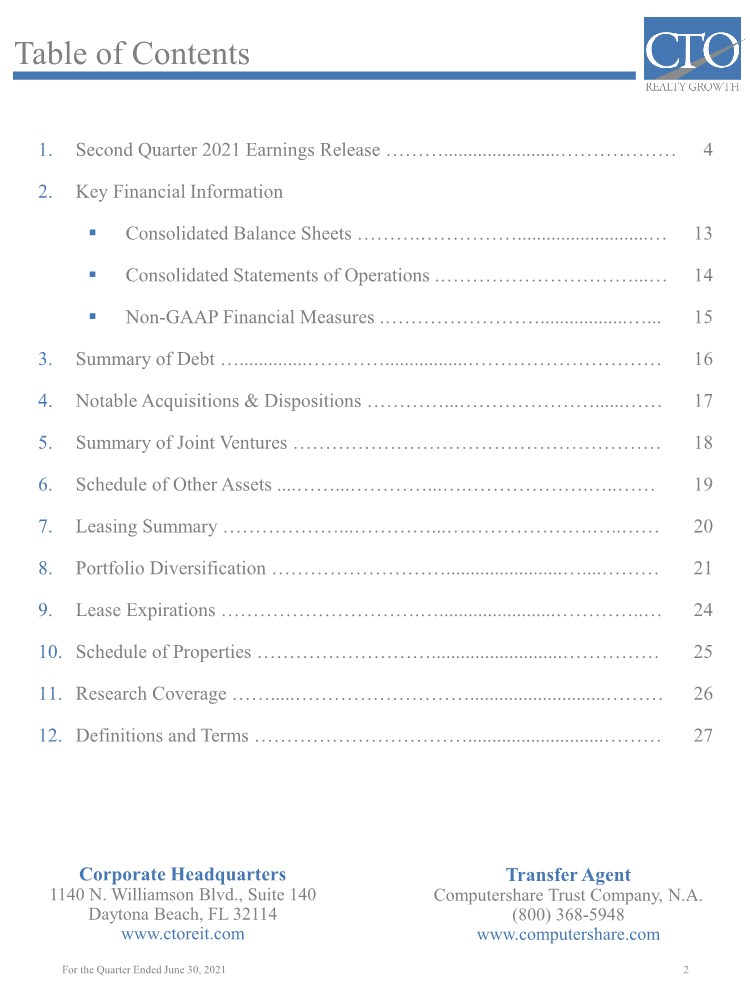
| Table of Contents 1. Second Quarter 2021 Earnings Release ………........................……………… 4 2. Key Financial Information ▪ Consolidated Balance Sheets ……….……………...........................… 13 ▪ Consolidated Statements of Operations .…………………………...… 14 ▪ Non-GAAP Financial Measures .……………………..................…... 15 3. Summary of Debt …..............………….................………………………… 16 4. Notable Acquisitions & Dispositions …………...…………………......…… 17 5. Summary of Joint Ventures ………………………………………………… 18 6. Schedule of Other Assets ....……...…………...….……………….…..…… 19 7. Leasing Summary ………………...…………...….……………….…..…… 20 8. Portfolio Diversification ………………………........................…....……… 21 9. Lease Expirations ………………………….…........................…………..… 24 10. Schedule of Properties ………………………...........................…………… 25 11. Research Coverage …….....………………………............................……… 26 12. Definitions and Terms ……………………………............................……… 27 2 Corporate Headquarters 1140 N. Williamson Blvd., Suite 140 Daytona Beach, FL 32114 www.ctoreit.com Transfer Agent Computershare Trust Company, N.A. (800) 368-5948 www.computershare.com For the Quarter Ended June 30, 2021 |
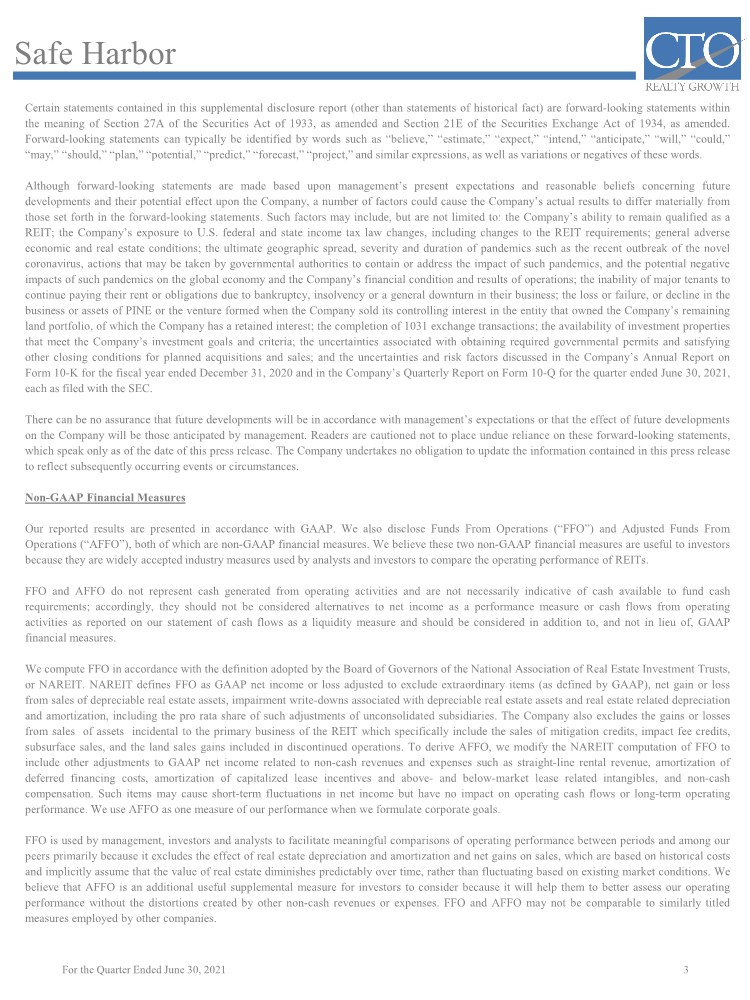
| Safe Harbor Certain statements contained in this supplemental disclosure report (other than statements of historical fact) are forward-looking statements within the meaning of Section 27A of the Securities Act of 1933, as amended and Section 21E of the Securities Exchange Act of 1934, as amended. Forward-looking statements can typically be identified by words such as “believe,” “estimate,” “expect,” “intend,” “anticipate,” “will,” “could,” “may,” “should,” “plan,” “potential,” “predict,” “forecast,” “project,” and similar expressions, as well as variations or negatives of these words. Although forward-looking statements are made based upon management’s present expectations and reasonable beliefs concerning future developments and their potential effect upon the Company, a number of factors could cause the Company’s actual results to differ materially from those set forth in the forward-looking statements. Such factors may include, but are not limited to: the Company’s ability to remain qualified as a REIT; the Company’s exposure to U.S. federal and state income tax law changes, including changes to the REIT requirements; general adverse economic and real estate conditions; the ultimate geographic spread, severity and duration of pandemics such as the recent outbreak of the novel coronavirus, actions that may be taken by governmental authorities to contain or address the impact of such pandemics, and the potential negative impacts of such pandemics on the global economy and the Company’s financial condition and results of operations; the inability of major tenants to continue paying their rent or obligations due to bankruptcy, insolvency or a general downturn in their business; the loss or failure, or decline in the business or assets of PINE or the venture formed when the Company sold its controlling interest in the entity that owned the Company’s remaining land portfolio, of which the Company has a retained interest; the completion of 1031 exchange transactions; the availability of investment properties that meet the Company’s investment goals and criteria; the uncertainties associated with obtaining required governmental permits and satisfying other closing conditions for planned acquisitions and sales; and the uncertainties and risk factors discussed in the Company’s Annual Report on Form 10-K for the fiscal year ended December 31, 2020 and in the Company’s Quarterly Report on Form 10-Q for the quarter ended June 30, 2021, each as filed with the SEC. There can be no assurance that future developments will be in accordance with management’s expectations or that the effect of future developments on the Company will be those anticipated by management. Readers are cautioned not to place undue reliance on these forward-looking statements, which speak only as of the date of this press release. The Company undertakes no obligation to update the information contained in this press release to reflect subsequently occurring events or circumstances. Non-GAAP Financial Measures Our reported results are presented in accordance with GAAP. We also disclose Funds From Operations (“FFO”) and Adjusted Funds From Operations (“AFFO”), both of which are non-GAAP financial measures. We believe these two non-GAAP financial measures are useful to investors because they are widely accepted industry measures used by analysts and investors to compare the operating performance of REITs. FFO and AFFO do not represent cash generated from operating activities and are not necessarily indicative of cash available to fund cash requirements; accordingly, they should not be considered alternatives to net income as a performance measure or cash flows from operating activities as reported on our statement of cash flows as a liquidity measure and should be considered in addition to, and not in lieu of, GAAP financial measures. We compute FFO in accordance with the definition adopted by the Board of Governors of the National Association of Real Estate Investment Trusts, or NAREIT. NAREIT defines FFO as GAAP net income or loss adjusted to exclude extraordinary items (as defined by GAAP), net gain or loss from sales of depreciable real estate assets, impairment write-downs associated with depreciable real estate assets and real estate related depreciation and amortization, including the pro rata share of such adjustments of unconsolidated subsidiaries. The Company also excludes the gains or losses from sales of assets incidental to the primary business of the REIT which specifically include the sales of mitigation credits, impact fee credits, subsurface sales, and the land sales gains included in discontinued operations. To derive AFFO, we modify the NAREIT computation of FFO to include other adjustments to GAAP net income related to non-cash revenues and expenses such as straight-line rental revenue, amortization of deferred financing costs, amortization of capitalized lease incentives and above- and below-market lease related intangibles, and non-cash compensation. Such items may cause short-term fluctuations in net income but have no impact on operating cash flows or long-term operating performance. We use AFFO as one measure of our performance when we formulate corporate goals. FFO is used by management, investors and analysts to facilitate meaningful comparisons of operating performance between periods and among our peers primarily because it excludes the effect of real estate depreciation and amortization and net gains on sales, which are based on historical costs and implicitly assume that the value of real estate diminishes predictably over time, rather than fluctuating based on existing market conditions. We believe that AFFO is an additional useful supplemental measure for investors to consider because it will help them to better assess our operating performance without the distortions created by other non-cash revenues or expenses. FFO and AFFO may not be comparable to similarly titled measures employed by other companies. 3 For the Quarter Ended June 30, 2021 |
| Earnings Release 4 For the Quarter Ended June 30, 2021 Press Release Contact: Matthew M. Partridge Senior Vice President, Chief Financial Officer and Treasurer (386) 944-5643 [email protected] FOR IMMEDIATE RELEASE CTO REALTY GROWTH REPORTS SECOND QUARTER 2021 OPERATING RESULTS DAYTONA BEACH, FL – July 29, 2021 – CTO Realty Growth, Inc. (NYSE: CTO) (the “Company” or “CTO”) today announced its operating results and earnings for the quarter ended June 30, 2021. Select Highlights ▪ Reported a Net Loss per diluted share of ($0.63) for the quarter ended June 30, 2021. ▪ Reported FFO and AFFO per diluted share of $0.83 and $1.07, respectively, for the quarter ended June 30, 2021. ▪ Paid a cash dividend for the second quarter of 2021 of $1.00 per share on June 30, 2021 to stockholders of record as of June 21, 2021. ▪ During the second quarter of 2021, acquired one multi-tenant, mixed use income property for $72.5 million. ▪ During the second quarter of 2021, disposed of eight single tenant income properties for a total disposition volume of $60.7 million, representing a weighted average exit cap rate of 7.1%. ▪ During the second quarter of 2021, sold approximately 9,300 acres of subsurface oil, gas and mineral rights for $0.7 million. ▪ Recognized a non-cash, unrealized gain of $3.4 million on the mark-to-market of the Company’s investment in Alpine Income Property Trust, Inc. (NYSE: PINE) during the second quarter of 2021. ▪ Executed an agreement to sell the Land JV’s (defined below) remaining holdings, of which the Company has a retained interest, for $67.0 million. ▪ Priced an underwritten public offering of 3,000,000 shares of 6.375% Series A Cumulative Redeemable Preferred Stock for $25.00 per share (the “Series A Preferred”). ▪ Book value per share outstanding as of June 30, 2021 was $58.51. ▪ The Company is revising its practice of declaring a quarterly cash common stock dividend concurrent with its quarterly earnings and instead anticipates announcing its quarterly cash common stock and Series A Preferred dividends for the third quarter of 2021 and for future periods at the end of the second month of the respective quarter. CEO Comments “We are encouraged by our second quarter execution and the progress we are making in constructing a high-quality multi- tenant, retail-based portfolio,” commented John P. Albright, President and Chief Executive Officer of CTO Realty Growth. |
| Earnings Release 5 For the Quarter Ended June 30, 2021 “We acquired a high-quality, class A, mixed use property in the Dallas market for $72.5 million and we continued to make good progress with the disposition of our single tenant assets, which totaled $61 million in the second quarter. The contract purchaser for the remaining Daytona Beach land holdings is in due diligence and we look forward to accretively reinvesting the expected proceeds into our core strategy. The combination of all of this activity, in addition to acquisition and disposition opportunities we anticipate materializing in the back half of the year, has us well-positioned to drive strong AFFO growth in 2022 as we execute on our diversified, retail-based investment strategy.” Quarterly Financial Results Highlights The tables below provide a summary of the Company’s operating results for the three months ended June 30, 2021: (in thousands) For the Three Months Ended June 30, 2021 For the Three Months Ended June 30, 2020 Variance to Comparable Period in the Prior Year Income Properties $ 11,574 $ 11,473 $ 101 0.9% Management Fee Income $ 752 $ 695 $ 57 8.2% Commercial Loan and Master Lease Investments $ 709 $ 835 $ (126) (15.1%) Real Estate Operations $ 1,248 $ 7 $ 1,241 17,728.6% Total Revenues $ 14,283 $ 13,010 $ 1,273 9.8% The increase in total revenue during the three months ended June 30, 2021 was primarily attributable to increased revenue from real estate operations related to the sale of subsurface interests. (in thousands, except per share data) For the Three Months Ended June 30, 2021 For the Three Months Ended June 30, 2020 Variance to Comparable Period in the Prior Year Net Income (Loss) $ (3,724) $ 12,611 $ (16,335) (129.5%) Net Income (Loss) per diluted share $ (0.63) $ 2.71 $ (3.34) (123.2%) FFO (1) $ 4,915 $ 2,532 $ 2,383 94.1% FFO per diluted share (1) $ 0.83 $ 0.54 $ 0.29 53.7% AFFO (1) $ 6,294 $ 443 $ 5,851 1,320.8% AFFO per diluted share (1) $ 1.07 $ 0.10 $ 0.97 970.0% Dividends Declared and Paid, per share $ 1.00 $ 0.25 $ 0.75 300.0% (1) See the “Non-GAAP Financial Measures” section and tables at the end of this press release for a discussion and reconciliation of Net Income (Loss) to non-GAAP financial measures, including FFO, FFO per diluted share, AFFO and AFFO per diluted share. The net loss for the three months ended June 30, 2021 was primarily attributable to a non-cash impairment charge on the Company’s retained interest in the joint venture that currently holds approximately 1,600 acres of undeveloped land in Daytona Beach, Florida (the “Land JV”) of $16.5 million, or $2.11 per diluted share, net of the related income tax benefit. The non-cash impairment charge is a result of the executed agreement to sell the Land JV’s remaining holdings. Additionally, during the three months ended June 30, 2021, the Company recognized gains on dispositions of income- producing properties totaling $4.7 million, or $0.80 per diluted share, in addition to a non-cash, unrealized gain of $3.4 million, or $0.57 per diluted share, on the mark-to-market of the Company’s investment in PINE due to the increase in the closing stock price of PINE during the quarter. Net Income (Loss) per diluted share, FFO per diluted share and AFFO per diluted share for the three months ended June 30, 2021 and the associated year-over-year comparisons include the dilutive effects of the Company’s previously announced special distribution that was intended to ensure that the Company distributed all of its previously undistributed earnings and |
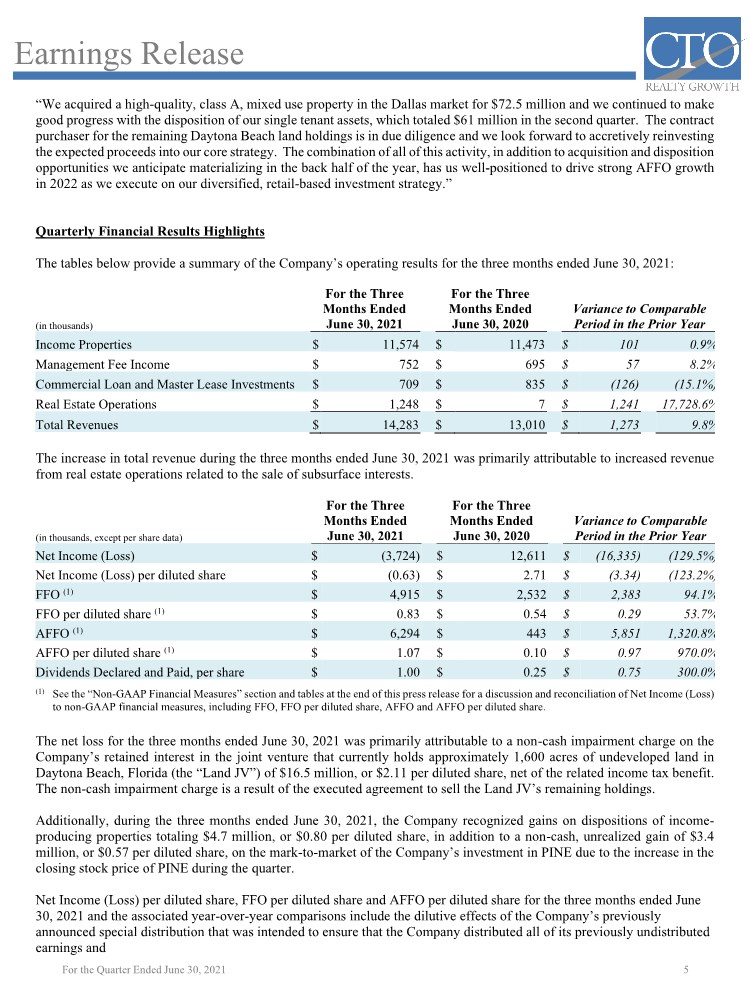
| Earnings Release 6 For the Quarter Ended June 30, 2021 profits attributable to taxable periods ended on or prior to December 31, 2019, as required in connection with the Company’s election to be taxable as a REIT commencing with its taxable year ended December 31, 2020. The Special Distribution was paid in the fourth quarter of 2020 through an aggregate of approximately $5.6 million in cash and the issuance of 1,198,963 shares of the Company’s common stock. Year-to-Date Financial Results Highlights The tables below provide a summary of the Company’s operating results for the six months ended June 30, 2021: (in thousands) For the Six Months Ended June 30, 2021 For the Six Months Ended June 30, 2020 Variance to Comparable Period in the Prior Year Income Properties $ 23,023 $ 22,476 $ 547 2.4% Management Fee Income $ 1,421 $ 1,397 $ 24 1.7% Commercial Loan and Master Lease Investments $ 1,410 $ 1,887 $ (477) (25.3%) Real Estate Operations $ 3,141 $ 88 $ 3,053 3,469.3% Total Revenues $ 28,995 $ 25,848 $ 3,147 12.2% The increase in total revenue during the six months ended June 30, 2021 was primarily attributable to increased revenue from real estate operations related to the sale of subsurface interests in addition to income produced by the Company’s recent income property acquisitions versus that of properties disposed of by the Company during the comparative period, offset by decreased revenue related to the timing of the Company’s investments in and dispositions of commercial loan and master lease investments. (in thousands, except per share data) For the Six Months Ended June 30, 2021 For the Six Months Ended June 30, 2020 Variance to Comparable Period in the Prior Year Net Income $ 4,061 $ 349 $ 3,712 1,063.61% Net Income per diluted share $ 0.69 $ 0.07 $ 0.62 885.7% FFO (1) $ 10,161 $ 11,822 $ (1,661) (14.1%) FFO per diluted share (1) $ 1.73 $ 2.52 $ (0.79) (31.3%) AFFO (1) $ 11,981 $ 9,625 $ 2,356 24.5% AFFO per diluted share (1) $ 2.03 $ 2.06 $ (0.03) (1.5%) Dividends Declared and Paid, per share $ 2.00 $ 0.50 $ 1.50 300.0% (1) See the “Non-GAAP Financial Measures” section and tables at the end of this press release for a discussion and reconciliation of Net Income to non-GAAP financial measures, including FFO, FFO per diluted share, AFFO and AFFO per diluted share. Net income for the six months ended June 30, 2021 includes gains on dispositions of income-producing properties totaling $5.4 million, or $0.92 per diluted share, in addition to a non-cash, unrealized gain of $8.2 million, or $1.40 per diluted share, on the mark-to-market of the Company’s investment in PINE due to the increase in the closing stock price of PINE during the period. Additionally, the Company recognized a non-cash impairment charge on the Company’s retained interest in the Land JV of $16.5 million, or $2.11 per diluted share, net of the related income tax benefit. The non-cash impairment charge is a result of the executed agreement to sell the Land JV’s remaining holdings. Net Income per diluted share, FFO per diluted share and AFFO per diluted share for the six months ended June 30, 2021 and the associated year-over-year comparisons include the dilutive effects of the Company’s previously announced special distribution that was intended to ensure that the Company distributed all of its previously undistributed earnings and profits attributable to taxable periods ended on or prior to December 31, 2019, as required in connection with the Company’s election to be taxable as a REIT commencing with its taxable year ended December 31, 2020. The Special Distribution was |
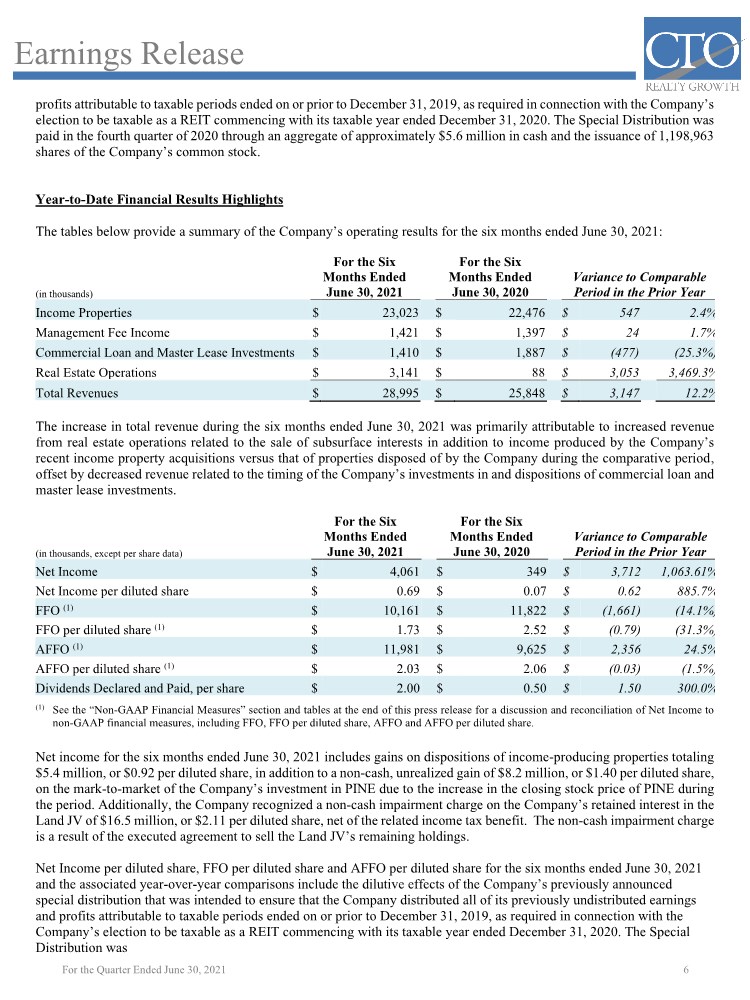
| Earnings Release 7 For the Quarter Ended June 30, 2021 paid in the fourth quarter of 2020 through an aggregate of approximately $5.6 million in cash and the issuance of 1,198,963 shares of the Company’s common stock. Acquisitions During the three months ended June 30, 2021, the Company acquired one multi-tenant, mixed use property for $72.5 million. During the six months ended June 30, 2021, the Company acquired three multi-tenant retail-based properties for total acquisition volume of $111.0 million. These acquisitions represent a weighted average going-in cash cap rate of 8.5%. Dispositions During the three months ended June 30, 2021, the Company sold eight single tenant income properties for total disposition volume of $60.7 million, reflecting a weighted average exit cap rate of 7.1%. The sale of the properties generated aggregate gains of $4.6 million. During the six months ended June 30, 2021, the Company sold ten, primarily single tenant income properties for total disposition volume of $65.5 million, reflecting a weighted average exit cap rate of 7.1%. The sale of the properties generated aggregate gains of $5.4 million. On July 14, 2021, the Company sold a property leased to Chick-fil-A for a sales price of $2.9 million, reflecting an exit cap rate of 4.5%. The property is an outparcel to Crossroads Towne Center, the Company’s multi-tenant income property located in Chandler, Arizona. On July 27, 2021, the Company sold a property leased to JPMorgan Chase Bank for a sales price of $4.7 million, reflecting an exit cap rate of 4.6%. The property is also an outparcel to Crossroads Towne Center. Income Property Portfolio As of June 30, 2021, the Company’s portfolio had economic occupancy of 90.6% and physical occupancy of 90.4%. The Company’s income property portfolio consisted of the following as of June 30, 2021: Property Type # of Properties Square Feet Weighted Average Remaining on Lease Term Single-Tenant (1) 12 1,115 21.1 years Multi-Tenant 8 1,566 6.3 years Total / Weighted Average Lease Term 20 2,681 12.2 years % of Cash Rent attributable to Retail Tenants 58% % of Cash Rent attributable to Office Tenants 40% % of Cash Rent attributable to Hotel Ground Lease 2% Square feet in thousands. (1) The 12 single-tenant properties include (i) a property leased to The Carpenter Hotel which is under a long-term ground lease and includes two tenant repurchase options and (ii) a property in Hialeah leased to a master tenant which includes three tenant repurchase options. Pursuant to FASB ASC Topic 842, Leases, the $16.3 and $21.0 million investments, respectively, have been recorded in the Company’s consolidated balance sheets as Commercial Loan and Master Lease Investments. |
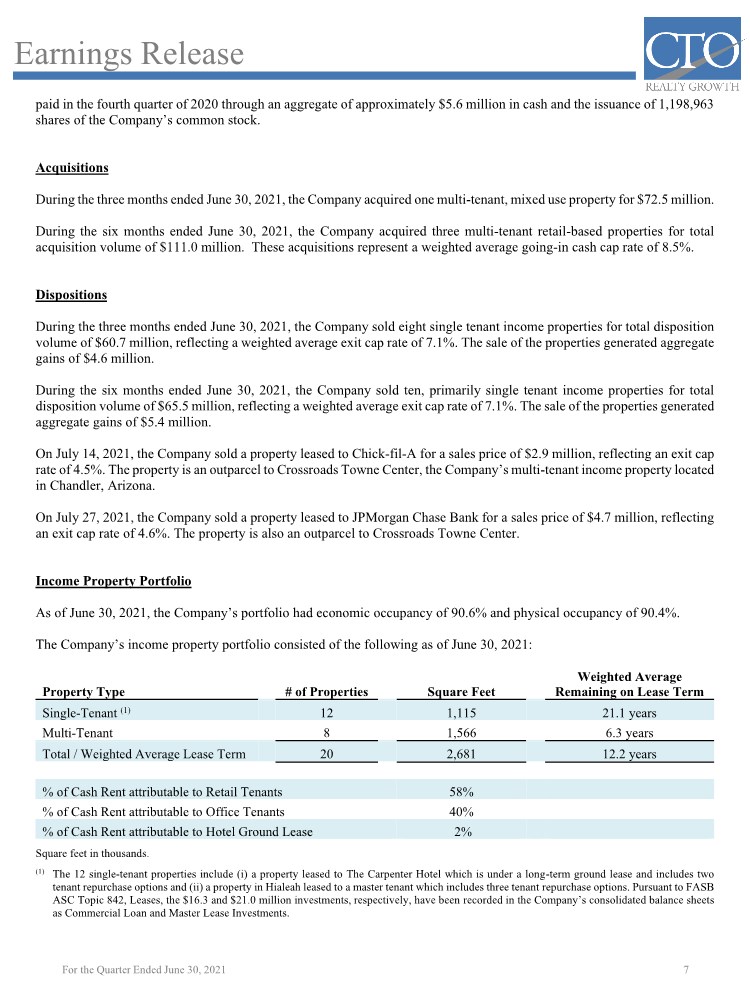
| Earnings Release 8 For the Quarter Ended June 30, 2021 Operational Highlights During the second quarter of 2021, CTO signed leases totaling 186,055 square feet. A summary of the Company’s leasing activity is as follows: Retail Square Feet Weighted Average Lease Term Cash Rent Per Square Foot Tenant Improvements Leasing Commissions New Leases 22.1 9.9 years $ 21.08 $ 2,734 $ 146 Renewals & Extensions 164.0 5.3 years $ 8.98 633 23 Total / Weighted Average 186.1 6.4 years $ 10.42 $ 3,367 $ 169 In thousands except for per square foot and lease term data. Land Joint Venture During the three months ended June 30, 2021, the Land JV entered into an agreement to sell its remaining land holdings, including any land previously under contract, for $67.0 million. The sale is anticipated to occur prior to the end of 2021. Subsurface Interests During the three months ended June 30, 2021, the Company sold approximately 9,300 acres of subsurface oil, gas and mineral rights for $0.7 million, resulting in a gain equal to the sales price. During the six months ended June 30, 2021, the Company sold approximately 34,500 acres of subsurface oil, gas and mineral rights for $2.6 million, resulting in a gain on the sale of $2.5 million. As of June 30, 2021, the Company owns full or fractional subsurface oil, gas, and mineral interests underlying approximately 420,000 “surface” acres of land owned by others in 20 counties in Florida. Capital Markets and Balance Sheet During the three months ended June 30, 2021, the Company completed the following notable capital markets transactions: ▪ On April 1, 2021, the Company filed a shelf registration statement on Form S-3, registering the possible issuance and sale of common stock, preferred stock, warrants, rights, and units with a maximum aggregate offering price of up to $350.0 million. ▪ On April 30, 2021, the Company implemented a $150.0 million “at-the-market” or ATM equity offering program (the “2021 ATM Program”) pursuant to which the Company may sell, from time to time, shares of the Company’s common stock. The Company was not active under the ATM Program during the six months ended June 30, 2021. ▪ On May 14, 2021, the Company repurchased $0.8 million aggregate principal amount of 2025 convertible senior notes. ▪ On June 28, 2021, the Company priced a public offering of 3,000,000 shares of its 6.375% Series A Cumulative Redeemable Preferred Stock at a public offering price of $25.00 per share. The offering closed on July 6, 2021 and generated total net proceeds to the Company of $72.4 million, which were utilized to pay down the Company’s revolving credit facility. ▪ On June 30, 2021, the Company’s $30.0 million mortgage note payable was assumed by PINE in connection with the Company’s sale of six net lease properties to PINE. |

| Earnings Release 9 For the Quarter Ended June 30, 2021 The following table provides a summary of the Company’s long-term debt, at face value, as of June 30, 2021: Component of Long-Term Debt Principal Interest Rate Maturity Date Revolving Credit Facility (1) $100.0 million 0.7325% + [1.35% – 1.95%] May 2023 Revolving Credit Facility $84.3 million 30-day LIBOR + [1.35% - 1.95%] May 2023 2025 Convertible Senior Notes $61.7 million 3.88% April 2025 2026 Term Loan (2) $65.0 million 0.2200% + [1.35% – 1.95%] March 2026 Total Debt / Weighted Average Interest Rate $311.0 million 2.27% (1) Effective March 31, 2020, the Company utilized an interest rate swap to achieve a fixed LIBOR rate of 0.7325% plus the applicable spread on $100.0 million of the outstanding balance on the revolving credit facility. (2) Effective March 10, 2021, the Company redesignated the interest rate swap that previously hedged $50.0 million of the outstanding balance on the revolving credit facility to $50.0 million principal balance on the term loan. Dividends The Company paid a cash dividend for the second quarter of 2021 of $1.00 per share, on June 30, 2021 to stockholders of record as of the close of business on June 21, 2021. The Company is revising its practice of declaring a quarterly cash common stock dividend concurrent with its quarterly earnings and instead anticipates announcing its quarterly cash common stock and Series A preferred stock dividends for the third quarter of 2021 and for future periods at the end of the second month of the respective quarter. 2021 Outlook The Company has revised its outlook for 2021 to take into account the Company’s second quarter performance and the expected impact of the Company’s various investment activities and capital markets transactions, including the recent Series A preferred equity issuance. The Company’s outlook for 2021, which does not include any potential tax expense or tax benefit related to the Company’s retained ownership in the Land JV, assumes continued improvement in economic activity, stable or positive business trends related to each of our tenants and other significant assumptions. 2021 Outlook Low High Acquisition of Income Producing Assets $175.0 million $225.0 million Target Investment Initial Cash Yield 7.25% 7.50% Disposition of Assets $125.0 million $150.0 million Target Disposition Cash Yield 5.75% 6.25% FFO Per Diluted Share $3.65 $3.85 AFFO Per Diluted Share $4.00 $4.20 Weighted Average Diluted Shares Outstanding 6.0 million 6.0 million |
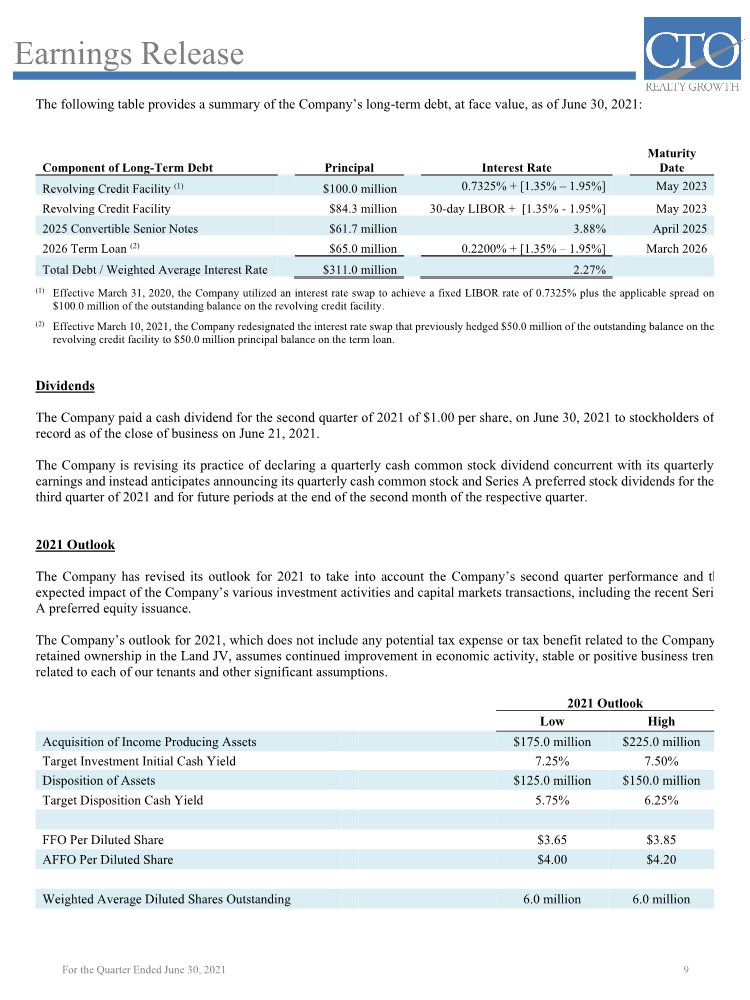
| Earnings Release 10 For the Quarter Ended June 30, 2021 COVID-19 Pandemic In March 2020, the World Health Organization declared the outbreak of the novel coronavirus as a pandemic (the “COVID- 19 Pandemic”), which has spread throughout the United States. The impact of the COVID-19 Pandemic has evolved rapidly, with many jurisdictions taking drastic measures to limit the spread of the virus by instituting quarantines or lockdowns and imposing travel restrictions. Such actions have created significant disruptions to global supply chains, and adversely impacted several industries, including airlines, hospitality, retail and the broader real estate industry. As a result of the approval of multiple COVID-19 vaccines for use and the distribution of such vaccines among the general population, a number of jurisdictions have reopened and loosened restrictions. However, wide disparities in vaccination rates and continued vaccine hesitancy, combined with the emergence of COVID-19 variants and surges in COVID-19 cases, could trigger the reinstatement of further restrictions. Such restrictions could include mandatory business shut-downs, travel restrictions, reduced business operations and social distancing requirements. The future impact of the COVID-19 Pandemic on the real estate industry and the Company’s financial condition and results of operations is uncertain and cannot be predicted currently since it depends on several factors beyond the control of the Company, including, but not limited to: (i) the uncertainty surrounding the severity and duration of the COVID-19 Pandemic, including possible recurrences and differing economic and social impacts of the COVID-19 Pandemic in various regions of the United States; (ii) the effectiveness of the United States public health response; (iii) the COVID-19 Pandemic’s impact on the United States and global economies; (iv) the timing, scope and effectiveness of additional governmental responses to the COVID-19 Pandemic; (v) the availability of a treatment and effectiveness of vaccines approved for COVID-19 and the willingness of individuals to get vaccinated; (vi) changes in how certain types of commercial property are used while maintaining social distancing and other techniques intended to control the impact of COVID-19; (vii) the impact of phase out of economic stimulus measures, the inflationary pressure of economic stimulus, and the eventual halt and reversal by the U.S. Treasury of asset purchases; and (viii) the uneven impact on the Company’s tenants, real estate values and cost of capital. 2nd Quarter Earnings Conference Call & Webcast The Company will host a conference call to present its operating results for the quarter ended June 30, 2021, on Friday, July 30, 2021, at 9:00 AM ET. Stockholders and interested parties may access the earnings call via teleconference or webcast: Teleconference: USA (Toll Free) 1-888-317-6003 International: 1-412-317-6061 Canada (Toll Free): 1-866-284-3684 Please dial in at least fifteen minutes prior to the scheduled start time and use the code 7119381 when prompted. A webcast of the call can be accessed at: https://services.choruscall.com/links/cto210730.html. To access the webcast, log on to the web address noted above or go to http://www.ctoreit.com and log in at the investor relations section. Please log in to the webcast at least ten minutes prior to the scheduled time of the Earnings Call. About CTO Realty Growth, Inc. CTO Realty Growth, Inc. is a publicly traded real estate investment trust that owns and operates a portfolio of high-quality, retail-based properties located primarily in higher growth markets in the United States. CTO also owns an approximate 16% interest in Alpine Income Property Trust, Inc. (NYSE: PINE), a publicly traded net lease REIT. We encourage you to review our most recent investor presentation, which is available on our website at www.ctoreit.com. |
| Earnings Release 11 For the Quarter Ended June 30, 2021 Safe Harbor Certain statements contained in this press release (other than statements of historical fact) are forward-looking statements within the meaning of Section 27A of the Securities Act of 1933, as amended and Section 21E of the Securities Exchange Act of 1934, as amended. Forward-looking statements can typically be identified by words such as “believe,” “estimate,” “expect,” “intend,” “anticipate,” “will,” “could,” “may,” “should,” “plan,” “potential,” “predict,” “forecast,” “project,” and similar expressions, as well as variations or negatives of these words. Although forward-looking statements are made based upon management’s present expectations and reasonable beliefs concerning future developments and their potential effect upon the Company, a number of factors could cause the Company’s actual results to differ materially from those set forth in the forward-looking statements. Such factors may include, but are not limited to: the Company’s ability to remain qualified as a REIT; the Company’s exposure to U.S. federal and state income tax law changes, including changes to the REIT requirements; general adverse economic and real estate conditions; the ultimate geographic spread, severity and duration of pandemics such as the recent outbreak of the novel coronavirus, actions that may be taken by governmental authorities to contain or address the impact of such pandemics, and the potential negative impacts of such pandemics on the global economy and the Company’s financial condition and results of operations; the inability of major tenants to continue paying their rent or obligations due to bankruptcy, insolvency or a general downturn in their business; the loss or failure, or decline in the business or assets of PINE or the venture formed when the Company sold its controlling interest in the entity that owned the Company’s remaining land portfolio, of which the Company has a retained interest; the completion of 1031 exchange transactions; the availability of investment properties that meet the Company’s investment goals and criteria; the uncertainties associated with obtaining required governmental permits and satisfying other closing conditions for planned acquisitions and sales; and the uncertainties and risk factors discussed in the Company’s Annual Report on Form 10-K for the fiscal year ended December 31, 2020 and other risks and uncertainties discussed from time to time in the Company’s filings with the U.S. Securities and Exchange Commission. There can be no assurance that future developments will be in accordance with management’s expectations or that the effect of future developments on the Company will be those anticipated by management. Readers are cautioned not to place undue reliance on these forward-looking statements, which speak only as of the date of this press release. The Company undertakes no obligation to update the information contained in this press release to reflect subsequently occurring events or circumstances. Non-GAAP Financial Measures Our reported results are presented in accordance with GAAP. We also disclose Funds From Operations (“FFO”) and Adjusted Funds From Operations (“AFFO”), both of which are non-GAAP financial measures. We believe these two non- GAAP financial measures are useful to investors because they are widely accepted industry measures used by analysts and investors to compare the operating performance of REITs. FFO and AFFO do not represent cash generated from operating activities and are not necessarily indicative of cash available to fund cash requirements; accordingly, they should not be considered alternatives to net income as a performance measure or cash flows from operating activities as reported on our statement of cash flows as a liquidity measure and should be considered in addition to, and not in lieu of, GAAP financial measures. We compute FFO in accordance with the definition adopted by the Board of Governors of the National Association of Real Estate Investment Trusts, or NAREIT. NAREIT defines FFO as GAAP net income or loss adjusted to exclude extraordinary items (as defined by GAAP), net gain or loss from sales of depreciable real estate assets, impairment write- downs associated with depreciable real estate assets and real estate related depreciation and amortization, including the pro rata share of such adjustments of unconsolidated subsidiaries. The Company also excludes the gains or losses from sales of assets incidental to the primary business of the REIT which specifically include the sales of mitigation credits, impact fee credits, subsurface sales, and the land sales gains included in discontinued operations. To derive AFFO, we modify the NAREIT computation of FFO to include other adjustments to GAAP net income related to non-cash revenues and expenses such as straight-line |
| Earnings Release 12 For the Quarter Ended June 30, 2021 rental revenue, amortization of deferred financing costs, amortization of capitalized lease incentives and above- and below- market lease related intangibles, and non-cash compensation. Such items may cause short-term fluctuations in net income but have no impact on operating cash flows or long-term operating performance. We use AFFO as one measure of our performance when we formulate corporate goals. FFO is used by management, investors and analysts to facilitate meaningful comparisons of operating performance between periods and among our peers primarily because it excludes the effect of real estate depreciation and amortization and net gains on sales, which are based on historical costs and implicitly assume that the value of real estate diminishes predictably over time, rather than fluctuating based on existing market conditions. We believe that AFFO is an additional useful supplemental measure for investors to consider because it will help them to better assess our operating performance without the distortions created by other non-cash revenues or expenses. FFO and AFFO may not be comparable to similarly titled measures employed by other companies. |
| Consolidated Balance Sheets 13 For the Quarter Ended June 30, 2021 CTO Realty Growth, Inc. Consolidated Balance Sheets (In thousands, except share and per share data) As of (Unaudited) June 30, 2021 December 31, 2020 ASSETS Real Estate: Land, at cost $ 172,304 $ 166,512 Building and Improvements, at cost 320,769 305,614 Other Furnishings and Equipment, at cost 682 672 Construction in Process, at cost 1,351 323 Total Real Estate, at cost 495,106 473,121 Less, Accumulated Depreciation (31,211) (30,737) Real Estate—Net 463,895 442,384 Land and Development Costs 6,684 7,083 Intangible Lease Assets—Net 71,470 50,176 Assets Held for Sale 3,720 833 Investment in Joint Ventures 32,497 48,677 Investment in Alpine Income Property Trust, Inc. 38,794 30,574 Mitigation Credits 2,621 2,622 Commercial Loan and Master Lease Investments 38,884 38,320 Cash and Cash Equivalents 4,701 4,289 Restricted Cash 13,918 29,536 Refundable Income Taxes 599 26 Deferred Income Taxes—Net 473 — Other Assets 11,616 12,180 Total Assets $ 689,872 $ 666,700 LIABILITIES AND STOCKHOLDERS’ EQUITY Liabilities: Accounts Payable $ 1,332 $ 1,047 Accrued and Other Liabilities 11,437 9,090 Deferred Revenue 4,036 3,319 Intangible Lease Liabilities—Net 22,459 24,163 Liabilities Held for Sale 831 831 Deferred Income Taxes—Net — 3,521 Long-Term Debt 304,886 273,830 Total Liabilities 344,981 315,801 Commitments and Contingencies Stockholders’ Equity: Preferred Stock – 100,000,000 shares authorized; $0.01 par value, no shares issued or outstanding at June 30, 2021; 50,000 shares authorized; $100.00 par value, no shares issued or outstanding at December 31, 2020 — — Common Stock – 500,000,000 shares authorized; $0.01 par value, 5,955,154 shares issued and outstanding at June 30, 2021; 25,000,000 shares authorized; $1.00 par value, 7,310,680 shares issued and 5,915,756 shares outstanding at December 31, 2020 60 7,250 Treasury Stock – 0 shares at June 30, 2021 and 1,394,924 shares at December 31, 2020 — (77,541) Additional Paid-In Capital 13,676 83,183 Retained Earnings 331,895 339,917 Accumulated Other Comprehensive Loss (740) (1,910) Total Stockholders’ Equity 344,891 350,899 Total Liabilities and Stockholders’ Equity $ 689,872 $ 666,700 |
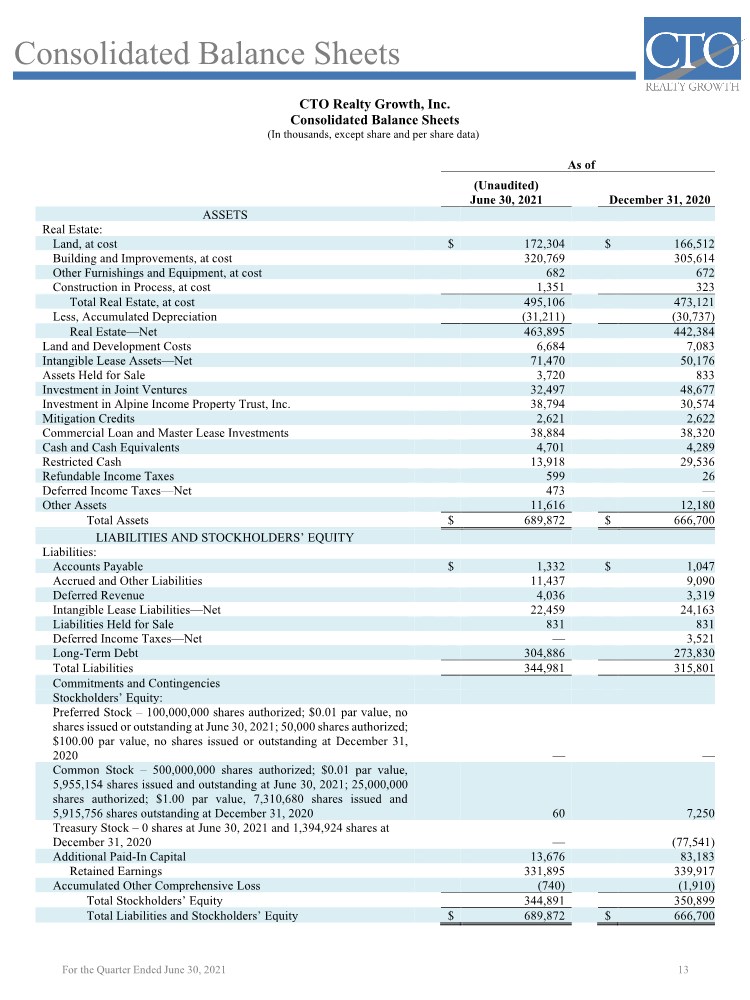
| Consolidated Statements of Operations 14 For the Quarter Ended June 30, 2021 CTO Realty Growth, Inc. Consolidated Statements of Operations (Unaudited, in thousands, except share, per share and dividend data) Three Months Ended Six Months Ended June 30, 2021 June 30, 2020 June 30, 2021 June 30, 2020 Revenues Income Properties $ 11,574 $ 11,473 $ 23,023 $ 22,476 Management Fee Income 752 695 1,421 1,397 Interest Income from Commercial Loan and Master Lease Investments 709 835 1,410 1,887 Real Estate Operations 1,248 7 3,141 88 Total Revenues 14,283 13,010 28,995 25,848 Direct Cost of Revenues Income Properties (2,787) (2,568) (5,704) (4,681) Real Estate Operations (533) (57) (615) (1,581) Total Direct Cost of Revenues (3,320) (2,625) (6,319) (6,262) General and Administrative Expenses (2,665) (2,171) (5,797) (5,263) Impairment Charges (16,527) — (16,527) (1,905) Depreciation and Amortization (5,031) (5,021) (9,861) (9,573) Total Operating Expenses (27,543) (9,817) (38,504) (23,003) Gain on Disposition of Assets 4,732 7,076 5,440 7,076 Gain (Loss) on Extinguishment of Debt (641) 504 (641) 1,141 Other Gains and Income 4,091 7,580 4,799 8,217 Total Operating Income (Loss) (9,169) 10,773 (4,710) 11,062 Investment and Other Income (Loss) 3,903 8,470 9,235 (4,716) Interest Expense (2,421) (2,453) (4,865) (5,906) Income (Loss) from Operations Before Income Tax Benefit (Expense) (7,687) 16,790 (340) 440 Income Tax Benefit (Expense) 3,963 (4,179) 4,401 (91) Net Income (Loss) $ (3,724) $ 12,611 $ 4,061 $ 349 Per Share Information: Basic and Diluted $ (0.63) $ 2.71 $ 0.69 $ 0.07 Weighted Average Number of Common Shares: Basic 5,898,280 4,653,627 5,888,735 4,682,511 Diluted 5,898,280 4,653,627 5,888,735 4,682,511 Dividends Declared and Paid $ 1.00 $ 0.25 $ 2.00 $ 0.50 |
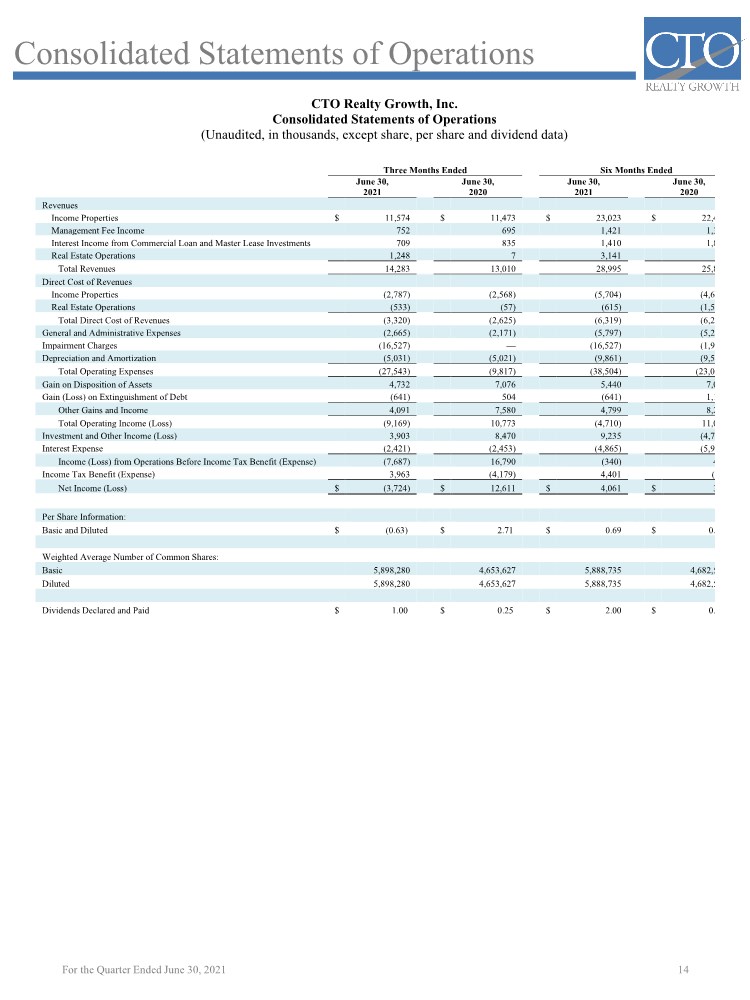
| Non-GAAP Financial Measures 15 For the Quarter Ended June 30, 2021 CTO Realty Growth, Inc. Non-GAAP Financial Measures (Unaudited, in thousands, except per share data) Three Months Ended Six Months Ended June 30, 2021 June 30, 2020 June 30, 2021 June 30, 2020 Net Income (Loss) $ (3,724) $ 12,611 $ 4,061 $ 349 Depreciation and Amortization 5,031 5,021 9,861 9,573 Gains on Disposition of Assets (4,732) (7,076) (5,440) (7,076) Losses (Gains) on the Disposition of Other Assets (748) 32 (2,575) 1,421 Impairment Charges, Net 12,474 — 12,474 1,905 Unrealized (Gain) Loss on Investment Securities (3,386) (8,056) (8,220) 5,650 Funds from Operations $ 4,915 $ 2,532 $ 10,161 $ 11,822 Adjustments: Straight-Line Rent Adjustment (490) (802) (1,175) (1,140) COVID-19 Rent Repayments (Deferrals), Net 434 (1,151) 654 (1,151) Amortization of Intangibles to Lease Income (338) (444) (734) (918) Contributed Leased Assets Accretion (38) (44) (159) (87) Loss (Gain) on Extinguishment of Debt 641 (504) 641 (1,141) Amortization of Discount on Convertible Debt 319 256 629 760 Non-Cash Compensation 742 699 1,700 1,518 Non-Recurring G&A 62 — 155 102 Amortization of Deferred Financing Costs to Interest Expense 159 73 324 223 Accretion of Loan Origination Fees (1) (69) (1) (157) Non-Cash Imputed Interest (111) (103) (214) (206) Adjusted Funds from Operations $ 6,294 $ 443 $ 11,981 $ 9,625 FFO per diluted share $ 0.83 $ 0.54 $ 1.73 $ 2.52 AFFO per diluted share $ 1.07 $ 0.10 $ 2.03 $ 2.06 |
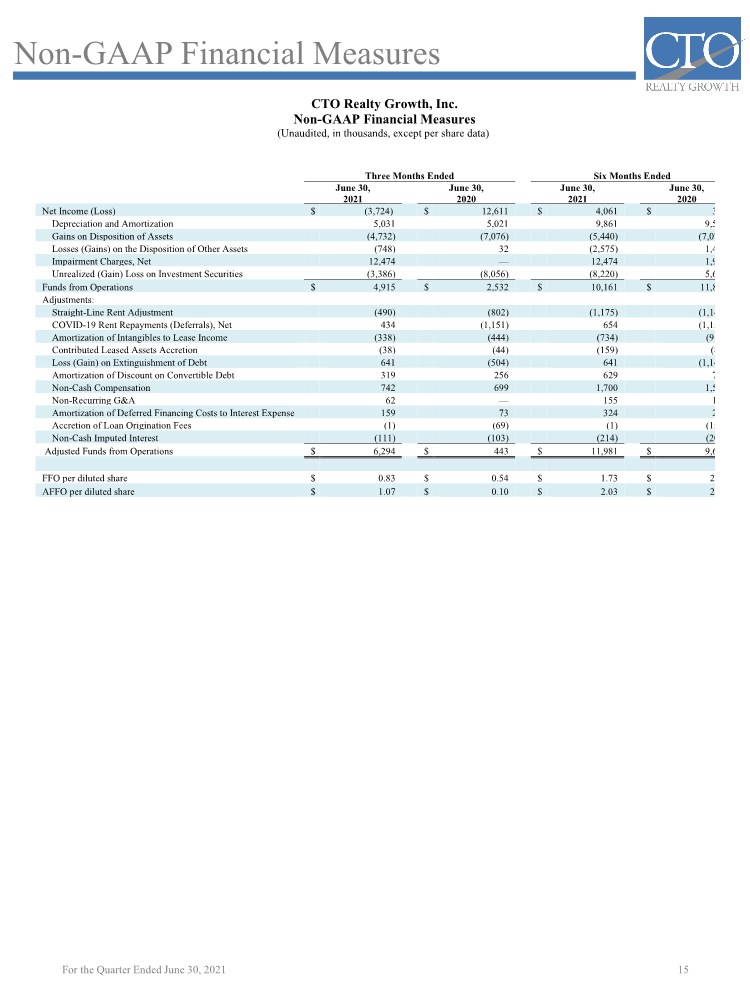
| Summary of Debt 16 Notes Payable Principal Interest Rate Maturity Date Revolving Credit Facility – Fixed (1) $100.0 million 0.7325% + [1.35% – 1.95%] May 2023 Revolving Credit Facility – Variable 84.3 million 30-day LIBOR + [1.35% – 1.95%] May 2023 2025 Convertible Senior Notes 61.7 million 3.88% April 2025 2026 Term Loan – Fixed (2) 50.0 million 0.2200% + [1.35% – 1.95%] March 2026 2026 Term Loan – Variable 15.0 million 30-day LIBOR + [1.35% – 1.95%] March 2026 Total Notes / Weighted- Average Interest Rate $311.0 million 2.27% Fixed vs. Variable Principal Interest Rate % of Total Total Fixed Rate Debt $211.7 million 2.59% 68% Total Variable Rate Debt 99.3 million 30-day LIBOR + [1.35% – 1.95%] 32% Total Debt $311.0 million 2.27% 100% Net Debt to Total Enterprise Value 48% Any differences a result of rounding. (1) Effective March 31, 2020, the Company utilized an interest rate swap to achieve a fixed LIBOR rate of 0.7325% plus the applicable spread on $100.0 million of the outstanding balance on the revolving credit facility. (2) Effective March 10, 2021, the Company redesignated the interest rate swap that previously hedged $50.0 million of the outstanding balance on the revolving credit facility to $50.0 million principal balance on the term loan. For the Quarter Ended June 30, 2021 |
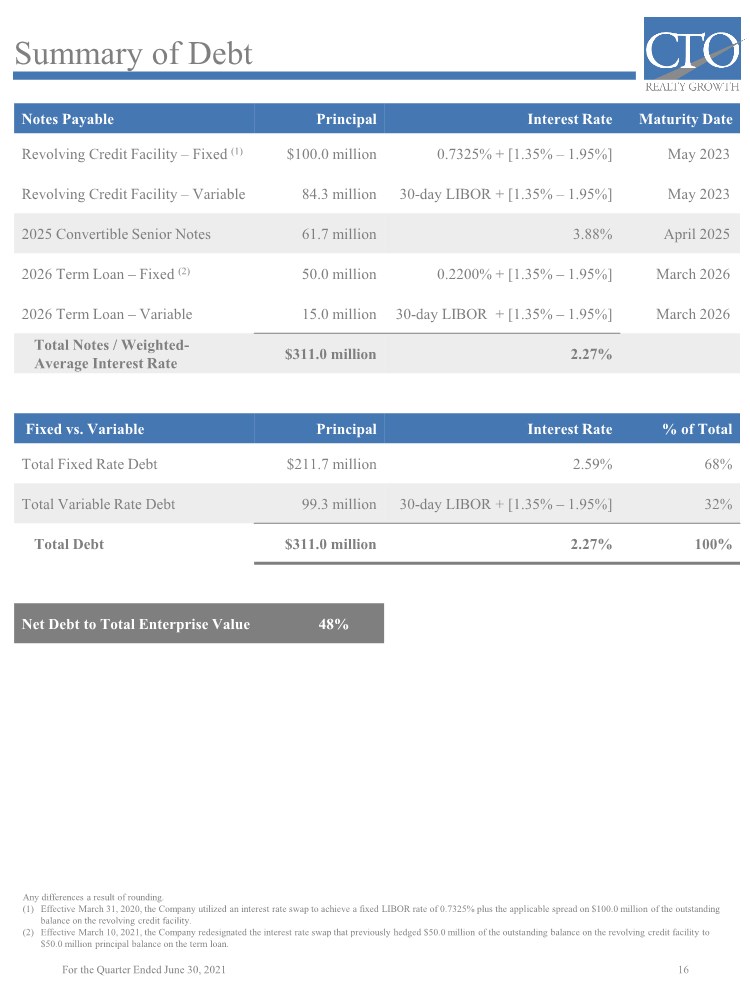
| Notable Acquisitions & Dispositions 17 Property Property Type Date Square Feet Price Gain World of Beer & Fuzzy’s Taco Shop - Brandon, FL Multi-Tenant Retail 1/20/2021 6,715 $2.3 $0.6 Moe’s Southwest Grill - Jacksonville, FL Single Tenant Retail 2/23/2021 3,111 2.5 0.1 Burlington - North Richland Hills, TX Single Tenant Retail 4/23/2021 70,891 11.5 0.1 Staples - Sarasota, FL Single Tenant Retail 5/7/2021 18,120 4.7 0.7 Walgreens - Clermont, FL Single Tenant Retail 6/30/2021 13,650 Sold as a Portfolio for $44.5 Gain on Sale of the Portfolio $3.9 Harris Teeter - Charlotte, NC Single Tenant Retail 6/30/2021 45,089 Lowe's - Katy, TX Single Tenant Retail 6/30/2021 131,644 Big Lots - Glendale, AZ Single Tenant Retail 6/30/2021 34,512 Rite Aid - Renton, WA Single Tenant Retail 6/30/2021 16,280 Big Lots - Germantown, MD Single Tenant Retail 6/30/2021 25,589 Total Dispositions 10 properties 365,601 $65.5 $5.4 Property Property Type Date Price Square Feet % Leased at Acquisition Jordan Landing – West Jordan, UT (Salt Lake City, UT) Multi-Tenant Retail 3/2/2021 $20.0 170,996 100% Eastern Commons – Henderson, NV (Las Vegas, NV) Multi-Tenant Retail 3/10/2021 18.5 146,667 88% The Shops at Legacy – Plano, TX (Dallas, TX) Multi-Tenant Retail 6/23/2021 72.5 236,432 83% Total Acquisitions 3 Properties $111.0 554,095 $ in millions. Any differences a result of rounding For the Quarter Ended June 30, 2021 |
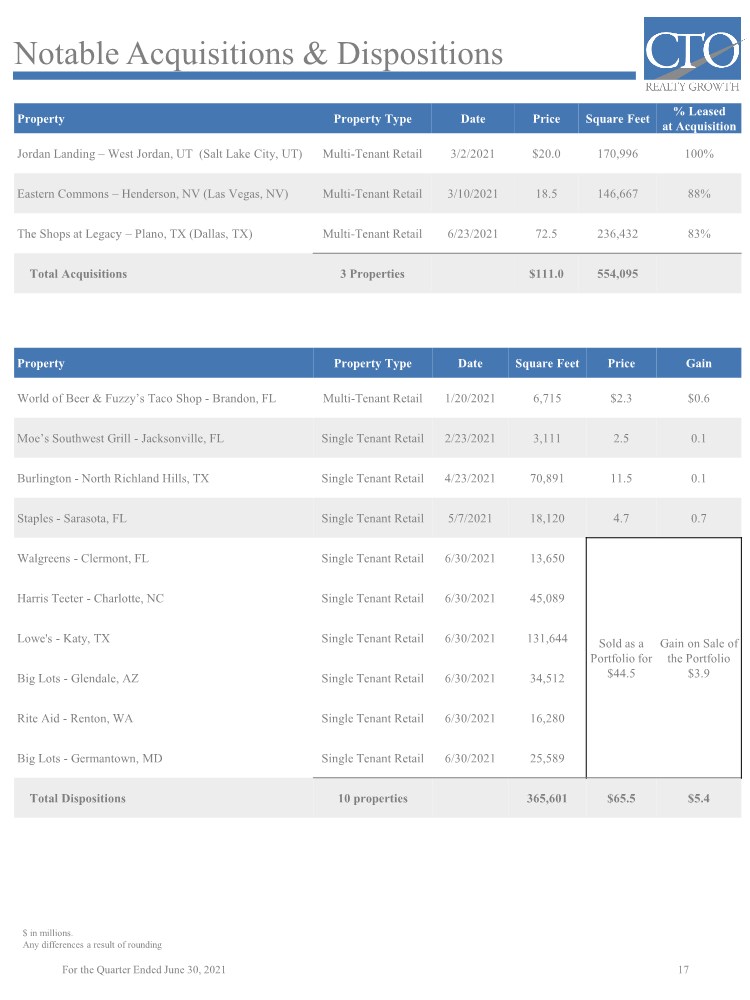
| Summary of Joint Ventures 18 Land Joint Venture Q2 2021 Since Inception Land Sales Acres Sold - acres 3,800 acres Sales Price $ - $79.7 million Distributions to Joint Venture Partner $ - $76.3 million Partner Capital Balance as of June 30, 2021 $33.4 million * The Company executed an agreement to sell the Land Joint Venture’s remaining holdings, of which the Company has a retained interest, for $67.0 million. Closing is expected to occur prior to year-end. There can be no assurances regarding the likelihood, timing, or final terms of such potential sale. Acres of Land Remaining to be Sold 1,600 acres Estimated Value $67.0 million Mitigation Bank Joint Venture Q2 2021 Since Inception Mitigation Credit Sales Sales Price $ - $6.1 million Distributions to Joint Venture Partner $ - $6.1 million * The Company is in discussions with BlackRock regarding the Company’s potential buyout of BlackRock’s position in the Mitigation Bank Joint Venture, the timing of which could occur in the latter half of 2021. There can be no assurances regarding the likelihood, timing, or final terms of such potential buyout. For the Quarter Ended June 30, 2021 |
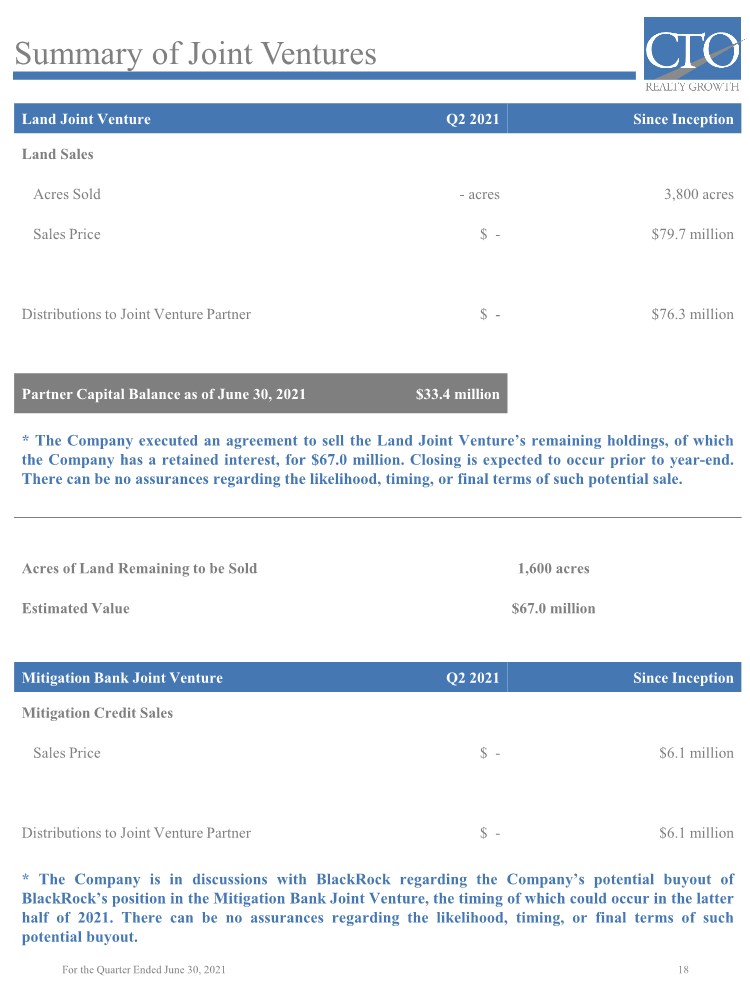
| Schedule of Other Assets 19 Subsurface Interests Acreage Estimated Value Acres Available for Sale (1) 420,000 acres $9.4 million Land & Development Acreage Estimated Value Downtown Daytona Land – Combined Parcels 6.0 acres Total Land & Development 6.0 acres $6.3 million All numbers in thousands except for acres and unless otherwise noted. (1) Includes royalty, half interest and full interest acreage, with and without entry rights. Commercial Loans Origination Date Maturity Date Original Loan Amount Carrying Value Interest Rate Mortgage Note – 4311 Maple Avenue, Dallas, TX October 2020 April 2023 $400 $393 7.50% Mortgage Note – 110 N. Beach St., Daytona Beach, FL June 2021 December 2022 $364 $364 10.00% Investment Securities Shares and Operating Partnership Units Owned Value Per Share at June 30, 2021 Estimated Value Alpine Income Property Trust 2,040 $19.02 per share $38.8 million For the Quarter Ended June 30, 2021 |
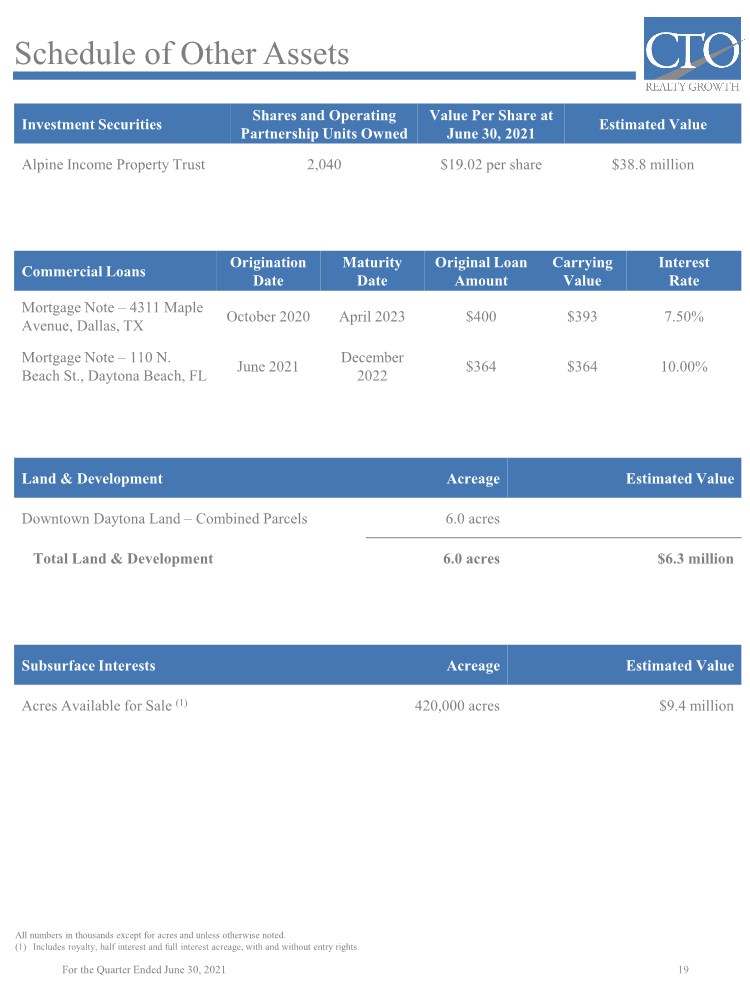
| Leasing Summary 20 Renewals & Extensions (1) Q1 2021 Q2 2021 2021 YTD Leases 11 3 14 Square Feet 130.0 164.0 294.0 New Cash Rent PSF $12.19 $8.98 $10.40 Tenant Improvements $97 $633 $730 Leasing Commissions $88 $23 $111 Weighted Average Term 5.2 years 5.3 years 5.2 years All numbers in thousands except per square foot data and unless otherwise noted. Any differences a result of rounding. (1) Renewal and extension leases represent the same tenant in the same location, with renewal leases representing expiring leases rolling over and extensions representing existing leases being extended for additional term and/or additional rent. New Leases Q1 2021 Q2 2021 2021 YTD Leases 3 6 9 Square Feet 3.5 22.1 25.6 New Cash Rent PSF $46.95 $21.08 $24.68 Tenant Improvements $56 $2,734 $2,790 Leasing Commissions $99 $146 $245 Weighted Average Term 9.1 years 9.9 years 9.7 years All Leases Summary Q1 2021 Q2 2021 2021 YTD Leases 14 9 23 Square Feet 133.5 186.1 319.6 New Cash Rent PSF $13.12 $10.42 $11.55 Tenant Improvements $153 $3,367 $3,520 Leasing Commissions $187 $169 $356 Weighted Average Term 5.5 years 6.4 years 6.0 years For the Quarter Ended June 30, 2021 |
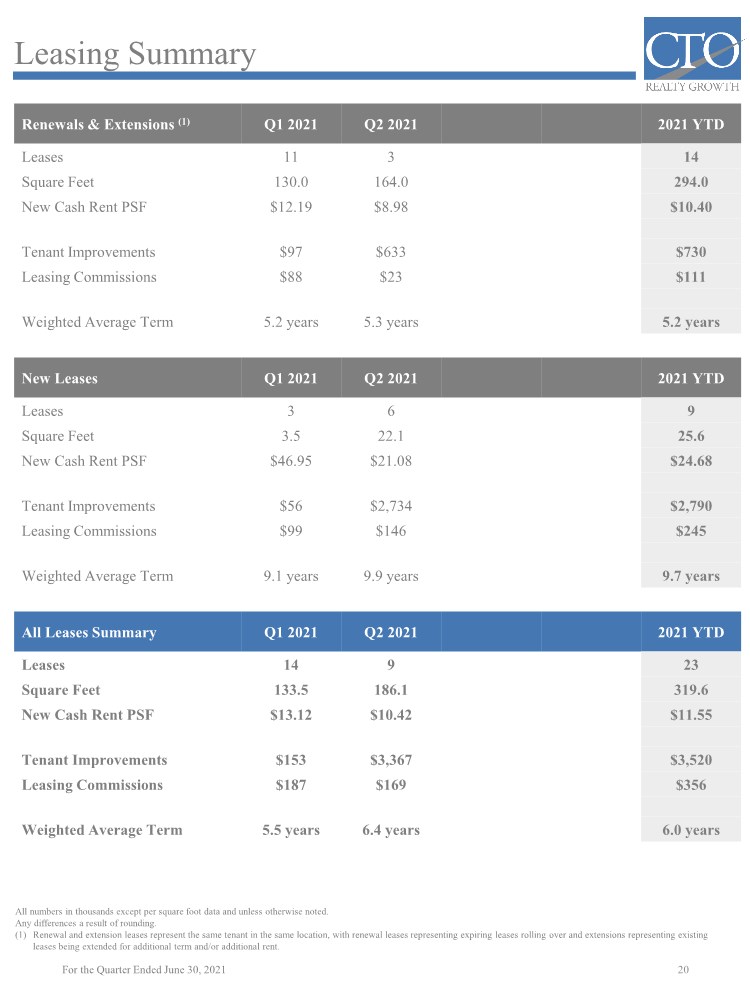
| Portfolio Diversification 21 Tenant or Concept Credit Rating (1) Square Feet Annualized Base Rent Percent of Annualized Base Rent BBB 210 $ 3,646 7.9% A+ 450 2,784 6.0% Not Rated 74 2,464 5.3% BB+ 121 2,284 4.9% CCC+ 59 2,191 4.7% Master Lease Tenant of Westland Gateway Plaza Not Rated 108 1,730 3.7% B 192 1,600 3.5% A 64 1,564 3.4% CCC+ 46 1,560 3.4% Not Rated 55 747 1.6% BB+ 47 716 1.5% Not Rated 6 705 1.5% A 10 691 1.5% CCC+ 28 683 1.5% BBB+ 36 630 1.4% Other - 978 22,214 48.1% Vacant - 196 -- Total Portfolio 2,681 $ 46,208 100.0% All numbers in thousands unless otherwise noted. Any differences a result of rounding. (1) A credit rated, or investment grade rated tenant (rating of BBB-, NAIC-2 or Baa3 or higher) is a tenant or the parent of a tenant with a credit rating from S&P Global Ratings, Moody’s Investors Service, Fitch Ratings or the National Associated of Insurance Commissioners (NAIC). For the Quarter Ended June 30, 2021 |
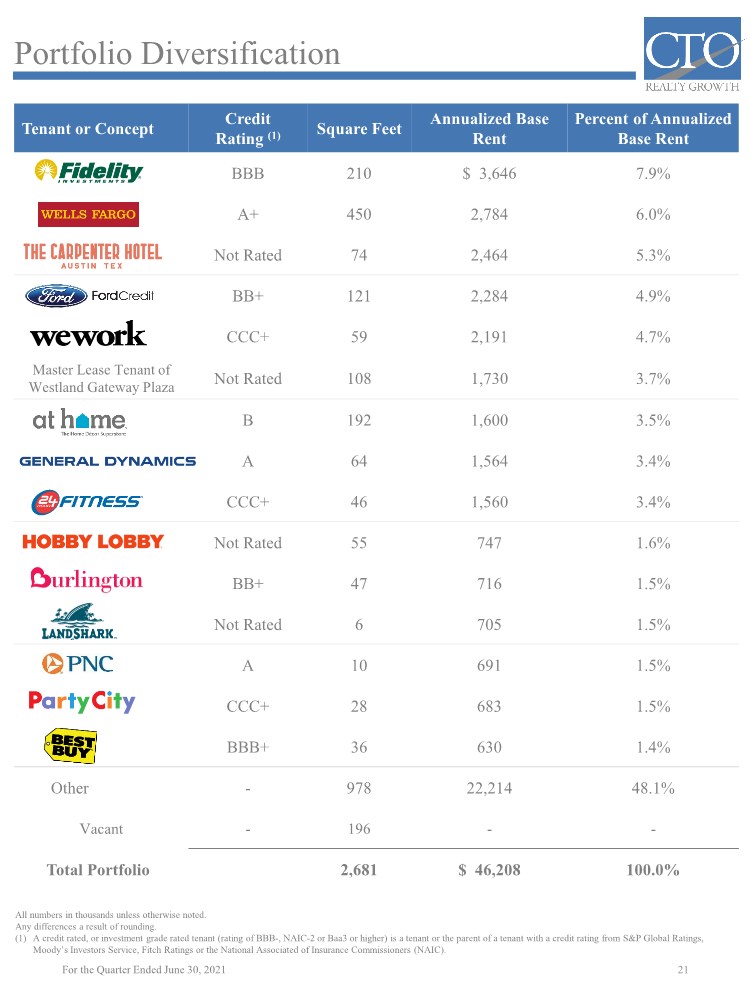
| Portfolio Diversification 22 Square Feet and Annualized Base Rent in thousands. Any differences a result of rounding. Geographic Concentration # of Properties Square Feet Annualized Base Rent Percent of Annualized Base Rent Florida 8 607 $ 13,290 28.8% Texas 3 446 9,674 20.9% Georgia 1 270 5,217 11.3% Arizona 1 254 4,763 10.3% New Mexico 1 210 3,646 7.9% Virginia 2 110 3,123 6.8% North Carolina 1 450 2,784 6.0% Utah 1 171 1,731 3.7% Nevada 1 167 1,495 3.2% New York 1 16 486 1.1% Total Portfolio 20 2,681 $ 46,208 100.0% For the Quarter Ended June 30, 2021 |
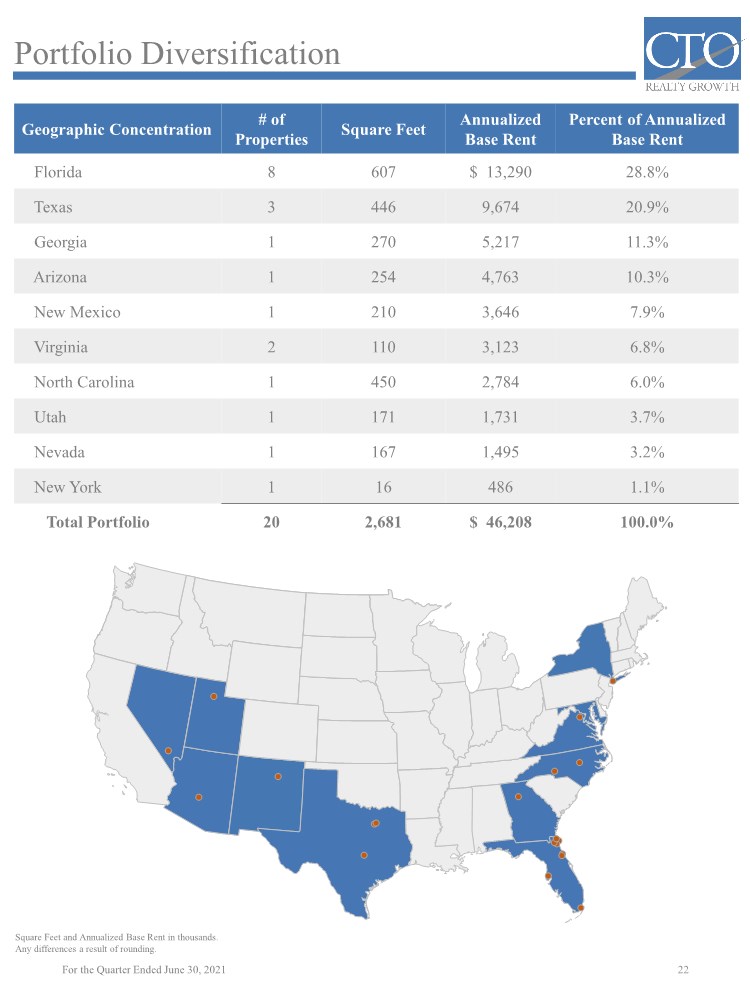
| Metropolitan Statistical Area # of Properties Square Feet Annualized Base Rent Percent of Annualized Base Rent Jacksonville, FL 4 367 $ 8,284 17.9% Dallas-Fort Worth-Arlington, TX 2 373 7,210 15.6% Atlanta–Sandy Springs–Alpharetta, GA 1 270 5,217 11.3% Phoenix-Mesa-Scottsdale, AZ 1 254 4,763 10.3% Albuquerque, NM 1 210 3,646 7.9% Washington-Arlington-Alexandria, DC-VA-MD-WV 2 110 3,123 6.8% Raleigh, NC 1 450 2,784 6.0% Austin-Round Rock, TX 1 74 2,464 5.3% Tampa-St. Petersburg-Clearwater, FL 1 121 2,284 4.9% Salt Lake City, UT 1 171 1,731 3.7% Miami-Fort Lauderdale-Pompano Beach, FL 1 108 1,730 3.7% Las Vegas-Henderson-Paradise, NV 1 147 1,495 3.2% Deltona–Daytona Beach–Ormond Beach, FL 2 12 992 2.1% New York-Newark-Jersey City, NY-NJ 1 16 486 1.1% Total Portfolio 20 2,681 $ 46,208 100.0% Bold Indicates Markets with > 1 Million in Population 17 2,459 $ 41,571 90.0% Portfolio Diversification 23 Square Feet and Annualized Base Rent in thousands. Any differences a result of rounding. For the Quarter Ended June 30, 2021 |
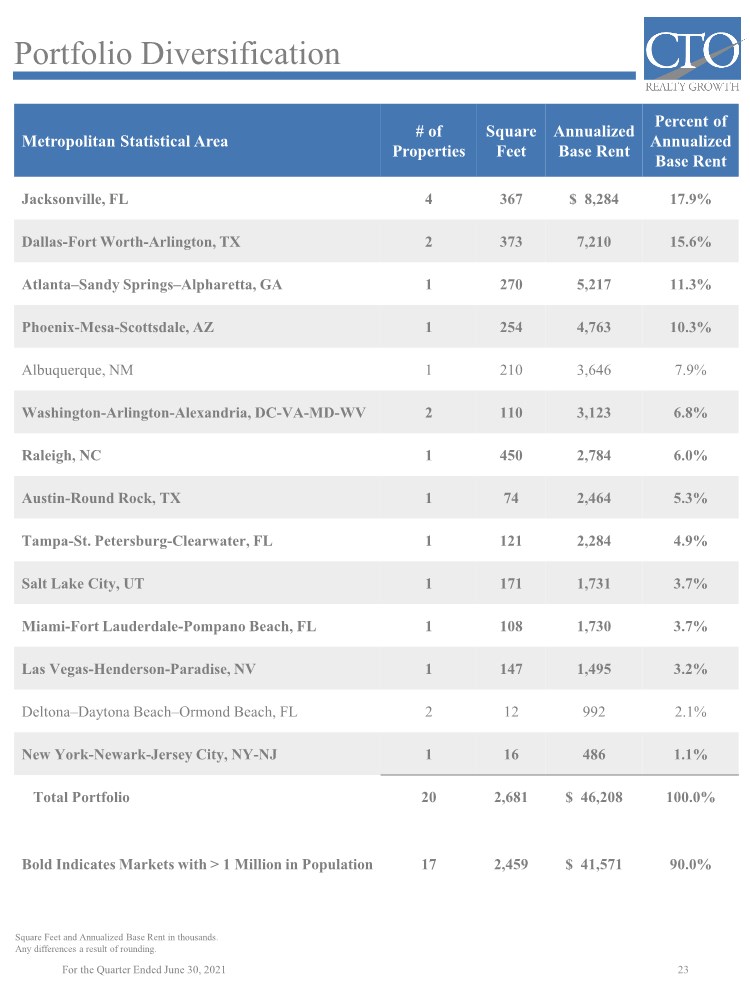
| Lease Expirations 24 Year # of Leases Expiring Square Feet Annualized Base Rent Percent of Annualized Base Rent 2021(1) 12 44 $ 1,086 2.4% 2022 20 76 1,953 4.2% 2023 15 122 2,326 5.0% 2024 11 498 3,918 8.5% 2025 15 99 2,906 6.3% 2026 18 223 4,461 9.7% 2027 8 161 2,173 4.7% 2028 17 453 9,102 19.7% 2029 13 220 4,115 8.9% 2030 10 93 1,880 4.1% 2031 10 60 861 1.9% 2032 5 52 1,356 2.9% 2033 2 65 2,896 6.3% 2034 3 67 1,204 2.6% 2035 2 51 1,778 3.8% Thereafter 4 200 4,194 9.1% Vacant - 196 -- Total Portfolio 165 2,681 $ 46,208 100.0% Physical Occupancy 90.4% Economic Occupancy 90.6% Square Feet and Annualized Base Rent in thousands. Any differences a result of rounding. (1) Includes leases that are month-to-month or in process of renewal. For the Quarter Ended June 30, 2021 |
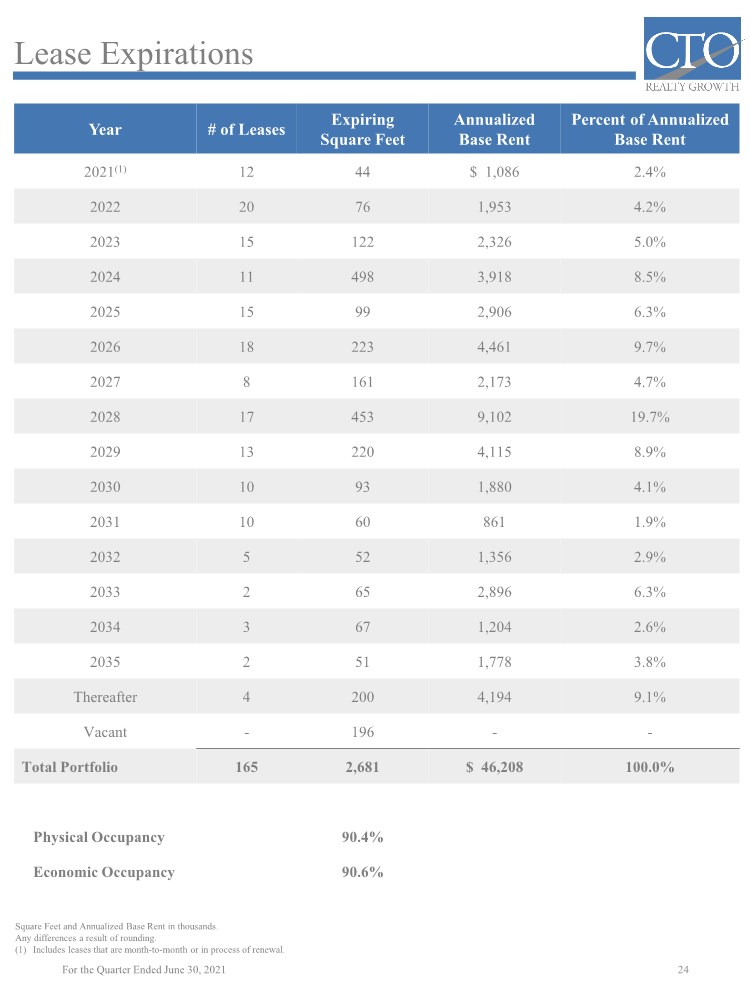
| Schedule of Properties 25 Property Asset Type Property Type Acreage Square Feet Occupancy Wells Fargo – Raleigh, NC Single Tenant Office 40.6 450 100% Ashford Lane – Atlanta, GA Multi-Tenant Retail 43.7 270 69% The Shops at Legacy – Plano, TX Multi-Tenant Mixed-Use 12.7 236 83% Crossroads Towne Center – Chandler, AZ Multi-Tenant Retail 31.1 254 98% The Strand – Jacksonville, FL Multi-Tenant Retail 52.0 215 91% Fidelity – Albuquerque, NM Single Tenant Office 25.3 210 100% Jordan Landing – West Jordan, UT Multi-Tenant Retail 16.1 171 100% Eastern Commons SC – Henderson, NV Multi-Tenant Retail 11.9 147 88% 245 Riverside – Jacksonville, FL Multi-Tenant Office 3.4 137 77% Westcliff Center – Fort Worth, TX Multi-Tenant Retail 10.3 136 60% Sabal Pavilion – Tampa, FL Single Tenant Office 11.5 121 100% Westland Gateway Plaza – Hialeah, FL Single Tenant Retail 8.5 108 100% The Carpenter Hotel – Austin, TX Single Tenant Retail 1.4 74 100% General Dynamics – Reston, VA Single Tenant Office 3.0 64 100% 24 Hour Fitness – Falls Church, VA Single Tenant Retail 3.1 46 100% Party City – Oceanside, NY Single Tenant Retail 1.2 16 100% Chuy’s – Jacksonville, FL Single Tenant Retail 1.2 8 100% Firebirds – Jacksonville, FL Single Tenant Retail 1.0 7 100% Landshark – Daytona Beach, FL Single Tenant Retail 3.0 6 100% Crabby’s – Daytona Beach, FL Single Tenant Retail 3.0 6 100% Total Portfolio 20 284.0 2,681 91% Square Feet in thousands. Any differences a result of rounding. For the Quarter Ended June 30, 2021 |
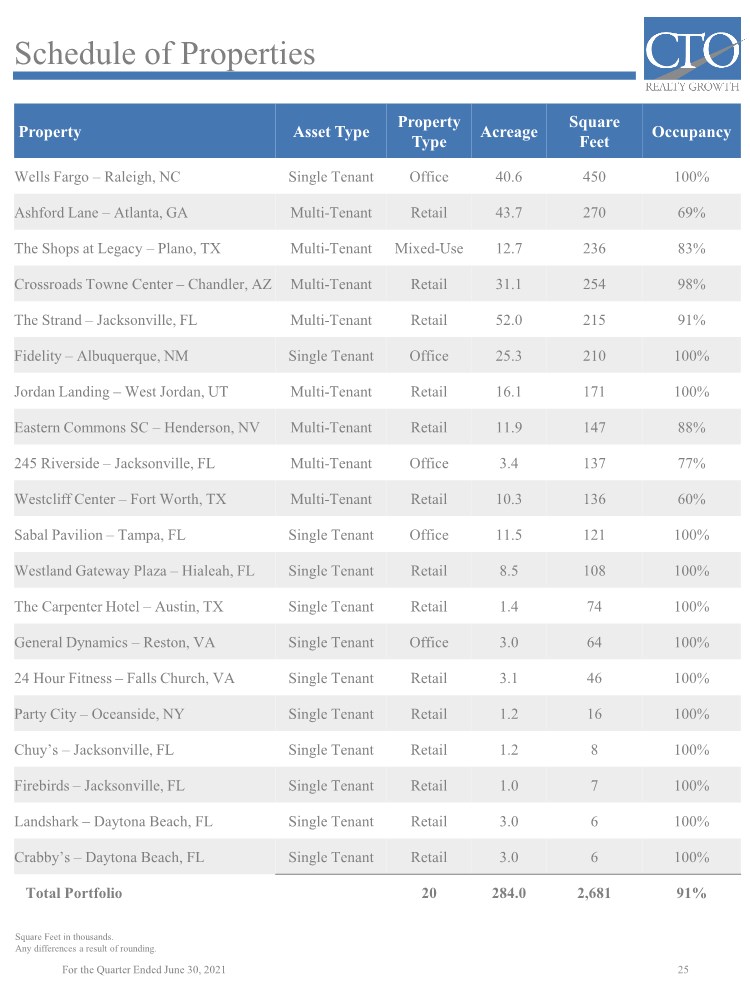
| Research Coverage 26 Institution Coverage Analyst Email Phone B. Riley Craig Kucera [email protected] (703) 312-1635 BTIG Michael Gorman [email protected] (212) 738-6138 Sarah Barcomb [email protected] (212) 882-2336 Compass Point Merrill Ross [email protected] (202) 534-1392 Janney Rob Stevenson [email protected] (646) 840-3217 Steve Dumanski [email protected] (646) 840-3213 For the Quarter Ended June 30, 2021 |
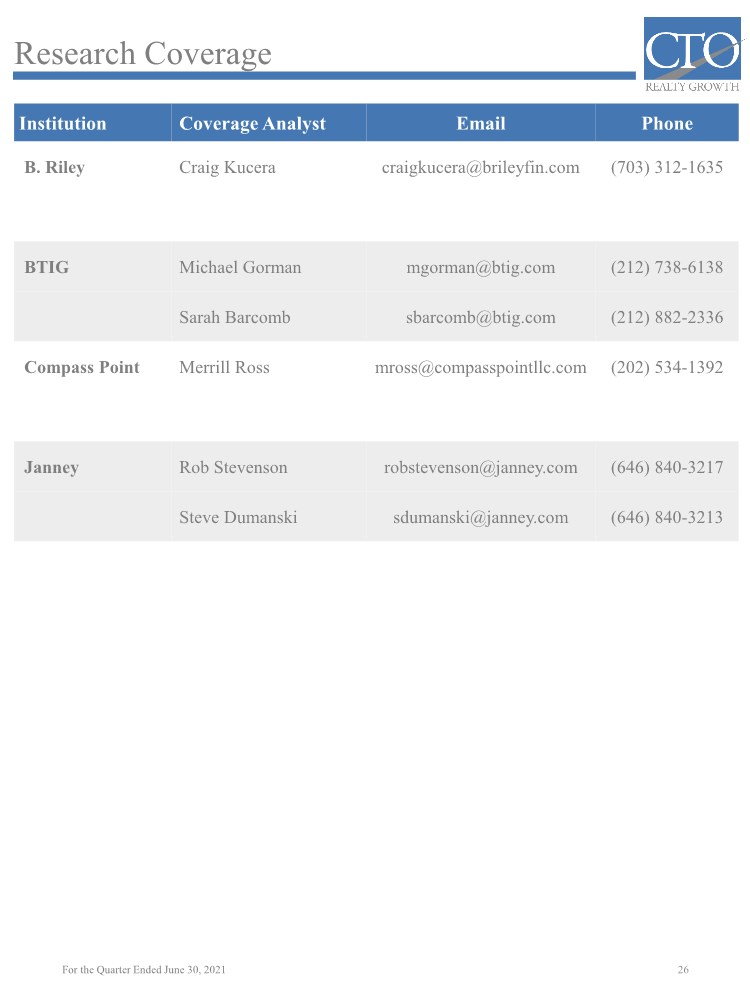
| Definitions and Terms 27 Annualized Base Rent (ABR) is the annual straight-line recognition of a lease’s minimum base rent as calculated based on the leases in-place within the Company’s portfolio as of the end of the reporting period. Funds From Operations (FFO) and Adjusted Funds From Operations (AFFO) are both non-GAAP financial measures. We believe these two non-GAAP financial measures are useful to investors because they are widely accepted industry measures used by analysts and investors to compare the operating performance of REITs. FFO and AFFO do not represent cash generated from operating activities and are not necessarily indicative of cash available to fund cash requirements; accordingly, they should not be considered alternatives to net income as a performance measure or cash flows from operating activities as reported on our statement of cash flows as a liquidity measure and should be considered in addition to, and not in lieu of, GAAP financial measures. We compute FFO in accordance with the definition adopted by the Board of Governors of the National Association of Real Estate Investment Trusts, or NAREIT. NAREIT defines FFO as GAAP net income or loss adjusted to exclude extraordinary items (as defined by GAAP), net gain or loss from sales of depreciable real estate assets, impairment write- downs associated with depreciable real estate assets and real estate related depreciation and amortization, including the pro rata share of such adjustments of unconsolidated subsidiaries. The Company also excludes the gains or losses from sales of assets incidental to the primary business of the REIT which specifically include the sales of mitigation credits, impact fee credits, subsurface sales, and the land sales gains included in discontinued operations. To derive AFFO, we modify the NAREIT computation of FFO to include other adjustments to GAAP net income related to non-cash revenues and expenses such as straight-line rental revenue, amortization of deferred financing costs, amortization of capitalized lease incentives and above- and below-market lease related intangibles, and non-cash compensation. Such items may cause short-term fluctuations in net income but have no impact on operating cash flows or long-term operating performance. We use AFFO as one measure of our performance when we formulate corporate goals. FFO is used by management, investors and analysts to facilitate meaningful comparisons of operating performance between periods and among our peers primarily because it excludes the effect of real estate depreciation and amortization and net gains on sales, which are based on historical costs and implicitly assume that the value of real estate diminishes predictably over time, rather than fluctuating based on existing market conditions. We believe that AFFO is an additional useful supplemental measure for investors to consider because it will help them to better assess our operating performance without the distortions created by other non-cash revenues or expenses. FFO and AFFO may not be comparable to similarly titled measures employed by other companies. Net Debt is calculated as our gross debt at face value and before the effects of net deferred financing costs, less cash, cash equivalents and restricted cash. We believe it is appropriate to exclude cash, cash equivalents and restricted cash from gross debt because the cash, cash equivalents and restricted cash could be used to repay debt. We believe net debt is a beneficial disclosure because it represents the contractual obligations of the company that would potentially need to be repaid in the future. New Cash Rent PSF is the in-place minimum cash rent of the newly signed lease, divided by the square feet of the unit for which the tenant is occupying. Weighted Average Term is the term of a set of leases, weighted by the amount of in-place annual minimum base rent. For the Quarter Ended June 30, 2021 |
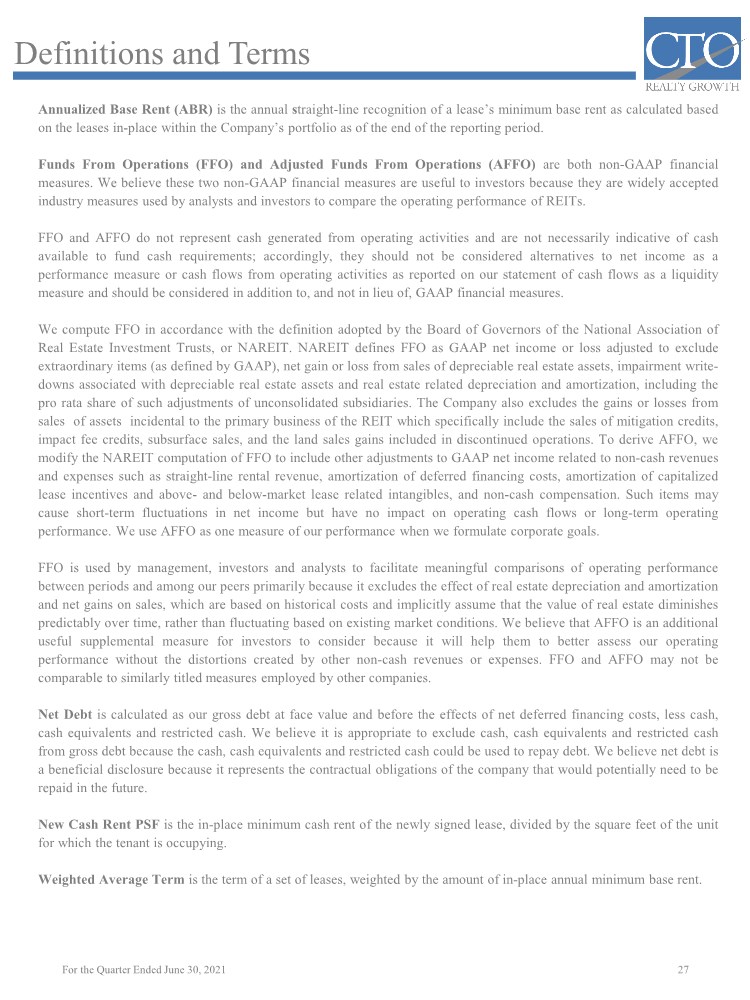
Serious News for Serious Traders! Try StreetInsider.com Premium Free!
You May Also Be Interested In
- Dimensional Fund Advisors Ltd. : Form 8.3 - BARRATT DEVELOPMENTS PLC - Ordinary Shares
- Åsa Vilsson new CFO at Elanders
- Proposals to the Annual General Meeting of Municipality Finance Plc
Create E-mail Alert Related Categories
SEC FilingsSign up for StreetInsider Free!
Receive full access to all new and archived articles, unlimited portfolio tracking, e-mail alerts, custom newswires and RSS feeds - and more!
