

Form 8-K CF Industries Holdings, For: Sep 20
 Tweet
Tweet Share
Share
Exhibit 99.1

London Roadshow September 2021 NYSE: CF

2 Safe harbor statement All statements in this presentation by CF Industries Holdings, Inc. (together with its subsidiaries, the “Company”), other th an those relating to historical facts, are forward - looking statements. Forward - looking statements can generally be identified by their use of terms s uch as “anticipate,” “believe,” “could,” “estimate,” “expect,” “intend,” “may,” “plan,” “predict,” “project,” “will” or “would” and similar terms and phrases, including references to assumptions. Forward - looking statements are not guarantees of future performance and are subject to a number of as sumptions, risks and uncertainties, many of which are beyond the Company’s control, which could cause actual results to differ materiall y f rom such statements. These statements may include, but are not limited to, statements about strategic plans and management’s expectati ons with respect to the production of green and blue (low - carbon) ammonia, the development of carbon capture and sequestration projects, the transit ion to and growth of a hydrogen economy, greenhouse gas reduction targets, projected capital expenditures, statements about future finan cia l and operating results, and other items described in this presentation. Important factors that could cause actual results to differ material ly from those in the forward - looking statements include, among others, the cyclical nature of the Company’s business and the impact of global supply and demand on the Company’s selling prices; the global commodity nature of the Company’s nitrogen products, the conditions in the internati ona l market for nitrogen products, and the intense global competition from other producers; conditions in the United States, Europe and other ag ricultural areas; the volatility of natural gas prices in North America and Europe; weather conditions; the seasonality of the fertilizer busin ess ; the impact of changing market conditions on the Company’s forward sales programs; difficulties in securing the supply and delivery of raw m ate rials, increases in their costs or delays or interruptions in their delivery; reliance on third party providers of transportation services and eq uipment; risks associated with cyber security; the Company’s reliance on a limited number of key facilities; acts of terrorism and regulations to comba t t errorism; risks associated with international operations; the significant risks and hazards involved in producing and handling the Company’s pro ducts against which the Company may not be fully insured; the Company’s ability to manage its indebtedness and any additional indebtedness tha t may be incurred; the Company’s ability to maintain compliance with covenants under its revolving credit agreement and the agreements go verning its indebtedness; downgrades of the Company’s credit ratings; risks associated with changes in tax laws and disagreements with ta xin g authorities; risks involving derivatives and the effectiveness of the Company’s risk measurement and hedging activities; potential liabili tie s and expenditures related to environmental, health and safety laws and regulations and permitting requirements; regulatory restrictions and req uir ements related to greenhouse gas emissions; the development and growth of the market for green and blue (low - carbon) ammonia and the risks and unc ertainties relating to the development and implementation of the Company’s green and blue (low - carbon) ammonia projects; risks associated w ith expansions of the Company’s business, including unanticipated adverse consequences and the significant resources that could b e r equired; risks associated with the operation or management of the strategic venture with CHS (the “CHS Strategic Venture”), risks and uncert ain ties relating to the market prices of the fertilizer products that are the subject of the supply agreement with CHS over the life of the suppl y a greement, and the risk that any challenges related to the CHS Strategic Venture will harm the Company’s other business relationships; and the impact of the novel coronavirus disease 2019 (COVID - 19) pandemic, including measures taken by governmental authorities to slow the spread of the vir us, on our business and operations. More detailed information about factors that may affect the Company’s performance and could cause ac tua l results to differ materially from those in any forward - looking statements may be found in CF Industries Holdings, Inc.’s filings with the S ecurities and Exchange Commission, including CF Industries Holdings, Inc.’s most recent annual and quarterly reports on Form 10 - K and Form 10 - Q, which are available in the Investor Relations section of the Company’s web site. It is not possible to predict or identify all risks an d u ncertainties that might affect the accuracy of our forward - looking statements and, consequently, our descriptions of such risks and uncertainties should not be considered exhaustive. There is no guarantee that any of the events, plans or goals anticipated by these forward - looking statements will oc cur, and if any of the events do occur, there is no guarantee what effect they will have on our business, results of operations, cash flows, fin anc ial condition and future prospects. Forward - looking statements are given only as of the date of this presentation and the Company disclaims any ob ligation to update or revise the forward - looking statements, whether as a result of new information, future events or otherwise, except as r equired by law.
3 Note regarding non - GAAP financial measures The Company reports its financial results in accordance with U.S. generally accepted accounting principles (GAAP). Management believes that EBITDA, adjusted EBITDA and free cash flow, which are non - GAAP financial measures, provide additional meaningful information regarding the Company's performance and financial strength. Non - GAAP financial measures should be viewed in addition to, and not as an alternative for, the Company's reported results prepared in accordance with GAAP. In addition, because not all companies use identical calculations, EBITDA, adjusted EBITDA and free cash flow included in this presentation may not be comparable to similarly titled measures of other companies. Reconciliations of EBITDA, adjusted EBITDA and free cash flow to the most directly comparable GAAP measures are provided in the tables accompanying this presentation. EBITDA is defined as net earnings attributable to common stockholders plus interest expense - net, income taxes, and depreciation and amortization. Other adjustments include the elimination of loan fee amortization that is included in both interest and amortization, and the portion of depreciation that is included in noncontrolling interest. The Company has presented EBITDA because management uses the measure to track performance and believes that it is frequently used by securities analysts, investors and other interested parties in the evaluation of companies in the industry. Adjusted EBITDA is defined as EBITDA adjusted with the selected items included in EBITDA as summarized in the tables accompanying this presentation. The Company has presented adjusted EBITDA because management uses adjusted EBITDA, and believes it is useful to investors, as a supplemental financial measure in the comparison of year - over - year performance. Free cash flow is defined as net cash provided by operating activities, as stated in the consolidated statements of cash flows, reduced by capital expenditures and distributions to noncontrolling interest. The Company has presented free cash flow because management uses this measure and believes it is useful to investors, as an indication of the strength of the Company and its ability to generate cash and to evaluate the Company’s cash generation ability relative to its industry competitors. It should not be inferred that the entire free cash flow amount is available for discretionary expenditures.

Company Overview

5 Strengthening global nitrogen outlook Global nitrogen price dynamics Global nitrogen demand Global energy differentials Low global coarse grains stocks - to - use ratio, excluding China, increased economic activity, and higher energy prices in Europe and Asia have significantly tightened the global nitrogen supply and demand balance Highly favorable environment for low - cost producers that appears sustainable into 2023 Stocks - to - use ratios at multi - year lows have driven the highest commodity crop prices in nearly a decade, supporting strong nitrogen demand to maximize yields globally The Company projects coarse grains stocks will require at least two more growing seasons to be replenished Strong nitrogen demand expected in North America in 2022; global requirements driven by robust demand from India and Brazil The Company expects corn acres planted in the US in 2022 to be similar to the 93 million acres planted in 2021 India is expected to tender for urea frequently in the second half of 2021, with purchases expected to approach 10 million metric tons for 2021 Imports of urea into Brazil were 24 percent higher year - over - year through the first six months of 2021 Energy prices in Europe and Asia increased significantly from the lows of 2020 and returned to sizable differentials compared to Henry Hub natural gas prices in North America Widened energy differentials have steepened the global nitrogen cost curve, increasing margin opportunities for North American producers Forward curves suggest current energy spreads will persist into 2023

6 Low stocks - to - use ratio drives higher grain values, expected to require at least two more growing seasons to replenish Global Coarse Grains Stocks - to - Use Ratio vs Corn Futures Prices* Percent 0 1 2 3 4 5 6 7 0 2 4 6 8 10 12 14 16 World-ex China Crop Futures Price (RHS) USD per Bushel Global Oilseeds Stocks - to - Use Ratio vs Soybean Futures Prices Percent 0 2 4 6 8 10 12 14 16 0 5 10 15 20 25 30 World-ex China Crop Futures Price (RHS) USD per Bushel
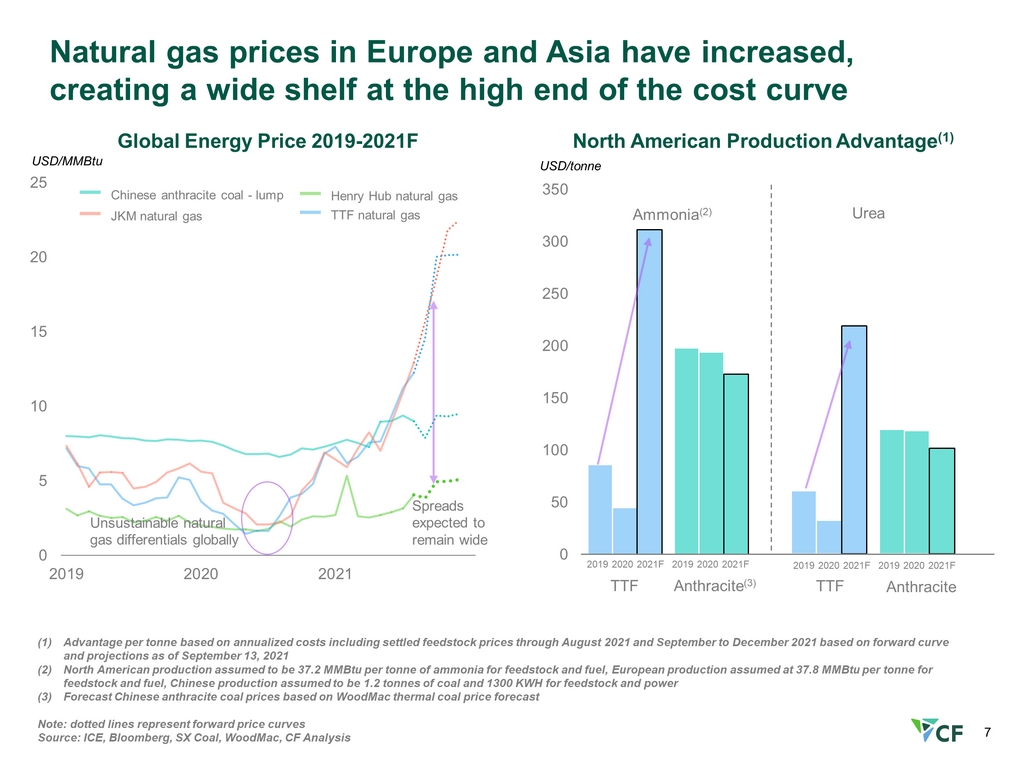
7 Natural gas prices in Europe and Asia have increased, creating a wide shelf at the high end of the cost curve Global Energy Price 2019 - 2021F USD/ tonne North American Production Advantage (1) 0 5 10 15 20 25 2019 2020 2021 Henry Hub natural gas TTF natural gas Chinese anthracite coal - lump JKM natural gas Unsustainable natural gas differentials globally 0 50 100 150 200 250 300 350 Ammonia (2) Urea Spreads expected to remain wide TTF Anthracite (3) 2019 2020 2021F 2019 2020 2021F TTF Anthracite 2019 2020 2021F 2019 2020 2021F USD/MMBtu (1) Advantage per tonne based on annualized costs including settled feedstock prices through August 2021 and September to December 2021 based on forw ar d curve and projections as of September 13, 2021 (2) North American production assumed to be 37.2 MMBtu per tonne of ammonia for feedstock and fuel, European production assumed at 37.8 MMBtu per tonne for feedstock and fuel, Chinese production assumed to be 1.2 tonnes of coal and 1300 KWH for feedstock and power (3) Forecast Chinese anthracite coal prices based on WoodMac thermal coal price forecast Note: dotted lines represent forward price curves Source: ICE, Bloomberg, SX Coal, WoodMac , CF Analysis
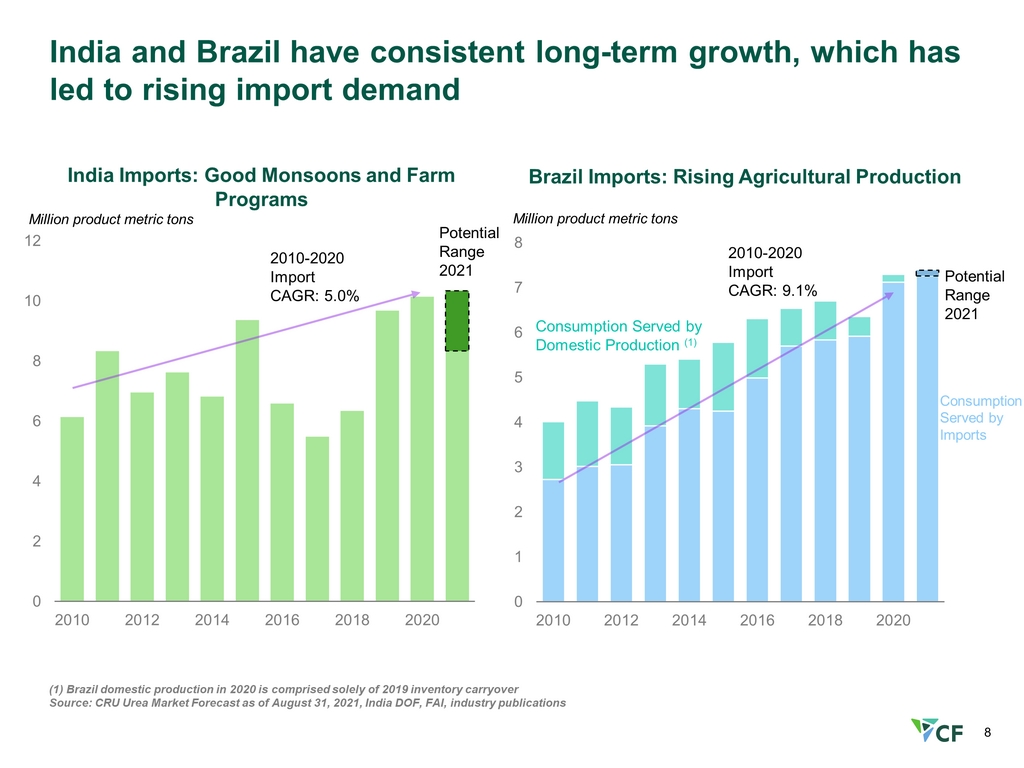
8 India and Brazil have consistent long - term growth, which has led to rising import demand (1) Brazil domestic production in 2020 is comprised solely of 2019 inventory carryover Source: CRU Urea Market Forecast as of August 31, 2021, India DOF, FAI, industry publications 0 2 4 6 8 10 12 2010 2012 2014 2016 2018 2020 0 1 2 3 4 5 6 7 8 2010 2012 2014 2016 2018 2020 India Imports: Good Monsoons and Farm Programs Million product metric tons 2010 - 2020 Import CAGR: 5.0% Potential Range 2021 Brazil Imports: Rising Agricultural Production Million product metric tons Consumption Served by Domestic Production (1) Consumption Served by Imports 2010 - 2020 Import CAGR: 9.1% Potential Range 2021

9 Ammonia as a fuel Clean energy strategy initiatives Blue Ammonia Green Ammonia Announced MOU with Mitsui & Co., Inc., one of the leading ammonia marketers in the world, to explore jointly the development of blue ammonia projects in the U.S. Completed engineering design study at the Donaldsonville Complex related to installation of CO 2 dehydration and compression equipment necessary for CCS The UK government is expected in October to select at least two carbon capture and sequestration (CCS) clusters to move into an operational phase by 2026. Both of the Company’s manufacturing complexes are part of CCS clusters under consideration Participating in the Joint Study Framework established by Itochu Corporation to verify and organize common issues regarding the use of ammonia as a maritime fuel CF will provide its expertise on ammonia production as well as the safe handling, transport and storage of ammonia during the initial stages of this effort From October 1, 2021, moving forward, 100% of electricity purchases for UK manufacturing complexes will be from renewable sources, compared to 23% currently This will bring company - wide electricity purchases from renewable sources to 38% versus 22% based on CF Industries’ electricity purchases across its network in 2020 Renewable Energy In April 2021 CF Industries signed an engineering and procurement contract with thyssenkrupp to supply a 20 megawatt (MW) alkaline water electrolysis plant to produce green hydrogen at the Donaldsonville C omplex Construction and installation is expected to begin in the second half of 2021 and to finish in 2023; when completed it will be the largest of its kind in North America
Financial Results and Capital Allocation

11 First half highlights (1) Average cost of natural gas excludes the $112 million gain on net settlement of certain natural gas contracts with suppliers in February 2021 (2) See appendix for reconciliation of EBITDA and adjusted EBITDA (3) Represents cash provided by operating activities (cash from operations) less capital expenditures less distributions to nonco ntr olling interest; see appendix for reconciliation of free cash flow EBITDA (2) Net earnings Net earnings per diluted share Adjusted EBITDA (2) $997 M 1H 2021 $808 M 1H 2020 $1.83 1H 2021 $1.20 1H 2020 LTM Cash from operations LTM Free cash flow (3) Rising nitrogen prices, partially offset by lower production and sales volume, underpin solid first half results Company announced redemption of $250 million of its 3.450% Senior Notes due June 2023 Net sales in 1H 2021 were $2.64B compared to $2.18B in 1H 2020 Average selling prices for 1H 2021 were higher than 1H 2020 across all segments due to strong global demand and decreased supply availability as higher global energy costs drove lower global operating rates Sales volume of 9.7M tons in 1H 2021 compared to 10.1M in 1H 2020 due to lower supply availability from lower production, partially offset by inventory drawdown Cost of sales for 1H 2021 was higher than 1H 2020 due to higher natural gas costs and higher maintenance and downtime costs Average cost of natural gas reflected in cost of sales was $3.24 (1) per MMBtu in 1H 2021 compared to $2.20 per MMBtu in 1H 2020 $1.22 B 2Q 2021 $994 M 1H 2021 $786 M 1H 2020 $397 M 1H 2021 $258 M 1H 2020 $0.7 B 2Q 2021
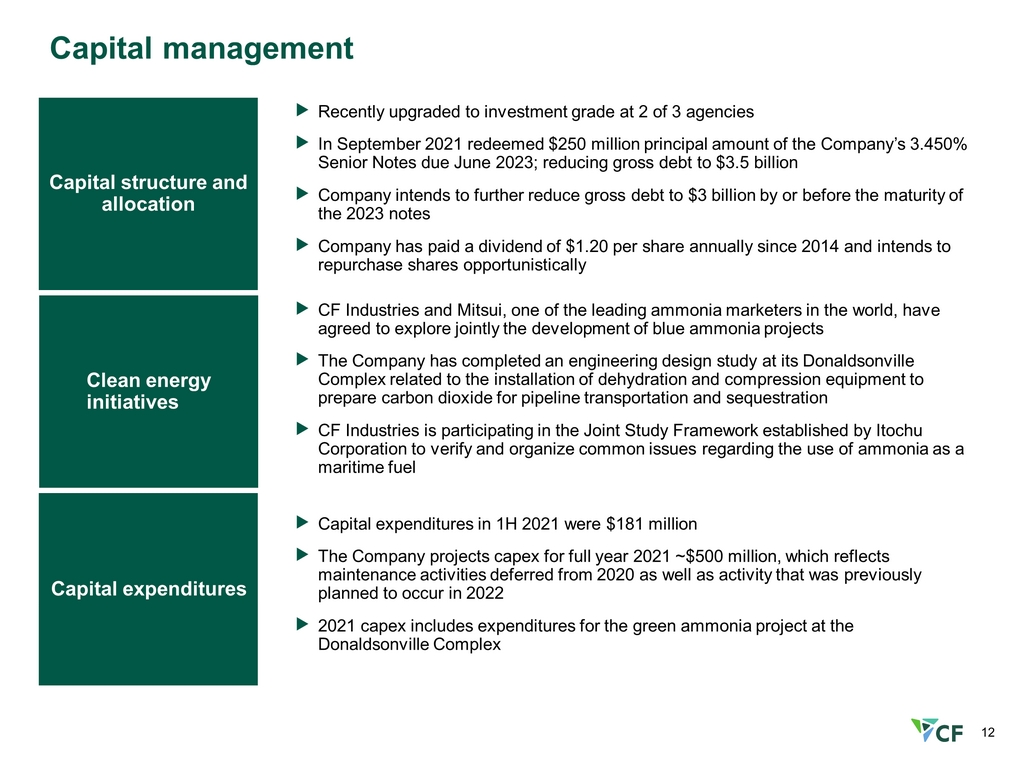
12 Capital management Capital structure and allocation Clean energy initiatives Capital expenditures Recently upgraded to investment grade at 2 of 3 agencies In September 2021 redeemed $250 million principal amount of the Company’s 3.450% Senior Notes due June 2023; reducing gross debt to $3.5 billion Company intends to further reduce gross debt to $3 billion by or before the maturity of the 2023 notes Company has paid a dividend of $1.20 per share annually since 2014 and intends to repurchase shares opportunistically CF Industries and Mitsui, one of the leading ammonia marketers in the world, have agreed to explore jointly the development of blue ammonia projects The Company has completed an engineering design study at its Donaldsonville Complex related to the installation of dehydration and compression equipment to prepare carbon dioxide for pipeline transportation and sequestration CF Industries is participating in the Joint Study Framework established by Itochu Corporation to verify and organize common issues regarding the use of ammonia as a maritime fuel Capital expenditures in 1H 2021 were $181 million The Company projects capex for full year 2021 ~$500 million, which reflects maintenance activities deferred from 2020 as well as activity that was previously planned to occur in 2022 2021 capex includes expenditures for the green ammonia project at the Donaldsonville Complex
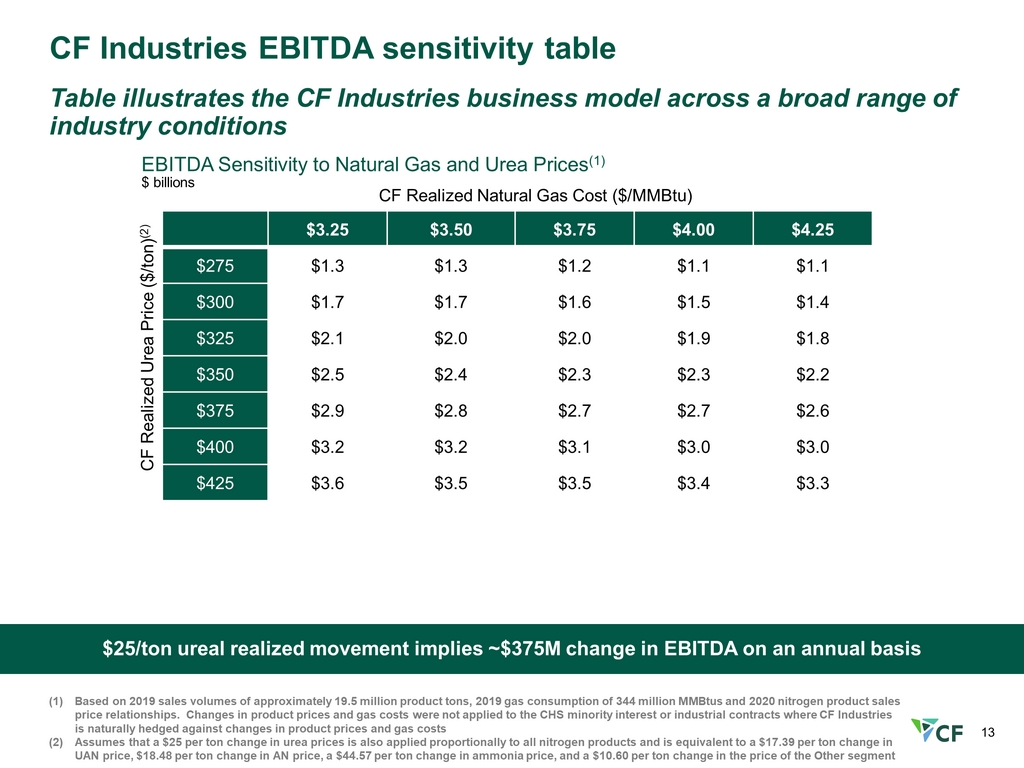
13 CF Industries EBITDA sensitivity table Table illustrates the CF Industries business model across a broad range of industry conditions $25/ton ureal realized movement implies ~$375M change in EBITDA on an annual basis (1) Based on 2019 sales volumes of approximately 19.5 million product tons, 2019 gas consumption of 344 million MMBtus and 2020 n itr ogen product sales price relationships. Changes in product prices and gas costs were not applied to the CHS minority interest or industrial con tra cts where CF Industries is naturally hedged against changes in product prices and gas costs (2) Assumes that a $25 per ton change in urea prices is also applied proportionally to all nitrogen products and is equivalent to a $17.39 per ton change in UAN price, $18.48 per ton change in AN price, a $44.57 per ton change in ammonia price, and a $10.60 per ton change in the pr ice of the Other segment EBITDA Sensitivity to Natural Gas and Urea Prices (1) $ billions CF Realized Natural Gas Cost ($/MMBtu) CF Realized Urea Price ($/ton) (2) $3.25 $3.50 $3.75 $4.00 $4.25 $275 $1.3 $1.3 $1.2 $1.1 $1.1 $300 $1.7 $1.7 $1.6 $1.5 $1.4 $325 $2.1 $2.0 $2.0 $1.9 $1.8 $350 $2.5 $2.4 $2.3 $2.3 $2.2 $375 $2.9 $2.8 $2.7 $2.7 $2.6 $400 $3.2 $3.2 $3.1 $3.0 $3.0 $425 $3.6 $3.5 $3.5 $3.4 $3.3

Environmental Stewardship and Governance

15 Dimension Material Issue Goal UN Sustainable Development Goals GHG Emissions; Energy Management; Climate Change Reduce carbon emissions • During 2021, develop and prioritize a list of viable GHG reduction capital projects • Reduce total CO 2 equivalent emissions by 25% per ton of product by 2030 (2015 baseline year) • Achieve net - zero carbon emissions by 2050 Climate Change Begin to report and disclose Company data in accordance with the Task Force on Climate - related Financial Disclosures (TCFD) framework for climate - related risks and opportunities, in addition to the Global Reporting Initiative (GRI) and Sustainability Accounting Standards Board (SASB) Water Management Ensure sustainable management of water (availability, use, and discharge) for all manufacturing operations: • During 2021, identify and evaluate a list of viable water reuse/reduction projects • Develop integrated water resource management plans to ensure sustainable withdrawals and discharges Energy, Emissions and Climate Change Goals aligned with material ESG issues

16 Dimension Material Issue Goal UN Sustainable Development Goals Workforce Health & Safety Strengthen and improve behavioral safety practices that support the commitment to safety excellence • At least 95% of the aggregated safety grades of all employees at manufacturing and distribution sites must be a "B" or better for the year • Safety critical equipment inspections completed per schedule • Management of changes in current year closed within 90 days of pre - startup review Diversity & Inclusion Continue to improve the inclusiveness and diversity of the Company and the Culture • Increase representation of females and people of color in senior leadership roles (director level and above) to at least 30% by end of 2025 • Implement a program to create additional pathways to long - term professional growth for traditionally underrepresented employee groups by end of 2021 with the ultimate goal of increasing the hiring and promotion of minority and female candidates Community Relations Increase engagement and support with our local communities and expand the corporate giving philosophy to include environmental sustainability, food access and security, STEM education and first responders within our local communities Implement a Volunteer Time Off (“VTO”) program by the end of 2021 which provides paid time off for employees to volunteer in their communities with organizations that are part of the Company ’s giving campaign. Achieve 25% employee participation in VTO program by the end of 2025 Our Workplaces and Communities Goals aligned with material ESG issues (cont’d)

17 Dimension Material Issue Goal UN Sustainable Development Goals Food Security; Environmental Compliance Be a driving force to increase adoption of enhanced conservation practices and nutrient management practices that promote sustainable agriculture • Reach 90,000 farmers with 4R Plus program by 2023 • Expand partnerships to achieve 60 million acres of farmland using sustainable practices by 2030 Safety & Environmental Stewardship of Chemicals Receive the “Protect & Sustain” certification (or equivalent environmental/product stewardship certification) for 100% of manufacturing sites by 2030 Management of Legal & Regulatory Environment Engage suppliers and service providers annually representing 50% of the Company ’s total procurement and supply chain expenditures and assess their commitment to and performance in key ESG areas Ethics • Annually require 100% of employees to be trained on and certify compliance with the Code of Corporate Conduct • Annually require 100% of employees to be trained on and certify compliance with the Environmental, Health, Safety, and Security Policy • Annually require 100% of employees to be trained on diversity and inclusion matters • Annually require 100% of employees to be trained on and certify compliance with Anti - corruption Compliance Policy Food Security and Product Stewardship Ethics and Governance Goals aligned with material ESG issues (cont’d)

18 Robert C. Arzbaecher Former Chairman and CEO, Acutant Corporation Deborah L. DeHaas Former Vice Chairman and Managing Partner Center for Board Effectiveness, Deloitte Stephen A. Furbacher Former President and COO, Dynergy Chairman of the Board Stephen J. Hagge Former President and CEO, AptarGroup W. Anthony Will President and CEO, CF Industries = New director in past 5 years Board of Directors Javed Ahmed Former CEO, Tate & Lyle John W. Eaves Executive Chairman, Arch Coal Theresa E. Wagler EVP & CFO, Steel Dynamics Celso L. White Former Global Chief Supply Chain Officer, Molson Coors Brewing Company Anne P. Noonan President and CEO, Summit Materials Michael J. Toelle Owner, T&T Farms Balanced, Diverse, and Independent Board Board Diversity 6 directors contribute to our Board’s gender and racial/ethnic diversity All Directors including Chairman are Independent, except for the CEO 2 4 3 3 <1 2-5 6-9 10+ Average Tenure: 6.4 years Independent, Diverse Board with the Right Skills and Expertise Jesus Madrazo Founder and Chairman of Kompali Farms 50% Diversity ● 3 Women ● 3 Racial/Ethnic 6 6

Appendix
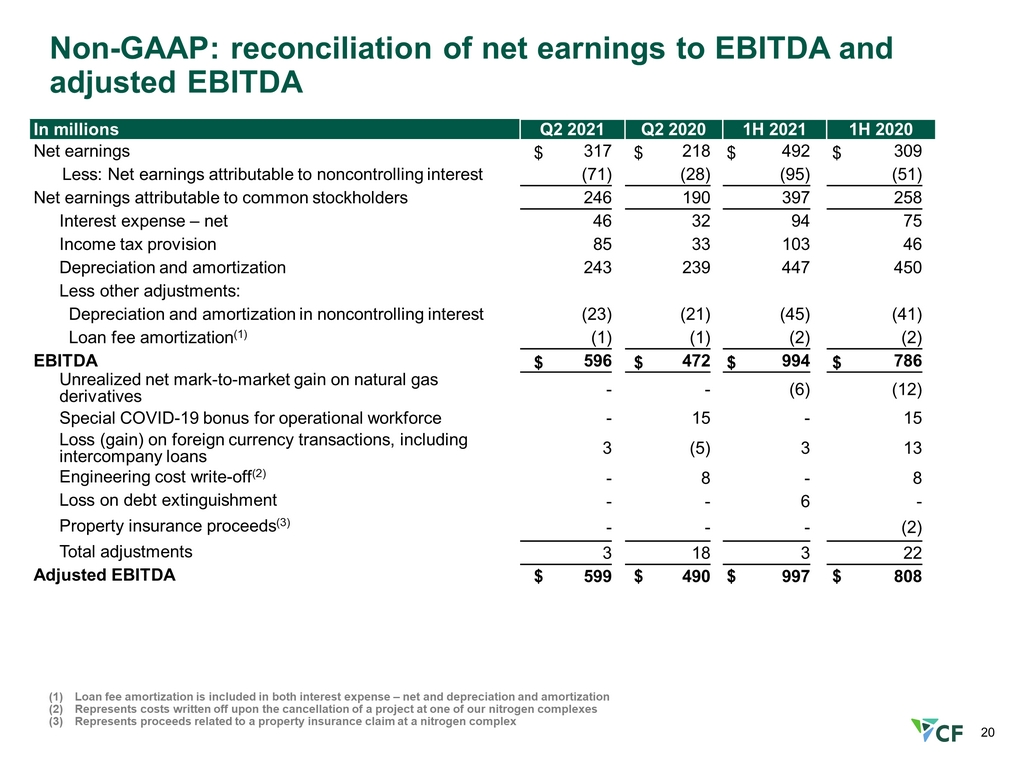
20 Non - GAAP: reconciliation of net earnings to EBITDA and adjusted EBITDA (1) Loan fee amortization is included in both interest expense – net and depreciation and amortization (2) Represents costs written off upon the cancellation of a project at one of our nitrogen complexes (3) Represents proceeds related to a property insurance claim at a nitrogen complex In millions Q2 20 21 Q2 2020 1H 20 21 1H 2020 Net earnings $ 317 $ 218 $ 492 $ 309 Less: Net earnings attributable to noncontrolling interest (71) (28) (95) (51) Net earnings attributable to common stockholders 246 190 397 258 Interest expense – net 46 32 94 75 Income tax provision 85 33 103 46 Depreciation and amortization 243 239 447 450 Less other adjustments: Depreciation and amortization in noncontrolling interest (23) (21) (45) (41) Loan fee amortization (1) (1) (1) (2) (2) EBITDA $ 596 $ 472 $ 994 $ 786 Unrealized net mark - to - market gain on natural gas derivatives - - (6) (12) Special COVID - 19 bonus for operational workforce - 15 - 15 Loss (gain) on foreign currency transactions, including intercompany loans 3 (5) 3 13 Engineering cost write - off (2) - 8 - 8 Loss on debt extinguishment - - 6 - Property insurance proceeds (3) - - - (2) Total adjustments 3 18 3 22 Adjusted EBITDA $ 599 $ 490 $ 997 $ 808
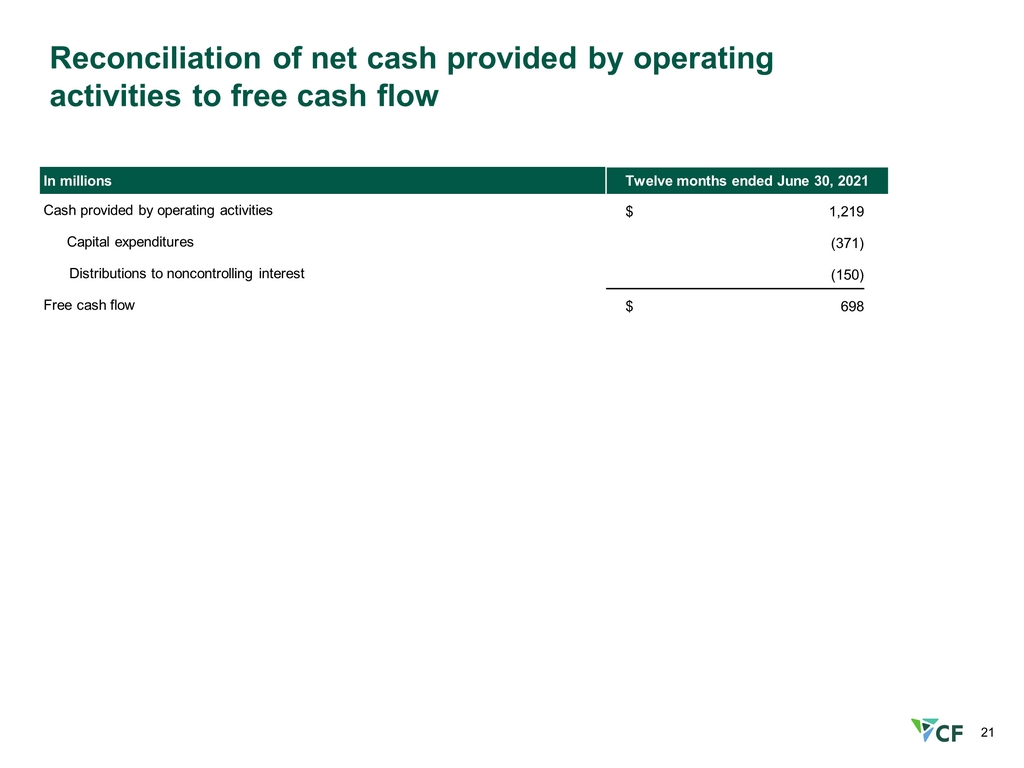
21 Reconciliation of net cash provided by operating activities to free cash flow In millions Twelve months ended June 30, 2021 Cash provided by operating activities $ 1,219 C apital expenditures (371) Distributions to noncontrolling interest (150) Free cash flow $ 698
Serious News for Serious Traders! Try StreetInsider.com Premium Free!
You May Also Be Interested In
- Man Group PLC : Form 8.3 - Barratt Developments plc
- Alphabet stock surges 11% to record high on Q1 earnings beat, first-ever dividend
- Gravity Announces Filing of Annual Report on Form 20-F for Fiscal Year 2023
Create E-mail Alert Related Categories
SEC FilingsSign up for StreetInsider Free!
Receive full access to all new and archived articles, unlimited portfolio tracking, e-mail alerts, custom newswires and RSS feeds - and more!
