

Form 8-K Apollo Medical Holdings, For: Jun 22
 Tweet
Tweet Share
Share
Exhibit 99.1

Apollo Medical Holdings (NASDAQ: AMEH) June 2021 Powered by Technology. Built by Doctors. For Patients.

Forward - looking statements This presentation contains forward - looking statements within the meaning of the Private Securities Litigation Reform Act of 1995 , Section 27A of the Securities Act and Section 21E of the Exchange Act. Forward - looking statements include any statements about t he Company's business, financial condition, operating results, plans, objectives, expectations and intentions, expansion plans, int egration of acquired companies and any projections of earnings, revenue, EBITDA, Adjusted EBITDA or other financial items, such as the Co mpa ny's projected capitation and future liquidity, and may be identified by the use of forward - looking terms such as “anticipate,” “coul d,” “can,” “may,” “might,” “potential,” “predict,” “should,” “estimate,” “expect,” “project,” “believe,” “plan,” “envision,” “intend,” “ con tinue,” “target,” “seek,” “will,” “would,” and the negative of such terms, other variations on such terms or other similar or comparable words, ph rases or terminology. Forward - looking statements reflect current views with respect to future events and financial performance and theref ore cannot be guaranteed. Such statements are based on the current expectations and certain assumptions of the Company's manageme nt, and some or all of such expectations and assumptions may not materialize or may vary significantly from actual results. Actua l r esults may also vary materially from forward - looking statements due to risks, uncertainties and other factors, known and unknown, inclu ding the risk factors described from time to time in the Company’s reports to the U.S. Securities and Exchange Commission (the “SE C”) , including without limitation the risk factors discussed in the Company's Annual Report on Form 10 - K for the year ended December 31, 2020, and subsequent Quarterly Reports on Form 10 - Q. Because the factors referred to above could cause actual results or outcomes to differ materially from those expressed or imp lie d in any forward - looking statements, you should not place undue reliance on any such forward - looking statements. Any forward - looking statements speak only as of the date of this presentation and, unless legally required, the Company does not undertake any ob lig ation to update any forward - looking statement, as a result of new information, future events or otherwise. 2 www.apollomed.net
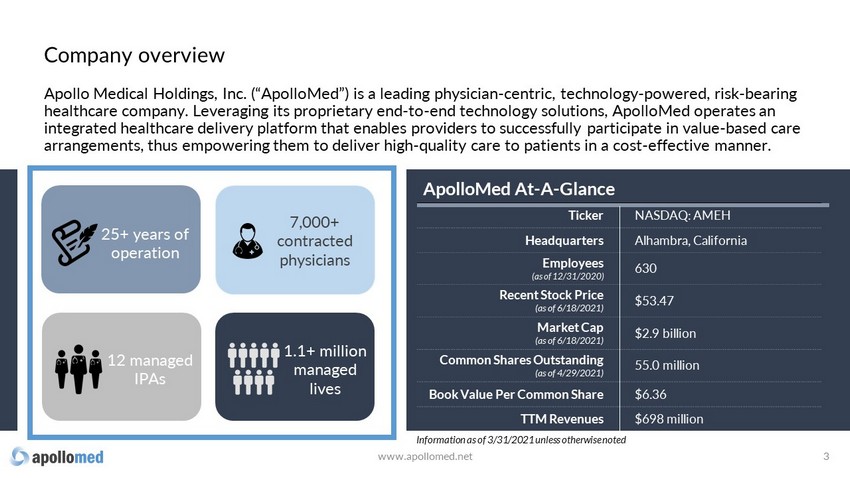
Apollo Medical Holdings, Inc. (“ApolloMed”) is a leading physician - centric, technology - powered, risk - bearing healthcare company. Leveraging its proprietary end - to - end technology solutions, ApolloMed operates an integrated healthcare delivery platform that enables providers to successfully participate in value - based care arrangements, thus empowering them to deliver high - quality care to patients in a cost - effective manner. 3 ApolloMed At - A - Glance Ticker NASDAQ: AMEH Headquarters Alhambra, California Employees (as of 12/31/2020) 630 Recent Stock Price ( as of 6/18/2021 ) $53.47 Market Cap (as of 6/18/2021) $2.9 bill ion Common Shares Outstanding (as of 4/29/2021) 55.0 million Book Value Per Common Share $6.36 TTM Revenues $698 million 7,000+ contracted physicians 12 managed IPAs 1.1+ million managed lives 25+ years of operation Information as of 3/31/2021 unless otherwise noted www.apollomed.net Company overview

Value - based care Fee - for - service CMS, COVID - 19, payer contracting, and focus on quality while lowering total cost are driving shift in healthcare Fee - for - service Value - based care Lack of incentives to improve chronic health conditions Driving a trend of rapidly increasing medical costs Rising patient dissatisfaction with provider relationship and quality of care Providers incentivized to improve general health of patients Compensation models in place to lower the overall cost of care Patients with better access and better care experience U.S. healthcare landscape is rapidly moving towards value - based care www.apollomed.net 4
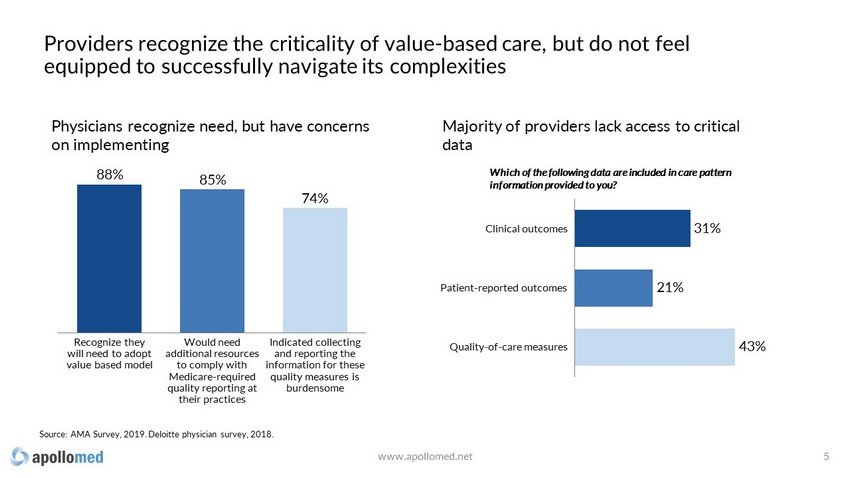
Providers recognize the criticality of value - based care, but do not feel equipped to successfully navigate its complexities Recognize they will need to adopt value based model Indicated collecting and reporting the information for these quality measures is burdensome Would need additional resources to comply with Medicare - required quality reporting at their practices 88% 85% 74% Source: AMA Survey, 2019. Deloitte physician survey, 2018. Patient - reported outcomes Clinical outcomes Quality - of - care measures 21% 31% 43% Physicians recognize need, but have concerns on implementing Majority of providers lack access to critical data Which of the following data are included in care pattern information provided to you? www.apollomed.net 5
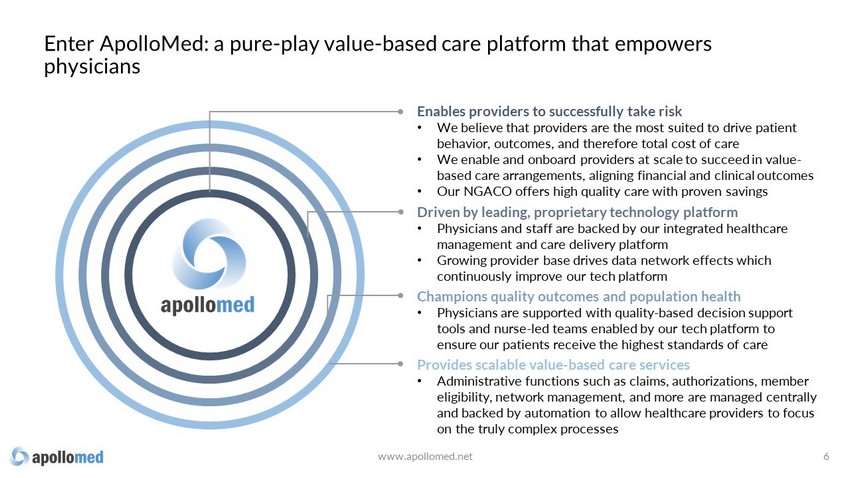
3270a Enables providers to successfully take risk • We believe that providers are the most suited to drive patient behavior, outcomes, and therefore total cost of care • We enable and onboard providers at scale to succeed in value - based care arrangements , aligning financial and clinical outcomes • Our NGACO offers high quality care with proven savings Driven by leading, proprietary technology platform • Physicians and staff are backed by our integrated healthcare management and care delivery platform • Growing provider base drives data network effects which continuously improve our tech platform Champions quality outcomes and population health • Physicians are supported with quality - based decision support tools and nurse - led teams enabled by our tech platform to ensure our patients receive the highest standards of care Provides scalable value - based care services • Administrative functions such as claims, authorizations, member eligibility, network management, and more are managed centrally and backed by automation to allow healthcare providers to focus on the truly complex processes Enter ApolloMed: a pure - play value - based care platform that empowers physicians www.apollomed.net 6

We act as a “single - payer” and assume risk for comprehensive patient care Insurance provider Insurance provider Insurance provider Other Payers Primary care provider Specialist services Lab tests Imaging Savings shared with providers, remaining retained as profit • 25+ yrs of operational expertise • AI - assisted tech platform for quality improvement and workflow automation • Population health support • Nurse - led case management • Deep local community ties Risk - bearing enablers ApolloMed is paid a set rate to assume risk for the care of our patients Provider s are paid via value - based contracts, aligning financial & patient outcomes 1 3 4 We enable providers to quarterback patient care and improve clinical outcomes 2 www.apollomed.net 7

We have established long - term relationships with a diversified payer mix Average tenure with key payers 8 15 years Contribution from each top payer <15% total net revenue www.apollomed.net

ApolloMed is profitable with attractive unit economics… www.apollomed.net 9 1 2 3 ApolloMed’s scale, extensive experience in value - based care, and better risk adjustment result in better per member per month payments vs industry standard 1 Our large network of physicians across primary care and various specialties allow us to have more efficient care navigation and population health management, resulting in lower claims expenses vs industry peers 2 Our tech - enabled MSO 1 utilizes proprietary workflow automation tools to reduce administrative costs, allowing us to scale profitably 3 Illustration of ApolloMed’s economics vs industry peers Industry standard $ Per member p er m onth (PMPM) paid to AMEH by insurers Medical claims expenses Gross margin OpEx from MSO/TPA 1 EBIT D&A EBITDA (1) Network Medical Management, ApolloMed’s MSO (Managed Services Organization) and wholly owned subsidiary, pays claims, reviews authorizations, and performs other administrative tasks on behalf of its managed and consolidated IPAs

Increased capitation due to contracting and risk adjustment Better specialty network cost management Additional service lines Reduced outsourced MSO fees Improved quality of care bonus realization Total improvement potential Shared with physicians Net savings to AMEH …and we consistently create additional value as we grow by scaling revenue and cost reduction drivers Illustration of potential value creation for IPA 1 on AMEH platform www.apollomed.net 10 (1) IPA: Independent Practice/Physician Association Baseline

In addition to having a proven model of consistent growth across our members and physicians… www.apollomed.net 11 2,500 0 1,500 500 1,000 2,000 780 Members (K) 384 2021E 2014 2017 1,130 2020 2,000 20% 77% 1,000 4,000 7,000 10,000 0 2,000 4,000 6,000 8,000 10,000 12,000 Contracted Physicians 2021E 2017 2014 2020 39%

…our Next - Gen ACO has demonstrated sustainable success, proving our ability to deliver savings and quality in value - based agreements www.apollomed.net 12 23,177 27,529 30,740 0 10,000 20,000 30,000 40,000 2017 Total aligned b eneficiaries 2018 2019 0 5 10 15 20 25 30 35 40 45 50 Total benchmark e xpenditures l ess t otal aligned b eneficiary e xpenditures , 2017 - 2019 ApolloMed NGACO Median NGACO 46.0 21.0 Source: CMS Innovation Center data. ($M) For the 2019 performance year, APA ACO was among the top 4 NGACOs in the country (out of 37) in: Gross savings $ Gross savings % Quality score: Average QS: 95.81 93.73

ApolloMed’s large provider network and proprietary tech platform drive a virtuous cycle, powering growth and improving patient outcomes www.apollomed.net 13 Better outcomes increases value - based incentive payout and decreases utilization Machine learning models improve with more data Providers succeed in value - based arrangements with ApolloMed Providers drive member growth

Platform enables demonstrable improved outcomes for members www.apollomed.net 14 Medicare All information provided is 2019 data unless otherwise noted. Sources: CMS, Chronic Conditions Data Warehouse (CCW), competitors’ IR, and internal figures Hospital Admits per 1,000 Benchmark 274 137 197 Competitor 50% fewer ER Visits per 1,000 Benchmark 603 272 465 Competitor 55% fewer Average Length of Stay* Benchmark 5.8 4.5 22% shorter Inpatient Bed Days per 1,000* Benchmark 1,594 613 62% fewer *Competitor did not provide metrics for average length of stay and inpatient bed days per 1,000.

ApolloMed engine driven by our proprietary tech platform 15 ApolloMed combines technology and data analytics, powered by machine learning and artificial intelligence, with clinical expertise Technology expertise + = Operational excellence Clinical knowledge Artificial intelligence Machine learning Natural language processing Automated claims adjudication Intelligent authorization auto - approval Member population risk stratification and more… www.apollomed.net

Technology drives operational and clinical efficiency 16 Our solutions address three key pain points in managed healthcare delivery: Automated medical claims adjudication Utilization management automation Population health and provider incentive platform • Have processed >4 million claims with no human intervention across 12 IPAs and all lines of business • Saved >30,000 hours of manual claims examiner effort • Have processed >200,000 authorization requests with no human intervention across 12 IPAs and all lines of business • Saved thousands of hours of human utilization management examiner effort • Real - time value - based care KPIs • Real - time, actionable notifications with incentives driving provider behavior • Machine - learning model for population risk stratification www.apollomed.net

ApolloMed is at the intersection of provider services and healthcare technology, uniquely positioning it to grow rapidly The Market Opportunity 17
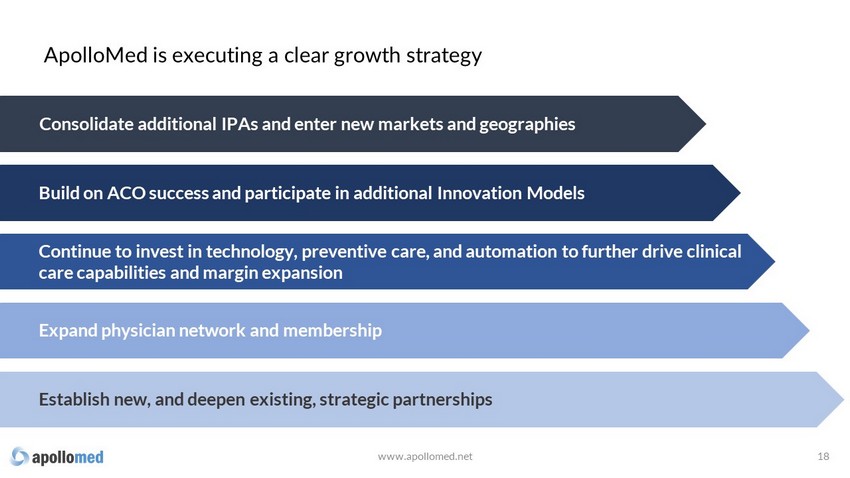
ApolloMed is executing a clear growth strategy 18 www.apollomed.net Consolidate additional IPAs and enter new markets and geographies Build on ACO success and participate in additional Innovation Models Continue to invest in technology, preventive care, and automation to further drive clinical care capabilities and margin expansion Expand physician network and membership Establish new, and deepen existing, strategic partnerships

A significant market opportunity in provider services 19 (1) Source: CMS.gov – NHE Fact Sheet, physician and clinical services expenditures (2) Source: CHCF.org – California Personal Health Core Spending, 2017 – Quick Reference Guide U.S. serviceable addressable market for provider services Estimated $838B for 2021 (1) SAM in state of CA ~$76B (2) SAM in CA counties currently served ~$17B www.apollomed.net

Although we have established a strong foothold in CA and are already in 9 of the top 25 counties by population in the U.S… 20 NJ MD Served by ApolloMed IPAs Served by ApolloMed ACO Planned expansion In discussions with other groups confidentially www.apollomed.net

…we are actively pursuing growth opportunities to capture greater share of the $3.6T provider services market opportunity 21 Current 2021 Goal ~1.1M Managed lives +500k >2M Managed lives +500k Managed lives in CA Managed lives outside of CA V V Provider services p opulation includes: Medicare , Medicaid , Commercial and Other Third Parties Potential membership in the State of California: Potential membership in CA counties currently served : ~21 M (2) ~14 M (3) U.S. total addressable market for ApolloMed services >$3.6T for 2021 (1) (1) Source: CMS.gov – NHE Fact Sheet, physician and clinical services expenditures (2) Source: Cattaneo & Stroud, Inc. – The Active California Medical Group Market report, March 31, 2019. (3) Source: Cattaneo & Stroud, Inc. – Total of Medical Groups HMO Enrollment by Lines Business, 2004 - 2018, March 15, 2019. www.apollomed.net

Integration of acquired IPAs 22 Allied Pacific IPA acquired for approx. $45M in May 2019 Allied Pacific IPA acquired remaining 75% stake not already held for approx. $7.25M in August 2019 ApolloMed continues to implement processes to fully integrate the IPAs acquired in 2019 into its framework — expected completion within 3 years of closing. ~170,000 members 340+ primary care physicians ~89,000 members 400+ primary care physicians Strategic growth – undervalued IPAs in contiguous areas Culture change – improvement needed in utilization management and population health practices Contracting – Payer contracts cannot be amended immediately www.apollomed.net

• CAIPA is a leading independent practice association serving the greater New York City area • Provides management, consulting, administrative, and other support services to professional healthcare service providers, including to Chinese American IPA d/b/a Coalition of Asian - American IPA (“CAIPA”) Strategic investment in CAIPA MSO – New York www.apollomed.net 23 Agreement whereby ApolloMed will own 30% of the post - closing total interests in CAIPA MSO on a fully diluted basis Partnership with CAIPA MSO enables ApolloMed to have a risk - contained entry foothold into New York ApolloMed to provide CAIPA MSO customers access to its proprietary population health management and healthcare delivery platform 1,000+ 500,000 Private practice providers covering over 70 specialties Managed lives Apollo Medical Holdings, Inc. and CAIPA MSO, LLC Announce Strategic Alliance in New York January 26, 2021

24 Large and rapidly growing market opportunity in value - based care Profitable & proven model with predictable, attractive unit economics and upside from risk - sharing Scalable and repeatable playbook for hypergrowth Industry - leading technology driven by data moat Flywheel effect that exponentially builds on substantial lead www.apollomed.net ApolloMed has overwhelming advantages and management will capitalize
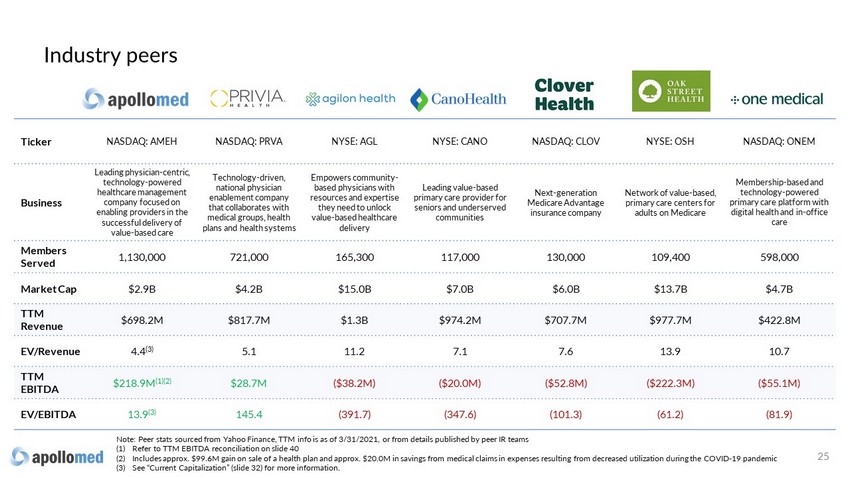
Ticker NASDAQ: AMEH NASDAQ: PRVA NYSE: AGL NYSE: CANO NASDAQ: CLOV NYSE: OSH NASDAQ: ONEM Business Leading physician - centric, technology - powered healthcare management company focused on enabling providers in the successful delivery of value - based care Technology - driven, national physician enablement company that collaborates with medical groups, health plans and health systems Empowers community - based physicians with resources and expertise they need to unlock value - based healthcare delivery Leading value - based primary care provider for seniors and underserved communities Next - generation Medicare Advantage insurance company Network of value - based, primary care centers for adults on Medicare Membership - based and technology - powered primary care platform with digital health and in - office care Members Served 1,130,000 721,000 165,300 117,000 130,000 109,400 598,000 Market Cap $2.9B $4.2B $15.0B $7.0B $6.0B $13.7B $4.7B TTM Revenue $698.2M $817.7M $1.3B $974.2M $707.7M $977.7M $422.8M EV/Revenue 4.4 (3) 5.1 11.2 7.1 7.6 13.9 10.7 TTM EBITDA $218.9M (1)(2) $28.7M ($38.2M) ($20.0M) ($52.8M) ($222.3M) ($55.1M) EV/EBITDA 13.9 (3) 145.4 (391.7) (347.6) (101.3) (61.2) (81.9) Industry peers 25 Note: Peer stats sourced from Yahoo Finance, TTM info is as of 3/31/2021, or from details published by peer IR teams (1) Refer to TTM EBITDA reconciliation on slide 40 (2) Includes approx. $99.6M gain on sale of a health plan and approx. $20.0M in savings from medical claims in expenses resulting fr om decreased utilization during the COVID - 19 pandemic (3) See “Current Capitalization” (slide 32) for more information.

Financial Overview A History of Profitable Growth
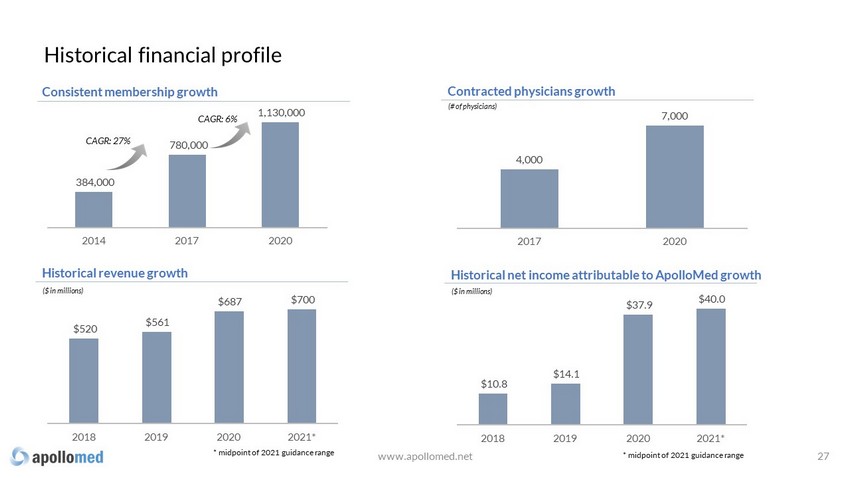
4,000 7,000 2017 2020 384,000 780,000 1,130,000 2014 2017 2020 CAGR: 27% $520 $561 $687 $700 2018 2019 2020 2021* Historical r evenue g rowth Consistent m embership g rowth Contracted p hysicians g rowth ($ in millions) (# of physicians) CAGR: 6% * midpoint of 2021 guidance range $10.8 $14.1 $37.9 $40.0 2018 2019 2020 2021* Historical net income attributable to ApolloMed growth ($ in millions) Historical financial profile www.apollomed.net * midpoint of 2021 guidance range 27
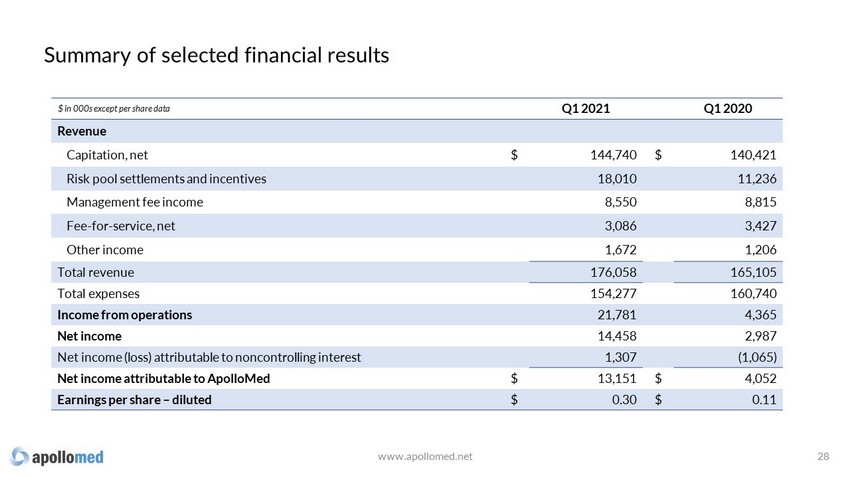
Summary of selected financial results www.apollomed.net 28 $ in 000s except per share data Q1 2021 Q1 2020 Revenue Capitation, net $ 144,740 $ 140,421 Risk pool settlements and incentives 18,010 11,236 Management fee income 8,550 8,815 Fee - for - service, net 3,086 3,427 Other income 1,672 1,206 Total revenue 176,058 165,105 Total expenses 154,277 160,740 Income from operations 21,781 4,365 Net income 14,458 2,987 Net income (loss) attributable to noncontrolling interest 1,307 (1,065) Net income attributable to ApolloMed $ 13,151 $ 4,052 Earnings per share – diluted $ 0.30 $ 0.11

2021 guidance $ in millions Q2 2021 Guidance range 2021 Guidance range Total revenue $163.0 - $173.0 $690.0 - $710.0 Net income $6.3 - $12.3 $50.0 - $60.0 Net income attributable to ApolloMed $6.5 - $10.5 $35.0 - $45.0 EBITDA (1) $15.6 - $21.6 $95.0 - $105.0 Adjusted EBITDA (1) $20.4 - $24.4 $115.0 - $125.0 29 (1) See “Guidance Reconciliation of Net Income to EBITDA and Adjusted EBITDA” and “Use of Non - GAAP Financial Measures” slides for mo re information. There can be no assurance that actual amounts will not be materially higher or lower than these expectations. See “Forward - Looking Statements” o n slide 2. www.apollomed.net

Capitation - Capitated fees for medical services via direct arrangements with managed care providers . Typically pre - paid monthly based on number of enrollees Risk p ool s ettlements & i ncentives - Full and shared risk capitation arrangements with certain health plans , local hospitals and Next Generation Accountable Care Organizations Management f ee i ncome - Fees earned from providing management, physician advisory, healthcare staffing, admin istrative and other non - medical services Fee - for - service - Professional component of charges for medical services rendered by our contracted physicians at outpatient centers 1.0% 1.7% 4.9% 10.2% 82.2% 0% 10% 20% 30% 40% 50% 60% 70% 80% 90% 100% For the quarter ended March 31, 2021 Capitation Risk pool settlements & incentives Management fee income Fee-for-service, net Other income Revenue breakdown 30 A B C D www.apollomed.net

Balance sheet highlights 31 $ in millions 3/31/2021 12/31/2020 $ Change % Change Cash and cash equivalents and investments in marketable securities $272.8 $261.2 $11.6 4% Working capital $243.9 $223.6 $20.3 9% Total stockholders’ equity $349.7 $330.9 $18.8 6% www.apollomed.net

Current capitalization 32 Note: Balance sheet data as of 3 /3 1 /202 1 (1) Excludes restricted cash of $65mm. www.apollomed.net (figures in millions, except per share price) Recent share price (as of 6/18/2021) $ 53.47 Common shares outstanding 55.0 Market capitalization $ 2,940.8 Plus: Total bank debt 243.3 Less: Cash and cash equivalents (1) (140.9) Implied enterprise value $ 3,043.2 Notes: Availability on revolving credit facility $ 25.0

Appendix

Together with our affiliated physician groups and consolidated entities, ApolloMed manages the medical lives of more than 1.1 million members. Consolidated IPAs ~ 558 ,000 member lives Publicly traded parent company M anagement services organization (MSO) Leading California IPAs * Managed IPAs ~ 484 ,000 member lives Next - generation accountable care organization ~ 29 ,000 member lives Commercial ACO & EPO ~ 59,000 member lives Acquired by Allied Pacific IPA in 2019 *8 additional IPAs under MSAs with NMM Organizational overview 34 www.apollomed.net See slides 12 and 38
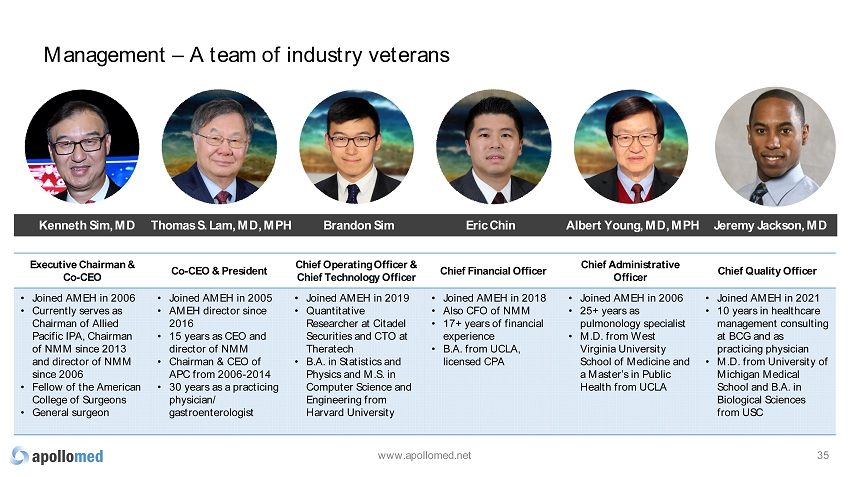
Management – A team of industry veterans 35 Executive Chairman & Co - CEO Co - CEO & President Chief Operating Officer & Chief Technology Officer Chief Financial Officer Chief Administrative Officer Chief Quality Officer • Joined AMEH in 2006 • Currently serves as Chairman of Allied Pacific IPA, Chairman of NMM since 2013 and director of NMM since 2006 • Fellow of the American College of Surgeons • General surgeon • Joined AMEH in 2005 • AMEH director since 2016 • 15 years as CEO and director of NMM • Chairman & CEO of APC from 2006 - 2014 • 30 years as a practicing physician/ gastroenterologist • Joined AMEH in 2019 • Quantitative Researcher at Citadel Securities and CTO at Theratech • B.A. in Statistics and Physics and M.S. in Computer Science and Engineering from Harvard University • Joined AMEH in 2018 • Also CFO of NMM • 17+ years of financial experience • B.A. from UCLA, licensed CPA • Joined AMEH in 2006 • 25+ years as pulmonology specialist • M.D. from West Virginia University School of Medicine and a Master’s in Public Health from UCLA • Joined AMEH in 2021 • 10 years in healthcare management consulting at BCG and as practicing physician • M.D. from University of Michigan Medical School and B.A. in Biological Sciences from USC Kenneth Sim, MD Eric Chin Albert Young, MD, MPH Brandon Sim Thomas S. Lam, MD, MPH www.apollomed.net Jeremy Jackson, MD

Across all aspects of care delivery, our offerings provide a steady revenue stream Our service offerings & revenue model 36 Consolidated Independent Practice Associations (IPAs) Next Generation ACO / Risk Model Management Services Organization (MSO) Commercial EPO Commercial ACO • Network of primary and specialty physicians • Deliver care under risk - bearing and capitated arrangements with payers • Negotiates discounts and manages claims for a network of physicians in 15 U.S. states and territories that deliver coordinated care to set beneficiaries under a risk - bearing capitated arrangement with CMS 2 • Provides non - medical services to medical companies and IPAs, such as billing, collection and administrative tasks • Delivers care under risk - bearing and capitated arrangements with employers • Members must utilize doctors and hospitals within the EPO network • Provides care coordination for aligned members ~82% ~10% ~5% New offering New offering % of revenue 1 1. For the first quarter ended 3/31/2021. Remaining 3% of revenue are related to fee - for - service offerings rendered by our contract ed physicians at our outpatient centers and other income. 2. Centers for Medicare & Medicaid Services www.apollomed.net

(Intermountain Healthcare) U.S. value - based landscape – providers 37 The value - based care landscape continues to broaden as more companies enter the market to take capitation risk directly or assist physicians in the transition to risk - based arrangements. Payer Owned Independent Other • Large payer - owned provider groups primarily pursuing payer - agnostic strategy • Minimal recent platform integration • Focus on acquisitions • ApolloMed, Privia Health, agilon health, Cano Health, Clover Health, Oak Street Health, One Medical and Signify Health are publicly traded • Other entrants are eyeing access to public markets • Several platforms considering strategic alternatives, e.g., PMA, Millennium, Genuine Health • New platforms continue to enter the market • Increased competition • Continued investment by sponsors and payers into cost management tools and services • Other value - based enablers are partnering with large multi - specialty groups to help take risk (UnitedHealth) (Cigna) (Humana) (Anthem) (Centene) (General Atlantic) (NYSE: EVH; TPG) (Humana, TPG, WCAS) Investor Owned www.apollomed.net

19.8 13.3 Stellar NGACO performance in 2019 www.apollomed.net 38 Net shared savings from CMS 37.3 Gross savings generated 19.8 17.5 Cap/risk arrangement 6.5 Provider bonus 13.3 Net shared savings settlement realized in Q3 2020 For the 2019 performance year, APA ACO was among the top 4 NGACOs in the country (out of 37) in: Gross Savings Amount Gross Savings Percentage • Applied and was approved by CMS to participate in the Next Generation ACO model in 2017 • Approved to participate in the All - Inclusive Population - Based Payment (AIPBP) track, the most advanced risk - taking payment model Gross Savings/Loss Amount is the Total Benchmark Expenditures minus the Total Aligned Beneficiary Expenditures. Gross Savings/Loss Percentage is the Total Benchmark minus Aligned Beneficiary Expenditures as a percentage of the Total Benc hma rk. Data sourced from: https://innovation.cms.gov/innovation - models/next - generation - aco - model ; 37 ACO’s reported as of 2/15/2021 ($ in millions)
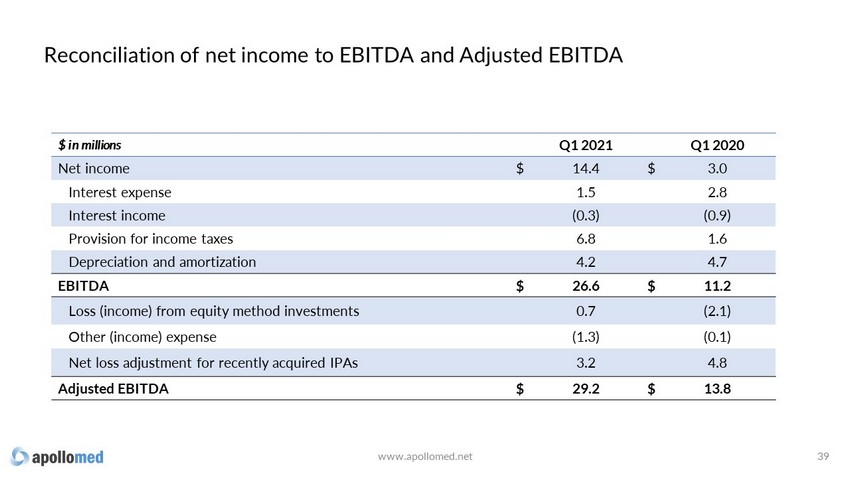
Reconciliation of net income to EBITDA and Adjusted EBITDA 39 www.apollomed.net $ in millions Q1 2021 Q1 2020 Net income $ 14.4 $ 3.0 Interest expense 1.5 2.8 Interest income (0.3) (0.9) Provision for income taxes 6.8 1.6 Depreciation and amortization 4.2 4.7 EBITDA $ 26.6 $ 11.2 Loss (income) from equity method investments 0.7 (2.1) Other (income) expense (1.3) (0.1) Net loss adjustment for recently acquired IPAs 3.2 4.8 Adjusted EBITDA $ 29.2 $ 13.8

TTM EBITDA reconciliation 40 www.apollomed.net $ in millions Q2 2020 Q3 2020 Q4 2020 Q1 2021 TTM 2021* Net income $ 81.0 $ 25.4 $ 12.9 $ 14.4 $ 133.7 Interest expense 2.7 2.5 1.5 1.5 8.2 Interest income (0.9) (0.8) (0.2) (0.3) (2.2) Provision for income taxes 31.9 10.8 11.9 6.8 61.4 Depreciation and amortization 4.6 4.7 4.3 4.2 17.8 EBITDA $ 119.3 $ 42.6 $ 30.4 $ 26.6 $ 218.9 Loss (income) from equity method investments (0.8) (0.4) (0.4) 0.7 (0.9) Gain on sale of equity method investment (99.6) - (0.2) - (99.8) Other (income) expense (1.3) (0.1) 0.4 (1.3) (2.3) Provider bonus payments 2.0 6.5 - - 8.5 Net loss adjustment for recently acquired IPAs 4.1 4.8 5.5 3.2 17.6 Adjusted EBITDA $ 23.7 $ 53.4 $ 35.7 $ 29.2 $ 142.0 * TTM 2021 ended March 31, 2021

Guidance reconciliation of net income to EBITDA and Adjusted EBITDA 41 www.apollomed.net $ in millions Low High Low High Net income $ 6.3 $ 12.3 $ 50.0 $ 60.0 Interest expense 1.5 1.6 8.0 8.5 Interest income (0.3) (0.5) (3.0) (5.0) Provision for income taxes 3.7 3.8 23.0 24.0 Depreciation and amortization 4.4 4.4 17.0 17.5 EBITDA $ 15.6 $ 21.6 $ 95.0 $ 105.0 Income from equity method investments - - (0.5) (1.0) Provider bonus payments - - 6.0 6.0 Net loss adjustment for recently acquired IPAs 4.8 2.8 14.5 15.0 Adjusted EBITDA $ 20.4 $ 24.4 $ 115.0 $ 125.0 Three Months Ending June 30, 2021 Year Ending December 31, 2021
Use of non - GAAP financial measures This presentation contains the non - GAAP financial measures Earnings Before Interest, Taxes, Depreciation and Amortization (“EBIT DA”) and Adjusted EBITDA, of which the most directly comparable financial measure presented in accordance with GAAP is net (loss) income. These measure s a re not in accordance with, or are an alternative to, U.S. generally accepted accounting principles (“GAAP”), and may be different from other non - GAAP financia l measures used by other companies. ApolloMed uses Adjusted EBITDA as a supplemental performance measure of its operations, for financial and operationa l decision - making, and as a supplemental means of evaluating period - to - period comparisons on a consistent basis. Adjusted EBITDA is calculated as earnings b efore interest, taxes, depreciation, and amortization, excluding losses from equity method investments provide bonus payments, impairment of intangi ble s, provision of doubtful accounts and other income earned that is not related to ApolloMed's normal operations. Adjusted EBITDA also excludes non recu rri ng items, including the effect on EBITDA of certain recently acquired IPAs. ApolloMed believes the presentation of these non - GAAP financial measures provides investors with relevant and useful information as it allows investors to evaluate the operating performance of the business activities without having to account for differences recognized because of no n - core and non - recurring financial information. When GAAP financial measures are viewed in conjunction with non - GAAP financial measures, investors are pr ovided with a more meaningful understanding of ApolloMed's ongoing operating performance. In addition, these non - GAAP financial measures are among those indicators ApolloMed uses as a basis for evaluating operational performance, allocating resources and planning and forecasting future pe rio ds. Non - GAAP financial measures are not intended to be considered in isolation, or as a substitute for, GAAP financial measures. To the extent this rel ease contains historical or future non - GAAP financial measures, ApolloMed has provided corresponding GAAP financial measures for comparative purposes. Reconciliati on between certain GAAP and non - GAAP measures is provided above. 42 www.apollomed.net

(1) The number of weighted average shares used to calculate EPS for the year ended December 31, 2020, was approximately 37.4 mil lion. (2) Based upon information publicly available as of 4/1/2021. Outstanding shares explained 43 In December 2020, approx. 5 million of Allied Pacific IPA’s shares of ApolloMed common stock were distributed through an in - kind dividend on a pro rata basis to Allied Pacific IPA’s individual shareholders. In addition, in March 2021, Allied Pacific IPA sold approx. 1.6 million shares of ApolloMed common stock to a non - related third party. As a result, the number of shares outstanding used to calculate EPS will increase in future periods but will be offset by a corresponding proportionate increase in net income attributable to ApolloMed as a result of this transaction. As a result, the Company does not expect this distribution (or future similar distributions) to have a material impact on GAAP EPS. The remaining approx. 10.9 million shares of ApolloMed common stock held by Allied Pacific IPA will continue to be treated as treasury stock and therefore will not be included in shares outstanding for GAAP EPS calculation purposes. 55.0M Total issued and outstanding shares as of 4/29/2021 44.1M (1) Expected shares outstanding to be used to calculate GAAP EPS for 2Q 2021 (2) 10.9M Treasury shares (owned by Allied Pacific IPA) after Allied Pacific IPA’s in - kind dividend in December 2020 and share sale in March 2021

Key acronyms 44 ◦ ACO: Accountable Care Organization ◦ AIPBP: All - Inclusive Population - Based Payments ◦ APC: Allied Physicians of California IPA ◦ CMMI: Center for Medicare and Medicaid Innovation ◦ CMS: Centers for Medicare & Medicaid Services ◦ DME: Durable Medical Equipment ◦ Health Plan / Pay e rs: Health Insurance Companies ◦ HMO: Health Maintenance Organization ◦ IPA: Independent Practice Association ◦ NCI: Non - Controlling Interest ◦ NMM: Network Medical Management , Inc. ◦ MSA: Master Service Agreement ◦ MSO: Management Services Organization ◦ NGACO: Next Generation Accountable Care Organization ◦ PCP: Primary Care Physician ◦ PMPM: Per Member Per Month ◦ SNF: Skilled Nursing Facility ◦ VIE: Variable Interest Entity www.apollomed.net

For inquiries, please contact: ApolloMed Investor Relations (626) 943 - 6491 [email protected] Carolyne Sohn, The Equity Group (415) 568 - 2255 [email protected]
Serious News for Serious Traders! Try StreetInsider.com Premium Free!
You May Also Be Interested In
- Green Energy Park Raises 30 million US Dollars in Initial Equity Funding to Accelerate the Energy Transition and to Build One of the Largest Renewable Hydrogen Production and Export Terminal Facilitie
- Flash News: OKX Wallet Now Supports Reading of Staked STONE
- Form 8.5 (EPT/RI) - Abrdn European Logistics Income Plc
Create E-mail Alert Related Categories
SEC FilingsSign up for StreetInsider Free!
Receive full access to all new and archived articles, unlimited portfolio tracking, e-mail alerts, custom newswires and RSS feeds - and more!
