

Form 8-K ALLIANCE DATA SYSTEMS For: Jan 27
 Tweet
Tweet Share
ShareExhibit 99.1
Brand Partner Highlights “We were very pleased with the pace and success of our business development
activities, which in the fourth quarter attracted several new brand partners, including the NFL, B&H Photo, Michaels, and TBC Corporation – which includes brands like National Tire & Battery (NTB), Big O Tires, and Midas. Alliance Data’s
omnichannel touchpoints and comprehensive product suite will position these brand partners to drive incremental sales growth and customer loyalty, while also providing expanded payment choices for their customers,” said Ralph Andretta, president
and chief executive officer of Alliance Data. 1 Alliance Data Systems Corporation | January 27, 2022 Alliance Data Reports Full Year and Fourth Quarter 2021 Results CEO Commentary “2021 represented a transformational year, resulting in a
streamlined and stronger Alliance Data. We successfully executed on our strategy to provide an enhanced suite of product offerings, expanded our fintech payments platform, attracted top-tier talent, advanced our core technology and digital
capabilities, and bolstered our financial position by divesting our last remaining non-core business.“Our fourth quarter results demonstrate Alliance Data’s ability to drive growth and improved core earnings. Year-end receivables increased 4%
from 2020 levels, and pre-tax pre-provision earnings increased both year-over-year and sequentially in the fourth quarter. At the same time, we continued to strategically invest in our business to capture longer-term efficiencies and growth
opportunities, positioning the company to achieve our target of $20 billion in average receivables for the full year of 2023.“Credit sales remained strong in the fourth quarter reflecting improved holiday shopping and consumer activity. In-store
credit transactions increased year-over-year as consumers continued to shop across all channels. Millennial and Gen. Z spending and transaction activity exceeded pre-pandemic levels in the quarter.“As expected, our net loss and delinquency rates
moved gradually higher in the fourth quarter in tandem with the wind-down of COVID-related federal stimulus programs. While we project these metrics to increase in 2022, they are expected to remain below historic levels.” - Ralph Andretta,
president and chief executive officer COLUMBUS, Ohio, January 27, 2022 – Alliance Data Systems Corporation (NYSE: ADS), a leading provider of tech-forward payment and lending solutions, today announced results for the full year and the fourth
quarter ended December 31, 2021.Fourth quarter net income was $17 million, or $0.34 per diluted share, inclusive of one-time costs related to the spinoff of the LoyaltyOne segment as Loyalty Ventures Inc. (NASDAQ: LYLT). Financial Fourth
Quarter 2021 Full Year 2021 Summary Total Company Continuing Operations(a) Total Company Continuing Operations(a) Net Income ($ millions) $17 $61 $801 $797 Earnings per Diluted Share $0.34 $1.21 $16.02 $15.95 Reflective of
the spinoff of Loyalty Ventures Inc.Fourth quarter credit sales increased 15% year-over-year.Credit performance held strong with a net loss rate of 4.4% in 4Q21.As a result of the spinoff of Loyalty Ventures Inc., capital and leverage ratios
improved as $750 million of debt was paid down and goodwill was reduced by $700 million. “Also in the quarter, we more than doubled the number of new direct merchant partner signings on Bread’s versatile fintech payments platform compared
to third quarter levels. More broadly, our business development pipeline remains robust, including soon-to-be announced new partnerships, supporting our confidence for continued growth in 2022 and beyond,” Andretta noted. “Additionally, we are
excited to extend our relationships with Ulta Beauty, Toyota, top Millennial and Gen Z brands, as well as Lexus. The long-term renewal with Ulta Beauty, one of our largest and faster-growing brand partners, reinforced our industry-leading
position in the beauty vertical, while the Toyota and Lexus renewal extends the growth of diversified verticals. With these renewals, we have secured the vast majority of our brand partner relationships through 2023.
“We are well-positioned to build on our momentum in 2022. While we continue to monitor uncertainties in the
economy, we are confident in the responsible execution of our strategy and the achievement of our financial targets. Our disciplined risk management approach focused on risk-reward tradeoff will enable us to maintain profitable growth in the
periods ahead; we are committed to ensuring our strategic investments deliver long-term shareholder value.” CFO Commentary - Perry Beberman, executive vice president and chief financial officer 2022 Full Year CFO OutlookMacroeconomic
Assumptions: “We expect a return to more normalized economic activity and consumer behavior and remain vigilant in monitoring COVID conditions and the impact on consumers and our brand partners. Our outlook assumes a moderation in the consumer
payment rate throughout 2022. Payment rate variability is a key determinant for the high- and low-ends of our forecasted ranges. Four Federal Reserve rate increases are also included in our 2022 forecast and our models indicate that these rate
hikes in 2022 would result in a nominal benefit to total net interest income.Average Receivables Growth: “Based on our new business expectations, visibility into our pipeline (including the BJ’s Wholesale Club non-renewal), and the current
economic outlook, we expect full year 2022 average receivables growth in the high-single- to low-double-digit range relative to 2021. This expected growth aligns with the achievement of our targeted full year average receivables of $20 billion in
2023.Total Revenue Growth: “Total revenue growth for 2022 is anticipated to be closely aligned with average receivables growth with net interest margin expected to remain steady on a full year basis as compared to 2021. Total Expenses Growth:
“As a result of continued investment in technology modernization, digital advancement, marketing, and product innovation, along with strong portfolio growth, we anticipate total expenses to increase in 2022, while ensuring we deliver modest
positive operating leverage for the full year. We will continue to invest prudently to position the Company for future growth and efficiencies, with the expectation of maintaining positive operating leverage. We will manage the pace and timing of
our investments to align with our revenue growth outlook, including the planned incremental investment of more than $125 million in digital and product innovation, marketing, and technology enhancements during the year. Net Loss Rate: “We expect
a net loss rate in the low-to-mid 5% range for 2022 as credit metrics begin to normalize from historically low rates due to federal stimulus and federal assistance programs largely expiring. We remain confident in our long-term guidance of a
through-the-cycle net loss rate below our historical average of 6%.” 2 Alliance Data Systems Corporation | January 27, 2022
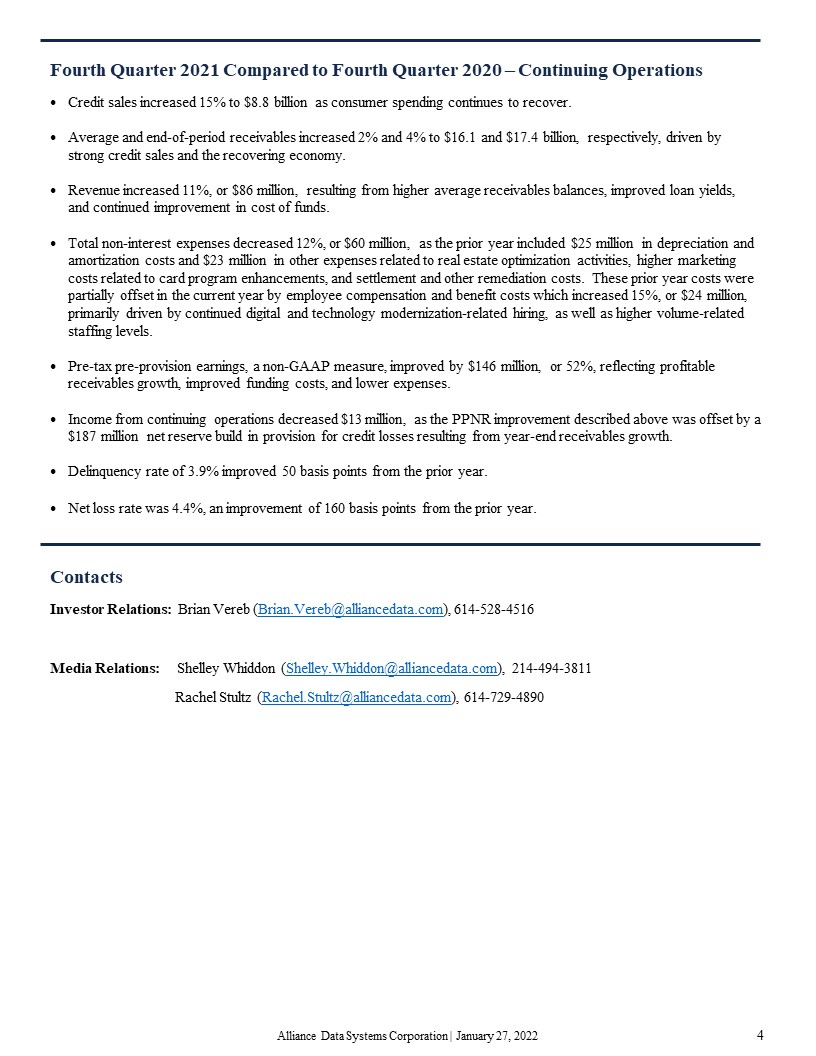
+15% +11% +52% +36% -21% -0.5% -1.6% Key Operating and Financial Metrics(a) Credit
Metrics Diluted EPS Continuing Operations(a) Quarter Ended Year Ended December 31, December 31, ($ in millions, except per share amounts) 2021 2020 Change 2021 2020 Change Total net interest and non-interest
income (“Revenue”) $855 $769 11% $3,272 $3,298 (1)% Net principal losses $176 $235 (25)% $720 $1,083 (34)% Reserve build (release) $187 ($82) nm ($176) $183 nm Provision for credit losses $363 $153
138% $544 $1,266 (57)% Total non-interest expenses $427 $487 (12)% $1,684 $1,731 (3)% Income from continuing operations before income taxes $65 $129 (50)% $1,044 $301 247% Income from continuing operations $61
$74 (18)% $797 $208 283% Income from continuing operations per diluted share $1.21 $1.54 (21)% $15.95 $4.35 267% Weighted average shares outstanding –
diluted 50.0 48.4 50.0 47.9 ********************************** Pre-tax pre-provision earnings (“PPNR”)* $428 $282 52% $1,588 $1,567 1% (a) Reflective of the spinoff of Loyalty Ventures Inc. for all periods
presented.nm – not meaningful* Pre-tax pre-provision earnings is a non-GAAP financial measure. 3 Alliance Data Systems Corporation | January 27, 2022
4 Alliance Data Systems Corporation | January 27, 2022 Fourth Quarter 2021 Compared to Fourth Quarter
2020 – Continuing OperationsCredit sales increased 15% to $8.8 billion as consumer spending continues to recover. Average and end-of-period receivables increased 2% and 4% to $16.1 and $17.4 billion, respectively, driven by strong credit sales
and the recovering economy. Revenue increased 11%, or $86 million, resulting from higher average receivables balances, improved loan yields, and continued improvement in cost of funds. Total non-interest expenses decreased 12%, or $60 million, as
the prior year included $25 million in depreciation and amortization costs and $23 million in other expenses related to real estate optimization activities, higher marketing costs related to card program enhancements, and settlement and other
remediation costs. These prior year costs were partially offset in the current year by employee compensation and benefit costs which increased 15%, or $24 million, primarily driven by continued digital and technology modernization-related hiring,
as well as higher volume-related staffing levels. Pre-tax pre-provision earnings, a non-GAAP measure, improved by $146 million, or 52%, reflecting profitable receivables growth, improved funding costs, and lower expenses. Income from continuing
operations decreased $13 million, as the PPNR improvement described above was offset by a $187 million net reserve build in provision for credit losses resulting from year-end receivables growth. Delinquency rate of 3.9% improved 50 basis points
from the prior year. Net loss rate was 4.4%, an improvement of 160 basis points from the prior year. ContactsInvestor Relations: Brian Vereb ([email protected]), 614-528-4516 Media Relations: Shelley Whiddon
([email protected]), 214-494-3811 Rachel Stultz ([email protected]), 614-729-4890
5 Alliance Data Systems Corporation | January 27, 2022 Forward-Looking StatementsThis release contains
forward-looking statements within the meaning of Section 27A of the Securities Act of 1933 and Section 21E of the Securities Exchange Act of 1934. Forward-looking statements give our expectations or forecasts of future events and can generally be
identified by the use of words such as "believe," "expect," "anticipate," "estimate," "intend," "project," "plan," "likely," "may," "should" or other words or phrases of similar import. Similarly, statements that describe our business strategy,
outlook, objectives, plans, intentions or goals also are forward-looking statements. Examples of forward-looking statements include, but are not limited to, statements we make regarding, and the guidance we give with respect to, our anticipated
operating or financial results, initiation or completion of strategic initiatives, including our ability to realize the intended benefits of the spinoff of the LoyaltyOne® segment, future dividend declarations, and future economic conditions,
including, but not limited to, market conditions and COVID-19 impacts related to relief measures for impacted borrowers and depositors, labor shortages due to quarantine, and reduction in demand from clients.We believe that our expectations are
based on reasonable assumptions. Forward-looking statements, however, are subject to a number of risks and uncertainties that could cause actual results to differ materially from the projections, anticipated results or other expectations
expressed in this release, and no assurances can be given that our expectations will prove to have been correct. These risks and uncertainties include, but are not limited to, factors set forth in the Risk Factors section in our Annual Report on
Form 10-K for the most recently ended fiscal year, which may be updated in Item 1A of, or elsewhere in, our Quarterly Reports on Form 10-Q filed for periods subsequent to such Form 10-K. Our forward-looking statements speak only as of the date
made, and we undertake no obligation, other than as required by applicable law, to update or revise any forward-looking statements, whether as a result of new information, subsequent events, anticipated or unanticipated circumstances or
otherwise.Non-GAAP Financial MeasuresWe prepare our Consolidated Financial Statements in accordance with accounting principles generally accepted in the United States of America (“GAAP”). However, certain information included within this release,
including the supplemental schedules and related investor presentation, constitutes non-GAAP financial measures. Our calculations of non-GAAP financial measures may differ from the calculations of similarly titled measures by other companies. In
particular, Pre-tax pre-provision earnings is calculated by increasing Income from continuing operations before income taxes by Provision for credit losses. Pre-tax pre-provision earnings less gain on portfolio sale is calculated by decreasing
Pre-tax pre-provision earnings by gains recognized on loan portfolio sales. We believe the use of these non-GAAP financial measures provides additional clarity in understanding our results of operations and trends. For a reconciliation of these
non-GAAP financial measures to the most directly comparable GAAP measures, please see the financial tables and information that follows.Conference Call / Webcast InformationAlliance Data will host a conference call on Thursday, January 27, 2022
at 8:30 a.m. (Eastern Time) to discuss the Company’s full year and fourth quarter 2021 results. The conference call will be available via the Internet at www.alliancedata.com. There will be several slides accompanying the webcast. Please go to
the website at least 15 minutes prior to the call to register, download and install any necessary software. The recorded webcast will also be available on the Company’s website.If you are unable to participate in the conference call, a replay
will be available. To access the replay, please dial (866) 813-9403 or (929) 458-6194 and enter “252370”. The replay will be available at approximately 11:59 a.m. (Eastern Time) on Thursday, January 27, 2022.
6 Alliance Data Systems Corporation | January 27, 2022 About Alliance DataAlliance Data® (NYSE: ADS) is a
leading provider of tech-forward payment and lending solutions, serving customers and consumer-based industries in North America. Through omnichannel touch points and a comprehensive product suite that includes credit products and Bread® digital
payment solutions, Alliance Data helps its partners drive loyalty and growth, while giving customers greater payment choices. Through its Comenity-branded financial services, it also offers credit and savings products to consumers. Headquartered
in Columbus, Ohio, Alliance Data is an S&P MidCap 400 company that employs approximately 6,000 associates worldwide. In November 2021, Alliance Data completed the spinoff of its LoyaltyOne segment, which included the Canadian AIR
MILES® Reward Program, and Netherlands-based BrandLoyalty. The company is now known as Loyalty Ventures Inc. (Nasdaq: LYLT).More information about Alliance Data can be found at AllianceData.com. Follow Alliance Data on Twitter,
Facebook, LinkedIn, Instagram and YouTube.
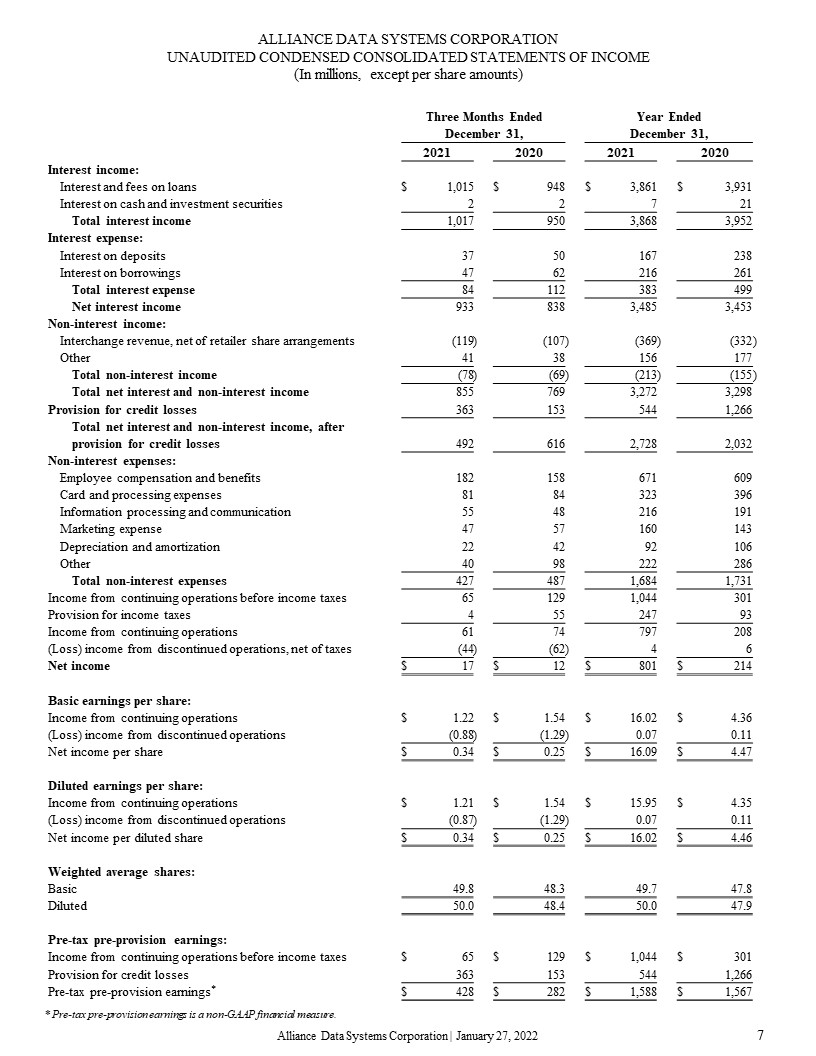
7 Alliance Data Systems Corporation | January 27, 2022 Three Months Ended
December 31, Year EndedDecember 31, 2021 2020 2021 2020 Interest income: Interest and fees on
loans $ 1,015 $ 948 $ 3,861 $ 3,931 Interest on cash and investment securities 2 2 7 21 Total interest
income 1,017 950 3,868 3,952 Interest expense: Interest on deposits 37 50 167 238 Interest on
borrowings 47 62 216 261 Total interest expense 84 112 383 499 Net interest
income 933 838 3,485 3,453 Non-interest income: Interchange revenue, net of retailer share
arrangements (119 ) (107 ) (369 ) (332 ) Other 41 38 156 177 Total non-interest income (78 ) (69 ) (213 ) (155 ) Total net
interest and non-interest income 855 769 3,272 3,298 Provision for credit losses 363 153 544 1,266 Total net interest and non-interest income, after provision
for credit losses 492 616 2,728 2,032 Non-interest expenses: Employee compensation and
benefits 182 158 671 609 Card and processing expenses 81 84 323 396 Information processing and
communication 55 48 216 191 Marketing expense 47 57 160 143 Depreciation and
amortization 22 42 92 106 Other 40 98 222 286 Total non-interest expenses 427 487 1,684 1,731 Income from
continuing operations before income taxes 65 129 1,044 301 Provision for income taxes 4 55 247 93 Income from continuing
operations 61 74 797 208 (Loss) income from discontinued operations, net of taxes (44 ) (62 ) 4 6 Net
income $ 17 $ 12 $ 801 $ 214 Basic earnings per share: Income from continuing
operations $ 1.22 $ 1.54 $ 16.02 $ 4.36 (Loss) income from discontinued operations (0.88 ) (1.29 ) 0.07 0.11 Net income per
share $ 0.34 $ 0.25 $ 16.09 $ 4.47 Diluted earnings per share: Income from continuing
operations $ 1.21 $ 1.54 $ 15.95 $ 4.35 (Loss) income from discontinued operations (0.87 ) (1.29 ) 0.07 0.11 Net income per diluted
share $ 0.34 $ 0.25 $ 16.02 $ 4.46 Weighted average
shares: Basic 49.8 48.3 49.7 47.8 Diluted 50.0 48.4 50.0 47.9 Pre-tax
pre-provision earnings: Income from continuing operations before income taxes $ 65 $ 129 $ 1,044 $ 301 Provision for credit
losses 363 153 544 1,266 Pre-tax pre-provision earnings* $ 428 $ 282 $ 1,588 $ 1,567 ALLIANCE DATA SYSTEMS CORPORATIONUNAUDITED CONDENSED CONSOLIDATED STATEMENTS OF
INCOME(In millions, except per share amounts) * Pre-tax pre-provision earnings is a non-GAAP financial measure.
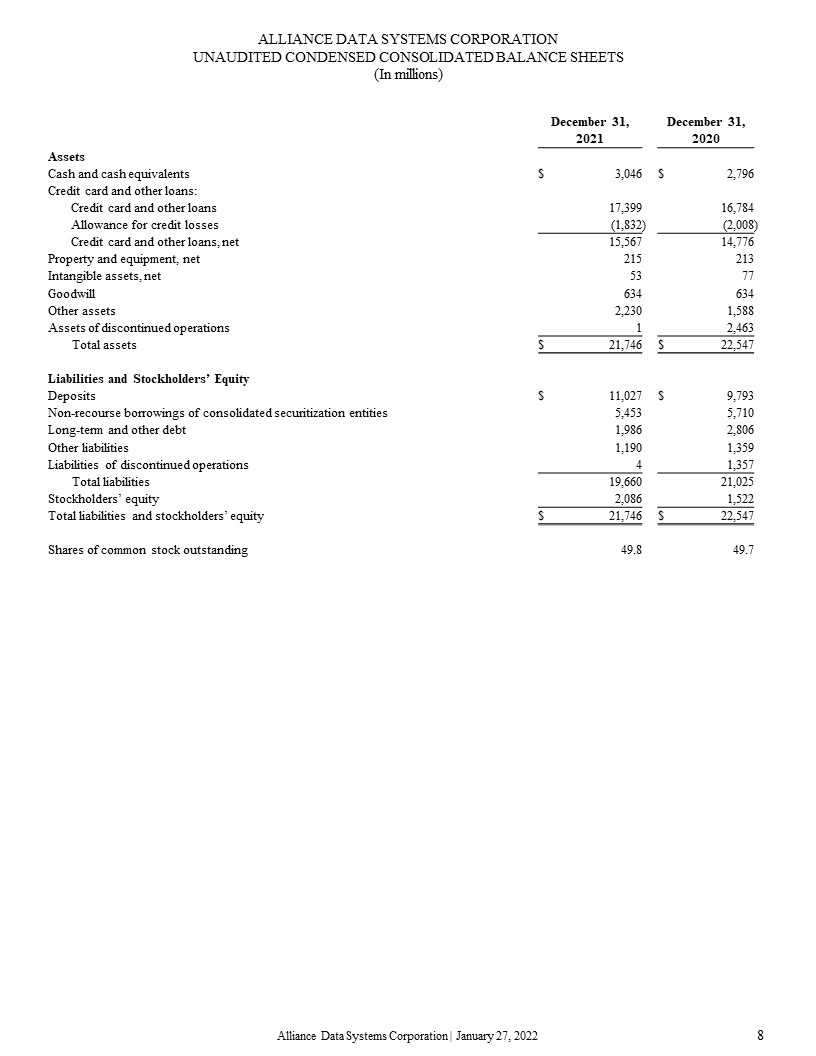
8 Alliance Data Systems Corporation | January 27, 2022 December 31, 2021 December 31,
2020 Assets Cash and cash equivalents $ 3,046 $ 2,796 Credit card and other loans: Credit card and other loans 17,399 16,784 Allowance for credit losses
(1,832 ) (2,008 ) Credit card and other loans, net 15,567 14,776 Property and equipment, net 215 213 Intangible assets, net 53 77 Goodwill 634 634 Other
assets 2,230 1,588 Assets of discontinued operations 1 2,463 Total assets $ 21,746 $ 22,547 Liabilities and Stockholders’ Equity Deposits
$ 11,027 $ 9,793 Non-recourse borrowings of consolidated securitization entities 5,453 5,710 Long-term and other debt 1,986 2,806 Other liabilities 1,190 1,359 Liabilities of
discontinued operations 4 1,357 Total liabilities 19,660 21,025 Stockholders’ equity 2,086 1,522 Total liabilities and stockholders’ equity
$ 21,746 $ 22,547 Shares of common stock outstanding 49.8 49.7 ALLIANCE DATA SYSTEMS CORPORATIONUNAUDITED CONDENSED CONSOLIDATED BALANCE SHEETS(In millions)
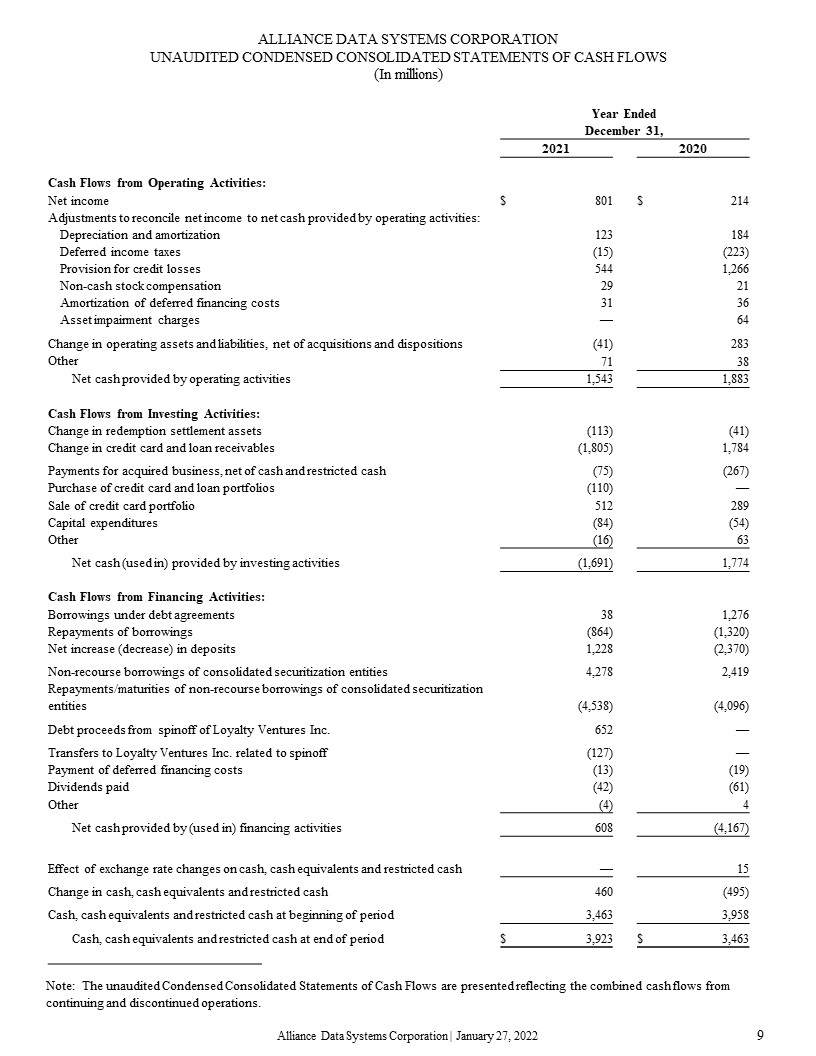
9 Alliance Data Systems Corporation | January 27, 2022 Year EndedDecember
31, 2021 2020 Cash Flows from Operating Activities: Net income $ 801 $ 214 Adjustments to reconcile net income to net
cash provided by operating activities: Depreciation and amortization 123 184 Deferred income taxes (15) (223) Provision for credit
losses 544 1,266 Non-cash stock compensation 29 21 Amortization of deferred financing costs 31 36 Asset impairment
charges — 64 Change in operating assets and liabilities, net of acquisitions and dispositions (41) 283 Other 71 38 Net cash provided by operating
activities 1,543 1,883 Cash Flows from Investing Activities: Change in redemption settlement assets (113) (41) Change in credit card
and loan receivables (1,805) 1,784 Payments for acquired business, net of cash and restricted cash (75) (267) Purchase of credit card and loan
portfolios (110) — Sale of credit card portfolio 512 289 Capital expenditures (84) (54) Other (16) 63 Net cash (used in) provided
by investing activities (1,691) 1,774 Cash Flows from Financing Activities: Borrowings under debt agreements 38 1,276 Repayments of
borrowings (864) (1,320) Net increase (decrease) in deposits 1,228 (2,370) Non-recourse borrowings of consolidated securitization
entities 4,278 2,419 Repayments/maturities of non-recourse borrowings of consolidated securitization entities (4,538) (4,096) Debt proceeds from spinoff of Loyalty Ventures
Inc. 652 — Transfers to Loyalty Ventures Inc. related to spinoff (127) — Payment of deferred financing costs (13) (19) Dividends
paid (42) (61) Other (4) 4 Net cash provided by (used in) financing activities 608 (4,167) Effect of exchange rate changes on cash,
cash equivalents and restricted cash — 15 Change in cash, cash equivalents and restricted cash 460 (495) Cash, cash equivalents and restricted cash at beginning of
period 3,463 3,958 Cash, cash equivalents and restricted cash at end of period $ 3,923 $ 3,463 Note: The unaudited Condensed Consolidated Statements of
Cash Flows are presented reflecting the combined cash flows from continuing and discontinued operations. ALLIANCE DATA SYSTEMS CORPORATIONUNAUDITED CONDENSED CONSOLIDATED STATEMENTS OF CASH FLOWS(In millions)
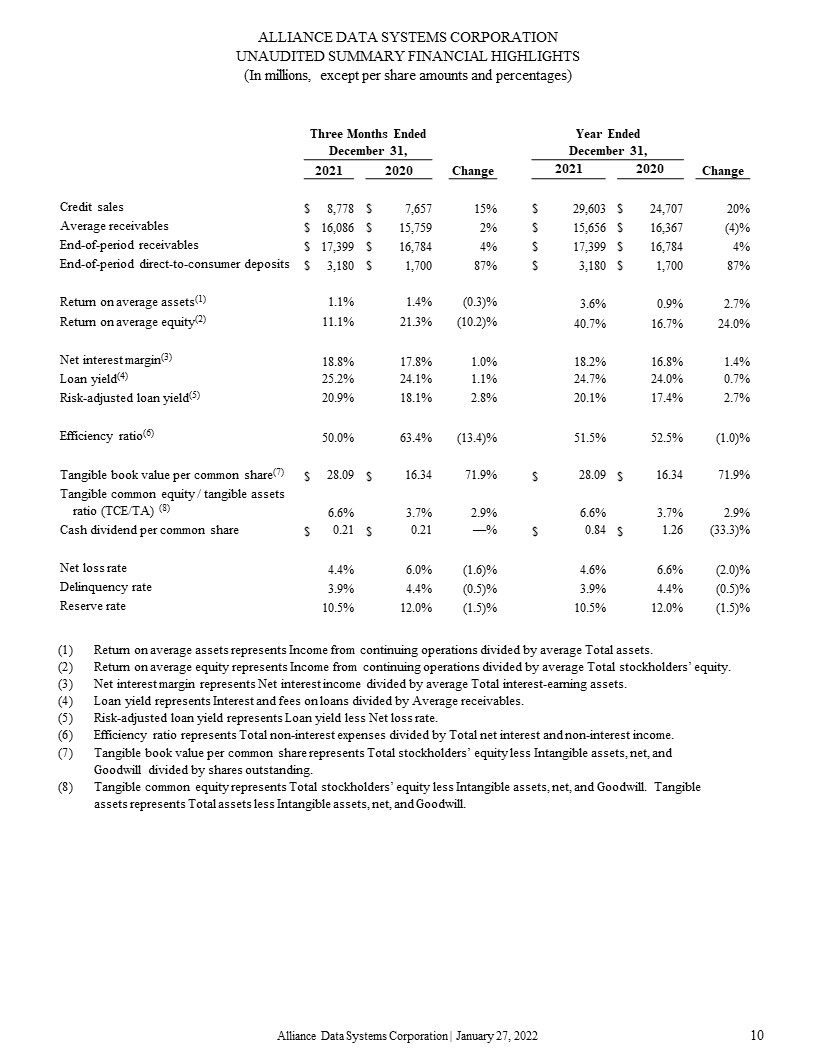
10 Alliance Data Systems Corporation | January 27, 2022 ALLIANCE DATA SYSTEMS CORPORATIONUNAUDITED
SUMMARY FINANCIAL HIGHLIGHTS(In millions, except per share amounts and percentages) Three Months Ended December 31, Year EndedDecember
31, 2021 2020 Change 2021 2020 Change Credit
sales $ 8,778 $ 7,657 15% $ 29,603 $ 24,707 20% Average receivables $ 16,086 $ 15,759 2% $ 15,656 $ 16,367 (4)% End-of-period
receivables $ 17,399 $ 16,784 4% $ 17,399 $ 16,784 4% End-of-period direct-to-consumer
deposits $ 3,180 $ 1,700 87% $ 3,180 $ 1,700 87% Return on average
assets(1) 1.1% 1.4% (0.3)% 3.6% 0.9% 2.7% Return on average
equity(2) 11.1% 21.3% (10.2)% 40.7% 16.7% 24.0% Net interest
margin(3) 18.8% 17.8% 1.0% 18.2% 16.8% 1.4% Loan yield(4) 25.2% 24.1% 1.1% 24.7% 24.0% 0.7% Risk-adjusted loan
yield(5) 20.9% 18.1% 2.8% 20.1% 17.4% 2.7% Efficiency
ratio(6) 50.0% 63.4% (13.4)% 51.5% 52.5% (1.0)% Tangible book value per common
share(7) $ 28.09 $ 16.34 71.9% $ 28.09 $ 16.34 71.9% Tangible common equity / tangible assets ratio (TCE/TA)
(8) 6.6% 3.7% 2.9% 6.6% 3.7% 2.9% Cash dividend per common
share $ 0.21 $ 0.21 —% $ 0.84 $ 1.26 (33.3)% Net loss
rate 4.4% 6.0% (1.6)% 4.6% 6.6% (2.0)% Delinquency rate 3.9% 4.4% (0.5)% 3.9% 4.4% (0.5)% Reserve
rate 10.5% 12.0% (1.5)% 10.5% 12.0% (1.5)% Return on average assets represents Income from continuing operations divided by average Total assets.Return on average equity represents Income
from continuing operations divided by average Total stockholders’ equity.Net interest margin represents Net interest income divided by average Total interest-earning assets.Loan yield represents Interest and fees on loans divided by Average
receivables.Risk-adjusted loan yield represents Loan yield less Net loss rate.Efficiency ratio represents Total non-interest expenses divided by Total net interest and non-interest income.Tangible book value per common share represents Total
stockholders’ equity less Intangible assets, net, and Goodwill divided by shares outstanding.Tangible common equity represents Total stockholders’ equity less Intangible assets, net, and Goodwill. Tangible assets represents Total assets less
Intangible assets, net, and Goodwill.
Alliance DataFourth Quarter & Full Year 2021 Results Perry BebermanEVP & CFO January 27,
2022 Ralph AndrettaPresident & CEO © 2022 ADS Alliance Data Systems, Inc. Exhibit 99.2
Forward-Looking Statements 2 © 2022 ADS Alliance Data Systems, Inc. Non-GAAP Financial
Measures This release contains forward-looking statements within the meaning of Section 27A of the Securities Act of 1933 and Section 21E of the Securities Exchange Act of 1934. Forward-looking statements give our expectations or forecasts of
future events and can generally be identified by the use of words such as "believe," "expect," "anticipate," "estimate," "intend," "project," "plan," "likely," "may," "should" or other words or phrases of similar import. Similarly, statements
that describe our business strategy, outlook, objectives, plans, intentions or goals also are forward-looking statements. Examples of forward-looking statements include, but are not limited to, statements we make regarding, and the guidance we
give with respect to, our anticipated operating or financial results, initiation or completion of strategic initiatives including our ability to realize the intended benefits of the spinoff of the LoyaltyOne® segment, future dividend
declarations, and future economic conditions, including, but not limited to, market conditions and COVID-19 impacts related to relief measures for impacted borrowers and depositors, labor shortages due to quarantine and reduction in demand from
clients.We believe that our expectations are based on reasonable assumptions. Forward-looking statements, however, are subject to a number of risks and uncertainties that could cause actual results to differ materially from the projections,
anticipated results or other expectations expressed in this release, and no assurances can be given that our expectations will prove to have been correct. These risks and uncertainties include, but are not limited to, factors set forth in the
Risk Factors section in our Annual Report on Form 10-K for the most recently ended fiscal year, which may be updated in Item 1A of, or elsewhere in, our Quarterly Reports on Form 10-Q filed for periods subsequent to such Form 10-K. Our
forward-looking statements speak only as of the date made, and we undertake no obligation, other than as required by applicable law, to update or revise any forward-looking statements, whether as a result of new information, subsequent events,
anticipated or unanticipated circumstances or otherwise. We prepare our Consolidated Financial Statements in accordance with accounting principles generally accepted in the United States of America (“GAAP”). However, certain information
included within this presentation, constitutes non-GAAP financial measures. Our calculations of non-GAAP financial measures may differ from the calculations of similarly titled measures by other companies. In particular, Pre-tax pre-provision
earnings is calculated by increasing Income from continuing operations before income taxes by Provision for credit losses. Pre-tax pre-provision earnings less gain on portfolio sale is calculated by decreasing Pre-tax pre-provision earnings by
gains recognized on loan portfolio sales. We believe the use of these non-GAAP financial measures provides additional clarity in understanding our results of operations and trends. For a reconciliation of these non-GAAP financial measures to
the most directly comparable GAAP measures, please see the financial tables and information that follows.
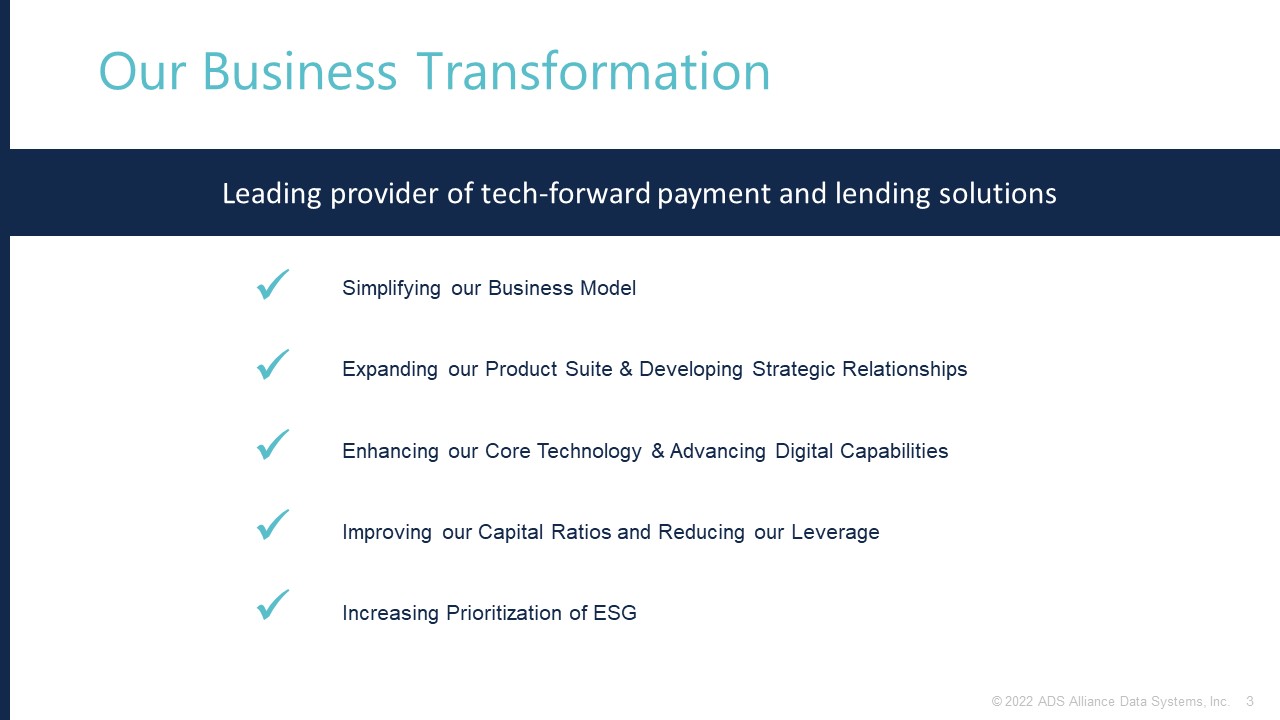
Our Business Transformation 3 © 2022 ADS Alliance Data Systems, Inc. Leading provider of
tech-forward payment and lending solutions Expanding our Product Suite & Developing Strategic Relationships Improving our Capital Ratios and Reducing our Leverage Enhancing our Core Technology & Advancing Digital
Capabilities Increasing Prioritization of ESG Simplifying our Business Model
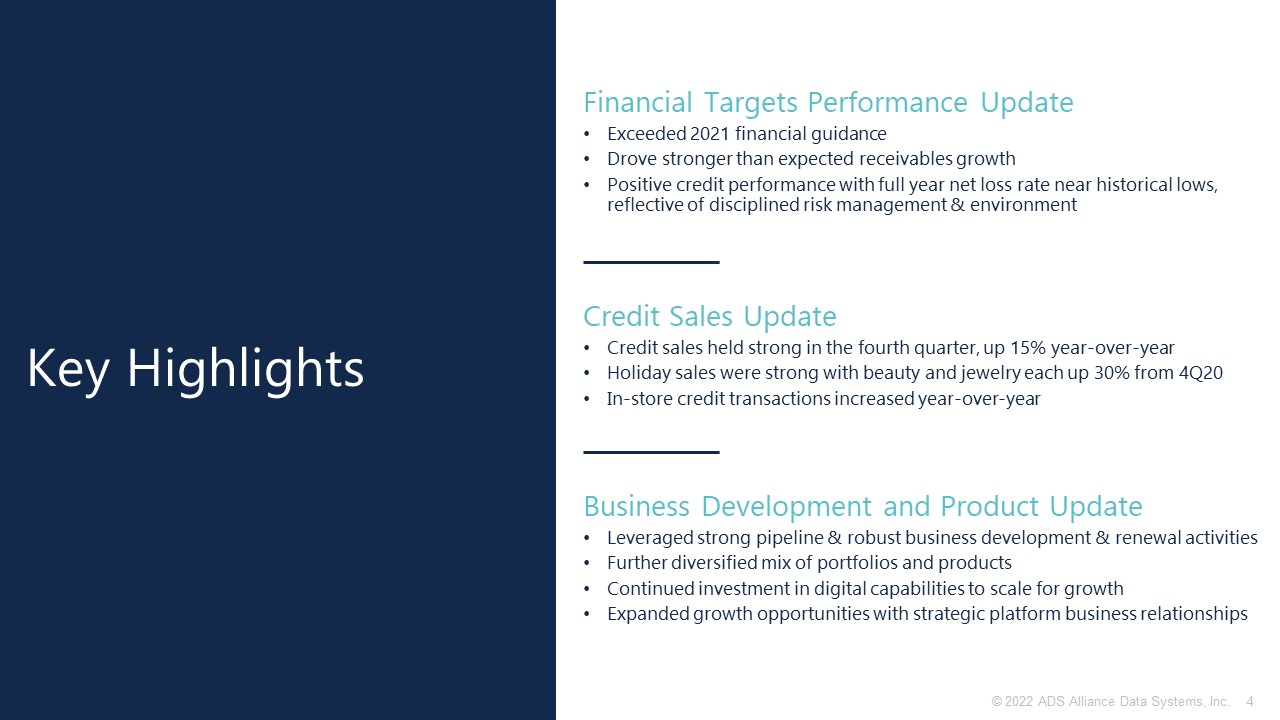
Credit Sales UpdateCredit sales held strong in the fourth quarter, up 15% year-over-yearHoliday sales
were strong with beauty and jewelry each up 30% from 4Q20In-store credit transactions increased year-over-year Business Development and Product UpdateLeveraged strong pipeline & robust business development & renewal activitiesFurther
diversified mix of portfolios and productsContinued investment in digital capabilities to scale for growthExpanded growth opportunities with strategic platform business relationships Key Highlights Financial Targets Performance
UpdateExceeded 2021 financial guidanceDrove stronger than expected receivables growthPositive credit performance with full year net loss rate near historical lows, reflective of disciplined risk management & environment 4 © 2022 ADS
Alliance Data Systems, Inc.
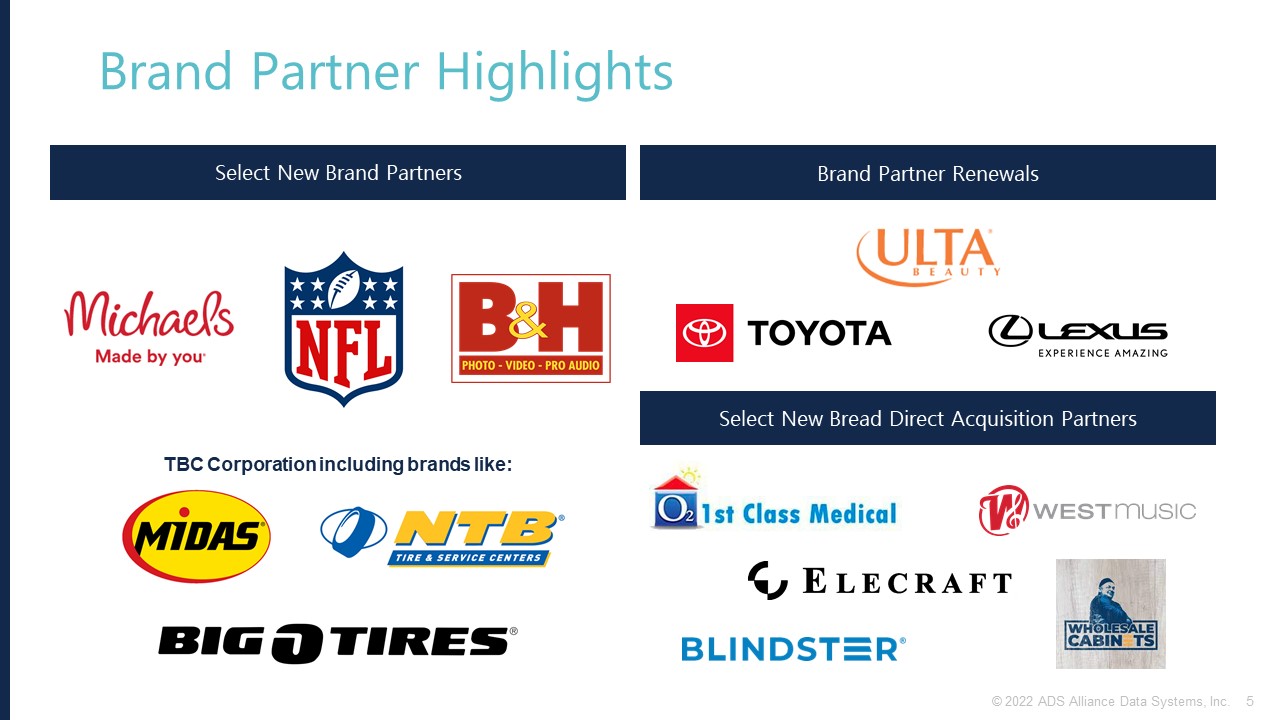
Brand Partner Highlights Select New Brand Partners Brand Partner Renewals Select New Bread
Direct Acquisition Partners TBC Corporation including brands like: 5 © 2022 ADS Alliance Data Systems, Inc.
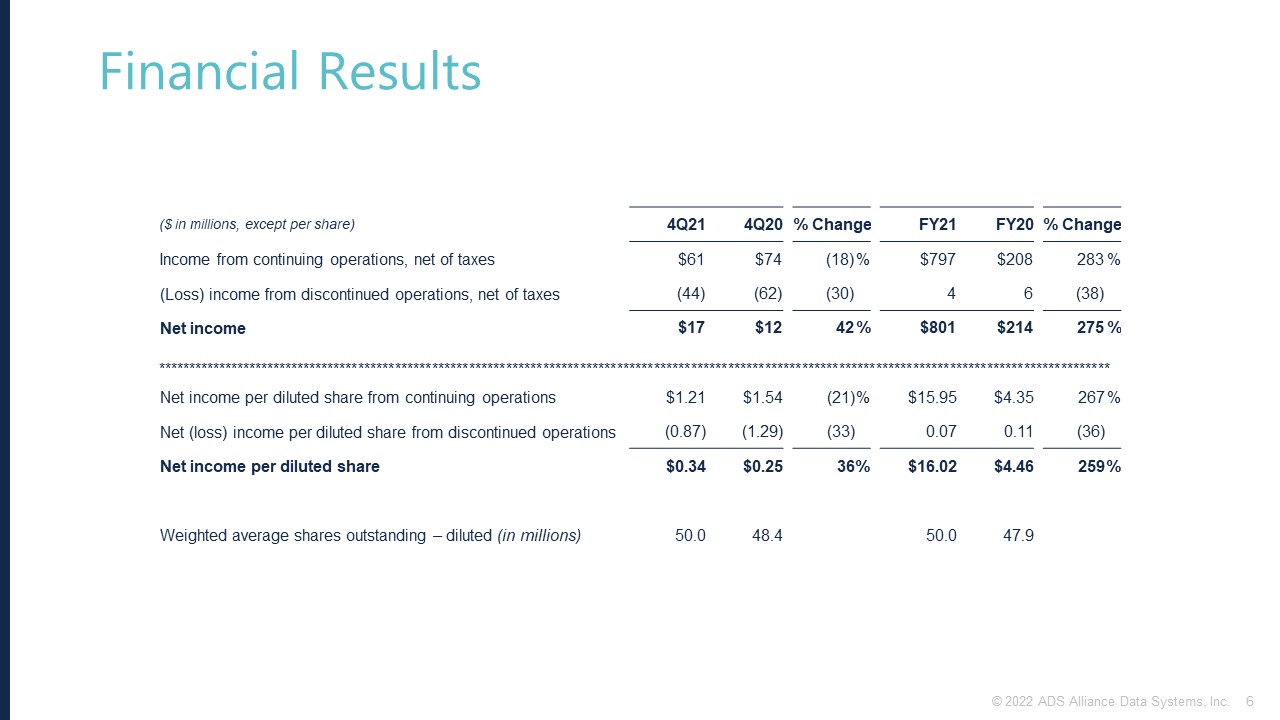
Financial Results ($ in millions, except per share) 4Q21 4Q20 % Change FY21 FY20 %
Change Income from continuing operations, net of taxes $61 $74 (18) % $797 $208 283 % (Loss) income from discontinued operations, net of taxes (44) (62) (30) 4 6 (38) Net
income $17 $12 42 % $801 $214 275 % *********************************************************************************************************************************************************** Net income per
diluted share from continuing operations $1.21 $1.54 (21) % $15.95 $4.35 267 % Net (loss) income per diluted share from discontinued operations (0.87) (1.29) (33) 0.07 0.11 (36) Net income per diluted
share $0.34 $0.25 36 % $16.02 $4.46 259 % Weighted average shares outstanding – diluted (in millions) 50.0 48.4 50.0 47.9 6 © 2022 ADS Alliance Data Systems, Inc.
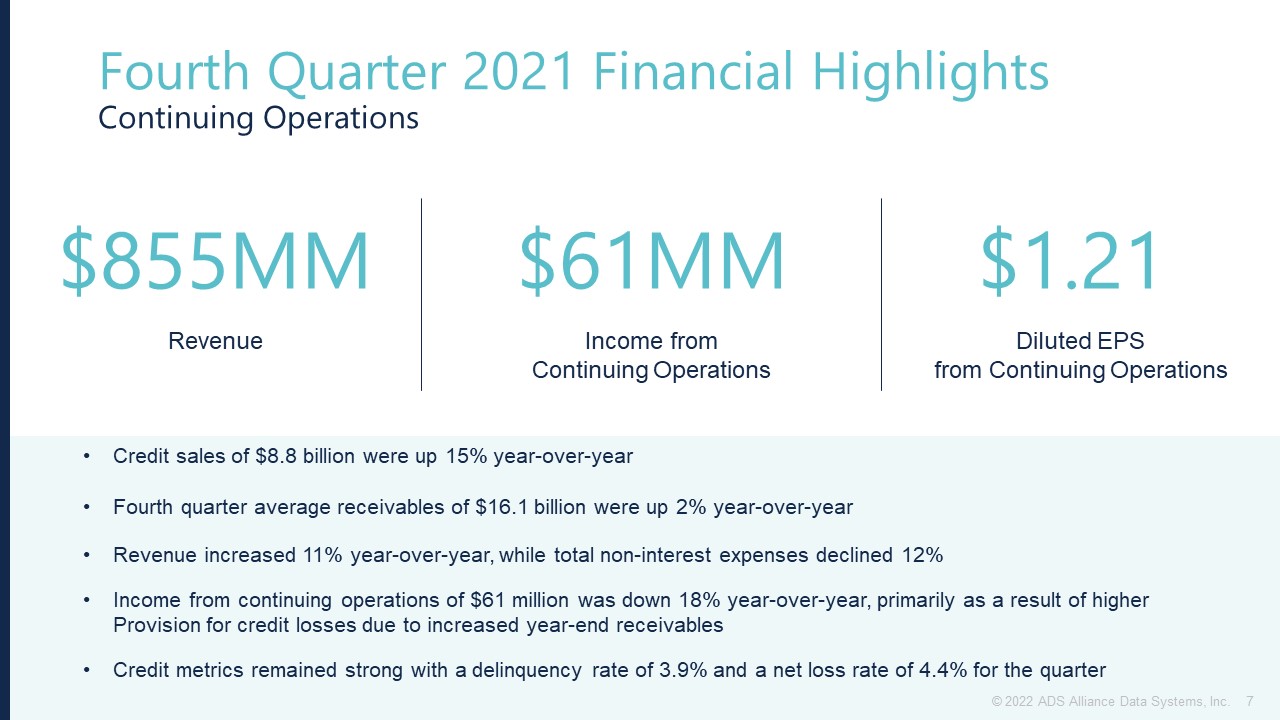
Fourth Quarter 2021 Financial HighlightsContinuing Operations Credit sales of $8.8 billion were up 15%
year-over-yearFourth quarter average receivables of $16.1 billion were up 2% year-over-year Revenue increased 11% year-over-year, while total non-interest expenses declined 12%Income from continuing operations of $61 million was down 18%
year-over-year, primarily as a result of higher Provision for credit losses due to increased year-end receivablesCredit metrics remained strong with a delinquency rate of 3.9% and a net loss rate of 4.4% for the
quarter $855MM Revenue $61MM Income from Continuing Operations $1.21 Diluted EPSfrom Continuing Operations 7 © 2022 ADS Alliance Data Systems, Inc.
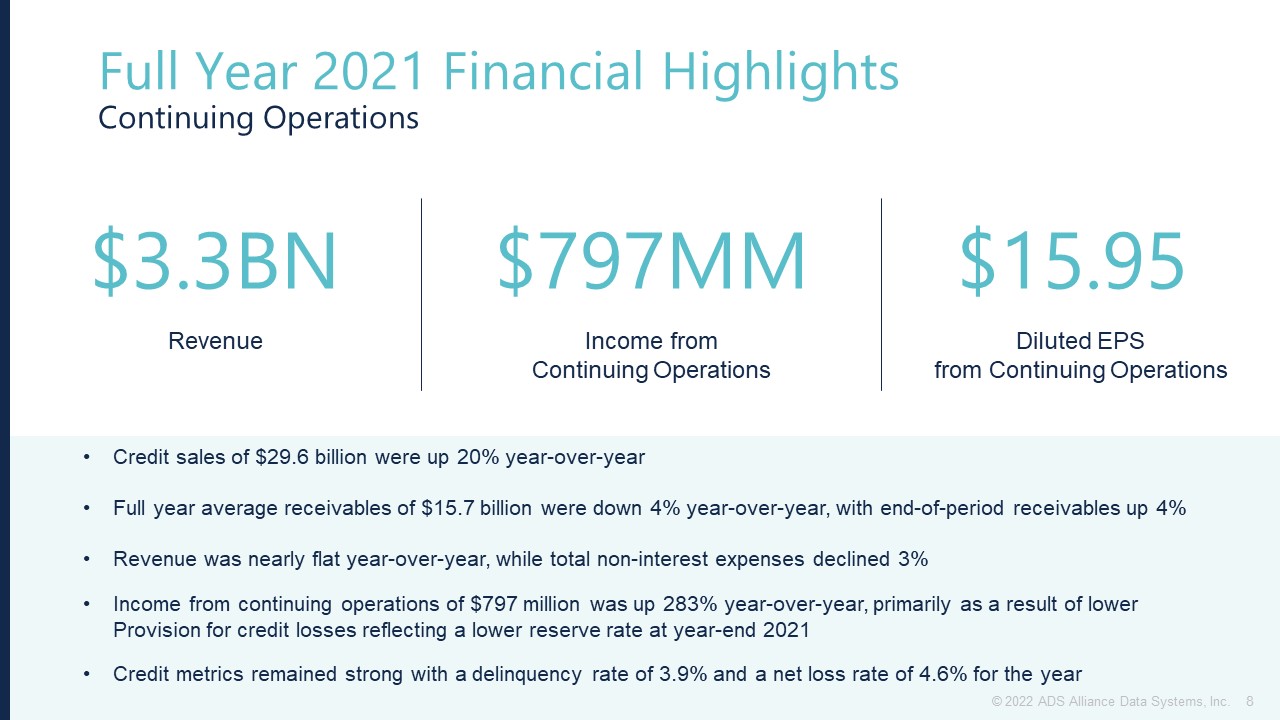
Full Year 2021 Financial HighlightsContinuing Operations Credit sales of $29.6 billion were up 20%
year-over-yearFull year average receivables of $15.7 billion were down 4% year-over-year, with end-of-period receivables up 4%Revenue was nearly flat year-over-year, while total non-interest expenses declined 3%Income from continuing operations
of $797 million was up 283% year-over-year, primarily as a result of lower Provision for credit losses reflecting a lower reserve rate at year-end 2021Credit metrics remained strong with a delinquency rate of 3.9% and a net loss rate of 4.6%
for the year $3.3BN Revenue $797MM Income from Continuing Operations $15.95 Diluted EPSfrom Continuing Operations 8 © 2022 ADS Alliance Data Systems, Inc.
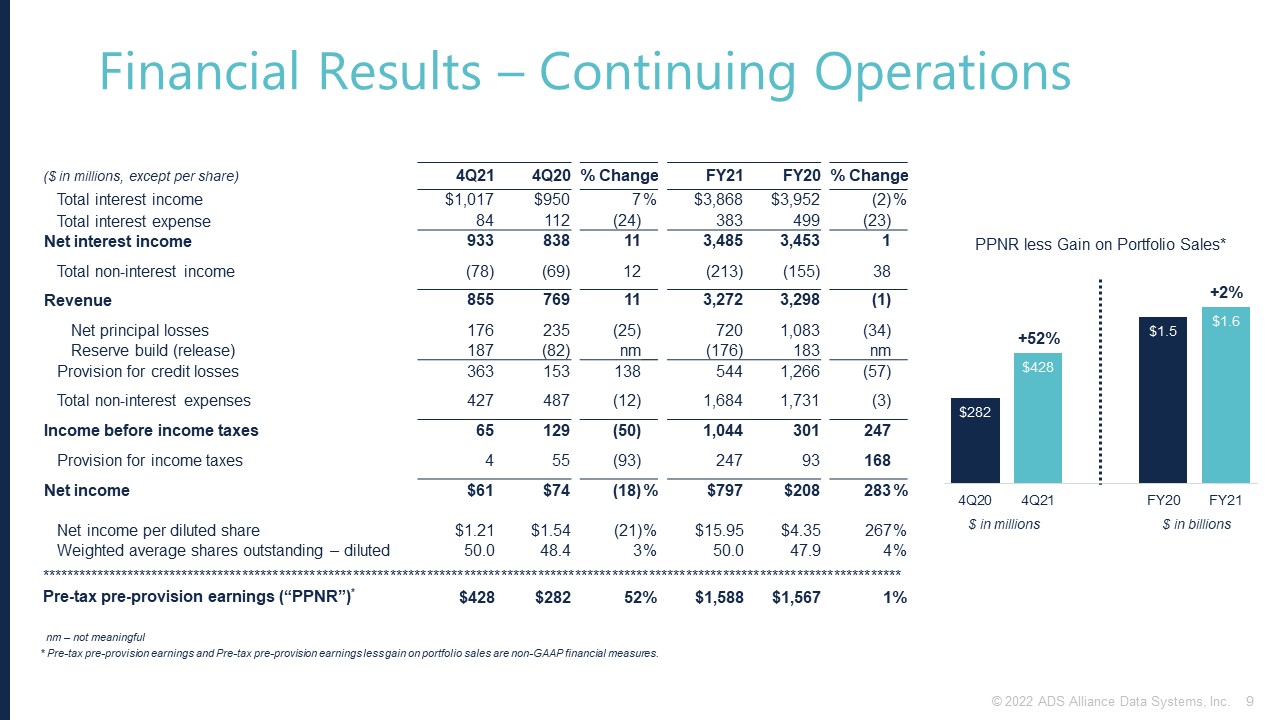
Financial Results – Continuing Operations ($ in millions, except per share) 4Q21 4Q20 %
Change FY21 FY20 % Change Total interest income $1,017 $950 7 % $3,868 $3,952 (2) % Total interest expense 84 112 (24) 383 499 (23) Net interest
income 933 838 11 3,485 3,453 1 Total non-interest
income (78) (69) 12 (213) (155) 38 Revenue 855 769 11 3,272 3,298 (1) Net principal losses 176 235 (25) 720 1,083 (34) Reserve build
(release) 187 (82) nm (176) 183 nm Provision for credit losses 363 153 138 544 1,266 (57) Total non-interest
expenses 427 487 (12) 1,684 1,731 (3) Income before income taxes 65 129 (50) 1,044 301 247 Provision for income
taxes 4 55 (93) 247 93 168 Net income $61 $74 (18) % $797 $208 283 % Net income per diluted share $1.21 $1.54 (21) % $15.95 $4.35 267 % Weighted
average shares outstanding –
diluted 50.0 48.4 3 % 50.0 47.9 4 % ******************************************************************************************************************************************** Pre-tax pre-provision
earnings (“PPNR”)* $428 $282 52 % $1,588 $1,567 1 % $ in millions $ in billions +52% +2% * Pre-tax pre-provision earnings and Pre-tax pre-provision earnings less gain on portfolio sales are non-GAAP financial measures. nm
– not meaningful 9 © 2022 ADS Alliance Data Systems, Inc.
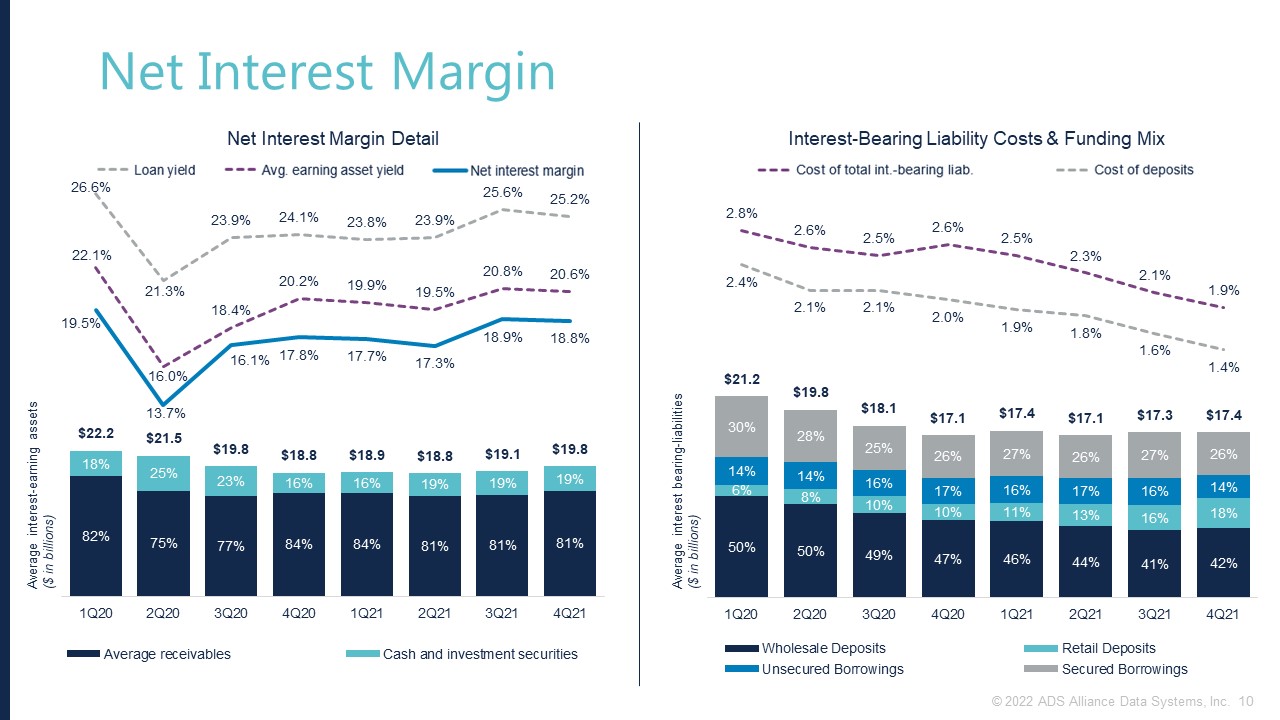
Net Interest Margin Average interest-earning assets($ in billions) Average interest
bearing-liabilities ($ in billions) 10 © 2022 ADS Alliance Data Systems, Inc.
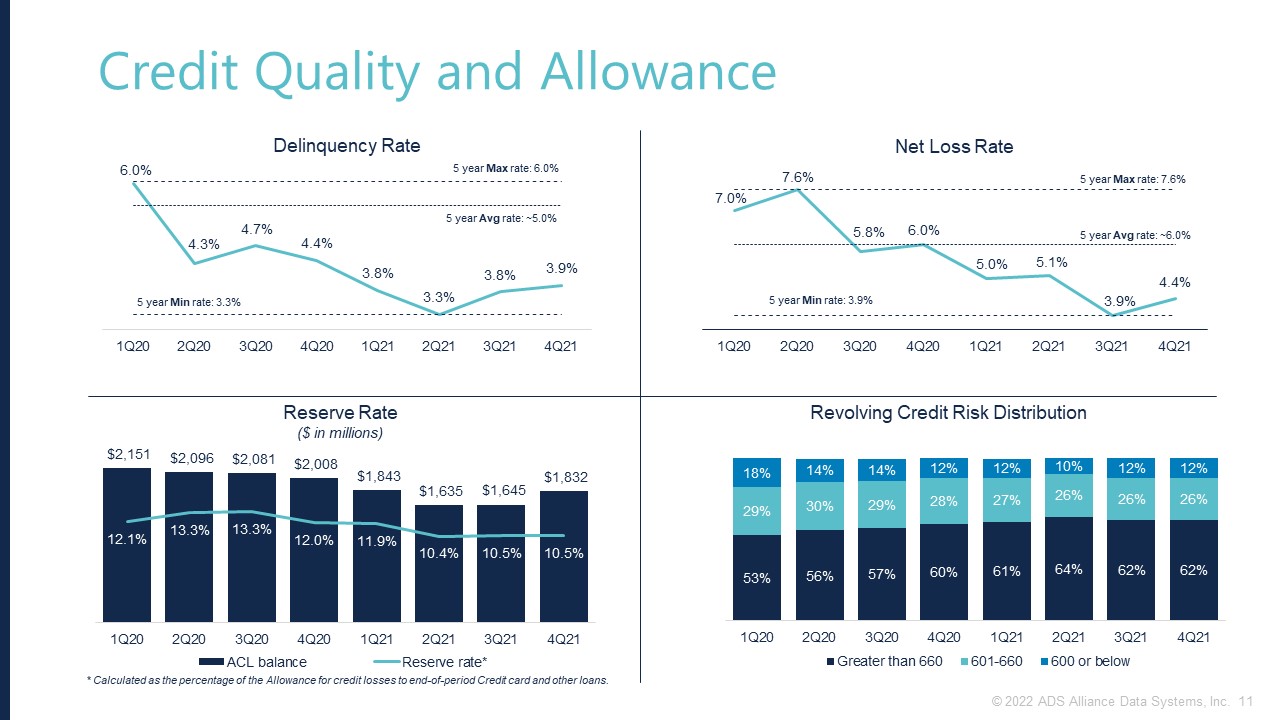
Credit Quality and Allowance Reserve Rate ($ in millions) Net Loss Rate Delinquency Rate 5 year Max
rate: 7.6% 5 year Min rate: 3.9% 5 year Avg rate: ~6.0% * Calculated as the percentage of the Allowance for credit losses to end-of-period Credit card and other loans. Revolving Credit Risk Distribution 5 year Max rate: 6.0% 5 year Avg
rate: ~5.0% 5 year Min rate: 3.3% 11 © 2022 ADS Alliance Data Systems, Inc.
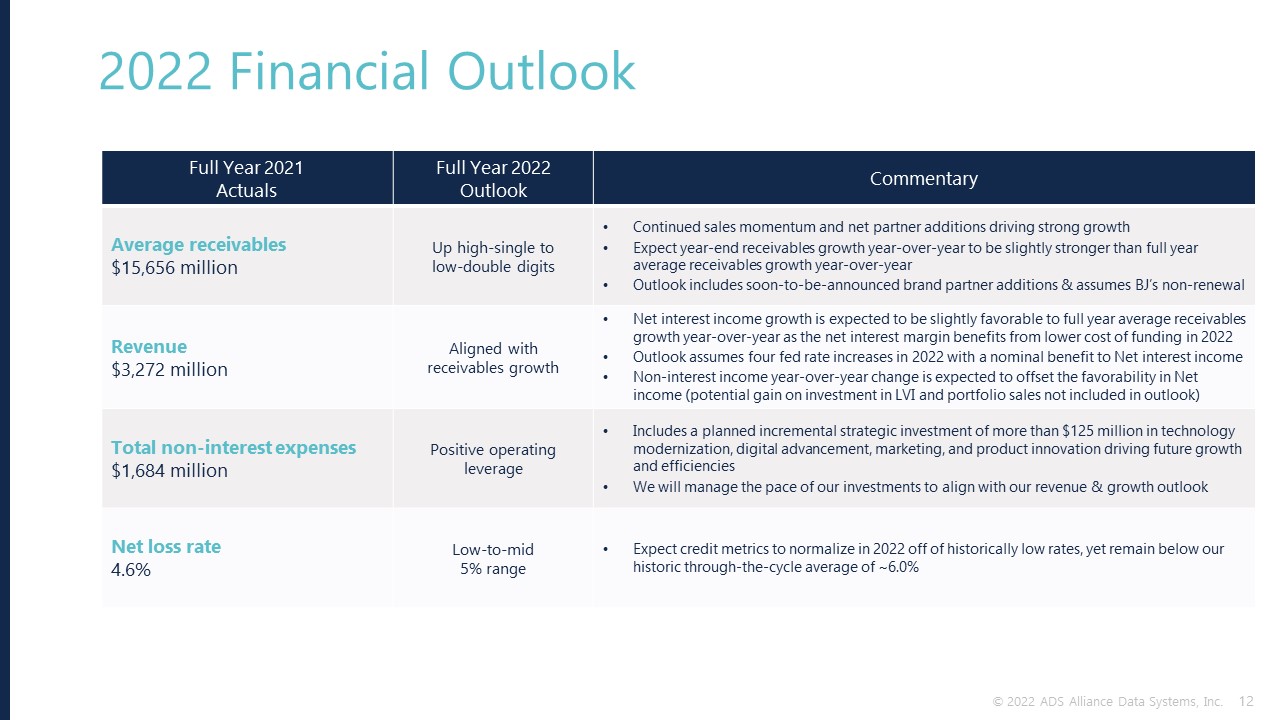
Full Year 2021Actuals Full Year 2022Outlook Commentary Average receivables $15,656 million Up
high-single to low-double digits Continued sales momentum and net partner additions driving strong growthExpect year-end receivables growth year-over-year to be slightly stronger than full year average receivables growth year-over-yearOutlook
includes soon-to-be-announced brand partner additions & assumes BJ’s non-renewal Revenue$3,272 million Aligned with receivables growth Net interest income growth is expected to be slightly favorable to full year average receivables
growth year-over-year as the net interest margin benefits from lower cost of funding in 2022Outlook assumes four fed rate increases in 2022 with a nominal benefit to Net interest incomeNon-interest income year-over-year change is expected to
offset the favorability in Net interest income (potential gain on investment in LVI and portfolio sales not included in outlook) Total non-interest expenses$1,684 million Positive operating leverage Includes a planned incremental strategic
investment of more than $125 million in technology modernization, digital advancement, marketing, and product innovation driving future growth and efficienciesWe will manage the pace of our investments to align with our revenue & growth
outlook Net loss rate4.6% Low-to-mid 5% range Expect credit metrics to normalize in 2022 off of historically low rates, yet remain below our historic through-the-cycle average of ~6.0% 2022 Financial Outlook 12 © 2022 ADS Alliance Data
Systems, Inc.

Appendix © 2022 ADS Alliance Data Systems, Inc.
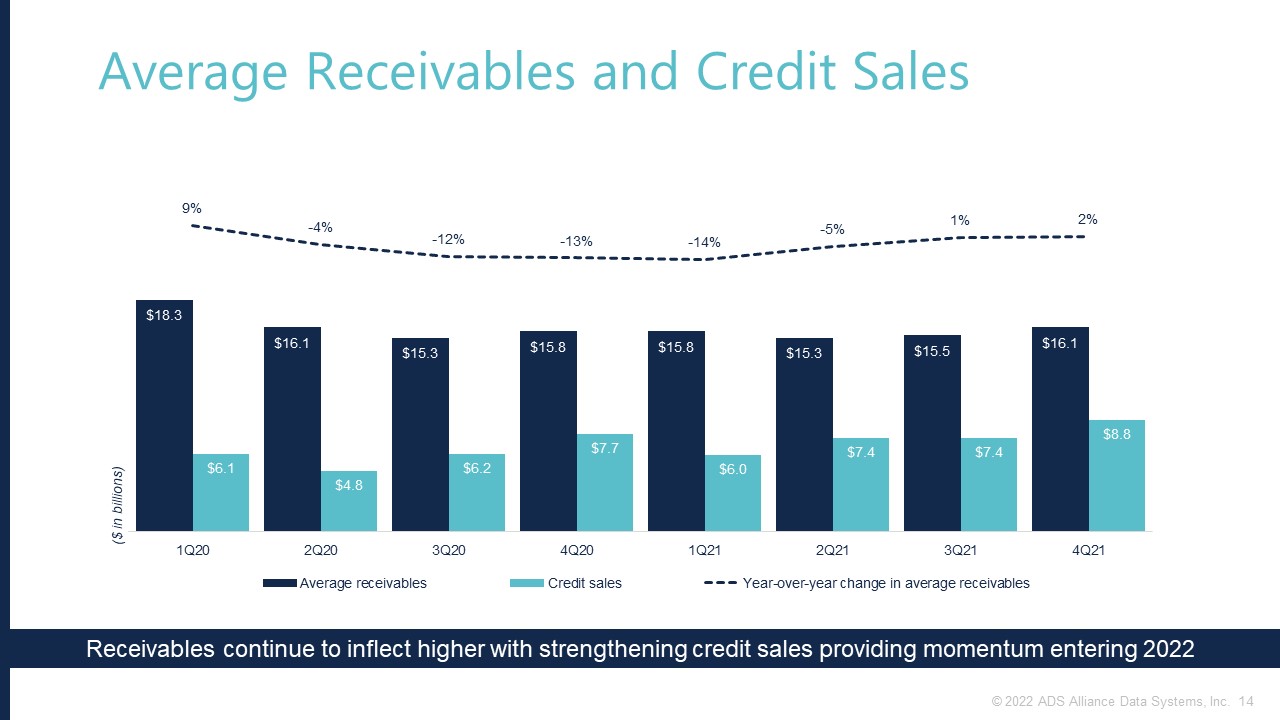
Average Receivables and Credit Sales ($ in billions) Receivables continue to inflect higher with
strengthening credit sales providing momentum entering 2022 14 © 2022 ADS Alliance Data Systems, Inc.
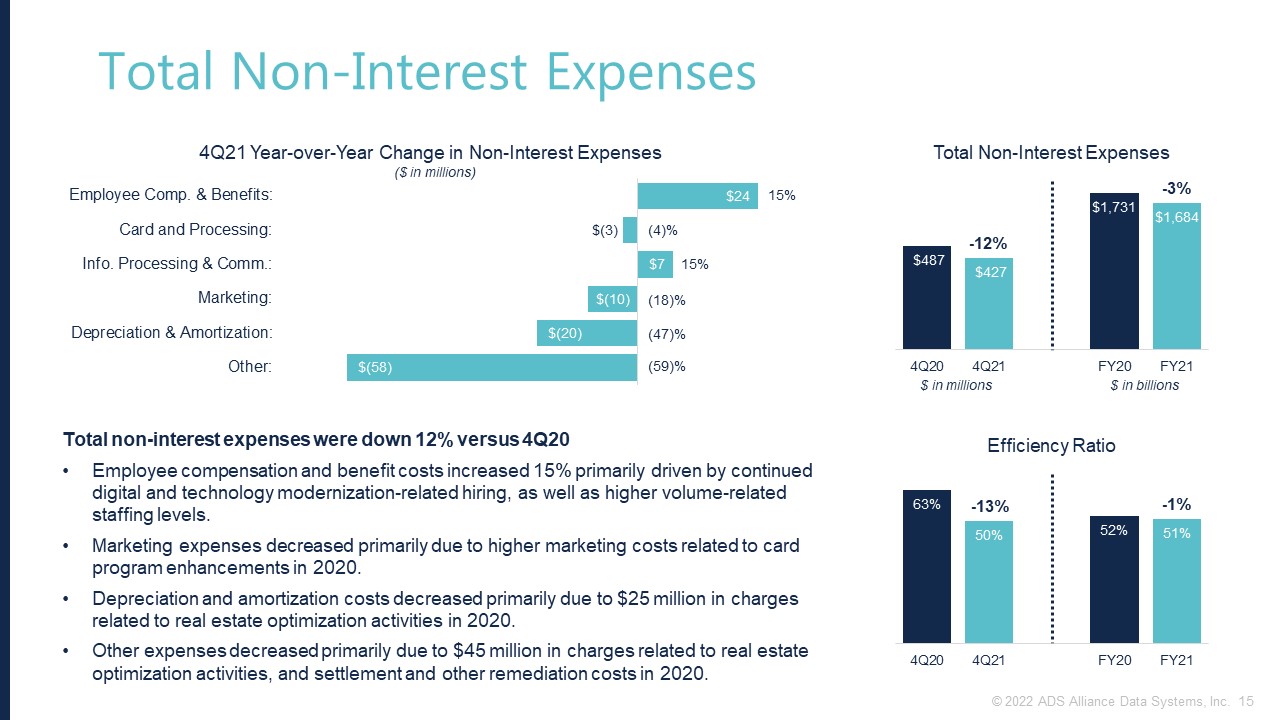
Total Non-Interest Expenses $ in millions $ in billions -12% -3% Total non-interest expenses were
down 12% versus 4Q20Employee compensation and benefit costs increased 15% primarily driven by continued digital and technology modernization-related hiring, as well as higher volume-related staffing levels.Marketing expenses decreased primarily
due to higher marketing costs related to card program enhancements in 2020.Depreciation and amortization costs decreased primarily due to $25 million in charges related to real estate optimization activities in 2020.Other expenses decreased
primarily due to $45 million in charges related to real estate optimization activities, and settlement and other remediation costs in 2020. -13% -1% ($ in millions) (4)% 15% 15% (18)% (47)% (59)% 15 © 2022 ADS Alliance Data
Systems, Inc.
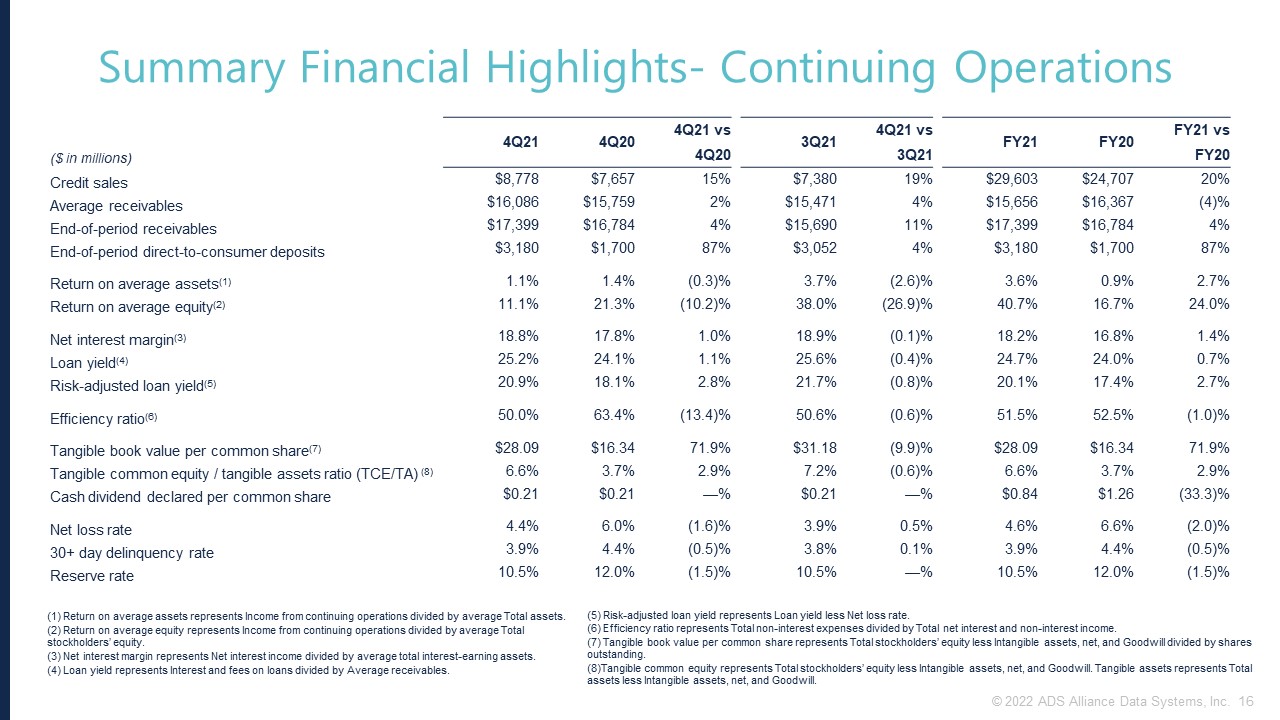
($ in millions) 4Q21 4Q20 4Q21 vs 3Q21 4Q21 vs FY21 FY20 FY21
vs 4Q20 3Q21 FY20 Credit sales $8,778 $7,657 15% $7,380 19% $29,603 $24,707 20% Average receivables $16,086 $15,759 2% $15,471 4% $15,656 $16,367 (4)% End-of-period
receivables $17,399 $16,784 4% $15,690 11% $17,399 $16,784 4% End-of-period direct-to-consumer deposits $3,180 $1,700 87% $3,052 4% $3,180 $1,700 87% Return on average
assets(1) 1.1% 1.4% (0.3)% 3.7% (2.6)% 3.6% 0.9% 2.7% Return on average equity(2) 11.1% 21.3% (10.2)% 38.0% (26.9)% 40.7% 16.7% 24.0% Net interest
margin(3) 18.8% 17.8% 1.0% 18.9% (0.1)% 18.2% 16.8% 1.4% Loan yield(4) 25.2% 24.1% 1.1% 25.6% (0.4)% 24.7% 24.0% 0.7% Risk-adjusted loan
yield(5) 20.9% 18.1% 2.8% 21.7% (0.8)% 20.1% 17.4% 2.7% Efficiency ratio(6) 50.0% 63.4% (13.4)% 50.6% (0.6)% 51.5% 52.5% (1.0)% Tangible book value per common
share(7) $28.09 $16.34 71.9% $31.18 (9.9)% $28.09 $16.34 71.9% Tangible common equity / tangible assets ratio (TCE/TA) (8) 6.6% 3.7% 2.9% 7.2% (0.6)% 6.6% 3.7% 2.9% Cash dividend declared per common
share $0.21 $0.21 —% $0.21 —% $0.84 $1.26 (33.3)% Net loss rate 4.4% 6.0% (1.6)% 3.9% 0.5% 4.6% 6.6% (2.0)% 30+ day delinquency
rate 3.9% 4.4% (0.5)% 3.8% 0.1% 3.9% 4.4% (0.5)% Reserve rate 10.5% 12.0% (1.5)% 10.5% —% 10.5% 12.0% (1.5)% (1) Return on average assets represents Income from continuing operations divided by average Total
assets. (2) Return on average equity represents Income from continuing operations divided by average Total stockholders’ equity. (3) Net interest margin represents Net interest income divided by average total interest-earning assets. (4)
Loan yield represents Interest and fees on loans divided by Average receivables. (5) Risk-adjusted loan yield represents Loan yield less Net loss rate. (6) Efficiency ratio represents Total non-interest expenses divided by Total net interest
and non-interest income. (7) Tangible book value per common share represents Total stockholders’ equity less Intangible assets, net, and Goodwill divided by shares outstanding. (8)Tangible common equity represents Total stockholders’ equity
less Intangible assets, net, and Goodwill. Tangible assets represents Total assets less Intangible assets, net, and Goodwill. 16 © 2022 ADS Alliance Data Systems, Inc. Summary Financial Highlights- Continuing Operations
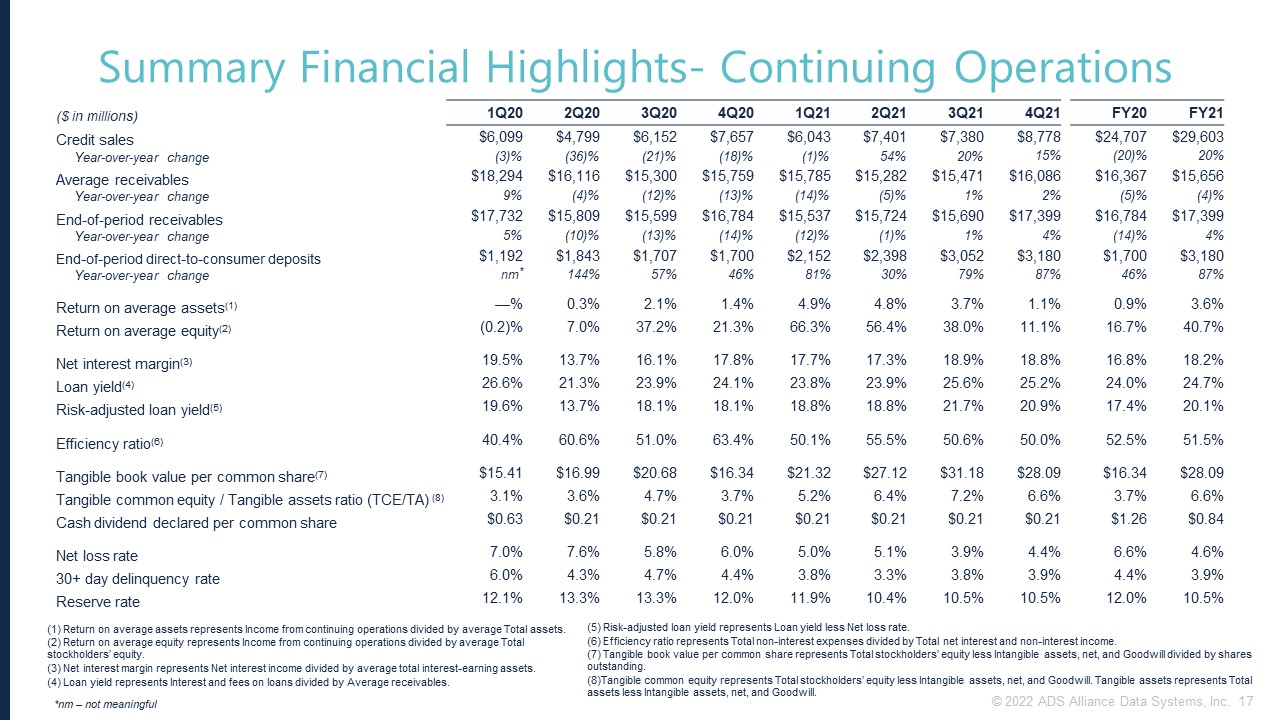
($ in millions) 1Q20 2Q20 3Q20 4Q20 1Q21 2Q21 3Q21 4Q21 FY20 FY21 Credit
sales $6,099 $4,799 $6,152 $7,657 $6,043 $7,401 $7,380 $8,778 $24,707 $29,603 Year-over-year change (3)% (36)% (21)% (18)% (1)% 54% 20% 15% (20)% 20% Average
receivables $18,294 $16,116 $15,300 $15,759 $15,785 $15,282 $15,471 $16,086 $16,367 $15,656 Year-over-year change 9% (4)% (12)% (13)% (14)% (5)% 1% 2% (5)% (4)% End-of-period
receivables $17,732 $15,809 $15,599 $16,784 $15,537 $15,724 $15,690 $17,399 $16,784 $17,399 Year-over-year change 5% (10)% (13)% (14)% (12)% (1)% 1% 4% (14)% 4% End-of-period direct-to-consumer
deposits $1,192 $1,843 $1,707 $1,700 $2,152 $2,398 $3,052 $3,180 $1,700 $3,180 Year-over-year change nm* 144% 57% 46% 81% 30% 79% 87% 46% 87% Return on average
assets(1) —% 0.3% 2.1% 1.4% 4.9% 4.8% 3.7% 1.1% 0.9% 3.6% Return on average equity(2) (0.2)% 7.0% 37.2% 21.3% 66.3% 56.4% 38.0% 11.1% 16.7% 40.7% Net interest
margin(3) 19.5% 13.7% 16.1% 17.8% 17.7% 17.3% 18.9% 18.8% 16.8% 18.2% Loan yield(4) 26.6% 21.3% 23.9% 24.1% 23.8% 23.9% 25.6% 25.2% 24.0% 24.7% Risk-adjusted loan
yield(5) 19.6% 13.7% 18.1% 18.1% 18.8% 18.8% 21.7% 20.9% 17.4% 20.1% Efficiency ratio(6) 40.4% 60.6% 51.0% 63.4% 50.1% 55.5% 50.6% 50.0% 52.5% 51.5% Tangible book value
per common share(7) $15.41 $16.99 $20.68 $16.34 $21.32 $27.12 $31.18 $28.09 $16.34 $28.09 Tangible common equity / Tangible assets ratio (TCE/TA) (8) 3.1% 3.6% 4.7% 3.7% 5.2% 6.4% 7.2% 6.6% 3.7% 6.6% Cash dividend
declared per common share $0.63 $0.21 $0.21 $0.21 $0.21 $0.21 $0.21 $0.21 $1.26 $0.84 Net loss rate 7.0% 7.6% 5.8% 6.0% 5.0% 5.1% 3.9% 4.4% 6.6% 4.6% 30+ day delinquency
rate 6.0% 4.3% 4.7% 4.4% 3.8% 3.3% 3.8% 3.9% 4.4% 3.9% Reserve rate 12.1% 13.3% 13.3% 12.0% 11.9% 10.4% 10.5% 10.5% 12.0% 10.5% *nm – not meaningful (1) Return on average assets represents Income from continuing
operations divided by average Total assets. (2) Return on average equity represents Income from continuing operations divided by average Total stockholders’ equity. (3) Net interest margin represents Net interest income divided by average
total interest-earning assets. (4) Loan yield represents Interest and fees on loans divided by Average receivables. (5) Risk-adjusted loan yield represents Loan yield less Net loss rate. (6) Efficiency ratio represents Total non-interest
expenses divided by Total net interest and non-interest income. (7) Tangible book value per common share represents Total stockholders’ equity less Intangible assets, net, and Goodwill divided by shares outstanding. (8)Tangible common equity
represents Total stockholders’ equity less Intangible assets, net, and Goodwill. Tangible assets represents Total assets less Intangible assets, net, and Goodwill. 17 © 2022 ADS Alliance Data Systems, Inc. Summary Financial Highlights-
Continuing Operations

($ in millions, except per share) 1Q20 2Q20 3Q20 4Q20 1Q21 2Q21 3Q21 4Q21 FY20 FY21 Total
interest income $1,227 $860 $915 $950 $942 $915 $994 $1,017 $3,952 $3,868 Total interest expense 146 127 114 112 107 100 92 84 499 383 Net interest
income 1,081 733 801 838 835 815 902 933 3,453 3,485 Total non-interest
income (11) (28) (47) (69) (33) (51) (51) (78) (155) (213) Revenue 1,070 705 754 769 802 764 851 855 3,298 3,272 Net principal losses 320 305 223 235 198
194 152 176 1,083 720 Reserve build (release) 336 (55) (16) (82) (164) (208) 9 187 183 (176) Provision for credit
losses 656 250 207 153 34 (14) 161 363 1,266 544 Total non-interest expenses 432 427 385 487 402 424 431 427 1,731 1,684 (Loss) income before income
taxes (18) 28 162 129 366 354 259 65 301 1,044 (Benefit) provision for income taxes (17) 8 47 55 99 91 53 4 93 247 Net (loss)
income $(1) $20 $115 $74 $267 $263 $206 $61 $208 $797 Net (loss) income per diluted share $(0.01) $0.41 $2.41 $1.54 $5.38 $5.25 $4.11 $1.21 $4.35 $15.95 Weighted average shares outstanding –
diluted
47.7 47.7 47.8 48.4 49.8 50.0 50.0 50.0 47.9 50.0 *************************************************************************************************************************************************************************************** Reconciliation
of GAAP to Non-GAAP Financial Measures: (Loss) income before income taxes $(18) $28 $162 $129 $366 $354 $259 $65 $301 $1,044 Provision for credit
losses 656 250 207 153 34 (14) 161 363 1,266 544 Pre-tax pre-provision earnings (“PPNR”)* $638 $278 $369 $282 $400 $340 $420 $428 $1,567 $1,588 Gain on portfolio sales 20 — — — — — 10 — 20 10 PPNR less
gain on portfolio sales* $618 $278 $369 $282 $400 $340 $410 $428 $1,547 $1,578 * Pre-tax pre-provision earnings and Pre-tax pre-provision earnings less gain on portfolio sales are non-GAAP financial measures. 18 © 2022 ADS
Alliance Data Systems, Inc. Financial Results – Continuing Operations
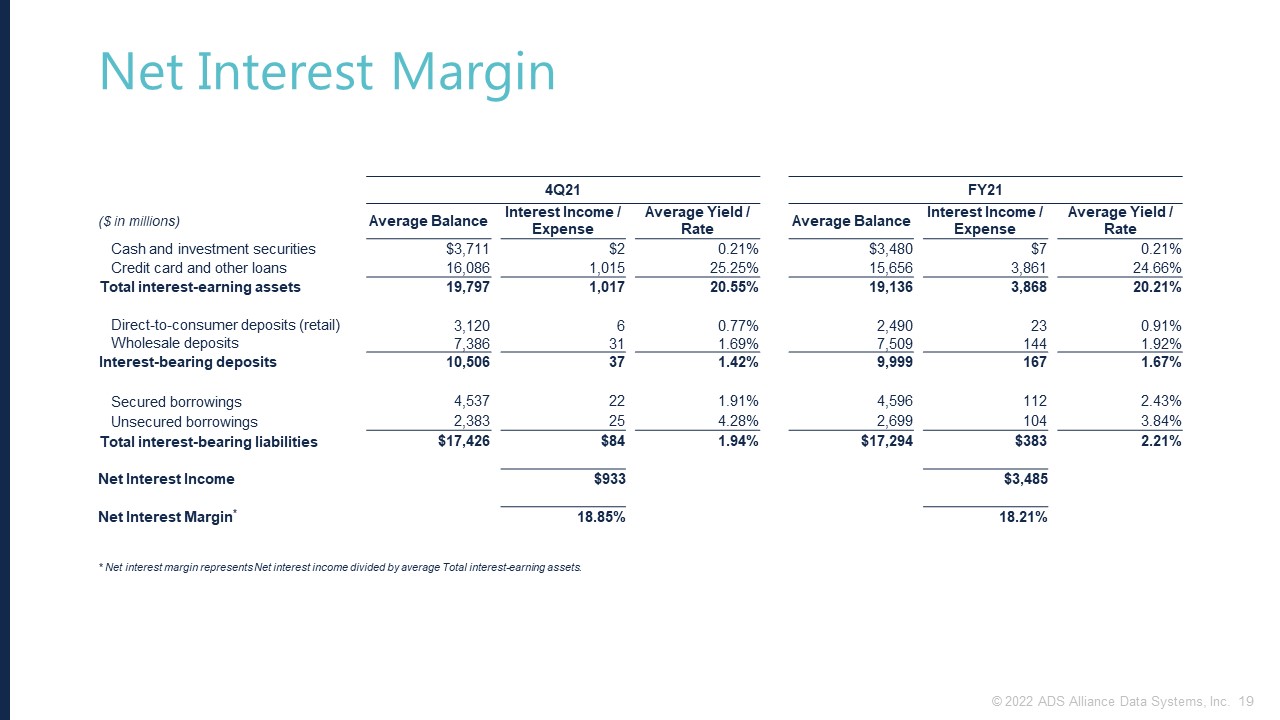
Net Interest Margin 4Q21 FY21 ($ in millions) Average Balance Interest
Income / Expense Average Yield / Rate Average Balance Interest Income / Expense Average Yield / Rate Cash and investment securities $3,711 $2 0.21% $3,480 $7 0.21% Credit card and other
loans 16,086 1,015 25.25% 15,656 3,861 24.66% Total interest-earning assets 19,797 1,017 20.55% 19,136 3,868 20.21% Direct-to-consumer deposits
(retail) 3,120 6 0.77% 2,490 23 0.91% Wholesale deposits 7,386 31 1.69% 7,509 144 1.92% Interest-bearing deposits 10,506 37 1.42% 9,999 167 1.67% Secured
borrowings 4,537 22 1.91% 4,596 112 2.43% Unsecured borrowings 2,383 25 4.28% 2,699 104 3.84% Total interest-bearing
liabilities $17,426 $84 1.94% $17,294 $383 2.21% Net Interest Income $933 $3,485 Net Interest Margin* 18.85% 18.21% * Net interest margin
represents Net interest income divided by average Total interest-earning assets. 19 © 2022 ADS Alliance Data Systems, Inc.
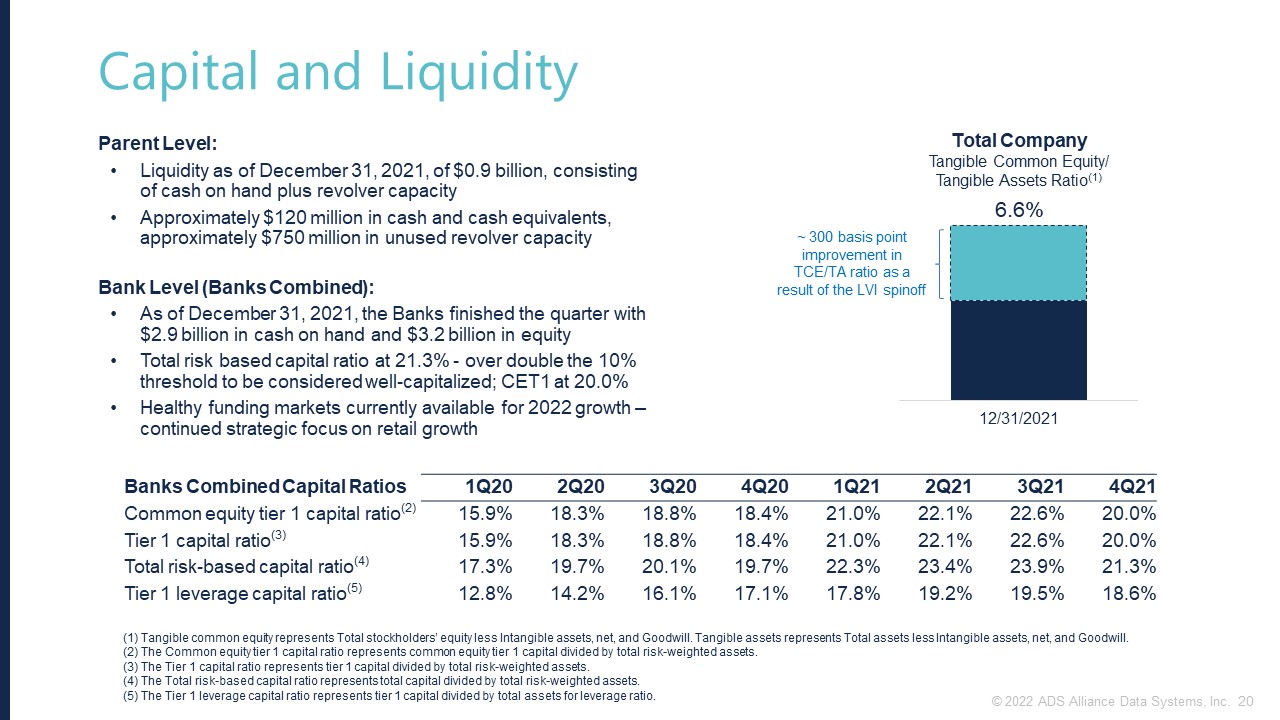
Capital and Liquidity Banks Combined Capital
Ratios 1Q20 2Q20 3Q20 4Q20 1Q21 2Q21 3Q21 4Q21 Common equity tier 1 capital ratio(2) 15.9% 18.3% 18.8% 18.4% 21.0% 22.1% 22.6% 20.0% Tier 1 capital ratio(3) 15.9% 18.3% 18.8% 18.4% 21.0% 22.1% 22.6% 20.0% Total
risk-based capital ratio(4) 17.3% 19.7% 20.1% 19.7% 22.3% 23.4% 23.9% 21.3% Tier 1 leverage capital ratio(5) 12.8% 14.2% 16.1% 17.1% 17.8% 19.2% 19.5% 18.6% Total Company Tangible Common Equity/Tangible Assets
Ratio(1) 6.6% ~ 300 basis point improvement in TCE/TA ratio as a result of the LVI spinoff Parent Level:Liquidity as of December 31, 2021, of $0.9 billion, consisting of cash on hand plus revolver capacity Approximately $120 million in
cash and cash equivalents, approximately $750 million in unused revolver capacityBank Level (Banks Combined):As of December 31, 2021, the Banks finished the quarter with $2.9 billion in cash on hand and $3.2 billion in equityTotal risk based
capital ratio at 21.3% - over double the 10% threshold to be considered well-capitalized; CET1 at 20.0%Healthy funding markets currently available for 2022 growth – continued strategic focus on retail growth (1) Tangible common equity
represents Total stockholders’ equity less Intangible assets, net, and Goodwill. Tangible assets represents Total assets less Intangible assets, net, and Goodwill.(2) The Common equity tier 1 capital ratio represents common equity tier 1
capital divided by total risk-weighted assets.(3) The Tier 1 capital ratio represents tier 1 capital divided by total risk-weighted assets.(4) The Total risk-based capital ratio represents total capital divided by total risk-weighted assets.
(5) The Tier 1 leverage capital ratio represents tier 1 capital divided by total assets for leverage ratio. 20 © 2022 ADS Alliance Data Systems, Inc.
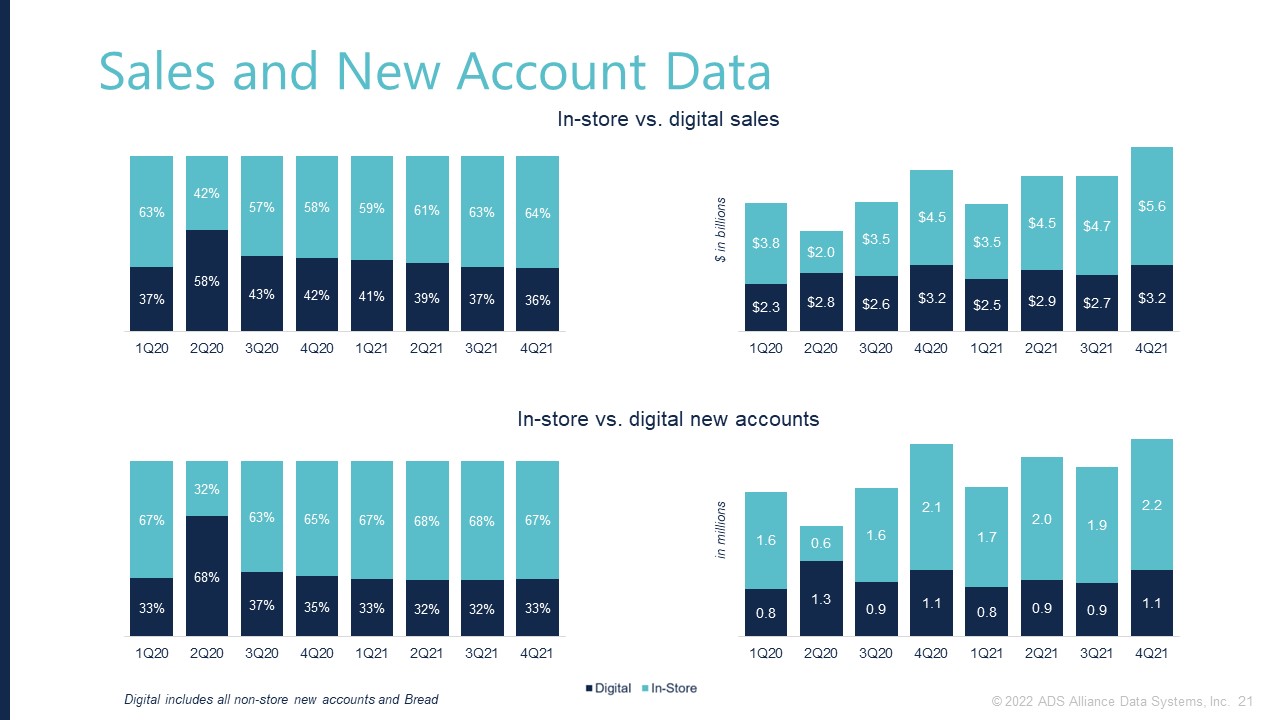
Sales and New Account Data In-store vs. digital sales Digital includes all non-store new accounts and
Bread $ in billions In-store vs. digital new accounts in millions 21 © 2022 ADS Alliance Data Systems, Inc.
Serious News for Serious Traders! Try StreetInsider.com Premium Free!
You May Also Be Interested In
- Company announcement no 7/2024 Annual account 2023
- RESULT OF RIKSBANK AUCTIONS GOVERNMENT BONDS
- Burning Rock Announces ADS Ratio Change
Create E-mail Alert Related Categories
SEC FilingsSign up for StreetInsider Free!
Receive full access to all new and archived articles, unlimited portfolio tracking, e-mail alerts, custom newswires and RSS feeds - and more!
