

Form 6-K PAN AMERICAN SILVER CORP For: Mar 31
 Tweet
Tweet Share
ShareUNITED STATES
SECURITIES AND EXCHANGE COMMISSION
Washington, D.C. 20549
__________________
FORM 6-K
_____________________
REPORT OF FOREIGN PRIVATE ISSUER
PURSUANT TO RULE 13a-16 OR 15d-16
UNDER THE SECURITIES EXCHANGE ACT of 1934
May 11, 2022
_____________________
Pan American Silver Corp.
(Exact name of registrant as specified in its charter)
1500-625 HOWE STREET
VANCOUVER BC CANADA V6C 2T6
(Address of principal executive offices)
000-13727
(Commission File Number)
_____________________
Indicate by check mark whether the registrant files or will file annual reports under cover Form 20-F or Form 40-F.
| Form 20-F | Form 40-F | X | |||||||||||||||
Indicate by check mark if the registrant is submitting the Form 6-K in paper as permitted by Regulation S-T Rule 101(b)(1). _____
Indicate by check mark if the registrant is submitting the Form 6-K in paper as permitted by Regulation S-T Rule 101(b)(7): _____
EXHIBIT LIST
| Exhibit | Description | |||||||
| 99.1 | ||||||||
| 99.2 | ||||||||
| 99.3 | ||||||||
| 99.4 | ||||||||
| 99.5 | ||||||||
Exhibits 99.1 and 99.2 of this report on Form 6-K is incorporated by reference into the Registrant’s registration statements on Form S-8 (Nos. 333-180494, 333-180495, 333-206162 and 333-229795) that have been filed with the Securities and Exchange Commission.
Signatures
Pursuant to the requirements of the Securities Exchange Act of 1934, the registrant has duly caused this report to be signed on its behalf by the undersigned, thereunto duly authorized.
| Pan American Silver Corp. | ||||||||
| (Registrant) | ||||||||
| Date: May 11, 2022 | By: | /s/ "Delaney Fisher" | ||||||
| Delaney Fisher | ||||||||
| Senior Vice President, Associate General Counsel and Corporate Secretary | ||||||||

Unaudited Condensed Interim Consolidated Financial Statements and Notes
FOR THE THREE MONTHS ENDING MARCH 31, 2022
| Condensed Interim Consolidated Statements of Financial Position (unaudited, in thousands of U.S. dollars) | ||||
| March 31, | December 31, | |||||||
| 2022 | 2021 | |||||||
| Assets | ||||||||
| Current assets | ||||||||
| Cash and cash equivalents (Note 21) | $ | 271,876 | $ | 283,550 | ||||
| Short-term investments (Note 5) | 54,410 | 51,723 | ||||||
| Trade and other receivables | 139,513 | 128,150 | ||||||
| Income tax receivables | 22,281 | 20,282 | ||||||
| Inventories (Note 6) | 472,959 | 500,462 | ||||||
| Derivative assets (Note 4a) | 7,143 | 3,995 | ||||||
| Prepaid expenses and other current assets | 14,441 | 13,007 | ||||||
| 982,623 | 1,001,169 | |||||||
| Non-current assets | ||||||||
| Mineral properties, plant and equipment (Note 7) | 2,330,156 | 2,344,551 | ||||||
| Long-term inventories (Note 6) | 26,457 | 25,644 | ||||||
| Long-term tax receivables | 9,044 | 8,711 | ||||||
| Deferred tax assets | 61,992 | 55,953 | ||||||
| Long-term investment and associate (Note 8) | 124,677 | 77,410 | ||||||
| Goodwill & other assets (Note 9) | 5,348 | 5,146 | ||||||
| Total assets | $ | 3,540,297 | $ | 3,518,584 | ||||
| Liabilities | ||||||||
| Current liabilities | ||||||||
| Accounts payable and accrued liabilities (Note 10) | $ | 299,593 | $ | 306,087 | ||||
| Derivative liabilities (Note 4a) | 1,115 | 351 | ||||||
| Provisions (Note 11) | 12,508 | 8,041 | ||||||
| Lease obligations (Note 12) | 11,974 | 10,663 | ||||||
| Debt (Note 13) | 3,400 | 3,400 | ||||||
| Income tax payables | 33,370 | 59,133 | ||||||
| 361,960 | 387,675 | |||||||
| Non-current liabilities | ||||||||
| Long-term provisions (Note 11) | 246,250 | 240,111 | ||||||
| Deferred tax liabilities | 171,433 | 184,785 | ||||||
| Long-term lease obligations (Note 12) | 20,622 | 19,898 | ||||||
| Long-term debt (Note 13) | 11,050 | 11,900 | ||||||
| Deferred revenue (Note 14) | 14,951 | 12,516 | ||||||
| Other long-term liabilities (Note 15) | 26,062 | 25,691 | ||||||
| Total liabilities | 852,328 | 882,576 | ||||||
| Equity (Note 16) | ||||||||
| Issued capital | 3,136,626 | 3,136,214 | ||||||
| Reserves | 93,348 | 93,375 | ||||||
| Deficit | (546,773) | (598,035) | ||||||
| Total equity attributable to Company shareholders | 2,683,201 | 2,631,554 | ||||||
| Non-controlling interests | 4,768 | 4,454 | ||||||
| Total equity | 2,687,969 | 2,636,008 | ||||||
| Total liabilities and equity | $ | 3,540,297 | $ | 3,518,584 | ||||
Contingencies (Note 24)
See accompanying notes to the condensed interim consolidated financial statements
APPROVED BY THE BOARD ON MAY 11, 2022
| "signed" | Gillian Winckler, Director | "signed" | Michael Steinmann, Director | ||||||||||||||
| PAN AMERICAN SILVER CORP. | 1 | |||||||
| Condensed Interim Consolidated Statements of Earnings and Comprehensive Earnings (unaudited, in thousands of U.S. dollars) | ||||
| Three months ended March 31, | ||||||||
| 2022 | 2021 | |||||||
| Revenue (Note 22) | $ | 439,888 | $ | 368,099 | ||||
| Cost of sales (Note 22) | ||||||||
| Production costs (Note 17) | (278,828) | (193,180) | ||||||
| Depreciation and amortization | (84,526) | (75,093) | ||||||
| Royalties | (9,779) | (9,862) | ||||||
| (373,133) | (278,135) | |||||||
| Mine operating earnings (Note 22) | 66,755 | 89,964 | ||||||
| General and administrative | (10,893) | (8,052) | ||||||
| Exploration and project development | (2,799) | (2,480) | ||||||
| Mine care and maintenance (Note 18) | (9,668) | (7,266) | ||||||
| Foreign exchange losses | (3,054) | (2,409) | ||||||
| Gains on derivatives (Note 4c) | 4,362 | 2,370 | ||||||
| (Losses) gains on sale of mineral properties, plant and equipment | (177) | 110 | ||||||
| Gains and income from associates (Note 8) | 45,033 | 198 | ||||||
| Other income | 1,081 | 854 | ||||||
| Earnings from operations | 90,640 | 73,289 | ||||||
| Investment income (loss) (Note 4b) | 2,826 | (39,033) | ||||||
| Interest and finance expense (Note 19) | (5,195) | (3,841) | ||||||
| Earnings before income taxes | 88,271 | 30,415 | ||||||
| Income tax expense (Note 23) | (11,440) | (37,977) | ||||||
| Net earnings (loss) and comprehensive earnings (loss) | $ | 76,831 | $ | (7,562) | ||||
| Net earnings (loss) and comprehensive earnings (loss) attributable to: | ||||||||
| Equity holders of the Company | $ | 76,517 | $ | (7,798) | ||||
| Non-controlling interests | 314 | 236 | ||||||
| $ | 76,831 | $ | (7,562) | |||||
| Earnings (loss) per share attributable to common shareholders (Note 20) | ||||||||
| Basic earnings (loss) per share | $ | 0.36 | $ | (0.04) | ||||
| Diluted earnings (loss) per share | $ | 0.36 | $ | (0.04) | ||||
| Weighted average shares outstanding (in 000’s) Basic | 210,463 | 210,261 | ||||||
| Weighted average shares outstanding (in 000’s) Diluted | 210,550 | 210,261 | ||||||
See accompanying notes to the condensed interim consolidated financial statements.
| PAN AMERICAN SILVER CORP. | 2 | |||||||
| Condensed Interim Consolidated Statements of Cash Flows (unaudited, in thousands of U.S. dollars) | ||||
| Three months ended March 31, | ||||||||
| 2022 | 2021 | |||||||
| Operating activities | ||||||||
| Net earnings (loss) for the period | $ | 76,831 | $ | (7,562) | ||||
| Income tax expense (Note 23) | 11,440 | 37,977 | ||||||
| Depreciation and amortization | 84,526 | 75,093 | ||||||
| Gains and income from associates (Note 8) | (45,033) | (198) | ||||||
| Accretion on closure and decommissioning provision (Notes 11,19) | 3,710 | 1,869 | ||||||
| Unrealized foreign exchange losses | 2,328 | 2,167 | ||||||
| Interest expense (Note 19) | 895 | 1,043 | ||||||
| Investment (income) loss | (2,826) | 39,033 | ||||||
| Interest paid | (1,370) | (1,215) | ||||||
| Interest received | 18 | 117 | ||||||
| Income taxes paid | (58,273) | (61,333) | ||||||
| Other operating activities (Note 21) | 11,570 | (9,743) | ||||||
| Net change in non-cash working capital items (Note 21) | (15,058) | (47,398) | ||||||
| $ | 68,758 | $ | 29,850 | |||||
| Investing activities | ||||||||
| Payments for mineral properties, plant and equipment | $ | (61,453) | $ | (47,971) | ||||
| Proceeds from disposition of mineral properties, plant and equipment | 7,699 | 770 | ||||||
| Proceeds from short-term investments | 704 | 255 | ||||||
| Net proceeds from derivatives | 1,978 | 2,484 | ||||||
| $ | (51,072) | $ | (44,462) | |||||
| Financing activities | ||||||||
| Proceeds from common shares issued | $ | 323 | $ | 39 | ||||
| Distributions to non-controlling interests | — | (313) | ||||||
| Dividends paid | (25,255) | (14,718) | ||||||
| Repayment of debt (Note 13) | (850) | — | ||||||
| Payment of equipment leases | (3,419) | (2,982) | ||||||
| $ | (29,201) | $ | (17,974) | |||||
| Effects of exchange rate changes on cash and cash equivalents | (159) | (1,030) | ||||||
| Decrease in cash and cash equivalents | (11,674) | (33,616) | ||||||
| Cash and cash equivalents at the beginning of the period | 283,550 | 167,113 | ||||||
| Cash and cash equivalents at the end of the period | $ | 271,876 | $ | 133,497 | ||||
Supplemental cash flow information (Note 21).
See accompanying notes to the condensed interim consolidated financial statements.
| PAN AMERICAN SILVER CORP. | 3 | |||||||
| Condensed Interim Consolidated Statements of Changes in Equity (unaudited, in thousands of U.S. dollars, except for number of shares) | ||||
| Attributable to equity holders of the Company | |||||||||||||||||||||||
| Issued shares | Issued capital | Reserves | Deficit | Total | Non- controlling interests | Total equity | |||||||||||||||||
| Balance, December 31, 2020 | 210,258,667 | $ | 3,132,140 | $ | 93,409 | $ | (623,030) | $ | 2,602,519 | $ | 3,320 | $ | 2,605,839 | ||||||||||
| Total comprehensive earnings | |||||||||||||||||||||||
| Net earnings for the year | — | — | — | 97,428 | 97,428 | 1,134 | 98,562 | ||||||||||||||||
| Shares issued on the exercise of stock options | 65,780 | 762 | (143) | — | 619 | — | 619 | ||||||||||||||||
| Shares issued as compensation | 133,077 | 3,312 | — | — | 3,312 | — | 3,312 | ||||||||||||||||
| Share-based compensation on option grants | — | — | 109 | — | 109 | — | 109 | ||||||||||||||||
| Distributions by subsidiaries to non-controlling interests | — | — | — | (933) | (933) | — | (933) | ||||||||||||||||
| Dividends paid | — | — | — | (71,500) | (71,500) | — | (71,500) | ||||||||||||||||
| Balance, December 31, 2021 | 210,457,524 | $ | 3,136,214 | $ | 93,375 | $ | (598,035) | $ | 2,631,554 | $ | 4,454 | $ | 2,636,008 | ||||||||||
| Total comprehensive earnings | |||||||||||||||||||||||
| Net earnings for the period | — | — | — | 76,517 | 76,517 | 314 | 76,831 | ||||||||||||||||
| Shares issued on the exercise of stock options | 26,930 | 412 | (89) | — | 323 | — | 323 | ||||||||||||||||
| Share-based compensation on option grants | — | — | 62 | — | 62 | — | 62 | ||||||||||||||||
| Dividends paid | — | — | — | (25,255) | (25,255) | — | (25,255) | ||||||||||||||||
| Balance, March 31, 2022 | 210,484,454 | $ | 3,136,626 | $ | 93,348 | $ | (546,773) | $ | 2,683,201 | $ | 4,768 | $ | 2,687,969 | ||||||||||
| Attributable to equity holders of the Company | |||||||||||||||||||||||
| Issued shares | Issued capital | Reserves | Deficit | Total | Non- controlling interests | Total equity | |||||||||||||||||
| Balance, December 31, 2020 | 210,258,667 | $ | 3,132,140 | $ | 93,409 | $ | (623,030) | $ | 2,602,519 | $ | 3,320 | $ | 2,605,839 | ||||||||||
| Total comprehensive loss | |||||||||||||||||||||||
| Net loss for the period | — | — | — | (7,798) | (7,798) | 236 | (7,562) | ||||||||||||||||
| Shares issued on the exercise of stock options | 2,868 | 46 | (7) | — | 39 | — | 39 | ||||||||||||||||
| Share-based compensation on option grants | — | — | 5 | — | 5 | — | 5 | ||||||||||||||||
| Distributions by subsidiaries to non-controlling interests | — | — | — | (313) | (313) | — | (313) | ||||||||||||||||
| Dividends paid | — | — | — | (14,718) | (14,718) | — | (14,718) | ||||||||||||||||
| Balance, March 31 2021 | 210,261,535 | $ | 3,132,186 | $ | 93,407 | $ | (645,859) | $ | 2,579,734 | $ | 3,556 | $ | 2,583,290 | ||||||||||
See accompanying notes to the condensed interim consolidated financial statements.
| PAN AMERICAN SILVER CORP. | 4 | |||||||
| Notes to the Condensed Interim Consolidated Financial Statements | ||||
| As at March 31, 2022 and December 31, 2021, and for the three months ended March 31, 2022 and 2021 (unaudited with tabular amounts in thousands of U.S. dollars except number of shares, options, warrants, and per share amounts, unless otherwise noted) | |||||
1. NATURE OF OPERATIONS
Pan American Silver Corp. is the ultimate parent company of its subsidiary group (collectively, the “Company”, or “Pan American”). Pan American is a British Columbia corporation domiciled in Canada, and its office is at Suite 1440 – 625 Howe Street, Vancouver, British Columbia, V6C 2T6.
The Company is engaged in the production and sale of silver, gold, zinc, lead and copper as well as other related activities, including exploration, extraction, processing, refining and reclamation. The Company’s major products are produced from mines in Canada, Peru, Mexico, Argentina and Bolivia. Additionally, the Company has project development activities in Canada, Peru, Mexico and Argentina, and exploration activities throughout South America, Canada and Mexico. As at March 31, 2022, the Company's Escobal mine in Guatemala continues to be on care and maintenance pending satisfactory completion of a consultation process led by the Ministry of Energy and Mines in Guatemala. In late February 2022, the Company's Morococha mine in Peru was placed on care and maintenance as a requirement to move the processing facilities to allow for the expansion of a neighboring mine.
Principal subsidiaries:
The principal subsidiaries of the Company and their geographic locations at March 31, 2022 were as follows:
| Location | Subsidiary | Ownership Interest | Accounting | Operations and Development Projects Owned | ||||||||||
| Canada | Lake Shore Gold Corp. | 100% | Consolidated | Bell Creek and Timmins West mines | ||||||||||
| Mexico | Plata Panamericana S.A. de C.V. | 100% | Consolidated | La Colorada mine | ||||||||||
| Compañía Minera Dolores S.A. de C.V. | 100% | Consolidated | Dolores mine | |||||||||||
| Peru | Pan American Silver Huaron S.A. | 100% | Consolidated | Huaron mine | ||||||||||
| Compañía Minera Argentum S.A. | 92% | Consolidated | Morococha mine | |||||||||||
| Shahuindo S.A.C. | 100% | Consolidated | Shahuindo mine | |||||||||||
| La Arena S.A. | 100% | Consolidated | La Arena mine | |||||||||||
| Bolivia | Pan American Silver (Bolivia) S.A. | 95% | Consolidated | San Vicente mine | ||||||||||
| Guatemala | Pan American Silver Guatemala S.A. | 100% | Consolidated | Escobal mine | ||||||||||
| Argentina | Minera Tritón Argentina S.A. | 100% | Consolidated | Manantial Espejo & Cap-Oeste Sur Este mines | ||||||||||
| Minera Joaquin S.R.L. | 100% | Consolidated | Joaquin mine | |||||||||||
| Minera Argenta S.A. | 100% | Consolidated | Navidad project | |||||||||||
2. BASIS OF PREPARATION
These unaudited condensed interim consolidated financial statements have been prepared in accordance with International Accounting Standard 34 - Interim Financial Reporting (“IAS 34”) as issued by the International Accounting Standards Board (“IASB”) and have been condensed with certain disclosures from the Company's audited consolidated financial statements for the year ended December 31, 2021 (the " Annual Financial Statements") omitted. Accordingly, these unaudited condensed interim consolidated financial statements should be read in conjunction with the Annual Financial Statements.
| PAN AMERICAN SILVER CORP. | 5 | |||||||
| Notes to the Condensed Interim Consolidated Financial Statements | ||||
| As at March 31, 2022 and December 31, 2021, and for the three months ended March 31, 2022 and 2021 (unaudited with tabular amounts in thousands of U.S. dollars except number of shares, options, warrants, and per share amounts, unless otherwise noted) | |||||
3. SUMMARY OF SIGNIFICANT ACCOUNTING POLICIES, STANDARDS, AND JUDGEMENTS
a)Changes in accounting policies
The accounting policies applied in the preparation of these unaudited condensed interim consolidated financial statements are consistent with those applied and disclosed in the Company’s audited consolidated financial statements for the year ended December 31, 2021.
b)Future changes in accounting standards
Certain new accounting standards and interpretations have been published that are not mandatory for the current period and have not been early adopted. Management is still evaluating and does not expect any such pronouncements to have a material impact on the Company’s consolidated financial statements upon adoption.
c)Significant judgements
In preparing the Company’s unaudited condensed interim consolidated financial statements for the three months ended March 31, 2022, the Company applied the critical judgments and estimates disclosed in Note 5 of its audited consolidated financial statements for the year ended December 31, 2021.
4. FINANCIAL INSTRUMENTS
a)Financial assets and liabilities by categories
| March 31, 2022 | Amortized cost | FVTPL | FVTOCI | Total | ||||||||||
| Financial Assets: | ||||||||||||||
| Cash and cash equivalents | $ | 271,876 | $ | — | $ | — | $ | 271,876 | ||||||
Trade receivables from provisional concentrates sales(1) | — | 48,242 | — | 48,242 | ||||||||||
Receivables not arising from sale of metal concentrates(1) | 73,748 | — | — | 73,748 | ||||||||||
| Short-term investments | — | 54,410 | — | 54,410 | ||||||||||
Long-term investment and associate(2) | — | — | 124,677 | 124,677 | ||||||||||
| Derivative assets | — | 7,143 | — | 7,143 | ||||||||||
| $ | 345,624 | $ | 109,795 | $ | 124,677 | $ | 580,096 | |||||||
| Financial Liabilities: | ||||||||||||||
| Derivative liabilities | $ | — | $ | 1,115 | $ | — | $ | 1,115 | ||||||
| Debt | $ | 14,450 | $ | — | $ | — | $ | 14,450 | ||||||
(1)Included in Trade and other receivables.
(2)Comprised of the Company's investment in Maverix Metals Inc. ("Maverix") (Note 8).
| December 31, 2021 | Amortized cost | FVTPL | FVTOCI | Total | ||||||||||
| Financial Assets: | ||||||||||||||
| Cash and cash equivalents | $ | 283,550 | $ | — | $ | — | $ | 283,550 | ||||||
Trade receivables from provisional concentrates sales(1) | — | 40,020 | — | 40,020 | ||||||||||
Receivables not arising from sale of metal concentrates(1) | 76,902 | — | — | 76,902 | ||||||||||
| Short-term investments | — | 51,723 | — | 51,723 | ||||||||||
| Derivative assets | — | 3,995 | — | 3,995 | ||||||||||
| $ | 360,452 | $ | 95,738 | $ | — | $ | 456,190 | |||||||
| Financial Liabilities: | ||||||||||||||
| Derivative liabilities | $ | — | $ | 351 | $ | — | $ | 351 | ||||||
| Debt | $ | 15,300 | $ | — | $ | — | $ | 15,300 | ||||||
(1)Included in Trade and other receivables.
b)Short-term investments recorded at fair value through profit or loss ("FVTPL")
The Company’s short-term investments are recorded at FVTPL. The gains (losses) from short-term investments for the three months ended March 31, 2022 and 2021 were as follows:
| PAN AMERICAN SILVER CORP. | 6 | |||||||
| Notes to the Condensed Interim Consolidated Financial Statements | ||||
| As at March 31, 2022 and December 31, 2021, and for the three months ended March 31, 2022 and 2021 (unaudited with tabular amounts in thousands of U.S. dollars except number of shares, options, warrants, and per share amounts, unless otherwise noted) | |||||
| Three months ended March 31, | ||||||||
| 2022 | 2021 | |||||||
| Unrealized gains (losses) on short-term investments | $ | 2,456 | $ | (39,033) | ||||
| Realized gains on short-term investments | 370 | — | ||||||
| $ | 2,826 | $ | (39,033) | |||||
c)Derivative instruments
The Company's derivatives are comprised of foreign currency and commodity contracts. The gains on derivatives for the three months ended March 31, 2022 and 2021 were comprised of the following:
| Three months ended March 31, | ||||||||
| 2022 | 2021 | |||||||
| Gains on derivatives | ||||||||
| Realized gains on derivatives | $ | 1,979 | $ | 2,477 | ||||
| Unrealized gains (losses) on derivatives | 2,383 | (107) | ||||||
| $ | 4,362 | $ | 2,370 | |||||
d)Fair value information
i) Fair Value Measurement
The categories of the fair value hierarchy that reflect the inputs to valuation techniques used to measure fair value are as follows:
Level 1: Quoted prices in active markets for identical assets or liabilities;
Level 2: Inputs other than quoted prices included within Level 1 that are observable for the asset or liability, either directly or indirectly; and
Level 3: Inputs for the asset or liability based on unobservable market data.
The levels in the fair value hierarchy into which the Company’s financial assets and liabilities that are measured and recognized on the Consolidated Statements of Financial Position at fair value on a recurring basis were categorized as follows:
| At March 31, 2022 | At December 31, 2021 | |||||||||||||
| Level 1 | Level 2 | Level 1 | Level 2 | |||||||||||
| Assets and Liabilities: | ||||||||||||||
| Short-term investments | $ | 54,410 | $ | — | $ | 51,723 | $ | — | ||||||
Long-term investment and associate(1) | 124,677 | — | — | — | ||||||||||
| Trade receivables from provisional concentrate sales | — | 48,242 | — | 40,020 | ||||||||||
| Derivative assets | — | 7,143 | — | 3,995 | ||||||||||
| Derivative liabilities | — | (1,115) | — | (351) | ||||||||||
| $ | 179,087 | $ | 54,270 | $ | 51,723 | $ | 43,664 | |||||||
(1)Comprised of the Company's investment in Maverix (Note 8).
The methodology and assessment of inputs for determining the fair value of financial assets and liabilities as well as the levels of hierarchy for the Company’s financial assets and liabilities measured at fair value remains unchanged from that at December 31, 2021.
| PAN AMERICAN SILVER CORP. | 7 | |||||||
| Notes to the Condensed Interim Consolidated Financial Statements | ||||
| As at March 31, 2022 and December 31, 2021, and for the three months ended March 31, 2022 and 2021 (unaudited with tabular amounts in thousands of U.S. dollars except number of shares, options, warrants, and per share amounts, unless otherwise noted) | |||||
ii) Valuation Techniques
Short-term investments, and long-term investment and associate
The Company’s short-term investments, and long-term investment and associate are valued using quoted market prices in active markets and as such are classified within Level 1 of the fair value hierarchy and are primarily equity securities. The fair value of the equity securities is calculated using the quoted market price multiplied by the quantity of shares held by the Company.
Derivative assets and liabilities
The Company’s derivative assets and liabilities were comprised of foreign currency and commodity contracts which are valued using observable market prices.
Receivables from Provisional Concentrate Sales
A portion of the Company’s trade receivables arose from provisional concentrate sales and are valued using quoted market prices based on the forward London Metal Exchange for copper, zinc and lead and the London Bullion Market Association P.M. fix for gold and silver.
e)Financial Instruments and related risks
The Company has exposure to risks of varying degrees of significance which could affect its ability to achieve its strategic objectives for growth and shareholder returns. The principal financial risks to which the Company is exposed are:
i)Credit risk
ii)Liquidity risk
iii)Market risk
1. Currency risk
2. Interest rate risk
3. Price risk
The Company’s Board of Directors has overall responsibility for the establishment and oversight of the Company’s risk management framework and reviews the Company’s policies on an ongoing basis.
i) Credit Risk
Credit risk is the risk of financial loss to the Company if a customer or counterparty to a financial instrument fails to meet its contractual obligations and arises principally from the Company’s trade receivables. The carrying value of trade receivables represents the maximum credit exposure.
The Company has concentrate contracts to sell the zinc, lead, copper and silver concentrates produced by the Huaron, Morococha, San Vicente and La Colorada mines. Concentrate contracts are a common business practice in the mining industry. The terms of the concentrate contracts may require the Company to deliver concentrate that has a value greater than the payment received at the time of delivery, thereby introducing the Company to credit risk of the buyers of concentrates. Should any of these counterparties not honour purchase arrangements, or should any of them become insolvent, the Company may incur losses for products already shipped and be forced to sell its concentrates on the spot market or it may not have a market for its concentrates and therefore its future operating results may be materially adversely impacted. At March 31, 2022, the Company had receivable balances associated with buyers of its concentrates of $48.2 million (December 31, 2021 - $40.0 million). The vast majority of the Company’s concentrate is sold to five well-known concentrate buyers.
Doré production from La Colorada, Dolores, Manantial Espejo, Shahuindo, La Arena, and Timmins is refined under long-term agreements with fixed refining terms at seven separate refineries worldwide. The Company generally retains the risk and title to the precious metals throughout the process of refining and therefore is exposed to the risk that the refineries will not be able to perform in accordance with the
| PAN AMERICAN SILVER CORP. | 8 | |||||||
| Notes to the Condensed Interim Consolidated Financial Statements | ||||
| As at March 31, 2022 and December 31, 2021, and for the three months ended March 31, 2022 and 2021 (unaudited with tabular amounts in thousands of U.S. dollars except number of shares, options, warrants, and per share amounts, unless otherwise noted) | |||||
refining contract and that the Company may not be able to fully recover precious metals in such circumstances. At March 31, 2022, the Company had approximately $35.7 million (December 31, 2021 - $52.3 million) of value contained in precious metal inventory at refineries. The Company maintains insurance coverage against the loss of precious metals at the Company’s mine sites, in-transit to refineries and while at the refineries. Risk is transferred to the refineries upon delivery.
The Company maintains trading facilities with several banks and bullion dealers for the purposes of transacting the Company’s metal sales. None of these facilities are subject to margin arrangements. The Company’s trading activities can expose the Company to the credit risk of its counterparties to the extent that the trading positions have a positive mark-to-market value. However, the Company maintains an active credit management and monitoring program to minimize the risk of excessive credit risk concentration with any single counterparty.
Refined silver and gold are sold in the spot market to various bullion traders and banks. Credit risk may arise from these activities if the Company is not paid for metal at the time it is delivered, as required by spot sale contracts.
Supplier advances for products and services yet to be provided are a common practice in some jurisdictions in which we operate. These advances represent a credit risk to us to the extent that suppliers do not deliver products or perform services as expected. As at March 31, 2022, we had made $17.5 million of supplier advances (December 31, 2021 - $11.2 million), which are reflected in “Trade and other receivables” on the consolidated statements of financial position.
Management constantly monitors and assesses the credit risk resulting from its refining arrangements, concentrate sales and commodity contracts with its refiners, trading counterparties and customers. Furthermore, management carefully considers credit risk when allocating prospective sales and refining business to counterparties. In making allocation decisions, management attempts to avoid unacceptable concentration of credit risk to any single counterparty.
The Company invests its cash and cash equivalents, which also has credit risk, with the objective of maintaining safety of principal and providing adequate liquidity to meet all current payment obligations.
ii) Liquidity Risk
Liquidity risk is the risk that the Company will not be able to meet its financial obligations as they come due. The Company manages its liquidity risk by continuously monitoring forecasted and actual cash flows. The Company has in place a rigorous planning and budgeting process to help determine the funds required to support the Company’s normal operating requirements on an ongoing basis and its expansion plans. The Company strives to maintain sufficient liquidity to meet its short-term business requirements, taking into account its anticipated cash flows from operations, its holdings of cash and short-term investments, and its committed loan facilities.
There was no significant change to the Company’s exposure to liquidity risk during the three months ended March 31, 2022.
iii) Market Risk
1.Currency Risk
The Company reports its financial statements in USD; however, the Company operates in jurisdictions that utilize other currencies. As a consequence, the financial results of the Company’s operations as reported in USD are subject to changes in the value of the USD relative to local currencies. Since the Company’s sales are denominated in USD and a portion of the Company’s operating costs and capital spending are in local currencies, the Company is negatively impacted by strengthening local currencies relative to the USD and positively impacted by the inverse.
| PAN AMERICAN SILVER CORP. | 9 | |||||||
| Notes to the Condensed Interim Consolidated Financial Statements | ||||
| As at March 31, 2022 and December 31, 2021, and for the three months ended March 31, 2022 and 2021 (unaudited with tabular amounts in thousands of U.S. dollars except number of shares, options, warrants, and per share amounts, unless otherwise noted) | |||||
At March 31, 2022, the Company had outstanding positions on its foreign currency exposure of Mexican peso ("MXN"), Peruvian sol ("PEN") and Canadian dollar ("CAD") purchases. The Company recorded gains of $0.5 million, $2.1 million, and $0.2 million, respectively, on MXN, PEN and CAD derivative contracts for the three months ended March 31, 2022 (2021 - losses of $0.8 million, losses of $0.9 million and gains of $0.5 million, respectively).
2.Interest Rate Risk
Interest rate risk is the risk that the fair values and future cash flows of the Company will fluctuate because of changes in market interest rates. The average interest rate earned by the Company during the three months ended March 31, 2022 on its cash and short-term investments was 0.33% (2021 - 0.35%).
On August 10, 2021 the Company entered into a Sustainability-Linked Credit Facility which replaced the Company's revolving credit facility (the "Credit Facility") (Note 13). There were no amounts drawn during the three months ended March 31, 2022 and March 31, 2021 on either the Sustainability-Linked Credit Facility or the Credit Facility.
In June 2021, a wholly-owned Peruvian subsidiary of the Company entered into a loan agreement (the "Loan") for the purpose of certain construction financing (Note 13). The Loan incurred an average interest rate of 3.6% during the three months ended March 31, 2022.
At March 31, 2022, the Company had $32.6 million in lease obligations (December 31, 2021 - $30.6 million) that are subject to an annualized interest rate of 10.4% (2021 - 10.6%).
3.Price Risk
Metal price risk is the risk that changes in metal prices will affect the Company’s income or the value of its related financial instruments. The Company derives its revenue from the sale of silver, gold, lead, copper, and zinc. The Company’s sales are directly dependent on metal prices that have shown significant volatility and are beyond the Company’s control. Consistent with the Company’s mission to provide equity investors with exposure to changes in precious metal prices, the Company’s current policy is to not hedge the price of precious metal.
The Company mitigates the price risk associated with its base metal production by committing some of its forecasted base metal production from time to time under forward sales and option contracts. The Board of Directors continually assesses the Company’s strategy towards its base metal exposure, depending on market conditions.
During the three months ended March 31, 2021, the Company entered into collars made up of put and call contracts for its exposure to copper but did not enter into copper contracts during the three months ended March 31, 2022. The Company recorded losses of $0.6 million during the three months ended March 31, 2021.
At March 31, 2022, the Company had outstanding positions of diesel swap contracts designated to fix or limit the Company’s exposure to higher fuel prices (the “Diesel fuel swaps”). The Company recorded gains of $2.8 million on Diesel fuel swaps during the three months ended March 31, 2022 (2021 - gains of $4.2 million).
At March 31, 2022, the Company had outstanding zinc sales contracts to manage exposure to fluctuation in prices. The company recorded losses of $1.1 million on these positions during the three months ended March 31, 2022. The Company did not enter into zinc contracts during the three months ended March 31, 2021.
| PAN AMERICAN SILVER CORP. | 10 | |||||||
| Notes to the Condensed Interim Consolidated Financial Statements | ||||
| As at March 31, 2022 and December 31, 2021, and for the three months ended March 31, 2022 and 2021 (unaudited with tabular amounts in thousands of U.S. dollars except number of shares, options, warrants, and per share amounts, unless otherwise noted) | |||||
5. SHORT-TERM INVESTMENTS
| March 31, 2022 | December 31, 2021 | |||||||||||||||||||
| Fair Value | Cost | Accumulated unrealized holding gains | Fair Value | Cost | Accumulated unrealized holding gains | |||||||||||||||
| Short-term investments | $ | 54,410 | $ | 20,781 | $ | 33,629 | $ | 51,723 | $ | 20,419 | $ | 31,304 | ||||||||
6. INVENTORIES
Inventories consist of:
| March 31, 2022 | December 31, 2021 | |||||||
| Concentrate inventory | $ | 26,619 | $ | 30,647 | ||||
| Stockpile ore | 33,121 | 43,216 | ||||||
| Heap leach inventory and in process | 287,503 | 286,266 | ||||||
| Doré and finished inventory | 63,500 | 81,448 | ||||||
| Materials and supplies | 88,673 | 84,529 | ||||||
| Total inventories | $ | 499,416 | $ | 526,106 | ||||
| Less: current portion of inventories | $ | (472,959) | $ | (500,462) | ||||
Non-current portion of inventories(1) | $ | 26,457 | $ | 25,644 | ||||
(1)Inventories at Escobal mine, which include $19.2 million (December 31, 2021 - $18.3 million) in supplies with the remainder attributable to metals, have been classified as non-current pending the restart of operations.
Total inventories held at net realizable value amounted to $190.3 million at March 31, 2022 (December 31, 2021 – $203.7 million). The Company recorded write-downs of $14.4 million for the three months ended March 31, 2022 (2021 – recoveries of $8.1 million) and were included in cost of sales.
| PAN AMERICAN SILVER CORP. | 11 | |||||||
| Notes to the Condensed Interim Consolidated Financial Statements | ||||
| As at March 31, 2022 and December 31, 2021, and for the three months ended March 31, 2022 and 2021 (unaudited with tabular amounts in thousands of U.S. dollars except number of shares, options, warrants, and per share amounts, unless otherwise noted) | |||||
7. MINERAL PROPERTIES, PLANT AND EQUIPMENT
Mineral properties, plant and equipment consist of:
| March 31, 2022 | December 31, 2021 | |||||||||||||||||||
| Cost | Accumulated Depreciation and Impairment | Carrying Value | Cost | Accumulated Depreciation and Impairment | Carrying Value | |||||||||||||||
| Producing properties: | ||||||||||||||||||||
| Huaron, Peru | $ | 230,374 | $ | (144,553) | $ | 85,821 | $ | 224,700 | $ | (141,902) | $ | 82,798 | ||||||||
| Morococha, Peru | 258,086 | (178,505) | 79,581 | 277,105 | (188,821) | 88,284 | ||||||||||||||
| Shahuindo, Peru | 597,354 | (142,140) | 455,214 | 590,096 | (132,727) | 457,369 | ||||||||||||||
| La Arena, Peru | 220,615 | (113,351) | 107,264 | 208,306 | (105,006) | 103,300 | ||||||||||||||
| La Colorada, Mexico | 366,041 | (190,734) | 175,307 | 355,471 | (185,684) | 169,787 | ||||||||||||||
Dolores, Mexico(1) | 1,752,000 | (1,385,854) | 366,146 | 1,738,040 | (1,350,908) | 387,132 | ||||||||||||||
Manantial Espejo, Argentina (2) | 519,399 | (506,584) | 12,815 | 518,931 | (500,244) | 18,687 | ||||||||||||||
| San Vicente, Bolivia | 154,308 | (112,845) | 41,463 | 151,045 | (110,829) | 40,216 | ||||||||||||||
| Timmins, Canada | 338,163 | (108,797) | 229,366 | 335,488 | (103,903) | 231,585 | ||||||||||||||
| Other | 29,542 | (20,109) | 9,433 | 29,804 | (19,664) | 10,140 | ||||||||||||||
| $ | 4,465,882 | $ | (2,903,472) | $ | 1,562,410 | $ | 4,428,986 | $ | (2,839,688) | $ | 1,589,298 | |||||||||
| Non-Producing Properties: | ||||||||||||||||||||
| Land | $ | 6,373 | $ | (871) | $ | 5,502 | $ | 6,373 | $ | (871) | $ | 5,502 | ||||||||
Navidad, Argentina(3) | 566,577 | (376,101) | 190,476 | 566,577 | (376,101) | 190,476 | ||||||||||||||
| Escobal, Guatemala | 258,877 | (2,191) | 256,686 | 257,390 | (1,842) | 255,548 | ||||||||||||||
| Timmins, Canada | 63,477 | — | 63,477 | 63,018 | — | 63,018 | ||||||||||||||
| Shahuindo, Peru | 3,549 | — | 3,549 | 3,549 | — | 3,549 | ||||||||||||||
| La Arena, Peru | 117,011 | — | 117,011 | 117,005 | — | 117,005 | ||||||||||||||
| Minefinders, Mexico | 78,443 | (36,975) | 41,468 | 78,443 | (36,975) | 41,468 | ||||||||||||||
| La Colorada, Mexico | 66,426 | — | 66,426 | 55,370 | — | 55,370 | ||||||||||||||
| Morococha, Peru | 2,981 | — | 2,981 | 2,981 | — | 2,981 | ||||||||||||||
| Other | 32,366 | (12,196) | 20,170 | 32,426 | (12,090) | 20,336 | ||||||||||||||
| $ | 1,196,080 | $ | (428,334) | $ | 767,746 | $ | 1,183,132 | $ | (427,879) | $ | 755,253 | |||||||||
| Total | $ | 5,661,962 | $ | (3,331,806) | $ | 2,330,156 | $ | 5,612,118 | $ | (3,267,567) | $ | 2,344,551 | ||||||||
(1)Includes previously recorded impairment charges of $748.9 million at March 31, 2022 (December 31, 2021 - $748.9 million).
(2)Includes previously recorded impairment charges of $173.3 million at March 31, 2022 (December 31, 2021 - $173.3 million).
(3)Includes previously recorded impairment charges of $376.1 million at March 31, 2022 (December 31, 2021 - $376.1 million).
Dispositions
On March 29, 2022, the Company received a $7.0 million payment from an arm's length party to be applied to certain costs associated with the closure and reclamation of the Morococha mine processing facility. This payment was included in proceeds from disposition of mineral properties, plant and equipment during the three months ended March 31, 2022.
| PAN AMERICAN SILVER CORP. | 12 | |||||||
| Notes to the Condensed Interim Consolidated Financial Statements | ||||
| As at March 31, 2022 and December 31, 2021, and for the three months ended March 31, 2022 and 2021 (unaudited with tabular amounts in thousands of U.S. dollars except number of shares, options, warrants, and per share amounts, unless otherwise noted) | |||||
8. LONG-TERM INVESTMENT AND ASSOCIATE
The following table shows a continuity of the Company's long-term investment and associate, classified as financial assets measured at fair value through other comprehensive income ("FVTOCI") and equity investees:
| FVTOCI | Investment in Associate | ||||||||||
| Maverix | Maverix | Total | |||||||||
| At December 31, 2020 | $ | — | $ | 71,560 | $ | 71,560 | |||||
| Acquisition of shares in associate | — | 2,616 | 2,616 | ||||||||
| Equity pick-up from equity investees | — | 4,510 | 4,510 | ||||||||
| Dilution losses | — | (34) | (34) | ||||||||
| Adjustment for change in ownership interest | — | (22) | (22) | ||||||||
| Dividends received | — | (1,220) | (1,220) | ||||||||
| At December 31, 2021 | — | 77,410 | 77,410 | ||||||||
| Equity pick-up from equity investees | $ | — | $ | 413 | $ | 413 | |||||
| Shareholder capital contribution | — | — | — | ||||||||
| Dividends received | — | (325) | (325) | ||||||||
| Loss of significant influence | 124,677 | (77,498) | 47,179 | ||||||||
| At March 31, 2022 | $ | 124,677 | $ | — | $ | 124,677 | |||||
Investment in Maverix:
On March 31, 2022, the Company determined that it no longer held significant influence over Maverix due to declining to exercise its right to nominate a representative to serve as a director on Maverix’s Board of Directors and accordingly the Company no longer has the power to participate in the financial and operating policy decisions of Maverix. As a result, the Company recorded a $44.6 million gain concurrent with the redesignation of its investment in Maverix from Investment in Associate, accounted using the "equity method" whereby the Company's recorded into income its ownership proportion of Maverix estimated earnings, into a long-term financial asset recorded at FVTOCI.
The Company's share of Maverix income or loss was recorded based on its 17% interest during the three months ended March 31, 2022 and 2021, representing the Company’s fully diluted ownership.
9. GOODWILL AND OTHER ASSETS
Other assets consist of:
| March 31, 2022 | December 31, 2021 | |||||||
| Goodwill | $ | 2,775 | $ | 2,775 | ||||
| Equity investments | 1,435 | 1,247 | ||||||
| Other assets | 1,138 | 1,124 | ||||||
| $ | 5,348 | $ | 5,146 | |||||
| PAN AMERICAN SILVER CORP. | 13 | |||||||
| Notes to the Condensed Interim Consolidated Financial Statements | ||||
| As at March 31, 2022 and December 31, 2021, and for the three months ended March 31, 2022 and 2021 (unaudited with tabular amounts in thousands of U.S. dollars except number of shares, options, warrants, and per share amounts, unless otherwise noted) | |||||
10. ACCOUNTS PAYABLE AND ACCRUED LIABILITIES
Accounts payable and accrued liabilities consist of:
| March 31, 2022 | December 31, 2021 | |||||||
Trade account payables(1) | $ | 75,153 | $ | 77,461 | ||||
| Royalty payables | 26,591 | 24,113 | ||||||
| Other accounts payable and accrued liabilities | 108,167 | 107,207 | ||||||
| Payroll and severance liabilities | 58,073 | 64,968 | ||||||
| Value added tax liabilities | 12,621 | 12,006 | ||||||
| Other tax payables | 18,988 | 20,332 | ||||||
| $ | 299,593 | $ | 306,087 | |||||
(1)No interest is charged on the trade accounts payable ranging from 30 to 60 days from the invoice date. The Company has policies in place to ensure that all payables are paid within the credit terms.
11. PROVISIONS
| 2022 | |||||
| Closure and decommissioning, December 31, 2021 | $ | 242,861 | |||
| Revisions in estimates and obligations incurred | 7,190 | ||||
| Reclamation expenditures | (976) | ||||
| Accretion expense (Note 19) | 3,710 | ||||
| Closure and decommissioning, March 31, 2022 | $ | 252,785 | |||
| Litigation | 5,973 | ||||
| Total provisions, March 31, 2022 | $ | 258,758 | |||
| Provision classification: | March 31, 2022 | December 31, 2021 | ||||||
| Current | $ | 12,508 | $ | 8,041 | ||||
| Non-Current | 246,250 | 240,111 | ||||||
| $ | 258,758 | $ | 248,152 | |||||
12. LEASES
Right-of-use Assets ("ROU")
The following table summarizes changes in ROU Assets for the three months ended March 31, 2022 which have been recorded in mineral properties, plant and equipment on the condensed interim consolidated statements of financial position:
| Three months ended March 31, 2022 | |||||
| Opening net book value | $ | 29,496 | |||
| Additions | 5,552 | ||||
| Depreciation | (3,064) | ||||
| Other | (844) | ||||
| Closing net book value | $ | 31,140 | |||
| PAN AMERICAN SILVER CORP. | 14 | |||||||
| Notes to the Condensed Interim Consolidated Financial Statements | ||||
| As at March 31, 2022 and December 31, 2021, and for the three months ended March 31, 2022 and 2021 (unaudited with tabular amounts in thousands of U.S. dollars except number of shares, options, warrants, and per share amounts, unless otherwise noted) | |||||
Lease obligations
The following table presents a reconciliation of the Company's undiscounted cash flows at March 31, 2022 and December 31, 2021 to their present value for the Company's lease obligations:
| March 31, 2022 | December 31, 2021 | |||||||
| Within one year | $ | 12,874 | $ | 11,690 | ||||
| Between one and five years | 18,210 | 16,676 | ||||||
| Beyond five years | 16,228 | 16,934 | ||||||
| Total undiscounted lease obligations | 47,312 | 45,300 | ||||||
| Less future interest charges | (14,716) | (14,739) | ||||||
| Total discounted lease obligations | 32,596 | 30,561 | ||||||
| Less current portion of lease obligations | (11,974) | (10,663) | ||||||
| Non-current portion of lease obligations | $ | 20,622 | $ | 19,898 | ||||
13. DEBT
Debt consists of:
| March 31, 2022 | December 31, 2021 | |||||||
| Loan | $ | 14,450 | $ | 15,300 | ||||
| Less: current portion of Loan | (3,400) | (3,400) | ||||||
| Non-current portion of Loan | $ | 11,050 | $ | 11,900 | ||||
In June 2021, a wholly-owned Peruvian subsidiary of the Company entered into a Loan for the purpose of certain construction financing. The Loan is denominated in USD, has a five-year term with quarterly repayments and bears interest of 3.6% per annum.
On August 10, 2021, Pan American Silver Corp. entered into an amendment agreement to amend and extend its $500 million Credit Facility, with a maturity date of February 1, 2023, into a $500 million Sustainability-Linked Credit Facility. The Sustainability-Linked Credit Facility features a pricing mechanism allowing for pricing adjustments on drawn and undrawn balances based on the Company's sustainability performance ratings and scores published by MSCI and S&P Global, leaders in ESG and Corporate Governance research and ratings. The Sustainability-Linked Credit Facility matures on August 8, 2025. In addition, the financial covenants include the requirement for the Company to maintain: (i) a leverage ratio less than or equal to 3.5:1; and (ii) an interest coverage ratio more than or equal to 3.0:1. The Sustainability-Linked Credit Facility and Credit Facility, respectively, were undrawn at March 31, 2022 and December 31, 2021. As of March 31, 2022, the Company was in compliance with all covenants required by the Sustainability-Linked Credit Facility.
The Sustainability-Linked Credit Facility can be drawn down at any time to finance the Company’s working capital requirements, acquisitions, investments and for general corporate purposes. Subject to pricing adjustment based on sustainability performance ratings and scores, any amounts drawn under the Sustainability-Linked Credit Facility will incur interest at LIBOR plus 1.825% to 2.80%. Undrawn amounts are subject to a stand-by fee of 0.41% to 0.63% per annum, dependent on the Company's leverage ratio and subject to pricing adjustments based on sustainability performance ratings and scores.
The Company did not draw from these credit facilities during the three months ended March 31, 2022 and 2021 and incurred $0.6 million and $0.5 million, respectively, in standby charges on undrawn amounts.
| PAN AMERICAN SILVER CORP. | 15 | |||||||
| Notes to the Condensed Interim Consolidated Financial Statements | ||||
| As at March 31, 2022 and December 31, 2021, and for the three months ended March 31, 2022 and 2021 (unaudited with tabular amounts in thousands of U.S. dollars except number of shares, options, warrants, and per share amounts, unless otherwise noted) | |||||
14. DEFERRED REVENUE
On July 11, 2016 the Company recognized a deferred revenue liability after it sold precious metal streams to Maverix whereby the Company will sell 100% of the future gold production from La Colorada and 5% of the future gold production from La Bolsa, which is in the exploration stage, respectively (the "Streams").
The deferred revenue related to the Streams will be recognized as revenue by Pan American as the gold ounces are delivered to Maverix and increased by $2.5 million during the three months ended March 31, 2022 to record the deferred revenue previously not recognized while using the equity method of accounting after concluding that it no longer held significant influence of Maverix. The deferred revenue liability was $15.0 million at March 31, 2022 (December 31, 2021 - $12.5 million).
15. OTHER LONG-TERM LIABILITIES
Other long-term liabilities consist of:
| March 31, 2022 | December 31, 2021 | |||||||
Deferred credit(1) | $ | 20,788 | $ | 20,788 | ||||
| Other tax payables | 15 | 16 | ||||||
| Severance liabilities | 5,259 | 4,887 | ||||||
| $ | 26,062 | $ | 25,691 | |||||
(1)Represents the obligation to deliver future silver production of Navidad pursuant to a silver stream contract.
16. SHARE CAPITAL AND EMPLOYEE COMPENSATION PLANS
a.Stock options and common shares issued as compensation ("Compensation Shares")
For the three months ended March 31, 2022, the total share-based compensation expense relating to stock options and Compensation Shares was $1.3 million (2021 - $0.9 million) and is presented as a component of general and administrative expense.
•Stock options
The Company did not grant any stock options during the three months ended March 31, 2022 or the comparative periods in 2021.
During the three months ended March 31, 2022, the Company issued 26,930 common shares in connection with the exercise of options (2021 – 2,868 common shares).
The following table summarizes changes in stock options for the three months ended March 31, 2022 and year ended December 31, 2021:
| Stock Options | ||||||||
| Options | Weighted Average Exercise Price CAD$ | |||||||
| As at December 31, 2020 | 317,417 | $ | 18.78 | |||||
| Granted | 53,115 | 30.70 | ||||||
| Exercised | (65,780) | 11.77 | ||||||
| Expired | (2,162) | 41.62 | ||||||
| Forfeited | (23,587) | 32.27 | ||||||
| As at December 31, 2021 | 279,003 | $ | 21.38 | |||||
| Exercised | (26,930) | 15.15 | ||||||
| Expired | (4,324) | 41.62 | ||||||
| As at March 31, 2022 | 247,749 | $ | 21.71 | |||||
| PAN AMERICAN SILVER CORP. | 16 | |||||||
| Notes to the Condensed Interim Consolidated Financial Statements | ||||
| As at March 31, 2022 and December 31, 2021, and for the three months ended March 31, 2022 and 2021 (unaudited with tabular amounts in thousands of U.S. dollars except number of shares, options, warrants, and per share amounts, unless otherwise noted) | |||||
The following table summarizes information about the Company's stock options outstanding at March 31, 2022:
| Options Outstanding | Options Exercisable | ||||||||||||||||
| Range of Exercise Prices CAD$ | Number Outstanding as at March 31, 2022 | Weighted Average Remaining Contractual Life (years) | Weighted Average Exercise Price CAD$ | Number Outstanding as at March 31, 2022 | Weighted Average Exercise Price CAD$ | ||||||||||||
| $9.76 - $17.11 | 31,882 | 0.6 | $ | 12.55 | 31,882 | $ | 12.55 | ||||||||||
| $17.12 - $24.46 | 134,097 | 3.3 | $ | 18.56 | 134,097 | $ | 18.56 | ||||||||||
| $24.47 - $31.81 | 74,165 | 6.2 | $ | 29.52 | 21,050 | $ | 26.54 | ||||||||||
| $31.82 - $39.48 | 7,605 | 5.7 | $ | 39.48 | 3,804 | $ | 39.48 | ||||||||||
| 247,749 | 3.9 | $ | 21.71 | 190,833 | $ | 18.85 | |||||||||||
b.PSUs
The Company recorded an expense of $0.7 million for PSUs for the three months ended March 31, 2022 (2021 - $0.2 million) and is presented as a component of general and administrative expense.
At March 31, 2022, the following PSUs were outstanding:
| PSU | Number Outstanding | Fair Value | ||||||
| As at December 31, 2020 | 255,559 | $ | 8,870 | |||||
| Granted | 79,417 | 2,049 | ||||||
| Paid out | (117,328) | (4,539) | ||||||
| Change in value | — | (901) | ||||||
| As at December 31, 2021 | 217,648 | $ | 5,479 | |||||
| Change in value | — | 554 | ||||||
| As at March 31, 2022 | 217,648 | $ | 6,033 | |||||
c.RSUs
Compensation expense for RSUs was $1.3 million for the three months ended March 31, 2022 (2021 - $0.6 million) and is presented as a component of general and administrative expense.
At March 31, 2022, the following RSUs were outstanding:
| RSU | Number Outstanding | Fair Value | ||||||
| As at December 31, 2020 | 396,572 | $ | 13,730 | |||||
| Granted | 240,366 | 5,818 | ||||||
| Paid out | (197,320) | (4,829) | ||||||
| Forfeited | (13,218) | (329) | ||||||
| Change in value | — | (3,699) | ||||||
| As at December 31, 2021 | 426,400 | $ | 10,691 | |||||
| Forfeited | (3,126) | (86) | ||||||
| Change in value | — | 1,079 | ||||||
| As at March 31, 2022 | 423,274 | $ | 11,684 | |||||
d.Issued share capital
The Company is authorized to issue 400,000,000 common shares without par value.
| PAN AMERICAN SILVER CORP. | 17 | |||||||
| Notes to the Condensed Interim Consolidated Financial Statements | ||||
| As at March 31, 2022 and December 31, 2021, and for the three months ended March 31, 2022 and 2021 (unaudited with tabular amounts in thousands of U.S. dollars except number of shares, options, warrants, and per share amounts, unless otherwise noted) | |||||
e.Dividends
The Company declared the following dividends for May 11, 2022 and the three months ended March 31, 2022 and 2021:
| Declaration Date | Record Date | Dividend per common share | ||||||
May 11, 2022(1) | May 24, 2022 | $ | 0.120 | |||||
| February 23, 2022 | March 7, 2022 | $ | 0.120 | |||||
| November 9, 2021 | November 22, 2021 | $ | 0.100 | |||||
| August 10, 2021 | August 23, 2021 | $ | 0.100 | |||||
| May 12, 2021 | May 25, 2021 | $ | 0.070 | |||||
| February 17, 2021 | March 1, 2021 | $ | 0.070 | |||||
(1)These dividends were declared subsequent to the quarter ended March 31, 2022 and have not been recognized as distributions to owners during the period presented.
f.CVRs
As part of the acquisition of Tahoe Resources Inc. on February 22, 2019, the Company issued 313,887,490 Contingent Value Rights ("CVRs"), with a term of 10 years, which are convertible into 15,600,208 common shares upon the first commercial shipment of concentrate following the restart of operations at the Escobal mine. As of March 31, 2022, there were 313,883,990 CVRs outstanding which were convertible into 15,600,034 common shares (December 31, 2021 - 313,883,990 CVRs convertible into 15,600,034 common shares).
17. PRODUCTION COSTS
Production costs are comprised of the following:
| Three months ended March 31, | ||||||||
| 2022 | 2021 | |||||||
| Materials and consumables | $ | 95,075 | $ | 88,064 | ||||
| Salaries and employee benefits | 80,004 | 81,861 | ||||||
| Contractors | 54,544 | 46,843 | ||||||
| Utilities | 16,060 | 11,810 | ||||||
| Other expense | 4,771 | 12,020 | ||||||
| Changes in inventories | 28,374 | (47,418) | ||||||
| $ | 278,828 | $ | 193,180 | |||||
18. MINE CARE AND MAINTENANCE
| Three months ended March 31, | ||||||||
| 2022 | 2021 | |||||||
Mine care and maintenance expenses(1) | $ | 9,668 | $ | 7,266 | ||||
(1)Comprised of Escobal mine, Morococha mine and Navidad project.
| PAN AMERICAN SILVER CORP. | 18 | |||||||
| Notes to the Condensed Interim Consolidated Financial Statements | ||||
| As at March 31, 2022 and December 31, 2021, and for the three months ended March 31, 2022 and 2021 (unaudited with tabular amounts in thousands of U.S. dollars except number of shares, options, warrants, and per share amounts, unless otherwise noted) | |||||
19. INTEREST AND FINANCE EXPENSE
| Three months ended March 31, | ||||||||
| 2022 | 2021 | |||||||
| Interest expense | $ | 895 | $ | 1,043 | ||||
| Finance fees | 590 | 929 | ||||||
| Accretion expense (Note 11) | 3,710 | 1,869 | ||||||
| $ | 5,195 | $ | 3,841 | |||||
20. EARNINGS PER SHARE (BASIC AND DILUTED)
| For the three months ended March 31, | 2022 | 2021 | ||||||||||||||||||
Earnings(1) (Numerator) | Shares (000’s) (Denominator) | Per-Share Amount | Earnings(1) (Numerator) | Shares (000’s) (Denominator) | Per-Share Amount | |||||||||||||||
| Net earnings (loss) for the period | $ | 76,517 | $ | (7,798) | ||||||||||||||||
| Basic earnings (loss) per share | $ | 76,517 | 210,463 | $ | 0.36 | $ | (7,798) | 210,261 | $ | (0.04) | ||||||||||
| Effect of Dilutive Securities: | ||||||||||||||||||||
| Stock Options | — | 87 | — | — | ||||||||||||||||
| Diluted earnings (loss) per share | $ | 76,517 | 210,550 | $ | 0.36 | $ | (7,798) | 210,261 | $ | (0.04) | ||||||||||
(1)Net earnings attributable to equity holders of the Company.
Potentially dilutive securities excluded in the diluted earnings per share calculation for the three months ended March 31, 2022 were 60,720 out-of-the-money options and CVRs potentially convertible into 15,600,034 common shares (2021 – 10,090 out-of-the-money options and CVRs potentially convertible into 15,600,034 common shares).
21. SUPPLEMENTAL CASH FLOW INFORMATION
The following tables summarize other adjustments for non-cash income statement items, changes in operating working capital items and significant non-cash items:
| Three months ended March 31, | |||||||||||
| Other operating activities | 2022 | 2021 | |||||||||
| Adjustments for non-cash income statement items: | |||||||||||
| Net realizable value adjustment for inventories | $ | 14,443 | $ | (8,143) | |||||||
| Gains on derivatives (Note 4c) | (4,362) | (2,370) | |||||||||
| Share-based compensation expense | 1,312 | 880 | |||||||||
| Losses (gains) on sale of mineral properties, plant and equipment | 177 | (110) | |||||||||
| $ | 11,570 | $ | (9,743) | ||||||||
| Three months ended March 31, | ||||||||
| Changes in non-cash operating working capital items: | 2022 | 2021 | ||||||
| Trade and other receivables | $ | (12,377) | $ | 1,223 | ||||
| Inventories | 10,335 | (39,934) | ||||||
| Prepaid expenses | (994) | (2,180) | ||||||
| Accounts payable and accrued liabilities | (11,728) | (6,415) | ||||||
| Provisions | (294) | (92) | ||||||
| $ | (15,058) | $ | (47,398) | |||||
| Cash and Cash Equivalents | March 31, 2022 | December 31, 2021 | ||||||
| Cash in banks | $ | 271,876 | $ | 283,550 | ||||
| PAN AMERICAN SILVER CORP. | 19 | |||||||
| Notes to the Condensed Interim Consolidated Financial Statements | ||||
| As at March 31, 2022 and December 31, 2021, and for the three months ended March 31, 2022 and 2021 (unaudited with tabular amounts in thousands of U.S. dollars except number of shares, options, warrants, and per share amounts, unless otherwise noted) | |||||
22. SEGMENTED INFORMATION
The Company reviews its segment reporting to ensure it reflects the operational structure of the Company and enables the Company's Chief Operating Decision Maker ("CODM") to review operating segment performance. We have determined that each producing mine and significant development property represents an operating segment. The Company has organized its reportable and operating segments by significant revenue streams and geographic regions.
Significant information relating to the Company’s reportable operating segments is summarized in the table below:
| For the three months ended March 31, 2022 | ||||||||||||||||||||
| Segment/Country | Operation | Revenue | Production costs and royalties | Depreciation | Mine operating earnings | Capital expenditures(1) | ||||||||||||||
| Silver Segment: | ||||||||||||||||||||
| Mexico | La Colorada | $ | 44,722 | $ | 24,463 | $ | 5,276 | $ | 14,983 | $ | 12,415 | |||||||||
| Peru | Huaron | 43,133 | 22,876 | 3,031 | 17,226 | 3,149 | ||||||||||||||
| Morococha | 22,305 | 22,181 | 2,308 | (2,184) | 351 | |||||||||||||||
| Bolivia | San Vicente | 16,902 | 12,840 | 1,987 | 2,075 | 2,901 | ||||||||||||||
| Argentina | Manantial Espejo | 33,150 | 26,575 | 5,643 | 932 | 1,089 | ||||||||||||||
| Guatemala | Escobal | — | — | — | — | 304 | ||||||||||||||
| Total Silver Segment | 160,212 | 108,935 | 18,245 | 33,032 | 20,209 | |||||||||||||||
| Gold Segment: | ||||||||||||||||||||
| Mexico | Dolores | 92,118 | 67,508 | 34,489 | (9,879) | 14,353 | ||||||||||||||
| Peru | Shahuindo | 66,140 | 33,045 | 10,619 | 22,476 | 6,687 | ||||||||||||||
| La Arena | 55,018 | 28,709 | 9,824 | 16,485 | 12,959 | |||||||||||||||
| Canada | Timmins | 66,400 | 50,108 | 10,270 | 6,022 | 10,325 | ||||||||||||||
| Total Gold Segment | 279,676 | 179,370 | 65,202 | 35,104 | 44,324 | |||||||||||||||
| Other segment: | ||||||||||||||||||||
| Canada | Pas Corp | — | — | 105 | (105) | 86 | ||||||||||||||
| Argentina | Navidad | — | — | — | — | 15 | ||||||||||||||
| Other | Other | — | 302 | 974 | (1,276) | 238 | ||||||||||||||
| Total | $ | 439,888 | $ | 288,607 | $ | 84,526 | $ | 66,755 | $ | 64,872 | ||||||||||
(1)Includes payments for mineral properties, plant and equipment and payment of equipment leases.
| PAN AMERICAN SILVER CORP. | 20 | |||||||
| Notes to the Condensed Interim Consolidated Financial Statements | ||||
| As at March 31, 2022 and December 31, 2021, and for the three months ended March 31, 2022 and 2021 (unaudited with tabular amounts in thousands of U.S. dollars except number of shares, options, warrants, and per share amounts, unless otherwise noted) | |||||
| For the three months ended March 31, 2021 | ||||||||||||||||||||
| Segment/Country | Operation | Revenue | Production costs and royalties | Depreciation | Mine operating earnings | Capital expenditures(1) | ||||||||||||||
| Silver Segment: | ||||||||||||||||||||
| Mexico | La Colorada | $ | 5,330 | $ | 4,204 | $ | 2,364 | $ | (1,238) | $ | 9,468 | |||||||||
| Peru | Huaron | 38,502 | 21,706 | 2,875 | 13,921 | 1,612 | ||||||||||||||
| Morococha | 24,357 | 18,164 | 3,550 | 2,643 | 2,391 | |||||||||||||||
| Bolivia | San Vicente | 24,651 | 15,909 | 2,936 | 5,806 | 558 | ||||||||||||||
| Argentina | Manantial Espejo | 29,102 | 26,396 | 3,963 | (1,257) | 1,378 | ||||||||||||||
| Guatemala | Escobal | — | — | — | — | 32 | ||||||||||||||
| Total Silver Segment | 121,942 | 86,379 | 15,688 | 19,875 | 15,439 | |||||||||||||||
| Gold Segment: | ||||||||||||||||||||
| Mexico | Dolores | 72,493 | 28,840 | 28,581 | 15,072 | 8,918 | ||||||||||||||
| Peru | Shahuindo | 58,337 | 25,772 | 9,158 | 23,407 | 2,822 | ||||||||||||||
| La Arena | 55,953 | 19,063 | 11,251 | 25,639 | 14,719 | |||||||||||||||
| Canada | Timmins | 59,374 | 42,988 | 10,040 | 6,346 | 8,866 | ||||||||||||||
| Total Gold Segment | 246,157 | 116,663 | 59,030 | 70,464 | 35,325 | |||||||||||||||
| Other segment: | ||||||||||||||||||||
| Canada | Pas Corp | — | — | 119 | (119) | 81 | ||||||||||||||
| Argentina | Navidad | — | — | — | — | 61 | ||||||||||||||
| Other | Other | — | — | 256 | (256) | 47 | ||||||||||||||
| Total | $ | 368,099 | $ | 203,042 | $ | 75,093 | $ | 89,964 | $ | 50,953 | ||||||||||
(1)Includes payments for mineral properties, plant and equipment and payment of equipment leases.
| At March 31, 2022 | ||||||||||||||
| Segment/Country | Operation | Assets | Liabilities | Net assets | ||||||||||
| Silver Segment: | ||||||||||||||
| Mexico | La Colorada | $ | 311,212 | $ | 55,675 | $ | 255,537 | |||||||
| Peru | Huaron | 133,268 | 64,918 | 68,350 | ||||||||||
| Morococha | 121,197 | 42,568 | 78,629 | |||||||||||
| Bolivia | San Vicente | 88,315 | 51,734 | 36,581 | ||||||||||
| Argentina | Manantial Espejo | 64,679 | 24,950 | 39,729 | ||||||||||
| Guatemala | Escobal | 291,582 | 20,774 | 270,808 | ||||||||||
| Total Silver Segment | 1,010,253 | 260,619 | 749,634 | |||||||||||
| Gold Segment: | ||||||||||||||
| Mexico | Dolores | 684,489 | 169,424 | 515,065 | ||||||||||
| Peru | Shahuindo | 600,217 | 193,374 | 406,843 | ||||||||||
| La Arena | 316,242 | 103,045 | 213,197 | |||||||||||
| Canada | Timmins | 398,085 | 57,087 | 340,998 | ||||||||||
| Total Gold Segment | 1,999,033 | 522,930 | 1,476,103 | |||||||||||
| Other segment: | ||||||||||||||
| Canada | Pas Corp | 218,878 | 19,179 | 199,699 | ||||||||||
| Argentina | Navidad | 193,992 | 2,920 | 191,072 | ||||||||||
| Other | 118,141 | 46,680 | 71,461 | |||||||||||
| Total | $ | 3,540,297 | $ | 852,328 | $ | 2,687,969 | ||||||||
| PAN AMERICAN SILVER CORP. | 21 | |||||||
| Notes to the Condensed Interim Consolidated Financial Statements | ||||
| As at March 31, 2022 and December 31, 2021, and for the three months ended March 31, 2022 and 2021 (unaudited with tabular amounts in thousands of U.S. dollars except number of shares, options, warrants, and per share amounts, unless otherwise noted) | |||||
| At December 31, 2021 | ||||||||||||||
| Segment/Country | Operation | Assets | Liabilities | Net assets | ||||||||||
| Silver Segment: | ||||||||||||||
| Mexico | La Colorada | $ | 299,038 | $ | 52,934 | $ | 246,104 | |||||||
| Peru | Huaron | 117,514 | 59,975 | 57,539 | ||||||||||
| Morococha | 124,607 | 40,494 | 84,113 | |||||||||||
| Bolivia | San Vicente | 88,924 | 53,264 | 35,660 | ||||||||||
| Argentina | Manantial Espejo | 71,012 | 29,017 | 41,995 | ||||||||||
| Guatemala | Escobal | 287,811 | 19,833 | 267,978 | ||||||||||
| Total Silver Segment | 988,906 | 255,517 | 733,389 | |||||||||||
| Gold Segment: | ||||||||||||||
| Mexico | Dolores | 750,220 | 193,638 | 556,582 | ||||||||||
| Peru | Shahuindo | 591,164 | 199,450 | 391,714 | ||||||||||
| La Arena | 317,371 | 106,799 | 210,572 | |||||||||||
| Canada | Timmins | 419,106 | 62,196 | 356,910 | ||||||||||
| Total Gold Segment | 2,077,861 | 562,083 | 1,515,778 | |||||||||||
| Other segment: | ||||||||||||||
| Canada | Pas Corp | 176,006 | 16,492 | 159,514 | ||||||||||
| Argentina | Navidad | 193,077 | — | 193,077 | ||||||||||
| Other | 82,734 | 48,484 | 34,250 | |||||||||||
| Total | $ | 3,518,584 | $ | 882,576 | $ | 2,636,008 | ||||||||
| Three months ended March 31, | ||||||||
| Product Revenue | 2022 | 2021 | ||||||
| Refined silver and gold | $ | 317,397 | $ | 278,925 | ||||
| Zinc concentrate | 28,281 | 25,285 | ||||||
| Lead concentrate | 48,922 | 17,857 | ||||||
| Copper concentrate | 28,405 | 29,834 | ||||||
| Silver concentrate | 16,883 | 16,198 | ||||||
| Total | $ | 439,888 | $ | 368,099 | ||||
23. INCOME TAXES
Components of Income Tax Expense
| Three months ended March 31, | ||||||||
| 2022 | 2021 | |||||||
| Current income tax expense | $ | 30,486 | $ | 26,576 | ||||
| Deferred income tax (recovery) expense | (19,046) | 11,401 | ||||||
| Income tax expense | $ | 11,440 | $ | 37,977 | ||||
Income tax expense differs from the amounts that would result from applying the Canadian federal and provincial income tax rates to earnings before income taxes. These differences result from the items shown on the following table, which results in effective tax rates that vary considerably from the comparable period. The main factors that impacted the effective tax rate for the three months ended March 31, 2022 and the comparable period for 2021 were foreign exchange rate fluctuations, changes in the recognition of certain deferred tax assets (primarily resulting from gains/losses on short-term investments and on foreign denominated intercompany debt), mining taxes paid, and withholding taxes remitted on payments from foreign subsidiaries. The Company expects that these and other factors will continue to cause fluctuations in effective tax rates in the future.
| PAN AMERICAN SILVER CORP. | 22 | |||||||
| Notes to the Condensed Interim Consolidated Financial Statements | ||||
| As at March 31, 2022 and December 31, 2021, and for the three months ended March 31, 2022 and 2021 (unaudited with tabular amounts in thousands of U.S. dollars except number of shares, options, warrants, and per share amounts, unless otherwise noted) | |||||
Reconciliation of Effective Income Tax Rate
| Three months ended March 31, | ||||||||
| 2022 | 2021 | |||||||
| Earnings before taxes and non-controlling interest | $ | 88,271 | $ | 30,415 | ||||
| Statutory Canadian income tax rate | 27.00 | % | 27.00 | % | ||||
| Income tax expense based on above rates | $ | 23,833 | $ | 8,212 | ||||
| Increase (decrease) due to: | ||||||||
| Non-deductible expenditures | 2,006 | 1,367 | ||||||
| Foreign tax rate differences | 1,501 | 3,915 | ||||||
| Change in net deferred tax assets not recognized | (11,685) | 14,590 | ||||||
| Effect of other taxes paid (mining and withholding) | 4,615 | 8,374 | ||||||
| Effect of foreign exchange on tax expense | (11,462) | 7,662 | ||||||
| Non-taxable impact of foreign exchange | 2,493 | (2,546) | ||||||
| Change in non-deductible portion of reclamation liabilities | 1,383 | (3,243) | ||||||
| Other | (1,244) | (354) | ||||||
| Income tax expense | $ | 11,440 | $ | 37,977 | ||||
24. CONTINGENCIES
The Company is subject to various legal, tax, environmental and regulatory matters that arise in the ordinary course of business activities. Each of these matters is subject to various uncertainties and it is possible that some of these matters may be resolved unfavorably to the Company. In the opinion of management none of these matters are expected to have a material adverse effect on the results of operations or financial conditions of the Company. Since December 31, 2021, there have been no significant changes to these contractual obligations and commitments.
25. RELATED PARTY TRANSACTIONS
The Company’s related parties include its subsidiaries, associates over which it exercises significant influence, and key management personnel. Transactions with the Company's subsidiaries have been eliminated on consolidation. Maverix remained a related party until March 31, 2022 (Note 8). There were no other related party transactions for the three months ended March 31, 2022 and 2021.
| PAN AMERICAN SILVER CORP. | 23 | |||||||

Management’s Discussion and Analysis
FOR THE THREE MONTHS ENDED MARCH 31, 2022
| Management Discussion and Analysis | ||||
| For the three months ended March 31, 2022 and 2021 (tabular amounts are in thousands of U.S. dollars except number of shares, options, warrants, per share amounts, and per ounce amounts, unless otherwise noted) | |||||
| TABLE OF CONTENTS | |||||
Liquidity Position and Capital Resources | |||||
Disclosure Controls and Procedures and Technical Information | |||||
| PAN AMERICAN SILVER CORP. | 1 | |||||||
| Management Discussion and Analysis | ||||
| For the three months ended March 31, 2022 and 2021 (tabular amounts are in thousands of U.S. dollars except number of shares, options, warrants, per share amounts, and per ounce amounts, unless otherwise noted) | |||||
MANAGEMENT’S DISCUSSION AND ANALYSIS OF FINANCIAL CONDITION
AND RESULTS OF OPERATIONS
May 11, 2022
INTRODUCTION
This Management’s Discussion and Analysis (“MD&A”) is intended to help the reader understand the significant factors that influence the performance of Pan American Silver Corp. and its subsidiaries (collectively “Pan American”, “we”, “us”, “our” or the “Company”) and such factors that may affect its future performance. This MD&A should be read in conjunction with the Company’s audited consolidated financial statements for the year ended December 31, 2021 (the “2021 Annual Financial Statements”), and the related notes contained therein, and the unaudited condensed interim consolidated financial statements for the three months ended March 31, 2022 (the “Q1 2022 Financial Statements”), and the related notes contained therein. All amounts in this MD&A, the 2021 Annual Financial Statements, and the Q1 2022 Financial Statements are expressed in United States dollars (“USD”) unless identified otherwise. The Company reports its financial position, financial performance and cash flows in accordance with International Financial Reporting Standards (“IFRS”), as issued by the International Accounting Standards Board (“IASB”). Pan American’s significant accounting policies are set out in Note 3 of the 2021 Annual Financial Statements.
This MD&A refers to various non-Generally Accepted Accounting Principles (“non-GAAP”) measures, such as “all-in sustaining costs per ounce sold”, “cash costs per ounce sold”, “adjusted earnings” and “basic adjusted earnings per share”, “cash mine operating earnings”, “total debt”, “capital”, and “working capital”, which are used by the Company to manage and evaluate operating performance at each of the Company’s mines and are widely reported in the mining industry as benchmarks for performance, do not have standardized meanings under IFRS, and the methodology by which these measures are calculated may differ from similar measures reported by other companies. To facilitate a better understanding of these non-GAAP measures as calculated by the Company, additional information has been provided in this MD&A. Please refer to the section of this MD&A entitled “Alternative Performance (Non-GAAP) Measures” for a detailed description of “all-in sustaining cost per ounce sold”, “cash costs per ounce sold”, “adjusted earnings” and “basic adjusted earnings per share”, “cash mine operating earnings”, “total debt”, “capital”, and “working capital” as well as details of the Company’s by-product credits and a reconciliation, where appropriate, of these measures to the Q1 2022 Financial Statements.
Any reference to “cash costs” in this MD&A should be understood to mean cash costs per ounce of silver or gold sold, net of by-product credits. Any reference to “AISC” in this MD&A should be understood to mean all-in sustaining costs per silver or gold ounce sold, net of by-product credits.
Except for historical information contained in this MD&A, the following disclosures are forward-looking statements within the meaning of the U.S. Private Securities Litigation Reform Act of 1995 and forward-looking information within the meaning of applicable Canadian provincial securities laws, or are future oriented financial information and as such, are based on an assumed set of economic conditions and courses of action. Please refer to the cautionary note regarding forward-looking statements and information at the back of this MD&A and the “Risks Related to Pan American’s Business” contained in the Company’s most recent Annual Information Form on file with the Canadian provincial securities regulatory authorities and Form 40-F on file with the U.S. Securities and Exchange Commission (the “SEC”). Additional information about Pan American and its business activities, including its Annual Information Form, is available on SEDAR at www.sedar.com.
| PAN AMERICAN SILVER CORP. | 2 | |||||||
| Management Discussion and Analysis | ||||
| For the three months ended March 31, 2022 and 2021 (tabular amounts are in thousands of U.S. dollars except number of shares, options, warrants, per share amounts, and per ounce amounts, unless otherwise noted) | |||||
CORE BUSINESS AND STRATEGY
Pan American engages in silver and gold mining and related activities, including exploration, mine development, extraction, processing, refining and reclamation. The Company owns and operates silver and gold mines located in Peru, Mexico, Argentina, Bolivia, and Canada. We also own the Escobal mine in Guatemala that is currently not operating. In addition, the Company is exploring for new silver deposits and opportunities throughout the Americas. The Company is listed on the Toronto Stock Exchange (Symbol: PAAS) and on the Nasdaq Global Select Market in New York (Symbol: PAAS).
Pan American’s vision is to be the world’s premier silver mining company, with a reputation for excellence in discovery, engineering, innovation and sustainable development. To achieve this vision, we base our business on the following strategy:
•Generate sustainable profits and superior returns on investments through the safe, efficient and environmentally sound development and operation of our assets.
•Constantly replace and grow our mineral reserves and mineral resources through targeted near-mine exploration and global business development.
•Foster positive long-term relationships with our employees, shareholders, communities and local governments through open and honest communication and ethical and sustainable business practices.
•Continually search for opportunities to upgrade and improve the quality of our assets, both internally and through acquisition.
•Encourage our employees to be innovative, responsive and entrepreneurial throughout our entire organization.
To execute this strategy, Pan American has assembled a sector-leading team of mining professionals with a depth of knowledge and experience in all aspects of our business, which enables the Company to confidently advance early stage projects through construction and into operation.
| PAN AMERICAN SILVER CORP. | 3 | |||||||
| Management Discussion and Analysis | ||||
| For the three months ended March 31, 2022 and 2021 (tabular amounts are in thousands of U.S. dollars except number of shares, options, warrants, per share amounts, and per ounce amounts, unless otherwise noted) | |||||
Q1 2022 HIGHLIGHTS
Operations
•Silver production of 4.62 million ounces
Consolidated silver production for Q1 2022 of 4.62 million ounces was comparable with the 4.58 million ounces produced in the three months ended March 31, 2021 ("Q1 2021"), primarily reflecting higher production at La Colorada and Manantial Espejo being offset by lower production from San Vicente and Morococha. The production variances for each of Pan American's mines are further described in the "Individual Mine Performance" section of this MD&A.
The Company reaffirms its 2022 operating outlook for silver production, as presented in the Company's 2021 Annual MD&A dated February 23, 2022.
•Gold production of 131.0 thousand ounces
Consolidated gold production for Q1 2022 of 131.0 thousand ounces was 5% lower than the 137.6 thousand ounces produced in Q1 2021, primarily reflecting lower production at La Arena and Dolores, which was partially offset by higher production at Shahuindo, as further described in the "Individual Mine Performance" section of this MD&A.
The Company reaffirms its 2022 operating outlook for gold production, as presented in the Company's 2021 Annual MD&A dated February 23, 2022.
•Base metal production
Zinc, lead and copper ("base metal") production in Q1 2022 of 10.2 thousand tonnes, 4.7 thousand tonnes, and 1.8 thousand tonnes, respectively, was lower than Q1 2021, primarily as a result of lower production at Morococha as the operation was placed on care and maintenance in February 2022 as previously announced in the Company's 2021 Annual MD&A, and decreased grades at Huaron.
The Company reaffirms its 2022 original annual forecast for zinc, lead and copper production, as presented in the Company's 2021 Annual MD&A dated February 23, 2022.
Financial
Cash Flow, liquidity and working capital position
Cash flow from operations: in Q1 2022 totaled $68.8 million, $38.9 million more than the $29.9 million generated in Q1 2021, reflecting: an $8.8 million increase in cash mine operating earnings(1) and a $32.3 million reduction in the build-up of non-cash working capital, largely related to changes in inventory that were a draw-down in Q1 2022 compared with a build-up in Q1 2021. These factors offset a $5.2 million increase in care and maintenance expenditures and general and administrative expenses. The cash flow movements are further described in the "Overview of Q1 2022 Financial Results" section.
As at March 31, 2022, the Company had working capital of $620.7 million, inclusive of cash and short-term investment balances of $326.3 million; a long-term investment in Maverix Metals Inc. ("Maverix") with a market value of $124.7 million; and $500.0 million available under its Sustainability-Linked Credit Facility. Total debt of $47.0 million was related to lease liabilities and construction loans.
Revenue and net income
Revenue in Q1 2022 of $439.9 million was 20% higher than in Q1 2021 as a result of an increase in silver and gold ounces sold by 40% and 9%, respectively. This was, largely due to draw downs of Q1 2022 inventories compared to build ups of Q1 2021 inventories.
| PAN AMERICAN SILVER CORP. | 4 | |||||||
| Management Discussion and Analysis | ||||
| For the three months ended March 31, 2022 and 2021 (tabular amounts are in thousands of U.S. dollars except number of shares, options, warrants, per share amounts, and per ounce amounts, unless otherwise noted) | |||||
Net earnings of $76.8 million ($0.36 basic earnings per share) was recorded for Q1 2022, compared with net losses of $7.6 million ($0.04 basic loss per share) in Q1 2021. The $84.4 million quarter-over-quarter increase is mainly due to:
i.a $44.8 million increase in gains and income from long-term assets. This was primarily due to a $44.6 million fair-value adjustment gain recognized in Q1 2022 from a change in the accounting treatment for the Company's investment in Maverix from an investment in associate to a long-term financial asset.
ii.a $41.9 million positive variance from investment income with income of $2.8 million in Q1 2022 relative to losses of $39.0 million in Q1 2021, primarily due to the fair value mark-to-market adjustments on short-term investments in equity securities, largely New Pacific Metals Corp;
iii.a $26.5 million decrease in income tax expense due to changes in foreign exchange rates increasing the value of deductible tax attributes in Q1 2022 compared to a reduction in the value of deductible tax attributes in Q1 2021; partially offset by,
iv.a $23.2 million decrease in mine operating earnings from increased production costs. This was a result of: a $22.6 million negative variation in quarter-over-quarter Net Realizable Value ("NRV") inventory adjustments; the COVID Omicron variant's impact on workforce deployment levels; and inflationary pressures.
See the "Overview of Q1 2022 Financial Results" section of this MD&A for further information.
Adjusted earnings(1): of $32.0 million ($0.15 per share) was recorded in Q1 2022, compared to the Q1 2021 adjusted earnings of $37.4 million ($0.18 per share).
Cash Costs(1)
During Q1 2022, all operations experienced reduced workforce deployments due to the spread of the COVID Omicron variant, which affected throughput and unit costs. Costs across the portfolio were also negatively impacted by inflationary pressures, particularly from an increase in prices for wages, diesel and certain consumables, including cyanide, explosives, and steel products, such as grinding media, as well as supply-chain shortages. These challenges are collectively referred as "Omicron, Inflationary and Supply Chain Cost Increases" throughout the report.
Despite the Omicron, Inflationary and Supply Chain Cost Increases listed above, Silver Segment Cash Costs per ounce in Q1 2022 of $10.23 were $2.07 lower than in Q1 2021. The decrease in quarter-over-quarter Cash Costs is driven primarily from:
i.a $1.45 per ounce decrease driven by Huaron and Morococha, largely from higher base metal prices;
ii.a $1.17 per ounce decrease from lower costs per ounce at La Colorada, which is further described in the "Individual Mine Performance" section of this MD&A; and,
iii.a $0.39 per ounce decrease at Manantial Espejo, largely due to higher grades.
These increases were partially offset by a $0.93 per ounce increase to Silver Segment Cash Costs from San Vicente due to narrower vein structures reducing silver and zinc grades.
Gold Segment Cash Costs per ounce in Q1 2022 were $1,069, $223 higher than in Q1 2021, reflecting increases at all Gold Segment mines, largely driven by lower mined grades due to mine sequencing, and inflationary pressures and supply chain shortages as previously described.
All-In Sustaining Costs (“AISC”)(1)
Silver Segment AISC for Q1 2022 of $13.41 per ounce were $3.58 lower than Q1 2021. The decrease primarily reflects the same factors that impacted Cash Costs described above, in addition to a $1.51 per ounce decrease, largely from lower sustaining capital expenditures per ounce sold in Q1 2022, and lower greenfield exploration expenditures allocated to the Silver Segment operations.
| PAN AMERICAN SILVER CORP. | 5 | |||||||
| Management Discussion and Analysis | ||||
| For the three months ended March 31, 2022 and 2021 (tabular amounts are in thousands of U.S. dollars except number of shares, options, warrants, per share amounts, and per ounce amounts, unless otherwise noted) | |||||
Gold Segment AISC for Q1 2022 of $1,502 per ounce were $444 higher than Q1 2021, largely reflecting the same factors that impacted Cash Costs described above, as well as higher sustaining capital and the impact from NRV adjustments at Dolores, which increased costs by $13.1 million, or $94 per ounce, in Q1 2022 and decreased costs by $9.6 million, or $75 per ounce, in the comparative quarter of 2021.
(1) Adjusted earnings, Cash Costs, AISC and Cash Mine Operating Earnings are non-GAAP measures, please refer to the “Alternative Performance (Non-GAAP) Measures” section of this MD&A for a detailed reconciliation of these measures to the Q1 2022 Financial Statements.
ENVIRONMENTAL, SOCIAL, AND GOVERNANCE (ESG)
Pan American is committed to conducting its business in a responsible and sustainable manner. Our ESG values include: caring for the environment in which we operate; contributing to the long-term development of our host communities; ensuring safe and secure workplaces for our employees; contributing to the welfare of our employees, local communities and governments; and, operating transparently.
Pan American released its 2021 sustainability report (the "Sustainability Report") on May 5, 2022, which is available on our website at www.panamericansilver.com. The Sustainability Report articulates our vision of sustainability, shares our management approach to sustainable development in the context of our business, discloses environmental, workplace and social performance, including challenges and opportunities, and demonstrates our progress toward our sustainability goals and initiatives. The Sustainability Report is prepared in accordance to the Global Reporting Initiative (GRI) Standards and is aligned with the Sustainability Accounting Standards Board (SASB) Standard. It also contains information in consideration of the Task Force on Climate Related Financial Disclosures (TCFD) reporting framework, which is included in the Climate, Energy, and Greenhouse Gas Emissions section of the Sustainability Report. The 2021 Sustainability Report also serves as our annual Communication on Progress for the United Nations Global Compact (UNGC).
The Company plans on providing a mid-year update on our progress with regards to our 2022 ESG goals, which can be found in our 2021 sustainability report, later in 2022.
OPERATING PERFORMANCE
Silver and Gold Production
The following table provides silver and gold production at each of Pan American’s operations for the three month periods ended March 31, 2022 and 2021. Each operation’s production variances are further discussed in the “Individual Mine Performance” section of this MD&A.
| Silver Production (ounces ‘000s) | Gold Production (ounces ‘000s) | |||||||||||||
| Three months ended March 31, | Three months ended March 31, | |||||||||||||
| 2022 | 2021 | 2022 | 2021 | |||||||||||
| La Colorada | 1,419 | 1,065 | 0.6 | 0.5 | ||||||||||
| Huaron | 899 | 884 | 0.2 | 0.3 | ||||||||||
Morococha(1) | 324 | 521 | 0.1 | 0.2 | ||||||||||
San Vicente(2) | 476 | 701 | — | 0.1 | ||||||||||
| Manantial Espejo | 903 | 697 | 6.1 | 5.9 | ||||||||||
| Dolores | 518 | 634 | 34.6 | 37.0 | ||||||||||
Shahuindo | 66 | 65 | 34.3 | 29.5 | ||||||||||
La Arena | 11 | 11 | 23.3 | 33.2 | ||||||||||
Timmins | 4 | 4 | 31.8 | 31.0 | ||||||||||
Total | 4,619 | 4,583 | 131.0 | 137.6 | ||||||||||
Total Payable Production(3) | 4,312 | 4,270 | 130.5 | 136.9 | ||||||||||
(1)Morococha data represents Pan American's 92.3% interest in the mine's production. Morococha was placed on care and maintenance in February 2022.
| PAN AMERICAN SILVER CORP. | 6 | |||||||
| Management Discussion and Analysis | ||||
| For the three months ended March 31, 2022 and 2021 (tabular amounts are in thousands of U.S. dollars except number of shares, options, warrants, per share amounts, and per ounce amounts, unless otherwise noted) | |||||
(2)San Vicente data represents Pan American's 95.0% interest in the mine's production.
(3)Payable production reflects sellable metal after deducting commercial contract metal payable deductions.
Base Metal Production
The following table provides the Company’s base metal production for the three months ended March 31, 2022 and 2021:
| Base Metal Production | ||||||||
| Three months ended March 31, | ||||||||
| 2022 | 2021 | |||||||
| Zinc – kt | 10.2 | 13.1 | ||||||
| Lead – kt | 4.7 | 5.0 | ||||||
| Copper – kt | 1.8 | 2.1 | ||||||
| Base Metal Payable Production | ||||||||
| Three months ended March 31, | ||||||||
| 2022 | 2021 | |||||||
| Zinc – kt | 8.5 | 10.9 | ||||||
| Lead – kt | 4.4 | 4.7 | ||||||
| Copper – kt | 1.6 | 1.7 | ||||||
Cash Costs and AISC
The quantification of both Cash Costs and AISC measures is described in detail, and where appropriate reconciled to the Q1 2022 Financial Statements, in the "Alternative (Non-GAAP) Performance Measures" section of this MD&A.
The following table reflects the Cash Costs and AISC net of by-product credits at each of Pan American’s operations for the three months ended March 31, 2022, as compared to the same periods in 2021:
| | Cash Costs(1) ($ per ounce) | AISC(1) ($ per ounce) | ||||||||||||
| Three months ended March 31, | Three months ended March 31, | |||||||||||||
| 2022 | 2021 | 2022 | 2021 | |||||||||||
| La Colorada | 9.73 | 15.62 | 12.19 | 42.44 | ||||||||||
| Huaron | (1.16) | 2.35 | 3.49 | 4.82 | ||||||||||
| Morococha | 5.68 | 13.89 | 7.08 | 17.47 | ||||||||||
| San Vicente | 19.39 | 13.35 | 23.94 | 14.20 | ||||||||||
| Manantial Espejo | 15.42 | 19.78 | 18.38 | 24.43 | ||||||||||
Silver Segment Consolidated(2) | 10.23 | 12.30 | 13.41 | 16.99 | ||||||||||
| Dolores | 976 | 718 | 1,682 | 723 | ||||||||||
| Shahuindo | 915 | 751 | 1,152 | 844 | ||||||||||
| La Arena | 963 | 598 | 1,424 | 1,072 | ||||||||||
Timmins | 1,414 | 1,292 | 1,695 | 1,568 | ||||||||||
Gold Segment Consolidated(2) | 1,069 | 846 | 1,502 | 1,058 | ||||||||||
(1)Cash Costs and AISC are non-GAAP measures. Please refer to the “Alternative Performance (Non-GAAP) Measures” section of this MD&A for a detailed description of these measures and where appropriate a reconciliation of the measure to the Q1 2022 Financial Statements.
(2)Silver Segment Cash Costs and AISC are calculated net of credits for realized revenues from all metals other than silver ("silver segment by-product credits"), and are calculated per ounce of silver sold. Gold segment Cash Costs and AISC are calculated net of credits for realized silver revenues ("gold segment by-product credits"), and are calculated per ounce of gold sold.
| PAN AMERICAN SILVER CORP. | 7 | |||||||
| Management Discussion and Analysis | ||||
| For the three months ended March 31, 2022 and 2021 (tabular amounts are in thousands of U.S. dollars except number of shares, options, warrants, per share amounts, and per ounce amounts, unless otherwise noted) | |||||
Individual Mine Performance
An analysis of performance at each operation in Q1 2022 compared with Q1 2021 follows. The project capital amounts invested in Q1 2022 are further discussed in the "Project Development Update" section of this MD&A.
La Colorada Operation
| Three months ended March 31, | ||||||||
| 2022 | 2021 | |||||||
| Ore tonnes mined – kt | 138.3 | 130.4 | ||||||
| Tonnes milled – kt | 138.4 | 133.5 | ||||||
| Average silver grade – grams per tonne | 350 | 276 | ||||||
| Average zinc grade - % | 1.83 | 1.98 | ||||||
| Average lead grade - % | 1.03 | 1.04 | ||||||
| Production: | ||||||||
| Silver – koz | 1,419 | 1,065 | ||||||
| Gold – koz | 0.61 | 0.53 | ||||||
| Zinc – kt | 2.15 | 2.25 | ||||||
| Lead – kt | 1.19 | 1.17 | ||||||
| Payable Production | ||||||||
| Silver – koz | 1,351 | 1,009 | ||||||
| Gold – koz | 0.52 | 0.42 | ||||||
| Zinc – kt | 1.83 | 1.91 | ||||||
| Lead – kt | 1.11 | 1.08 | ||||||
Cash Costs - $ per ounce(1) | 9.73 | 15.62 | ||||||
Sustaining capital - $ thousands(2) | 3,855 | 5,386 | ||||||
AISC - $ per ounce(1) | 12.19 | 42.44 | ||||||
| Payable silver sold - koz | 1,620 | 225 | ||||||
(1)Cash Costs and AISC are non-GAAP measures. Please refer to the “Alternative Performance (Non-GAAP) Measures” section of this MD&A for a detailed reconciliation of these measures to cost of sales.
(2)Sustaining capital expenditures exclude $8.6 million of investing activity cash outflows for Q1 2022 (Q1 2021: $4.1 million) related to investment capital incurred on the La Colorada projects, as disclosed in the “Project Development Update” section of this MD&A.
Q1 2022 vs. Q1 2021
Production:
•Silver: 33% increase, largely from higher grades and throughput, both of which benefited from improved ventilation rates in the mine that resulted in higher mining rates and allowed access to high-grade zones. Throughput increased despite significant Omicron-related absenteeism.
•By-products: 4% decrease and 2% increase in zinc and lead production, respectively, as a result of mine sequencing.
Cash Costs: decreased by $5.88 per ounce, primarily driven by higher silver grades driving lower costs per ounce, as well as higher by-product metal prices, which more than offset the Omicron, Inflationary and Supply Chain Cost Increases.
Sustaining Capital: was lower in Q1 2022, driven by lower spend on the expansion of the tailings storage facility. The balance of the Q1 2022 spending primarily related to mine deepening, improvements in ventilation infrastructure, equipment replacements, lease payments for equipment, and near-mine exploration activities.
AISC: were $30.25 per ounce lower, largely due to lower sustaining capital per ounce, as Q1 2021 AISC was impacted by the timing of shipments, in addition to the same factors decreasing quarter-over-quarter Cash Costs.
| PAN AMERICAN SILVER CORP. | 8 | |||||||
| Management Discussion and Analysis | ||||
| For the three months ended March 31, 2022 and 2021 (tabular amounts are in thousands of U.S. dollars except number of shares, options, warrants, per share amounts, and per ounce amounts, unless otherwise noted) | |||||
Huaron Operation
| Three months ended March 31, | ||||||||
| 2022 | 2021 | |||||||
| Ore tonnes mined – kt | 237.8 | 235.7 | ||||||
| Tonnes milled – kt | 234.9 | 237.7 | ||||||
| Average silver grade – grams per tonne | 143 | 139 | ||||||
| Average zinc grade - % | 2.22 | 2.74 | ||||||
| Average lead grade - % | 1.40 | 1.30 | ||||||
| Average copper grade - % | 0.70 | 0.87 | ||||||
| Production: | ||||||||
| Silver – koz | 899 | 884 | ||||||
| Gold – koz | 0.24 | 0.28 | ||||||
| Zinc – kt | 4.05 | 5.13 | ||||||
| Lead – kt | 2.58 | 2.30 | ||||||
| Copper – kt | 1.22 | 1.56 | ||||||
| Payable Production: | ||||||||
| Silver – koz | 740 | 739 | ||||||
| Gold – koz | 0.05 | 0.02 | ||||||
| Zinc – kt | 3.34 | 4.23 | ||||||
| Lead – kt | 2.43 | 2.16 | ||||||
| Copper – kt | 1.10 | 1.24 | ||||||
Cash Costs - $ per ounce(1) | (1.16) | 2.35 | ||||||
| Sustaining capital - $ thousands | 3,149 | 1,612 | ||||||
AISC-$ per ounce(1) | 3.49 | 4.82 | ||||||
| Payable silver sold – koz | 720 | 709 | ||||||
(1)Cash Costs and AISC are non-GAAP measures. Please refer to the “Alternative Performance (Non-GAAP) Measures” section of this MD&A for a detailed reconciliation of these measures to cost of sales.
Q1 2022 vs. Q1 2021
Production:
•Silver: 2% higher, primarily from higher grades due to mine sequencing.
•By-products: zinc and copper production were 21% and 22% lower, respectively, while lead was 12% higher, all due to mine sequencing.
Cash Costs: decreased $3.50 per ounce, primarily from higher base metal prices net of lower zinc and copper grades, and lower treatment and refining charges per ounce. These, more than offset the Omicron, Inflationary and Supply Chain Cost Increases.
Sustaining Capital: was higher than Q1 2021 due to an increase in spending on mine equipment and the expansion of the tailings storage facility. The balance of Q1 2022 capital spending related to equipment and facility leases, and near-mine exploration activities.
AISC: decreased by $1.33 per ounce as a result of the same factors that affected Cash Costs, partially offset by higher sustaining capital per ounce.
| PAN AMERICAN SILVER CORP. | 9 | |||||||
| Management Discussion and Analysis | ||||
| For the three months ended March 31, 2022 and 2021 (tabular amounts are in thousands of U.S. dollars except number of shares, options, warrants, per share amounts, and per ounce amounts, unless otherwise noted) | |||||
Dolores Operation
| Three months ended March 31, | ||||||||
| 2022 | 2021 | |||||||
| Ore tonnes mined – kt | 1,532.6 | 2,934.2 | ||||||
| Waste tonnes mined – kt | 6,317.1 | 6,497.5 | ||||||
| Tonnes placed – kt | 2,002.2 | 1,859.8 | ||||||
| Average silver grade – grams per tonne | 14 | 19 | ||||||
| Average gold grade – grams per tonne | 0.63 | 1.06 | ||||||
| Production: | ||||||||
| Silver – koz | 518 | 634 | ||||||
| Gold – koz | 34.6 | 37.0 | ||||||
| Payable Production: | ||||||||
| Silver – koz | 517 | 633 | ||||||
| Gold – koz | 34.5 | 36.9 | ||||||
Cash Costs - $ per gold ounce(1) | 976 | 718 | ||||||
Sustaining capital - $ thousands | 14,353 | 8,919 | ||||||
AISC - $ per gold ounce(1) | 1,682 | 723 | ||||||
| Payable gold sold - koz | 40.8 | 31.5 | ||||||
(1)Cash Costs and AISC are non-GAAP measures. Please refer to the “Alternative Performance (Non-GAAP) Measures” section of this MD&A for a detailed reconciliation of these measures to cost of sales. Previously reported Cash Costs and AISC on a per silver ounce basis are disclosed in the Cash Costs and AISC section.
Q1 2022 vs. Q1 2021
Production:
•Silver: 18% lower, largely from a decrease in silver grades due to a reserve estimate shortfall in the section of the open pit Phase 9B being mined during the quarter.
•Gold: 7% lower, primarily from a combination of mine sequencing into lower gold grade ores and a decrease in gold grades due to the reserve shortfall described above, which was partially offset by expected leach sequencing favoring timing of gold production.
Cash Costs: increased $258 per ounce, primarily from higher operating costs per ounce and lower by-product credits per ounce, both largely driven by the decrease in grades described above, as well as Omicron, Inflationary and Supply Chain Cost Increases.
Sustaining Capital: was higher than Q1 2021, primarily driven by greater capitalized Phase 10 waste mining and increased heap leach pad expansion expenses in Q1 2022.
AISC: increased $959 per ounce, primarily due to the impact of NRV inventory adjustments, the increased sustaining capital, and the factors affecting quarter-over-quarter Cash Costs. The NRV inventory adjustments increased costs by $13.1 million, or $321 per ounce, in Q1 2022 compared with a cost-reducing $9.6 million, or $304 per ounce, adjustment in Q1 2021.
| PAN AMERICAN SILVER CORP. | 10 | |||||||
| Management Discussion and Analysis | ||||
| For the three months ended March 31, 2022 and 2021 (tabular amounts are in thousands of U.S. dollars except number of shares, options, warrants, per share amounts, and per ounce amounts, unless otherwise noted) | |||||
Shahuindo Operation
| Three months ended March 31, | ||||||||
| 2022 | 2021 | |||||||
| Ore tonnes mined – kt | 3,211.5 | 3,141.6 | ||||||
| Waste tonnes mined – kt | 4,314.2 | 3,511.5 | ||||||
| Tonnes placed – kt | 3,327.2 | 2,806.5 | ||||||
| Average silver grade – grams per tonne | 6 | 5 | ||||||
| Average gold grade – grams per tonne | 0.41 | 0.46 | ||||||
| Production: | ||||||||
| Silver – koz | 66 | 65 | ||||||
| Gold – koz | 34.26 | 29.54 | ||||||
| Payable Production: | ||||||||
| Silver – koz | 65.25 | 64.49 | ||||||
| Gold – koz | 34.23 | 29.51 | ||||||
Cash Costs - $ per ounce(1) | 915 | 751 | ||||||
Sustaining capital - $ thousands(2) | 7,381 | 2,681 | ||||||
AISC - $ per ounce(1) | 1,152 | 844 | ||||||
| Payable gold sold - koz | 33.8 | 31.7 | ||||||
(1)Cash Costs and AISC are non-GAAP measures. Please refer to the “Alternative Performance (Non-GAAP) Measures” section of this MD&A for a detailed reconciliation of these measures to cost of sales.
(2)Sustaining capital expenditures exclude $0.2 million of investing activity cash outflows for Q1 2022, (Q1 2021: $0.1 million) related to lease payments for the crushing and agglomeration plant completed by Tahoe, and is included in Other Projects, as disclosed in the “Project Development Update” section of this MD&A.
Q1 2022 vs. Q1 2021
Production:
•Gold: 16% higher, primarily from higher tonnes stacked and a higher ratio of ounces recovered to stacked, partially offset by lower grades due to mine sequencing. The increase in tonnes stacked during Q1 2022 reflects improved ore blending characteristics and drier conditions than typical for the wet summer months, which allowed for increased stacking rates.
Cash Costs: were $164 per ounce higher, primarily due to a higher ratio of waste to ore in the current section of the mine plan, lower gold grades due to mine sequencing, and Omicron, Inflationary and Supply Chain Cost Increases.
Sustaining Capital: an increase from Q1 2021, due to the timing of payments on leach pad construction and site infrastructure investments. Capital in both periods also included near-mine exploration and payments for leased mining equipment.
AISC: were $308 per ounce higher, largely due to the same factors affecting Cash Costs, as well as the higher sustaining capital expenditures.
| PAN AMERICAN SILVER CORP. | 11 | |||||||
| Management Discussion and Analysis | ||||
| For the three months ended March 31, 2022 and 2021 (tabular amounts are in thousands of U.S. dollars except number of shares, options, warrants, per share amounts, and per ounce amounts, unless otherwise noted) | |||||
La Arena Operation
| Three months ended March 31, | ||||||||
| 2022 | 2021 | |||||||
| Ore tonnes mined – kt | 2,035.1 | 2,040.8 | ||||||
| Waste tonnes mined – kt | 6,869.7 | 8,003.7 | ||||||
| Tonnes placed – kt | 2,035.1 | 2,040.8 | ||||||
| Average silver grade – grams per tonne | 1 | 1 | ||||||
| Average gold grade – grams per tonne | 0.33 | 0.38 | ||||||
| Production: | ||||||||
| Silver – koz | 11 | 11 | ||||||
| Gold – koz | 23.35 | 33.15 | ||||||
| Payable Production: | ||||||||
| Silver – koz | 10.88 | 10.83 | ||||||
| Gold – koz | 23.33 | 33.13 | ||||||
Cash Costs - $ per ounce(1) | 963 | 598 | ||||||
| Sustaining capital - $ thousands | 12,959 | 14,719 | ||||||
AISC - $ per ounce(1) | 1,424 | 1,072 | ||||||
| Payable gold sold - koz | 29.7 | 31.4 | ||||||
(1)Cash Costs and AISC are non-GAAP measures. Please refer to the “Alternative Performance (Non-GAAP) Measures” section of this MD&A for a detailed reconciliation of these measures to cost of sales.
Q1 2022 vs. Q1 2021
Production:
•Gold: 30% lower as a result of lower grades due to mine sequencing and a decrease in the ratio of ounces recovered to stacked due to timing of leach sequencing.
Cash Costs: increased by $365 per ounce, primarily reflecting Omicron, Inflationary and Supply Chain Cost Increases and lower grades.
Sustaining Capital: lower than Q1 2021, largely as a result of lower rates of capitalized deferred stripping. Expenditures in Q1 2022 were comprised mainly of capitalized deferred stripping, waste storage facility preparation, and other camp and mine infrastructure.
AISC: increased by $352 per ounce, largely from the same factors affecting quarter-over-quarter Cash Costs.
| PAN AMERICAN SILVER CORP. | 12 | |||||||
| Management Discussion and Analysis | ||||
| For the three months ended March 31, 2022 and 2021 (tabular amounts are in thousands of U.S. dollars except number of shares, options, warrants, per share amounts, and per ounce amounts, unless otherwise noted) | |||||
Timmins Operation
| Three months ended March 31, | ||||||||
| 2022 | 2021 | |||||||
| Ore tonnes mined – kt | 415.6 | 397.1 | ||||||
| Tonnes milled – kt | 409.4 | 400.0 | ||||||
| Average silver grade – grams per tonne | — | — | ||||||
| Average gold grade – grams per tonne | 2.51 | 2.64 | ||||||
| Production: | ||||||||
| Silver – koz | 4 | 4 | ||||||
| Gold – koz | 31.79 | 30.98 | ||||||
| Payable Production: | ||||||||
| Silver – koz | 3.75 | 3.86 | ||||||
| Gold – koz | 31.76 | 30.96 | ||||||
Cash Costs - $ per ounce(1) | 1,414 | 1,292 | ||||||
Sustaining capital - $ thousands(2) | 9,924 | 8,222 | ||||||
AISC - $ per ounce(1) | 1,695 | 1,568 | ||||||
| Payable gold sold - koz | 35.4 | 33.2 | ||||||
(1)Cash Costs and AISC are non-GAAP measures. Please refer to the “Alternative Performance (Non-GAAP) Measures” section of this MD&A for a detailed reconciliation of these measures to cost of sales.
(2)Sustaining capital expenditures exclude $0.4 million of investing activity cash outflows for Q1 2022, (Q1 2021: $0.6 million) related to investment capital incurred on the Timmins projects, as disclosed in the “Project Development Update” section of this MD&A.
Q1 2022 vs. Q1 2021
Production:
•Gold: 3% higher, reflecting higher mining rates and increased mill recoveries due to in-process inventory movements, partially offset by lower grades.
Cash Costs: increased $122 per ounce, primarily as a result of the lower grades and higher operating costs from Omicron, Inflationary and Supply Chain Cost Increases, increased ventilation and ground control needs at Bell Creek.
Sustaining Capital: higher than Q1 2021, due to increased mobile mine equipment refurbishment and replacements, and increased near-mine exploration, partially offset by lower tailings expansion expenditures.
AISC: the $128 per ounce increase reflects the same factors that affected Cash Costs.
| PAN AMERICAN SILVER CORP. | 13 | |||||||
| Management Discussion and Analysis | ||||
| For the three months ended March 31, 2022 and 2021 (tabular amounts are in thousands of U.S. dollars except number of shares, options, warrants, per share amounts, and per ounce amounts, unless otherwise noted) | |||||
Other Operations(1)
| Three months ended March 31, 2022 | Three months ended March 31, 2021 | |||||||||||||||||||
| Morococha | San Vicente | Manantial Espejo | Morococha | San Vicente | Manantial Espejo | |||||||||||||||
| Tonnes milled – kt | 100.5 | 75.1 | 134.7 | 149.2 | 89.0 | 157.3 | ||||||||||||||
| Average silver grade – grams per tonne | 112 | 222 | 234 | 121 | 265 | 157 | ||||||||||||||
| Average gold grade – grams per tonne | 1.55 | 1.30 | ||||||||||||||||||
| Average zinc grade - % | 3.12 | 2.16 | — | 2.88 | 2.58 | — | ||||||||||||||
| Average lead grade - % | 0.96 | 0.28 | — | 1.17 | 0.13 | — | ||||||||||||||
| Average copper grade - % | 0.60 | 0.21 | — | 0.38 | 0.24 | — | ||||||||||||||
| Production: | ||||||||||||||||||||
| Silver – koz | 324 | 476 | 903 | 521 | 701 | 697 | ||||||||||||||
| Gold – koz | 0.15 | 0.02 | 6.07 | 0.16 | 0.08 | 5.89 | ||||||||||||||
| Zinc – kt | 2.67 | 1.34 | — | 3.72 | 1.96 | — | ||||||||||||||
| Lead – kt | 0.73 | 0.19 | — | 1.43 | 0.11 | — | ||||||||||||||
| Copper – kt | 0.47 | 0.12 | — | 0.37 | 0.16 | — | ||||||||||||||
Cash Costs - $ per ounce(2) | 5.68 | 19.39 | 15.42 | 13.89 | 13.35 | 19.78 | ||||||||||||||
AISC - $ per ounce(2) | 7.08 | 23.94 | 18.38 | 17.47 | 14.20 | 24.43 | ||||||||||||||
(1)Production figures are for Pan American’s 92.3% share of Morococha and 95% share of San Vicente, respectively, unless otherwise noted. Morococha was placed on care and maintenance in February 2022.
(2)Cash Costs and AISC are non-GAAP measures. Please refer to the “Alternative Performance (Non-GAAP) Measures” section of this MD&A for a detailed reconciliation of these measures to cost of sales.
Q1 2022 vs. Q1 2021
Morococha: production reflects the operation being placed on care and maintenance in late February 2022 while we explore alternatives to optimize value given the requirement to move the processing facilities to allow for the expansion of a neighboring open pit mine.
San Vicente: mined grades continue to decrease from increasing dilution from the narrowing vein structures encountered as we mine deeper.
Manantial Espejo: the quarter-over-quarter production increase is due to higher tonnages and grades of ores mined at COSE and Joaquin. The Company expects to complete mining operations at COSE in the second quarter of 2022. This has been incorporated in the Company's 2022 guidance issued on February 23, 2022.
| PAN AMERICAN SILVER CORP. | 14 | |||||||
| Management Discussion and Analysis | ||||
| For the three months ended March 31, 2022 and 2021 (tabular amounts are in thousands of U.S. dollars except number of shares, options, warrants, per share amounts, and per ounce amounts, unless otherwise noted) | |||||
2022 ANNUAL OPERATING OUTLOOK
All 2022 forecast amounts in this section refer to the 2022 Operating Outlook, as provided in the Company's 2021 MD&A dated February 23, 2022. These estimates are forward-looking statements and information that are subject to the cautionary note associated with forward-looking statements and information at the end of this MD&A.
Production Relative to Forecast:
The following table summarizes the metal production during 2022 compared to the 2022 Operating Outlook:
| 2022 Operating Outlook | Q1 2022 | |||||||
| Silver – Moz | 19.00 - 20.50 | 4.62 | ||||||
Gold – koz | 550.0 - 605.0 | 131.0 | ||||||
| Zinc – kt | 35.0 - 40.0 | 10.2 | ||||||
| Lead – kt | 15.0 - 17.0 | 4.7 | ||||||
| Copper – kt | 5.5 - 6.5 | 1.8 | ||||||
Based on Q1 2022 production results and the expected production for the remainder of the year, Management reaffirms the 2022 Operating Outlook annual consolidated metal production, as shown in the table above.
Cash Costs and AISC Compared to Forecast:
The following table summarizes Cash Costs and AISC for each operation for 2022 compared to the respective 2022 Operating Outlook amounts. These forecast estimates are largely influenced by Management's assumptions and estimates for productivity, input costs, commodity prices and currency exchange rates.
Cash Costs(1) ($ per ounce) | AISC(1) ($ per ounce) | |||||||||||||
2022 Operating Outlook | Q1 2022 | 2022 Operating Outlook | Q1 2022 | |||||||||||
| Silver Segment: | ||||||||||||||
| La Colorada | 8.00 - 9.00 | 9.73 | 12.40 - 13.40 | 12.19 | ||||||||||
| Huaron | 1.80 - 4.50 | (1.16) | 7.80 - 9.90 | 3.49 | ||||||||||
| Morococha | n/a | 5.68 | n/a | 7.08 | ||||||||||
| San Vicente | 15.30 - 16.55 | 19.39 | 18.70 - 19.70 | 23.94 | ||||||||||
| Manantial Espejo | 21.00 - 24.00 | 15.42 | 22.00 - 24.80 | 18.38 | ||||||||||
Total | 10.70 - 12.20 | 10.23 | 14.50 - 16.00 | 13.41 | ||||||||||
| Gold Segment: | ||||||||||||||
| Dolores | 715 - 840 | 976 | 925 - 1,070 | 1,682 | ||||||||||
| Shahuindo | 910 - 995 | 915 | 1,170 - 1,275 | 1,152 | ||||||||||
| La Arena | 990 - 1,070 | 963 | 1,380 - 1,475 | 1,424 | ||||||||||
Timmins | 1,340 - 1,415 | 1,414 | 1,615 - 1,695 | 1,695 | ||||||||||
| Total | 970 - 1,070 | 1,069 | 1,240 - 1,365 | 1,502 | ||||||||||
(1)Cash Costs and AISC are non-GAAP measures. Please refer to the “Alternative Performance (Non-GAAP) Measures” section of this MD&A for a detailed description of these calculations and a reconciliation of these measures to the Q1 2022 Financial Statements.
(2)The cash costs and AISC forecasts assume realized metal prices for Q1 2022 and the following metal prices for the remainder of 2022: of $22.50/oz for silver, $3,000/tonne ($1.36/lb) for zinc, $2,200/tonne ($1.00/lb) for lead, $9,200/tonne ($4.17/lb) for copper, and $1,750/oz for gold; and average annual exchange rates relative to 1 USD of 20.00 for the Mexican peso ("MXN"), 4.10 for the Peruvian sol ("PEN"), 122.17 for the Argentine peso ("ARS"), 7.00 for the Bolivian boliviano ("BOB"), and $1.25 for the Canadian dollar ("CAD").
Based on Q1 2022 Cash Costs and AISC results, Management reaffirms the 2022 Operating Outlook for Cash Costs and AISC, as shown in the table above.
| PAN AMERICAN SILVER CORP. | 15 | |||||||
| Management Discussion and Analysis | ||||
| For the three months ended March 31, 2022 and 2021 (tabular amounts are in thousands of U.S. dollars except number of shares, options, warrants, per share amounts, and per ounce amounts, unless otherwise noted) | |||||
Capital Expenditures Relative to Forecast:
The following table summarizes the 2022 capital expenditures compared to the 2022 Operating Outlook:
| 2022 Capital Expenditures ($ millions) | ||||||||
2022 Operating Outlook | Q1 2022 | |||||||
| La Colorada | 28.0 - 29.0 | 3.9 | ||||||
| Huaron | 16.0 - 19.0 | 3.1 | ||||||
| Morococha | n/a | 0.3 | ||||||
| San Vicente | 7.0 - 8.0 | 2.9 | ||||||
| Manantial Espejo | 2.0 - 3.0 | 1.1 | ||||||
| Dolores | 33.0 - 34.0 | 14.4 | ||||||
| Shahuindo | 37.0 - 38.0 | 7.4 | ||||||
| La Arena | 39.0 - 40.0 | 13.0 | ||||||
Timmins | 38.0 - 39.0 | 9.9 | ||||||
Sustaining Capital Sub-total | 200.0 - 210.0 | 56.0 | ||||||
| La Colorada Skarn projects | 68.0 - 81.0 | 8.6 | ||||||
| Timmins projects | 12.0 - 14.0 | 0.4 | ||||||
| Other | n/a | 0.2 | ||||||
Project Capital Sub-total | 80.0 - 95.0 | 9.2 | ||||||
Total Capital | 280.0 - 305.0 | 65.2 | ||||||
Management reaffirms the 2022 Operating Outlook for sustaining and project capital, as shown in the table above.
PROJECT DEVELOPMENT UPDATE
The following table reflects the amounts spent on each of Pan American’s major projects in Q1 2022 compared with Q1 2021:
Project Development Capital | Three months ended March 31, | |||||||
| (thousands of USD) | ||||||||
| 2022 | 2021 | |||||||
La Colorada projects | 8,560 | 4,082 | ||||||
| Timmins projects | 401 | 644 | ||||||
Other projects | 163 | 225 | ||||||
| Total | $ | 9,124 | 4,951 | |||||
During Q1 2022, the Company invested $9.1 million, largely on exploration and development of the La Colorada Skarn project, including advancing construction of the new concrete-lined ventilation shaft and beginning commissioning of the refrigeration plant.
| PAN AMERICAN SILVER CORP. | 16 | |||||||
| Management Discussion and Analysis | ||||
| For the three months ended March 31, 2022 and 2021 (tabular amounts are in thousands of U.S. dollars except number of shares, options, warrants, per share amounts, and per ounce amounts, unless otherwise noted) | |||||
OVERVIEW OF Q1 2022 FINANCIAL RESULTS
Selected Annual and Quarterly Information
The following tables set out selected quarterly results for the past ten quarters as well as selected annual results for the past two years. The dominant factors affecting results in the quarters and years presented below are the volatility of realized metal prices and the timing of sales, which vary with the timing of shipments and impairment charges.
| 2022 | Quarter Ended | ||||
| (In thousands of USD, other than per share amounts) | March 31 | ||||
| Revenue | $ | 439,888 | |||
| Mine operating earnings | $ | 66,755 | |||
| Earnings for the period attributable to equity holders | $ | 76,517 | |||
| Basic (loss) earnings per share | $ | 0.36 | |||
| Diluted (loss) earnings per share | $ | 0.36 | |||
| Cash flow from operating activities | $ | 68,758 | |||
| Cash dividends paid per share | $ | 0.12 | |||
| Other financial information | |||||
| Total assets | $ | 3,540,297 | |||
Total long-term financial liabilities(1) | $ | 303,984 | |||
| Total attributable shareholders’ equity | $ | 2,683,201 | |||
(1)Total long-term financial liabilities are comprised of non-current liabilities excluding deferred tax liabilities, and deferred revenue.
| 2021 | Quarter Ended | Year Ended | |||||||||||||||
| (In thousands of USD, other than per share amounts) | Mar 31 | Jun 30 | Sep 30 | Dec 31 | Dec 31 | ||||||||||||
| Revenue | $ | 368,099 | $ | 382,132 | $ | 460,349 | $ | 422,170 | $ | 1,632,750 | |||||||
| Mine operating earnings | $ | 89,964 | $ | 103,048 | $ | 98,887 | $ | 76,039 | $ | 367,938 | |||||||
| (Loss) earnings for the period attributable to equity holders | $ | (7,798) | $ | 70,939 | $ | 20,251 | $ | 14,036 | $ | 97,428 | |||||||
| Basic (loss) earnings per share | $ | (0.04) | $ | 0.34 | $ | 0.10 | $ | 0.06 | $ | 0.46 | |||||||
| Diluted (loss) earnings per share | $ | (0.04) | $ | 0.34 | $ | 0.10 | $ | 0.06 | $ | 0.46 | |||||||
| Cash flow from operating activities | $ | 29,850 | $ | 87,143 | $ | 157,017 | $ | 118,098 | $ | 392,108 | |||||||
| Cash dividends paid per share | $ | 0.07 | $ | 0.07 | $ | 0.10 | $ | 0.10 | $ | 0.34 | |||||||
| Other financial information | |||||||||||||||||
| Total assets | $ | 3,518,584 | |||||||||||||||
Total long-term financial liabilities(1) | $ | 297,600 | |||||||||||||||
| Total attributable shareholders’ equity | $ | 2,631,554 | |||||||||||||||
(1)Total long-term financial liabilities are comprised of non-current liabilities excluding deferred tax liabilities, and deferred revenue.
| PAN AMERICAN SILVER CORP. | 17 | |||||||
| Management Discussion and Analysis | ||||
| For the three months ended March 31, 2022 and 2021 (tabular amounts are in thousands of U.S. dollars except number of shares, options, warrants, per share amounts, and per ounce amounts, unless otherwise noted) | |||||
| 2020 | Quarter Ended | Year Ended | |||||||||||||||
| (In thousands of USD, other than per share amounts) | Mar 31 | Jun 30 | Sep 30 | Dec 31 | Dec 31 | ||||||||||||
| Revenue | $ | 358,428 | $ | 249,509 | $ | 300,414 | $ | 430,461 | $ | 1,338,812 | |||||||
| Mine operating earnings | $ | 50,058 | $ | 48,386 | $ | 124,561 | $ | 137,172 | $ | 360,177 | |||||||
| (Loss) earnings for the period attributable to equity holders | $ | (76,807) | $ | 20,063 | $ | 65,741 | $ | 168,885 | $ | 177,882 | |||||||
| Basic (loss) earnings per share | $ | (0.37) | $ | 0.10 | $ | 0.31 | $ | 0.80 | $ | 0.85 | |||||||
| Diluted (loss) earnings per share | $ | (0.37) | $ | 0.10 | $ | 0.31 | $ | 0.80 | $ | 0.85 | |||||||
| Cash flow from operating activities | $ | 114,051 | $ | 62,750 | $ | 114,943 | $ | 170,571 | $ | 462,315 | |||||||
| Cash dividends paid per share | $ | 0.05 | $ | 0.05 | $ | 0.05 | $ | 0.07 | $ | 0.22 | |||||||
| Other financial information | |||||||||||||||||
| Total assets | $ | 3,433,875 | |||||||||||||||
Total long-term financial liabilities(1) | $ | 277,696 | |||||||||||||||
| Total attributable shareholders’ equity | $ | 2,602,519 | |||||||||||||||
(1)Total long-term financial liabilities are comprised of non-current liabilities excluding deferred tax liabilities, and deferred revenue.
| PAN AMERICAN SILVER CORP. | 18 | |||||||
| Management Discussion and Analysis | ||||
| For the three months ended March 31, 2022 and 2021 (tabular amounts are in thousands of U.S. dollars except number of shares, options, warrants, per share amounts, and per ounce amounts, unless otherwise noted) | |||||
Income Statement: Q1 2022 vs. Q1 2021
Net earnings of $76.8 million were recorded in Q1 2022 compared to a net loss of $7.6 million in Q1 2021, which corresponds to basic earnings per share of $0.36 and a loss of $0.04, respectively.
The following table highlights the differences between the Q1 2021 and Q1 2022 net earnings:
| Net loss, three months ended March 31, 2021 | $ | (7,562) | Note | ||||||||
| Revenue: | |||||||||||
| Increased realized metal prices | $ | 13,875 | |||||||||
| Higher quantities of metal sold | 51,649 | ||||||||||
| Decreased direct selling costs | 1,899 | ||||||||||
| Decreased negative settlement adjustments | 4,366 | ||||||||||
| Total increase in revenue | $ | 71,789 | (1) | ||||||||
| Cost of sales: | |||||||||||
| Increased production costs and decreased royalty charges | $ | (85,565) | (2) | ||||||||
| Increased depreciation and amortization | (9,433) | (3) | |||||||||
| Total increase in cost of sales | $ | (94,998) | |||||||||
| Increased gains and income from associates | 44,835 | (4) | |||||||||
| Decreased investment loss | 41,859 | (5) | |||||||||
| Decreased income tax expense | 26,537 | (6) | |||||||||
| Increased net gain on asset sales, and derivatives | 1,705 | ||||||||||
| Decreased other expense | 227 | ||||||||||
| Increased general and administrative expense | (2,841) | ||||||||||
| Increased care and maintenance costs | (2,402) | ||||||||||
| Increased interest and finance expense | (1,354) | ||||||||||
| Increased foreign exchange loss | (645) | ||||||||||
| Increased exploration and project development expense | (319) | ||||||||||
| Net earnings, three months ended March 31, 2022 | $ | 76,831 | |||||||||
(1)Revenue for Q1 2022 was $71.8 million higher than in Q1 2021, largely from increased quantities of metal sold and higher metal prices. The quarter-over-quarter increase in quantities of metal sold was driven mainly by silver and gold sales, with increases of 40% and 9%, respectively (see table below). These increases arose from a combination of the timing of sales and increased payable silver production, partially offset by lower payable gold production. The timing of sales relates to precious metals inventory draw-downs in Q1 2022 compared to build-ups in Q1 2021. The majority of the silver sales quantity variance reflects increased production and an inventory draw-down at La Colorada in Q1 2022 compared to a shipping delay-driven concentrate build up and lower production from ventilation constraints in Q1 2021. The increased quantities of gold sold was mainly attributable to the timing of sales at Dolores and La Arena, which resulted in inventory draw-downs in Q1 2022 compared to build-ups in Q1 2021, partially offset by the lower Gold Segment payable production, as described in the "Operating Performance" section of this MD&A.
In addition to the increase in quantities of metal sold were higher realized metal prices for all metals except silver, which decreased 9% from Q1 2021. Realized gold prices increased 5%, and realized prices for copper, zinc and lead increased 15%, 38%, and 15%, respectively (see realized prices in table below).
| PAN AMERICAN SILVER CORP. | 19 | |||||||
| Management Discussion and Analysis | ||||
| For the three months ended March 31, 2022 and 2021 (tabular amounts are in thousands of U.S. dollars except number of shares, options, warrants, per share amounts, and per ounce amounts, unless otherwise noted) | |||||
The following table reflects the metal prices realized by the Company and the quantities of metal sold during each quarter:
Realized Metal Prices (1) | Quantities of Metal Sold (2) | |||||||||||||
| Three months ended March 31, | Three months ended March 31, | |||||||||||||
| 2022 | 2021 | 2022 | 2021 | |||||||||||
Silver | $ | 24.03 | $ | 26.41 | 4,890 | 3,490 | ||||||||
Gold | $ | 1,880 | $ | 1,788 | 148.1 | 136.0 | ||||||||
Zinc | $ | 3,792 | $ | 2,756 | 7.9 | 11.1 | ||||||||
Lead | $ | 2,341 | $ | 2,036 | 4.9 | 3.9 | ||||||||
Copper | $ | 9,767 | $ | 8,515 | 1.7 | 1.8 | ||||||||
(1)Metal price stated as dollars per ounce for silver and gold, and dollars per tonne for zinc, lead and copper, inclusive of final settlement adjustments on concentrate sales.
(2)Metal quantities stated as koz for silver and gold and kt for zinc, lead and copper.
(2)Production and royalty costs in Q1 2022 were $85.6 million higher than in Q1 2021. The increase was driven by an $85.6 million, or 44%, increase in production costs. The increased production costs were largely driven by the previously discussed quarter-over-quarter increase in quantities of gold and silver sold and NRV inventory adjustments, as well as Omicron, Inflationary and Supply Chain Cost Increases. Excluding the impact of NRV inventory adjustments, Gold Segment production costs increased by $39.5 million from higher costs at all operations, driven by the 12.0 thousand ounce, or 9%, increase in quantities of gold sold and increased operating costs, including Omicron, Inflationary and Supply Chain Cost Increases, as further described for each operation in the" Operating Performance" section of this MD&A. Silver Segment production costs, excluding the impact of NRV inventory adjustments, increased by $17.1 million, from a $20.1 million increase in costs at La Colorada from the increase in production and sales volumes in Q1 2022 compared to Q1 2021.
Additionally, there was a $22.6 million quarter-over-quarter cost increase from NRV inventory adjustments, which increased costs by $14.4 million in Q1 2022 compared to a $8.1 million decrease to costs in Q1 2021. NRV inventory adjustments in both quarters were related mainly to Dolores and were driven largely by inflationary pressures.
(3)Depreciation and amortization ("D&A") expense was $9.4 million higher than in Q1 2021. The increase was largely from higher sales volumes, which is predominantly recorded on a units-of-production basis, and mainly from higher quantities of gold sold at Dolores and silver sold at La Colorada. Annual changes to depreciation rates in late 2021, primarily those relating to open pit operations, are also reflected in the quarter-over-quarter increase.
(4)Gains and income from associates in Q1 2022 was $45.0 million compared to $0.2 million in Q1 2021, representing a $44.8 million increase. The income in Q1 2022 primarily reflects a $44.6 million fair-value adjustment gain that was recognized due to a change in accounting treatment for the Company's investment in Maverix. Management determined that, as of March 31, 2022, the Company no longer held significant influence over Maverix due to declining to exercise its right to nominate a representative to serve as a director on Maverix’s Board of Directors to replace its previous representative who had retired, and accordingly the Company no longer has the power to participate in the financial and operating policy decisions of Maverix. As a result, the Company's investment in Maverix was redesignated from "Investment in Associate", accounted using the "equity method" whereby the Company recorded into income its ownership proportion of Maverix's estimated earnings, to a "long-term financial asset", which will be recorded at fair value going forward. The Q1 2021 gains and income from associates represented income recorded under the equity-method, with no such accounting treatment change related to valuation gain.
(5)Investment income of $2.8 million in Q1 2022 was a $41.9 million positive change relative to investment losses of $39.0 million in Q1 2021, both driven primarily by fair value mark-to-market adjustments on the Company's equity investment in New Pacific Metals Corp.
| PAN AMERICAN SILVER CORP. | 20 | |||||||
| Management Discussion and Analysis | ||||
| For the three months ended March 31, 2022 and 2021 (tabular amounts are in thousands of U.S. dollars except number of shares, options, warrants, per share amounts, and per ounce amounts, unless otherwise noted) | |||||
(6)Income tax expense in Q1 2022 was $11.4 million compared to $38.0 million in Q1 2021. The $26.5 million decrease in tax expense is due primarily to the appreciation of the PEN on Peruvian tax attributes in Q1 2022 compared to devaluation of the PEN and MXN, respectively, on Peruvian and Mexican tax attributes in Q1 2021.
Statement of Cash Flows: Q1 2022 vs. Q1 2021
Cash flow from operations in Q1 2022 totaled $68.8 million, $38.9 million more than the $29.9 million generated in Q1 2021. The increase was primarily driven from less cash used in working capital changes, increased cash mine operating earnings and decreased income tax cash payments.
Working capital changes in Q1 2022 resulted in a $15.1 million use of cash compared with a $47.4 million use of cash in Q1 2021. The Q1 2022 use of cash was mainly driven by a $12.4 million build-up in trade and other receivable balances, an $11.7 million net pay-down in accounts payable and accrued liability balances, partially offset by a $10.3 million reduction in inventories. The Q1 2021 use of cash was mainly driven by a $39.9 million build-up in inventories, largely the result of the delay in transporting concentrate inventories from La Colorada, and a $6.4 million decrease in accounts payables.
Investing activities used $51.1 million in Q1 2022, primarily related to the $61.5 million spent on mineral properties, plant and equipment ("MPP&E") at the Company’s mines and projects, as previously described in the “Operating Performance” section of this MD&A, which was partially offset by $7.7 million in MPP&E related proceeds, which largely reflect a $7.0 million payment from an arm's length party to be applied to costs associated with the closure and reclamation of the Morococha mine processing facility, and $2.0 million in proceeds from the settlement of the Company's derivatives comprised of commodity and FX hedging contracts. In Q1 2021, investing activities used $44.5 million, primarily from the $48.0 million spent on mineral properties, plant and equipment, which offset $0.3 million in proceeds from the sale of short-term investments.
Financing activities in Q1 2022 used $29.2 million compared to $18.0 million used in Q1 2021. Cash used in Q1 2022 primarily consisted of $25.3 million in dividends and $3.4 million of lease repayments. The net cash used in Q1 2021 consisted primarily of $14.7 million paid as dividends to shareholders and $3.0 million of lease payments. The increase in dividend payments reflects the Company's new dividend policy announced on February 24, 2022, as described in the Annual Information Form published on February 23, 2022.
Adjusted Earnings: Q1 2022 vs Q1 2021
Adjusted earnings is a non-GAAP measure. Please refer to the “Alternative Performance (Non-GAAP) Measures” section of this MD&A for a detailed description of “adjusted earnings”, and a reconciliation of these measures to the Q1 2022 Financial Statements.
Adjusted Earnings in Q1 2022 was $32.0 million, representing basic adjusted earnings per share of $0.15, compared to Q1 2021 adjusted earnings of $37.4 million, and basic adjusted earnings per share of $0.18. A reconciliation of adjusted earnings for the three months ended March 31, 2022 and 2021, to the net earnings for each period is included in the “Alternative Performance (Non-GAAP) Measures” section of this MD&A.
| PAN AMERICAN SILVER CORP. | 21 | |||||||
| Management Discussion and Analysis | ||||
| For the three months ended March 31, 2022 and 2021 (tabular amounts are in thousands of U.S. dollars except number of shares, options, warrants, per share amounts, and per ounce amounts, unless otherwise noted) | |||||
The following chart illustrates the key factors leading to the change in adjusted earnings from Q1 2021 to Q1 2022: 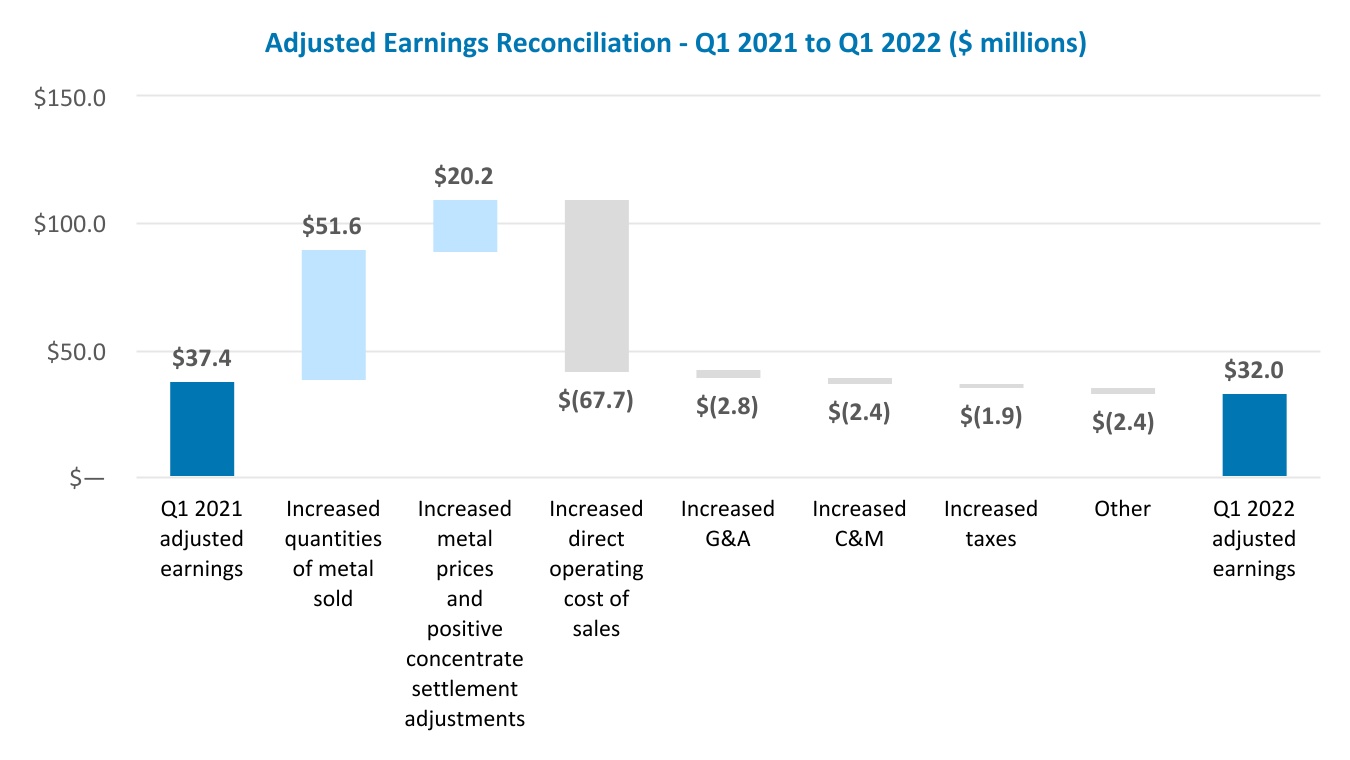
LIQUIDITY AND CAPITAL POSITION
| Liquidity and Capital Measures (in $000s) | March 31, 2022 | Dec. 31, 2021 | Q1 2022 Change | ||||||||
| Cash and cash equivalents ("Cash") | $ | 271,876 | $ | 283,550 | $ | (11,674) | |||||
| Short-term Investments | $ | 54,410 | $ | 51,723 | $ | 2,687 | |||||
| Cash and Short-term investments | $ | 326,286 | $ | 335,273 | $ | (8,987) | |||||
| Working Capital | $ | 620,663 | $ | 613,494 | $ | 7,169 | |||||
| Credit Facility committed amount | $ | 500,000 | $ | 500,000 | $ | — | |||||
| Credit Facility amounts drawn | $ | — | $ | — | $ | — | |||||
| Shareholders' equity | $ | 2,683,201 | $ | 2,631,554 | $ | 51,647 | |||||
Total debt (1) | $ | 47,046 | $ | 45,861 | $ | 1,185 | |||||
Capital (1) | $ | 2,403,961 | $ | 2,342,142 | $ | 61,819 | |||||
(1)Total debt is a non-GAAP measure calculated as the total of amounts drawn on the Sustainability-Linked Credit Facility, finance lease liabilities and loans payable. Capital is a non-GAAP measure and consists of shareholders’ equity and debt net of cash and cash equivalents and short term investments. Please refer to the “Alternative Performance (Non-GAAP) Measures” section of this MD&A for a detailed description of the calculations.
Liquidity and Capital Resources
The Company's cash and short term investments decreased by $9.0 million during Q1 2022. The decrease was driven by an $11.7 million decrease in cash and cash equivalents from the previously described increase in MPP&E additions and higher dividend payments, partially offset by increased operating cash flows from cash mine operating earnings. Cash mine operating earnings of $165.7 million in Q1 2022 was higher than the $156.9 million generated in Q1 2021 and was sufficient to fund corporate overhead, exploration and care and maintenance expenses, tax payments, and investing and financing activities, which mostly related to payments for property, plant and equipment.
| PAN AMERICAN SILVER CORP. | 22 | |||||||
| Management Discussion and Analysis | ||||
| For the three months ended March 31, 2022 and 2021 (tabular amounts are in thousands of U.S. dollars except number of shares, options, warrants, per share amounts, and per ounce amounts, unless otherwise noted) | |||||
Pan American’s investment objectives for its cash balances are to preserve capital, to provide liquidity and to maximize returns. The Company’s strategy to achieve these objectives is to invest excess cash balances in a portfolio of primarily fixed income instruments with specified credit rating targets established by the Board of Directors, and by diversifying the currencies in which it maintains its cash balances. The Company does not own any asset-backed commercial paper or other similar, known, at-risk investments in its investment portfolio.
Working capital of $620.7 million at March 31, 2022 was $7.2 million higher than working capital of $613.5 million at December 31, 2021. The Company also maintains a long term investment in Maverix that was valued at $124.7 million at March 31, 2022.
As of March 31, 2022, the Company was in compliance with all financial covenants under the $500 million revolving Sustainability-Linked Credit Facility, which was undrawn. The borrowing costs under the Company's Sustainability-Linked Credit Facility are based on the Company's leverage ratio subject to pricing adjustments based on the Company's sustainability performance ratings and scores at either (i) LIBOR plus 1.825% to 2.80% or; (ii) The Bank of Nova Scotia's Base Rate on U.S. dollar denominated commercial loans plus 0.825% to 1.80%. Undrawn amounts under the Sustainability-Linked Credit Facility are subject to a stand-by fee of 0.41% to 0.63% per annum, dependent on the Company's leverage ratio and subject to pricing adjustments based on sustainability performance ratings and scores. The Company's Sustainability-Linked Credit Facility matures on August 8, 2025.
The net cash generated from the sales of metal production provides our primary source of cash flows, and we do not currently expect to experience payment delinquencies from our metal sales counterparties during the COVID-19 pandemic, though the impact of COVID-19 on the credit risk associated with our counterparties cannot be determined with any degree of certainty.
The Company’s financial position at March 31, 2022, and the operating cash flows that are expected over the next 12 months, lead Management to believe that the Company’s liquid assets are sufficient to satisfy our 2022 working capital requirements, fund currently planned capital expenditures, and to discharge liabilities as they come due. The Company remains well positioned to take advantage of strategic opportunities as they become available. Liquidity risks are discussed further in the “Risks and Uncertainties” section of this MD&A.
In the normal course of business, the Company enters into contracts that give rise to commitments for future minimum payments, details of which are described in Note 8(e)(ii) of the 2021 Annual Financial Statements, and in the "Liquidity and Capital Position" section of the Company's annual 2021 Management Discussion and Analysis (the "2021 Annual MD&A"). Since December 31, 2021, there have been no significant changes to these contractual obligations and commitments.
The impact of inflation on the Company’s financial position, operational performance, or cash flows over the next 12 months cannot be determined with any degree of certainty due to a number of uncertainties, including those related to the COVID-19 pandemic.
Outstanding Share Amounts
As at March 31, 2022, the Company had approximately 0.2 million stock options outstanding (each exercisable for one common share of the Company), with exercise prices in the range of CAD $9.76 to CAD $39.48 and a weighted average life of 3.9 years. Approximately 0.2 million of the stock options were vested and exercisable at March 31, 2022, with an average weighted exercise price of CAD $18.85 per share.
The following table sets out the common shares and options outstanding as at the date of this MD&A:
| Outstanding as at May 11, 2022 | |||||
| Common shares | 210,511,219 | ||||
| Options | 220,984 | ||||
| Total | 210,732,203 | ||||
As part of the acquisition of Tahoe Resources Inc. on February 22, 2019, the Company issued 313,887,490 Contingent Value Rights ("CVRs"), with a term of 10 years, which are convertible into 15,600,208 common shares
| PAN AMERICAN SILVER CORP. | 23 | |||||||
| Management Discussion and Analysis | ||||
| For the three months ended March 31, 2022 and 2021 (tabular amounts are in thousands of U.S. dollars except number of shares, options, warrants, per share amounts, and per ounce amounts, unless otherwise noted) | |||||
upon the first commercial shipment of concentrate following the restart of operations at the Escobal mine. As of March 31, 2022, there were 313,883,990 CVRs outstanding which were convertible into 15,600,034 common shares.
CLOSURE AND DECOMMISSIONING COST PROVISION
The estimated future closure and decommissioning costs are based principally on the requirements of relevant authorities and the Company’s environmental policies. The provision is measured using management’s assumptions and estimates for future cash outflows. The Company accrues these costs, which are determined by discounting costs using rates specific to the underlying obligation. Upon recognition of a liability for the closure and decommissioning costs, the Company capitalizes these costs to the related mine and amortizes such amounts over the life of each mine on a unit-of-production basis except in the case of exploration projects for which the offset to the liability is expensed. The accretion of the discount due to the passage of time is recognized as an increase in the liability and a finance expense.
The total inflated and undiscounted amount of estimated cash flows required to settle the Company’s estimated future closure and decommissioning costs as of March 31, 2022 was $451.7 million (December 31, 2021 - $413.0 million) using inflation rates of between 1% and 6% (December 31, 2021 - between 1% and 5%). The inflated and discounted provision on the statement of financial position as at March 31, 2022 was $252.8 million (December 31, 2021 - $242.9 million), using discount rates between 2% and 10% (December 31, 2021 - between 1% and 9%). Spending with respect to decommissioning obligations at Alamo Dorado and Manantial Espejo began in 2016, while the remainder of the obligations are expected to be paid through 2047, or later if the mine lives are extended. Revisions made to the reclamation obligations in Q1 2022 were primarily a result of increased inflation rates, increased discount rates from higher government debt yields, increased site disturbance from the ordinary course of operations at the mines, reclamation activities, and revisions to the estimates based on periodic reviews of closure plans and related costs, actual expenditures incurred, and closure activities completed. These obligations will be funded from operating cash flows, reclamation deposits, and cash on hand.
The accretion of the discount charged in Q1 2022 as finance expense was $3.7 million (Q1 2021 - $1.9 million). Reclamation expenditures incurred during Q1 2022 were $1.0 million (Q1 2021 $0.8 million).
RELATED PARTY TRANSACTIONS
The Company’s related parties include its subsidiaries, associates over which it exercises significant influence, and key management personnel. Transactions with the Company's subsidiaries have been eliminated on consolidation. Maverix remained a related party until March 31, 2022. There were no other related party transactions for the three months ended March 31, 2022 and 2021.
ALTERNATIVE PERFORMANCE (NON-GAAP) MEASURES
Per Ounce Measures
Cash Costs and AISC are non-GAAP financial measures that do not have any standardized meaning prescribed by IFRS and are therefore unlikely to be comparable to similar measures presented by other companies.
Pan American produces by-product metals incidentally to our silver and gold mining activities. We have adopted the practice of calculating a performance measure with the net cost of producing an ounce of silver and gold, our primary payable metals, after deducting revenues gained from incidental by-product production. This performance measurement has been commonly used in the mining industry for many years and was developed as a relatively simple way of comparing the net production costs of the primary metal for a specific period against the prevailing market price of that metal.
Silver segment Cash Costs and AISC are calculated net of credits for realized revenues from all metals other than silver ("silver segment by-product credits"), and are calculated per ounce of silver sold. Gold segment Cash Costs
| PAN AMERICAN SILVER CORP. | 24 | |||||||
| Management Discussion and Analysis | ||||
| For the three months ended March 31, 2022 and 2021 (tabular amounts are in thousands of U.S. dollars except number of shares, options, warrants, per share amounts, and per ounce amounts, unless otherwise noted) | |||||
and AISC are calculated net of credits for realized silver revenues ("gold segment by-product credits"), and are calculated per ounce of gold sold.
Cash costs per ounce metrics, net of by-product credits, is used extensively in our internal decision making processes. We believe the metric is also useful to investors because it facilitates comparison, on a mine-by-mine basis, notwithstanding the unique mix of incidental by-product production at each mine, of our operations’ relative performance on a period-by-period basis, and against the operations of our peers in the silver industry. Cash costs per ounce is conceptually understood and widely reported in the mining industry.
We believe that AISC, also calculated net of by-products, is a comprehensive measure of the full cost of operating our consolidated business, given it includes the cost of replacing silver and gold ounces through exploration, the cost of ongoing capital investments (sustaining capital), as well as other items that affect the Company’s consolidated cash flow.
To facilitate a better understanding of these measure as calculated by the Company, the following table provides the detailed reconciliation of these measure to the applicable cost items, as reported in the consolidated financial statements for the respective periods.
| PAN AMERICAN SILVER CORP. | 25 | |||||||
| Management Discussion and Analysis | ||||
| For the three months ended March 31, 2022 and 2021 (tabular amounts are in thousands of U.S. dollars except number of shares, options, warrants, per share amounts, and per ounce amounts, unless otherwise noted) | |||||
| Silver Segment | Gold Segment | |||||||||||||
| (In thousands of USD, except as noted) | March 31, 2022 | March 31, 2021 | March 31, 2022 | March 31, 2021 | ||||||||||
Production costs(1) | $ | 97,589 | $ | 80,601 | $ | 174,383 | $ | 112,580 | ||||||
| Purchase Price Allocation Inventory Fair Value Adjustment | — | — | — | (327) | ||||||||||
| NRV inventory adjustments | (1,353) | (1,441) | (13,090) | 9,585 | ||||||||||
| On-site direct operating costs | 96,236 | 79,159 | 161,293 | 121,837 | ||||||||||
| Royalties | 4,665 | 5,779 | 5,114 | 4,083 | ||||||||||
Smelting, refining and direct selling charges(2) | 16,270 | 18,154 | 35 | 50 | ||||||||||
Cash cost of sales before by-product credits | 117,171 | 103,093 | 166,442 | 125,969 | ||||||||||
Silver segment by-product credits(2) | (74,251) | (68,530) | — | — | ||||||||||
Gold segment by-product credits(2) | — | — | (17,003) | (17,869) | ||||||||||
Cash Costs | $ | 42,920 | $ | 34,563 | $ | 149,439 | $ | 108,100 | ||||||
| NRV inventory adjustments | 1,353 | 1,441 | 13,090 | (9,585) | ||||||||||
Sustaining capital | 11,340 | 10,669 | 44,616 | 34,541 | ||||||||||
Exploration and project development(3) | — | 566 | — | 1,003 | ||||||||||
Reclamation cost accretion(4) | 650 | 504 | 2,812 | 1,129 | ||||||||||
All-in sustaining costs | $ | 56,263 | $ | 47,744 | $ | 209,957 | $ | 135,189 | ||||||
| Silver segment silver ounces sold (koz) | 4,197 | 2,810 | — | — | ||||||||||
| Gold segment gold ounces sold (koz) | — | — | 140 | 128 | ||||||||||
Cash costs per ounce sold | $ | 10.23 | $ | 12.30 | $ | 1,069 | $ | 846 | ||||||
| AISC per ounce sold | $ | 13.41 | $ | 16.99 | $ | 1,502 | $ | 1,058 | ||||||
| AISC per ounce sold (excluding NRV inventory adjustments) | $ | 13.08 | $ | 16.48 | $ | 1,409 | $ | 1,133 | ||||||
(1)Silver Segment production costs for Q1 2022 excludes $6.9 million relating to mine operation severance payments and accruals at Morococha.
(2)Included in the revenue line of the consolidated income statements. By-product credits are reflective of realized metal prices for the applicable periods.
(3)Exploration and project development expenditures exclude $2.8 million of exploration expenditures related to non-operating properties for Q1 2022.
(4)Reclamation cost accretion excludes $0.2 million of accretion related to non-operating properties for Q1 2022 (Q1 2021: $0.2 million).
| PAN AMERICAN SILVER CORP. | 26 | |||||||
| Management Discussion and Analysis | ||||
| For the three months ended March 31, 2022 and 2021 (tabular amounts are in thousands of U.S. dollars except number of shares, options, warrants, per share amounts, and per ounce amounts, unless otherwise noted) | |||||
Sustaining capital is included in AISC, while capital related to growth projects or acquisitions (referred to by the Company as project or investment capital) is not. Inclusion of only sustaining capital in the AISC measure reflects the capital costs associated with current ounces sold as opposed to project capital, which is expected to increase future production. The project capital excluded in the reconciliation below is further described in the "Project Development Update" section of this MD&A.
| Reconciliation of payments for mineral properties, plant and equipment and sustaining capital | Three months ended March 31, | |||||||
| (in thousands of USD) | 2022 | 2021 | ||||||
Payments for mineral properties, plant and equipment(1) | $ | 61,453 | $ | 47,971 | ||||
| Add/(Subtract) | ||||||||
Lease Payments(1) | 3,419 | 2,982 | ||||||
Repayment of loans(2) | 850 | — | ||||||
| Investment (non-sustaining) capital | (9,765) | (5,743) | ||||||
Sustaining Capital | $ | 55,957 | $ | 45,210 | ||||
(1)As presented on the consolidated statements of cash flows.
(2)As presented on the consolidated statements of cash flows. Related to repayments of construction loans for leach pad expansions in Peru.
| PAN AMERICAN SILVER CORP. | 27 | |||||||
| Management Discussion and Analysis | ||||
| For the three months ended March 31, 2022 and 2021 (tabular amounts are in thousands of U.S. dollars except number of shares, options, warrants, per share amounts, and per ounce amounts, unless otherwise noted) | |||||
Silver Segment Cash Costs and AISC by mine:
| SILVER SEGMENT | Three months ended March 31, 2022 | |||||||||||||||||||
| (In thousands of USD, except as noted) | La Colorada | Huaron | Morococha | San Vicente | Manantial Espejo | Consolidated Silver Segment | ||||||||||||||
| Production Costs | $ | 24,162 | $ | 22,876 | $ | 15,325 | $ | 9,656 | $ | 25,570 | $ | 97,589 | ||||||||
| NRV inventory adjustments | — | — | — | — | (1,353) | (1,353) | ||||||||||||||
| On-site direct operating costs | 24,162 | 22,876 | 15,325 | 9,656 | 24,217 | 96,236 | ||||||||||||||
| Royalties | 301 | — | — | 3,185 | 1,179 | 4,665 | ||||||||||||||
| Smelting, refining & direct selling costs | 3,451 | 5,949 | 3,575 | 1,251 | 2,044 | 16,270 | ||||||||||||||
Cash Costs before by-product credits | 27,914 | 28,824 | 18,900 | 14,092 | 27,441 | 117,171 | ||||||||||||||
| Silver segment by-product credits | (12,143) | (29,656) | (17,005) | (1,362) | (14,085) | (74,251) | ||||||||||||||
| Cash Costs | $ | 15,771 | $ | (832) | $ | 1,895 | $ | 12,730 | $ | 13,355 | $ | 42,920 | ||||||||
| NRV inventory adjustments | — | — | — | — | 1,353 | 1,353 | ||||||||||||||
| Sustaining capital | 3,855 | 3,149 | 345 | 2,901 | 1,089 | 11,340 | ||||||||||||||
| Exploration and project development | — | — | — | — | — | — | ||||||||||||||
| Reclamation cost accretion | 127 | 199 | 122 | 80 | 122 | 650 | ||||||||||||||
All-in sustaining costs | $ | 19,754 | $ | 2,516 | $ | 2,363 | $ | 15,712 | $ | 15,919 | $ | 56,263 | ||||||||
| Silver segment silver ounces sold (koz) | 1,620 | 720 | 334 | 656 | 866 | 4,197 | ||||||||||||||
| Cash cost per ounce sold | $ | 9.73 | $ | (1.16) | $ | 5.68 | $ | 19.39 | $ | 15.42 | $ | 10.23 | ||||||||
| AISC per ounce sold | $ | 12.19 | $ | 3.49 | $ | 7.08 | $ | 23.94 | $ | 18.38 | $ | 13.41 | ||||||||
| AISC per ounce sold (excluding NRV inventory adjustments) | $ | 12.19 | $ | 3.49 | $ | 7.08 | $ | 23.94 | $ | 16.81 | $ | 13.08 | ||||||||
| SILVER SEGMENT | Three months ended March 31, 2021 | |||||||||||||||||||
| (In thousands of USD, except as noted) | La Colorada | Huaron | Morococha | San Vicente | Manantial Espejo | Consolidated Silver Segment | ||||||||||||||
| Production Costs | $ | 4,089 | $ | 21,732 | $ | 18,165 | $ | 10,820 | $ | 25,795 | $ | 80,601 | ||||||||
| NRV inventory adjustments | — | — | — | — | (1,441) | (1,441) | ||||||||||||||
| On-site direct operating costs | 4,089 | 21,732 | 18,165 | 10,820 | 24,354 | 79,159 | ||||||||||||||
| Royalties | 114 | (25) | — | 5,089 | 601 | 5,779 | ||||||||||||||
| Smelting, refining & direct selling costs | 207 | 6,390 | 5,045 | 4,590 | 1,923 | 18,154 | ||||||||||||||
Cash Costs before by-product credits | 4,410 | 28,096 | 23,209 | 20,499 | 26,878 | 103,093 | ||||||||||||||
| Silver segment by-product credits | (894) | (26,431) | (16,068) | (10,730) | (14,407) | (68,530) | ||||||||||||||
Cash Costs | $ | 3,516 | $ | 1,666 | $ | 7,141 | $ | 9,769 | $ | 12,471 | $ | 34,563 | ||||||||
| NRV inventory adjustments | — | — | — | — | 1,441 | 1,441 | ||||||||||||||
| Sustaining capital | 5,386 | 1,612 | 1,735 | 558 | 1,378 | 10,669 | ||||||||||||||
| Exploration and project development | 540 | — | 27 | — | — | 566 | ||||||||||||||
| Reclamation cost accretion | 113 | 139 | 75 | 65 | 112 | 504 | ||||||||||||||
All-in sustaining costs | $ | 9,555 | $ | 3,417 | $ | 8,977 | $ | 10,392 | $ | 15,403 | $ | 47,744 | ||||||||
| Silver segment silver ounces sold (koz) | 225 | 709 | 514 | 732 | 631 | 2,810 | ||||||||||||||
Cash cost per ounce sold | $ | 15.62 | $ | 2.35 | $ | 13.89 | $ | 13.35 | $ | 19.78 | $ | 12.30 | ||||||||
| AISC per ounce sold | $ | 42.44 | $ | 4.82 | $ | 17.47 | $ | 14.20 | $ | 24.43 | $ | 16.99 | ||||||||
| AISC per ounce sold (excluding NRV inventory adjustments) | $ | 42.44 | $ | 4.82 | $ | 17.47 | $ | 14.20 | $ | 22.14 | $ | 16.48 | ||||||||
| PAN AMERICAN SILVER CORP. | 28 | |||||||
| Management Discussion and Analysis | ||||
| For the three months ended March 31, 2022 and 2021 (tabular amounts are in thousands of U.S. dollars except number of shares, options, warrants, per share amounts, and per ounce amounts, unless otherwise noted) | |||||
Gold Segment Cash Costs and AISC by mine:
| GOLD SEGMENT | Three months ended March 31, 2022 | ||||||||||||||||
| (In thousands of USD, except as noted) | Dolores | Shahuindo | La Arena | Timmins | Consolidated Gold Segment | ||||||||||||
| Production Costs | $ | 64,259 | $ | 33,045 | $ | 28,836 | $ | 48,243 | $ | 174,383 | |||||||
| Purchase Price Allocation Inventory Fair Value Adjustment | — | — | — | — | — | ||||||||||||
| NRV inventory adjustments | (13,090) | — | — | — | (13,090) | ||||||||||||
| On-site direct operating costs | 51,169 | 33,045 | 28,836 | 48,243 | 161,293 | ||||||||||||
| Royalties | 3,249 | — | — | 1,865 | 5,114 | ||||||||||||
| Smelting, refining & direct selling costs | 6 | — | — | 29 | 35 | ||||||||||||
Cash Costs before by-product credits | 54,424 | 33,045 | 28,836 | 50,137 | 166,442 | ||||||||||||
| Gold segment by-product credits | (14,570) | (2,104) | (240) | (89) | (17,003) | ||||||||||||
| Cash Costs of Sales | $ | 39,854 | $ | 30,941 | $ | 28,596 | $ | 50,049 | $ | 149,439 | |||||||
| NRV inventory adjustments | 13,090 | — | — | — | 13,090 | ||||||||||||
| Sustaining capital | 14,353 | 7,381 | 12,959 | 9,924 | 44,616 | ||||||||||||
| Exploration and project development | — | — | — | — | — | ||||||||||||
| Reclamation cost accretion | 1,382 | 645 | 741 | 43 | 2,812 | ||||||||||||
All-in sustaining costs | $ | 68,678 | $ | 38,967 | $ | 42,296 | $ | 60,016 | $ | 209,957 | |||||||
| Gold segment gold ounces sold | 40,842 | 33,828 | 29,693 | 35,400 | 139,762 | ||||||||||||
| Cash cost per ounce sold | $ | 976 | $ | 915 | $ | 963 | $ | 1,414 | $ | 1,069 | |||||||
| AISC per ounce sold | $ | 1,682 | $ | 1,152 | $ | 1,424 | $ | 1,695 | $ | 1,502 | |||||||
| AISC per ounce sold (excluding NRV inventory adjustments) | $ | 1,361 | $ | 1,152 | $ | 1,424 | $ | 1,695 | $ | 1,409 | |||||||
| GOLD SEGMENT | Three months ended March 31, 2021 | ||||||||||||||||
| (In thousands of USD, except as noted) | Dolores | Shahuindo | La Arena | Timmins | Consolidated Gold Segment | ||||||||||||
| Production Costs | $ | 26,330 | $ | 25,772 | $ | 19,063 | $ | 41,415 | $ | 112,580 | |||||||
| Purchase Price Allocation Inventory Fair Value Adjustment | — | (322) | (6) | — | (327) | ||||||||||||
| NRV inventory adjustments | 9,585 | — | — | — | 9,585 | ||||||||||||
| On-site direct operating costs | 35,914 | 25,450 | 19,057 | 41,415 | 121,837 | ||||||||||||
| Royalties | 2,510 | — | — | 1,573 | 4,083 | ||||||||||||
| Smelting, refining & direct selling costs | 12 | — | — | 37 | 50 | ||||||||||||
Cash Costs before by-product credits | 38,437 | 25,450 | 19,057 | 43,025 | 125,969 | ||||||||||||
| Gold segment by-product credits | (15,828) | (1,615) | (305) | (122) | (17,869) | ||||||||||||
| Cash Costs of Sales | $ | 22,608 | $ | 23,836 | $ | 18,753 | $ | 42,904 | $ | 108,100 | |||||||
| NRV inventory adjustments | (9,585) | — | — | — | (9,585) | ||||||||||||
| Sustaining capital | 8,919 | 2,681 | 14,719 | 8,222 | 34,541 | ||||||||||||
| Exploration and project development | 99 | — | — | 904 | 1,003 | ||||||||||||
| Reclamation cost accretion | 701 | 263 | 150 | 15 | 1,129 | ||||||||||||
All-in sustaining costs | $ | 22,743 | $ | 26,780 | $ | 33,621 | $ | 52,045 | $ | 135,189 | |||||||
| Gold segment gold ounces sold | 31,478 | 31,736 | 31,351 | 33,200 | 127,764 | ||||||||||||
| Cash cost per ounce sold | $ | 718 | $ | 751 | $ | 598 | $ | 1,292 | $ | 846 | |||||||
| AISC per ounce sold | $ | 723 | $ | 844 | $ | 1,072 | $ | 1,568 | $ | 1,058 | |||||||
| AISC per ounce sold (excluding NRV inventory adjustments) | $ | 1,027 | $ | 844 | $ | 1,072 | $ | 1,568 | $ | 1,133 | |||||||
| PAN AMERICAN SILVER CORP. | 29 | |||||||
| Management Discussion and Analysis | ||||
| For the three months ended March 31, 2022 and 2021 (tabular amounts are in thousands of U.S. dollars except number of shares, options, warrants, per share amounts, and per ounce amounts, unless otherwise noted) | |||||
Adjusted Earnings
Adjusted earnings and basic adjusted earnings per share are non-GAAP measures that the Company considers to better reflect normalized earnings because it eliminates items that in management's judgment are subject to volatility as a result of factors that are unrelated to operations in the period, and/or relate to items that will settle in future periods. Certain items that become applicable in a period may be adjusted for, with the Company retroactively presenting comparable periods with an adjustment for such items and conversely, items no longer applicable may be removed from the calculation. The Company adjusts certain items in the periods that they occurred, but does not reverse or otherwise unwind the effect of such items in future periods. Neither adjusted earnings nor basic adjusted earnings per share have any standardized meaning prescribed by GAAP and are therefore unlikely to be comparable to similar measures presented by other companies.
The following table shows a reconciliation of adjusted earnings for the three months ended March 31, 2022 and 2021, to the net earnings for each period.
| Three months ended March 31, | ||||||||
| (In thousands of USD, except as noted) | 2022 | 2021 | ||||||
| Net earnings (loss) for the period | $ | 76,831 | $ | (7,562) | ||||
| Adjust for: | ||||||||
| Unrealized foreign exchange losses | 2,328 | 2,167 | ||||||
| Heap inventory net realizable value charge (recovery) | 14,743 | (5,714) | ||||||
| Unrealized (gains) losses on derivatives | (2,384) | 114 | ||||||
| Gains and income from associates | (45,033) | (198) | ||||||
| Mine operation severance payments | 6,856 | — | ||||||
| Losses (gains) on sale of mineral properties, plant and equipment | 177 | (110) | ||||||
| Investment (income) loss | (2,826) | 39,033 | ||||||
| Effect of taxes on adjusting items | (7,253) | 2,041 | ||||||
| Effect of foreign exchange on taxes | (11,462) | 7,662 | ||||||
| Total adjustments | $ | (44,854) | $ | 44,995 | ||||
| Adjusted earnings for the period | $ | 31,977 | $ | 37,433 | ||||
| Weighted average shares for the period | 210,463 | 210,261 | ||||||
| Adjusted earnings per share for the period | $ | 0.15 | $ | 0.18 | ||||
Total Debt
Total debt is a non-GAAP measure calculated as the total current and non-current portions of: long-term debt (including amounts drawn on the Credit Facility), lease liabilities, and loans payable. Total debt does not have any standardized meaning prescribed by GAAP and is therefore unlikely to be comparable to similar measures presented by other companies. The Company and certain investors use this information to evaluate the financial debt leverage of the Company.
Capital
Capital is a non-GAAP measure and is calculated as total equity plus total debt less cash and cash equivalents and short term investments. Capital does not have any standardized meaning prescribed by GAAP and is therefore unlikely to be comparable to similar measures presented by other companies. The Company and certain investors use this information to evaluate the enterprise value of the Company.
Working Capital
Working capital is a non-GAAP measure calculated as current assets less current liabilities. Working capital does not have any standardized meaning prescribed by GAAP and is therefore unlikely to be comparable to similar
| PAN AMERICAN SILVER CORP. | 30 | |||||||
| Management Discussion and Analysis | ||||
| For the three months ended March 31, 2022 and 2021 (tabular amounts are in thousands of U.S. dollars except number of shares, options, warrants, per share amounts, and per ounce amounts, unless otherwise noted) | |||||
measures presented by other companies. The Company and certain investors use this information to evaluate whether the Company is able to meet its current obligations using its current assets.
Cash Mine Operating Earnings
Cash mine operating earnings is a non-GAAP measure calculated as mine operating earnings excluding depreciation and amortization expense and NRV inventory adjustments included in production costs. Cash mine operating earnings does not have any standardized meaning prescribed by GAAP and is therefore unlikely to be comparable to similar measures presented by other companies. The Company excludes these significant non-cash items to arrive at cash mine operating earnings for the purpose of analyzing and explaining periodic cash flow from operations and changes thereto.
| Reconciliation of cash mine operating earnings | Three months ended March 31, | |||||||
| (in thousands of USD) | 2022 | 2021 | ||||||
Mine operating earnings(1) | $ | 66,755 | $ | 89,964 | ||||
| Add/(Subtract) | ||||||||
Depreciation and amortization(1) | 84,526 | 75,093 | ||||||
Net realizable value adjustment for inventories(2) | 14,443 | (8,143) | ||||||
Cash mine operating earnings | $ | 165,724 | $ | 156,914 | ||||
(1)As presented on the consolidated statements of earnings and comprehensive earnings.
(2)As presented in Note 21 to the Company's Q1 2022 Financial Statements.
RISKS AND UNCERTAINTIES
The Company is exposed to many risks in conducting its business, including but not limited to: metal price risk as the Company derives its revenue from the sale of silver, gold, zinc, lead, and copper; trading and credit risk in the normal course of dealing with other companies; foreign exchange risk as the Company reports its financial statements in USD whereas the Company operates in jurisdictions that utilize other currencies; risks relating to cyber security; the inherent risk of uncertainties in estimating mineral reserves and mineral resources; political, economic and social risks related to conducting business in jurisdictions such as Canada, Peru, Mexico, Argentina, Bolivia and Guatemala; environmental risks; risks related to its relations with employees and local communities where we operate, and risks relating to the spread of COVID-19, which has to date resulted in profound health and economic impacts globally and which presents future risks and uncertainties that are largely unknown at this time. Certain of these risks are described below, and are more fully described in Pan American’s Annual Information Form (available on SEDAR at www.sedar.com) and Form 40-F filed with the SEC, and in the Financial Instruments and related risks section of the 2021 Annual Financial Statements. Readers are encouraged to refer to these documents for a more detailed description of some of the risks and uncertainties inherent to Pan American’s business.
Financial Risk Exposure
The Company is exposed to financial risks, including metal price risk, credit risk, interest rate risk, foreign currency exchange rate risk, and liquidity risk. The Company's exposures and management of each of those risks is described in the 2021 Annual Financial Statements under Note 8 "Financial Instruments", along with the financial statement classification, the significant assumptions made in determining the fair value, and amounts of income, expenses, gains and losses associated with financial instruments. Fair value estimates are made at a specific point in time, based on relevant market information and information about the financial instrument. These estimates are subjective in nature and involve uncertainties and matters of significant judgment and, therefore, cannot be determined with precision. Changes in assumptions could significantly affect the estimates. There were no significant changes to those risks or to the Company's management of exposure to those risks during the three months ended March 31, 2022.
The following provides a description of the risks related to financial instruments and how management manages these risks:
| PAN AMERICAN SILVER CORP. | 31 | |||||||
| Management Discussion and Analysis | ||||
| For the three months ended March 31, 2022 and 2021 (tabular amounts are in thousands of U.S. dollars except number of shares, options, warrants, per share amounts, and per ounce amounts, unless otherwise noted) | |||||
Price Risk
A decrease in the market price of commodities such as silver, gold and other metals and increase in the price of consumables could affect our profitability, along with the commercial viability of our mines and production from some of our mining properties. From time to time, Pan American mitigates the price risk associated with its base metal production by committing some of its future production under forward sales or option contracts. However, decisions relating to hedging may have material adverse effects on our financial performance, financial position, and results of operations. The Board of Directors continually assesses Pan American’s strategy towards our base metal exposure.
As at March 31, 2022, the Company had outstanding collars made up of put and call contracts for its exposure to zinc (2,700 tonnes); as well as an outstanding forward contract for its exposure to zinc (2,700 tonnes) with settlement dates on those positions between April 2022 and December 2022. The outstanding collars have respective weighted average floor and cap prices per tonne of $3,150 and $4,000. The outstanding forward contract has a fixed price of $4,065. The Company recorded losses of $1.1 million in Q1 2022. The Company did not have any zinc contracts outstanding during the comparable periods in 2021.
As at March 31, 2021, the Company had outstanding collars made up of put and call contracts for its exposure to copper (1,350 tonnes) with settlement dates on those positions between April 2021 and December 2021, and recorded losses of $0.6 million in Q1 2021, on these positions. There were no comparable copper positions during Q1 2022.
During 2020, the Company entered into diesel swap contracts designed to fix or limit the Company’s exposure to higher fuel prices. At March 31, 2022, the Company had outstanding positions on its diesel exposure with a notional amount of 2.7 million gallons, with a weighted average fixed price of $1.42 per gallon. The Company recorded gains of $2.8 million for the three months ended March 31, 2022. (2021 - gains of $4.2 million for the three months ended March 31, 2021).
Trading Activities and Credit Risk
The zinc, lead, and copper concentrates produced by us are sold through long-term supply arrangements to metal traders or integrated mining and smelting companies. The terms of the concentrate contracts may require us to deliver concentrate that has a value greater than the payment received at the time of delivery, thereby introducing us to credit risk of the buyers of our concentrates. Should any of these counterparties not honour our contractual arrangements, or should any of them become insolvent, we may incur losses for products already shipped and be forced to sell our concentrates in the spot market or we may not have a market for our concentrates and therefore our future operating results may be materially adversely impacted.
As at March 31, 2022, we had receivable balances associated with buyers of our concentrates of $48.2 million (December 31, 2021 - $40.0 million). The vast majority of our concentrate is sold to a limited number of concentrate buyers.
Doré production is refined under long term agreements with fixed refining terms at seven separate refineries worldwide. We generally retain the risk and title to the precious metals throughout the process of refining and therefore are exposed to the risk that the refineries will not be able to perform in accordance with the refining contract and that we may not be able to fully recover our precious metals in such circumstances. As at March 31, 2022, we had approximately $35.7 million (December 31, 2021 - $52.3 million) contained in precious metal inventory at refineries. We maintain insurance coverage against the loss of precious metals at our mine sites and in-transit to refineries. Risk is transferred to the refineries upon delivery.
Refined silver and gold is sold in the spot market to various bullion traders and banks. Credit risk may arise from these activities if we are not paid for metal at the time it is delivered, as required by spot sale contracts.
We maintain trading facilities with several banks and bullion dealers for the purposes of transacting our trading activities. None of these facilities are subject to margin arrangements. Our trading activities can expose us to our counterparties’ credit risk to the extent that our trading positions have a positive mark-to-market value.
| PAN AMERICAN SILVER CORP. | 32 | |||||||
| Management Discussion and Analysis | ||||
| For the three months ended March 31, 2022 and 2021 (tabular amounts are in thousands of U.S. dollars except number of shares, options, warrants, per share amounts, and per ounce amounts, unless otherwise noted) | |||||
Supplier advances for products and services yet to be provided are a common practice in some jurisdictions in which we operate. These advances represent a credit risk to us to the extent that suppliers do not deliver products or perform services as expected. As at March 31, 2022, we had made $17.5 million of supplier advances (December 31, 2021 - $11.2 million), which are reflected in “Trade and other receivables” on the consolidated statements of financial position.
Management constantly monitors and assesses the credit risk resulting from our concentrate sales, refining arrangements and commodity contracts. Furthermore, management carefully considers credit risk when allocating prospective sales and refining business to counterparties. In making allocation decisions, management attempts to avoid unacceptable concentration of credit risk to any single counterparty.
From time to time, we may invest in equity securities of other companies. Just as investing in Pan American is inherent with risks such as those set out in this MD&A, by investing in other companies we will be exposed to the risks associated with owning equity securities and those risks inherent in the investee companies.
Foreign currency exchange rate risk
We report our financial statements in USD; however we operate in jurisdictions that utilize other currencies. As a consequence, the financial results of our operations, as reported in USD, are subject to changes in the value of the USD relative to local currencies. Since our sales are denominated in USD and a portion of our operating costs and capital spending are in local currencies, we are negatively impacted by strengthening local currencies relative to the USD and positively impacted by the inverse. From time to time, we mitigate part of this currency exposure by accumulating local currencies, entering into contracts designed to fix or limit our exposure to changes in the value of local currencies relative to the USD, or assuming liability positions to offset financial assets subject to currency risk.
Pan American held cash and short-term investments of $61.8 million in CAD, $1.1 million in MXN, $7.1 million in PEN, $12.8 million in ARS, $2.7 million in BOB, and $0.4 million in Guatemalan quetzales as at March 31, 2022.
At March 31, 2022, Pan American had outstanding positions on $27.0 million in foreign currency exposure of MXN purchases, $12.6 million of PEN purchases, and $36.0 million of CAD purchases. The MXN positions had weighted average USD put and call exchange rates of $20.50 and $26.08, respectively, expiring between April 2022 and December 2022. The PEN positions had a weighted average USD fixed exchange rate of $4.13, expiring between April 2022 and December 2022. The CAD positions had weighted average USD put and call exchange rates of $1.26 and $1.32, respectively, expiring between April 2022 and December 2022. The Company recorded gains of $0.5 million, gains of $2.1 million, and gains of $0.2 million, respectively on MXN, PEN and CAD derivative contracts for the three months ended March 31, 2022. (March 31, 2021 - losses of $0.8 million, losses of $0.9 million, and gains of $0.5 million, on MXN, PEN, and CAD derivative contracts, respectively).
Claims and Legal Proceedings
Pan American is subject to various claims and legal proceedings covering a wide range of matters that arise in the ordinary course of business activities , including matters relating to employees or former employees, commercial relationships, and claims by local communities, Indigenous stakeholders, and private land owners. Some of these claims or proceedings may seek sizeable monetary damages against us and/or the return of surface or mineral rights or revocation of permits and licenses that are valuable to us and which may impact our operations and profitability if lost. Further information on the nature, assessment and management of such claims are described in this section, the Risks and Uncertainties section of the 2021 Annual MD&A, and in Note 28 to the Company's 2021 Annual Financial Statements. There were no significant changes to those risks or to the Company's management of exposure to those risks during the three months ended March 31, 2022.
In early May 2021, the Company’s subsidiary in Guatemala and the Ministry of Energy and Mines of Guatemala were served with legal proceedings that were originated in the Constitutional Court of Guatemala by a small group of residents and landowners, or alleged residents and landowners, from the La Cuchilla community near the Escobal mine claiming that prior mining activities damaged their lands. Currently, operations at Escobal are
| PAN AMERICAN SILVER CORP. | 33 | |||||||
| Management Discussion and Analysis | ||||
| For the three months ended March 31, 2022 and 2021 (tabular amounts are in thousands of U.S. dollars except number of shares, options, warrants, per share amounts, and per ounce amounts, unless otherwise noted) | |||||
suspended pending the completion of the government-led ILO 169 consultation process. Nevertheless, the action seeks injunctive relief to prevent future mining activities at Escobal. While the Company believes the claims are procedurally and substantively flawed and without merit, the outcome of these proceedings cannot be determined at this time.
As reported in our Annual Information Form dated February 23, 2022, certain individuals have asserted community rights and land ownership over a portion of the La Colorada mine’s surface lands in the Agrarian Courts of Mexico. They have also initiated a process before the Secretariat of Agrarian, Territorial and Urban Development (“SEDATU”) in Zacatecas to declare such lands as national property. In 2019, we filed a legal challenge (amparo) against this process and obtained an injunction to protect our ownership of these surface rights pending the outcome of the challenge and a further review by SEDATU. Our challenge was dismissed on October 25, 2021, primarily on the basis that no final declaration of national lands had yet been made by SEDATU that would affect our property rights. We have appealed this dismissal and we will continue to oppose the SEDATU process. While we believe that we hold proper title to the surface lands in question, if we are unable to maintain, or maintain access to, those surface rights, there could be material adverse impacts on the La Colorada mine’s future mining operations.
In mid-2017, Tahoe, which was acquired by us in late February 2019, and certain of its former directors and officers became the subject of three purported class action lawsuits filed in the United States that center primarily around alleged misrepresentations. These U.S. class action lawsuits were later consolidated into one class action suit that is ongoing in Nevada. In October 2018, Tahoe learned that a similar class action lawsuit had been filed against Tahoe and its former chief executive officer in the Superior Court of Ontario. These lawsuits seek significant damages. We have disputed the allegations made in these suits, however the outcomes are not determinable at this time.
Legal proceedings are subject to various uncertainties and it is possible that some of the matters in which we are involved may be resolved unfavourably against us and may result in a material adverse effect on our financial position, cash flow and results of operations. We establish provisions for matters that are probable and can be reasonably estimated. We also carry liability insurance coverage, however such insurance does not cover all risks to which we might be exposed and in other cases, may only partially cover losses incurred by us.
COVID-19 and Other Pandemics
Since the outbreak of COVID-19 in late 2019, it has spread into areas where we have operations and where our offices are located. During 2020, Government efforts to curtail the spread of COVID-19 resulted in temporary suspensions of our operations in Mexico, Peru, Argentina and Bolivia, and we reduced throughput at our Timmins operation in Canada in order to enhance physical distancing and protect our personnel and the community. The spread of COVID-19 has impacted our employees and contractors, not only as it relates to potential health concerns, but also in terms of limitations on movement, availability of food and other goods, and personal well-being, among others. Our suppliers and service providers have also been impacted.
While COVID-19 has already had significant, direct impacts on our operations, our business, our workforce, and our production, the extent to which COVID-19 will continue to impact our operations will depend on future developments which are highly uncertain and cannot be predicted with confidence. These future developments include, but are not limited to, the duration of any outbreak, new information that may emerge concerning the severity of COVID-19 or its variants, and the actions taken to contain COVID-19 or treat it. The impact of governmental restrictions and health and safety protocols could improve or worsen relative to our assumptions, depending on how each jurisdiction manages potential outbreaks of COVID-19 and the efficacy of vaccines and other measures. We assume operations will continue to be impacted by comprehensive COVID-19 protocols in 2022, which would increase costs and restrict throughput levels, especially at our underground mines. Our ability to continue with our operations, or to successfully maintain our operations on care and maintenance if so required, or to restart or ramp-up any such operations efficiently or economically, or at all, is unknown. It is also uncertain, whether we will be able to maintain an adequate financial condition and have sufficient capital, or have access to capital through our Sustainability-Linked Credit Facility or otherwise, to sustain our business and operations.
| PAN AMERICAN SILVER CORP. | 34 | |||||||
| Management Discussion and Analysis | ||||
| For the three months ended March 31, 2022 and 2021 (tabular amounts are in thousands of U.S. dollars except number of shares, options, warrants, per share amounts, and per ounce amounts, unless otherwise noted) | |||||
Moreover, the continued presence of, or spread, of COVID-19 and its variants, and any future emergence and spread of similar pathogens, globally would likely have material adverse effect on both global and regional economies, including those in which we operate, as we have seen already. Such effects would not only affect our business and results of operations, but also the operations of our suppliers, contractors and service providers, including smelter and refining service providers, and the demand for our production. COVID-19 and the spread of similar pathogens could also negatively impact stock markets, including the trading price of our shares, adversely impact our ability to raise capital, cause continued interest rate volatility and movements that could make obtaining financing or refinancing our debt obligations more challenging or more expensive (if such financing is available at all), and result in any operations affected by coronavirus becoming subject to quarantine or shut down. Any of these developments, and others, could have a material adverse effect on our business and results of operations.
Climate Change
There is significant evidence of the effects of climate change on our planet and an intensifying focus on addressing these issues. The Company recognizes that climate change is a global challenge that can impact our business in a range of possible ways. Mining and processing operations are energy intensive and result in a carbon footprint either directly or through the purchase of fossil-fuel based electricity. As such, the Company is impacted by current and emerging policy and regulation relating to greenhouse gas emission levels, energy efficiency, and reporting of climate-change related risks. While some of the costs associated with reducing emissions may be offset by increased energy efficiency, technological innovation, or the increased demand for our metals as part of technological innovations, the current regulatory trend may result in additional transition costs at some of our operations. Governments are introducing climate change legislation and treaties at the international, national, and local levels, and regulations relating to emission levels and energy efficiency are evolving and becoming more rigorous. Current laws and regulatory requirements are not consistent across the jurisdictions in which we operate, and regulatory uncertainty is likely to result in additional complexity and cost in our compliance efforts. Public perception of mining is, in some respects, negative and there is increasing pressure to curtail mining in many jurisdictions as a result, in part, of perceived adverse effects of mining on the environment.
Concerns around climate change may also affect the market price of our shares as institutional investors and others may divest interests in industries that are thought to have more environmental impacts. While we are committed to operating responsibly and reducing the negative effects of our operations on the environment, our ability to reduce emissions, energy and water usage by increasing efficiency and by adopting new innovation is constrained by technological advancement, operational factors and economics. Adoption of new technologies, the use of renewable energy, and infrastructure and operational changes necessary to reduce water usage may also increase our costs significantly. Concerns over climate change, and our ability to respond to regulatory requirements and societal expectations, may have significant impacts on our operations and on our reputation, and may even result in reduced demand for our products.
The physical risks of climate change could also adversely impact our operations. These risks include, among other things, extreme weather events, resource shortages, changes in rainfall and in storm patterns and intensities, water shortages, changing sea levels and extreme temperatures. Climate-related events such as mudslides, floods, droughts and fires can have significant impacts, directly and indirectly, on our operations and could result in damage to our facilities, disruptions in accessing our sites with labour and essential materials or in shipping products from our mines, risks to the safety and security of our personnel and to communities, shortages of required supplies such as fuel and chemicals, inability to source enough water to supply our operations, and the temporary or permanent cessation of one or more of our operations. There is no assurance that we will be able to successfully anticipate, respond to, or manage the risks associated with physical climate change events and impacts, and this may result in material adverse consequences to our business and to our financial results.
| PAN AMERICAN SILVER CORP. | 35 | |||||||
| Management Discussion and Analysis | ||||
| For the three months ended March 31, 2022 and 2021 (tabular amounts are in thousands of U.S. dollars except number of shares, options, warrants, per share amounts, and per ounce amounts, unless otherwise noted) | |||||
SUMMARY OF SIGNIFICANT ACCOUNTING POLICIES, STANDARDS AND JUDGEMENTS
Changes in accounting policies
The accounting policies applied in the preparation of these unaudited condensed interim consolidated financial statements are consistent with those applied and disclosed in the Company’s audited consolidated financial statements for the year ended December 31, 2021.
Future changes in accounting standards
Certain new accounting standards and interpretations have been published that are not mandatory for the current period and have not been early adopted. Management is still evaluating and does not expect any such pronouncements to have a material impact on the Company’s consolidated financial statements upon adoption.
Significant judgements
In preparing financial statements in accordance with IFRS, Management is required to make estimates and assumptions that affect the amounts reported in the consolidated financial statements. These critical accounting estimates represent Management's estimates and judgments that are uncertain and any changes in these could materially impact the Company’s financial statements. Management continuously reviews its estimates, judgments, and assumptions using the most current information available.
Readers should also refer to Note 3 of the 2021 Annual Financial Statements, for the Company’s summary of significant accounting policies.
DISCLOSURE CONTROLS AND PROCEDURES AND INTERNAL CONTROL OVER FINANCIAL REPORTING
Pan American’s management considers the meaning of internal control to be the processes established by management to provide reasonable assurance about the achievement of the Company’s objectives regarding operations, reporting and compliance. Internal control is designed to address identified risks that threaten any of these objectives.
Disclosure controls and procedures (“DC&P”)
Our Chief Executive Officer (“CEO”) and Chief Financial Officer (“CFO”) are responsible for establishing and maintaining adequate DC&P. Under the supervision and with the participation of our CEO and CFO, we evaluated the effectiveness of the design and operation of our DC&P in accordance with requirements of National Instrument 52-109 of the Canadian Securities Commission (“NI 52-109”) and the Sarbanes Oxley Act of 2002 (as adopted by the US Securities and Exchange Commission).
As of December 31, 2021, based on the evaluation, our CEO and CFO concluded that our DC&P were effective to ensure that information required to be disclosed by us in reports we file or submit is recorded, processed, summarized and reported within the time periods specified in securities legislation and is accumulated and communicated to our management, including our CEO and CFO.
Internal control over financial reporting (“ICFR”)
Our CEO and CFO are responsible for establishing and maintaining adequate ICFR. Under the supervision and with the participation of our CEO and CFO, we evaluated the effectiveness of our ICFR as of December 31, 2021 based upon the Internal Control - Integrated Framework (2013) issued by the Committee of Sponsoring Organizations of the Treadway Commission. Based on the evaluation, our CEO and CFO concluded that our ICFR was effective as of December 31, 2021. Management reviewed the results of management’s evaluation with the Audit Committee of the Board.
The effectiveness of the Company’s ICFR as of December 31, 2021 has been audited by Deloitte LLP, Independent Registered Public Accounting Firm as stated in their report immediately preceding the Company’s audited consolidated financial statements for the year ended December 31, 2021.
| PAN AMERICAN SILVER CORP. | 36 | |||||||
| Management Discussion and Analysis | ||||
| For the three months ended March 31, 2022 and 2021 (tabular amounts are in thousands of U.S. dollars except number of shares, options, warrants, per share amounts, and per ounce amounts, unless otherwise noted) | |||||
Changes in ICFR
There has been no change in the Company’s ICFR during the three and twelve month periods ended March 31, 2022 that has materially affected, or is reasonably likely to materially affect, its ICFR.
Inherent limitations of controls and procedures
All internal control systems, no matter how well designed, have inherent limitations. As a result, even systems determined to be effective may not prevent or detect misstatements on a timely basis, as systems can provide only reasonable assurance that the objectives of the control system are met. In addition, projections of any evaluation of the effectiveness of ICFR to future periods are subject to the risk that controls may become inadequate because of changes in conditions, or that the degree of compliance with the policies or procedures may change.
TECHNICAL INFORMATION
Scientific and technical information contained in this MD&A has been reviewed and approved by Martin Wafforn, P.Eng., Senior Vice President Technical Services and Processing Optimization, and Christopher Emerson, FAusIMM, Vice President Business Development and Geology, each of whom are Qualified Persons, as the term is defined in NI 43-101.
For more detailed information regarding the Company’s material mineral properties and technical information related thereto, including a complete list of current technical reports applicable to such properties, please refer to the Company’s Annual Information Form dated February 23, 2022, filed at www.sedar.com or the Company’s most recent Form 40-F filed with the SEC.
Cautionary Note Regarding Forward-Looking Statements and Information
Certain of the statements and information in this MD&A constitute “forward-looking statements” within the meaning of the United States Private Securities Litigation Reform Act of 1995 and “forward-looking information” within the meaning of applicable Canadian provincial securities laws relating to the Company and its operations. All statements, other than statements of historical fact, are forward-looking statements. When used in this MD&A, the words, “will”, “believes”, “expects”, “intents”, “plans”, “forecast”, “objective”, “guidance”, “outlook”, “potential”, “anticipated”, “budget”, and other similar words and expressions, identify forward-looking statements or information. These forward-looking statements or information relate to, among other things: future financial or operational performance and forecasts for 2022, including our estimated production of silver, gold and other metals forecasted and anticipated timing for the same, and our estimated Cash Costs, AISC, capital and exploration, mine operation, general and administrative, care and maintenance expenditures; future anticipated prices for gold, silver and other metals and assumed foreign exchange rates; expectations with respect to the future anticipated impact of COVID-19 on our operations, the lessening or increase in pandemic-related restrictions and protocols, and the anticipated timing for the same; the ability of Pan American to continue with its operations, or to successfully maintain our operations on care and maintenance, should the situation related to COVID-19 not be as anticipated; the impacts of inflation on Pan American and its operations; whether Pan American is able to maintain a strong financial condition and have sufficient capital, or have access to capital through the Sustainability-Linked Credit Facility or otherwise, to sustain our business and operations; the timing and outcome of legal proceedings, including the claims relating to La Cuchilla and the impact that any such legal proceedings may have on Pan American; the duration and effect of the suspensions of operations of the Escobal mine, as well as the nature of and continuation of the constitutional court-mandated ILO 169 consultation process in Guatemala, and the timing and, if applicable, completion thereof; certain legal proceedings that were originated in the Constitutional Court of Guatemala relating to the Escobal mine; the SEDATU process with respect to a portion of the La Colorada mine’s surface lands; the timing and success of site infrastructure upgrades at the La Colorada mine; the ability of Pan American to successfully complete any capital projects, including with respect to the La Colorada and the Timmins projects, the expected economic or operational results derived from those projects, and the impacts of any such projects on Pan American; the future results of our exploration activities, including with respect to the skarn exploration program at La Colorada; and the Company’s plans and expectations for its properties and operations.
These forward-looking statements and information reflect the Company’s current views with respect to future events and are necessarily based upon a number of assumptions and estimates that, while considered reasonable by the Company, are inherently subject to significant operational, business, economic, competitive, political, regulatory, and social uncertainties and contingencies. These assumptions, some of which are described in the “Risks and Uncertainties” section of this MD&A, include: the world-wide economic and social impact of COVID-19 is managed and the duration and extent of the coronavirus pandemic is minimized or not long-term; the management of COVID-19 in each jurisdiction; the assumptions related to the global supply and availability of COVID-19 vaccines and the effectiveness and results of any vaccines; the presence and impact of COVID-19 on our workforce, suppliers and other essential resources and the effect those impacts have on our business; if necessary, continuation of operations following shutdowns or reductions in production, our ability to manage reduced operations efficiently and economically, including to maintain necessary staffing; our ability to implement environmental, social and governance activities; tonnage of ore to be mined and processed; ore grades and recoveries; prices for silver, gold and base metals remaining as estimated; currency exchange rates remaining as estimated; capital, decommissioning and reclamation estimates; our mineral
| PAN AMERICAN SILVER CORP. | 37 | |||||||
| Management Discussion and Analysis | ||||
| For the three months ended March 31, 2022 and 2021 (tabular amounts are in thousands of U.S. dollars except number of shares, options, warrants, per share amounts, and per ounce amounts, unless otherwise noted) | |||||
reserve and mineral resource estimates and the assumptions upon which they are based; prices for energy inputs, labour, materials, supplies and services (including transportation); no labour-related disruptions at any of our operations; no unplanned delays or interruptions in scheduled production; protection of our interests against claims and legal proceedings; all necessary permits, licenses and regulatory approvals for our operations are received in a timely manner and can be maintained; and our ability to comply with environmental, health and safety laws, particularly given the potential for modifications and expansion of such laws. The foregoing list of assumptions is not exhaustive.
The Company cautions the reader that forward-looking statements and information involve known and unknown risks, uncertainties and other factors that may cause actual results and developments to differ materially from those expressed or implied by such forward-looking statements or information contained in this MD&A and the Company has made assumptions and estimates based on or related to many of these factors. Such factors include, without limitation: the duration and effects of the coronavirus and COVID-19 variants, and any other epidemics or pandemics on our operations and workforce, and their effects on global economies and society; fluctuations in silver, gold, and base metal prices; fluctuations in prices for energy inputs; fluctuations in currency markets (such as the PEN, MXN, ARS, BOL, GTQ and CAD versus the USD); risks related to the technological and operational nature of the Company’s business; changes in national and local government, legislation, taxation, controls or regulations and political, legal or economic developments in Canada, the United States, Mexico, Peru, Argentina, Bolivia, Guatemala or other countries where the Company may carry on business, some of which might prevent or cause the suspension or discontinuation of mining activities, including the risk of expropriation related to certain of our operations, particularly in Argentina and Bolivia and risks related to the constitutional court-mandated ILO 169 consultation process in Guatemala; risks and hazards associated with the business of mineral exploration, development and mining (including environmental hazards, industrial accidents, unusual or unexpected geological or structural formations, pressures, cave-ins and flooding); risks relating to the credit worthiness or financial condition of suppliers, refiners and other parties with whom the Company does business; inadequate insurance, or inability to obtain insurance, to cover these risks and hazards; employee relations; relationships with and claims by the local communities and indigenous populations; availability and increasing costs associated with mining inputs and labour; the Company’s ability to secure our mine sites or maintain access to our mine sites due to criminal activity, violence, or civil and labour unrest; the speculative nature of mineral exploration and development, including the risk of obtaining or retaining necessary licenses and permits; challenges to, or difficulty in maintaining, the Company’s title to properties and continued ownership thereof; diminishing quantities or grades of mineral reserves as properties are mined; global financial conditions; the Company’s ability to complete and successfully integrate acquisitions and to mitigate other business combination risks; the actual results of current exploration activities, conclusions of economic evaluations, and changes in project parameters to deal with unanticipated economic or other factors; increased competition in the mining industry for properties, equipment, qualified personnel, and their costs; having sufficient cash to pay obligations as they come due; and those factors identified under the caption “Risks Related to Pan American’s Business” in the Company’s most recent Form 40-F and Annual Information Form filed with the United States Securities and Exchange Commission and Canadian provincial securities regulatory authorities, respectively. Although the Company has attempted to identify important factors that could cause actual results to differ materially, there may be other factors that cause results not to be as anticipated, estimated, described, or intended. Investors are cautioned against attributing undue certainty or reliance on forward-looking statements or information. Forward-looking statements and information are designed to help readers understand Management's current views of our near and longer term prospects and may not be appropriate for other purposes. The Company does not intend, and does not assume any obligation, to update or revise forward-looking statements or information to reflect changes in assumptions or in circumstances or any other events affecting such statements or information, other than as required by applicable law.
Cautionary Note to U.S. Investors Concerning Estimates of Mineral Reserves and Mineral Resources
This MD&A has been prepared in accordance with the requirements of Canadian securities laws, which differ from the requirements of U.S. securities laws. Unless otherwise indicated, all references to mineral reserve and mineral resource estimates included in the MD&A have been disclosed in accordance with NI 43-101 and the Canadian Institute of Mining, Metallurgy, and Petroleum Definition Standards. NI 43-101 is a rule developed by the Canadian Securities Administrators that establishes standards for all public disclosure an issuer makes of scientific and technical information concerning mineral projects. Canadian standards, including NI 43-101, differ significantly from the requirements of the SEC, and information concerning mineralization, deposits, mineral reserve and resource information contained or referred to herein may not be comparable to similar information disclosed by U.S. companies.
| PAN AMERICAN SILVER CORP. | 38 | |||||||
Form 52-109F2
Certification of Interim Filings
Full Certificate
I, Michael Steinmann, Chief Executive Officer of Pan American Silver Corp., certify the following:
1.Review: I have reviewed the interim financial report and interim MD&A (together, the “interim filings”) of Pan American Silver Corp. (the “issuer”) for the interim period ended March 31, 2022.
2.No misrepresentations: Based on my knowledge, having exercised reasonable diligence, the interim filings do not contain any untrue statement of a material fact or omit to state a material fact required to be stated or that is necessary to make a statement not misleading in light of the circumstances under which it was made, with respect to the period covered by the interim filings.
3.Fair presentation: Based on my knowledge, having exercised reasonable diligence, the interim financial report together with the other financial information included in the interim filings fairly present in all material respects the financial condition, financial performance and cash flows of the issuer, as of the date of and for the periods presented in the interim filings.
4.Responsibility: The issuer’s other certifying officer(s) and I are responsible for establishing and maintaining disclosure controls and procedures (DC&P) and internal control over financial reporting (ICFR), as those terms are defined in National Instrument 52-109 Certification of Disclosure in Issuers’ Annual and Interim Filings, for the issuer.
5.Design: Subject to the limitations, if any, described in paragraphs 5.2 and 5.3, the issuer’s other certifying officer(s) and I have, as at the end of the period covered by the interim filings
(a)designed DC&P, or caused it to be designed under our supervision, to provide reasonable assurance that
(i)material information relating to the issuer is made known to us by others, particularly during the period in which the interim filings are being prepared; and
(ii)information required to be disclosed by the issuer in its annual filings, interim filings or other reports filed or submitted by it under securities legislation is recorded, processed, summarized and reported within the time periods specified in securities legislation; and
(b)designed ICFR, or caused it to be designed under our supervision, to provide reasonable assurance regarding the reliability of financial reporting and the preparation of financial statements for external purposes in accordance with the issuer’s GAAP.
5.1Control framework: The control framework the issuer’s other certifying officer(s) and I used to design the issuer’s ICFR is the Internal Control – Integrated Framework issued by the Committee of Sponsoring Organizations of the Treadway Commission.
5.2Not applicable.
5.3Not applicable.
6.Reporting changes in ICFR: The issuer has disclosed in its interim MD&A any change in the issuer’s ICFR that occurred during the period beginning on January 1, 2022 and ended on March 31, 2022 that has materially affected, or is reasonably likely to materially affect, the issuer’s ICFR.
| Date: May 11, 2022 | |||||
| /s/ “Michael Steinmann” | |||||
| Michael Steinmann | |||||
| Chief Executive Officer | |||||
Form 52-109F2
Certification of Interim Filings
Full Certificate
I, Ignacio Couturier, Chief Financial Officer of Pan American Silver Corp., certify the following:
1.Review: I have reviewed the interim financial report and interim MD&A (together, the “interim filings”) of Pan American Silver Corp. (the “issuer”) for the interim period ended March 31, 2022.
2.No misrepresentations: Based on my knowledge, having exercised reasonable diligence, the interim filings do not contain any untrue statement of a material fact or omit to state a material fact required to be stated or that is necessary to make a statement not misleading in light of the circumstances under which it was made, with respect to the period covered by the interim filings.
3.Fair presentation: Based on my knowledge, having exercised reasonable diligence, the interim financial report together with the other financial information included in the interim filings fairly present in all material respects the financial condition, financial performance and cash flows of the issuer, as of the date of and for the periods presented in the interim filings.
4.Responsibility: The issuer’s other certifying officer(s) and I are responsible for establishing and maintaining disclosure controls and procedures (DC&P) and internal control over financial reporting (ICFR), as those terms are defined in National Instrument 52-109 Certification of Disclosure in Issuers’ Annual and Interim Filings, for the issuer.
5.Design: Subject to the limitations, if any, described in paragraphs 5.2 and 5.3, the issuer’s other certifying officer(s) and I have, as at the end of the period covered by the interim filings
(1)designed DC&P, or caused it to be designed under our supervision, to provide reasonable assurance that
(a)material information relating to the issuer is made known to us by others, particularly during the period in which the interim filings are being prepared; and
(b)information required to be disclosed by the issuer in its annual filings, interim filings or other reports filed or submitted by it under securities legislation is recorded, processed, summarized and reported within the time periods specified in securities legislation; and
(2)designed ICFR, or caused it to be designed under our supervision, to provide reasonable assurance regarding the reliability of financial reporting and the preparation of financial statements for external purposes in accordance with the issuer’s GAAP.
5.1Control framework: The control framework the issuer’s other certifying officer(s) and I used to design the issuer’s ICFR is the Internal Control – Integrated Framework issued by the Committee of Sponsoring Organizations of the Treadway Commission.
5.2Not applicable.
5.3Not applicable.
6.Reporting changes in ICFR: The issuer has disclosed in its interim MD&A any change in the issuer’s ICFR that occurred during the period beginning on January 1, 2022 and ended on March 31, 2022 that has materially affected, or is reasonably likely to materially affect, the issuer’s ICFR.
| Date: May 11, 2022 | |||||
| /s/ “Ignacio Couturier” | |||||
| Ignacio Couturier | |||||
| Chief Financial Officer | |||||
 | Q1 2022 NEWS RELEASE All amounts expressed in U.S. dollars unless otherwise indicated. Unaudited tabular amounts are in thousands of U.S. dollars except number of shares, options, warrants, and per share amounts, unless otherwise noted. | ||||
Pan American Silver reports revenue of $439.9 million in Q1 2022
Vancouver, B.C. - May 11, 2022 - Pan American Silver Corp. (NASDAQ: PAAS) (TSX: PAAS) ("Pan American" or the "Company") today reported unaudited results for the quarter ended March 31, 2022 ("Q1 2022").
“Pan American reported strong financial performance in the quarter, enabling us to declare a dividend of $0.12 per common share for Q1, in line with the new dividend policy announced in February 2022," said Michael Steinmann, President and Chief Executive Officer. "As we indicated in our February 23, 2022 news release, our operations experienced high levels of workforce absenteeism in January and early February due to the Omicron variant of COVID-19. Workforce deployment is now back to more normal levels, and we are maintaining our guidance for 2022 with production weighted to the second half of the year."
Consolidated Q1 2022 Highlights:
•Silver production of 4.6 million ounces and gold production of 131.0 thousand ounces.
•Revenue of $439.9 million included inventory draw downs of 531.6 thousand ounces of silver and 17.6 thousand ounces of gold.
•Net earnings of $76.8 million ($0.36 basic income per share). Adjusted earnings were $32.0 million ($0.15 basic adjusted income per share), with the most significant adjustment being the exclusion of the $44.6 million one-time gain for Pan American's investment in Maverix Metals Inc. ("Maverix").
•Operations generated $68.8 million of cash flow, net of $58.3 million in tax payments.
•Silver Segment Cash Costs and All-in Sustaining Costs ("AISC") per silver ounce were $10.23 and $13.41, respectively. Excluding Net Realizable Value ("NRV") inventory adjustments, Silver Segment AISC was $13.08 per ounce.
•Gold Segment Cash Costs and AISC per gold ounce were $1,069 and $1,502, respectively. Excluding NRV inventory adjustments, Gold Segment AISC was $1,409 per ounce.
•Completed a quarterly-record 25,924 metres drilled on the La Colorada Skarn project, advanced pre-sinking of the concrete lined ventilation shaft and began commissioning of the refrigeration plant. See the news release issued on May 9, 2022, for further details on the recent drill results.
•Management maintains the guidance for 2022 production, costs and capital expenditures. Production is expected to be weighted to the second half of 2022, reflecting the impact on production from reduced workforce deployment levels in Q1 2022 due to the Omicron variant and mine sequencing. See the "2022 Guidance" section of this news release for further details, and the Company's Management's Discussion and Analysis for the three months ended March 31, 2022.
•As at March 31, 2022, Pan American had working capital of $620.7 million, inclusive of cash and short-term investment balances of $326.3 million; a long-term investment in Maverix with a market value of $124.7 million; and $500.0 million available under our sustainability-linked credit facility. Total debt of $47.0 million was related to lease liabilities and construction loans.
•A cash dividend of $0.12 per common share has been declared, payable on or about June 3, 2022, to holders of record of Pan American’s common shares as of the close on May 24, 2022. The dividend is comprised of a base dividend of $0.10 per common share and a variable dividend of $0.02 per common share. On February 23, 2022, Pan American introduced a dividend policy that provides for a base dividend plus a supplemental dividend amount tied to our net cash balance. The dividends are eligible dividends for Canadian income tax purposes.
PAN AMERICAN SILVER CORP. | 1 | |||||||
| Q1 2022 NEWS RELEASE All amounts expressed in U.S. dollars unless otherwise indicated. Unaudited tabular amounts are in thousands of U.S. dollars except number of shares, options, warrants, and per share amounts, unless otherwise noted. | ||||
CONSOLIDATED RESULTS
| Three months ended March 31, 2022 | Twelve months ended Dec. 31, 2021 | |||||||
| Weighted average shares during period (millions) | 210.5 | 210.3 | ||||||
| Shares outstanding end of period (millions) | 210.5 | 210.5 | ||||||
| Three months ended March 31, | ||||||||
| 2022 | 2021 | |||||||
| FINANCIAL | ||||||||
| Revenue | $ | 439,888 | $ | 368,099 | ||||
| Mine operating earnings | $ | 66,755 | $ | 89,964 | ||||
| Net income (loss) | $ | 76,831 | $ | (7,562) | ||||
Basic income (loss) per share(1) | $ | 0.36 | $ | (0.04) | ||||
Adjusted income(2) | $ | 31,977 | $ | 37,433 | ||||
Basic adjusted income per share(1) | $ | 0.15 | $ | 0.18 | ||||
| Net cash generated from operating activities | $ | 68,758 | $ | 29,850 | ||||
Net cash generated from operating activities before changes in working capital(2) | $ | 83,816 | $ | 77,248 | ||||
Sustaining capital expenditures(2) | $ | 55,957 | $ | 45,210 | ||||
Non-sustaining capital expenditures(2) | $ | 9,765 | $ | 5,743 | ||||
| Cash dividend per share | $ | 0.12 | $ | 0.07 | ||||
| PRODUCTION | ||||||||
| Silver (thousand ounces) | 4,619 | 4,583 | ||||||
| Gold (thousand ounces) | 131.0 | 137.6 | ||||||
| Zinc (thousand tonnes) | 10.2 | 13.1 | ||||||
| Lead (thousand tonnes) | 4.7 | 5.0 | ||||||
| Copper (thousand tonnes) | 1.8 | 2.1 | ||||||
CASH COSTS(2) ($/ounce) | ||||||||
| Silver Segment | 10.23 | 12.30 | ||||||
| Gold Segment | 1,069 | 846 | ||||||
AISC(2) ($/ounce) | ||||||||
| Silver Segment | 13.41 | 16.99 | ||||||
| Gold Segment | 1,502 | 1,058 | ||||||
AVERAGE REALIZED PRICES(3) | ||||||||
Silver ($/ounce) | 24.03 | 26.41 | ||||||
Gold ($/ounce) | 1,880 | 1,788 | ||||||
Zinc ($/tonne) | 3,792 | 2,756 | ||||||
Lead ($/tonne) | 2,341 | 2,036 | ||||||
Copper ($/tonne) | 9,767 | 8,515 | ||||||
(1)Per share amounts are based on basic weighted average common shares.
(2)Non-GAAP measure; please refer to the "Alternative Performance (non-GAAP) Measures" section of this news release for further information on these measures.
(3)Metal prices stated are inclusive of final settlement adjustments on concentrate sales.
Cash Costs, AISC, adjusted earnings, basic adjusted earnings per share, sustaining and non-sustaining capital, working capital, total debt and net cash are not generally accepted accounting principle ("non-GAAP") financial measures. Please refer to the "Alternative Performance (non-GAAP) Measures" section of this news release for further information on these measures. This news release should be read in conjunction with Pan American's unaudited Condensed Interim Consolidated Financial Statements and our Management's Discussion and Analysis for the three months ended March 31, 2022. This material is available on Pan American’s website at panamericansilver.com, on SEDAR at www.sedar.com and on EDGAR at www.sec.gov.
PAN AMERICAN SILVER CORP. | 2 | |||||||
| Q1 2022 NEWS RELEASE All amounts expressed in U.S. dollars unless otherwise indicated. Unaudited tabular amounts are in thousands of U.S. dollars except number of shares, options, warrants, and per share amounts, unless otherwise noted. | ||||
2022 GUIDANCE
There are no changes to the guidance for 2022 provided on February 23, 2022, as detailed below. We are currently experiencing higher than expected overall inflationary pressures, particularly for diesel and certain consumables, as well as disruptions in the supply chain. Management is monitoring this situation and will adjust its cost estimates if required.
These estimates are forward-looking statements and information that are subject to the cautionary note associated with forward-looking statements and information at the end of this news release.
Annual Production
| Silver – Moz | 19.0 - 20.5 | ||||
Gold – koz | 550.0 - 605.0 | ||||
| Zinc – kt | 35.0 - 40.0 | ||||
| Lead – kt | 15.0 - 17.0 | ||||
| Copper – kt | 5.5 - 6.5 | ||||
Cash Costs and AISC
Cash Costs(1)(2) ($ per ounce) | AISC(1)(2) ($ per ounce) | |||||||
Silver Segment Total | 10.70 - 12.20 | 14.50 - 16.00 | ||||||
| Gold Segment Total | 970 - 1,070 | 1,240 - 1,365 | ||||||
(1)Cash Costs and AISC are non-GAAP measures. Please refer to the "Alternative Performance (non-GAAP) Measures" section of this news release for further information on these measures.
(2)The Cash Costs and AISC forecasts assume average metal prices of $22.50/oz for silver, $1,750/oz for gold, $3,000/tonne ($1.36/lb) for zinc, $2,200/tonne ($1.00/lb) for lead, and $9,200/tonne ($4.17/lb) for copper; and average annual exchange rates relative to 1 USD of 20.00 for the Mexican peso ("MXN"), 4.10 for the Peruvian sol ("PEN"), 122.17 for the Argentine peso ("ARS"), 7.00 for the Bolivian boliviano ("BOB"), and $1.25 for the Canadian dollar ("CAD").
Capital Expenditures
| (in millions of USD) | |||||
Sustaining Capital(1) | 200.0 - 210.0 | ||||
Project Capital | 80.0 - 95.0 | ||||
| Total Capital | 280.0 - 305.0 | ||||
(1) Sustaining Capital includes $24.0 million for forecast lease and other payments, which include debt repayments on construction loan facilities classified as "Debt" as per Note 17 of the Company's audited financial statements for the year ended December 31, 2021. These facilities are for constructions of pads and other infrastructure in which the Company only makes cash payments upon completion of construction activities and on a scheduled basis.
Conference Call and Webcast
Date: May 12, 2022
Time: 11:00 am ET (8:00 am PT)
Dial-in numbers: 1-800-319-4610 (toll-free in Canada and the U.S.)
+1-604-638-5340 (international participants)
Webcast: panamericansilver.com
The live webcast, presentation slides and the Q1 2022 report will be available at panamericansilver.com. An archive of the webcast will also be available for three months.
About Pan American Silver
Pan American owns and operates silver and gold mines located in Mexico, Peru, Canada, Argentina and Bolivia. We also own the Escobal mine in Guatemala that is currently not operating. Pan American provides enhanced exposure to silver through a large base of silver reserves and resources, as well as major catalysts to grow silver production. We have a 28-year history of operating in Latin America, earning an industry-leading reputation for
PAN AMERICAN SILVER CORP. | 3 | |||||||
| Q1 2022 NEWS RELEASE All amounts expressed in U.S. dollars unless otherwise indicated. Unaudited tabular amounts are in thousands of U.S. dollars except number of shares, options, warrants, and per share amounts, unless otherwise noted. | ||||
sustainability performance, operational excellence and prudent financial management. We are headquartered in Vancouver, B.C. and our shares trade on NASDAQ and the Toronto Stock Exchange under the symbol "PAAS".
Learn more at panamericansilver.com.
For more information contact:
Siren Fisekci
VP, Investor Relations & Corporate Communications
Ph: 604-806-3191
Email: ir@panamericansilver.com
Technical Information
Scientific and technical information contained in this news release have been reviewed and approved by Martin Wafforn, P.Eng., Senior Vice President Technical Services and Process Optimization, and Christopher Emerson, FAusIMM, Vice President Business Development and Geology, each of whom are Qualified Persons, as the term is defined in Canadian National Instrument 43-101 - Standards of Disclosure for Mineral Projects.
For additional information about Pan American's material mineral properties, please refer to Pan American’s Annual Information Form dated February 23, 2022, filed at www.sedar.com, or the Company's most recent Form 40-F filed with the Securities and Exchange Commission.
Alternative Performance (Non-GAAP) Measures
In this news release, we refer to measures that are not generally accepted accounting principle ("non-GAAP") financial measures. These measures are widely used in the mining industry as a benchmark for performance, but do not have a standardized meaning as prescribed by IFRS as an indicator of performance, and may differ from methods used by other companies with similar descriptions. These non-GAAP financial measures include:
•Cash Costs. Pan American's method of calculating cash costs may differ from the methods used by other entities and, accordingly, Pan American's Cash Costs may not be comparable to similarly titled measures used by other entities. Investors are cautioned that Cash Costs should not be construed as an alternative to production costs, depreciation and amortization, and royalties determined in accordance with IFRS as an indicator of performance.
•Adjusted earnings and basic adjusted earnings per share. Pan American believes that these measures better reflect normalized earnings as they eliminate items that in management's judgment are subject to volatility as a result of factors, which are unrelated to operations in the period, and/or relate to items that will settle in future periods.
•All-in Sustaining Costs per silver or gold ounce sold, net of by-product credits ("AISC"). Pan American has adopted AISC as a measure of its consolidated operating performance and its ability to generate cash from all operations collectively, and Pan American believes it is a more comprehensive measure of the cost of operating our consolidated business than traditional cash costs per payable ounce, as it includes the cost of replacing ounces through exploration, the cost of ongoing capital investments (sustaining capital), general and administrative expenses, as well as other items that affect Pan American's consolidated earnings and cash flow.
•Total debt is calculated as the total current and non-current portions of: long-term debt, finance lease liabilities and loans payable. Total debt does not have any standardized meaning prescribed by GAAP and is therefore unlikely to be comparable to similar measures presented by other companies. Pan American and certain investors use this information to evaluate the financial debt leverage of Pan American.
•Net cash is calculated as cash and cash equivalents plus short-term investments, other than equity securities less total debt.
•Working capital is calculated as current assets less current liabilities. Working capital does not have any standardized meaning prescribed by GAAP and is therefore unlikely to be comparable to similar measures presented by other companies. Pan American and certain investors use this information to evaluate whether Pan American is able to meet its current obligations using its current assets.
•Total available liquidity is calculated as the sum of Cash and cash equivalents, Short-term Investments, and the amount available on the Credit Facility. Total available liquidity does not have any standardized meaning prescribed by GAAP and is therefore unlikely to be comparable to similar measures presented by other companies. Pan American and certain investors use this information to evaluate the liquid assets available to Pan American.
PAN AMERICAN SILVER CORP. | 4 | |||||||
| Q1 2022 NEWS RELEASE All amounts expressed in U.S. dollars unless otherwise indicated. Unaudited tabular amounts are in thousands of U.S. dollars except number of shares, options, warrants, and per share amounts, unless otherwise noted. | ||||
Readers should refer to the "Alternative Performance (non-GAAP) Measures" section of Pan American’s Management's Discussion and Analysis for the period ended December 31, 2021, for a more detailed discussion of these and other non-GAAP measures and their calculation.
Cautionary Note Regarding Forward-Looking Statements and Information
Certain of the statements and information in this news release constitute "forward-looking statements" within the meaning of the United States Private Securities Litigation Reform Act of 1995 and "forward-looking information" within the meaning of applicable Canadian provincial securities laws. All statements, other than statements of historical fact, are forward-looking statements or information. Forward-looking statements or information in this news release relate to, among other things: future financial or operational performance, including our estimated production of silver, gold and other metals forecasted for 2022, our estimated Cash Costs and AISC, and our sustaining and project capital expenditures in 2022; the anticipated timing for metals production; the impact of inflationary pressures on our operations and business, particularly for diesel and certain consumables, as well as the impacts related to disruptions in the supply chain; future anticipated prices for gold, silver and other metals and assumed foreign exchange rates; expectations with respect to the future anticipated impact of COVID-19 on our operations and the assumptions that the impact of COVID-19, including the Omicron variant, will be such that we will be able to maintain our workforce at near normal levels in 2022; the ability to continue making progress at any of our exploration projects, including the Wetmore and Whitney projects, and the results of any exploration programs undertaken; whether Pan American is able to maintain a strong financial condition and have sufficient capital, or have access to capital through our corporate sustainability-linked credit facility or otherwise, to sustain our business and operations; and the ability of Pan American to successfully complete any capital projects, including, but not limited to, the La Colorada Skarn project, the expected economic or operational results derived from those projects, and the impacts of any such projects on Pan American and Pan American’s plans and expectations for its properties and operations.
These forward-looking statements and information reflect Pan American’s current views with respect to future events and are necessarily based upon a number of assumptions that, while considered reasonable by Pan American, are inherently subject to significant operational, business, economic and regulatory uncertainties and contingencies. These assumptions include: the world-wide economic and social impact of COVID-19 and the duration and extent of the COVID-19 pandemic and related restrictions, and the presence and impact of COVID-19 and COVID-19 related restrictions on our workforce, suppliers and other essential resources and what effect those impacts, if they change, would have on our business; the effect that the COVID-19 pandemic may have on our financial and operational results; the ability of Pan American to continue with its operations, or to successfully maintain our operations on care and maintenance, should the situation related to COVID-19 not be as anticipated; continuation of operations following shutdowns or reductions in production, our ability to manage reduced operations efficiently and economically, including to maintain necessary staffing; tonnage of ore to be mined and processed; future anticipated prices for gold, silver and other metals and assumed foreign exchange rates; the timing and impact of planned capital expenditure projects at La Colorada and our other operations, including anticipated sustaining, project, and exploration expenditures; the ongoing impact and timing of the court-mandated ILO 169 consultation process in Guatemala; ore grades and recoveries; prices for silver, gold and base metals remaining as estimated; currency exchange rates remaining as estimated; capital, decommissioning and reclamation estimates; our mineral reserve and resource estimates and the assumptions upon which they are based; prices for energy inputs, labour, materials, supplies and services (including transportation); no labour-related disruptions at any of our operations; no unplanned delays or interruptions in scheduled production; all necessary permits, licenses and regulatory approvals for our operations are received in a timely manner; our ability to secure and maintain title and ownership to properties and the surface rights necessary for our operations; and our ability to comply with environmental, health and safety laws. The foregoing list of assumptions is not exhaustive.
These forward-looking statements and information reflect Pan American’s current views with respect to future events and are necessarily based upon a number of assumptions that, while considered reasonable by Pan American, are inherently subject to significant operational, business, economic and regulatory uncertainties and contingencies. These assumptions include: the impact of inflation and disruptions to the global, regional and local supply chains; the world-wide economic and social impact of COVID-19 and the duration and extent of the COVID-19 pandemic and related restrictions; the presence and impact of COVID-19 and COVID-19 related restrictions on our workforce, suppliers and other essential resources and what effect those impacts, if they change, would have on our business; the effect that the COVID-19 pandemic may have on our financial and operational results; the ability of Pan American to continue with its operations, or to successfully maintain our operations on care and maintenance, should the situation related to COVID-19 not be as anticipated; continuation of operations following shutdowns or reductions in production, if applicable, and our ability to manage reduced operations efficiently and economically, including to maintain necessary staffing; tonnage of ore to be mined and processed; future anticipated prices for gold, silver and other metals and assumed foreign exchange rates; the timing and impact of planned capital expenditure projects at La Colorada and our other operations, including anticipated sustaining, project, and exploration expenditures; the
PAN AMERICAN SILVER CORP. | 5 | |||||||
| Q1 2022 NEWS RELEASE All amounts expressed in U.S. dollars unless otherwise indicated. Unaudited tabular amounts are in thousands of U.S. dollars except number of shares, options, warrants, and per share amounts, unless otherwise noted. | ||||
ongoing impact and timing of the court-mandated ILO 169 consultation process in Guatemala; ore grades and recoveries; prices for silver, gold and base metals remaining as estimated; currency exchange rates remaining as estimated; capital, decommissioning and reclamation estimates; our mineral reserve and resource estimates and the assumptions upon which they are based; prices for energy inputs, labour, materials, supplies and services (including transportation); no labour-related disruptions at any of our operations; no unplanned delays or interruptions in scheduled production; all necessary permits, licenses and regulatory approvals for our operations are received in a timely manner; our ability to secure and maintain title and ownership to properties and the surface rights necessary for our operations; and our ability to comply with environmental, health and safety laws. The foregoing list of assumptions is not exhaustive.
PAN AMERICAN SILVER CORP. | 6 | |||||||
Serious News for Serious Traders! Try StreetInsider.com Premium Free!
You May Also Be Interested In
- PMD Device Solutions Publishes 2023 Annual Report
- Konsolidator maintains its financial expectations for 2024
- Green Energy Park Raises 30 million US Dollars in Initial Equity Funding to Accelerate the Energy Transition and to Build One of the Largest Renewable Hydrogen Production and Export Terminal Facilitie
Create E-mail Alert Related Categories
SEC FilingsSign up for StreetInsider Free!
Receive full access to all new and archived articles, unlimited portfolio tracking, e-mail alerts, custom newswires and RSS feeds - and more!
