

Form 6-K Anheuser-Busch InBev For: May 05
 Tweet
Tweet Share
Share
SECURITIES AND EXCHANGE COMMISSION
WASHINGTON, D.C. 20549
FORM 6-K
REPORT OF FOREIGN PRIVATE ISSUER
PURSUANT TO RULE 13a-16 OR 15d-16
UNDER THE SECURITIES EXCHANGE ACT OF 1934
May 5, 2022
Commission File No.: 001-37911
Anheuser-Busch InBev SA/NV
(Translation of registrant’s name into English)
Belgium
(Jurisdiction of Incorporation)
Brouwerijplein 1
3000 Leuven, Belgium
(Address of principal executive offices)
Indicate by check mark whether the registrant files or will file annual reports under cover of Form 20-F or Form 40-F:
Form 20-F ☒ Form 40-F ☐
Indicate by check mark if the registrant is submitting the Form 6-K in paper as permitted by Regulation S-T Rule 101(b)(1): ☐
Indicate by check mark if the registrant is submitting the Form 6-K in paper as permitted by Regulation S-T Rule 101(b)(7): ☐
Indicate by check mark whether by furnishing the information contained in this Form, the registrant is also thereby furnishing the information to the Commission pursuant to Rule 12g3-2(b) under the Securities Exchange Act of 1934.
Yes ☐ No ☒
EXHIBIT INDEX
| Exhibit Number |
Description | |
| 99.1 | Press release issued 5 May 2022 regarding first quarter 2022 results. | |
SIGNATURE
Pursuant to the requirements of the Securities Exchange Act of 1934, the registrant has duly caused this report to be signed on its behalf by the undersigned, thereunto duly authorized.
| ANHEUSER-BUSCH INBEV SA/NV (Registrant) | ||||||
| Dated: May 5, 2022 | By: | /s/ Jan Vandermeersch | ||||
| Name: | Jan Vandermeersch | |||||
| Title: | Global Legal Director Corporate | |||||
Exhibit 99.1
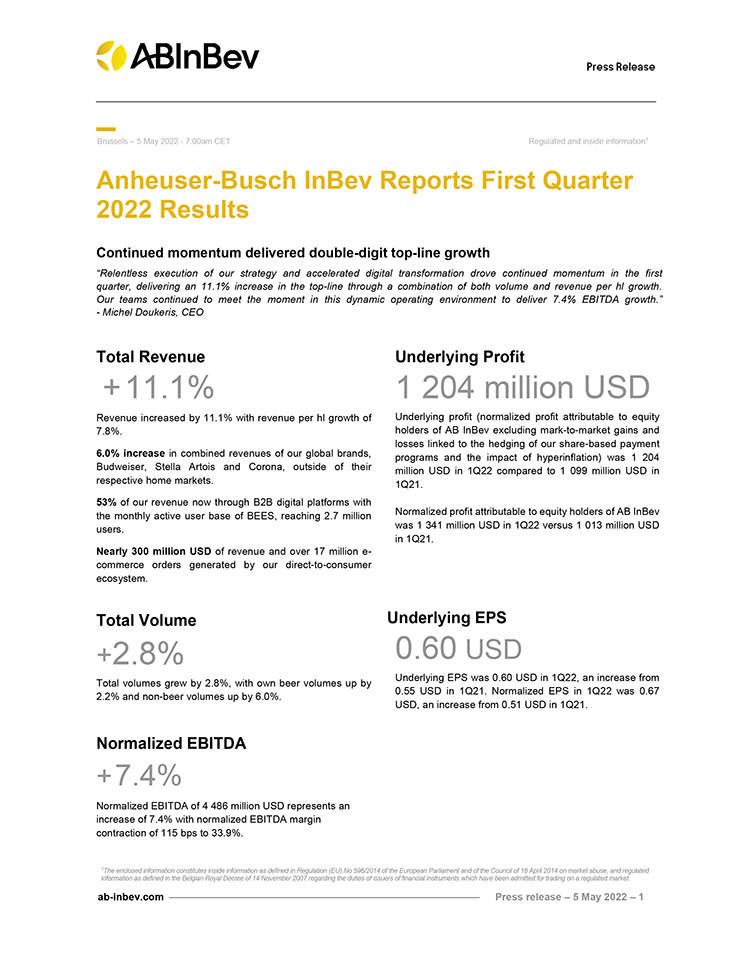
Press Release Brussels – 5 May 2022 - 7:00am CET Regulated and inside information1 Anheuser-Busch InBev Reports First Quarter 2022 Results Continued momentum delivered double-digit top-line growth “Relentless execution of our strategy and accelerated digital transformation drove continued momentum in the firstquarter, delivering an 11.1% increase in the top-line through a combination of both volume and revenue per hl growth.Our teams continued to meet the moment in this dynamic operating environment to deliver 7.4% EBITDA growth.”- Michel Doukeris, CEO Total Revenue + 11.1% Revenue increased by 11.1% with revenue per hl growth of 7.8%. 6.0% increase in combined revenues of our global brands, Budweiser, Stella Artois and Corona, outside of their respective home markets. 53% of our revenue now through B2B digital platforms with the monthly active user base of BEES, reaching 2.7 million users. Nearly 300 million USD of revenue and over 17 million e-commerce orders generated by our direct-to-consumer ecosystem. Underlying Profit 1 204 million USD Underlying profit (normalized profit attributable to equity holders of AB InBev excluding mark-to-market gains and losses linked to the hedging of our share-based payment programs and the impact of hyperinflation) was 1 204 million USD in 1Q22 compared to 1 099 million USD in 1Q21. Normalized profit attributable to equity holders of AB InBev was 1 341 million USD in 1Q22 versus 1 013 million USD in 1Q21. Total Volume +2.8% Total volumes grew by 2.8%, with own beer volumes up by 2.2% and non-beer volumes up by 6.0%. Normalized EBITDA + 7.4% Normalized EBITDA of 4 486 million USD represents an increase of 7.4% with normalized EBITDA margin contraction of 115 bps to 33.9%. Underlying EPS 0.60 USD Underlying EPS was 0.60 USD in 1Q22, an increase from 0.55 USD in 1Q21. Normalized EPS in 1Q22 was 0.67 USD, an increase from 0.51 USD in 1Q21. 1The enclosed information constitutes inside information as defined in Regulation (EU) No 596/2014 of the European Parliament and of the Council of 16 April 2014 on market abuse, and regulated information as defined in the Belgian Royal Decree of 14 November 2007 regarding the duties of issuers of financial instruments which have been admitted for trading on a regulated market. ab-inbev.com Press release – 5 May 2022 – 1

ab-inbev.com Press release – 5 May 2022 – 2 Management comments Continued momentum delivered double-digit top-line growth We delivered top-line growth of 11.1%, comprised of a mix of 2.8% volume and 7.8% revenue per hl growth, driven by revenue management initiatives and ongoing premiumization. EBITDA increased by 7.4% as top-line growth was partially offset by anticipated commodity headwinds and higher SG&A due primarily to elevated supply chain costs. Consistent execution of our strategy We continue to execute on and invest behind the three key pillars of our strategy to deliver consistent growth and long-term value creation. Lead and grow the category: This quarter we delivered volume growth in more than two thirds of our markets, even in the context of the ongoing dynamic operating environment. Digitize and monetize our ecosystem: BEES is now live in 17 markets and has reached 2.7 million monthly active users. Optimize our business: In 1Q22, we completed the redemption of a further 3.1 billion USD of bonds. Lead and grow the category We are executing on five proven and scalable levers to drive category expansion: Inclusive Category: Following the successful expansion of Coronita, our smaller bottle pack offering for Corona, we scaled further smaller pack formats in several key markets in Latin America to provide consumers with price points and choice for different consumption needs. In addition, we expanded our portfolio of inclusive brands by scaling the launch of Nativa, our local crop brand in Colombia. Core Superiority: Our mainstream portfolio delivered high-single digit revenue growth and once again outperformed the industry across most of our main markets according to our estimates. Occasions Development: Our non-alcoholic beer portfolio delivered continued revenue growth led by liquid and pack innovations, such as Corona Sunbrew in Canada, and growth of our local brand extensions such as Budweiser Zero in the US and Brahma 0.0 in Brazil. To further develop the participation of beer in the meals occasion, we are scaling our 360 degree “Sign Off, Dine, Bon Appetit” campaign for Stella Artois in 7 markets to enhance salience and frequency. Premiumization: Our above core portfolio grew revenue by approximately 15% this quarter led by a particularly strong performance from Michelob ULTRA in the US which grew double-digits. Our global brands grew revenue by 6.0% outside of their home markets, led by Corona with 14.1% and Stella Artois with 11.5%. Budweiser grew by 0.3%, impacted by the renewed COVID-19 restrictions in China.
ab-inbev.com Press release – 5 May 2022 – 3 Beyond Beer: Our global Beyond Beer business contributed over 350 million USD of revenue in the quarter. In the US, Cutwater grew by strong double-digits, nearly 1.3x the growth of the total RTD spirits segment, and in South Africa, Brutal Fruit and Flying Fish delivered continued double-digit growth. We further expanded the roll out of the Mike’s Hard portfolio of brands which have now been launched in more than 10 markets globally. Following our earlier recognition as the Cannes Lions 2022 Creative Marketer of the Year, we are proud to have been recognized by Fast Company as one of the World’s Most Innovative Companies in 2022, ranked number 12 globally and number 1 in the North America category. Digitize and monetize our ecosystem Digitizing our relationships with our more than 6 million customers globally: The BEES platform captured approximately 6.5 billion USD in gross merchandise value (GMV) with over 23 million orders placed, with both metrics growing over 50% versus 1Q21. Leading the way in DTC solutions: Our omni-channel direct-to-consumer (DTC) ecosystem of fast-growing e-commerce platforms and nearly 13 000 brick and mortar retail stores generated revenue of approximately 300 million USD. Our DTC e-commerce platforms generated over 17 million orders in the quarter, led by Zé Delivery in Brazil which delivered double-digit growth in orders. Optimize our business Our bond portfolio maintains a very manageable weighted average pre-tax coupon rate of approximately 4% with 93% of the portfolio fixed rate. Our net interest expense has decreased by nearly 70 million USD versus 1Q21, principally as a result of our gross debt reduction efforts. Advancing our ESG priorities We continue to accelerate our ambitious ESG agenda to enable our commercial vision, create shared prosperity across our value chain and fulfill our company purpose. In recognition of our efforts, we have been awarded the Gold Medal for International Corporate Achievement in Sustainable Development by the World Environment Center. Creating a future with more cheers Our continued momentum further builds our confidence that our leading portfolio of brands, accelerated digital transformation and unique ecosystem position us well to drive consistent profitable growth, long-term value creation and a future with more cheers.

ab-inbev.com Press release – 5 May 2022 – 4 2022 Outlook (i) Overall Performance: We expect our EBITDA to grow in-line with our medium-term outlook of between 4-8% and our revenue to grow ahead of EBITDA from a healthy combination of volume and price. The outlook for FY22 reflects our current assessment of the scale and magnitude of the COVID-19 pandemic, which is subject to change as we continue to monitor ongoing developments. (ii) Net Finance Costs: Net pension interest expenses and accretion expenses are expected to be in the range of 170 to 200 million USD per quarter, depending on currency and interest rate fluctuations. We expect the average gross debt coupon in FY22 to be approximately 4.0%. Net finance costs will continue to be impacted by any gains and losses related to the hedging of our share-based payment programs. (iii) Effective Tax Rates (ETR): We expect the normalized ETR in FY22 to be in the range of 28% to 30%, excluding any gains and losses relating to the hedging of our share-based payment programs. The ETR outlook does not consider the impact of potential future changes in legislation. (iv) Net Capital Expenditure: We expect net capital expenditure of between 4.5 and 5.0 billion USD in FY22.
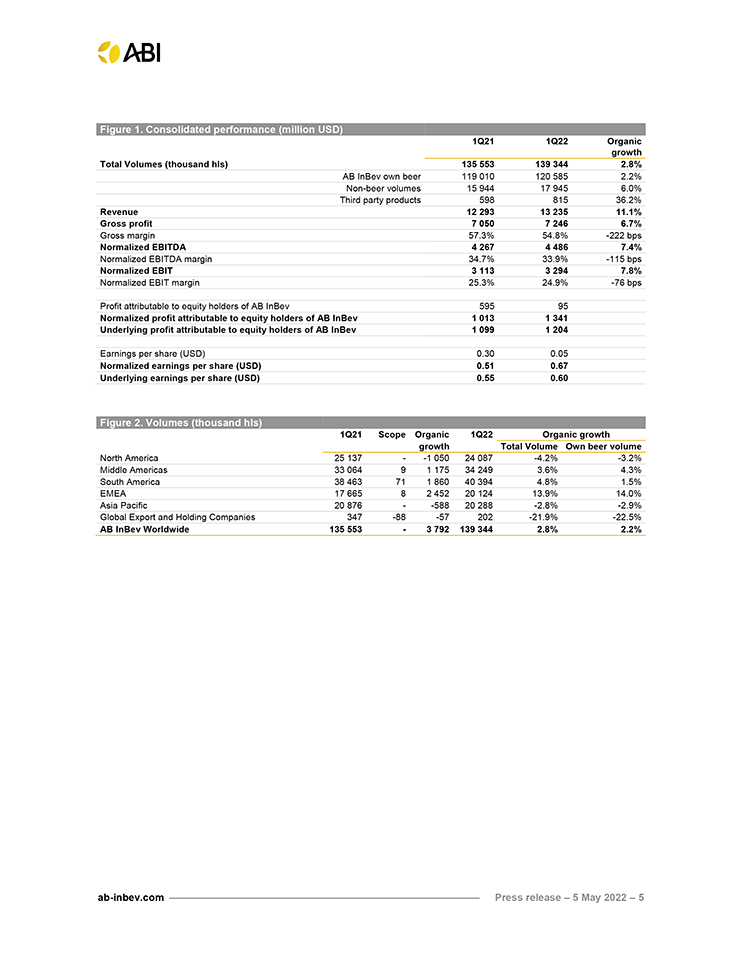
Figure 1. Consolidated performance (million USD) 1Q21 1Q22 Organic growth Total Volumes (thousand hls) 135 553 139 344 2.8% AB InBev own beer 119 010 120 585 2.2% Non-beer volumes 15 944 17 945 6.0% Third party products 598 815 36.2% Revenue 12 293 13 235 11.1% Gross profit 7 050 7 246 6.7% Gross margin 57.3% 54.8% -222 bps Normalized EBITDA 4 267 4 486 7.4% Normalized EBITDA margin 34.7% 33.9% -115 bps Normalized EBIT 3 113 3 294 7.8% Normalized EBIT margin 25.3% 24.9% -76 bps Profit attributable to equity holders of AB InBev 595 95 Normalized profit attributable to equity holders of AB InBev 1 013 1 341 Underlying profit attributable to equity holders of AB InBev 1 099 1 204 Earnings per share (USD) 0.30 0.05 Normalized earnings per share (USD) 0.51 0.67 Underlying earnings per share (USD) 0.55 0.60 Figure 2. Volumes (thousand hls) 1Q21 Scope Organic 1Q22 Organic growth growth Total Volume Own beer volume North America 25 137 - -1 050 24 087 -4.2% -3.2% Middle Americas 33 064 9 1 175 34 249 3.6% 4.3% South America 38 463 71 1 860 40 394 4.8% 1.5% EMEA 17 665 8 2 452 20 124 13.9% 14.0% Asia Pacific 20 876 - -588 20 288 -2.8% -2.9% Global Export and Holding Companies 347 -88 -57 202 -21.9% -22.5% AB InBev Worldwide 135 553 - 3 792 139 344 2.8% 2.2% ab-inbev.com Press release – 5 May 2022 – 5

ab-inbev.com Press release – 5 May 2022 – 6 Key Market Performances United States: Continued top-line growth despite soft industry Operating performance: Revenue grew by 2.1% with revenue per hl growing by 6.2% driven by revenue management initiatives and continued premiumization. Sales-to-wholesalers (STWs) were down by 3.8%. Sales-to-retailers (STRs) declined by 5.0%, underperforming the industry, which was impacted by the resurgence of COVID-19 in January. EBITDA was flat. Commercial highlights: We continue to execute our commercial strategy, rebalancing our portfolio toward faster growing above core segments and adjacencies. Our above core portfolio continues to outperform, led by Michelob ULTRA which grew double digits. Our premium and super premium brands grew in the mid-single digits. Within the spirits-based ready-to-drink segment, our portfolio continues to grow ahead of the industry, led by Cutwater and the successful launch of NÜTRL vodka seltzer. Mexico: Double digit top- and bottom-line growth Operating performance: Revenue grew by low-teens, with revenue per hl growth of high-single digits driven primarily by continued revenue management initiatives. Our volumes grew by mid-single digits, ahead of the industry, despite the phasing impact of a later Easter. EBITDA grew by over 10%. Commercial highlights: We delivered growth across all segments of our portfolio driven by ongoing portfolio development, digital transformation, and channel expansion. Our above core portfolio once again grew by double digits, led by the Modelo family and Michelob ULTRA. We continue to expand our distribution footprint, with the opening of 200 new Modelorama stores and the successful completion of the seventh wave of our OXXO rollout, expanding to approximately 3 600 additional stores. BEES continues to expand, with almost 75% of our revenues now digital. Colombia: Double digit top- and bottom-line growth Operating performance: We delivered revenue growth of nearly 20%, with revenue per hl growth of low-teens driven by revenue management initiatives and premiumization. Our volumes grew by mid-single digits supported by the return of key consumption occasions and our investments in capacity expansion. EBITDA grew by almost 20%. Commercial highlights: We continue to grow the beer category through the implementation of our expansion levers, delivering a new record high per capita consumption this quarter. Our premium and super premium portfolio led the way with over 30% volume growth. The roll out and adoption of BEES continued with 89% of our revenues now digital and more than 30% of our BEES customers also BEES marketplace users. Brazil: Double-digit top-line growth Operating performance: Revenue grew by 16.9%, with revenue per hl growth of 10.8%. Our beer volumes once again outperformed the industry according to our estimates, growing by 2.1% despite lapping a strong comparable. Non-beer volumes grew by 16.9% driven by the continued recovery of out of home consumption occasions and the expansion of portfolio availability on the BEES platform. EBITDA grew by 3.4%. Commercial highlights: Our premium and super premium brands delivered high-teens volume growth, supported by the continued recovery of the on-premise channel. Within the core segment, our portfolio delivered mid-single digit volume growth. BEES now covers 92% of our active customers with 87% of our revenues digital. Our DTC platform, Zé Delivery, fulfilled more than 16 million orders in 1Q22, a 15% increase versus 1Q21.

ab-inbev.com Press release – 5 May 2022 – 7 Europe: Double digit top- and bottom-line growth Operating performance: Revenue grew by high-teens, with mid-single digit growth in volumes and revenue per hl growth of low-teens, supported by revenue management initiatives, ongoing premiumization and on-premise recovery. EBITDA grew by over 30%. Versus 1Q19, top-line grew by mid-single digits despite on-trade volumes not fully recovering to pre-pandemic levels. Commercial highlights: We continue to drive premiumization across Europe, with our premium and super premium brands making up over 50% of our revenue and delivering mid-teens revenue growth. Our DTC product, PerfectDraft, expanded the active shopper base by more than 40% versus 1Q21. South Africa: Double-digit top- and bottom-line growth Operating performance: Revenue grew by 30.7% with mid-single digit revenue per hl growth and mid-twenties volume growth, ahead of the industry according to our estimates and supported by a favorable comparable from a one-month ban on alcohol sales in 1Q21. EBITDA grew by over 40%. Compared to 1Q19, top-line grew by over 30% with bottom-line growth in the high-twenties. Commercial highlights: Our momentum continued with consistent growth across all segments of our portfolio, led by over 40% growth in our leading core brand, Carling Black Label. Our global brands and beyond beer portfolio both grew by more than 30%. Driven by BEES, digital channels now represent 89% of our revenues. China: Ongoing momentum although performance impacted by COVID-19 restrictions Operating performance: Momentum continued into the start of the year, however the implementation of COVID-19 restrictions in March led to a total industry decline of low-single digits in the quarter, according to our estimates. These restrictions disproportionately impacted our key regions and channels, leading to a 4.3% volume decline. Revenue per hl grew by 3.3%, driven by premiumization and revenue management initiatives, resulting in a 1.2% decline in total revenue. EBITDA was flattish. Commercial highlights: We continue to invest behind our commercial strategy, focused on premiumization, channel and geographic expansion, and digital transformation. The share of our total volume generated by our premium and super premium portfolio increased in the quarter. Compared to 1Q19, Budweiser grew revenue by high-single digits and our super premium portfolio grew by more than 20%. The roll out and adoption of BEES continued with expansion to 28 cities and over 20 000 customers. Highlights from our other markets Canada: Our beer volume outperformed the industry, led by our above core portfolio which grew by mid-single digits. Total volume declined due to a strong comparable and a soft industry, which continued to be impacted by COVID-19 restrictions. Revenue decreased by mid-single digits. Peru: We delivered double-digit top-line growth with a healthy balance of high-single digit volume and revenue per hl growth, driven by ongoing portfolio transformation and supported by continued post COVID-19 recovery. Our premium brands once again delivered particularly strong performances, growing low-teens year over year. We continue to advance our digital transformation with 86% of our revenues now through digital channels.

ab-inbev.com Press release – 5 May 2022 – 8 Ecuador: We delivered mid-teens top-line growth with low-single digit volume growth, despite the re-implementation of COVID-19 restrictions throughout January. We continue to focus on expanding the beer category and driving premiumization with our premium brands growing double-digits. 98% of our revenue in Ecuador is now digital with over 30% of our BEES customers now also BEES marketplace users. Argentina: Revenue grew by double-digits, driven primarily by revenue management initiatives in a highly inflationary environment with volumes growing by low single-digits. Africa excluding South Africa: In Nigeria, our top-line grew nearly 50%, despite continued supply chain constraints, driven by volume growth and revenue management initiatives. In our other key markets, we continue to see strong consumer demand for our brands which led to double-digit volume and revenue growth, driven by Botswana, Mozambique, Tanzania and Zambia. South Korea: Volumes grew by high-single digits supported by continued market share gains in both the on-premise and in-home channels and the gradual easing of COVID-19 restrictions. Revenue per hl increased by low-single digits, resulting in double-digit revenue growth.
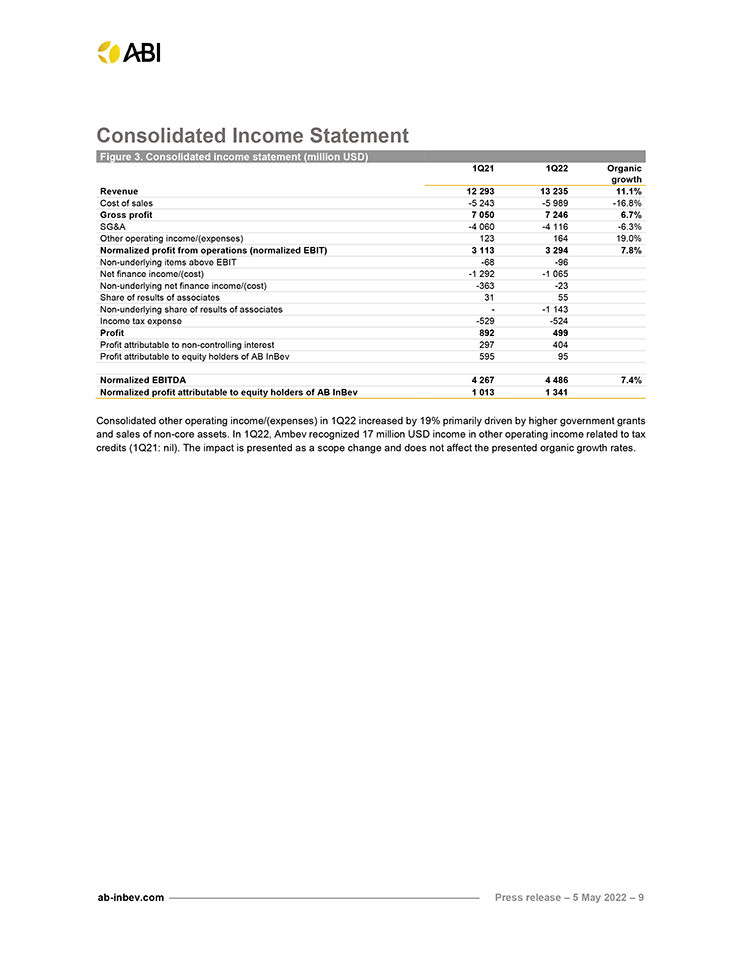
Consolidated Income Statement Figure 3. Consolidated income statement (million USD) 1Q21 1Q22 Organic growth Revenue 12 293 13 235 11.1% Cost of sales -5 243 -5 989 -16.8% Gross profit 7 050 7 246 6.7% SG&A -4 060 -4 116 -6.3% Other operating income/(expenses) 123 164 19.0% Normalized profit from operations (normalized EBIT) 3 113 3 294 7.8% Non-underlying items above EBIT -68 -96 Net finance income/(cost) -1 292 -1 065 Non-underlying net finance income/(cost) -363 -23 Share of results of associates 31 55 Non-underlying share of results of associates - -1 143 Income tax expense -529 -524 Profit 892 499 Profit attributable to non-controlling interest 297 404 Profit attributable to equity holders of AB InBev 595 95 Normalized EBITDA 4 267 4 486 7.4% Normalized profit attributable to equity holders of AB InBev 1 013 1 341 Consolidated other operating income/(expenses) in 1Q22 increased by 19% primarily driven by higher government grants and sales of non-core assets. In 1Q22, Ambev recognized 17 million USD income in other operating income related to tax credits (1Q21: nil). The impact is presented as a scope change and does not affect the presented organic growth rates. ab-inbev.com Press release – 5 May 2022 – 9
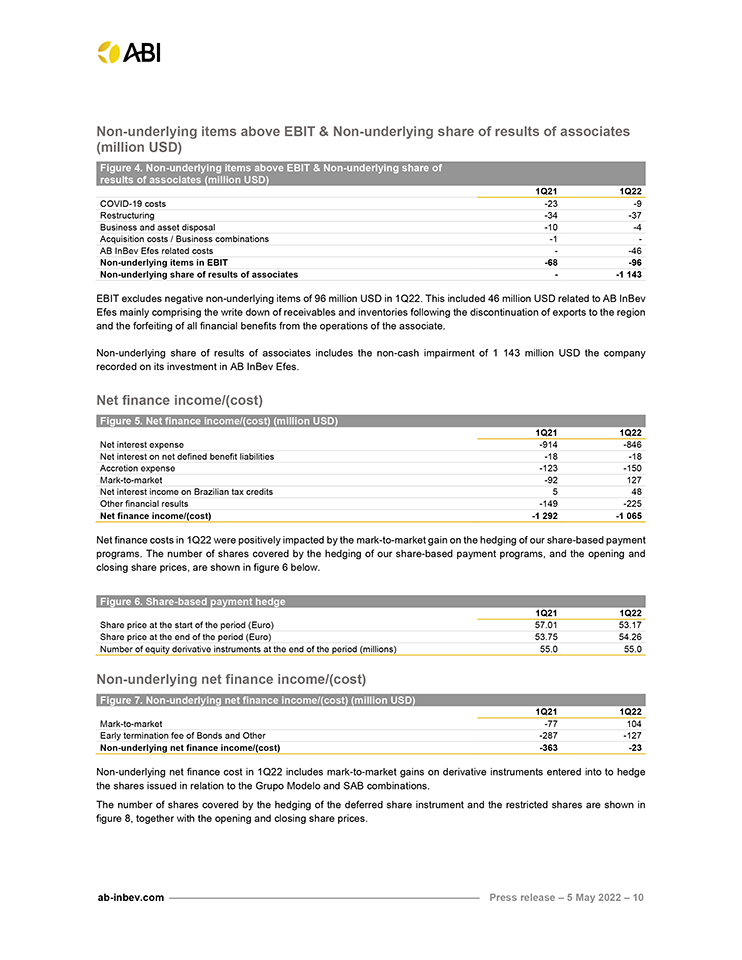
Non-underlying items above EBIT & Non-underlying share of results of associates (million USD) Figure 4. Non-underlying items above EBIT & Non-underlying share of results of associates (million USD) 1Q21 1Q22 COVID-19 costs -23 -9 Restructuring -34 -37 Business and asset disposal -10 -4 Acquisition costs / Business combinations -1 - AB InBev Efes related costs - -46 Non-underlying items in EBIT -68 -96 Non-underlying share of results of associates - -1 143 EBIT excludes negative non-underlying items of 96 million USD in 1Q22. This included 46 million USD related to AB InBev Efes mainly comprising the write down of receivables and inventories following the discontinuation of exports to the region and the forfeiting of all financial benefits from the operations of the associate. Non-underlying share of results of associates includes the non-cash impairment of 1 143 million USD the company recorded on its investment in AB InBev Efes. Net finance income/(cost) Figure 5. Net finance income/(cost) (million USD) 1Q21 1Q22 Net interest expense -914 -846 Net interest on net defined benefit liabilities -18 -18 Accretion expense -123 -150 Mark-to-market -92 127 Net interest income on Brazilian tax credits 5 48 Other financial results -149 -225 Net finance income/(cost) -1 292 -1 065 Net finance costs in 1Q22 were positively impacted by the mark-to-market gain on the hedging of our share-based payment programs. The number of shares covered by the hedging of our share-based payment programs, and the opening and closing share prices, are shown in figure 6 below. Figure 6. Share-based payment hedge 1Q21 1Q22 Share price at the start of the period (Euro) 57.01 53.17 Share price at the end of the period (Euro) 53.75 54.26 Number of equity derivative instruments at the end of the period (millions) 55.0 55.0 Non-underlying net finance income/(cost) Figure 7. Non-underlying net finance income/(cost) (million USD) 1Q21 1Q22 Mark-to-market -77 104 Early termination fee of Bonds and Other -287 -127 Non-underlying net finance income/(cost) -363 -23 Non-underlying net finance cost in 1Q22 includes mark-to-market gains on derivative instruments entered into to hedge the shares issued in relation to the Grupo Modelo and SAB combinations. The number of shares covered by the hedging of the deferred share instrument and the restricted shares are shown in figure 8, together with the opening and closing share prices. ab-inbev.com Press release – 5 May 2022 – 10
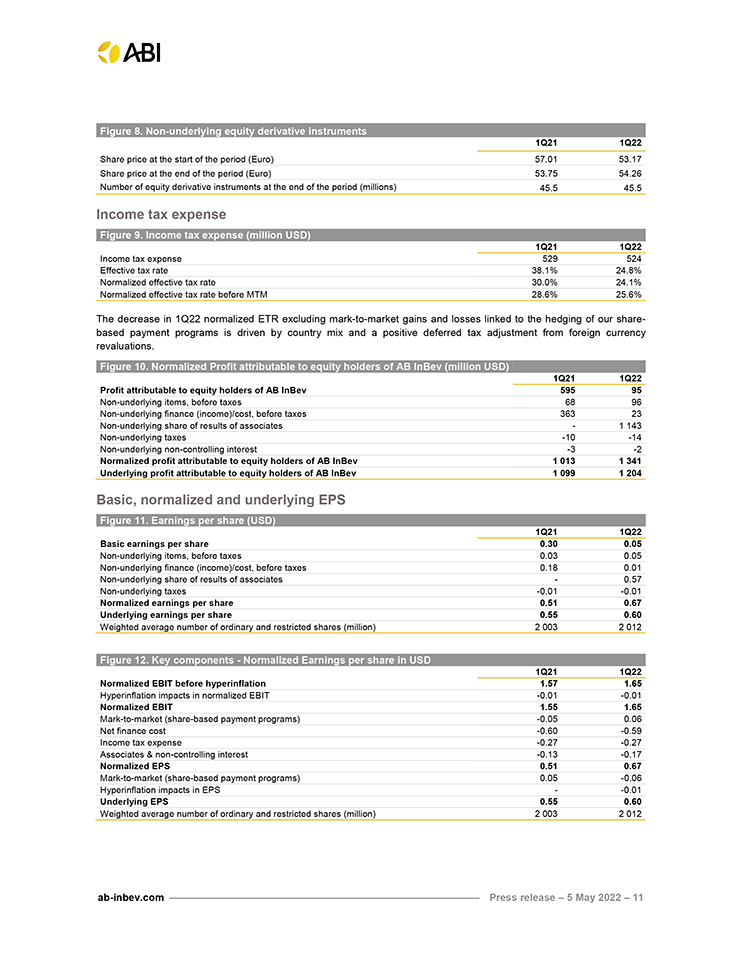
Figure 8. Non-underlying equity derivative instruments 1Q21 1Q22 Share price at the start of the period (Euro) 57.01 53.17 Share price at the end of the period (Euro) 53.75 54.26 Number of equity derivative instruments at the end of the period (millions) 45.5 45.5 Income tax expense Figure 9. Income tax expense (million USD) 1Q21 1Q22 Income tax expense 529 524 Effective tax rate 38.1% 24.8% Normalized effective tax rate 30.0% 24.1% Normalized effective tax rate before MTM 28.6% 25.6% The decrease in 1Q22 normalized ETR excluding mark-to-market gains and losses linked to the hedging of our share-based payment programs is driven by country mix and a positive deferred tax adjustment from foreign currency revaluations. Figure 10. Normalized Profit attributable to equity holders of AB InBev (million USD) 1Q21 1Q22 Profit attributable to equity holders of AB InBev 595 95 Non-underlying items, before taxes 68 96 Non-underlying finance (income)/cost, before taxes 363 23 Non-underlying share of results of associates - 1 143 Non-underlying taxes -10 -14 Non-underlying non-controlling interest -3 -2 Normalized profit attributable to equity holders of AB InBev 1 013 1 341 Underlying profit attributable to equity holders of AB InBev 1 099 1 204 Basic, normalized and underlying EPS Figure 11. Earnings per share (USD) 1Q21 1Q22 Basic earnings per share 0.30 0.05 Non-underlying items, before taxes 0.03 0.05 Non-underlying finance (income)/cost, before taxes 0.18 0.01 Non-underlying share of results of associates - 0.57 Non-underlying taxes -0.01 -0.01 Normalized earnings per share 0.51 0.67 Underlying earnings per share 0.55 0.60 Weighted average number of ordinary and restricted shares (million) 2 003 2 012 Figure 12. Key components - Normalized Earnings per share in USD 1Q21 1Q22 Normalized EBIT before hyperinflation 1.57 1.65 Hyperinflation impacts in normalized EBIT -0.01 -0.01 Normalized EBIT 1.55 1.65 Mark-to-market (share-based payment programs) -0.05 0.06 Net finance cost -0.60 -0.59 Income tax expense -0.27 -0.27 Associates & non-controlling interest -0.13 -0.17 Normalized EPS 0.51 0.67 Mark-to-market (share-based payment programs) 0.05 -0.06 Hyperinflation impacts in EPS - -0.01 Underlying EPS 0.55 0.60 Weighted average number of ordinary and restricted shares (million) 2 003 2 012 ab-inbev.com Press release – 5 May 2022 – 11

Reconciliation between profit attributable to equity holders and normalized EBITDA Figure 13. Reconciliation of normalized EBITDA to profit attributable to equity holders of AB InBev (million USD) 1Q21 1Q22 Profit attributable to equity holders of AB InBev 595 95 Non-controlling interests 297 404 Profit 892 499 Income tax expense 529 524 Share of result of associates -31 -55 Non-underlying share of results of associates - 1 143 Net finance (income)/cost 1 292 1 065 Non-underlying net finance (income)/cost 363 23 Non-underlying items above EBIT 68 96 Normalized EBIT 3 113 3 294 Depreciation, amortization and impairment 1 154 1 192 Normalized EBITDA 4 267 4 486 Normalized EBITDA and normalized EBIT are measures utilized by AB InBev to demonstrate the company’s underlying performance. Normalized EBITDA is calculated excluding the following effects from profit attributable to equity holders of AB InBev: (i) non-controlling interest; (ii) income tax expense; (iii) share of results of associates; (iv) non-underlying share of results of associates; (v) net finance cost; (vi) non-underlying net finance cost; (vii) non-underlying items above EBIT; and (viii) depreciation, amortization and impairment. Normalized EBITDA and normalized EBIT are not accounting measures under IFRS accounting and should not be considered as an alternative to profit attributable to equity holders as a measure of operational performance, or an alternative to cash flow as a measure of liquidity. Normalized EBITDA and normalized EBIT do not have a standard calculation method and AB InBev’s definition of normalized EBITDA and normalized EBIT may not be comparable to that of other companies. ab-inbev.com Press release – 5 May 2022 – 12
ab-inbev.com Press release – 5 May 2022 – 13 Recent Events Announcement of new integrated commercial structure On 21 April 2022, the company announced a newly aligned commercial leadership structure designed to accelerate the next phase of innovation and growth. Based in New York, Ricardo Tadeu, formerly Chief B2B Officer, has been appointed to the newly created role, Chief Growth Officer, reporting to AB InBev CEO, Michel Doukeris. Announcement of decision to sell interest in Russian JV On 22 April 2022, the company announced its decision to sell its non-controlling interest in the AB InBev Efes joint venture and is in active discussions with its partner, Turkish Brewer Anadolu Efes, to acquire this interest. AB InBev’s request regarding the suspension of the license for production and sale of Bud in Russia will also be part of a potential transaction. AB InBev previously announced it is forfeiting all financial benefit as a non-controlling partner from the joint venture operations. As a result, AB InBev is de-recognizing the investments in AB InBev Efes and reports a 1.1 billion USD non-cash impairment charge in non-underlying share of results of associates as part of its first quarter results announcement.
ab-inbev.com Press release – 5 May 2022 – 14 Notes To facilitate the understanding of AB InBev’s underlying performance, the analyses of growth, including all comments in this press release, unless otherwise indicated, are based on organic growth and normalized numbers. In other words, financials are analyzed eliminating the impact of changes in currencies on translation of foreign operations, and scope changes. Scope changes represent the impact of acquisitions and divestitures, the start or termination of activities or the transfer of activities between segments, curtailment gains and losses and year over year changes in accounting estimates and other assumptions that management does not consider as part of the underlying performance of the business. All references per hectoliter (per hl) exclude US non-beer activities. References to the High End Company refer to a business unit made up of a portfolio of global, specialty and craft brands across more than 30 countries. Whenever presented in this document, all performance measures (EBITDA, EBIT, profit, tax rate, EPS) are presented on a “normalized” basis, which means they are presented before non-underlying items. Non-underlying items are either income or expenses which do not occur regularly as part of the normal activities of the Company. They are presented separately because they are important for the understanding of the underlying sustainable performance of the Company due to their size or nature. Normalized measures are additional measures used by management and should not replace the measures determined in accordance with IFRS as an indicator of the Company’s performance. We are reporting the results from Argentina applying hyperinflation accounting, starting from the 3Q18 results release in which we accounted for the hyperinflation impact for the first nine months of 2018. The IFRS rules (IAS 29) require us to restate the year-to-date results for the change in the general purchasing power of the local currency, using official indices before converting the local amounts at the closing rate of the period. These impacts are excluded from organic calculations. In 1Q22, we reported a positive impact on the profit attributable to equity holders of AB InBev of 11 million USD. The impact in 1Q22 normalized EPS was 0.01 USD. Values in the figures and annexes may not add up, due to rounding. 1Q22 EPS is based upon a weighted average of 2 012 million shares compared to a weighted average of 2 003 million shares for 1Q21. Legal disclaimer This release contains “forward-looking statements”. These statements are based on the current expectations and views of future events and developments of the management of AB InBev and are naturally subject to uncertainty and changes in circumstances. The forward-looking statements contained in this release include, statements other than historical facts and include statements typically containing words such as “will”, “may”, “should”, “believe”, “intends”, “expects”, “anticipates”, “targets”, “estimates”, “likely”, “foresees” and words of similar import. All statements other than statements of historical facts are forward-looking statements. You should not place undue reliance on these forward-looking statements, which reflect the current views of the management of AB InBev, are subject to numerous risks and uncertainties about AB InBev and are dependent on many factors, some of which are outside of AB InBev’s control. There are important factors, risks and uncertainties that could cause actual outcomes and results to be materially different, including, but not limited to, the effects of the COVID-19 pandemic and uncertainties abouts its impact and duration and the risks and uncertainties relating to AB InBev described under Item 3.D of AB InBev’s Annual Report on Form 20-F filed with the SEC on 18 March 2022. Many of these risks and uncertainties are, and will be, exacerbated by the COVID-19 pandemic and ongoing conflict in Russia and Ukraine and any worsening of the global business and economic environment as a result. Other unknown or unpredictable factors could cause actual results to differ materially from those in the forward-looking statements. The forward-looking statements should be read in conjunction with the other cautionary statements that are included elsewhere, including AB InBev’s most recent Form 20-F and other reports furnished on Form 6-K, and any other documents that AB InBev has made public. Any forward-looking statements made in this communication are qualified in their entirety by these cautionary statements and there can be no assurance that the actual results or developments anticipated by AB InBev will be realized or, even if substantially realized, that they will have the expected consequences to, or effects on, AB InBev or its business or operations. Except as required by law, AB InBev undertakes no obligation to publicly update or revise any forward-looking statements, whether as a result of new information, future events or otherwise. The first quarter 2022 (1Q22) financial data set out in Figure 1 (except for the volume information), Figures 3 to 5, 7, 9 and 10 of this press release have been extracted from the group’s unaudited condensed consolidated interim financial statements as of and for the three months ended 31 March 2022, which have been reviewed by our statutory auditors PwC Réviseurs d’Entreprises SRL / PwC Bedrijfsrevisoren BV in accordance with the standards of the Public Company Accounting Oversight Board (United States). Financial data included in Figures 6, 8, 11 to 13 have been extracted from the underlying accounting records as of and for the three months ended 31 March 2022 (except for the volume information). References in this document to materials on our websites, such as www.bees.com, are included as an aid to their location and are not incorporated by reference into this document.

ab-inbev.com Press release – 5 May 2022 – 15 Conference call and webcast Investor Conference call and webcast on Thursday, 5 May 2022: 3.00pm Brussels / 2.00pm London / 9.00am New York Registration details: Webcast (listen-only mode): AB InBev 1Q22 Results Webcast To join by phone, please use one of the following two phone numbers: Toll-Free: 877-407-8029 Toll: 201-689-8029 Investors Media Shaun Fullalove Kate Laverge Tel: +1 212 573 9287 Tel: +1 917 940 7421 E-mail: [email protected] E-mail: [email protected] Maria Glukhova Ana Zenatti Tel: +32 16 276 888 Tel: +1 646 249 5440 E-mail: [email protected] E-mail: [email protected] Cyrus Nentin Tel: +1 646 746 9673 E-mail: [email protected] About Anheuser-Busch InBev Anheuser-Busch InBev is a publicly traded company (Euronext: ABI) based in Leuven, Belgium, with secondary listings on the Mexico (MEXBOL: ANB) and South Africa (JSE: ANH) stock exchanges and with American Depositary Receipts on the New York Stock Exchange (NYSE: BUD). As a company, we dream big to create a future with more cheers. We are always looking to serve up new ways to meet life’s moments, move our industry forward and make a meaningful impact in the world. We are committed to building great brands that stand the test of time and to brewing the best beers using the finest ingredients. Our diverse portfolio of well over 500 beer brands includes global brands Budweiser®, Corona® and Stella Artois®; multi-country brands Beck’s®, Hoegaarden®, Leffe® and Michelob ULTRA®; and local champions such as Aguila®, Antarctica®, Bud Light®, Brahma®, Cass®, Castle®, Castle Lite®, Cristal®, Harbin®, Jupiler®, Modelo Especial®, Quilmes®, Victoria®, Sedrin®, and Skol®. Our brewing heritage dates back more than 600 years, spanning continents and generations. From our European roots at the Den Hoorn brewery in Leuven, Belgium. To the pioneering spirit of the Anheuser & Co brewery in St. Louis, US. To the creation of the Castle Brewery in South Africa during the Johannesburg gold rush. To Bohemia, the first brewery in Brazil. Geographically diversified with a balanced exposure to developed and developing markets, we leverage the collective strengths of approximately 169,000 colleagues based in nearly 50 countries worldwide. For 2021, AB InBev’s reported revenue was 54.3 billion USD (excluding JVs and associates).
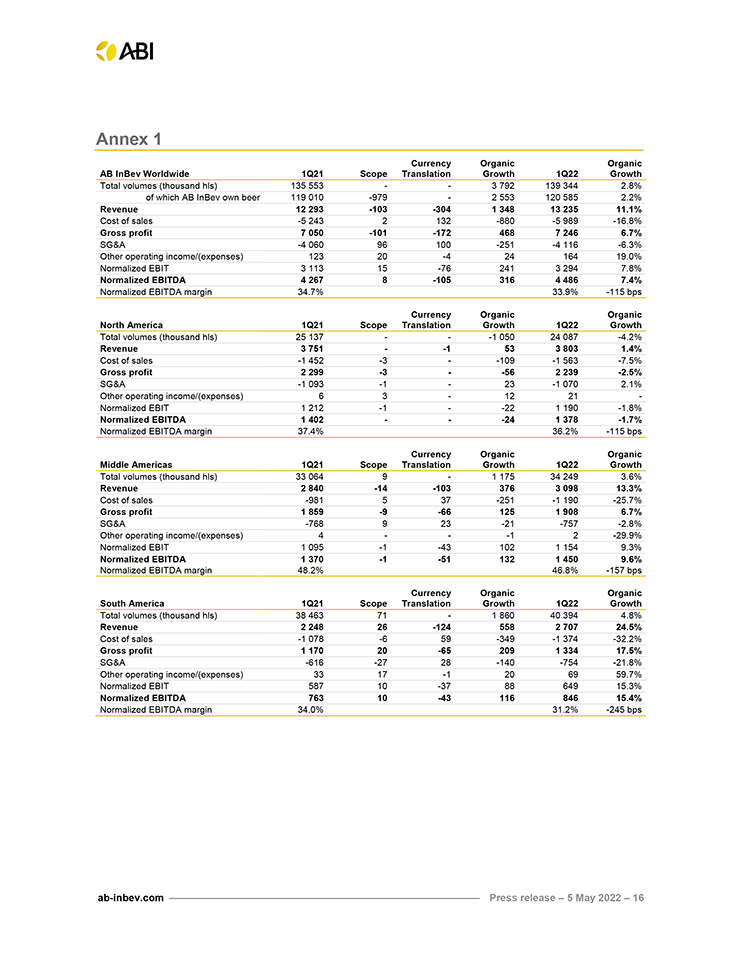
Annex 1 Currency Organic Organic AB InBev Worldwide 1Q21 Scope Translation Growth 1Q22 Growth Total volumes (thousand hls) 135 553 - - 3 792 139 344 2.8% of which AB InBev own beer 119 010 -979 - 2 553 120 585 2.2% Revenue 12 293 -103 -304 1 348 13 235 11.1% Cost of sales -5 243 2 132 -880 -5 989 -16.8% Gross profit 7 050 -101 -172 468 7 246 6.7% SG&A -4 060 96 100 -251 -4 116 -6.3% Other operating income/(expenses) 123 20 -4 24 164 19.0% Normalized EBIT 3 113 15 -76 241 3 294 7.8% Normalized EBITDA 4 267 8 -105 316 4 486 7.4% Normalized EBITDA margin 34.7% 33.9% -115 bps Currency Organic Organic North America 1Q21 Scope Translation Growth 1Q22 Growth Total volumes (thousand hls) 25 137 - - -1 050 24 087 -4.2% Revenue 3 751 - -1 53 3 803 1.4% Cost of sales -1 452 -3 - -109 -1 563 -7.5% Gross profit 2 299 -3 - -56 2 239 -2.5% SG&A -1 093 -1 - 23 -1 070 2.1% Other operating income/(expenses) 6 3 - 12 21 - Normalized EBIT 1 212 -1 - -22 1 190 -1.8% Normalized EBITDA 1 402 - - -24 1 378 -1.7% Normalized EBITDA margin 37.4% 36.2% -115 bps Currency Organic Organic Middle Americas 1Q21 Scope Translation Growth 1Q22 Growth Total volumes (thousand hls) 33 064 9 - 1 175 34 249 3.6% Revenue 2 840 -14 -103 376 3 098 13.3% Cost of sales -981 5 37 -251 -1 190 -25.7% Gross profit 1 859 -9 -66 125 1 908 6.7% SG&A -768 9 23 -21 -757 -2.8% Other operating income/(expenses) 4 - - -1 2 -29.9% Normalized EBIT 1 095 -1 -43 102 1 154 9.3% Normalized EBITDA 1 370 -1 -51 132 1 450 9.6% Normalized EBITDA margin 48.2% 46.8% -157 bps Currency Organic Organic South America 1Q21 Scope Translation Growth 1Q22 Growth Total volumes (thousand hls) 38 463 71 - 1 860 40 394 4.8% Revenue 2 248 26 -124 558 2 707 24.5% Cost of sales -1 078 -6 59 -349 -1 374 -32.2% Gross profit 1 170 20 -65 209 1 334 17.5% SG&A -616 -27 28 -140 -754 -21.8% Other operating income/(expenses) 33 17 -1 20 69 59.7% Normalized EBIT 587 10 -37 88 649 15.3% Normalized EBITDA 763 10 -43 116 846 15.4% Normalized EBITDA margin 34.0% 31.2% -245 bps ab-inbev.com Press release – 5 May 2022 – 16
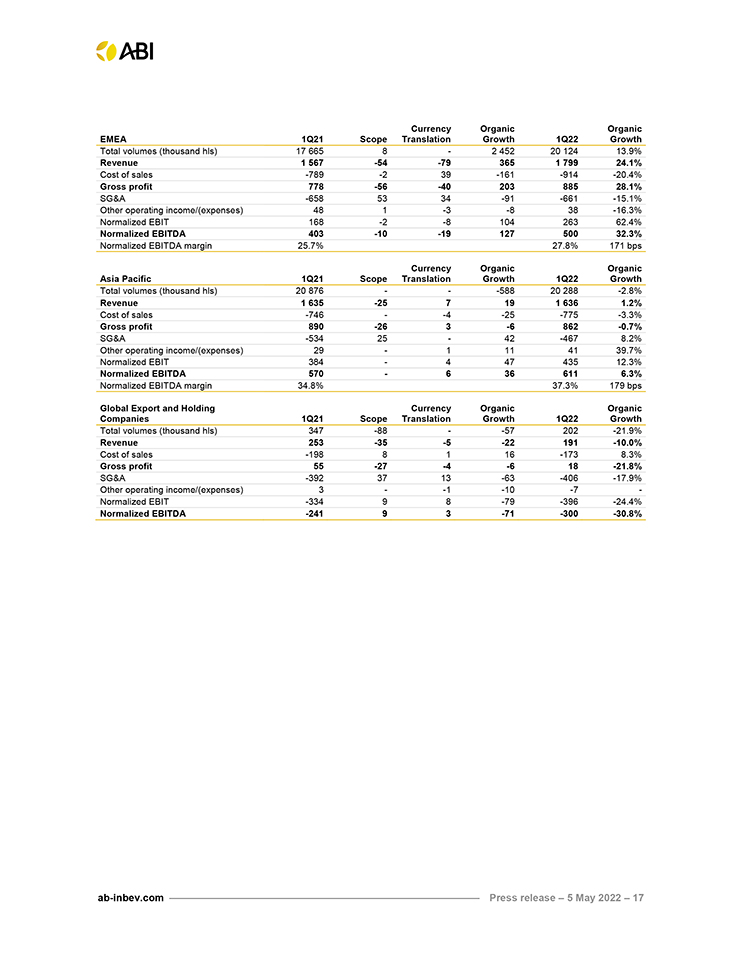
Currency Organic Organic EMEA 1Q21 Scope Translation Growth 1Q22 Growth Total volumes (thousand hls) 17 665 8 - 2 452 20 124 13.9% Revenue 1 567 -54 -79 365 1 799 24.1% Cost of sales -789 -2 39 -161 -914 -20.4% Gross profit 778 -56 -40 203 885 28.1% SG&A -658 53 34 -91 -661 -15.1% Other operating income/(expenses) 48 1 -3 -8 38 -16.3% Normalized EBIT 168 -2 -8 104 263 62.4% Normalized EBITDA 403 -10 -19 127 500 32.3% Normalized EBITDA margin 25.7% 27.8% 171 bps Currency Organic Organic Asia Pacific 1Q21 Scope Translation Growth 1Q22 Growth Total volumes (thousand hls) 20 876 - - -588 20 288 -2.8% Revenue 1 635 -25 7 19 1 636 1.2% Cost of sales -746 - -4 -25 -775 -3.3% Gross profit 890 -26 3 -6 862 -0.7% SG&A -534 25 - 42 -467 8.2% Other operating income/(expenses) 29 - 1 11 41 39.7% Normalized EBIT 384 - 4 47 435 12.3% Normalized EBITDA 570 - 6 36 611 6.3% Normalized EBITDA margin 34.8% 37.3% 179 bps Global Export and Holding Currency Organic Organic Companies 1Q21 Scope Translation Growth 1Q22 Growth Total volumes (thousand hls) 347 -88 - -57 202 -21.9% Revenue 253 -35 -5 -22 191 -10.0% Cost of sales -198 8 1 16 -173 8.3% Gross profit 55 -27 -4 -6 18 -21.8% SG&A -392 37 13 -63 -406 -17.9% Other operating income/(expenses) 3 - -1 -10 -7 - Normalized EBIT -334 9 8 -79 -396 -24.4% Normalized EBITDA -241 9 3 -71 -300 -30.8% ab-inbev.com Press release – 5 May 2022 – 17
Serious News for Serious Traders! Try StreetInsider.com Premium Free!
You May Also Be Interested In
- Dicello Levitt LLP Announces Investor Class Action Lawsuit Filed Against QuidelOrtho Corp. f/k/a Quidel Corp. (NASDAQ: QDEL) And Lead Plaintiff Deadline
- CIDARA Therapeutics ALERT: Bragar Eagel & Squire, P.C. is Investigating Cidara Therapeutics, Inc. on Behalf of Cidara Therapeutics Stockholders and Encourages Investors to Contact the Firm
- Guanajuato Silver Announces Brokered LIFE Offering of Units
Create E-mail Alert Related Categories
SEC FilingsSign up for StreetInsider Free!
Receive full access to all new and archived articles, unlimited portfolio tracking, e-mail alerts, custom newswires and RSS feeds - and more!
