

Form 424B3 Strategic Storage Trust
 Tweet
Tweet Share
ShareFiled Pursuant to Rule 424(b)(3)
Registration No. 333-256598

STRATEGIC STORAGE TRUST VI, INC.
SUPPLEMENT NO. 4 DATED MAY 20, 2022
TO THE PROSPECTUS DATED MARCH 17, 2022
This document supplements, and should be read in conjunction with, the prospectus of Strategic Storage Trust VI, Inc. dated March 17, 2022, Supplement No. 1 dated April 7, 2022, Supplement No. 2 dated April 13, 2022, and Supplement No. 3 dated May 3, 2022. Unless otherwise defined in this supplement, capitalized terms used in this supplement shall have the same meanings as set forth in the prospectus.
The purpose of this supplement is to disclose:
Our Offering
Pursuant to our private offering, which terminated on March 17, 2022, we sold approximately $100.6 million in Class P shares, or approximately 10.6 million Class P shares. On March 17, 2022, our public offering was declared effective. As of May 13, 2022, we had sold approximately 0.1 million Class A shares, 0.1 million Class T shares, and 0.1 million Class W shares for gross offering proceeds of approximately $1.9 million in our public offering. As of May 13, 2022, approximately $1.1 billion in shares remained available for sale in our public offering, including shares available pursuant to our distribution reinvestment plan.
Acquisition of Chandler Property
On April 28, 2022, an affiliate of SmartStop Self Storage REIT, Inc. assigned its interest in a purchase and sale agreement (the “Chandler PSA”) with an unaffiliated third party for the acquisition of a self storage
1
facility located in Chandler, Arizona (the “Chandler Property”) to a wholly-owned subsidiary of our operating partnership.
On May 17, 2022, we closed on the acquisition of the Chandler Property. The Chandler Property is a self storage facility that contains approximately 81,400 net rentable square feet of storage space and 590 self storage units. The purchase price of the Chandler Property was approximately $25.5 million, plus closing costs and an acquisition fee equal to approximately $0.3 million to our advisor. We funded such acquisition with net proceeds from our private and public offerings and a draw on the Huntington Credit Facility.
Update Regarding our Debt
Huntington Credit Facility
On November 30, 2021, we, through three special purpose entities (collectively, the “Borrower”) wholly owned by our operating partnership, entered into a credit agreement (the “Credit Agreement”) with Huntington National Bank (“Huntington”), as administrative agent and sole lead arranger. Under the terms of the Credit Agreement, the Borrower had an initial maximum borrowing capacity of $50 million (the “Huntington Credit Facility”), which was fully drawn as of April 26, 2022.
On May 17, 2022, we entered into an amendment and joinder to the Credit Agreement to increase the maximum borrowing capacity to a total of $100 million. In connection with the increase of the maximum borrowing capacity, we drew approximately $14.5 million of the Huntington Credit Facility to acquire the Chandler Property and added the Chandler Property as collateral to the Huntington Credit Facility.
Share Redemption Program Information
For the three months ended March 31, 2022, we did not receive any redemption requests, nor did we redeem any shares of common stock.
Update to Our Risk Factors
The following is added as an additional risk factor under the “Risk Factors — Risks Related to this Offering and an Investment in Strategic Storage Trust VI, Inc.” section of our prospectus.
We have incurred a net loss to date, have an accumulated deficit and our operations may not be profitable in 2022.
We incurred a net loss attributable to common stockholders of approximately $1.7 million for the three months ended March 31, 2022. Our accumulated deficit was approximately $4.6 million as of March 31, 2022.
Related Party Fees and Expenses
The following table summarizes related party costs incurred and paid by us for the year ended December 31, 2021 and the three months ended March 31, 2022, as well as any related amounts payable as of December 31, 2021 and March 31, 2022:
2
|
|
Year Ended December 31, 2021 |
|
Three Months Ended March 31, 2022 |
||||||||
|
|
Incurred |
|
Paid |
|
Payable |
|
Incurred |
|
Paid |
|
Payable |
Expensed |
|
|
|
|
|
|
|
|
|
|
|
|
Operating expenses |
|
$1,120,374 |
|
$997,903 |
|
$122,471 |
|
$448,280 |
|
$307,661 |
|
$263,090 |
Asset management fees |
|
178,282 |
|
156,138 |
|
22,144 |
|
155,332 |
|
175,642 |
|
1,834 |
Property management fees |
|
96,505 |
|
88,300 |
|
8,205 |
|
79,050 |
|
75,510 |
|
11,745 |
Transfer Agent expenses |
|
42,949 |
|
42,949 |
|
— |
|
55,184 |
|
50,184 |
|
5,000 |
Acquisition expenses(1) |
|
662,957 |
|
551,302 |
|
111,655 |
|
130,138 |
|
104,133 |
|
137,660 |
Capitalized |
|
|
|
|
|
|
|
|
|
|
|
|
Acquisition related(2) |
|
1,442,319 |
|
1,046,673 |
|
395,646 |
|
1,200,000 |
|
— |
|
1,595,646 |
Additional Paid-in Capital |
|
|
|
|
|
|
|
|
|
|
|
|
Offering costs |
|
501,712 |
|
436,212 |
|
65,500 |
|
— |
|
65,500 |
|
— |
Total |
|
$4,045,098 |
|
$3,319,477 |
|
$725,621 |
|
$2,067,984 |
|
$778,630 |
|
$2,014,975 |
Update to The Self Storage Industry
The following is hereby added before the final paragraph of the “The Self Storage Industry – Industry Trends and Outlook” section of our prospectus:
The chart below demonstrates trailing total compound annual returns of various asset classes through 2021(1):
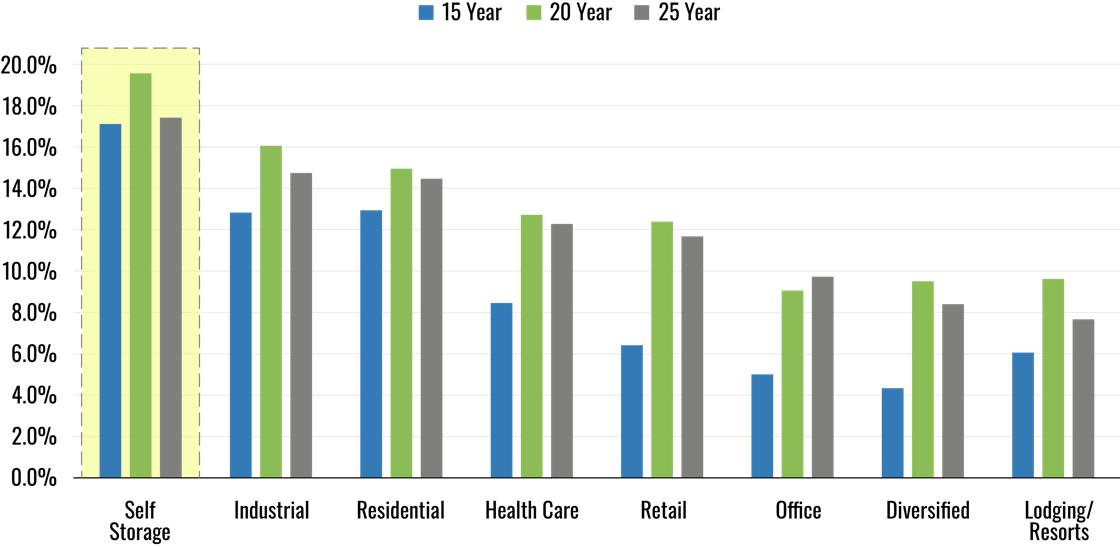
Source: Nareit
3
Updated Prior Performance Summary
The information contained in the “Prior Performance Summary” section of our prospectus is hereby deleted and replaced with the following:
PRIOR PERFORMANCE SUMMARY
The information presented in this section represents the historical experience of certain real estate programs sponsored by our sponsor and its affiliates. You should not assume that you will experience returns, if any, comparable to those experienced by investors in the prior real estate programs described herein. On June 28, 2019, SmartStop acquired the self storage advisory, asset management, property management, investment management, and certain joint venture interests of SAM, along with certain other assets (collectively, the “Self Administration Transaction”). As a result of the Self Administration Transaction, SmartStop REIT Advisors, LLC, our sponsor and an indirect wholly owned subsidiary of SmartStop, is deemed to be an affiliate of SAM for prior performance purposes relating to prior self storage programs.
The information in this section and the Prior Performance Tables included in this prospectus as Appendix C show relevant summary information regarding certain programs sponsored or co-sponsored by our sponsor or its affiliates. As described below, our sponsor or its affiliates have sponsored or co-sponsored public, non-traded REIT offerings and private offerings of real estate programs that in some cases have investment objectives, including particular investment types that are considerably similar to ours. Prior to the Self Administration Transaction, SAM was the sponsor of SmartStop, a public non-traded REIT focused on stabilized self storage properties, which closed its primary offering to new investors in January 2017; SST IV, a public non-traded REIT investing in both income-producing and growth self storage properties; and SSGT II, a private REIT investing in growth self storage properties. Following the Self Administration Transaction, SmartStop REIT Advisors, LLC, our sponsor, became the sponsor of SST IV, until such company’s merger with and into a wholly-owned subsidiary of SmartStop on March 17, 2021, and SSGT II. Our sponsor in the future may sponsor other private and public offerings of real estate programs. To the extent that such future offerings or programs remaining in operation share the same or similar investment objectives or acquire properties in the same or nearby markets, such programs may be in competition with the investments made by us. See the “CONFLICTS OF INTEREST” section of this prospectus for additional information. Programs that list substantially the same investment objectives as we do in their prospectus or private offering memorandum are considered to have investment objectives similar to ours, regardless of the particular emphasis that a program places on each objective.
The information in this summary represents the historical experience of certain programs sponsored or co-sponsored by our sponsor or its affiliates. Unless otherwise noted, the information presented herein is as of December 31, 2021.
The Prior Performance Tables set forth information as of the dates indicated regarding the prior programs described therein that invested in self storage properties, which we deem to have similar investment objectives to us, as to: (1) experience in raising and investing funds (Table I); (2) compensation to sponsor (Table II); (3) annual operating results of prior real estate programs (Table III); (4) results of completed programs (Table IV); and (5) sale or disposals of properties by prior real estate programs (Table V). The purpose of this prior
4
performance information is to enable you to evaluate accurately the experience of our sponsor and its affiliates with like programs.
Public Programs
The following discussion is intended to summarize briefly the objectives and performance of prior public programs with similar investment objectives and to disclose any material adverse business developments sustained by them.
SmartStop Self Storage, Inc.
Strategic Capital Holdings, LLC, or SCH, which is controlled by the founder of SAM, sponsored one prior public program, SmartStop Self Storage, formerly known as Strategic Storage Trust, Inc., or SSTI, a public, non-traded REIT focused on investments in self storage properties. On March 17, 2008, SmartStop Self Storage began its initial public offering of common stock. On May 22, 2008, SmartStop Self Storage satisfied the minimum offering requirements of its initial public offering and commenced formal operations. On September 16, 2011, the initial public offering was terminated, having raised gross proceeds of approximately $289 million.
On September 22, 2011, SmartStop Self Storage commenced its follow-on public offering of stock. On April 2, 2012, SmartStop Self Storage announced that its board had approved an estimated value per share of SmartStop Self Storage’s common stock of $10.79 based on the estimated value of SmartStop Self Storage’s assets less the estimated value of SmartStop Self Storage’s liabilities, or net asset value, divided by the number of shares outstanding on an adjusted fully diluted basis, calculated as of December 31, 2011. Effective June 1, 2012, SmartStop Self Storage raised its offering price for shares sold in the follow-on offering from $10.00 per share to $10.79 per share. On September 22, 2013, the follow-on offering was terminated, having raised gross proceeds of approximately $251 million. SmartStop Self Storage raised approximately $541 million of gross offering proceeds from approximately 16,200 investors as of the close of its follow-on offering. On September 5, 2014, SmartStop Self Storage announced that its board of directors had approved an estimated value per share of SmartStop Self Storage’s common stock of $10.81 based on the estimated value of SmartStop Self Storage’s assets less the estimated value of SmartStop Self Storage’s liabilities, or net asset value, divided by the number of shares outstanding on an adjusted fully diluted basis, calculated as of June 30, 2014.
In addition to its initial public offering and follow-on offering, in September 2009, SmartStop Self Storage also issued approximately 6.2 million shares in connection with the mergers of two privately-offered REITs sponsored by affiliates of SAM and that were organized to invest primarily in self storage properties (the “SmartStop Mergers”). SmartStop Self Storage acquired 11 properties in connection with the SmartStop Mergers. Those properties consisted of approximately 8,500 units and 1.4 million rentable square feet.
Through September 30, 2015, with a combination of debt and offering proceeds from its initial public offering and follow-on offering, SmartStop Self Storage invested approximately $614 million in 111 properties in 17 states and Canada consisting of approximately 68,900 units and 8.8 million rentable square feet. Based on the amount invested in these properties, approximately 97% was spent on existing self storage properties and 3% was spent on construction or redevelopment of self storage properties. As a percentage of the aggregate purchase price, the allocation of financing proceeds for these 111 properties was 58% debt proceeds and 42% equity.
On October 1, 2015, SmartStop Self Storage and Extra Space closed on a merger transaction in which SmartStop Self Storage was acquired by Extra Space for $13.75 per share in cash, representing an enterprise value of approximately $1.4 billion.
5
Below is a summary of relevant information of the properties purchased with proceeds from SmartStop Self Storage’s initial public offering and follow-on offering:
State |
|
No. of |
|
|
Units |
|
|
Sq. Ft. |
|
|
% of Total |
|
|
% of |
|
|||||
Alabama(2) |
|
|
2 |
|
|
|
1,135 |
|
|
|
161,900 |
|
|
|
1.8 |
% |
|
|
2.0 |
% |
Arizona |
|
|
4 |
|
|
|
1,975 |
|
|
|
243,900 |
|
|
|
2.8 |
% |
|
|
1.5 |
% |
California(2) |
|
|
7 |
|
|
|
5,140 |
|
|
|
581,900 |
|
|
|
6.6 |
% |
|
|
11.5 |
% |
Florida |
|
|
9 |
|
|
|
6,170 |
|
|
|
668,500 |
|
|
|
7.6 |
% |
|
|
9.0 |
% |
Georgia |
|
|
22 |
|
|
|
12,990 |
|
|
|
1,708,900 |
|
|
|
19.4 |
% |
|
|
17.7 |
% |
Illinois(3) |
|
|
4 |
|
|
|
2,455 |
|
|
|
394,000 |
|
|
|
4.5 |
% |
|
|
2.2 |
% |
Kentucky |
|
|
5 |
|
|
|
2,870 |
|
|
|
415,700 |
|
|
|
4.7 |
% |
|
|
3.2 |
% |
Mississippi |
|
|
3 |
|
|
|
1,495 |
|
|
|
224,300 |
|
|
|
2.6 |
% |
|
|
2.2 |
% |
Nevada |
|
|
6 |
|
|
|
4,015 |
|
|
|
551,100 |
|
|
|
6.3 |
% |
|
|
5.0 |
% |
New Jersey |
|
|
6 |
|
|
|
4,660 |
|
|
|
445,400 |
|
|
|
5.1 |
% |
|
|
8.7 |
% |
New York |
|
|
1 |
|
|
|
700 |
|
|
|
82,800 |
|
|
|
0.9 |
% |
|
|
0.8 |
% |
North Carolina |
|
|
3 |
|
|
|
1,560 |
|
|
|
207,600 |
|
|
|
2.4 |
% |
|
|
1.5 |
% |
Ontario, Canada(4) |
|
|
4 |
|
|
|
3,695 |
|
|
|
411,600 |
|
|
|
4.7 |
% |
|
|
4.9 |
% |
Pennsylvania |
|
|
4 |
|
|
|
2,210 |
|
|
|
285,700 |
|
|
|
3.2 |
% |
|
|
1.8 |
% |
South Carolina |
|
|
12 |
|
|
|
6,765 |
|
|
|
931,800 |
|
|
|
10.6 |
% |
|
|
10.3 |
% |
Tennessee |
|
|
3 |
|
|
|
1,840 |
|
|
|
254,600 |
|
|
|
2.9 |
% |
|
|
4.5 |
% |
Texas |
|
|
11 |
|
|
|
5,960 |
|
|
|
875,100 |
|
|
|
10.0 |
% |
|
|
8.6 |
% |
Virginia |
|
|
5 |
|
|
|
3,280 |
|
|
|
343,900 |
|
|
|
3.9 |
% |
|
|
4.6 |
% |
Total |
|
111(5) |
|
|
|
68,915 |
|
|
|
8,788,700 |
|
|
|
100 |
% |
|
|
100 |
% |
|
(1) Includes all rentable square feet consisting of storage spaces, parking and commercial office units.
(2) Does not include properties in which SmartStop Self Storage owned a minority interest, including the interests owned in the San Francisco Self Storage DST property, Montgomery County Self Storage, DST properties and the Hawthorne property.
(3) Includes approximately 85,000 rentable square feet of industrial warehouse/office space at the Chicago – Ogden Ave. property.
(4) All of these Canadian properties were located within the Greater Toronto metropolitan area.
(5) Excludes the 11 properties acquired in connection with the SmartStop Mergers consisting of approximately 8,500 units and 1.4 million rentable square feet and properties acquired during 2014 with proceeds from sources other than the initial public offering and follow-on offering.
SmartStop Self Storage REIT, Inc.
Prior to the closing of the Self Administration Transaction, SAM served as the sponsor of SmartStop, formerly known as Strategic Storage Trust II, Inc., or SST II, another non-traded REIT focused on investments in self storage properties that was registered to sell up to $1.095 billion of its shares in a public offering. Our current sponsor is an indirect wholly owned subsidiary of SmartStop. On January 10, 2014, SmartStop’s public offering was declared effective. On May 23, 2014, SmartStop reached its minimum offering amount of $1.5 million in sales of shares and SmartStop commenced operations. On April 8, 2016, SmartStop’s board of directors approved an estimated value per share of SmartStop’s common stock of $10.09 for both Class A shares and Class T shares based on the estimated value of SmartStop’s assets less the estimated value of SmartStop’s liabilities, or net asset value, divided by the number of shares outstanding on an adjusted fully diluted basis, calculated as of December 31, 2015. As a result, effective April 14, 2016, SmartStop raised the offering price for Class A shares sold in its primary offering from $10.00 per share to $11.21 per share and the offering price for Class T shares sold in its primary offering from $9.47 per share to $10.62 per share. In addition, effective April 21, 2016, the price per share for shares sold pursuant to SmartStop’s distribution reinvestment plan increased from $9.50 per share to $10.09 per share for both Class A and Class T shares.
On January 9, 2017, SmartStop closed its primary offering to new investors. SmartStop sold approximately $493 million in Class A shares and approximately $73 million in Class T shares pursuant to its public offering and had a total of approximately 13,000 investors.
6
On April 13, 2017, SmartStop’s board of directors approved an estimated value per share of SmartStop’s common stock of $10.22 for both Class A shares and Class T shares based on the estimated value of SmartStop’s assets less the estimated value of SmartStop’s liabilities, or net asset value, divided by the number of shares outstanding on an adjusted fully diluted basis, calculated as of December 31, 2016. As a result, effective in May 2017, the price per share for shares sold pursuant to SmartStop’s distribution reinvestment plan increased from $10.09 per share to $10.22 per share for both Class A and Class T shares. On April 19, 2018, SmartStop’s board of directors approved an estimated value per share of SmartStop’s common stock of $10.65 for both Class A shares and Class T shares based on the estimated value of SmartStop’s assets less the estimated value of SmartStop’s liabilities, or net asset value, divided by the number of shares outstanding on an adjusted fully diluted basis, calculated as of December 31, 2017. As a result, effective in May 2018, the price per share for shares sold pursuant to SmartStop’s distribution reinvestment plan increased from $10.22 per share to $10.65 per share for both Class A and Class T shares. On June 26, 2019, SmartStop’s board of directors approved an estimated value per share of SmartStop’s common stock of $10.66 for both Class A shares and Class T shares based on the estimated value of SmartStop’s assets less the estimated value of SmartStop’s liabilities, or net asset value, divided by the number of shares outstanding on an adjusted fully diluted basis, calculated as of March 31, 2019. As a result, effective in July 2019, the price per share for shares sold pursuant to SmartStop’s distribution reinvestment plan increased from $10.65 per share to $10.66 per share for both Class A and Class T shares. On April 20, 2020, SmartStop’s board of directors approved an estimated value per share of SmartStop’s common stock of $10.40 for both Class A shares and Class T shares based on the estimated value of SmartStop’s assets less the estimated value of SmartStop’s liabilities, or net asset value, divided by the number of shares outstanding on an adjusted fully diluted basis, calculated as of December 31, 2019. As a result, effective in May 2020, the price per share for shares sold pursuant to SmartStop’s distribution reinvestment plan decreased from $10.66 per share to $10.40 per share for both Class A and Class T shares. On October 19, 2021, SmartStop’s board of directors approved an estimated value per share of SmartStop’s common stock of $15.08 for both Class A shares and Class T shares based on the estimated value of SmartStop’s assets less the estimated value of SmartStop’s liabilities, or net asset value, divided by the number of shares outstanding on an adjusted fully diluted basis, calculated as of June 30, 2021. As a result, effective in November 2021, the price per share for shares sold pursuant to SmartStop’s distribution reinvestment plan increased from $10.40 per share to $15.08 per share for both Class A and Class T shares.
On October 29, 2019, SmartStop entered into a preferred stock purchase agreement with an affiliate of Extra Space, pursuant to which Extra Space committed to purchase up to $200 million in shares of SmartStop’s Series A Convertible Preferred Stock (the “SmartStop Preferred Stock”), in one or more closings. The initial closing in the amount of $150 million occurred on October 29, 2019. Pursuant to the preferred stock purchase agreement, Extra Space committed to purchase up to an additional $50 million, at SmartStop’s option, which SmartStop subsequently exercised. Accordingly, on October 26, 2020, Extra Space purchased the remaining $50 million in shares of SmartStop Preferred Stock.
As noted below in “Strategic Storage Growth Trust, Inc.,” on January 24, 2019, SmartStop acquired SSGT in a merger whereby SSGT merged with and into a wholly-owned subsidiary of SmartStop in exchange for merger consideration equal to $12.00 per share cash for each share of SSGT common stock, representing a total purchase price of approximately $350 million (which includes assumption of SSGT debt and net liabilities) (the “SSGT Merger”). Accordingly, as of January 24, 2019, SmartStop became the owner of all of the properties previously owned by SSGT. On July 11, 2019, SmartStop acquired a property that was previously under contract with SSGT.
As noted below in “Strategic Storage Trust IV, Inc.,” on March 17, 2021, SmartStop acquired SST IV in a merger whereby SST IV merged with and into a wholly-owned subsidiary of SmartStop in which stockholders of SST IV received 2.1875 shares of SmartStop’s Class A common stock for each share of common stock of SST IV. Accordingly, as of March 17, 2021, SmartStop became the owner of all of the properties previously owned by SST IV. As of December 31, 2021, SmartStop had not effectuated a liquidity event and is still within the time period specified in its prospectus for such an event.
7
Through December 31, 2021, with a combination of debt and offering proceeds from its public offering, SmartStop invested approximately $848 million in 84 self storage properties located in 15 states and Ontario, Canada, comprising approximately 52,240 units and approximately 6.1 million rentable square feet. Based on the amount invested in these properties, approximately 4% was spent on new self storage properties, 95% was spent on existing self storage properties and 1% was spent on construction or redevelopment of self storage properties. As a percentage of the aggregate purchase price, the allocation of financing proceeds for these 84 properties was approximately 48% debt proceeds and 52% equity. Below is a summary of these 84 properties as of December 31, 2021:
State |
|
No. of |
|
Units(1) |
|
|
Sq. Ft. |
|
|
% of Total |
|
|
Physical |
|
|
Rental |
|
|||||
Alabama |
|
1 |
|
|
1,090 |
|
|
|
163,300 |
|
|
|
2.70 |
% |
|
|
92.2 |
% |
|
|
1.4 |
% |
Arizona |
|
1 |
|
980 |
|
|
|
96,500 |
|
|
|
1.60 |
% |
|
|
98.1 |
% |
|
|
1.1 |
% |
|
California |
|
19 |
|
|
11,490 |
|
|
|
1,231,800 |
|
|
|
20.00 |
% |
|
|
95.5 |
% |
|
|
25.0 |
% |
Colorado |
|
4 |
|
|
2,080 |
|
|
|
224,500 |
|
|
|
3.70 |
% |
|
|
94.7 |
% |
|
|
4.1 |
% |
Florida |
|
13 |
|
|
10,240 |
|
|
|
1,237,500 |
|
|
|
20.10 |
% |
|
|
95.8 |
% |
|
|
23.3 |
% |
Illinois |
|
2 |
|
|
1,020 |
|
|
|
107,700 |
|
|
|
1.80 |
% |
|
|
96.2 |
% |
|
|
1.4 |
% |
Indiana |
|
2 |
|
|
1,030 |
|
|
|
112,700 |
|
|
|
1.80 |
% |
|
|
92.7 |
% |
|
|
1.1 |
% |
Maryland |
|
2 |
|
|
1,610 |
|
|
|
169,500 |
|
|
|
2.80 |
% |
|
|
93.9 |
% |
|
|
2.7 |
% |
Michigan |
|
4 |
|
|
2,220 |
|
|
|
266,100 |
|
|
|
4.30 |
% |
|
|
94.4 |
% |
|
|
3.5 |
% |
New Jersey |
|
1 |
|
450 |
|
|
|
47,100 |
|
|
|
0.80 |
% |
|
|
97.2 |
% |
|
|
0.8 |
% |
|
Nevada |
|
3 |
|
|
2,220 |
|
|
|
289,900 |
|
|
|
4.70 |
% |
|
|
95.7 |
% |
|
|
4.4 |
% |
North Carolina |
|
14 |
|
|
5,760 |
|
|
|
817,900 |
|
|
|
13.30 |
% |
|
|
95.9 |
% |
|
|
9.7 |
% |
Ohio |
|
5 |
|
|
2,310 |
|
|
|
279,700 |
|
|
|
4.60 |
% |
|
|
92.9 |
% |
|
|
2.7 |
% |
South Carolina |
|
2 |
|
|
1,450 |
|
|
|
197,800 |
|
|
|
3.20 |
% |
|
|
94.7 |
% |
|
|
2.2 |
% |
Washington |
|
1 |
|
490 |
|
|
|
48,500 |
|
|
|
0.80 |
% |
|
|
91.0 |
% |
|
|
0.8 |
% |
|
Ontario, Canada |
|
10 |
|
|
7,800 |
|
|
|
849,600 |
|
|
|
13.80 |
% |
|
|
93.0 |
% |
|
|
15.8 |
% |
Total |
|
84 (5)(6) |
|
|
52,240 |
|
|
|
6,140,100 |
|
|
|
100 |
% |
|
|
95.1 |
% |
|
|
100 |
% |
(1) Includes all rentable units, consisting of storage units and parking (approximately 2,000 units).
(2) Includes all rentable square feet consisting of storage units and parking (approximately 550,000 square feet).
(3) Represents the occupied square feet of all facilities SmartStop owned in a state or province divided by total rentable square feet of all the facilities SmartStop owned in such state as of December 31, 2021.
(4) Represents rental income (excludes administrative fees, late fees, and other ancillary income) for all facilities SmartStop owned in a state or province divided by its total rental income for the month of December 2021.
(5) Excludes the 28 properties acquired in connection with the SSGT Merger, consisting of approximately 19,400 units and 2.1 million rentable square feet, which properties were not acquired with proceeds of SmartStop’s public offering. Such properties are reflected in the discussion regarding SSGT below.
(6) Excludes the 24 wholly-owned properties acquired in connection with the SST IV Merger on March 17, 2021, consisting of approximately 17,820 units and 2.0 million rentable square feet, which properties were not acquired with proceeds of SmartStop’s public offering. Such properties are reflected in the discussion regarding SST IV below.
See Table III of the Prior Performance Tables for more detailed information as to the operating results of SmartStop.
Strategic Storage Growth Trust, Inc.
SAM also sponsored SSGT, another non-traded REIT focused on investments in self storage properties that registered to sell up to $1.095 billion of its shares in a public offering. On June 17, 2013, SSGT commenced a private offering of up to $109.5 million in shares of SSGT’s common stock to accredited investors only pursuant to a confidential private placement memorandum. On May 23, 2014, SSGT reached the minimum offering amount of $1.0 million in sales of shares in its private offering and SSGT commenced operations. On January 16,
8
2015, SSGT terminated the private offering, having raised a total of $7.8 million. On January 20, 2015, SSGT’s public offering was declared effective.
On April 8, 2016, SSGT’s board of directors approved an estimated value per share of SSGT’s common stock of $10.05 for both Class A shares and Class T shares based on the estimated value of SSGT’s assets less the estimated value of SSGT’s liabilities, or net asset value, divided by the number of shares outstanding on an adjusted fully diluted basis, calculated as of December 31, 2015. As a result, effective April 14, 2016, SSGT raised the offering price for Class A shares sold in its primary offering from $10.00 per share to $11.17 per share and the offering price for Class T shares sold in its primary offering from $9.47 per share to $10.58 per share. In addition, effective April 21, 2016, the price per share for shares sold pursuant to SSGT’s distribution reinvestment plan increased from $9.50 per share to $10.05 per share for both Class A and Class T shares.
On March 31, 2017, SSGT closed its primary offering to new investors. Investors who submitted subscriptions in accordance with SSGT’s close down procedures and were accepted by SSGT were admitted as stockholders effective as of March 31, 2017. Pursuant to its public offering, SSGT sold approximately $193 million in Class A shares and approximately $79 million in Class T shares and had a total of approximately 6,300 investors.
On April 13, 2017, SSGT’s board of directors approved an estimated value per share of SSGT’s common stock of $11.56 for both Class A shares and Class T shares based on the estimated value of SSGT’s assets less the estimated value of SSGT’s liabilities, or net asset value, divided by the number of shares outstanding on an adjusted fully diluted basis, calculated as of December 31, 2016. As a result, effective in May 2017, the price per share for shares sold pursuant to SSGT’s distribution reinvestment plan increased from $10.05 per share to $11.56 per share for both Class A and Class T shares. On April 19, 2018, SSGT’s board of directors approved an estimated value per share of SSGT’s common stock of $11.58 for both Class A shares and Class T shares based on the estimated value of SSGT’s assets less the estimated value of SSGT’s liabilities, or net asset value, divided by the number of shares outstanding on an adjusted fully diluted basis, calculated as of December 31, 2017. As a result, effective in May 2018, the price per share for shares sold pursuant to SSGT’s distribution reinvestment plan increased from $11.56 per share to $11.58 per share for both Class A and Class T shares.
On August 10, 2018, SSGT’s board of directors approved the suspension of SSGT’s distribution reinvestment plan effective as of August 23, 2018. On January 24, 2019, SmartStop acquired SSGT in a merger whereby SSGT merged with and into a wholly-owned subsidiary of SmartStop in exchange for merger consideration equal to $12.00 per share cash for each share of SSGT common stock. Accordingly, as of January 24, 2019, SmartStop owned all of the properties previously owned by SSGT. On July 11, 2019, SmartStop acquired a property that was previously under contract with SSGT.
Through December 31, 2018, with a combination of debt and offering proceeds from its private and public offerings, SSGT invested approximately $237.3 million in 29 self storage properties located in 10 states and in the Greater Toronto Ontario, Canada area, comprising approximately 19,800 self storage units and 2.2 million rentable square feet. SSGT did not acquire any properties after December 31, 2018. Based on the amount invested in these properties, approximately 36% was spent on new self storage properties, 61% was spent on existing self storage properties and 3% was spent on construction or redevelopment of self storage properties. As a percentage of the aggregate purchase price, the allocation of financing proceeds for these 29 properties was
9
approximately 18% debt proceeds and 82% equity. In October 2019, one of the Texas properties was sold to an unaffiliated third party. Below is a summary of the 28 remaining properties, as of December 31, 2021:
State |
|
No. of |
|
|
Units(1) |
|
|
Sq. Ft. |
|
|
% of Total |
|
|
Physical |
|
|
Rental |
|
|
||||||
Arizona |
|
1 |
|
|
840 |
|
|
|
89,800 |
|
|
|
4.20 |
% |
|
|
94.6 |
% |
|
|
4.3 |
% |
|
||
California |
|
5 |
|
|
|
3,630 |
|
|
|
370,500 |
|
|
|
17.20 |
% |
|
|
96.5 |
% |
|
|
20.4 |
% |
|
|
Colorado |
|
2 |
|
|
|
1,160 |
|
|
|
124,500 |
|
|
|
5.80 |
% |
|
|
91.8 |
% |
|
|
4.3 |
% |
|
|
Florida |
|
4 |
|
|
|
2,930 |
|
|
|
293,100 |
|
|
|
13.60 |
% |
|
|
96.0 |
% |
|
|
14.3 |
% |
|
|
Illinois |
|
3 |
|
|
|
1,860 |
|
|
|
207,900 |
|
|
|
9.70 |
% |
|
|
94.2 |
% |
|
|
7.7 |
% |
|
|
Massachusetts |
|
1 |
|
|
840 |
|
|
|
93,200 |
|
|
|
4.30 |
% |
|
|
97.8 |
% |
|
|
9.7 |
% |
|
||
Nevada |
|
3 |
|
|
|
2,730 |
|
|
|
335,900 |
|
|
|
15.60 |
% |
|
|
96.1 |
% |
|
|
14.7 |
% |
|
|
North Carolina |
|
3 |
|
|
|
1,530 |
|
|
|
197,800 |
|
|
|
9.20 |
% |
|
|
92.7 |
% |
|
|
6.2 |
% |
(4) |
|
South Carolina |
|
1 |
|
|
490 |
|
|
|
48,200 |
|
|
|
2.20 |
% |
|
|
96.3 |
% |
|
|
2.0 |
% |
|
||
Texas |
|
3 |
|
|
|
1,700 |
|
|
|
230,500 |
|
|
|
10.70 |
% |
|
|
94.7 |
% |
|
|
9.4 |
% |
|
|
Toronto, Canada |
|
2 |
|
|
|
1,740 |
|
|
|
161,200 |
|
|
|
7.50 |
% |
|
|
93.3 |
% |
|
|
7.0 |
% |
|
|
Total |
|
|
28 |
|
|
|
19,450 |
|
|
|
2,152,600 |
|
|
|
100 |
% |
|
95.1%(3) |
|
|
|
100 |
% |
|
|
(1) Includes all rentable units, consisting of storage units, and parking units (approximately 450 units).
(2) Includes all rentable square feet consisting of storage units, and parking units (approximately 130,000 square feet).
(3) Represents the occupied square feet of all facilities SSGT owned in a state divided by total rentable square feet of all the facilities SSGT owned in such state as of December 31, 2020.
(4) Represents rental income for all facilities SSGT owned in a state divided by its total rental income for the month of December 2020.
See Table III of the Prior Performance Tables for more detailed information as to the operating results of SSGT. Also see Table IV of the Prior Performance Tables for more detailed information on the completed program results for SSGT.
Strategic Storage Trust IV, Inc.
Prior to the Self Administration Transaction, SAM was the sponsor of SST IV, a non-traded REIT that registered to sell up to $1.095 billion of its shares in a public offering. On January 25, 2017, SST IV sold approximately 360,577 Class A shares for $7.5 million to an institutional investor pursuant to a private offering transaction. On March 17, 2017, SST IV’s public offering was declared effective. As of December 31, 2019, SST IV had issued in its public offering approximately 4,396,000 Class A shares for gross offering proceeds of approximately $109.5 million, approximately 3,628,000 Class T shares for gross offering proceeds of approximately $87.8 million, and approximately 978,000 Class W shares for gross offering proceeds of approximately $22.4 million.
On June 20, 2019, SST IV’s board of directors approved an estimated value per share of SST IV’s common stock of $22.65 for each of its Class A, Class T, and Class W shares based on the estimated value of SST IV’s assets less the estimated value of SST IV’s liabilities, or net asset value, divided by the number of shares outstanding on an adjusted fully diluted basis, calculated as of March 31, 2019. As a result, effective in June 2019, the price per share for shares sold pursuant to SST IV’s primary offering for its Class A, Class T, and Class W shares changed to $24.89, $24.10, and $22.65, respectively, and, effective in July 2019, the price per share sold pursuant to SST IV’s distribution reinvestment plan changed from $22.75 per share to $22.65 per share for each of Class A, Class T, and Class W shares. On June 29, 2020, SST IV’s board of directors approved an estimated value per share of SST IV’s common stock of $22.65 for each of its Class A, Class T, and Class W shares based on the estimated value of SST IV’s assets less the estimated value of SST IV’s liabilities, or net asset value, divided by the number of shares outstanding on an adjusted fully diluted basis, calculated as of March 31, 2020. As a result, effective in June 2020, the price per share for shares sold pursuant to SST IV’s distribution
10
reinvestment plan remained $22.65 per share for each of Class A, Class T, and Class W shares; SST IV’s primary offering was suspended as of April 30, 2020 and terminated on September 11, 2020.
On March 17, 2021, SmartStop acquired SST IV in a merger whereby SST IV merged with and into a wholly-owned subsidiary of SmartStop in which stockholders of SST IV received 2.1875 shares of SmartStop’s Class A common stock for each share of common stock of SST IV. Accordingly, as of March 17, 2021, SmartStop owns all of the properties previously owned by SST IV.
Through December 31, 2020, with offering proceeds from its private and public offerings, SST IV invested approximately $304 million in 24 wholly-owned self storage properties located in nine states, comprising approximately 18,000 units and 2.0 million rentable square feet, and approximately $10 million in five unconsolidated real estate development ventures located in the Greater Toronto Area of Ontario, Canada, in each of which SST IV, through its subsidiaries, owned a 50% equity interest. Based on the amount invested in these properties, 100% was spent on existing self storage properties. As of December 31, 2020, SST IV’s total indebtedness was approximately $89.7 million of variable rate debt and approximately $42.5 million of fixed rate debt, less approximately $0.7 million in net debt issuance costs.
Upon the SST IV Merger, SmartStop acquired all of the real estate owned by SST IV, consisting of 24 wholly-owned self storage properties located across nine states and six unconsolidated real estate development ventures located in the Greater Toronto Area of Ontario, Canada. The unconsolidated real estate development ventures consisted of three operating properties and three properties in various stages of development. A summary of SST IV’s real estate portfolio is as follows (as of December 31, 2021):
State |
|
No. of |
|
Units(1) |
|
|
Sq. Ft. |
|
|
% of Total |
|
|
Physical |
|
|
Rental |
|
|||||
Arizona |
|
1 |
|
720 |
|
|
|
78,700 |
|
|
|
3.90 |
% |
|
|
93.1 |
% |
|
|
3.6 |
% |
|
California |
|
2 |
|
|
1,620 |
|
|
|
153,700 |
|
|
|
7.70 |
% |
|
|
94.0 |
% |
|
|
7.9 |
% |
Florida |
|
5 |
|
|
3,840 |
|
|
|
519,200 |
|
|
|
26.00 |
% |
|
|
95.3 |
% |
|
|
25.7 |
% |
North Carolina |
|
2 |
|
|
1,900 |
|
|
|
176,700 |
|
|
|
8.80 |
% |
|
|
94.7 |
% |
|
|
8.3 |
% |
New Jersey |
|
1 |
|
|
1,900 |
|
|
|
158,000 |
|
|
|
5.30 |
% |
|
|
88.2 |
% |
|
|
9.1 |
% |
Nevada |
|
2 |
|
|
1,260 |
|
|
|
131,300 |
|
|
|
6.60 |
% |
|
|
95.5 |
% |
|
|
7.7 |
% |
Texas |
|
8 |
|
|
4,620 |
|
|
|
614,100 |
|
|
|
30.70 |
% |
|
|
95.5 |
% |
|
|
25.1 |
% |
Virginia |
|
1 |
|
830 |
|
|
|
71,100 |
|
|
|
3.60 |
% |
|
|
95.3 |
% |
|
|
4.8 |
% |
|
Washington |
|
2 |
|
|
1,190 |
|
|
|
148,100 |
|
|
|
7.40 |
% |
|
|
95.4 |
% |
|
|
7.8 |
% |
Total |
|
24 |
|
|
17,880 |
|
|
|
2,050,900 |
|
|
|
100 |
% |
|
94.8%(3) |
|
|
|
100 |
% |
|
(1) Includes all rentable units, consisting of storage units and parking (approximately 690 units).
(2) Includes all rentable square feet, consisting of storage units and parking (approximately 250,000 square feet).
(3) Represents the occupied square feet of all facilities SST IV owned in a state divided by total rentable square feet of all the facilities SST IV owned in such state as of December 31, 2021.
(4) Represents rental income (excludes administrative fees, late fees, and other ancillary income) for all facilities SST IV owned in a state divided by SST IV’s total rental income for the month ended December 31, 2021.
In certain instances, our sponsor and its affiliates have agreed to make certain accommodations that benefit the owners of these public programs, such as the deferral of payment or waiver of both asset and property management fees and related reimbursable expenses otherwise payable to our sponsor or its affiliates. Although real estate programs in general are subject to being affected by the cyclical nature of the real estate market and general risks associated with investments in real estate, at this time, we are not aware of any major adverse business developments or conditions relative to these public programs, or any other program sponsored or co-sponsored by our sponsor or SAM or its affiliates, that would be material to investors in this offering.
11
Private Programs
The following discussion is intended to summarize briefly the objectives and performance of prior privately-offered programs (the “Private Programs”) with similar investment objectives and to disclose any material adverse business developments sustained by them.
The completed offering for Private Programs sponsored or co-sponsored by our sponsor or its affiliates include one privately-offered REIT and two multi-asset Delaware Statutory Trust (“DST”) offerings. These three Private Programs raised approximately $135 million of gross offering proceeds from approximately 1,530 investors.
With a combination of debt and offering proceeds, these Private Programs invested approximately $193 million in 25 properties located in nine states. Based on the aggregate amount of acquisition costs, approximately 100% was spent on existing or used properties and none on construction or redevelopment properties. Over the course of two of the three Private Programs, 15 properties were sold or merged into SmartStop Self Storage. As a percentage of the aggregate amount of acquisition costs, the diversification of these 25 properties by geographic area is as follows:
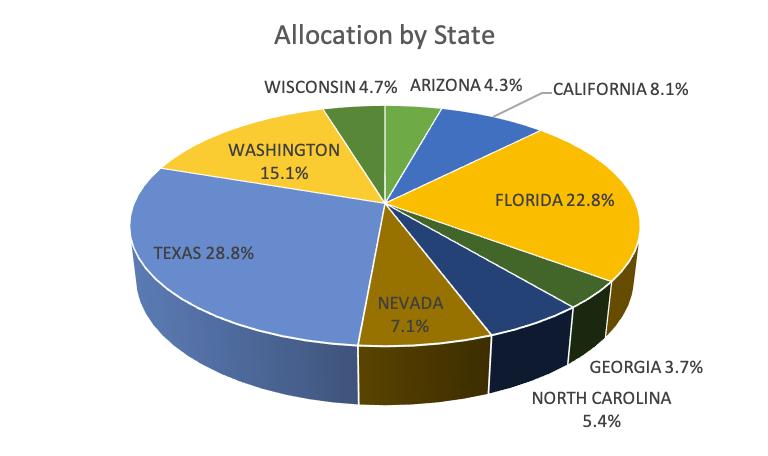
As a percentage of the aggregate amount of acquisition and development costs, the allocation of financing proceeds for these 25 properties is 56% equity and 44% debt proceeds.
In total, the properties within all Private Programs had an aggregate of approximately 1.9 million square feet of gross leasable space.
In certain instances, the sponsor of these programs, and its affiliates, have agreed to make certain accommodations to benefit the owners of these properties, such as the deferral of asset management fees otherwise payable to the sponsor or its affiliates. Our business may be affected by similar conditions. Although certain Private Programs sponsored or co-sponsored by our sponsor or its affiliates have been adversely affected by the cyclical nature of the real estate market and general risks associated with investments in real estate, at this time, we are not aware of any other adverse business developments other than those described above relative to the prior programs that would be material to investors.
No assurance can be made that our program or other programs sponsored by our sponsor or its affiliates will ultimately be successful in meeting their investment objectives. Below is a summary of the three Private
12
Programs previously sponsored by our sponsor or its affiliates that we believe are most similar to this offering (i.e., programs focusing on self storage). All of such programs have completed operations.
Strategic Storage Growth Trust II, Inc.
Prior to the Self Administration Transaction, SAM was the sponsor of SSGT II, a private REIT that was engaged in a private placement offering of up to $270 million. On September 30, 2020, the private offering was closed to new investors, although SSGT II continued to offer shares of common stock to its existing stockholders pursuant to its distribution reinvestment plan through February 2022. SSGT II received approximately $110.8 million in offering proceeds from the sale of its common stock pursuant to the primary private offering. As of December 31, 2021, SSGT II had received approximately $5.8 million in proceeds from the sale of its common stock pursuant to its distribution reinvestment plan. As of December 31, 2021, with a combination of approximately 20% debt and 80% offering proceeds, SSGT II had invested approximately $143 million in ten operating self storage properties located in seven states (Arizona, California, Texas, Florida, Nevada, Washington, and Wisconsin) as well as in two unconsolidated real estate ventures located in the Greater Toronto Area of Ontario, Canada, in each of which SSGT II, through its subsidiaries, owns a 50% equity interest.
On February 24, 2022, SmartStop and SSGT II entered into a merger agreement whereby SmartStop would acquire SSGT II in a stock-for-stock merger transaction. The merger is subject to various closing conditions, including approval by SSGT II’s stockholders.
Self Storage I, DST
USA Self Storage I, DST (“Self Storage I DST”) was a DST organized to invest in certain self storage properties. Self Storage I DST completed its offering in October 2005 and received approximately $13.3 million of gross offering proceeds. With a combination of approximately 68% debt and 32% offering proceeds, Self Storage I DST invested approximately $36 million in 10 properties located in three states (Georgia, North Carolina, and Texas), consisting of an aggregate of approximately 5,425 units and 800,400 rentable square feet. SmartStop Self Storage acquired a 3.05% beneficial interest in Self Storage I DST on September 24, 2009 upon the acquisition of Self Storage REIT II, Inc., a private REIT organized to invest primarily in self storage properties (“REIT II”), and an additional 16.703% beneficial interest in Self Storage I DST between May 20, 2010 and November 30, 2010. On February 1, 2011 and February 15, 2011, SmartStop Self Storage acquired the remaining interests in Self Storage I DST, bringing its total ownership to 100%. Consideration provided for the purchase consisted of approximately $10.2 million in cash along with the issuance of approximately 70,000 limited partnership units in SmartStop OP and the assumption of an approximately $23.3 million bank loan. Pursuant to the merger of SmartStop Self Storage with Extra Space on October 1, 2015, the Self Storage I DST properties were sold to Extra Space.
Southwest Colonial, DST
Southwest Colonial, DST was a DST organized to invest in certain self storage properties. Southwest Colonial, DST completed its offering in June 2008 and received $11 million of gross offering proceeds. With a combination of approximately 64% debt and 36% offering proceeds, Southwest Colonial, DST invested approximately $28 million in five properties. These five self storage properties were located in Texas and consisted of an aggregate of approximately 2,806 units and 392,228 rentable square feet. SmartStop Self Storage acquired a 0.28% beneficial interest in Southwest Colonial, DST on September 24, 2009 upon the acquisition of REIT II. During the fourth quarter of 2013, SmartStop Self Storage acquired the remaining beneficial interests in Southwest Colonial, DST for consideration consisting of approximately $9.0 million in cash, along with the issuance of approximately 151,300 limited partnership units in SmartStop OP and the assumption of an approximately $16.7 million bank loan held by Southwest Colonial, DST. As such, SmartStop Self Storage acquired 100% of the interests in Southwest Colonial, DST. Pursuant to the merger of SmartStop Self Storage with Extra Space on October 1, 2015, the Southwest Colonial, DST properties were sold to Extra Space.
13
No assurance can be made that our program or other programs sponsored by affiliates of our advisor will ultimately be successful in meeting their investment objectives.
Distribution Declaration History
The following table shows the distributions we have paid through March 31, 2022:
Quarter |
OP Unit |
Common |
Distributions |
1st Quarter 2021 |
$ — |
$ — |
$ 0.03(2) |
2nd Quarter 2021 |
$ 45,941 |
$ 24,770 |
$ 0.13 |
3rd Quarter 2021 |
$ 69,325 |
$ 145,355 |
$ 0.13 |
4th Quarter 2021 |
$ 68,603 |
$ 283,712 |
$ 0.13 |
1st Quarter 2022 |
$ 67,845 |
$ 404,558 |
$ 0.13 |
(1) Declared distributions are paid monthly in arrears.
(2) Distributions in the first quarter of 2021 were declared for the month of March only.
Management’s Discussion and Analysis of Financial Condition and Results of Operations
The following discussion and analysis should be read in conjunction with the “Selected Financial Data” above and our accompanying consolidated financial statements and the notes thereto contained elsewhere in this supplement.
Overview
Strategic Storage Trust VI, Inc., a Maryland corporation (the “Company”), was formed on October 14, 2020 under the Maryland General Corporation Law for the purpose of engaging in the business of investing in self storage facilities and commenced formal operations on March 10, 2021. We intend to elect to be treated as a REIT under the Internal Revenue Code for federal income tax purposes beginning with our taxable year ended December 31, 2021.
On February 26, 2021, pursuant to a confidential private placement memorandum, we commenced a private offering of up to $200,000,000 in shares of our common stock and $20,000,000 shares of common stock pursuant to our distribution reinvestment plan. Please see Note 1 of the Notes to the Consolidated Financial Statements contained elsewhere in this supplement for additional information. As of March 31, 2022, we had received approximately $99.7 million in offering proceeds from the sale of our common stock pursuant to the private offering. Our private offering was terminated on March 17, 2022.
In connection with the Public Offering, defined below, we filed articles of amendment to our Charter (the “Articles of Amendment”) and articles supplementary to our Charter (the “Articles Supplementary”). Following the filing of the Articles of Amendment and the Articles Supplementary, we authorized 300,000,000 shares of common stock designated as Class A shares, 30,000,000 shares of common stock designated as Class P shares, 300,000,000 shares of common stock designated as Class T shares, and 70,000,000 shares of common stock designated as Class W shares. Any common stock sold in the Private Offering were redesignated as Class P common stock upon the filing of the Articles of Amendment. On May 28, 2021, we filed a Form S-11 Registration Statement, which has subsequently been amended, with the Securities and Exchange Commission (“SEC”) to register a maximum of $1,000,000,000 in shares of Class A, Class T, and Class W common stock for sale to the public (the “Primary Offering”) and $95,000,000 in shares of Class A, Class T, and Class W common stock for sale pursuant to our distribution reinvestment plan (collectively, the “Public Offering”). On March 17, 2022, the SEC declared our registration statement effective.
We have invested the net proceeds from our private offering primarily in self storage facilities consisting of both income-producing and growth properties located in the United States and Canada. As of March 31, 2022, we owned eight operating self storage properties located in five states (Arizona, Florida, Nevada, Oregon and
14
Washington) as well as 50% equity interests in two unconsolidated real estate ventures located in the Greater Toronto Area that are intended to be developed into self storage facilities, with subsidiaries of SmartCentres Real Estate Investment Trust (“SmartCentres”) owning the other 50% of such entity.
As of March 31, 2022, our self storage portfolio was comprised as follows:
State |
|
No. of |
|
|
Units(1) |
|
|
Sq. Ft. |
|
|
% of Total |
|
|
Physical |
|
|
Rental |
|
||||||
Arizona |
|
|
3 |
|
|
|
2,125 |
|
|
|
225,200 |
|
|
|
41 |
% |
|
|
81 |
% |
(5) |
|
59.1 |
% |
Florida |
|
|
2 |
|
|
|
1,120 |
|
|
|
119,875 |
|
|
|
22 |
% |
|
|
68 |
% |
(6) |
|
22.7 |
% |
Nevada |
|
|
1 |
|
|
|
335 |
|
|
|
51,900 |
|
|
|
9 |
% |
|
|
92 |
% |
|
|
17.3 |
% |
Oregon |
|
|
1 |
|
|
|
524 |
|
|
|
56,200 |
|
|
|
10 |
% |
|
|
51 |
% |
(7) |
|
— |
|
Washington |
|
|
1 |
|
|
|
1,090 |
|
|
|
100,100 |
|
|
|
18 |
% |
|
|
86 |
% |
|
|
0.9 |
% |
|
|
|
8 |
|
|
|
5,194 |
|
|
|
553,275 |
|
|
|
100 |
% |
|
|
77 |
% |
|
|
100 |
% |
Investments in Unconsolidated Real Estate Ventures
We have entered into joint venture agreements with a subsidiary of SmartCentres, an unaffiliated third party, to acquire tracts of land and develop them into self storage facilities. We account for these investments using the equity method of accounting and they will be stated at cost and adjusted for our share of net earnings or losses and reduced by distributions. Equity in earnings (loss) will generally be recognized based on our ownership interest in the earnings of each of the unconsolidated investments.
The following table summarizes our investments in unconsolidated real estate ventures as of March 31, 2022:
|
|
Location |
|
Date Real Estate |
|
Real Estate |
|
Equity |
|
|
Approx. Units |
|
|
Approx. |
|
|||
Toronto |
|
Toronto, Ontario |
|
April 2021 |
|
Under Development |
|
|
50 |
% |
|
|
1,200 |
|
|
|
98,500 |
|
Toronto II |
|
Toronto, Ontario |
|
December 2021 |
|
Under Development |
|
|
50 |
% |
|
|
1,500 |
|
|
|
121,500 |
|
|
|
|
|
|
|
|
|
|
|
|
|
2,700 |
|
|
|
220,000 |
|
|
Development costs are currently expected to be approximately CAD $17.5 million for the Toronto Property and approximately CAD $22.6 million for the Toronto II Property, and are expected to be funded with debt proceeds. We expect development on these properties to be completed in the second half of 2023.
15
Critical Accounting Policies
We have established accounting policies which conform to generally accepted accounting principles (“GAAP”) in the U.S. Preparing financial statements in conformity with GAAP requires management to use judgment in the application of accounting policies, including making estimates and assumptions. Following is a discussion of the estimates and assumptions used in setting accounting policies that we consider critical in the presentation of our financial statements. Many estimates and assumptions involved in the application of GAAP may have a material impact on our financial condition or operating performance, or on the comparability of such information to amounts reported for other periods, because of the subjectivity and judgment required to account for highly uncertain items or the susceptibility of such items to change. These estimates and assumptions affect our reported amounts of assets and liabilities, our disclosure of contingent assets and liabilities at the dates of the financial statements and our reported amounts of revenue and expenses during the period covered by this supplement. If management’s judgment or interpretation of the facts and circumstances relating to various transactions had been different, it is possible that different accounting policies would have been applied or different amounts of assets, liabilities, revenues and expenses would have been recorded, thus resulting in a materially different presentation of the financial statements or materially different amounts being reported in the financial statements. Additionally, other companies may use different estimates and assumptions that may impact the comparability of our financial condition and results of operations to those companies.
We believe that our critical accounting policies include the following: real estate purchase price allocations; the evaluation of whether any of our long-lived assets have been impaired; the determination of the useful lives of our long-lived assets; and the evaluation of the consolidation of our interests in joint ventures. The following discussion of these policies supplements, but does not supplant the description of our significant accounting policies, as contained in Note 2 of the Notes to the Consolidated Financial Statements contained in this supplement, and is intended to present our analysis of the uncertainties involved in arriving upon and applying each policy.
Real Estate Purchase Price Allocation
We account for acquisitions in accordance with GAAP which requires that we allocate the purchase price of a property to the tangible and intangible assets acquired and the liabilities assumed based on their relative fair values. This guidance requires us to make significant estimates and assumptions, including fair value estimates, which requires the use of significant unobservable inputs as of the acquisition date.
The value of the tangible assets, consisting of land and buildings, is determined as if vacant. Because we believe that substantially all of the leases in place at properties we will acquire will be at market rates, as the majority of the leases are month-to-month contracts, we do not expect to allocate any portion of the purchase prices to above or below market leases. We also consider whether in-place, market leases represent an intangible asset. Acquisitions of portfolios of facilities are allocated to the individual facilities based upon an income approach or a cash flow analysis using appropriate risk adjusted capitalization rates which take into account the relative size, age, and location of the individual facility along with current and projected occupancy and rental rate levels or appraised values, if available.
Our allocations of purchase prices are based on certain significant estimates and assumptions, variations in such estimates and assumptions could result in a materially different presentation of the consolidated financial statements or materially different amounts being reported in the consolidated financial statements.
Impairment of Long-Lived Assets
The majority of our assets, other than cash and cash equivalents, consist of long-lived real estate assets as well as intangible assets related to our acquisitions. We will evaluate such assets for impairment based on events and changes in circumstances that may arise in the future and that may impact the carrying amounts of our long-lived assets, including those held through joint ventures. When indicators of potential impairment are present, we will assess the recoverability of the particular asset by determining whether the carrying value of the asset will be recovered, through an evaluation of the undiscounted future operating cash flows expected from the use of the asset and its eventual disposition. This evaluation is based on a number of estimates and assumptions. Based on this evaluation, if the expected undiscounted future cash flows do not exceed the carrying value, we will adjust
16
the value of the long-lived asset and recognize an impairment loss. Our evaluation of the impairment of long-lived assets could result in a materially different presentation of the financial statements or materially different amounts being reported in the financial statements, as the amount of impairment loss recognized, if any, may vary based on the estimates and assumptions we use.
Estimated Useful Lives of Long-Lived Assets
We assess the useful lives of the assets underlying our properties based upon a subjective determination of the period of future benefit for each asset. We record depreciation expense with respect to these assets based upon the estimated useful lives we determine. Our determinations of the useful lives of the assets could result in a materially different presentation of the financial statements or materially different amounts being reported in the financial statements, as such determinations, and the corresponding amount of depreciation expense, may vary dramatically based on the estimates and assumptions we use.
Consolidation of Investments in Joint Ventures
We evaluate the consolidation of our investments in joint ventures in accordance with relevant accounting guidance. This evaluation requires us to determine whether we have a controlling interest in a joint venture through a means other than voting rights, and, if so, such joint venture may be required to be consolidated in our financial statements. Our evaluation of our joint ventures under such accounting guidance could result in a materially different presentation of the financial statements or materially different amounts being reported in the financial statements, as the joint venture entities included in our financial statements may vary based on the estimates and assumptions we use.
REIT Qualification
We intend to make an election under Section 856(c) of the Internal Revenue Code of 1986 (the “Code”) to be taxed as a REIT under the Code, commencing with the taxable year ended December 31, 2021. By qualifying as a REIT for federal income tax purposes, we generally will not be subject to federal income tax on income that we distribute to our stockholders. If we fail to qualify as a REIT in any taxable year, we will be subject to federal income tax on our taxable income at regular corporate rates and will not be permitted to qualify for treatment as a REIT for federal income tax purposes for four years following the year in which our qualification is denied. Such an event could materially and adversely affect our net income and could have a material adverse impact on our financial condition and results of operations. However, we believe that we are organized and operate in such a manner as to qualify for treatment as a REIT and intend to operate in the foreseeable future in such a manner that we will remain qualified as a REIT for federal income tax purposes.
Recent Market Conditions
Our rental revenue and operating results depend significantly on the demand for self storage space. Due to the COVID-19 pandemic, our operations have adjusted to meet the needs of our customers and employees, while striving to create a safe environment for everyone at our properties and corporate offices. We also adjusted our in-store operations in order to comply with the various governmental orders, and, in certain cases, we had to temporarily close some of our offices. Additionally, we have expanded our options for customers to rent units via contactless means, including directly through our website and call center.
The challenges associated with the COVID-19 pandemic were partially offset by other trends that helped maintain the demand for self storage. The broader shift of people working from home, elevated migration patterns and strength in the housing market helped drive continued growth in self storage demand.
The underlying relative strength in the self storage industry in the midst of the COVID-19 pandemic continued into 2022. The ultimate extent and duration of the COVID-19 pandemic could still affect the self storage industry and/or us, potentially by the impact of governmental orders or broader economic conditions, which impact our customers, and in turn could affect our financial condition, collections, liquidity, and results of operations. These potential future developments are uncertain and cannot be predicted. This includes new information that may also emerge concerning the breadth of the COVID-19 outbreak, as well as the actions to
17
contain or treat its impact, including the distribution and broad acceptance of various vaccines for COVID-19 or the efficacy of those vaccines against new COVID-19 variants.
Results of Operations
Overview
We derive revenues principally from: (i) rents received from tenants who rent storage units under month-to-month leases at each of our self storage facilities; and (ii) sales of packing- and storage-related supplies at our storage facilities. Therefore, our operating results depend significantly on our ability to retain our existing tenants and lease our available self storage units to new tenants, while maintaining and, where possible, increasing the prices for our self storage units. Additionally, our operating results depend on our tenants making their required rental payments to us.
Competition in the market areas in which we operate is significant and affects the occupancy levels, rental rates, rental revenues and operating expenses of our facilities. Development of any new self storage facilities would intensify competition of self storage operators in markets in which we operate.
On March 10, 2021 we commenced formal operations and we acquired our first six self storage properties during 2021. On March 29, 2022, we acquired our seventh self storage property located in Vancouver, Washington. On March 31, 2022, we acquired our eight self storage property located in Portland, Oregon. Operating results in future periods will depend on the results of operations of these properties and the real estate properties that we acquire.
As a result of the timing of our formation, commencement of operations and acquisition of our properties during 2021 and 2022, we believe there is no basis for comparison to prior periods. We expect revenue and expenses to increase in future periods as we acquire additional properties.
Total Revenues
Total revenues for the three months ended March 31, 2022 and 2021 were approximately $1.0 million and none, respectively. The increase in total revenue is primarily attributable to a full quarter of operations for the six properties acquired during 2021 and partial quarter of operations for the two properties acquired in the first quarter of 2022. We expect total revenues to increase in the future commensurate with our future acquisition activity and lease-up of our non-stabilized properties.
Property Operating Expenses
Property operating expenses for the three months ended March 31, 2022 and 2021 were approximately $0.5 million and none, respectively. Property operating expenses include the costs to operate our facilities including payroll, utilities, insurance, real estate taxes, and marketing. The increase in property operating expenses is primarily attributable to a full quarter of operations for the six properties acquired during 2021 and partial quarter of operations for the two properties acquired in the first quarter of 2022. We expect property operating expenses to increase in the future as our operational activity increases but decrease as a percentage of total revenues as we lease-up our non-stabilized properties.
Property Operating Expenses – Affiliates
Property operating expenses – affiliates for the three months ended March 31, 2022 and 2021 were approximately $0.2 million and none, respectively. Property operating expenses – affiliates includes property management fees and asset management fees. The increase in property operating expenses – affiliates is primarily attributable to a full quarter of operations for the six properties acquired during 2021 and partial quarter of operations for the two properties acquired in the first quarter of 2022. We expect property operating expenses – affiliates to increase in the future as our operational activity increases.
18
General and Administrative Expenses
General and administrative expenses for the three months ended March 31, 2022 and 2021 were approximately $0.5 million and none, respectively. General and administrative expenses consist primarily of legal expenses, directors’ and officers’ insurance, transfer agent fees, an allocation of a portion of our Advisor’s payroll related costs, accounting expenses and board of directors related costs. The increase in general and administrative expenses is primarily attributable to an increase in costs commensurate with the increase in our operational activity. We expect general and administrative expenses to increase in the future as our operational activity increases, but decrease as a percentage of total revenue.
Depreciation and Amortization Expenses
Depreciation and amortization expenses for the three months ended March 31, 2022 and 2021 were approximately $0.8 million and none, respectively. Depreciation expense consists primarily of depreciation on the buildings and site improvements at our properties. Amortization expense consists of the amortization of intangible assets resulting from our acquisitions. The increase in depreciation and amortization expense is primarily attributable to a full quarter of operations for the six properties acquired during 2021 and partial quarter of operations for the two properties acquired in the first quarter of 2022. We expect depreciation and amortization expense to increase in future periods commensurate with our future acquisition activity.
Acquisition Expenses – Affiliates
Acquisition expenses – affiliates for the three months ended March 31, 2022 and 2021 were approximately $0.1 million and none, respectively. Acquisition expenses primarily relate to the costs associated with our potential acquisitions of self storage facilities prior to the acquisitions becoming probable in accordance with our capitalization policy. We expect acquisition expenses- affiliates to fluctuate in the future commensurate with our acquisition activity.
Other Property Acquisition Expenses
Other property acquisition expenses for the three months ended March 31, 2022 and 2021 were approximately $0.3 million and none, respectively. Acquisition expenses primarily relate to the costs associated with our potential acquisitions of self storage facilities prior to the acquisitions becoming probable in accordance with our capitalization policy. We expect other property acquisition expenses to fluctuate in the future commensurate with our acquisition activity.
Interest Expense
Interest expense for the three months ended March 31, 2022 and 2021 was approximately $0.4 million and none, respectively. Interest expense consists of interest incurred on the loans related to our acquisition of six self storage properties during 2021 and two properties during the first quarter of 2022. We expect interest expense to fluctuate in the future commensurate with our future debt level.
Interest Expense – Debt Issuance Costs
Interest expense – debt issuance costs for the three months ended March 31, 2022 and 2021 were approximately $0.1 million and none, respectively. Interest expense – debt issuance costs reflects the amortization of fees incurred in connection with obtaining financing. We expect interest expense – debt issuance costs to increase commensurate with our future financing activity.
Foreign currency adjustment
Foreign currency adjustment for the three months ended March 31, 2022 and 2021 was approximately $0.1 million and none, respectively. Foreign currency adjustment consists of changes in foreign currency related
19
to our investments in unconsolidated real estate ventures, classified as short term in accordance with GAAP. We expect foreign currency adjustment to change in the future based upon changes in exchange rates, as well as future investments in real estate in currencies other than United States dollars, classified as short term in accordance with GAAP.
Liquidity and Capital Resources
Cash Flows
A comparison of cash flows for operating, investing and financing activities for the three months ended March 31, 2022 and 2021 is as follows:
|
|
Three Months Ended |
|
|
|
|
||||||||||
|
|
March 31, |
|
|
March 31, |
|
|
Change |
|
|||||||
Net cash flow provided by (used in): |
|
|
|
|
|
|
|
|
|
|||||||
Operating activities |
|
$ |
(712,947 |
) |
|
$ |
— |
|
|
$ |
(712,947 |
) |
||||
Investing activities |
|
|
(39,527,073 |
) |
|
|
— |
|
|
|
(39,527,073 |
) |
||||
Financing activities |
|
|
47,288,024 |
|
|
|
50,000 |
|
|
|
47,238,024 |
|
||||
Cash flows used in operating activities for the three months ended March 31, 2022 and 2021 were approximately $0.7 million and none, respectively, a change of approximately $0.7 million. The increase in cash used in our operating activities is primarily the result of an increase in cash used in operations.
Cash flows used in investing activities for the three months ended March 31, 2022 and 2021 were approximately $39.5 million and none, respectively, a change of approximately $39.5 million. The increase in cash used in our investing activities is primarily the result of cash used for the purchase of real estate of approximately $39.2 million.
Cash flows provided by financing activities for the three months ended March 31, 2022 and 2021 were approximately $47.3 million and $0.1 million, respectively, a change of approximately $47.2 million. The increase in cash provided by our financing activities is primarily the result of an increase in net proceeds raised from our Offering of approximately $47.7 million.
Short-Term Liquidity and Capital Resources
Our Advisor funded and was responsible for our organization and offering costs on our behalf, prior to the commencement of our formal operations on March 10, 2021 when we acquired the Phoenix Property. Currently, we generally expect that we will meet our short-term operating liquidity requirements, including potential development costs related to our joint venture investments as described in “- Investments in Unconsolidated Real Estate Ventures” above from the combination of proceeds from our offerings, proceeds from secured or unsecured financing from banks or other lenders, and net cash provided by property operations.
Distribution Policy and Distributions
We commenced paying distributions to our stockholders in March 2021 and intend to continue to pay regular distributions to our stockholders. From the commencement of paying cash distributions in March 2021, 100% of our cash distributions have been paid from the net proceeds of our private offering. Until we are generating operating cash flow sufficient to fund distributions to our stockholders, we may decide to make stock distributions or to make distributions using a combination of stock and cash, or to fund some or all of our distributions from the proceeds of our private offering, proceeds of our Public Offering or from borrowings in anticipation of future cash flow, which may reduce the amount of capital we ultimately invest in properties. Because substantially all of our operations will be performed indirectly through our Operating Partnership, our ability to pay distributions depends in large part on our Operating Partnership’s ability to pay distributions to its partners, including to us. In the event we do not have enough cash from operations to fund cash distributions, we may borrow, issue additional securities or sell assets in order to fund the distributions or make the distributions
20
out of net proceeds from our Public Offering. Therefore, it is likely that some or all of the distributions that we make will represent a return of capital to you, at least in the first few years of operation. Though we have no present intention to make in-kind distributions, we are authorized by our charter to make in-kind distributions of readily marketable securities, distributions of beneficial interests in a liquidating trust established for our dissolution and the liquidation of our assets in accordance with the terms of the charter or distributions that meet all of the following conditions: (a) our board of directors advises each stockholder of the risks associated with direct ownership of the property; (b) our board of directors offers each stockholder the election of receiving such in-kind distributions; and (c) in-kind distributions are only made to those stockholders who accept such offer.
Over the long-term, we expect that a greater percentage of our distributions will be paid from cash flows from operations. However, our operating performance cannot be accurately predicted and may deteriorate in the future due to numerous factors, including our ability to raise and invest capital at favorable yields, the financial performance of our investments in the current real estate and financial environment and the types and mix of investments in our portfolio. As a result, future distributions declared and paid may exceed cash flow from operations.
Distributions will be paid to our stockholders as of the record date selected by our board of directors. We pay distributions monthly based on daily declaration and record dates so that investors may be entitled to distributions immediately upon purchasing our shares. We expect to continue to regularly pay distributions unless our results of operations, our general financial condition, general economic conditions, or other factors inhibit us from doing so. Distributions will be authorized at the discretion of our board of directors, which will be directed, in substantial part, by its obligation to cause us to comply with the REIT requirements of the Code. Our board of directors may increase, decrease or eliminate the distribution rate that is being paid at any time. Distributions will be made on all classes of our common stock at the same time. The per share amount of distributions on different classes of shares will likely differ because of different allocations of class-specific expenses. Specifically, distributions on Class T shares and Class W shares will likely be lower than distributions on Class A shares and Class P shares because Class T shares are subject to ongoing stockholder servicing fees and Class W shares are subject to ongoing dealer manager servicing fees. The funds we receive from operations that are available for distribution may be affected by a number of factors, including the following:
We must distribute to our stockholders at least 90% of our taxable income each year in order to meet the requirements for being treated as a REIT under the Code. Our directors may authorize distributions in excess of this percentage as they deem appropriate. Because we may receive income from interest or rents at various times during our fiscal year, distributions may not reflect our income earned in that particular distribution period, but may be made in anticipation of cash flow that we expect to receive during a later period and may be made in advance of actual receipt of funds in an attempt to make distributions relatively uniform. To allow for such differences in timing between the receipt of income and the payment of expenses, and the effect of required debt payments, among other things, we could be required to borrow funds from third parties on a short-term basis, issue new securities, or sell assets to meet the distribution requirements that are necessary to achieve the tax benefits associated with qualifying as a REIT. We are not prohibited from undertaking such activities by our
21
charter, bylaws or investment policies, and we may use an unlimited amount from any source to pay our distributions. These methods of obtaining funding could affect future distributions by increasing operating costs and decreasing available cash, which could reduce the value of our stockholders' investments in our shares. In addition, such distributions may constitute a return of investors’ capital.
We have not been able to and may not be able to pay distributions from our cash flows from operations, in which case distributions may be paid in part from debt financing or from proceeds from the issuance of common stock in our offerings. The payment of distributions from sources other than cash flows from operations may reduce the amount of proceeds available for investment and operations or cause us to incur additional interest expense as a result of borrowed funds.
Over the long-term, we expect that a greater percentage of our distributions will be paid from cash flows from operations. However, our operating performance cannot be accurately predicted and may deteriorate in the future due to numerous factors, including our ability to raise and invest capital at favorable yields, the financial performance of our investments in the current real estate and financial environment and the types and mix of investments in our portfolio. As a result, future distributions declared and paid may exceed cash flow from operations.
The following shows our distributions paid and the sources of such distributions for the respective periods presented:
|
|
Three Months Ended |
|
|
|
|
|
Three Months Ended |
|
|
|
|
||||
Distributions paid in cash — |
|
$ |
404,558 |
|
|
|
|
|
$ |
— |
|
|
|
|
||
Distributions paid in cash — |
|
|
67,845 |
|
|
|
|
|
|
— |
|
|
|
|
||
Distributions reinvested |
|
|
268,630 |
|
|
|
|
|
|
— |
|
|
|
|
||
Total distributions |
|
$ |
741,033 |
|
|
|
|
|
$ |
— |
|
|
|
|
||
Source of distributions |
|
|
|
|
|
|
|
|
|
|
|
|
||||
Cash flows provided by operations |
|
$ |
— |
|
|
|
0.0 |
% |
|
$ |
— |
|
|
|
0.0 |
% |
Proceeds from offerings |
|
|
472,403 |
|
|
|
63.7 |
% |
|
|
— |
|
|
|
0.0 |
% |
Offering proceeds from distribution |
|
|
268,630 |
|
|
|
36.3 |
% |
|
|
— |
|
|
|
0.0 |
% |
Total sources |
|
$ |
741,033 |
|
|
|
100.0 |
% |
|
$ |
— |
|
|
|
0.0 |
% |
From our inception through March 31, 2022, we have paid cumulative distributions of approximately $1.4 million, as compared to cumulative net loss attributable to our common stockholders of approximately $4.6 million. For the three months ended March 31, 2022, we paid distributions of approximately $0.7 million, as compared to a net loss attributable to our common stockholders of approximately $1.7 million. Net loss attributable to our common stockholders for the three months ended March 31, 2022, reflects non-cash depreciation and amortization of approximately $0.8 million and acquisition related expenses of approximately $0.5 million. From our inception through March 31, 2022, cumulative net loss attributable to our common stockholders reflects non-cash depreciation and amortization of approximately $1.7 million, and acquisition related expenses of approximately $1.8 million.
For the three months ended March 31, 2021, we paid no distributions, as compared to a net loss attributable to our common stockholders of approximately $161.
22
Indebtedness
As of March 31, 2022, our total indebtedness was approximately $47.9 million which included approximately $43.9 million of variable rate debt and approximately $4.8 million of fixed rate debt, less approximately $0.8 million in net debt issuance costs.
Long-Term Liquidity and Capital Resources
On a long-term basis, our principal demands for funds will be for property acquisitions, either directly or through entity interests, for the payment of operating expenses and distributions, and for the payment of interest on our outstanding indebtedness, if any.
Our material cash requirements from known contractual and other obligations primarily relate to the following, for which information on both a short-term and long-term basis is provided in the indicated notes to the consolidated financial statements:
Long-term potential future sources of capital include proceeds from secured or unsecured financings from banks or other lenders, issuance of equity instruments and undistributed funds from operations. To the extent we are not able to secure requisite financing in the form of a credit facility or other debt, we will be dependent upon proceeds from the issuance of equity securities and cash flows from operating activities in order to meet our long-term liquidity requirements and to fund our distributions.
Off Balance Sheet Arrangements
We have joint ventures with SmartCentres, which are accounted for using the equity method of accounting (Refer to Note 4 of the Notes to the Consolidated Financial Statements). Other than the foregoing, we do not currently have any relationships with unconsolidated entities or financial partnerships. Such entities are often referred to as structured finance or special purpose entities, which typically are established for the purpose of facilitating off-balance sheet arrangements or other contractually narrow or limited purposes.
Subsequent Events
Please see Note 10 of the Notes to the Consolidated Financial Statements contained in this supplement.
Seasonality
We believe that we will experience minor seasonal fluctuations in the occupancy levels of our facilities which we believe will be slightly higher over the summer months due to increased moving activity.
23
Financial Statements
The financial statements listed below are contained in this supplement:
Consolidated Financial Statements |
|
Consolidated Balance Sheets |
F-2 |
Consolidated Statements of Operations |
F-3 |
Consolidated Statements of Equity |
F-4 |
Consolidated Statements of Cash Flows |
F-5 |
Notes to Consolidated Financial Statements |
F-6 |
|
|
|
|
F-1
STRATEGIC STORAGE TRUST VI, INC. AND SUBSIDIARIES
CONSOLIDATED BALANCE SHEETS
|
|
March 31, |
|
|
December 31, |
|
||
ASSETS |
|
|
|
|
|
|
||
Real estate facilities: |
|
|
|
|
|
|
||
Land |
|
$ |
16,532,903 |
|
|
$ |
10,811,899 |
|
Buildings |
|
|
95,279,925 |
|
|
|
61,778,581 |
|
Site improvements |
|
|
3,205,709 |
|
|
|
2,766,245 |
|
|
|
|
115,018,537 |
|
|
|
75,356,725 |
|
Accumulated depreciation |
|
|
(1,124,386 |
) |
|
|
(597,090 |
) |
|
|
|
113,894,151 |
|
|
|
74,759,635 |
|
Construction in process |
|
|
62,122 |
|
|
|
86,987 |
|
Real estate facilities, net |
|
|
113,956,273 |
|
|
|
74,846,622 |
|
Cash and cash equivalents |
|
|
11,284,270 |
|
|
|
3,934,933 |
|
Restricted cash |
|
|
344,493 |
|
|
|
645,826 |
|
Investments in unconsolidated real estate ventures (Note 4) |
|
|
9,955,317 |
|
|
|
9,632,360 |
|
Other assets, net |
|
|
1,006,589 |
|
|
|
797,285 |
|
Intangible assets, net of accumulated amortization |
|
|
1,700,227 |
|
|
|
1,014,552 |
|
Total assets |
|
$ |
138,247,169 |
|
|
$ |
90,871,578 |
|
LIABILITIES AND EQUITY |
|
|
|
|
|
|
||
Secured debt, net |
|
$ |
47,942,372 |
|
|
$ |
47,856,858 |
|
Accounts payable and accrued liabilities |
|
|
1,537,388 |
|
|
|
1,194,900 |
|
Distributions payable |
|
|
444,557 |
|
|
|
225,507 |
|
Due to affiliates |
|
|
2,014,975 |
|
|
|
725,621 |
|
Total liabilities |
|
|
51,939,292 |
|
|
|
50,002,886 |
|
Commitments and contingencies (Note 7) |
|
|
|
|
|
|
||
Redeemable common stock |
|
|
597,788 |
|
|
|
329,158 |
|
Equity: |
|
|
|
|
|
|
||
Strategic Storage Trust VI, Inc. equity: |
|
|
|
|
|
|
||
Preferred Stock, $0.001 par value; 200,000,000 shares authorized; none issued |
|
|
— |
|
|
|
— |
|
Class P Common stock, $0.001 par value; 30,000,000 shares authorized; |
|
|
10,522 |
|
|
|
5,063 |
|
Class A Common stock, $0.001 par value; 300,000,000 shares authorized; |
|
|
— |
|
|
|
— |
|
Class T Common stock, $0.001 par value; 300,000,000 shares authorized; |
|
|
— |
|
|
|
— |
|
Class W Common stock, $0.001 par value; 70,000,000 shares authorized; |
|
|
— |
|
|
|
— |
|
|
|
|
|
|
|
|
||
Additional paid-in capital |
|
|
88,646,410 |
|
|
|
40,737,265 |
|
Distributions |
|
|
(1,877,375 |
) |
|
|
(985,132 |
) |
Accumulated deficit |
|
|
(4,635,477 |
) |
|
|
(2,985,345 |
) |
Total Strategic Storage Trust VI, Inc. equity |
|
|
82,144,080 |
|
|
|
36,771,851 |
|
Noncontrolling interests in our Operating Partnership |
|
|
3,566,009 |
|
|
|
3,767,683 |
|
Total equity |
|
|
85,710,089 |
|
|
|
40,539,534 |
|
Total liabilities and equity |
|
$ |
138,247,169 |
|
|
$ |
90,871,578 |
|
See notes to consolidated financial statements.
F-2
STRATEGIC STORAGE TRUST VI, INC. AND SUBSIDIARIES
CONSOLIDATED STATEMENTS OF OPERATIONS
(Unaudited)
|
|
Three Months Ended March 31, |
|
|||||
|
|
2022 |
|
|
2021 |
|
||
Revenues: |
|
|
|
|
|
|
||
Self storage rental revenue |
|
$ |
938,388 |
|
|
$ |
— |
|
Ancillary operating revenue |
|
|
14,572 |
|
|
|
— |
|
Total revenues |
|
|
952,960 |
|
|
|
— |
|
Operating expenses: |
|
|
|
|
|
|
||
Property operating expenses |
|
|
478,273 |
|
|
|
— |
|
Property operating expenses – affiliates |
|
|
234,382 |
|
|
|
— |
|
General and administrative |
|
|
470,550 |
|
|
|
— |
|
Depreciation |
|
|
531,040 |
|
|
|
— |
|
Intangible amortization expense |
|
|
226,505 |
|
|
|
— |
|
Acquisition expense – affiliates |
|
|
130,138 |
|
|
|
— |
|
Other property acquisition expenses |
|
|
321,668 |
|
|
|
— |
|
Total operating expenses |
|
|
2,392,556 |
|
|
|
— |
|
Operating loss |
|
|
(1,439,596 |
) |
|
|
— |
|
Other income (expense): |
|
|
|
|
|
|
||
Interest expense |
|
|
(409,293 |
) |
|
|
— |
|
Interest expense – debt issuance costs |
|
|
(83,647 |
) |
|
|
— |
|
Equity in loss of unconsolidated affiliate |
|
|
— |
|
|
|
(161 |
) |
Other expense |
|
|
(708 |
) |
|
|
— |
|
Foreign currency adjustment |
|
|
149,278 |
|
|
|
— |
|
Net loss |
|
|
(1,783,966 |
) |
|
|
(161 |
) |
Net loss attributable to the noncontrolling interests in our Operating |
|
|
133,834 |
|
|
|
— |
|
Net loss attributable to Strategic Storage Trust VI, Inc. common |
|
$ |
(1,650,132 |
) |
|
$ |
(161 |
) |
Net loss per Class P share—basic and diluted |
|
$ |
(0.23 |
) |
|
$ |
(0.75 |
) |
Net loss per Class A share—basic and diluted |
|
$ |
— |
|
|
$ |
— |
|
Net loss per Class T share—basic and diluted |
|
$ |
— |
|
|
$ |
— |
|
Net loss per Class W share—basic and diluted |
|
$ |
— |
|
|
$ |
— |
|
Weighted average Class P shares outstanding—basic and diluted |
|
|
7,241,403 |
|
|
|
216 |
|
Weighted average Class A shares outstanding—basic and diluted |
|
|
— |
|
|
|
— |
|
Weighted average Class T shares outstanding—basic and diluted |
|
|
— |
|
|
|
— |
|
Weighted average Class W shares outstanding—basic and diluted |
|
|
— |
|
|
|
— |
|
See notes to consolidated financial statements.
F-3
Strategic Storage Trust VI, Inc. AND SUBSIDIARIES
CONSOLIDATED STATEMENTS OF EQUITY
(Unaudited)
|
|
Common Stock |
|
|
|
|
|
|
|
|
|
|
|
Total |
|
|
|
|
|
|
|
|
|
|
||||||||||||||||||||||||||||||||||||
|
|
Class P |
|
|
Class A |
|
|
Class T |
|
|
Class W |
|
|
|
|
|
|
|
|
|
|
|
Strategic |
|
|
Noncontrolling |
|
|
|
|
|
|
|
|||||||||||||||||||||||||||
|
|
Number of |
|
|
Common |
|
|
Number of |
|
|
Common |
|
|
Number of |
|
|
Common |
|
|
Number of |
|
|
Common |
|
|
Additional |
|
|
Distributions |
|
|
Accumulated |
|
|
Storage |
|
|
Interests in |
|
|
Total |
|
|
Redeemable |
|
|||||||||||||||
Balance as of January 1, 2021 |
|
|
— |
|
|
$ |
— |
|
|
|
— |
|
|
$ |
— |
|
|
|
— |
|
|
$ |
— |
|
|
|
— |
|
|
$ |
— |
|
|
$ |
— |
|
|
$ |
— |
|
|
$ |
— |
|
|
$ |
— |
|
|
$ |
— |
|
|
$ |
— |
|
|
$ |
— |
|
Gross proceeds from issuance of common stock |
|
|
5,666 |
|
|
|
6 |
|
|
|
— |
|
|
|
— |
|
|
|
— |
|
|
|
— |
|
|
|
— |
|
|
|
— |
|
|
|
50,994 |
|
|
|
— |
|
|
|
— |
|
|
|
51,000 |
|
|
|
2,000 |
|
|
|
53,000 |
|
|
|
— |
|
Offering costs |
|
|
— |
|
|
|
— |
|
|
|
— |
|
|
|
— |
|
|
|
— |
|
|
|
— |
|
|
|
— |
|
|
|
— |
|
|
|
(50,994 |
) |
|
|
— |
|
|
|
— |
|
|
|
(50,994 |
) |
|
|
— |
|
|
|
(50,994 |
) |
|
|
— |
|
Distributions |
|
|
— |
|
|
|
— |
|
|
|
— |
|
|
|
— |
|
|
|
— |
|
|
|
— |
|
|
|
— |
|
|
|
— |
|
|
|
— |
|
|
|
(15 |
) |
|
|
— |
|
|
|
(15 |
) |
|
|
— |
|
|
|
(15 |
) |
|
|
— |
|
Net loss attributable to Strategi Storage Trust VI, Inc. |
|
|
— |
|
|
|
— |
|
|
|
— |
|
|
|
— |
|
|
|
— |
|
|
|
— |
|
|
|
— |
|
|
|
— |
|
|
|
— |
|
|
|
— |
|
|
|
(161 |
) |
|
|
(161 |
) |
|
|
— |
|
|
|
(161 |
) |
|
|
— |
|
Balance as of March 31, 2021 |
|
|
5,666 |
|
|
$ |
6 |
|
|
|
— |
|
|
$ |
— |
|
|
|
— |
|
|
$ |
— |
|
|
|
— |
|
|
$ |
— |
|
|
$ |
— |
|
|
$ |
(15 |
) |
|
$ |
(161 |
) |
|
$ |
(170 |
) |
|
$ |
2,000 |
|
|
$ |
1,830 |
|
|
$ |
— |
|
|
|
|
|
|
|
|
|
|
|
|
|
|
|
|
|
|
|
|
|
|
|
|
|
|
|
|
|
|
|
|
|
|
|
|
|
|
|
|
|
|
|
|
|
|
|
|||||||||||||||
|
|
|
|
|
|
|
|
|
|
|
|
|
|
|
|
|
|
|
|
|
|
|
|
|
|
|
|
|
|
|
|
|
|
|
|
|
|
|
|
|
|
|
|
|
|
|||||||||||||||
|
|
Common Stock |
|
|
|
|
|
|
|
|
|
|
|
Total |
|
|
|
|
|
|
|
|
|
|
||||||||||||||||||||||||||||||||||||
|
|
Class P |
|
|
Class A |
|
|
Class T |
|
|
Class W |
|
|
|
|
|
|
|
|
|
|
|
Strategic |
|
|
Noncontrolling |
|
|
|
|
|
|
|
|||||||||||||||||||||||||||
|
|
Number of |
|
|
Common |
|
|
Number of |
|
|
Common |
|
|
Number of |
|
|
Common |
|
|
Number of |
|
|
Common |
|
|
Additional |
|
|
Distributions |
|
|
Accumulated |
|
|
Storage |
|
|
Interests in |
|
|
Total |
|
|
Redeemable |
|
|||||||||||||||
Balance as of December 31, |
|
|
5,062,804 |
|
|
$ |
5,063 |
|
|
|
— |
|
|
$ |
— |
|
|
|
— |
|
|
$ |
— |
|
|
|
— |
|
|
$ |
— |
|
|
$ |
40,737,265 |
|
|
$ |
(985,132 |
) |
|
$ |
(2,985,345 |
) |
|
$ |
36,771,851 |
|
|
$ |
3,767,683 |
|
|
$ |
40,539,534 |
|
|
$ |
329,158 |
|
Gross proceeds from issuance of common stock |
|
|
5,430,060 |
|
|
|
5,430 |
|
|
|
— |
|
|
|
— |
|
|
|
— |
|
|
|
— |
|
|
|
— |
|
|
|
— |
|
|
|
52,604,231 |
|
|
|
— |
|
|
|
— |
|
|
|
52,609,661 |
|
|
|
— |
|
|
|
52,609,661 |
|
|
|
— |
|
Offering costs |
|
|
— |
|
|
|
— |
|
|
|
— |
|
|
|
— |
|
|
|
— |
|
|
|
— |
|
|
|
— |
|
|
|
— |
|
|
|
(4,695,057 |
) |
|
|
— |
|
|
|
— |
|
|
|
(4,695,057 |
) |
|
|
— |
|
|
|
(4,695,057 |
) |
|
|
— |
|
Changes to redeemable common stock |
|
|
— |
|
|
|
— |
|
|
|
— |
|
|
|
— |
|
|
|
— |
|
|
|
— |
|
|
|
— |
|
|
|
— |
|
|
|
(268,630 |
) |
|
|
— |
|
|
|
— |
|
|
|
(268,630 |
) |
|
|
— |
|
|
|
(268,630 |
) |
|
|
268,630 |
|
Distributions |
|
|
— |
|
|
|
— |
|
|
|
— |
|
|
|
— |
|
|
|
— |
|
|
|
— |
|
|
|
— |
|
|
|
— |
|
|
|
— |
|
|
|
(892,243 |
) |
|
|
— |
|
|
|
(892,243 |
) |
|
|
— |
|
|
|
(892,243 |
) |
|
|
— |
|
Distributions to noncontrolling interests |
|
|
— |
|
|
|
— |
|
|
|
— |
|
|
|
— |
|
|
|
— |
|
|
|
— |
|
|
|
— |
|
|
|
— |
|
|
|
— |
|
|
|
— |
|
|
|
— |
|
|
|
— |
|
|
|
(67,840 |
) |
|
|
(67,840 |
) |
|
|
— |
|
Issuance of shares for distribution reinvestment plan |
|
|
28,737 |
|
|
|
29 |
|
|
|
— |
|
|
|
— |
|
|
|
— |
|
|
|
— |
|
|
|
— |
|
|
|
— |
|
|
|
268,601 |
|
|
|
— |
|
|
|
— |
|
|
|
268,630 |
|
|
|
— |
|
|
|
268,630 |
|
|
|
— |
|
Net loss attributable to Strategic Storage Trust VI, Inc. |
|
|
— |
|
|
|
— |
|
|
|
— |
|
|
|
— |
|
|
|
— |
|
|
|
— |
|
|
|
— |
|
|
|
— |
|
|
|
— |
|
|
|
— |
|
|
|
(1,650,132 |
) |
|
|
(1,650,132 |
) |
|
|
— |
|
|
|
(1,650,132 |
) |
|
|
— |
|
Net loss attributable to the noncontrolling interests in our Operating Partnership |
|
|
— |
|
|
|
— |
|
|
|
— |
|
|
|
— |
|
|
|
— |
|
|
|
— |
|
|
|
— |
|
|
|
— |
|
|
|
— |
|
|
|
— |
|
|
|
— |
|
|
$ |
- |
|
|
|
(133,834 |
) |
|
|
(133,834 |
) |
|
|
— |
|
Balance as of March 31, 2022 |
|
|
10,521,601 |
|
|
$ |
10,522 |
|
|
|
— |
|
|
$ |
— |
|
|
|
— |
|
|
$ |
— |
|
|
|
— |
|
|
$ |
— |
|
|
$ |
88,646,410 |
|
|
$ |
(1,877,375 |
) |
|
$ |
(4,635,477 |
) |
|
$ |
82,144,080 |
|
|
$ |
3,566,009 |
|
|
$ |
85,710,089 |
|
|
$ |
597,788 |
|
See notes to consolidated financial statements.
F-4
STrategic Storage Trust VI, Inc. AND SUBSIDIARIES
CONSOLIDATED STATEMENTS OF CASH FLOWS
(Unaudited)
|
|
Three Months Ended |
|
|||||
|
|
2022 |
|
|
2021 |
|
||
Cash flows from operating activities: |
|
|
|
|
|
|
||
Net loss |
|
$ |
(1,783,966 |
) |
|
$ |
(161 |
) |
Adjustments to reconcile net loss to cash used in operating activities: |
|
|
|
|
|
|
||
Depreciation and amortization |
|
|
757,545 |
|
|
|
— |
|
Amortization of debt issuance costs |
|
|
83,647 |
|
|
|
— |
|
Equity in loss of unconsolidated investment |
|
|
— |
|
|
|
161 |
|
Unrealized foreign currency adjustment |
|
|
(149,278 |
) |
|
|
— |
|
Changes in operating assets and liabilities: |
|
|
|
|
|
|
||
Other assets, net |
|
|
(208,781 |
) |
|
|
— |
|
Accounts payable and accrued liabilities |
|
|
498,532 |
|
|
|
— |
|
Due to affiliates |
|
|
89,354 |
|
|
|
— |
|
Net cash used in operating activities |
|
|
(712,947 |
) |
|
|
— |
|
Cash flows from investing activities: |
|
|
|
|
|
|
||
Purchase of real estate |
|
|
(39,241,028 |
) |
|
|
— |
|
Additions to real estate facilities |
|
|
(108,099 |
) |
|
|
— |
|
Investments in unconsolidated real estate ventures |
|
|
(177,946 |
) |
|
|
— |
|
Net cash used in investing activities |
|
|
(39,527,073 |
) |
|
|
— |
|
Cash flows from financing activities: |
|
|
|
|
|
|
||
Gross proceeds from issuance of common stock |
|
|
52,344,661 |
|
|
|
51,000 |
|
Offering costs |
|
|
(4,584,234 |
) |
|
|
(1,000 |
) |
Distributions paid to common stockholders |
|
|
(404,558 |
) |
|
|
— |
|
Distributions paid to noncontrolling interest in our Operating Partnership |
|
|
(67,845 |
) |
|
|
— |
|
Net cash provided by financing activities |
|
|
47,288,024 |
|
|
|
50,000 |
|
Net change in cash, cash equivalents and restricted cash |
|
|
7,048,004 |
|
|
|
50,000 |
|
Cash, cash equivalents and restricted cash, beginning of year |
|
|
4,580,759 |
|
|
|
— |
|
Cash, cash equivalents and restricted cash, end of period |
|
$ |
11,628,763 |
|
|
$ |
50,000 |
|
Supplemental disclosures and non-cash transactions: |
|
|
|
|
|
|
||
Cash paid for interest |
|
$ |
369,541 |
|
|
$ |
— |
|
Real estate facilities in due to affiliates |
|
$ |
1,200,000 |
|
|
$ |
— |
|
Proceeds from issuance of common stock in accounts payable and accrued liabilities |
|
$ |
(85,000 |
) |
|
$ |
— |
|
Offering costs included in accounts payable and accrued liabilities |
|
$ |
263,795 |
|
|
$ |
49,994 |
|
Issuance of shares pursuant to distribution reinvestment plan |
|
$ |
268,630 |
|
|
$ |
— |
|
Distributions payable to common stockholders |
|
$ |
421,192 |
|
|
$ |
15 |
|
Distributions payable to noncontrolling interests in our Operating Partnership |
|
$ |
23,365 |
|
|
$ |
— |
|
See notes to consolidated financial statements.
F-5
STRATEGIC STORAGE TRUST VI, INC. AND SUBSIDIARIES
NOTES TO CONSOLIDATED FINANCIAL STATEMENTS
March 31, 2022
(Unaudited)
Note 1. Organization
Strategic Storage Trust VI, Inc., a Maryland corporation (the “Company”), was formed on October 14, 2020 under the Maryland General Corporation Law for the purpose of engaging in the business of investing in self storage facilities and commenced formal operations on March 10, 2021. Our year-end is December 31. As used herein, “we,” “us,” “our” and “Company” refer to Strategic Storage Trust VI, Inc. and each of our subsidiaries.
SmartStop REIT Advisors, LLC is our sponsor (our “Sponsor”). Our Sponsor is an indirect subsidiary of SmartStop Self Storage REIT, Inc. (“SmartStop”). Our Sponsor is a company focused on providing self storage advisory, asset management, and property management services. Our Sponsor owns 90% of the economic interests (and 100% of the voting membership interests) of Strategic Storage Advisor VI, LLC (our “Advisor”) and owns 100% of Strategic Storage Property Management VI, LLC (our “Property Manager”).
We have no employees. Our Advisor, a Delaware limited liability company, was formed on October 7, 2020. Our Advisor is responsible for managing our affairs on a day-to-day basis and identifying and making acquisitions and investments on our behalf under the terms of an advisory agreement we entered into with our Advisor on February 26, 2021 (our “Private Offering Advisory Agreement”), which was amended and restated on March 17, 2022 (our "Advisory Agreement"). A majority of our officers are also officers of our Advisor, Sponsor and SmartStop.
On January 15, 2021, our Advisor purchased approximately 110 shares of our common stock for $1,000 and became our initial stockholder. Our Articles of Incorporation authorized 30,000 shares of common stock with a par value of $0.001 per share. Our Articles of Amendment and Restatement (our "Charter") authorized 700,000,000 shares of common stock with a par value of $0.001 per share and 200,000,000 shares of preferred stock with a par value of $0.001 per share. On February 26, 2021, pursuant to a confidential private placement memorandum (the “private placement memorandum”), we commenced a private offering of up to $200,000,000 in shares of our common stock and $20,000,000 in shares of common stock pursuant to our distribution reinvestment plan (the “Private Offering”). On March 10, 2021, we commenced formal operations.
In connection with the Public Offering, defined below, we filed articles of amendment to our Charter (the “Articles of Amendment”) and articles supplementary to our Charter (the “Articles Supplementary”). Following the filing of the Articles of Amendment and the Articles Supplementary, we authorized 300,000,000 shares of common stock designated as Class A shares, 30,000,000 shares of common stock designated as Class P shares, 300,000,000 shares of common stock designated as Class T shares, and 70,000,000 shares of common stock designated as Class W shares. Any common stock sold in the Private Offering were redesignated as Class P common stock upon the filing of the Articles of Amendment. On May 28, 2021, we filed a Form S-11 Registration Statement, which has subsequently been amended, with the Securities and Exchange Commission (“SEC”) to register a maximum of $1,000,000,000 in shares of Class A, Class T, and Class W common stock for sale to the public (the “Primary Offering”) and $95,000,000 in shares of Class A, Class T, and Class W common stock for sale pursuant to our distribution reinvestment plan (collectively, the “Public Offering”). On March 17, 2022, the SEC declared our registration statement effective and our Private Offering was terminated.
As of March 31, 2022, approximately 10.5 million shares of Class P common stock have been sold in the Private Offering for gross offering proceeds of approximately $99.7 million.
We have invested the net proceeds from our Private Offering primarily in self storage facilities consisting of both income-producing and growth properties located in the United States and Canada. As of March 31, 2022, we owned eight operating self storage properties located in five states (Arizona, Florida, Nevada, Oregon and
F-6
Washington) as well as 50% equity interests in two unconsolidated real estate ventures located in the Greater Toronto Area that are intended to be developed into self storage facilities, with subsidiaries of SmartCentres Real Estate Investment Trust (“SmartCentres”) owning the other 50% of such entity. For more information, see Notes 3 and 4.
Our operating partnership, Strategic Storage Operating Partnership VI, L.P., a Delaware limited partnership (our “Operating Partnership”), was formed on October 15, 2020. On January 15, 2021, SmartStop Storage Advisors, LLC (“SSA”), an affiliate of our Advisor, purchased a limited partnership interest in our Operating Partnership for $1,000 and we contributed the initial $1,000 capital contribution we received to our Operating Partnership in exchange for the general partner interest. On February 26, 2021, in connection with entering into the Private Offering Advisory Agreement, SSA made an additional $1,000 investment in our Operating Partnership in exchange for additional limited partnership interests and a special limited partnership interest.
On March 10, 2021, SmartStop OP, L.P. (“SmartStop OP”), an affiliate of our Sponsor and the operating partnership of SmartStop, contributed $5.0 million to our Operating Partnership, in exchange for 549,451 units of limited partnership interest in our Operating Partnership (the “OP Investment”). The OP Investment was made net of sales commissions and dealer manager fees, but without giving effect to the early investor discounts available to purchasers of shares in the Private Offering. At the effective time of the OP Investment, SmartStop OP was admitted as a limited partner to our Operating Partnership. As of March 31, 2022, SmartStop OP’s investment in our Operating Partnership represented approximately 5% of the outstanding units of limited partnership interest.
Our Operating Partnership will own, directly or indirectly through one or more special purpose entities, all of the self storage properties that we acquire. We will conduct certain activities through our taxable REIT subsidiary, Strategic Storage TRS VI, Inc., a Delaware corporation (the “TRS”) which was formed on October 16, 2020 and is a wholly owned subsidiary of our Operating Partnership.
Our Property Manager, a Delaware limited liability company, was formed on October 7, 2020 to manage our properties. Our Property Manager will derive substantially all of its income from the property management services it performs for us. Our Property Manager may enter into sub-property management agreements with third party management companies and pay part of its management fee to such sub-property manager. See Note 6 – Related Party Transactions – Property Management Agreement.
Our dealer manager is Pacific Oak Capital Markets, LLC, a Delaware limited liability company (our “Dealer Manager”). On February 26, 2021, we entered into a dealer manager agreement with our Dealer Manager (the “Private Offering Dealer Manager Agreement”), pursuant to which our Dealer Manager was responsible for marketing our shares being offered pursuant to the Private Offering. In connection with our Public Offering, we entered into a dealer manager agreement with our Dealer Manager, pursuant to which our Dealer Manager is responsible for marketing our shares being offered pursuant to our Primary Offering (the "Dealer Manager Agreement"). An affiliate of our Dealer Manager owns a 10% non-voting economic interest in our Advisor.
As we accept subscriptions for shares of our common stock, we transfer all of the net offering proceeds to our Operating Partnership as capital contributions in exchange for additional units of interest in our Operating Partnership. However, we will be deemed to have made capital contributions in the amount of gross proceeds received from investors, and our Operating Partnership will be deemed to have simultaneously paid the sales commissions and other costs associated with the offerings. In addition, our Operating Partnership is structured to make distributions with respect to limited partnership units that are equivalent to the distributions made to holders of common stock. Finally, a limited partner in our Operating Partnership may later exchange his or her limited partnership units in our Operating Partnership for shares of our common stock at any time after one year following the date of issuance of their limited partnership units, subject to certain restrictions outlined in the limited partnership agreement of our Operating Partnership, which was amended and restated in connection with the Public Offering (the “Operating Partnership Agreement”). SSA and SmartStop OP are prohibited from exchanging or otherwise transferring units representing $202,000 of the limited partnership units acquired in their
F-7
initial investments in our Operating Partnership so long as our Advisor is acting as our Advisor pursuant to our Advisory Agreement.
Recent Market Conditions
The current COVID-19 pandemic continues to impact the global economy, as well as the United States and the markets in which we will operate. Our rental revenue and operating results will depend significantly on the demand for self storage space. While we have not seen a material impact on the demand for self storage space resulting from the COVID-19 outbreak as of the date of these financial statements, if the outbreak causes weakness in national, regional and local economies that negatively impact the demand for self storage space and/or increase bad debts, our business, financial condition, liquidity, results of operations and prospects could be adversely impacted. In addition, as a result of the COVID-19 pandemic, there have been, and may continue to be, temporary shut downs or restrictions placed on businesses and entities by cities, counties, states, or the federal government. These events may negatively impact the demand for self storage space or the willingness or ability of customers to visit our facilities, which could reduce rental revenue and ancillary operating revenue produced by our facilities. These events may also require us to make certain operational changes such as suspending rate increases and late fees or pausing auctions, which could adversely impact our business, financial condition, liquidity and results of operations.
The ultimate extent and duration of the COVID-19 pandemic could still affect the self storage industry and/or us, potentially by the impact of governmental orders or broader economic conditions, which impact our customers, and in turn could affect our financial condition, collections, liquidity, and results of operations. These potential future developments are uncertain and cannot be predicted. This includes new information that may also emerge concerning the breadth of the COVID-19 outbreak, as well as the actions to contain or treat its impact, including the distribution and broad acceptance of various vaccines for COVID-19 or the efficacy of those vaccines against new COVID-19 variants.
Note 2. Summary of Significant Accounting Policies
Basis of Presentation
The accompanying consolidated financial statements have been prepared in accordance with U.S. generally accepted accounting principles (“GAAP”) as contained within the Financial Accounting Standards Board (“FASB”) Accounting Standards Codification (“ASC”) and the rules and regulations of the SEC.
Principles of Consolidation
Our financial statements, and the financial statements of our Operating Partnership, including its wholly-owned subsidiaries, are consolidated in the accompanying consolidated financial statements as of March 31, 2022. The portion of these entities not wholly-owned by us is presented as noncontrolling interests. All intercompany accounts and transactions have been eliminated in consolidation. Please see consolidation considerations section below.
Consolidation Considerations
Current accounting guidance provides a framework for identifying a variable interest entity (“VIE”) and determining when a company should include the assets, liabilities, noncontrolling interests, and results of activities of a VIE in its consolidated financial statements. In general, a VIE is an entity or other legal structure used to conduct activities or hold assets that either (1) has an insufficient amount of equity to carry out its principal activities without additional subordinated financial support, (2) has a group of equity owners that are unable to make significant decisions about its activities, or (3) has a group of equity owners that do not have the obligation to absorb losses or the right to receive returns generated by its operations. Generally, a VIE should be consolidated if a party with an ownership, contractual, or other financial interest in the VIE (a variable interest holder) has the power to direct the VIE’s most significant activities and the obligation to absorb losses or right to receive benefits of the VIE that could be significant to the VIE. A variable interest holder that consolidates the VIE is called the primary beneficiary. Upon consolidation, the primary beneficiary generally must initially record all of the VIE’s assets, liabilities, and noncontrolling interest at fair value and subsequently account for the VIE as
F-8
if it were consolidated based on majority voting interest. Our Operating Partnership is deemed to be a VIE and is consolidated by the Company as the primary beneficiary.
As a result of the OP Investment on March 10, 2021, our Operating Partnership and its subsidiaries were recorded as an equity investment by us from commencement of operations through April 30, 2021 as an affiliate of our Sponsor was determined to be the primary beneficiary. As we sold shares in the Private Offering and contributed the net offering proceeds to our Operating Partnership we became the primary beneficiary and consolidated the Operating Partnership and its wholly-owned subsidiaries on May 1, 2021. As a result of consolidation, we allocated the assets acquired and liabilities assumed to tangible and intangible assets based on their fair values as of the date of consolidation. The aggregate of the fair values were primarily allocated to real estate facilities of approximately $16.0 million, intangible assets of approximately $0.3 million, investment in unconsolidated real estate venture of $3.7 million, secured debt of approximately $14.2 million, other current liabilities of approximately $1.3 million and non controlling interest of approximately $4.6 million. There was no material impact on our net loss as a result of consolidation of our Operating Partnership on May 1, 2021.
As of March 31, 2022, we had not entered into any other contracts/interests that would be deemed to be variable interests in VIEs other than our joint ventures with SmartCentres, which are accounted for under the equity method of accounting. Please see Note 4. Other than the entities noted above, we do not currently have any material relationships with unconsolidated entities or financial partnerships.
Under the equity method, our investments will be stated at cost and adjusted for our share of net earnings or losses and reduced by distributions. Equity in earnings will generally be recognized based on our ownership interest in the earnings of each of the unconsolidated investments.
Noncontrolling Interest in Consolidated Entities
We account for the noncontrolling interest in our Operating Partnership in accordance with the related accounting guidance. Due to our control through our general partnership interest in our Operating Partnership and the limited rights of the limited partner, our Operating Partnership, including its wholly-owned subsidiary, was consolidated by us beginning May 1, 2021, and the limited partner interest is reflected as a noncontrolling interest in the accompanying consolidated balance sheets as of March 31, 2022 and December 31, 2021. The noncontrolling interest shall be attributed its share of income and losses, even if that attribution results in a deficit noncontrolling interest balance.
Use of Estimates
The preparation of the consolidated financial statements in conformity with GAAP requires management to make estimates and assumptions that affect the amounts reported in the consolidated financial statements and accompanying notes. The current economic environment has increased the degree of uncertainty inherent in these estimates and assumptions. Management will adjust such estimates when facts and circumstances dictate. Actual results could materially differ from those estimates. The most significant estimates made include the allocation of property purchase price to tangible and intangible assets acquired and liabilities assumed at relative fair value, the determination if certain entities should be consolidated, the evaluation of potential impairment of long-lived assets, and the estimated useful lives of real estate assets and intangibles.
Cash and Cash Equivalents
We consider all short-term, highly liquid investments that are readily convertible to cash with a maturity of three months or less at the time of purchase to be cash equivalents.
We may maintain cash and cash equivalents in financial institutions in excess of insured limits, but believe this risk will be mitigated by only investing in or through major financial institutions.
Restricted Cash
Restricted cash consists primarily of impound reserve accounts for interest and property taxes in connection with the requirements of certain of our loan agreements.
F-9
Real Estate Purchase Price Allocation
We account for asset acquisitions in accordance with GAAP which requires that we allocate the purchase price of a property to the tangible and intangible assets acquired and the liabilities assumed based on their relative fair values. This guidance requires us to make significant estimates and assumptions, including fair value estimates, which requires the use of significant unobservable inputs, as of the acquisition date.
The value of the tangible assets, consisting of land and buildings, is determined as if vacant. Substantially all of the leases in place at acquired properties are at market rates, as the majority of the leases are month-to-month contracts. We also consider whether in-place, market leases represent an intangible asset. We recorded approximately $0.9 million and none in intangible assets to recognize the value of in-place leases related to our acquisitions during the three months ended March 31, 2022 and 2021, respectively. We do not expect, nor to date have we recorded, intangible assets for the value of customer relationships because we expect we will not have concentrations of significant customers and the average customer turnover will be fairly frequent.
Allocation of purchase price to acquisitions of facilities are allocated to the individual facilities based upon an income approach or a cash flow analysis using appropriate risk adjusted capitalization rates which take into account the relative size, age, and location of the individual facility along with current and projected occupancy and rental rate levels or appraised values, if available.
Acquisitions that do not meet the definition of a business, as defined under current GAAP, are accounted for as asset acquisitions. During the three months ended March 31, 2022, our acquisitions did not meet the definition of a business because substantially all of the fair value was concentrated in a single identifiable asset or group of similar identifiable assets (i.e. land, buildings, and related intangible assets) or because the acquisition did not include a substantive process in the form of an acquired workforce or an acquired contract that cannot be replaced without significant cost, effort or delay. As a result, once an acquisition is deemed probable, transaction costs are capitalized rather than expensed. During the three months ended March 31, 2022 our acquisitions did not meet the definition of a business, and we capitalized approximately $0.4 million of acquisition-related transaction costs.
During the three months ended March 31, 2022, we expensed approximately $0.5 million of acquisition-related transaction costs that did not meet our capitalization policy during the respective periods. There was no acquisition activity for the three months ended March 31, 2021.
Evaluation of Possible Impairment of Long-Lived Assets
Management monitors events and changes in circumstances that could indicate that the carrying amounts of our long-lived assets, including those held through joint ventures, may not be recoverable. When indicators of potential impairment are present that indicate that the carrying amounts of the assets may not be recoverable, we will assess the recoverability of the assets by determining whether the carrying value of the long-lived assets will be recovered through the undiscounted future operating cash flows expected from the use of the asset and its eventual disposition. In the event that such expected undiscounted future cash flows do not exceed the carrying value, we will adjust the value of the long-lived assets to the fair value and recognize an impairment loss. For the three months ended March 31, 2022, no impairment losses were recognized.
Advertising Costs
Advertising costs are included in property operating expenses and general and administrative expenses, depending on the nature of the expense, in the accompanying consolidated statement of operations. These costs are expensed in the period in which the cost is incurred. The Company incurred advertising costs of approximately $85,000 and none for the three months ended March 31, 2022 and 2021.
Revenue Recognition
Management believes that all of our leases are operating leases. Rental income is recognized in accordance with the terms of the leases, which generally are month-to-month. Revenues from any long-term operating leases will be recognized on a straight-line basis over the term of the lease. The excess of rents received over amounts contractually due pursuant to the underlying leases will be included in accounts payable and
F-10
accrued liabilities in our consolidated balance sheet and contractually due but unpaid rent will be included in other assets.
Allowance for Doubtful Accounts
Tenant accounts receivable is reported net of an allowance for doubtful accounts. Management records a general reserve estimate based upon a review of the current status of tenant accounts receivable. It is reasonably possible that management’s estimate of the allowance will change in the future.
Real Estate Facilities
Real estate facilities are recorded based on relative fair value as of the date of acquisition. We capitalize costs incurred to develop, construct, renovate and improve properties, including interest and property taxes incurred during the construction period. The construction period begins when expenditures for the real estate assets have been made and activities that are necessary to prepare the asset for its intended use are in progress. The construction period ends when the asset is substantially complete and ready for its intended use.
Depreciation of Real Property Assets
Our management is required to make subjective assessments as to the useful lives of our depreciable assets. We consider the period of future benefit of the asset to determine the appropriate useful lives.
Depreciation of our real property assets is charged to expense on a straight-line basis over the estimated useful lives
as follows:
Description |
|
Standard Depreciable |
Land |
|
Not Depreciated |
Buildings |
|
35 years |
Site Improvements |
|
7-10 years |
Depreciation of Personal Property Assets
Personal property assets consist primarily of furniture, fixtures and equipment and are depreciated on a straight-line basis over the estimated useful lives generally ranging from 3 to 5 years, and are included in other assets on our consolidated balance sheets.
Foreign Currency Translation
For non-U.S. functional currency operations, assets and liabilities are translated to U.S. dollars at current exchange rates. Revenues and expenses are translated at the average rate for the period. Transactions denominated in a currency other than the functional currency of the related operations are recorded at rates of exchange in effect at the date of the translation. Changes in investments classified as short term in accordance with GAAP are recorded in other income (expense).
Intangible Assets
We have allocated a portion of our real estate purchase price to in-place leases. We are amortizing in-place leases on a straight-line basis over 18 months, the estimated average rental period for the leases. As of March 31, 2022, the gross amounts allocated to in-place lease intangibles were approximately $2.2 million and accumulated amortization of in-place lease intangibles totaled approximately $0.5 million.
The total estimated future amortization expense of intangible assets for the years ending December 31, 2022 and 2023 is approximately $1.1 million and $0.6 million, respectively.
F-11
Debt Issuance Costs
The net carrying value of costs incurred in connection with obtaining non revolving debt are presented on the consolidated balance sheets as a reduction of the related debt. Debt issuance costs are amortized on a straight-line basis over the term of the related loan, which is not materially different than the effective interest method. As of March 31, 2022 and December 31, 2021, accumulated amortization of debt issuance costs related to non revolving debt totaled approximately $110,000 and $25,000, respectively.
Organizational and Offering Costs
Our Advisor may fund organization and offering costs on our behalf. We are required to reimburse our Advisor for such organization and offering costs; provided, however, our Advisor will fund, and will not be reimbursed for, 1.0% of the gross offering proceeds from the sale of Class W shares towards payment of organization and offering expenses, which we will recognize as a capital contribution from our Advisor. Our Advisor must reimburse us within 60 days after the end of the month in which the initial public offering terminates to the extent we paid or reimbursed organization and offering costs (excluding sales commissions, dealer manager fees, stockholder servicing fees and dealer manager servicing fees) in excess of 15% of the gross offering proceeds from the Primary Offering. If at any point in time we determine that the total organization and offering costs are expected to exceed 15% of the gross proceeds anticipated to be received from the Primary Offering, we will recognize such excess as a capital contribution from our Advisor. Offering costs are recorded as an offset to additional paid-in capital, and organization costs are recorded as an expense.
In connection with our Private Offering, our Dealer Manager received a sales commission of up to 6.0% of gross proceeds from sales in the Private Offering and a dealer manager fee equal to up to 3.0% of gross proceeds from sales in the Private Offering under the terms of the Private Offering Dealer Manager Agreement.
In connection with our Primary Offering, our Dealer Manager will receive a sales commission of up to 6.0% of gross proceeds from sales of Class A shares and up to 3.0% of gross proceeds from the sales of Class T shares in the Primary Offering and a dealer manager fee up to 3.0% of gross proceeds from sales of both Class A shares and Class T shares in the Primary Offering under the terms of the Dealer Manager Agreement. Our Dealer Manager does not receive an upfront sales commission or dealer manager fee from the sales of Class W shares in the Primary Offering. In addition, our Dealer Manager receives an ongoing stockholder servicing fee that is payable monthly and accrues daily in an amount equal to 1/365th of 1% of the purchase price per share of the Class T shares sold in the Primary Offering. Our Dealer Manager also receives an ongoing dealer manager servicing fee that is payable monthly and accrues daily in an amount equal to 1/365th of 0.5% of the purchase price per share of the Class W shares sold in the Primary Offering. We will cease paying the stockholder servicing fee with respect to the Class T shares sold in the Primary Offering at the earlier of (i) the date we list our shares on a national securities exchange, merge or consolidate with or into another entity, or sell or dispose of all or substantially all of our assets, (ii) the date at which the aggregate underwriting compensation from all sources equals 10% of the gross proceeds from the sale of Class A shares, Class T shares, and Class W shares in our Primary Offering (i.e., excluding proceeds from sales pursuant to our distribution reinvestment plan), which calculation shall be made by us with the assistance of our Dealer Manager commencing after the termination of our Primary Offering; (iii) with respect to a particular Class T share, the third anniversary of the issuance of the share; and (iv) the date that such Class T share is redeemed or is no longer outstanding. We will cease paying the dealer manager servicing fee with respect to the Class W shares sold in the Primary Offering at the earlier of (i) the date we list our shares on a national securities exchange, merge or consolidate with or into another entity, or sell or dispose of all or substantially all of our assets, (ii) the date at which the aggregate underwriting compensation from all sources equals 10% of the gross proceeds from the sale of Class A shares, Class T shares, and Class W shares in our Primary Offering (i.e., excluding proceeds from sales pursuant to our distribution reinvestment plan),which calculation shall be made by us with the assistance of our Dealer Manager commencing after the termination of our Primary Offering; (iii) the end of the month in which the aggregate underwriting compensation paid in our Primary Offering with respect to Class W shares, comprised of the dealer manager servicing fee, equals 9.0% of the gross proceeds from the sale of Class W shares in our Primary Offering (i.e., excluding proceeds from sales pursuant to our distribution reinvestment plan), which calculation shall be made by us with the assistance of our Dealer Manager commencing after the termination of our Primary Offering, and (iv) the date that such Class W share is redeemed or is no longer outstanding.
F-12
Our Dealer Manager enters into participating dealer agreements with certain other broker-dealers which authorize them to sell our shares. Upon sale of our shares by such broker-dealers, our Dealer Manager will re-allow all of the sales commissions and, subject to certain limitations, the stockholder servicing fees paid in connection with sales made by these broker-dealers. Our Dealer Manager may also re-allow to these broker-dealers a portion of their dealer manager fee as marketing fees, reimbursement of certain costs and expenses of attending training and education meetings sponsored by our Dealer Manager, payment of attendance fees required for employees of our Dealer Manager or other affiliates to attend retail seminars and public seminars sponsored by these broker-dealers, or to defray other distribution-related expenses. Our Dealer Manager will also receive reimbursement of bona fide due diligence expenses; however, to the extent these due diligence expenses cannot be justified, any excess over actual due diligence expenses would have been considered underwriting compensation subject to a 10% FINRA limitation and, when aggregated with all other non-accountable expenses in connection with our Public Offering, may not exceed 3% of gross offering proceeds from sales in the Public Offering. We record a liability within Due to Affiliates for the future estimated stockholder and dealer manager servicing fees and a reduction to additional paid-in capital at the time of sale of the Class T and Class W shares as an offering cost.
Redeemable Common Stock
We adopted a share redemption program that will enable stockholders to sell their shares to us in limited circumstances.
We record amounts that are redeemable under the share redemption program as redeemable common stock in the accompanying consolidated balance sheets since the shares are redeemable at the option of the holder and therefore their redemption is outside our control. The maximum amount redeemable under our share redemption program will be limited to the number of shares we could repurchase with the amount of the net proceeds from the sale of shares under the distribution reinvestment plan. However, accounting guidance states that determinable amounts that can become redeemable but that are contingent on an event that is likely to occur (e.g., the passage of time) should be presented as redeemable when such amount is known. Therefore, the net proceeds from the distribution reinvestment plan are considered to be temporary equity and are presented as redeemable common stock in our consolidated balance sheets.
In addition, current accounting guidance requires, among other things, that financial instruments that represent a mandatory obligation of us to repurchase shares be classified as liabilities and reported at settlement value. For the three months ended March 31, 2022 and 2021, we did not receive any redemption requests.
Fair Value Measurements
The accounting standard for fair value measurements and disclosures defines fair value, establishes a framework for measuring fair value, and provides for expanded disclosure about fair value measurements. Fair value is defined by the accounting standard for fair value measurements and disclosures as the exchange price that would be received for an asset or paid to transfer a liability (an exit price) in the principal or most advantageous market for the asset or liability in an orderly transaction between market participants on the measurement date. It also establishes a fair value hierarchy that prioritizes observable and unobservable inputs used to measure fair value into three levels. The following summarizes the three levels of inputs and hierarchy of fair value we will use when measuring fair value:
In instances where the determination of the fair value measurement is based on inputs from different levels of the fair value hierarchy, the fair value measurement will fall within the lowest level that is significant to the fair value measurement in its entirety.
F-13
The accounting guidance for fair value measurements and disclosures provides a framework for measuring fair value and establishes a fair value hierarchy which requires an entity to maximize the use of observable inputs and minimize the use of unobservable inputs when measuring fair value. In determining fair value, we will utilize valuation techniques that maximize the use of observable inputs and minimize the use of unobservable inputs to the extent possible as well as consider counterparty credit risk in our assessment of fair value. Considerable judgment will be necessary to interpret Level 2 and 3 inputs in determining fair value of our financial and non- financial assets and liabilities. Accordingly, there can be no assurance that the fair values we will present will be indicative of amounts that may ultimately be realized upon sale or other disposition of these assets.
Financial and non-financial assets and liabilities measured at fair value on a non-recurring basis in our consolidated financial statements consist of real estate and related liabilities assumed related to our acquisition. The fair value of these assets and liabilities were determined as of the acquisition date using widely accepted valuation techniques, including (i) discounted cash flow analysis, which considers, among other things, leasing assumptions, growth rates, discount rates and terminal capitalization rates, (ii) income capitalization approach, which considers prevailing market capitalization rates, and (iii) comparable sales activity. In general, we consider multiple valuation techniques when measuring fair values. However, in certain circumstances, a single valuation technique may be appropriate. All of the fair values of the assets and liabilities assumed at the consolidation of the Operating Partnership were derived using Level 3 inputs.
The carrying amounts of cash and cash equivalents, restricted cash, other assets, accounts payable and accrued liabilities, distributions payable and amounts due to affiliates are expected to approximate fair value.
The table below summarizes our fixed rate notes payable at March 31, 2022 and December 31, 2021. The estimated fair value of financial instruments are subjective in nature and are dependent on a number of important assumptions, including discount rates and relevant comparable market information associated with each financial instrument. The fair value of the fixed rate notes payable was estimated by discounting the future cash flows using the current rates at which similar loans would be made to borrowers with similar credit ratings and for the same remaining maturities. The use of different market assumptions and estimation methodologies may have a material effect on the reported estimated fair value amounts. Accordingly, the estimates presented below are not necessarily indicative of the amounts we would realize in a current market exchange.
|
|
March 31, 2022 |
|
|
December 31, 2021 |
|
|||||||||||
|
|
Fair |
|
|
Carrying |
|
|
Fair |
|
|
Carrying |
|
|||||
Fixed Rate Secured Debt |
|
$ |
4,700,000 |
|
|
$ |
4,800,000 |
|
|
$ |
4,850,000 |
|
|
$ |
4,800,000 |
|
|
Income Taxes
We intend to make an election to be taxed as a Real Estate Investment Trust (“REIT”), under Sections 856 through 860 of the Internal Revenue Code of 1986, as amended (the “Code”), commencing with our taxable year ended December 31, 2021. To qualify as a REIT, we must meet certain organizational and operational requirements, including a requirement to distribute at least 90% of the REIT’s ordinary taxable income to stockholders (which is computed without regard to the dividends paid deduction or net capital gains and which does not necessarily equal net income as calculated in accordance with GAAP). As a REIT, we generally will not be subject to federal income tax on taxable income that we distribute to our stockholders. If we fail to qualify as a REIT in any taxable year, we will then be subject to federal income taxes on our taxable income at regular corporate rates and will not be permitted to qualify for treatment as a REIT for federal income tax purposes for four years following the year during which qualification is lost unless the IRS grants us relief under certain statutory provisions. Such an event could materially adversely affect our net income and net cash available for distribution to stockholders. However, we believe that we are organized and operate in such a manner as to qualify for treatment as a REIT and intend to operate in the foreseeable future in such a manner that we will remain qualified as a REIT for federal income tax purposes.
Even if we qualify for taxation as a REIT, we may be subject to certain state and local taxes on our income and property, and federal income and excise taxes on our undistributed income.
F-14
We filed an election to treat our TRS as a taxable REIT subsidiary. In general, the TRS performs additional services for our customers and generally engages in any real estate or non-real estate related business. The TRS is subject to corporate federal and state income tax. The TRS follows accounting guidance which requires the use of the asset and liability method. Deferred income taxes represent the tax effect of future differences between the book and tax bases of assets and liabilities.
Recently Issued Accounting Guidance
In March 2020, the FASB issued ASU 2020-04, “Reference Rate Reform (Topic 848).” ASU 2020-04 contains practical expedients for reference rate reform related activities that impact debt, leases, derivatives and other contracts. The guidance in ASU 2020-04 is optional and may be elected over time as reference rate reform activities occur. We continue to evaluate the impact of the guidance and may apply other elections as applicable as additional changes in the market occur.
Note 3. Real Estate Facilities
The following summarizes the activity in real estate facilities during the three months ended March 31, 2022 (we had no real estate facilities during the three months ended March 31, 2021):
Real estate facilities |
|
|
|
|
Balance at December 31, 2021 |
|
$ |
75,356,725 |
|
Facility acquisitions |
|
|
39,528,848 |
|
Improvements and additions |
|
|
132,964 |
|
Balance at March 31, 2022 |
|
$ |
115,018,537 |
|
Accumulated depreciation |
|
|
|
|
Balance at December 31, 2021 |
|
$ |
(597,090 |
) |
Depreciation expense |
|
|
(527,296 |
) |
Balance at March 31, 2022 |
|
$ |
(1,124,386 |
) |
The following table summarizes the purchase price allocations for our acquisitions during the three months ended March 31, 2022:
Property |
|
Acquisition |
|
Real Estate |
|
|
Intangibles |
|
|
Total(1) |
|
|
2022 |
|
|
2022 |
|
|||||
Vancouver – WA |
|
03/29/22 |
|
$ |
24,612,304 |
|
|
$ |
655,415 |
|
|
$ |
25,267,719 |
|
|
$ |
3,154 |
|
|
$ |
(5,583 |
) |
Portland – OR |
|
03/31/22 |
|
$ |
14,916,544 |
|
|
$ |
256,765 |
|
|
$ |
15,173,309 |
|
|
$ |
— |
|
|
$ |
(7,968 |
) |
|
|
|
|
$ |
39,528,848 |
|
|
$ |
912,180 |
|
|
$ |
40,441,028 |
|
|
$ |
3,154 |
|
|
$ |
(13,551 |
) |
Note 4. Investments in Unconsolidated Real Estate Ventures
We have entered into various agreements with a subsidiary of SmartCentres, an unaffiliated third party, to acquire tracts of land and develop them into self storage facilities.
We account for these investments using the equity method of accounting and they are stated at cost and adjusted for our share of net earnings or losses and reduced by distributions. Equity in earnings (loss) will
F-15
generally be recognized based on our ownership interest in the earnings (loss) of each of the unconsolidated investments.
The Company's investments in unconsolidated real estate ventures is summarized as follows:
|
|
|
|
|
|
|
|
|
|
Carrying Value of |
|
|||||||||
|
|
Location |
|
Date Real Estate |
|
Real Estate |
|
Equity |
|
March 31, |
|
|
December 31, |
|
||||||
Toronto |
|
Toronto, Ontario |
|
April 2021 |
|
Under development |
|
50% |
|
$ |
3,807,346 |
|
|
$ |
3,750,217 |
|
||||
Toronto II |
|
Toronto, Ontario |
|
December 2021 |
|
Under development |
|
50% |
|
|
6,147,971 |
|
|
|
5,882,143 |
|
||||
|
|
|
|
|
|
|
|
|
|
$ |
9,955,317 |
|
|
$ |
9,632,360 |
|
||||
On April 19, 2021, our Operating Partnership (through its subsidiaries) and SmartCentres (through its subsidiaries) acquired an undeveloped tract of land located in Toronto, Ontario (the “Toronto Land”) from an unaffiliated third party. The Toronto Land is owned by a limited partnership in which we (through our subsidiaries) and SmartCentres (through its subsidiaries) are each a 50% limited partner and each have an equal ranking general partner. At closing, our Operating Partnership (through its subsidiaries) subscribed for 50% of the units of the limited partnership at an agreed upon subscription price of approximately CAD $4.25 million, representing a contribution equivalent to 50% of the purchase price of the Toronto Land. The contribution was funded with a combination of proceeds from the Term Loan (see Note 5 – Loans from SmartStop OP, L.P.) and proceeds from our Private Offering. We expect that the limited partnership will develop the Toronto Land and build a self storage facility (the “Toronto Property”). The project is expected to be funded with debt proceeds.
On December 14, 2021, our Operating Partnership (through its subsidiaries) and SmartCentres (through its subsidiaries) acquired three parcels of land located in Toronto, Ontario (the “Toronto II Land”) from an unaffiliated third party. The Toronto II Land is owned by a limited partnership in which we (through our subsidiaries) and SmartCentres (through its subsidiaries) are each a 50% limited partner and each have an equal ranking general partner. At closing, our Operating Partnership (through its subsidiaries) subscribed for 50% of the units of the limited partnership at an agreed upon subscription price of approximately CAD $6.6 million, representing a contribution equivalent to 50% of the purchase price of the Toronto II Land. The contribution was funded with proceeds from our Private Offering. We expect that the limited partnership will develop the Toronto II Land into a self storage facility (the “Toronto II Property”). The project is expected to be funded with debt proceeds.
Note 5. Secured Debt
The Company’s secured debt is summarized as follows:
Secured Debt |
|
March 31, |
|
|
December 31, |
|
|
Interest |
|
|
Maturity |
|||||||||
Huntington Credit Facility |
|
$ |
37,062,500 |
|
|
$ |
37,062,500 |
|
|
|
3.25 |
% |
|
11/30/2024 |
||||||
Skymar Las Vegas Loan |
|
|
4,800,000 |
|
|
|
4,800,000 |
|
|
|
4.125 |
% |
|
8/1/2024 |
||||||
SmartStop Delayed Draw Mezzanine Loan |
|
|
6,800,000 |
|
|
|
6,800,000 |
|
|
|
3.34 |
% |
|
12/30/2022 |
||||||
Debt issuance costs, net |
|
|
(720,128 |
) |
|
|
(805,642 |
) |
|
|
|
|
|
|||||||
Total Secured Debt |
|
$ |
47,942,372 |
|
|
$ |
47,856,858 |
|
|
|
|
|
|
|||||||
F-16
The weighted average interest rate on our consolidated debt as of March 31, 2022 was approximately 3.40%.
Huntington Loan
On March 11, 2021, in connection with the acquisition of the Phoenix Property, we, through an indirect, wholly-owned subsidiary of our Operating Partnership, entered into a term loan agreement (the “Huntington Loan Agreement”) with Huntington National Bank, a national banking association, as lead arranger and administrative agent for approximately $9.0 million (the “Huntington Loan”). At closing, we drew approximately $8.6 million. The remaining $0.4 million served as an interest holdback to cover monthly interest payments until fully utilized. The proceeds of the Huntington Loan were used to partially fund the acquisition of the Phoenix Property. The Huntington Loan was secured by a deed of trust on the Phoenix Property. We and our Operating Partnership served as limited guarantors with respect to the Huntington Loan. The interest rate on the Huntington Loan was equal to the greater of (i) 3.50% per annum, or (ii) 30-day LIBOR plus 2.75%. Payments on the Huntington Loan were interest only until March 11, 2024, which was the initial maturity date.
On November 30, 2021, in conjunction with entering into the Huntington Credit Facility, the Huntington Loan was repaid and terminated in accordance with the Huntington Loan Agreement without fees or penalties.
Huntington Credit Facility
On November 30, 2021, we, through three special purpose entities (collectively, the “Borrower”) wholly owned by our operating partnership, entered into a credit agreement (the “Credit Agreement”) with Huntington National Bank (“Huntington”), as administrative agent and sole lead arranger.
Under the terms of the Credit Agreement, the Borrower has a maximum borrowing capacity of $50 million (the “Huntington Credit Facility”). However, certain financial requirements with respect to both the Borrower and the “Pool” of “Mortgaged Properties” (as each term is defined in the Credit Agreement) must be satisfied prior to making any drawdowns on the Huntington Credit Facility in accordance with the Credit Agreement. At close, we borrowed approximately $22.4 million on the Huntington Credit Facility, secured by a first mortgage deed of trust on the Surprise, Phoenix and Phoenix II Properties. In conjunction with the initial draw on the Huntington Credit Facility, the Huntington Loan was repaid and terminated in accordance with the Huntington Loan Agreement without any fees or penalties. On December 30, 2021, in conjunction with the acquisitions of the Bradenton Property and Apopka Property, we borrowed an additional approximately $14.7 million pursuant to the Huntington Credit Facility and the Bradenton and Apopka Properties were added as security. On April 26, 2022, the Vancouver Property was added as security to the Huntington Credit Facility and we borrowed approximately $12.9 million for a total outstanding amount of $50 million (See Note 10 - Subsequent Events).
The Huntington Credit Facility is a term loan that has a maturity date of November 30, 2024, which may, in certain circumstances, be extended at the option of the Borrower until November 30, 2026. Payments due under the Huntington Credit Facility are interest-only during the initial term of the loan.
The amounts outstanding under the Huntington Credit Facility bear interest at a variable rate equal to Secured Overnight Financing Rate (“SOFR”) plus 2.61%, adjusted monthly, with a floor of 3.25%. As of March 31, 2022, the interest rate on the Huntington Credit Facility was 3.25%. The loan may be prepaid in whole, but not in part, at any time, subject to certain conditions as set forth in the Credit Agreement.
The Credit Agreement contains certain customary representations and warranties, affirmative, negative and financial covenants, borrowing conditions, and events of default. We serve as a limited recourse guarantor with respect to the Huntington Credit Facility. In particular, the financial covenants include a minimum debt service coverage ratio and minimum net worth and liquid assets requirements applicable to us and our Operating Partnership as guarantors. As of March 31, 2022, we are in compliance with all such covenants. The Huntington Credit Facility may be repaid after one year in accordance with the Credit Agreement.
F-17
Skymar Loan
On July 8, 2021, we, through a wholly-owned special purposes entity, entered into a $4.8 million financing with Skymar Capital Corporation (“Skymar”) as lender pursuant to a mortgage loan (the “Skymar Las Vegas Loan”). The Las Vegas Loan is secured by a first mortgage deed of trust on the Las Vegas property. The loan has a maturity date of August 1, 2024. Monthly payments due under the loan agreement (the “Las Vegas Loan Agreement”) are interest-only for the first two years, with principal and interest payments thereafter.
The amount outstanding under the Las Vegas Loan bears interest at an annual fixed rate equal to 4.125%. The loan may be prepaid in whole, but not in part, at any time, subject to certain conditions as set forth in the Las Vegas Loan Agreement. The loan documents contain: agreements; representations; warranties and borrowing conditions; reserve requirements and events of default all as set forth in such loan documents. In addition, and pursuant to the terms of the limited recourse guaranty, we serve as a non-recourse guarantor with respect to the Las Vegas Loan.
Loans from SmartStop OP, L.P.
On March 11, 2021, in connection with the acquisition of the Phoenix Property, we, through a wholly owned subsidiary of our Operating Partnership, entered into a mezzanine loan agreement (the “Mezzanine Loan Agreement”) with SmartStop OP, an affiliate of our sponsor, for $3.5 million (the “Mezzanine Loan”). The Mezzanine Loan required a commitment fee equal to 1.0% of the amount drawn at closing of the Mezzanine Loan. The proceeds of the Mezzanine Loan were used to partially fund the acquisition of the Phoenix Property. The Mezzanine Loan was secured by a pledge of the equity interest in the indirect, wholly-owned subsidiary of our Operating Partnership that owns the Phoenix Property. Our Operating Partnership served as a limited guarantor with respect to the Mezzanine Loan.
The interest rate on the Mezzanine Loan was equal to 8.5% per annum. Payments on the Mezzanine Loan were interest only until September 7, 2021, which was the initial maturity date of the Mezzanine Loan. In accordance with the terms of the Mezzanine Loan Agreement, we extended the maturity date of the Mezzanine Loan through March 6, 2022 by providing written notice to SmartStop OP, at which time the interest rate of the Mezzanine Loan increased to 9.25% per annum. On November 12, 2021, we repaid the outstanding balance on the Mezzanine Loan along with all accrued interest. The loan was terminated in accordance with the Mezzanine Loan Agreement without fees or penalties.
On April 16, 2021, in connection with the acquisition of the Toronto Land, we, through our Operating Partnership, entered into a term loan agreement (the “Term Loan Agreement”) with SmartStop OP, for $2.1 million (the “Term Loan”). The Term Loan required a commitment fee equal to 1.0% of the amount of the Term Loan. The proceeds of the Term Loan were used to fund our contribution to the limited partnership that purchased the Toronto Land. The Term Loan was secured by a pledge of the equity interest in the wholly-owned subsidiary of our Operating Partnership that indirectly owns a portion of the Toronto Property.
The initial interest rate on the Term Loan was equal to 8.5% per annum. Commencing on October 14, 2021 and continuing until April 16, 2022, the maturity date of the Term Loan (the “Maturity Date”), the interest rate was equal to 9.25% per annum. Payments on the Term Loan were interest only until the Maturity Date. On November 12, 2021, we repaid the outstanding balance on the Term Loan along with all accrued interest. The loan was terminated in accordance with the Term Loan Agreement without fees or penalties.
On December 30, 2021, in connection with the acquisition of the Bradenton Property and the Apopka Property, we, through a wholly-owned subsidiary of our operating partnership, entered into a mezzanine loan agreement (the “SmartStop Delayed Draw Mezzanine Loan Agreement”) with SmartStop OP, an affiliate of our sponsor, for up to $45 million (the “SmartStop Delayed Draw Mezzanine Loan”). The SmartStop Delayed Draw Mezzanine Loan required a commitment fee equal to 1.0% of the amount drawn at closing. On December 30, 2021, we borrowed $6.8 million pursuant to the SmartStop Delayed Draw Mezzanine Loan. The proceeds were used to partially fund the acquisitions of the Bradenton Property and the Apopka Property. The SmartStop Delayed Draw Mezzanine Loan is secured by a pledge of the equity interest in the indirect, wholly-owned
F-18
subsidiaries of our operating partnership that own the Bradenton Property and the Apopka Property. Our Operating Partnership serves as a non-recourse guarantor with respect to the SmartStop Delayed Draw Mezzanine Loan.
The interest rate on the SmartStop Delayed Draw Mezzanine Loan is a variable rate equal to LIBOR plus 3%. Payments are interest only until December 30, 2022, which is the initial maturity date. We may, in certain circumstances, extend the ultimate maturity date of the SmartStop Delayed Draw Mezzanine Loan through December 30, 2023 upon written notice to SmartStop OP, in which event the interest rate will increase to LIBOR plus 4% per annum. The SmartStop Delayed Draw Mezzanine Loan may be prepaid in whole or in part at any time without fees or penalty and, in certain circumstances, equity interests securing the SmartStop Delayed Draw Mezzanine Loan may be released from the pledge of collateral.
The following table presents the future principal payment requirements on our outstanding secured debt as of March 31, 2022:
2022 |
|
$ |
6,800,000 |
|
2023 |
|
|
— |
|
2024 |
|
|
41,862,500 |
|
Thereafter |
|
|
— |
|
Total payments |
|
|
48,662,500 |
|
Debt issuance costs, net |
|
|
(720,128 |
) |
Total |
|
$ |
47,942,372 |
|
Note 6. Related Party Transactions
Fees to Affiliates
Our Private Offering Advisory Agreement and our Private Offering Dealer Manager Agreement entitled our Advisor and our Dealer Manager to specified fees upon the provision of certain services with regard to the Private Offering and investment of funds in real estate properties, among other services, as well as reimbursement for organization and offering costs incurred by our Advisor on our behalf and reimbursement of certain costs and expenses incurred by our Advisor in providing services to us.
In addition, our Advisory Agreement with our Advisor and our Dealer Manager Agreement with our Dealer Manager entitle our Advisor and our Dealer Manager to specified fees upon the provision of certain services with regard to the Public Offering and investment of funds in real estate properties, among other services, as well as reimbursement for organization and offering costs incurred by our Advisor on our behalf and reimbursement of certain costs and expenses incurred by our Advisor in providing services to us.
Organization and Offering Costs
Organization and offering costs of the Private Offering paid by our Advisor on our behalf will be reimbursed to our Advisor. In addition, organization and offering costs of the Public Offering have been paid and will continue to be paid by our Advisor on our behalf and will be reimbursed to our Advisor; provided, however, that our Advisor will fund, and will not be reimbursed for, 1.0% of the gross offering proceeds from the sale of Class W shares towards payment of organization and offering expenses. Organization and offering costs consist of all expenses (other than sales commissions, the dealer manager fee, stockholder servicing fees and dealer manager servicing fees) to be paid by us in connection with the Private Offering and Public Offering, including our legal, accounting, printing, mailing and filing fees, charges of our escrow holder and other accountable organization and offering expenses, including, but not limited to, (i) amounts to reimburse our Advisor for all marketing related costs and expenses such as salaries and direct expenses of employees of our Advisor and its affiliates in connection with registering and marketing our shares; (ii) technology costs associated with the Private Offering and Public Offering; (iii) our costs of conducting our training and education meetings; (iv) our costs of attending retail seminars conducted by participating broker-dealers; and (v) payment or reimbursement of bona fide due diligence expenses. Our Advisor will be required to reimburse us within 60 days after the end of the month which the Public Offering terminates to the extent we paid or reimbursed organization and offering costs
F-19
(including sales commissions, dealer manager fees, stockholder servicing fees, and dealer manager servicing fees) in excess of 15% of the gross offering proceeds from the Primary Offering.
Advisory Agreements
We do not have any employees. Our Advisor is primarily responsible for managing our business affairs and carrying out the directives of our board of directors. Our Advisor receives various fees and expenses under the terms of our Advisory Agreement. As discussed above, we will be required under our Advisory Agreement to reimburse our Advisor for organization and offering costs; provided, however, our Advisor funded, and will not be reimbursed for, 1% of the gross offering proceeds from the sale of Class W shares towards payment of organization and offering expenses. As noted above, the Advisory Agreement also requires our Advisor to reimburse us to the extent that offering expenses, including sales commissions, dealer manager fees, stockholder servicing fees and dealer manager servicing fees, are in excess of 15% of gross proceeds from the Primary Offering.
Our Advisor receives acquisition fees equal to 1.0% of the contract purchase price of each property we acquire plus reimbursement of any acquisition expenses our Advisor incurs. Our Advisor also receives a monthly asset management fee equal to 0.0625%, which is one-twelfth of 0.75%, of our aggregate asset value, as defined. Under our Advisory Agreement, our Advisor will receive a disposition fee equal to the lesser of 1% of the contract sales price of each property sold or 50% of the competitive commission rate.
SSA may also be entitled to various subordinated distributions under our operating partnership agreement if we (1) list our shares of common stock on a national exchange, (2) terminate or do not renew the Advisory Agreement, (3) liquidate our portfolio, or (4) effect a merger or other corporate reorganization.
Our Advisory Agreement provides for reimbursement of our Advisor’s direct and indirect costs of providing administrative and management services to us. Beginning four fiscal quarters after commencement of the Public Offering, pursuant to our Advisory Agreement, our Advisor will be required to pay or reimburse us the amount by which our aggregate annual operating expenses, as defined, exceed the greater of 2% of our average invested assets or 25% of our net income, as defined, unless a majority of our independent directors determine that such excess expenses were justified based on unusual and non-recurring factors. For any fiscal quarter for which total operating expenses for the 12 months then ended exceed the limitation, we will disclose this fact in our next quarterly report or within 60 days of the end of that quarter and send a written disclosure of this fact to our stockholders. In each case the disclosure will include an explanation of the factors that the independent directors considered in arriving at the conclusion that the excess expenses were justified.
Property Management Agreement
Each of our self storage properties is managed by our Property Manager under separate property management agreements. Under each agreement, our Property Manager receives a fee for its services in managing our properties, generally equal to the greater of $3,000 or 6% of the gross revenues from the properties plus reimbursement of the Property Manager’s costs of managing the properties. In addition, our Property Manager or an affiliate has the exclusive right to offer tenant insurance plans, tenant protection plans or similar programs (collectively “Tenant Programs”) to customers at our properties and is entitled to substantially all of the benefits of such Tenant Programs. The property management agreements have a three-year term and automatically renew for successive three year periods thereafter, unless we or our Property Manager provide prior written notice at least 90 days prior to the expiration of the term. After the end of the initial three year term, either party may terminate a property management agreement generally upon 60 days’ prior written notice. With respect to each new property we acquire for which we enter into a property management agreement with our Property Manager we also pay our Property Manager a one-time start-up fee in the amount of $3,750.
All of our properties are operated under the “SmartStop® Self Storage” brand. An affiliate of our Sponsor owns the rights to the “SmartStop® Self Storage” brand.
F-20
Transfer Agent Agreement
Our Chief Executive Officer is also the chief executive officer and indirect owner of the parent company of our transfer agent (our "Transfer Agent"), which is a registered transfer agent with the SEC. Pursuant to our transfer agent agreement, our Transfer Agent provides transfer agent and registrar services to us. These services are substantially similar to what a third party transfer agent would provide in the ordinary course of performing its functions as a transfer agent, including, but not limited to: providing customer service to our stockholders, processing the distributions and any servicing fees with respect to our shares and issuing regular reports to our stockholders. Our Transfer Agent may retain and supervise third party vendors in its efforts to administer certain services. Our Transfer Agent also conducts transfer agent and registrar services for our Sponsor and other non-traded REITs sponsored by our Sponsor.
Fees paid to our Transfer Agent are based on a fixed quarterly distribution fee, monthly open account fee, monthly portal fee, one-time initial account setup fee, one-time transfer fee and phone call fee per investor call received by our transfer agent. In addition, we will reimburse our Transfer Agent for all reasonable expenses or other charges incurred by it in connection with the provision of its services to us, and we will pay our Transfer Agent fees for any additional services we may request from time to time, in accordance with its rates then in effect. Upon the request of our Transfer Agent, we may also advance payment for substantial reasonable out-of-pocket expenditures to be incurred by it.
The initial term of the Transfer Agent Agreement is three years, which term will be automatically renewed for one year successive terms, but either party may terminate the Transfer Agent Agreement upon 90 days’ prior written notice. In the event that we terminate the Transfer Agent Agreement, other than for cause, we will pay our transfer agent all amounts that would have otherwise accrued during the remaining term of the Transfer Agent Agreement; provided, however, that when calculating the remaining months in the term for such purposes, such term is deemed to be a 12-month period starting from the date of the most recent annual anniversary date.
Pursuant to the terms of the agreements described above, the following table summarizes related party costs incurred and paid by us for the year ended December 31, 2021 and the three months ended March 31, 2022, as well as any related amounts payable as of December 31, 2021 and March 31, 2022:
|
|
Year Ended December 31, 2021 |
|
Three Months Ended March 31, 2022 |
||||||||
|
|
Incurred |
|
Paid |
|
Payable |
|
Incurred |
|
Paid |
|
Payable |
Expensed |
|
|
|
|
|
|
|
|
|
|
|
|
Operating expenses |
|
$1,120,374 |
|
$997,903 |
|
$122,471 |
|
$448,280 |
|
$307,661 |
|
$263,090 |
Asset management fees |
|
178,282 |
|
156,138 |
|
22,144 |
|
155,332 |
|
175,642 |
|
1,834 |
Property management fees |
|
96,505 |
|
88,300 |
|
8,205 |
|
79,050 |
|
75,510 |
|
11,745 |
Transfer Agent expenses |
|
42,949 |
|
42,949 |
|
— |
|
55,184 |
|
50,184 |
|
5,000 |
Acquisition expenses (1) |
|
662,957 |
|
551,302 |
|
111,655 |
|
130,138 |
|
104,133 |
|
137,660 |
Capitalized |
|
|
|
|
|
|
|
|
|
|
|
|
Acquisition related (2) |
|
1,442,319 |
|
1,046,673 |
|
395,646 |
|
1,200,000 |
|
— |
|
1,595,646 |
Additional Paid-in Capital |
|
|
|
|
|
|
|
|
|
|
|
|
Offering costs |
|
501,712 |
|
436,212 |
|
65,500 |
|
— |
|
65,500 |
|
— |
Total |
|
$4,045,098 |
|
$3,319,477 |
|
$725,621 |
|
$2,067,984 |
|
$778,630 |
|
$2,014,975 |
F-21
Tenant Programs
We may offer Tenant Programs to customers at our properties pursuant to which our Property Manager or an affiliate is entitled to substantially all of the net revenue attributable to the sale of Tenant Programs at our properties.
In order to protect the interest of the Property Manager in receiving these revenues in light of the fact that we control the properties and, hence, the ability of the Property Manager to receive such revenues, we and an affiliate of our Property Manager agreed to transfer our respective rights in such revenue to a joint venture entity owned 0.1% by our TRS subsidiary and 99.9% by our Property Manager’s affiliate (the “PM Affiliate”). Under the terms of the operating agreement of the joint venture entity, dated March 8, 2021 (the “JV Agreement”), our TRS receives 0.1% of the net revenues generated from such Tenant Programs and the PM Affiliate receives the other 99.9% of such net revenues. The JV Agreement further provides, among other things, that if a member or its affiliate terminates all or substantially all of the property management agreements or defaults in its material obligations under the JV Agreement or undergoes a change of control, as defined, (the “Triggering Member”), the other member generally shall have the right (but not the obligation) to either (i) sell all of its interest in the joint venture to the Triggering Member at fair market value (as agreed upon or as determined under an appraisal process) or (ii) purchase all of the Triggering Member’s interest in the joint venture at 95% of fair market value. For the three months ended March 31, 2022 and 2021, an affiliate of our Property Manager received net revenue from this joint venture of approximately $50,000 and $0, respectively.
Storage Auction Program
Our Sponsor owns a minority interest in a company that owns 50% of an online auction company (the “Auction Company”) that serves as a web portal for self storage companies to post their auctions for the contents of abandoned storage units online instead of using live auctions conducted at the self storage facilities. The Auction Company receives a service fee for such services. During the three months ended March 31, 2022 and 2021, we paid approximately $450 and $0 in fees to the Auction Company related to our properties, respectively. Our properties will receive the proceeds from such online auctions.
Note 7. Commitments and Contingencies
Distribution Reinvestment Plan
We adopted a distribution reinvestment plan that will allow our stockholders to have distributions otherwise distributable to them invested in additional shares of our common stock at a price equal to 95% of the then-current per share offering price. We adopted an amended and restated distribution reinvestment plan in connection with the Public Offering. The purchase price per share will be 95% of the latest per share offering price offered in the Private Offering for Class P shares and 95% of the current offering price of our shares in the Primary Offering for Class A, Class T and Class W shares. No sales commission or dealer manager fee will be paid on shares sold through the distribution reinvestment plan. We may amend or terminate the distribution reinvestment plan for any reason at any time upon 10 days’ prior written notice to stockholders.
As of March 31, 2022, we have sold approximately 65,000 shares of common stock through our distribution reinvestment plan offering.
Share Redemption Program
We adopted a share redemption program for stockholders purchasing Class P shares in the Private Offering and a separate share redemption program for stockholders purchasing Class A shares, Class T shares and Class W shares in the Public Offering, each of which enables stockholders to sell their shares to us in limited circumstances. As long as our common stock is not listed on a national securities exchange or over-the-counter market, our stockholders who have held their stock for at least one year may be able to have all or any portion of their shares of stock redeemed by us. We may redeem the shares of stock presented for redemption for cash to the extent that we have sufficient funds available to fund such redemption.
F-22
Until we establish a net asset value per share, the redemption price per share for Class A shares, Class T shares and Class W shares purchased in our Public Offering shall initially be equal to the net investment amount of such shares, which will be based on the “amount available for investment” percentage for the respective class of shares, assuming the maximum amount of our public offering is raised, shown in the estimated use of proceeds table in our prospectus in effect as of the investor’s purchase date. For each class of shares, this amount will equal the then-current offering price of the shares, less the associated sales commissions, dealer manager fees and estimated organization and offering expenses not reimbursed by our Advisor assuming the maximum amount of our Public Offering is raised.
The redemption price per for Class P shares purchased in the Private Offering will depend on the length of time such stockholders have held such shares as follows (in each case, as adjusted for any stock dividends, combinations, splits, recapitalizations and the like with respect to our common stock):
At any time we are engaged in an offering of Class P shares, the Redemption Amount for Class P shares purchased under the share redemption program will always be equal to or lower than the applicable per share offering price for such Class P shares. As long as we are engaged in an offering of Class P shares, the Redemption Amount shall be the lesser of the amount such stockholders paid for their Shares or the price per share in the offering. If we are no longer engaged in an offering of Class P shares, the per Share Redemption Amount will be determined by our board of directors.
Our board of directors may amend, suspend or terminate the share redemption program with 30 days’ notice to our stockholders. We may provide this notice by including such information in a Current Report on Form 8-K or in our annual or quarterly reports, all publicly filed with the SEC, or by a separate mailing to our stockholders.
There are several limitations on our ability to redeem shares under the share redemption program, including, but not limited to:
• Unless the shares are being redeemed in connection with a stockholder’s death, “qualifying disability” (as defined under the share redemption program) or bankruptcy, we may not redeem shares until the stockholder has held his or her shares for one year.
• During any calendar year, we will not redeem in excess of 5% of the weighted-average number of shares outstanding during the prior calendar year.
• The cash available for redemption is limited to the proceeds from the sale of shares pursuant to our distribution reinvestment plan.
F-23
• We have no obligation to redeem shares if the redemption would violate the restrictions on distributions under Maryland law, which prohibits distributions that would cause a corporation to fail to meet statutory tests of solvency.
Operating Partnership Redemption Rights
The limited partners of our Operating Partnership have the right to cause our Operating Partnership to redeem their limited partnership units for cash equal to the value of an equivalent number of our shares, or, at our option, we may purchase their limited partnership units by issuing one share of our common stock for each limited partnership unit redeemed. These rights may not be exercised under certain circumstances that could cause us to lose our REIT election. Furthermore, limited partners may exercise their redemption rights only after their limited partnership units have been outstanding for one year. SSA and SmartStop OP are prohibited from exchanging or otherwise transferring units representing $202,000 of the initial investments in our Operating Partnership so long as our Advisor is acting as our Advisor pursuant to our Advisory Agreement.
Other Contingencies
From time to time, we are party to legal proceedings that arise in the ordinary course of our business. We are not aware of any legal proceedings of which the outcome is reasonably likely to have a material adverse effect on our results of operations or financial condition, nor are we aware of any such legal proceedings contemplated by governmental authorities.
Note 8. Declaration of Distributions
Cash Distribution Declaration
On March 25, 2022, our board of directors declared a daily distribution rate of approximately $0.001644 per day per share on the outstanding shares of common stock payable to Class A, Class T, Class W and Class P stockholders of record of such shares as shown on our books at the close of business on each day of the period commencing on April 1, 2022 and ending June 30, 2022. In connection with this distribution, for the stockholders of Class T shares, after the stockholder servicing fee is paid, approximately $0.001370 per day will be paid per Class T share and for the stockholders of Class W shares, after the dealer manager servicing fee is paid, approximately $0.001515 per day will be paid per Class W share. Such distributions payable to each stockholder of record during a month will be paid the following month.
Note 9. Potential Acquisitions
Potential Acquisition of Etobicoke Property
On May 19, 2021, an affiliate of our Sponsor assigned its interest in a purchase and sale agreement (the “Etobicoke Purchase Agreement”) with an unaffiliated third party for the acquisition of a parcel of land to be developed into a self storage facility located in Etobicoke, in the city of Toronto, Ontario (the “Etobicoke Property”) to a wholly-owned subsidiary of our Operating Partnership. The purchase price of the Etobicoke Property is approximately CAD $2.2 million. The Etobicoke Property will be developed into a self storage facility. We expect the acquisition of the Etobicoke Property to close in the second half of 2022. Construction is expected to commence following the closing of the acquisition. We expect to fund the acquisition of the Etobicoke Property with a combination of net proceeds from our offerings and/or potential future debt financing. If we fail to complete the acquisition, we may forfeit CAD $250,000 in earnest money deposits.
Potential Acquisition of Scarborough Property
On July 15, 2021, an affiliate of our Sponsor assigned its interest in a purchase and sale agreement (the “Scarborough Purchase Agreement”) with an unaffiliated third party for the acquisition of a parcel of land to be developed into a self storage facility located in Scarborough, in the city of Toronto, Ontario (the “Scarborough Property”) to a wholly-owned subsidiary of our Operating Partnership. The purchase price of the Scarborough Property is approximately CAD $2.2 million. We expect the acquisition of the Scarborough Property to close in the first half of 2023. Construction is expected to commence following the closing of the acquisition. We expect
F-24
to fund the acquisition of the Scarborough Property with a combination of net proceeds from our offerings and/or potential future debt financing. If we fail to complete the acquisition, we may forfeit CAD $250,000 in earnest money deposits.
Potential Acquisition of Hamilton Property
On August 31, 2021, one of our subsidiaries entered into a contribution agreement with a subsidiary of SmartCentres, to acquire a tract of land owned by SmartCentres and located in Hamilton, Ontario (the “Hamilton Land”) in the Greater Toronto Area of Canada.
Upon closing, the Hamilton Land will be owned by a limited partnership (the “Hamilton Limited Partnership”), in which we (through our subsidiaries) and SmartCentres (through its subsidiaries) will each be a 50% limited partner and each have an equal ranking general partner in the Hamilton Limited Partnership. It is intended that the Hamilton Limited Partnership develops a self storage facility on the land. At closing, we (through our subsidiaries) will subscribe for 50% of the units in the Hamilton Limited Partnerships at an agreed upon subscription price of approximately CAD $750,000, representing contributions equivalent to 50% of the agreed upon fair market value of the land. We expect the acquisition of the Hamilton Land to close in the second half of 2022. Construction is expected to commence following the closing of the acquisition. We expect to fund the acquisition of the Hamilton Land with a combination of net proceeds from our offerings and/or potential future debt financing. If we fail to complete the acquisition, we may forfeit CAD $75,000 in earnest money deposits.
Note 10. Subsequent Events
Acquisition of Newark Property
On April 26, 2022, we, through an indirect, wholly-owned subsidiary of our Operating Partnership, acquired a self storage facility located in Newark, Delaware (the “Newark Property”) from an unaffiliated third party. The purchase price for the Newark Property was approximately $19.7 million, plus closing costs and acquisition fees, which was funded by proceeds from our offerings and a draw on the Huntington Credit Facility and Huntington Bridge Loan, as defined below.
Acquisition of Levittown Property
On April 26, 2022, we, through an indirect, wholly-owned subsidiary of our Operating Partnership, acquired a self storage facility located in Levittown, Pennsylvania (the “Levittown Property”) from an unaffiliated third party. The purchase price for the Levittown Property was approximately $21.0 million, plus closing costs and acquisition fees, which was funded by proceeds from our offerings and a draw on the Huntington Credit Facility and Huntington Bridge Loan.
Huntington Credit Facility
On April 26, 2022, we borrowed approximately $12.9 million on the Huntington Credit Facility, secured by a first mortgage deed of trust on the Vancouver Property.
Huntington Bridge Loan
On April 26, 2022, we, through three wholly-owned special purposes entities, entered into an approximately $30.6 million financing with Huntington as lender pursuant to a mortgage loan (the “Huntington Bridge Loan”). The Huntington Bridge Loan is secured by a first mortgage deed of trust on the Portland, Newark and Levittown Properties. The loan has a maturity date of July 25, 2022. Monthly payments due under the loan agreement (the “Huntington Bridge Loan Agreement”) are interest-only until the maturity date.
F-25
The amounts outstanding under the Huntington Bridge Loan bear interest at a variable rate equal to Secured Overnight Financing Rate (“SOFR”) plus 2.61%, adjusted monthly, with a floor of 3.25%. We serve as a limited recourse guarantor with respect to the Huntington Bridge Loan. The loan may be prepaid either in whole or in part, at any time, subject to certain conditions as set forth in the Huntington Bridge Loan Agreement.
Potential Acquisition of Chandler Property
On April 28, 2022, an affiliate of our Sponsor assigned its interest in a purchase and sale agreement (the “Chandler Purchase Agreement”) with an unaffiliated third party for the acquisition of a self storage facility located in Chandler, AZ (the “Chandler Property”) to a wholly-owned subsidiary of our Operating Partnership. The Chandler Property is an existing self storage facility and has a purchase price of approximately $25.5 million, plus closing costs and acquisition fees. We expect the acquisition of the Chandler Property to close in the second quarter of 2022 and to fund such acquisition with a combination of net proceeds from our offerings and potential future debt financing. If we fail to complete the acquisition, we may forfeit $510,000 in earnest money deposits.
Offering Status
As of May 6, 2022, in connection with our offerings we have issued approximately 10.6 million Class P shares for gross offering proceeds of approximately $100.6 million, approximately 0.1 million Class A shares for gross offering proceeds of approximately $1.3 million, approximately 0.1 million Class T shares for gross offering proceeds of approximately $0.1 million and no Class W shares have been issued.
F-26
APPENDIX C
PRIOR PERFORMANCE TABLES
The following Prior Performance Tables provide historical unaudited financial information relating to three public and one private real estate investment programs (“Prior Real Estate Programs”), which we deem to have similar investment objectives to us, sponsored by our sponsor or its affiliates. As described elsewhere in this prospectus, on June 28, 2019, SmartStop and its operating partnership entered into the Self Administration Transaction with SAM and its affiliates, pursuant to which, effective as of June 28, 2019, SmartStop acquired the self storage advisory, asset management, property management, investment management, and certain joint venture interests of SAM, along with certain other assets. As a result of the Self Administration Transaction, SmartStop REIT Advisors, our sponsor and an indirect wholly owned subsidiary of SmartStop, is deemed to be an affiliate of SAM for prior performance purposes relating to prior self storage programs. This information should be read together with the summary information included in the “Prior Performance Summary” section of this prospectus.
The Prior Real Estate Programs presented provide an indication of prior real estate programs sponsored by our sponsor or its affiliates and the performance of these programs. However, the general condition of the economy, as well as other factors, can affect the real estate market and operations and impact the financial performance significantly.
Investors should not construe inclusion of the following tables as implying, in any manner, that we will have results comparable to those reflected in such tables. Distributable cash flow, federal income tax deductions, or other factors could be substantially different. Investors should note that by acquiring our shares of common stock, they will not be acquiring any interest in any prior program.
The following tables are included herein:
Table I – Experience in Raising and Investing Funds — Table I summarizes information of the prior performance of our sponsor and its affiliates in raising funds for the Prior Real Estate Programs, the offerings of which closed in the most recent three years ended December 31, 2021. The information in Table I is unaudited.
Table II – Compensation to Sponsor — Table II summarizes the compensation paid to our sponsor and its affiliates for the Prior Real Estate Programs, the offerings of which closed in the most recent three years ended December 31, 2021. The information in Table II is unaudited.
Table III – Annual Operating Results of Prior Real Estate Programs — Table III summarizes the operating results for the Prior Real Estate Programs, the offerings of which closed in the most recent five years ended December 31, 2021. The information in Table III is unaudited.
Table IV – Results of Completed Prior Real Estate Programs — Table IV summarizes the results for the Prior Real Estate Programs that have completed operations during the previous five years ended December 31, 2021. The information in Table IV is unaudited.
Table V – Sales or Disposals of Properties for Prior Real Estate Programs — Table V includes all sales or disposals of properties by Prior Real Estate Programs within the most recent three years ended December 31, 2021. The information in Table V is unaudited.
The Prior Real Estate Programs presented in the Prior Performance Tables are considered to have similar investment objectives as ours. We intend to invest in income and growth self storage properties (such as development, re-development, lease-up, and expansion opportunities) and related self storage investments. Our stockholders will not own any interest in any Prior Real Estate Program and should not assume that they will experience returns, if any, comparable to those experienced by investors in the Prior Real Estate Programs. Please see “Risk Factors — Risks Related to Investments in Real Estate” in the prospectus. Due to the risks involved in
C-1
the ownership of and investment in real estate, there is no guarantee of any level of return on your investment and you may lose some or all of your investment.
C-2
TABLE I
EXPERIENCE IN RAISING AND INVESTING FUNDS (UNAUDITED)
This table provides a summary of the experience of our sponsor or its affiliates in investing and raising funds in Prior Real Estate Programs for which the offerings have closed in the most recent three years ended December 31, 2021. Information is provided pertaining to the timing and length of this offering and the time period over which the proceeds have been invested in the properties.
|
|
Strategic Storage |
|
|
Strategic Storage Growth Trust II, Inc. (Private Offering)(2) |
|
||
Dollar amount offered |
|
$ 1,095,000,000 |
|
|
$ 270,000,000 |
|
||
Dollar amount raised |
|
$ |
247,201,659 |
|
|
$ |
116,644,777 |
|
Length of offering (in months) |
|
41 |
|
|
17 |
|
||
Months to invest 90% of amount available for investment |
|
35 |
|
|
21 |
|
||
C-3
NOTES TO TABLE I
(1) Amounts included herein relate to proceeds raised and invested pursuant to SST IV’s public offering, which terminated on September 11, 2020. Additionally, amounts included herein relate to amounts reinvested pursuant to the related distribution reinvestment plan, but do not include any amounts related to SST IV’s Registration Statement on Form S-3 for its distribution reinvestment plan offering filed with the SEC on July 30, 2020 (the “SST IV Form S-3”).
(2) Amounts included herein relate to proceeds raised and invested pursuant to SSGT II’s private offering, which closed on September 30, 2020. Additionally, amounts included herein relate to amounts reinvested pursuant to the related distribution reinvestment plan.
C-4
TABLE II
COMPENSATION TO SPONSOR (UNAUDITED)
This table sets forth the compensation paid to our sponsor or its affiliates for Prior Real Estate Programs for which the offerings have closed in the most recent three years ended December 31, 2021. The table includes compensation paid out of the offering proceeds and compensation paid in connection with the ongoing operations of Prior Real Estate Programs. The Prior Real Estate Programs for which information is presented below have a similar investment objective to this program.
|
Strategic Storage
|
Strategic Storage Growth Trust II, Inc.(18)
|
Date offering commenced |
Multiple(2) |
January 9, 2019 |
Dollar amount raised |
$ 254,702,659 |
$ 116,644,777 |
Amount paid or payable to sponsor from proceeds of offering: |
|
|
Selling commissions(3) |
$ 12,030,853 |
$ 8,286,252 |
Stockholder servicing fees(4) |
$ 2,755,807 |
$ — |
Dealer manager fees(5) |
$ 4,356,531 |
$ 2,365,792 |
Dealer manager servicing fees(6) |
$ 567,340 |
$ — |
Offering expenses(7) |
$ 2,301,707 |
$ 990,775 |
Acquisition costs |
|
|
Acquisition fees(8) |
$ — |
$ — |
Acquisition expenses(9) |
$ 2,159,550 |
$ 984,662 |
Other(10) |
$ 90,000 |
$ 37,500 |
Dollar amount of cash generated from operations before deducting payments to sponsor |
$ 14,622,685 |
$ 5,373,326 |
Amounts paid or payable to sponsor from operations: |
|
|
Property management fees(11) |
$ 3,130,417 |
$ 1,064,124 |
Asset management fees(12) |
$ 6,613,728 |
$ 3,431,976 |
Construction fees(13) |
$ 154,806 |
$ — |
Transfer agent fees(14) |
$ 929,628 |
$ 378,650 |
Tenant protection plan revenues(15) |
$ 5,331 |
$ 15 |
Reimbursements(16) |
$ 4,545,701 |
$ 3,378,875 |
Debt issuance costs |
$ — |
$ — |
Dollar amount of property sales and refinancing before deducting payments to sponsor(17) |
|
|
Cash |
— |
— |
Notes |
— |
— |
Amount paid to sponsor from property sales and refinancing |
|
|
Incentive fees |
— |
— |
Real estate commissions |
— |
— |
Other |
— |
— |
C-5
NOTES TO TABLE II
(1) The offering related amounts included herein are presented for the entire SST IV program (private offering transaction and public offering), and do not include any amounts offered or raised pursuant to the SST IV Form S-3. The operating related amounts included herein are presented through March 17, 2021, the date SmartStop acquired SST IV by way of merger.
(2) With respect to SST IV the offering related amounts herein relate to both SST IV’s private offering transaction and public offering. SST IV’s private offering transaction and public offering commenced on January 25, 2017 and March 17, 2017, respectively.
(3) Represents selling commissions paid to the dealer manager, an affiliate of our sponsor, all of which was reallowed to participating broker-dealers.
(4) Represents stockholder servicing fees, which were paid on an ongoing basis, payable monthly and accrued to the broker-dealers daily in an amount equal to 1/365th of 1% of the purchase price per share of the Class T shares sold in the primary public offering for SST IV. Such stockholder servicing fees ceased to be paid on behalf of SST IV shortly after the SST IV Merger on March 17, 2021.
(5) Represents amounts paid to the dealer manager, a portion of which was reallowed to participating broker-dealers.
(6) Represents dealer manager servicing fees, which were paid to the dealer manager on an ongoing basis, payable monthly and accrued to the dealer manager daily in an amount equal to 1/365th of 0.5% of the purchase price per share of the Class W shares sold in the primary public offering for SST IV. Such dealer manager servicing fees ceased to be paid on the behalf of SST IV at the closing of the SST IV Merger on March 17, 2021.
(7) Represents direct costs of the offering, paid to the sponsor or an affiliate. Such costs include reimbursable costs of the program’s advisor and third party costs originally paid by the program’s advisor. In addition to such costs, direct costs of the offering paid by SST IV and SSGT II directly to third parties for offering costs totaled approximately $4.6 million and $0.8 million, respectively.
(8) Represents acquisition fees incurred by the program and paid to its advisor.
(9) Represents acquisition related reimbursable costs paid to the program’s advisor. In addition to such costs, acquisition related costs paid directly by SST IV and SSGT II to third parties totaled approximately $1.4 million and $0.6 million, respectively.
(10) Represents set-up fees paid to an affiliated property manager of $3,750 per property, as applicable.
(11) Represents property management fees paid by SST IV and SSGT II to an affiliated property manager.
(12) Represents asset management fees paid to the program’s advisor.
(13) Represents construction fees paid to the program’s property manager.
(14) Represents fees paid to an affiliate of the program’s sponsor for transfer agent and registrar services provided.
(15) Amounts represent net tenant protection plan revenues paid to an affiliate of the property manager pursuant to joint venture arrangements.
(16) Represents general and administrative costs, paid to the program’s advisor and its affiliates. Such costs include reimbursable costs of the program’s advisor (and its affiliates) and third party costs originally paid by the program’s advisor and its affiliates.
(17) Certain programs have had activity relating to these line items. However, no fees were paid to affiliates of the sponsor in connection therewith. As such, including any related data is not meaningful and has therefore been omitted.
(18) Amounts relate to proceeds raised and invested pursuant to SSGT II’s private offering, which closed on September 30, 2020. Additionally, amounts included herein relate to amounts reinvested pursuant to the related distribution reinvestment plan.
C-6
TABLE III
OPERATING RESULTS OF PRIOR REAL ESTATE PROGRAMS (UNAUDITED)
The following sets forth the unaudited operating results of Prior Real Estate Programs sponsored by our sponsor or its affiliates, the offerings of which have closed in the most recent five years ended December 31, 2021. The information relates only to programs with investment objectives similar to this program. Unless otherwise indicated, all amounts are as of and for the year ended December 31 for the year indicated.
|
|
SmartStop Self Storage REIT, Inc. |
|
|||||||||||||||||
|
|
2017 |
|
|
2018 |
|
|
2019 |
|
|
2020 |
|
|
2021 |
|
|||||
Summary Operating Results |
|
|
|
|
|
|
|
|
|
|
|
|
|
|
|
|||||
Total revenue |
|
$ |
76,108,906 |
|
|
$ |
80,412,257 |
|
|
$ |
109,528,549 |
|
|
$ |
124,024,363 |
|
|
$ |
168,764,571 |
|
Operating expenses(1) |
|
$ |
35,119,216 |
|
|
$ |
35,483,338 |
|
|
$ |
48,327,320 |
|
|
$ |
46,912,928 |
|
|
$ |
53,857,490 |
|
Depreciation and amortization(2) |
|
$ |
33,452,073 |
|
|
$ |
22,802,691 |
|
|
$ |
41,098,672 |
|
|
$ |
42,071,743 |
|
|
$ |
53,368,611 |
|
Other operating expenses |
|
$ |
3,962,506 |
|
|
$ |
5,974,785 |
|
|
$ |
4,569,849 |
|
|
$ |
56,179,902 |
|
|
$ |
45,030,720 |
|
Gain on sale of real estate |
|
$ — |
|
|
$ — |
|
|
$ |
3,944,696 |
|
|
$ — |
|
|
$ |
178,631 |
|
|||
Operating income (loss) |
|
$ |
3,575,111 |
|
|
$ |
16,151,443 |
|
|
$ |
11,588,012 |
|
|
$ |
(21,140,210 |
) |
|
$ |
16,507,750 |
|
Interest expense |
|
$ |
18,194,016 |
|
|
$ |
19,170,970 |
|
|
$ |
41,428,312 |
|
|
$ |
36,053,312 |
|
|
$ |
33,383,604 |
|
Net loss — GAAP basis |
|
$ |
(14,986,290 |
) |
|
$ |
(3,720,730 |
) |
|
$ |
(25,095,538 |
) |
|
$ |
(51,206,803 |
) |
|
$ |
(19,564,718 |
) |
Summary of Statement of Cash Flows |
|
|
|
|
|
|
|
|
|
|
|
|
|
|
|
|||||
Net cash flows provided by operating activities |
|
$ |
19,935,013 |
|
|
$ |
18,359,125 |
|
|
$ |
9,767,022 |
|
|
$ |
26,769,871 |
|
|
$ |
58,764,984 |
|
Net cash flows used in investing activities |
|
$ |
(57,546,328 |
) |
|
$ |
(3,179,291 |
) |
|
$ |
(347,783,873 |
) |
|
$ |
(28,958,838 |
) |
|
$ |
(120,214,731 |
) |
Net cash flows provided by (used in) financing activities |
|
$ |
31,278,664 |
|
|
$ |
(12,541,473 |
) |
|
$ |
392,223,412 |
|
|
$ |
13,739,338 |
|
|
$ |
25,674,567 |
|
Amount and Source of Distributions |
|
|
|
|
|
|
|
|
|
|
|
|
|
|
|
|||||
Total distributions paid in cash to common stockholders |
|
$ |
16,671,024 |
|
|
$ |
17,566,799 |
|
|
$ |
18,207,418 |
|
|
$ |
19,160,171 |
|
|
$ |
26,157,045 |
|
Distribution Data Per $1,000 invested(3) |
|
|
|
|
|
|
|
|
|
|
|
|
|
|
|
|||||
Total distributions paid in cash to common stockholders |
|
$ |
30.09 |
|
|
$ |
31.71 |
|
|
$ |
32.17 |
|
|
$ |
33.85 |
|
|
$ |
46.21 |
|
From operations |
|
$ |
30.09 |
|
|
$ |
31.71 |
|
|
$ |
17.26 |
|
|
$ |
33.85 |
|
|
$ |
46.21 |
|
From offering proceeds |
|
$ — |
|
|
$ — |
|
|
$ — |
|
|
$ — |
|
|
$ — |
|
|||||
From financing activities |
|
$ — |
|
|
$ — |
|
|
$ |
14.91 |
|
|
$ — |
|
|
$ — |
|
||||
Summary Balance Sheet |
|
|
|
|
|
|
|
|
|
|
|
|
|
|
|
|||||
Total assets |
|
$ |
817,497,838 |
|
|
$ |
796,354,037 |
|
|
$ |
1,311,433,731 |
|
|
$ |
1,282,221,057 |
|
|
$ |
1,618,292,776 |
|
Total liabilities |
|
$ |
410,062,755 |
|
|
$ |
418,870,325 |
|
|
$ |
775,802,382 |
|
|
$ |
785,289,170 |
|
|
$ |
943,224,605 |
|
Redeemable equity |
|
$ |
24,497,059 |
|
|
$ |
32,226,815 |
|
|
$ |
43,391,362 |
|
|
$ |
57,335,575 |
|
|
$ |
71,334,675 |
|
Preferred equity |
|
$ — |
|
|
$ — |
|
|
$ |
146,426,164 |
|
|
$ |
196,356,107 |
|
|
$ |
196,356,107 |
|
||
Common equity |
|
$ |
382,938,024 |
|
|
$ |
345,256,897 |
|
|
$ |
345,813,823 |
|
|
$ |
243,240,205 |
|
|
$ |
407,377,389 |
|
Estimated per share value(4) |
|
$ |
10.22 |
|
|
$ |
10.65 |
|
|
$ |
10.66 |
|
|
$ |
10.40 |
|
|
$ |
15.08 |
|
C-7
TABLE III
OPERATING RESULTS OF PRIOR REAL ESTATE PROGRAMS (UNAUDITED)—CONTINUED
|
|
Strategic Storage Growth Trust, Inc. |
|
|||||||||||||
|
|
2015 |
|
|
2016 |
|
|
2017 |
|
|
2018(8) |
|
||||
Summary Operating Results |
|
|
|
|
|
|
|
|
|
|
|
|
||||
Total revenue |
|
$ |
4,857,407 |
|
|
$ |
9,313,759 |
|
|
$ |
13,786,361 |
|
|
$ |
14,369,493 |
|
Operating expenses(1) |
|
$ |
2,205,173 |
|
|
$ |
4,016,072 |
|
|
$ |
5,945,010 |
|
|
$ |
6,277,406 |
|
Depreciation and amortization(2) |
|
$ |
2,107,159 |
|
|
$ |
3,298,559 |
|
|
$ |
4,803,665 |
|
|
$ |
5,401,800 |
|
Other operating expenses |
|
$ |
2,895,764 |
|
|
$ |
3,857,079 |
|
|
$ |
6,853,793 |
|
|
$ |
4,739,171 |
|
Operating loss |
|
$ |
(2,350,689 |
) |
|
$ |
(1,857,951 |
) |
|
$ |
(3,816,107 |
) |
|
$ |
(2,048,884 |
) |
Interest expense |
|
$ |
1,026,798 |
|
|
$ |
2,057,428 |
|
|
$ |
518,390 |
|
|
$ |
664,431 |
|
Net loss — GAAP basis |
|
$ |
(3,375,721 |
) |
|
$ |
(3,955,374 |
) |
|
$ |
(3,955,942 |
) |
|
$ |
(2,727,009 |
) |
Summary of Statement of Cash Flows |
|
|
|
|
|
|
|
|
|
|
|
|
||||
Net cash flows (used in) provided by operating activities |
|
$ |
(672,711 |
) |
|
$ |
167,590 |
|
|
$ |
2,041,912 |
|
|
$ |
2,988,004 |
|
Net cash flows used in investing activities |
|
$ |
(44,311,649 |
) |
|
$ |
(29,988,936 |
) |
|
$ |
(100,107,167 |
) |
|
$ |
(54,311,670 |
) |
Net cash flows provided by financing activities |
|
$ |
47,084,108 |
|
|
$ |
26,923,887 |
|
|
$ |
147,193,760 |
|
|
$ |
1,200,444 |
|
Amount and Source of Distributions |
|
|
|
|
|
|
|
|
|
|
|
|
||||
Total distributions paid in cash to common stockholders |
|
$ |
5,983 |
|
|
$ |
576,046 |
|
|
$ |
3,313,927 |
|
|
$ |
3,948,280 |
|
Distribution Data Per $1,000 invested(3) |
|
|
|
|
|
|
|
|
|
|
|
|
||||
Total distributions paid in cash to common stockholders |
|
$ |
0.23 |
|
|
$ |
5.42 |
|
|
$ |
11.94 |
|
|
$ |
14.23 |
|
From operations |
|
$ — |
|
|
$ |
1.58 |
|
|
$ |
7.36 |
|
|
$ |
10.77 |
|
|
From offering proceeds |
|
$ |
0.23 |
|
|
$ |
3.84 |
|
|
$ |
4.58 |
|
|
$ |
3.46 |
|
Summary Balance Sheet |
|
|
|
|
|
|
|
|
|
|
|
|
||||
Total assets |
|
$ |
69,929,708 |
|
|
$ |
93,937,975 |
|
|
$ |
239,929,758 |
|
|
$ |
238,744,685 |
|
Total liabilities |
|
$ |
40,644,751 |
|
|
$ |
15,278,591 |
|
|
$ |
13,635,347 |
|
|
$ |
21,015,247 |
|
Redeemable equity |
|
$ |
10,706 |
|
|
$ |
1,086,603 |
|
|
$ |
5,679,485 |
|
|
$ |
8,208,920 |
|
Preferred equity |
|
$ |
15,884,852 |
|
|
$ — |
|
|
$ — |
|
|
$ — |
|
|||
Common equity |
|
$ |
13,389,399 |
|
|
$ |
77,572,781 |
|
|
$ |
220,614,926 |
|
|
$ |
209,520,518 |
|
Estimated per share value(6) |
|
N/A |
|
|
$ |
10.05 |
|
|
$ |
11.56 |
|
|
$ |
11.58 |
|
|
C-8
TABLE III
OPERATING RESULTS OF PRIOR REAL ESTATE PROGRAMS (UNAUDITED)—CONTINUED
|
|
Strategic Storage Trust IV, Inc. |
|
|||||||||||||
|
|
2017 |
|
|
2018 |
|
|
2019 |
|
|
2020 |
|
||||
Summary Operating Results |
|
|
|
|
|
|
|
|
|
|
|
|
||||
Total revenue |
|
$ |
475,404 |
|
|
$ |
5,764,028 |
|
|
$ |
17,248,341 |
|
|
$ |
23,107,964 |
|
Operating expenses(1) |
|
$ |
286,373 |
|
|
$ |
2,814,717 |
|
|
$ |
8,929,428 |
|
|
$ |
13,808,546 |
|
Depreciation and amortization(2) |
|
$ |
284,869 |
|
|
$ |
3,416,033 |
|
|
$ |
10,264,931 |
|
|
$ |
11,172,898 |
|
Other operating expenses |
|
$ |
1,150,842 |
|
|
$ |
3,050,772 |
|
|
$ |
3,465,539 |
|
|
$ |
4,513,273 |
|
Operating loss |
|
$ |
(1,246,680 |
) |
|
$ |
(3,517,494 |
) |
|
$ |
(5,411,557 |
) |
|
$ |
(6,386,753 |
) |
Interest expense |
|
$ — |
|
|
$ |
(1,341,631 |
) |
|
$ |
(4,131,356 |
) |
|
$ |
(5,454,781 |
) |
|
Net loss — GAAP basis |
|
$ |
(1,246,680 |
) |
|
$ |
(4,719,953 |
) |
|
$ |
(9,568,728 |
) |
|
$ |
(12,088,304 |
) |
Summary of Statement of Cash Flows |
|
|
|
|
|
|
|
|
|
|
|
|
||||
Net cash flows (used in) provided by operating activities |
|
$ |
(1,289,006 |
) |
|
$ |
(97,732 |
) |
|
$ |
927,028 |
|
|
$ |
122,945 |
|
Net cash flows used in investing activities |
|
$ |
(13,337,799 |
) |
|
$ |
(132,453,332 |
) |
|
$ |
(142,287,477 |
) |
|
$ |
(28,504,107 |
) |
Net cash flows provided by financing activities |
|
$ |
36,354,930 |
|
|
$ |
126,417,379 |
|
|
$ |
131,330,362 |
|
|
$ |
32,167,260 |
|
Amount and Source of Distributions |
|
|
|
|
|
|
|
|
|
|
|
|
||||
Total distributions paid in cash to common stockholders |
|
$ |
(681,700 |
) |
|
$ |
(2,620,607 |
) |
|
$ |
(5,401,316 |
) |
|
$ |
(9,076,138 |
) |
Distribution Data Per $1,000 invested(3) |
|
|
|
|
|
|
|
|
|
|
|
|
||||
Total distributions paid in cash to common stockholders |
|
$ |
16.07 |
|
|
$ |
22.58 |
|
|
$ |
24.58 |
|
|
$ |
37.21 |
|
From operations |
|
$ — |
|
|
$ — |
|
|
$ — |
|
|
$ — |
|
||||
From offering proceeds |
|
$ |
16.07 |
|
|
$ |
22.58 |
|
|
$ |
24.58 |
|
|
$ |
37.21 |
|
Summary Balance Sheet |
|
|
|
|
|
|
|
|
|
|
|
|
||||
Total assets |
|
$ |
35,804,087 |
|
|
$ |
161,942,760 |
|
|
$ |
288,469,695 |
|
|
$ |
309,327,297 |
|
Total liabilities |
|
$ |
1,105,316 |
|
|
$ |
69,129,692 |
|
|
$ |
118,657,170 |
|
|
$ |
137,836,052 |
|
Redeemable equity |
|
$ |
183,420 |
|
|
$ |
2,093,989 |
|
|
$ |
5,793,896 |
|
|
$ |
11,649,486 |
|
Preferred equity |
|
$ — |
|
|
$ — |
|
|
$ — |
|
|
$ — |
|
||||
Common equity |
|
$ |
34,515,351 |
|
|
$ |
90,719,079 |
|
|
$ |
164,018,629 |
|
|
$ |
159,841,759 |
|
Estimated per share value(10) |
|
N/A |
|
|
N/A |
|
|
$ |
22.65 |
|
|
$ |
22.65 |
|
||
C-9
TABLE III
OPERATING RESULTS OF PRIOR REAL ESTATE PROGRAMS (UNAUDITED)—CONTINUED
|
|
Strategic Storage Growth Trust II, Inc. |
|
|||||||||
|
|
2019 |
|
|
2020 |
|
|
2021 |
|
|||
Summary Operating Results |
|
|
|
|
|
|
|
|
|
|||
Total revenue |
|
$ |
1,327,822 |
|
|
$ |
4,747,638 |
|
|
$ |
10,363,639 |
|
Operating expenses(1) |
|
$ |
1,455,803 |
|
|
$ |
3,918,136 |
|
|
$ |
6,506,143 |
|
Depreciation and amortization(2) |
|
$ |
1,256,280 |
|
|
$ |
3,744,411 |
|
|
$ |
4,982,252 |
|
Other operating expenses |
|
$ |
1,830,077 |
|
|
$ |
1,892,033 |
|
|
$ |
1,427,661 |
|
Operating loss |
|
$ |
(3,214,338 |
) |
|
$ |
(4,807,212 |
) |
|
$ |
(2,552,417 |
) |
Interest expense |
|
$ |
(232,197 |
) |
|
$ |
(1,798,204 |
) |
|
$ |
(3,432,157 |
) |
Net loss — GAAP basis |
|
$ |
(3,287,666 |
) |
|
$ |
(7,244,603 |
) |
|
$ |
(6,280,673 |
) |
Summary of Statement of Cash Flows |
|
|
|
|
|
|
|
|
|
|||
Net cash flows used in operating activities |
|
$ |
(1,953,617 |
) |
|
$ |
(1,387,280 |
) |
|
$ |
(204,766 |
) |
Net cash flows used in investing activities |
|
$ |
(83,014,514 |
) |
|
$ |
(59,710,023 |
) |
|
$ |
(4,310,411 |
) |
Net cash flows provided by financing activities |
|
$ |
118,245,379 |
|
|
$ |
31,527,581 |
|
|
$ |
16,322,667 |
|
Amount and Source of Distributions |
|
|
|
|
|
|
|
|
|
|||
Total distributions paid in cash to common stockholders |
|
$ |
(1,132,896 |
) |
|
$ |
(1,937,026 |
) |
|
$ |
(2,093,434 |
) |
Distribution Data Per $1,000 invested(3) |
|
|
|
|
|
|
|
|
|
|||
Total distributions paid in cash to common stockholders |
|
$ |
(11.68 |
) |
|
$ |
(17.48 |
) |
|
$ |
(18.90 |
) |
From operations |
|
$ — |
|
|
$ — |
|
|
$ — |
|
|||
From offering proceeds |
|
$ |
(11.68 |
) |
|
$ |
(17.48 |
) |
|
$ |
(18.90 |
) |
Summary Balance Sheet |
|
|
|
|
|
|
|
|
|
|||
Total assets |
|
$ |
116,006,945 |
|
|
$ |
141,387,652 |
|
|
$ |
152,811,610 |
|
Total liabilities |
|
$ |
33,863,803 |
|
|
$ |
43,153,497 |
|
|
$ |
76,497,661 |
|
Redeemable equity |
|
$ |
1,364,275 |
|
|
$ |
3,588,637 |
|
|
$ |
5,862,077 |
|
Preferred equity |
|
$ — |
|
|
$ |
13,449,229 |
|
|
$ — |
|
||
Common equity |
|
$ |
80,778,867 |
|
|
$ |
81,196,289 |
|
|
$ |
70,451,872 |
|
Estimated per share value |
|
N/A |
|
|
N/A |
|
|
N/A |
|
|||
C-10
NOTES TO TABLE III
(1) Operating expenses include the ongoing operating costs, excluding the costs separately detailed in the tables.
(2) Depreciation of real property is calculated on the straight-line method over estimated useful lives ranging primarily from 5 to 35 years. The fair value of in-place leases upon the acquisition of a property is amortized over the estimated future benefit period.
(3) Distribution data was calculated based on the gross proceeds invested as of the end of each respective period shown. Distributions in excess of cash flow from operations were funded from offering proceeds.
(4) On April 8, 2016, SmartStop’s board of directors approved a net asset valuation of $10.09 per share as of December 31, 2015. On April 13, 2017, SmartStop’s board of directors approved a net asset valuation of $10.22 per share as of December 31, 2016. On April 19, 2018, SmartStop’s board of directors approved a net asset valuation of $10.65 per share as of December 31, 2017. On June 26, 2019, SmartStop’s board of directors approved a net asset valuation of $10.66 per share as of March 31, 2019. On April 20, 2020, SmartStop’s board of directors approved a net asset valuation of $10.40 per share as of December 31, 2019. On October 19, 2021, SmartStop’s board of directors approved a net asset valuation of $15.08 per share as of June 30, 2021. For the purposes of calculating these estimated net asset values per share, independent third party appraisers valued SmartStop’s properties.
(5) SmartStop terminated its initial public offering on January 9, 2017.
(6) On April 8, 2016, SSGT’s board of directors approved a net asset valuation of $10.05 per share as of December 31, 2015. On April 13, 2017, SSGT’s board of directors approved a net asset valuation of $11.56 per share as of December 31, 2016. On April 19, 2018, SSGT’s board of directors approved a net asset valuation of $11.58 per share as of December 31, 2017. For the purposes of calculating these estimated net asset values per share, an independent third party appraiser valued SSGT’s properties. On January 24, 2019, SmartStop acquired SSGT by way of merger.
(7) SSGT terminated its private offering on January 16, 2015 and terminated its public offering on March 31, 2017.
(8) The 2018 results are presented as of and for the nine months ended September 30, 2018. On January 24, 2019, SmartStop acquired SSGT by way of merger. As such, the financial information contained in Table III is provided through September 30, 2018. For financial information following September 30, 2018, refer to the financials include in Table III for SmartStop.
(9) SST IV terminated its initial public offering on September 11, 2020.
(10) On June 20, 2019, SST IV’s board of directors approved an estimated value per share of SST IV’s common stock of $22.65 for each of its Class A, Class T, and Class W shares based on the estimated value of SST IV’s assets less the estimated value of SST IV’s liabilities, or net asset value, divided by the number of shares outstanding on an adjusted fully diluted basis, calculated as of March 31, 2019. On June 29, 2020, SST IV’s board of directors approved an estimated value per share of SST IV’s common stock of $22.65 for each of its Class A, Class T, and Class W shares based on the estimated value of SST IV’s assets less the estimated value of SST IV’s liabilities, or net asset value, divided by the number of shares outstanding on an adjusted fully diluted basis, calculated as of March 31, 2020. SST IV’s primary offering was suspended as of April 30, 2020 and terminated on September 11, 2020. For the purposes of calculating these estimated net asset values per share, an independent third party appraiser valued SST IV’s properties. On March 17, 2021, SmartStop acquired SST IV by way of merger.
(11) SSGT II commenced its private offering and operations on January 9, 2019 upon reaching the minimum escrow requirements of the private offering, suspended its primary offering on April 30, 2020 and closed its primary offering on September 30, 2020.
C-11
TABLE IV
RESULTS OF COMPLETED PRIOR REAL ESTATE PROGRAMS (UNAUDITED)
This table sets forth summary information on the results of Prior Real Estate Programs sponsored by our sponsor or its affiliates that completed operations during the previous five years ended December 31, 2021. The information relates only to programs with investment objectives similar to this program.
Program Name |
|
Strategic Storage |
|
|
Strategic Storage Trust IV, Inc.(3) |
|
||
Date of closing of offering |
|
January 16, 2015 |
|
|
September 11, 2020 |
|
||
Duration of offering (in months) |
|
19.0 and 27.0 |
|
|
43 |
|
||
Date program terminated |
|
January 24, 2019 |
|
|
March 17, 2021 |
|
||
Dollar amount raised |
|
$ |
279,933,449 |
|
|
$ |
254,702,659 |
|
Annualized return on investment |
|
9.3%(2) |
|
|
N/A(4) |
|
||
Annual median leverage |
|
|
13 |
% |
|
|
33 |
% |
C-12
NOTES TO TABLE IV
(1) SSGT merged into a subsidiary of SmartStop on January 24, 2019 in an all-cash merger transaction. The offering related amounts included herein do not include any amounts offered or raised pursuant to the SSGT Form S-3 or SSGT’s private offering which terminated on January 16, 2015.
(2) Annualized return on investment was calculated as (a) the difference between the aggregate amounts distributed to investors and invested by investors, divided by (b) the aggregate amount invested by investors, divided by (c) the number of years from the initial receipt of offering proceeds from a third party investor to the liquidity event. As applicable, the aggregate amount distributed to investors includes distributions paid in cash and any operating partnership units issued upon acquisition by SSGT.
(3) SST IV merged into a subsidiary of SmartStop on March 17, 2021 in a stock-for-stock merger transaction and the stockholders of SST IV now own shares of common stock of SmartStop. The offering related amounts included herein do not include any amounts offered or raised pursuant to the SST IV Form S-3.
(4) Since the SST IV stockholders now own shares of common stock of SmartStop, which has not yet engaged in a liquidity event, annualized return on investment cannot be calculated at this time.
C-13
TABLE V
SALES OR DISPOSALS OF PROPERTIES FOR PRIOR REAL ESTATE PROGRAMS (UNAUDITED)
The following table sets forth sales or other disposals of properties by Prior Real Estate Programs sponsored by our sponsor or its affiliates during the most recent three years ended December 31, 2021. The information relates only to programs with investment objectives similar to this program.
Selling Price, Net of Closing Costs and GAAP Adjustments
Property |
Date Acquired |
Date of Sale |
Cash Received Net of Closing Costs(1) |
Mortgage Balance at Time of Sale |
Purchase Money Mortgage Taken Back by Program |
Adjustments Resulting from Application of GAAP |
Total |
San Antonio II |
1/24/2019(2) |
10/18/2019 |
$8,224,286 |
$7,497,324 |
— |
— |
$15,721,610 |
Cost of Properties Including Closing and Soft Costs
Property |
Original Mortgage Financing |
Total Acquisition Cost, Capital Improvements, Closing and Soft Costs(3) |
Total |
Gain on Sale of Investment |
Excess (Deficiency) of Property Operating Cash Receipts Over Cash Expenditures |
San Antonio II |
$7,497,324 |
$4,728,578 |
$12,225,902 |
$3,495,708 |
$387,336 |
C-14
NOTES TO TABLE V
(1) Excludes amounts used to repay mortgage.
(2) SmartStop acquired the San Antonio II Property in the SSGT Merger on January 24, 2019. SSGT originally acquired the San Antonio Property on January 6, 2016.
(3) Excludes mortgage amount.
C-15
Serious News for Serious Traders! Try StreetInsider.com Premium Free!
You May Also Be Interested In
- Robbins LLP Reminds IRobot Corporation Shareholders of the Pending May 7, 2024 Lead Plaintiff Deadline
- Denarius Metals Announces 2023 Fiscal Year Results
- Tuktu Resources Ltd. Announces 2023 Year-End Results and Reserves
Create E-mail Alert Related Categories
SEC FilingsSign up for StreetInsider Free!
Receive full access to all new and archived articles, unlimited portfolio tracking, e-mail alerts, custom newswires and RSS feeds - and more!
