

Form 10-Q STEEL DYNAMICS INC For: Mar 31
 Tweet
Tweet Share
ShareUNITED STATES
SECURITIES AND EXCHANGE COMMISSION
WASHINGTON, D.C. 20549
FORM
ended
OR
Commission File Number
(Exact name of registrant as specified in its charter)
| ||
(State or other jurisdiction of incorporation or organization) | (I.R.S. Employer Identification No.) | |
(Address of principal executive offices) | (Zip Code) |
Registrant’s telephone number, including area code: (
Not Applicable
(Former name, former address and former fiscal year, if changed since last report.)
Securities registered pursuant to Section 12(b) of the Act.
Title of each class | Trading Symbol | Name of each exchange on which registered |
Indicate by check mark whether the registrant (1) has filed all reports required to be filed by Section 13 or 15(d) of the Securities Exchange Act of 1934 during the preceding 12 months (or for such shorter period that the registrant was required to file such reports), and (2) has been subject to such filing requirements for the past 90 days.
Indicate by check mark whether the registrant has submitted electronically every Interactive Data File required to be submitted pursuant to Rule 405 of Regulation S-T (§232.405 of this chapter) during the preceding 12 months (or for such shorter period that the registrant was required to submit such files).
Indicate by check mark whether the registrant is a large accelerated filer, an accelerated filer, a non-accelerated filer, a smaller reporting company, or an emerging growth company. See the definitions of “large accelerated filer,” “accelerated filer,” “smaller reporting company,” and “emerging growth company” in Rule 12b-2 of the Exchange Act.
|
| Accelerated filer ◻ |
| Non-accelerated filer ◻ | |||
Smaller reporting company | Emerging growth company | ||||||
If an emerging growth company, indicate by check mark if the registrant has elected not to use the extended transition period for complying with any new or revised financial accounting standards provided pursuant to Section 13(a) of the Exchange Act. ◻
Indicate by check mark whether the registrant is a shell company (as defined in Rule 12b-2 of the Exchange Act). Yes
As of April 25, 2022, Registrant had
STEEL DYNAMICS, INC.
Table of Contents
PART I. FINANCIAL INFORMATION
ITEM 1. FINANCIAL STATEMENTS
STEEL DYNAMICS, INC.
CONSOLIDATED BALANCE SHEETS
(in thousands, except share data)
March 31, | December 31, | |||||
2022 | 2021 | |||||
Assets | (unaudited) | |||||
Current assets | ||||||
Cash and equivalents | $ | | $ | | ||
Accounts receivable, net | | | ||||
Accounts receivable-related parties | | | ||||
Inventories | | | ||||
Other current assets | | | ||||
Total current assets | | | ||||
Property, plant and equipment, net | | | ||||
Intangible assets, net | | | ||||
Goodwill | | | ||||
Other assets | | | ||||
Total assets | $ | | $ | | ||
Liabilities and Equity | ||||||
Current liabilities | ||||||
Accounts payable | $ | | $ | | ||
Accounts payable-related parties | | | ||||
Income taxes payable | | | ||||
Accrued payroll and benefits | | | ||||
Accrued interest | | | ||||
Accrued expenses | | | ||||
Current maturities of long-term debt | | | ||||
Total current liabilities | | | ||||
Long-term debt | | | ||||
Deferred income taxes | | | ||||
Other liabilities | | | ||||
Total liabilities | | | ||||
Commitments and contingencies | ||||||
Redeemable noncontrolling interests | | | ||||
Equity | ||||||
Common stock voting, $ | ||||||
| ||||||
shares outstanding, as of March 31, 2022 and December 31, 2021, respectively | | | ||||
Treasury stock, at cost; | ||||||
as of March 31, 2022 and December 31, 2021, respectively | ( | ( | ||||
Additional paid-in capital | | | ||||
Retained earnings | | | ||||
Accumulated other comprehensive income (loss) | | ( | ||||
Total Steel Dynamics, Inc. equity | | | ||||
Noncontrolling interests | ( | ( | ||||
Total equity | | | ||||
Total liabilities and equity | $ | | $ | | ||
See notes to consolidated financial statements.
1
STEEL DYNAMICS, INC.
CONSOLIDATED STATEMENTS OF INCOME (UNAUDITED)
(in thousands, except per share data)
Three-Month Periods Ended | |||||
March 31, | |||||
2022 | 2021 | ||||
Net sales | |||||
Unrelated parties | $ | | $ | | |
Related parties | | | |||
Total net sales | | | |||
Costs of goods sold | | | |||
Gross profit | | | |||
Selling, general and administrative expenses | | | |||
Profit sharing | | | |||
Amortization of intangible assets | | | |||
Operating income | | | |||
Interest expense, net of capitalized interest | | | |||
Other (income) expense, net | | | |||
Income before income taxes | | | |||
Income tax expense | | | |||
Net income | | | |||
Net income attributable to noncontrolling interests | ( | ( | |||
Net income attributable to Steel Dynamics, Inc. | $ | | $ | | |
Basic earnings per share attributable to Steel | |||||
Dynamics, Inc. stockholders | $ | $ | |||
Weighted average common shares outstanding | |||||
Diluted earnings per share attributable to Steel | |||||
Dynamics, Inc. stockholders, including the effect | |||||
of assumed conversions when dilutive | $ | $ | |||
Weighted average common shares and share equivalents outstanding | |||||
Dividends declared per share | $ | $ | |||
See notes to consolidated financial statements.
2
STEEL DYNAMICS, INC.
CONSOLIDATED STATEMENTS OF COMPREHENSIVE INCOME (UNAUDITED)
(in thousands)
Three-Month Periods Ended | |||||
March 31, | |||||
2022 | 2021 | ||||
Net income | $ | | $ | | |
Other comprehensive income - net unrealized gain on cash | |||||
flow hedging derivatives, net of income tax of $ | |||||
for the three-month periods ended March 31, 2022 and 2021, respectively | | | |||
Comprehensive income | | | |||
Comprehensive income attributable to noncontrolling interests | ( | ( | |||
Comprehensive income attributable to Steel Dynamics, Inc. | $ | | $ | | |
See notes to consolidated financial statements.
3
STEEL DYNAMICS, INC.
CONSOLIDATED STATEMENTS OF CASH FLOWS (UNAUDITED)
(in thousands)
Three-Month Periods Ended | |||||
March 31, | |||||
2022 | 2021 | ||||
Operating activities: | |||||
Net income | $ | | $ | | |
Adjustments to reconcile net income to net cash provided by | |||||
operating activities: | |||||
Depreciation and amortization | | | |||
Equity-based compensation | | | |||
Deferred income taxes | | | |||
Other adjustments | | ( | |||
Changes in certain assets and liabilities: | |||||
Accounts receivable | ( | ( | |||
Inventories | | ( | |||
Other assets | | | |||
Accounts payable | ( | | |||
Income taxes receivable/payable | | | |||
Accrued expenses | ( | ( | |||
Net cash provided by operating activities | | | |||
Investing activities: | |||||
Purchases of property, plant and equipment | ( | ( | |||
Investments in unconsolidated affiliates | ( | - | |||
Other investing activities | | | |||
Net cash used in investing activities | ( | ( | |||
Financing activities: | |||||
Issuance of current and long-term debt | | | |||
Repayment of current and long-term debt | ( | ( | |||
Dividends paid | ( | ( | |||
Purchases of treasury stock | ( | - | |||
Other financing activities | ( | ( | |||
Net cash used in financing activities | ( | ( | |||
Decrease in cash, cash equivalents, and restricted cash | ( | ( | |||
Cash, cash equivalents, and restricted cash at beginning of period | | | |||
Cash, cash equivalents, and restricted cash at end of period | $ | | $ | | |
Supplemental disclosure information: | |||||
Cash paid for interest | $ | | $ | | |
Cash paid for income taxes, net | $ | | $ | | |
See notes to consolidated financial statements.
4
Note 1. Description of the Business and Significant Accounting Policies
Description of the Business
Steel Dynamics, Inc. (SDI), together with its subsidiaries (the company), is one of the largest and most diversified domestic steel producers and metals recycler. The company has
Steel Operations Segment. Steel operations include the company’s electric arc furnace (EAF) steel mills, including Butler Flat Roll Division, Columbus Flat Roll Division, Southwest-Sinton Flat Roll Division (Sinton), Structural and Rail Division, Engineered Bar Products Division, Roanoke Bar Division, and Steel of West Virginia; and steel coating and processing operations at The Techs, Heartland Flat Roll Division, United Steel Supply (USS), and Vulcan Threaded Products, Inc (Vulcan). Steel operations accounted for
Metals Recycling Operations Segment. Metals recycling operations include the company’s OmniSource ferrous and nonferrous processing, transportation, marketing, brokerage, and scrap management services primarily throughout the United States and in Central and Northern Mexico. Metals recycling operations accounted for
Steel Fabrication Operations Segment. Steel fabrication operations include the company’s New Millennium Building Systems’ joist and deck plants located throughout the United States, and in Northern Mexico. Revenues from these plants are generated from the fabrication of trusses, girders, steel joists and steel deck used within the non-residential construction industry. Steel fabrication operations accounted for
Other. Other operations consist of subsidiary operations that are below the company’s quantitative thresholds required for reportable segments and primarily consist of joint ventures, and our idle Minnesota ironmaking operations. Also included in “Other” are certain unallocated corporate accounts, such as the company’s senior unsecured credit facility, senior notes, certain other investments and the company’s profit sharing component.
Significant Accounting Policies
Principles of Consolidation
The consolidated financial statements include the accounts of SDI, together with its wholly- and majority-owned or controlled consolidated subsidiaries, after elimination of intercompany accounts and transactions. Noncontrolling and redeemable noncontrolling interests represent the noncontrolling owners’ proportionate share in the equity, income, or losses of the company’s majority-owned or controlled consolidated subsidiaries. Redeemable noncontrolling interests related to USS (owned
5
Note 1. Description of the Business and Significant Accounting Policies (Continued)
Use of Estimates
These consolidated financial statements are prepared in conformity with accounting principles generally accepted in the United States, and accordingly, include amounts that require management to make estimates and assumptions that affect the amounts reported in the consolidated financial statements and in the notes thereto. Significant items subject to such estimates and assumptions include the carrying value of property, plant and equipment, intangible assets, and goodwill; valuation allowances for trade receivables, inventories and deferred income tax assets; unrecognized tax benefits; potential environmental liabilities; and litigation claims and settlements. Actual results may differ from these estimates and assumptions.
In the opinion of management, these financial statements reflect all normal recurring adjustments necessary for a fair presentation of the interim period results. These consolidated financial statements and notes should be read in conjunction with the audited financial statements and notes thereto included in the company’s Annual Report on Form 10-K for the year ended December 31, 2021.
Cash and Equivalents, and Restricted Cash
Cash and equivalents include all highly liquid investments with a maturity of three months or less at the date of acquisition. Restricted cash is primarily funds held in escrow as required by various insurance and government organizations. The balance of cash, cash equivalents and restricted cash in the consolidated statements of cash flows includes restricted cash of $
Goodwill
The company’s goodwill consisted of the following at March 31, 2022, and December 31, 2021 (in thousands):
March 31, | December 31, | |||||||
2022 | 2021 | |||||||
Steel Operations Segment | $ | | $ | | ||||
Metals Recycling Operations Segment | | | ||||||
Steel Fabrication Operations Segment | | | ||||||
$ | | $ | | |||||
Metals Recycling Operations Segment goodwill decreased $
6
Note 1. Description of the Business and Significant Accounting Policies (Continued)
Credit Losses
The company is exposed to credit risk in the event of nonpayment of accounts receivable by customers. The company mitigates its exposure to credit risk, which it generally extends on an unsecured basis, by performing ongoing credit evaluations and taking further action if necessary, such as requiring letters of credit or other security interests to support the customer receivable. The allowance for credit losses for accounts receivable is based on the company’s reasonable estimate of known credit risks and historical experience, adjusted for current and anticipated economic and other pertinent factors affecting the company’s customers, that may differ from historical experience. Customer accounts receivable are written off when all collection efforts have been exhausted and the amounts are deemed uncollectible.
At March 31, 2022, the company reported $
Note 2. Investments in Unconsolidated Affiliates
On January 31, 2022, the company purchased a
Note 3. Earnings Per Share
Basic earnings per share is based on the weighted average shares of common stock outstanding during the period. Diluted earnings per share assumes the weighted average dilutive effect of common share equivalents outstanding during the period applied to the company’s basic earnings per share. Common share equivalents represent potentially dilutive restricted stock units, deferred stock units, restricted stock, and performance awards, and are excluded from the computation in periods in which they have an anti-dilutive effect. There were
Three-Month Periods Ended March 31, | |||||||||||||||||
2022 | 2021 | ||||||||||||||||
Weighted | Weighted | ||||||||||||||||
Average | Average | ||||||||||||||||
Net Income | Shares | Per Share | Net Income | Shares | Per Share | ||||||||||||
(Numerator) | (Denominator) | Amount | (Numerator) | (Denominator) | Amount | ||||||||||||
Basic earnings per share | $ | | | $ | | $ | | | $ | | |||||||
Dilutive common share equivalents | - | | - | | |||||||||||||
Diluted earnings per share | $ | | | $ | | $ | | | $ | | |||||||
7
Note 4. Inventories
Inventories are stated at lower of cost or net realizable value. Cost is determined using a weighted average cost method for raw materials and supplies, and on a first-in, first-out basis for other inventory.
March 31, | December 31, | ||||||||
2022 | 2021 | ||||||||
Raw materials | $ | $ | |||||||
Supplies | |||||||||
Work in progress | |||||||||
Finished goods | |||||||||
Total inventories | $ | $ | |||||||
Note 5. Changes in Equity
The following tables provide a reconciliation of the beginning and ending carrying amounts of total equity, equity attributable to stockholders of Steel Dynamics, Inc., and equity and redeemable amounts attributable to noncontrolling interests (in thousands) for the three-month periods ended March 31, 2022 and 2021:
Stockholders of Steel Dynamics, Inc. | ||||||||||||||||||||||||
Accumulated | ||||||||||||||||||||||||
Additional | Other | Redeemable | ||||||||||||||||||||||
Common | Treasury | Paid-In | Retained | Comprehensive | Noncontrolling | Total | Noncontrolling | |||||||||||||||||
| Stock |
| Stock |
| Capital |
| Earnings |
| Income (Loss) |
| Interests |
| Equity |
| Interests | |||||||||
Balances at December 31, 2021 | $ | | $ | ( | $ | | $ | | $ | ( | $ | ( | $ | | $ | | ||||||||
Dividends declared | - | - | - | ( | - | - | ( | - | ||||||||||||||||
Noncontrolling investors, net | - | - | - | - | - | ( | ( | | ||||||||||||||||
Share repurchases | - | ( | - | - | - | - | ( | - | ||||||||||||||||
Equity-based compensation | - | | ( | ( | - | - | ( | - | ||||||||||||||||
Net income | - | - | - | | - | | | - | ||||||||||||||||
Other comprehensive income, | - | - | - | - | | - | | - | ||||||||||||||||
net of tax | ||||||||||||||||||||||||
Stockholders of Steel Dynamics, Inc. | ||||||||||||||||||||||||
Accumulated | ||||||||||||||||||||||||
Additional | Other | Redeemable | ||||||||||||||||||||||
Common | Treasury | Paid-In | Retained | Comprehensive | Noncontrolling | Total | Noncontrolling | |||||||||||||||||
| Stock |
| Stock |
| Capital |
| Earnings |
| Income |
| Interests |
| Equity |
| Interests | |||||||||
Balances at December 31, 2020 | $ | | $ | ( | $ | | $ | | $ | | $ | ( | $ | | $ | | ||||||||
Dividends declared | - | - | - | ( | - | - | ( | - | ||||||||||||||||
Noncontrolling investors, net | - | - | - | - | - | ( | ( | | ||||||||||||||||
Equity-based compensation | - | | ( | ( | - | - | | - | ||||||||||||||||
Net income | - | - | - | | - | | | - | ||||||||||||||||
Other comprehensive income, | - | - | - | - | | - | | - | ||||||||||||||||
net of tax | ||||||||||||||||||||||||
Balances at March 31, 2021 | $ | | $ | ( | $ | | $ | | $ | | $ | ( | $ | | $ | | ||||||||
8
Note 6. Derivative Financial Instruments
The company is exposed to certain risks relating to its ongoing business operations. The company utilizes derivative instruments to mitigate commodity margin risk, and occasionally to mitigate foreign currency exchange rate risk, and have in the past to mitigate interest rate fluctuation risk. The company routinely enters into forward exchange traded futures and option contracts to manage the price risk associated with nonferrous metals inventory as well as purchases and sales of nonferrous and ferrous metals (primarily aluminum and copper). The company offsets fair value amounts recognized for derivative instruments executed with the same counterparty under master netting agreements.
Commodity Futures Contracts. If the company is “long” on futures contracts, it means the company has more futures contracts purchased than futures contracts sold for the underlying commodity. If the company is “short” on a futures contract, it means the company has more futures contracts sold than futures contracts purchased for the underlying commodity.
Commodity Futures | Long/Short | Metric Tons | ||||
Aluminum | Long | |||||
Aluminum | Short | |||||
Copper | Long | |||||
Copper | Short |
The following summarizes the location and amounts of the fair values reported on the company’s consolidated balance sheets as of March 31, 2022, and December 31, 2021, and gains and losses related to derivatives included in the company’s statement of income for the three-month periods ended March 31, 2022, and 2021 (in thousands):
Asset Derivatives | Liability Derivatives | ||||||||||||
Balance sheet | Fair Value | Fair Value | |||||||||||
location | March 31, 2022 | December 31, 2021 | March 31, 2022 | December 31, 2021 | |||||||||
Derivative instruments designated as hedges | |||||||||||||
Commodity futures | Other current assets | $ | | $ | | $ | | $ | | ||||
Derivative instruments not designated as | |||||||||||||
hedges | |||||||||||||
Commodity futures | Other current assets | | | | | ||||||||
Total derivative instruments | $ | | $ | | $ | | $ | | |||||
9
Note 6. Derivative Financial Instruments (continued)
The fair value of the above derivative instruments along with required margin deposit amounts with the same counterparty under master netting arrangements totaled $
Amount of gain (loss) | Amount of gain (loss) | |||||||||||||||
recognized in income | Location of gain | recognized in income | ||||||||||||||
Location of gain | on derivatives for the | (loss) recognized | on derivatives for the | |||||||||||||
(loss) recognized | three-month periods | Hedged items in | in income on | three-month periods | ||||||||||||
in income on | ended March 31, | fair value hedge | related hedged | ended March 31, | ||||||||||||
derivatives | 2022 | 2021 | relationships | items | 2022 | 2021 | ||||||||||
Derivatives in fair value | ||||||||||||||||
hedging relationships | ||||||||||||||||
Commodity futures | Costs of goods sold | $ | | $ | | Firm commitments | Costs of goods sold | $ | ( | $ | ( | |||||
Inventory | Costs of goods sold | ( | ( | |||||||||||||
Derivatives not designated | $ | ( | $ | ( | ||||||||||||
as hedging instruments | ||||||||||||||||
Commodity futures | Costs of goods sold | $ | ( | $ | ( | |||||||||||
Derivatives accounted for as fair value hedges had ineffectiveness resulting in gains of $
Derivatives accounted for as cash flow hedges resulted in net gains of $
10
Note 7. Fair Value Measurements
Accounting standards provide a comprehensive framework for measuring fair value and sets forth a definition of fair value and establishes a hierarchy prioritizing the inputs to valuation techniques, giving the highest priority to quoted prices in active markets for identical assets and liabilities and the lowest priority to unobservable value inputs. Levels within the hierarchy are defined as follows:
| ● | Level 1—Unadjusted quoted prices for identical assets and liabilities in active markets; |
| ● | Level 2—Quoted prices for similar assets and liabilities in active markets (other than those included in Level 1) which are observable for the asset or liability, either directly or indirectly; and |
| ● | Level 3—Valuations derived from valuation techniques in which one or more significant inputs or significant value drivers are unobservable. |
The following table sets forth financial assets and liabilities measured at fair value on a recurring basis in the consolidated balance sheet and the respective levels to which the fair value measurements are classified within the fair value hierarchy as of March 31, 2022 and December 31, 2021 (in thousands):
Quoted Prices | Significant | ||||||||||
in Active | Other | Significant | |||||||||
Markets for | Observable | Unobservable | |||||||||
Identical Assets | Inputs | Inputs | |||||||||
Total | (Level 1) | (Level 2) | (Level 3) | ||||||||
March 31, 2022 | |||||||||||
Commodity futures – financial assets | $ | | $ | $ | | $ | |||||
Commodity futures – financial liabilities | | | |||||||||
December 31, 2021 | |||||||||||
Commodity futures – financial assets | $ | | $ | $ | | $ | |||||
Commodity futures – financial liabilities |
| |
|
| |
| |||||
The carrying amounts of financial instruments including cash and equivalents, and restricted cash approximate fair value (Level 1). The fair values of the commodity futures contracts are estimated by the use of quoted market prices, estimates obtained from brokers, and other appropriate valuation techniques based on references available (Level 2). The fair value of long-term debt, including current maturities, as determined by quoted market prices (Level 2), was approximately $
Note 8. Commitments and Contingencies
The company is involved in various routine litigation matters, including administrative proceedings, regulatory proceedings, governmental investigations, environmental matters, and commercial and construction contract disputes, none of which are expected to have a material impact on the company’s financial condition, results of operations, or liquidity.
11
Note 9. Segment Information
The company’s operations are primarily organized and managed by reportable operating segments, which are steel operations, metals recycling operations, and steel fabrication operations. The segment operations are more fully described in Note 1 to the consolidated financial statements. Operating segment performance and resource allocations are primarily based on operating results before income taxes. The accounting policies of the reportable segments are consistent with those described in Note 1 to the consolidated financial statements. Intra-segment sales and any related profits are eliminated in consolidation. Amounts included in the category “Other” are from subsidiary operations that are below the quantitative thresholds required for reportable segments and primarily consist of joint ventures, and the idle Minnesota ironmaking operations. Also included in “Other” are certain unallocated corporate accounts, such as the company’s senior unsecured credit facility, senior notes, certain other investments and the company’s profit sharing component.
The company’s segment results, including disaggregated revenue by segment to external, external non-United States, and other segment customers, are as follows (in thousands):
Metals | Steel | |||||||||||||||||
For the three-month period ended | Steel | Recycling | Fabrication | |||||||||||||||
March 31, 2022 | Operations | Operations | Operations | Other | Eliminations | Consolidated | ||||||||||||
Net sales - disaggregated revenue | ||||||||||||||||||
External | $ | | $ | | $ | | $ | | $ | - | $ | | ||||||
External Non-U.S. | | | | | - | | ||||||||||||
Other segments | | | | | ( | - | ||||||||||||
| | | | ( | | |||||||||||||
Operating income (loss) | | | | ( | (1) | ( | | |||||||||||
Income (loss) before income taxes | | | | ( | ( | | ||||||||||||
Depreciation and amortization | | | | | - | | ||||||||||||
Capital expenditures | | | | | - | | ||||||||||||
As of March 31, 2022 | ||||||||||||||||||
Assets | $ | | $ | | $ | | $ | | (2) | $ | ( | (3) | $ | | ||||
Footnotes related to the three-month period ended March 31, 2022, segment results (in millions): | ||||||||
(1) | Corporate SG&A | $ | ( | (2) | Cash and equivalents | $ | | |
Companywide equity-based compensation | ( | Accounts receivable | | |||||
Company profit sharing component | ( | Inventories | | |||||
Other, net | ( | Property, plant and equipment, net | | |||||
$ | ( | Intra-company debt | | |||||
Other | | |||||||
$ | | |||||||
(3) | Elimination of intra-company receivables | $ | ( | |||||
Elimination of intra-company debt | ( | |||||||
Other | ( | |||||||
$ | ( | |||||||
12
Note 9. Segment Information (Continued)
Metals | Steel | |||||||||||||||||
For the three-month period ended | Steel | Recycling | Fabrication | |||||||||||||||
March 31, 2021 | Operations | Operations | Operations | Other | Eliminations | Consolidated | ||||||||||||
Net sales - disaggregated revenue | ||||||||||||||||||
External | $ | | $ | | $ | | $ | | $ | - | $ | | ||||||
External Non-U.S. | | | | | - | | ||||||||||||
Other segments | | | | | ( | - | ||||||||||||
| | | | ( | | |||||||||||||
Operating income (loss) | | | | ( | (1) | ( | | |||||||||||
Income (loss) before income taxes | | | | ( | ( | | ||||||||||||
Depreciation and amortization | | | | | - | | ||||||||||||
Capital expenditures | | | | | - | | ||||||||||||
Footnotes related to the three-month period ended March 31, 2021, segment results (in millions): | ||||||||
(1) | Corporate SG&A | $ | ( | |||||
Companywide equity-based compensation | ( | |||||||
Company profit sharing component | ( | |||||||
Other, net | ( | |||||||
$ | ( | |||||||
13
ITEM 2. MANAGEMENT’S DISCUSSION AND ANALYSIS OF FINANCIAL CONDITION AND RESULTS OF OPERATIONS
Forward-Looking Statements
This report contains some predictive statements about future events, including statements related to conditions in domestic or global economies, conditions in steel and recycled metals market places, Steel Dynamics' revenues, costs of purchased materials, future profitability and earnings, and the operation of new, existing or planned facilities. These statements, which we generally precede or accompany by such typical conditional words as "anticipate", "intend", "believe", "estimate", "plan", "seek", "project", or "expect", or by the words "may", "will", or "should", are intended to be made as "forward-looking", subject to many risks and uncertainties, within the safe harbor protections of the Private Securities Litigation Reform Act of 1995. These statements speak only as of this date and are based upon information and assumptions, which we consider reasonable as of this date, concerning our businesses and the environments in which they operate. Such predictive statements are not guarantees of future performance, and we undertake no duty to update or revise any such statements. Some factors that could cause such forward-looking statements to turn out differently than anticipated include: (1) domestic and global economic factors; (2) global steelmaking overcapacity and imports of steel, together with increased scrap prices; (3) pandemics, epidemics, widespread illness or other health issues, such as the COVID-19 pandemic; (4) the cyclical nature of the steel industry and the industries we serve; (5) volatility and major fluctuations in prices and availability of scrap metal, scrap substitutes, and our potential inability to pass higher costs on to our customers; (6) cost and availability of electricity, natural gas, oil, or other energy resources are subject to volatile market conditions; (7) increased environmental, greenhouse gas emissions and sustainability considerations or regulations; (8) compliance with and changes in environmental and remediation requirements; (9) significant price and other forms of competition from other steel producers, scrap processors and alternative materials; (10) availability of an adequate source of supply of scrap for our metals recycling operations; (11) cybersecurity threats and risks to the security of our sensitive data and information technology; (12) the implementation of our growth strategy; (13) litigation and legal compliance; (14) unexpected equipment downtime or shutdowns; (15) governmental agencies may refuse to grant or renew some of our licenses and permits; (16) our senior unsecured credit facility contains, and any future financing agreements may contain, restrictive covenants that may limit our flexibility; and (17) the impacts of impairment charges.
More specifically, we refer you to our more detailed explanation of these and other factors and risks that may cause such predictive statements to turn out differently, as set forth in our most recent Annual Report on Form 10-K under the headings Special Note Regarding Forward-Looking Statements and Risk Factors for the year ended December 31, 2021, in our quarterly reports on Form 10-Q, or in other reports which we from time to time file with the Securities and Exchange Commission. These reports are available publicly on the Securities and Exchange Commission website, www.sec.gov, and on our website, www.steeldynamics.com under “Investors – SEC Filings.”
Description of the Business
We are one of the largest domestic steel producers and metal recyclers in the United States, based on estimated steelmaking and steel coating capacity of approximately 13 million tons and actual metals recycling volumes, with one of the most diversified product and end-market portfolios in the domestic steel industry. Annual steelmaking and steel coating capacity is expected to increase to approximately 16 million tons once our new Southwest-Sinton Flat Roll Division is fully operational. Our primary sources of revenue are from the manufacture and sale of steel products, the processing and sale of recycled ferrous and nonferrous metals, and the fabrication and sale of steel joists and deck products. We have three reportable segments: steel operations, metals recycling operations, and steel fabrication operations.
Operating Statement Classifications
Net Sales. Net sales from our operations are a factor of volumes shipped, product mix and related pricing. We charge premium prices for certain grades of steel, product dimensions, certain smaller volumes, and for value-added processing or coating of our steel products. Except for the steel fabrication operations, we recognize revenues from sales and the allowance for estimated returns and claims from these sales at the point in time control of the product transfers to the customer, upon shipment or delivery. Our steel fabrication operations recognize revenues over time based on completed fabricated tons to date as a percentage of total tons required for each contract.
14
Costs of Goods Sold. Our costs of goods sold represent all direct and indirect costs associated with the manufacture of our products. The principal elements of these costs are scrap and scrap substitutes (which represent the most significant single component of our consolidated costs of goods sold), steel substrate, direct and indirect labor and related benefits, alloys, zinc, transportation and freight, repairs and maintenance, utilities such as electricity and natural gas, and depreciation.
Selling, General and Administrative Expenses. Selling, general and administrative expenses consist of all costs associated with our sales, finance and accounting, and administrative departments, including, among other items, labor and related benefits, and professional services.
Company-wide profit sharing and amortization of intangible assets are each separately presented in the statement of income.
Interest Expense, net of Capitalized Interest. Interest expense consists of interest associated with our senior credit facilities and other debt, net of interest costs that are required to be capitalized during the construction period of certain capital investment projects.
Other (Income) Expense, net. Other income consists of interest income earned on our temporary cash deposits; any other non-operating income activity, including income from investments in unconsolidated affiliates accounted for under the equity method. Other expense consists of any non-operating costs, such as certain acquisition and financing expenses.
Results Overview
Our consolidated results for the first quarter of 2022 were highlighted by record net sales of $5.6 billion, record operating income of $1.5 billion, record net income of $1.1 billion, and record cash flow from operations of $819.0 million. During the first quarter of 2022, steel demand remained strong, most notably in the automotive, construction, and industrial sectors. Our steel fabrication segment achieved record operating income in the quarter, surpassing full-year 2021 results, on robust non-residential construction demand and historically high average selling prices.
Consolidated operating income increased $900.7 million, or 152%, to $1.5 billion for the first quarter of 2022, compared to the first quarter of 2021. First quarter 2022 net income attributable to Steel Dynamics, Inc. increased $673.4 million, or 156%, to $1.1 billion, compared to the first quarter of 2021, consistent with the increased operating income.
Segment Operating Results 2022 vs. 2021 (dollars in thousands)
Three Months Ended March 31, | |||||||
2022 | % Change | 2021 | |||||
Net sales: | |||||||
Steel Operations Segment | $ | 3,931,653 | 49% | $ | 2,642,847 | ||
Metals Recycling Operations Segment | 1,143,217 | 6% | 1,079,912 | ||||
Steel Fabrication Operations Segment | 930,100 | 259% | 259,020 | ||||
Other | 298,458 | (3)% | 307,481 | ||||
6,303,428 | 4,289,260 | ||||||
Intra-company | (733,526) | (744,663) | |||||
$ | 5,569,902 | 57% | $ | 3,544,597 | |||
Operating income (loss): | |||||||
Steel Operations Segment | $ | 1,163,010 | 82% | $ | 637,411 | ||
Metals Recycling Operations Segment | 44,960 | (11)% | 50,563 | ||||
Steel Fabrication Operations Segment | 466,875 | 4638% | 9,854 | ||||
Other | (174,535) | (92)% | (90,913) | ||||
1,500,310 | 606,915 | ||||||
Intra-company | (5,443) | (12,716) | |||||
$ | 1,494,867 | 152% | $ | 594,199 | |||
15
Steel Operations Segment |
Steel operations consist of our electric arc furnace steel mills, producing steel from ferrous scrap and scrap substitutes, utilizing continuous casting, automated rolling mills, and numerous value-added downstream steel coating and processing operations. Our steel operations sell directly to end-users, steel fabricators, and service centers. These products are used in numerous industry sectors, including the construction, automotive, manufacturing, transportation, heavy and agriculture equipment, and pipe and tube (including OCTG) markets. Steel operations accounted for 68% and 71% of our consolidated net sales during the three months ended March 31, 2022 and 2021, respectively.
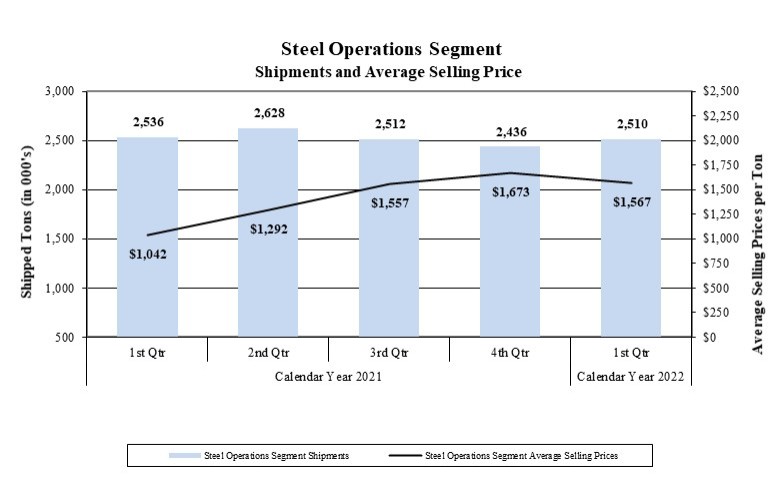
Steel Operations Segment Shipments (tons):
Three Months Ended March 31, | |||||
2022 | % Change | 2021 | |||
Total shipments | 2,894,828 | 3% | 2,822,274 | ||
Intra-segment shipments | (385,289) | (286,296) | |||
Steel Operations Segment shipments | 2,509,539 | (1)% | 2,535,978 | ||
External shipments | 2,409,763 | (0)% | 2,410,817 | ||
16
Steel Operations Segment Results 2022 vs. 2021
During the first quarter of 2022, steel demand dynamics remained strong, with the automotive, construction, and industrial sectors continuing to lead steel demand. We also started to see an increase in steel demand from the energy sector. Compared to the sequential fourth quarter of 2021, sheet steel pricing moderated from the record fourth quarter levels, while long products average selling prices increased slightly. However, first quarter 2022 average selling prices increased 50%, or $525 per ton, compared to first quarter of 2021. Steel operations segment shipments decreased 1% in the first quarter 2022, as compared to the same period in 2021. Net sales for the steel operations were 49% higher in the first quarter 2022 when compared to the same period in 2021, due to the increased average steel selling prices.
Metallic raw materials used in our electric arc furnaces represent our single most significant steel manufacturing cost, generally comprising approximately 55% to 65% of our steel mill operations’ manufacturing costs. Our metallic raw material cost per net ton consumed in our steel operations increased $102, or 27%, in the first quarter of 2022, compared to the same period in 2021, consistent with overall increased domestic scrap pricing noted below in the metals recycling operations segment discussion.
As a result of average selling prices increasing more than scrap costs, metal spread (which we define as the difference between average steel mill selling prices and the cost of ferrous scrap consumed in our steel mills) increased 63% in the first quarter of 2022 compared to the first quarter of 2021. Primarily as a result of this metal spread expansion, operating income for the steel operations increased 82%, to $1.2 billion, in the first quarter of 2022, compared to the same period in 2021.
Metals Recycling Operations Segment |
Metals recycling operations includes both ferrous and nonferrous scrap metal processing, transportation, marketing, brokerage, and scrap management services. Our steel mills utilize a large portion of the ferrous scrap sold by our metals recycling operations as raw material in our steelmaking operations, and the remainder is sold to other consumers, such as other steel manufacturers and foundries. In the first quarters of 2022 and 2021, 65% and 69%, respectively, of metals recycling operations ferrous scrap was sold to our own steel mills, as our steel mills utilization was 93% in the first quarters of 2022 and 2021. Our metals recycling operations accounted for 10% and 13% of our consolidated net sales during the three months ended March 31, 2022 and 2021, respectively.
Metals Recycling Operations Segment Shipments:
Three Months Ended March 31, | |||||
2022 | % Change | 2021 | |||
Ferrous metal (gross tons) | |||||
Total | 1,265,222 | (9)% | 1,395,843 | ||
Inter-company | (827,994) | (14)% | (958,661) | ||
External shipments | 437,228 | 0% | 437,182 | ||
Nonferrous metals (thousands of pounds) | |||||
Total | 260,890 | (7)% | 280,809 | ||
Inter-company | (24,761) | (43,552) | |||
External shipments | 236,129 | (0)% | 237,257 | ||
Metals Recycling Operations Segment Results 2022 vs. 2021
Our metals recycling operations benefitted from strong steel market demand and increased selling prices for recycled scrap in the first quarter of 2022. Domestic steel mill utilization rates were approximately 80% in the first quarter of 2022, as compared to approximately 77% in the first quarter of 2021. Net sales increased 6% during the first quarter of 2022 compared to the same period in 2021, driven by higher average selling prices for both ferrous and nonferrous metals, partially offset by the 9% and 7% decrease in ferrous and nonferrous shipments, respectively. Ferrous scrap average selling prices increased 16% during the first quarter of 2022 compared to the same period in 2021, while average nonferrous scrap prices increased 15%. Ferrous metal spread (which we define as the difference between
17
average selling prices and the cost of purchased scrap) increased 11%, while nonferrous metal spread increased 24% during the first quarter of 2022 compared to the same period in 2021. In spite of these improved metal spreads, metals recycling operations operating income decreased 11% to $45.0 million in the first quarter of 2022 compared to the first quarter of 2021 due to the decreased ferrous and nonferrous shipments.
Steel Fabrication Operations Segment |
Steel fabrication operations include seven New Millennium Building Systems joist and deck plants located throughout the United States, and in Northern Mexico. Revenues from these plants are generated from the fabrication of steel joists, trusses, girders and steel deck used within the non-residential construction industry. Steel fabrication operations accounted for 17% and 7% of our consolidated net sales during the three months ended March 31, 2022 and 2021, respectively.
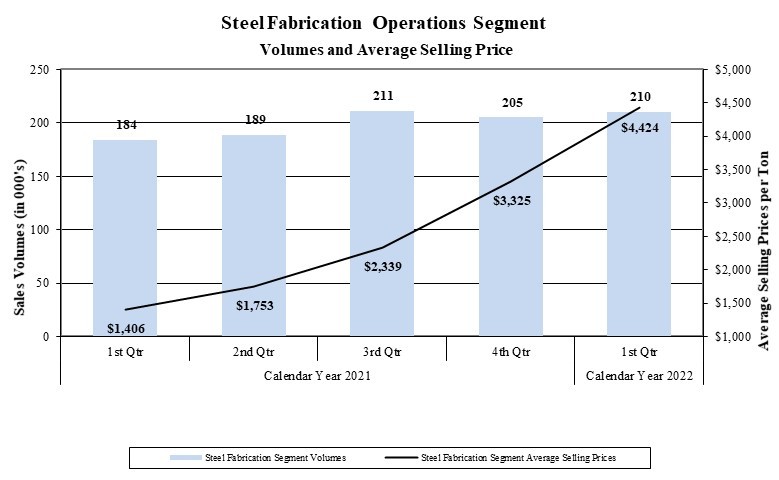
Steel Fabrication Operations Segment Results 2022 vs. 2021
Our steel fabrication operations continue to benefit from the strong non-residential construction market, resulting in continued record order backlog and record forward-pricing at the end of the first quarter of 2022. This continuing robust order activity and broad customer optimism supports strong overall demand dynamics for the construction industry. Net sales for the steel fabrication operations increased 259% during the first quarter of 2022 compared to the same period in 2021, as average selling prices increased $3,018 per ton, or 215%, while shipments increased 14% to 210,000 tons.
The purchase of various steel products is the largest single cost of production for our steel fabrication operations, historically representing approximately two-thirds of the total cost of manufacturing, increasing to approximately three-fourths during 2021 and the first quarter of 2022 with the increased steel costs. The average cost per ton of steel consumed increased 89% in the first quarter 2022, as compared to the same period in 2021, as evidenced by the increased steel selling prices in our steel operations segment. As a result of selling prices per ton increasing more than steel input costs per ton, metal spread (which we define as the difference between average selling prices and the cost of
18
purchased steel) increased more than fourfold in the first quarter of 2022 compared to the same period in 2021. This expanded metal spread resulted in record operating income of $466.9 million in the first quarter 2022 compared to $9.9 million in the same period in 2021.
Other Operations |
First Quarter Consolidated Results 2022 vs. 2021
Selling, General and Administrative Expenses. Selling, general and administrative expenses of $152.0 million during the first quarter of 2022 were comparable to the $149.8 million during the first quarter of 2021. Selling, general and administrative expenses represented 2.7% and 4.2% of net sales during first quarter 2022 and 2021, respectively.
Profit sharing expense during the first quarter of 2022 of $128.5 million increased 163% from the $48.8 million during the same period in 2021, consistent with increased pretax earnings. The company profit sharing component represents 8% of pretax earnings.
Interest Expense, net of Capitalized Interest. During the first quarter of 2022, interest expense of $16.7 million was comparable to the $17.3 million during the first quarter of 2021.
Income Tax Expense. First quarter 2022 income tax expense of $350.4 million, at an effective income tax rate of 24.0%, increased 174% compared to the $128.1 million, at an effective income tax rate of 22.6%, during the first quarter of 2021, consistent with increased pretax earnings.
Liquidity and Capital Resources
Capital Resources and Long-term Debt. Our business is capital intensive and requires substantial expenditures for, among other things, the purchase and maintenance of equipment used in our operations, and to remain in compliance with environmental laws. Our short-term and long-term liquidity needs arise primarily from working capital requirements, capital expenditures, including expansion projects, principal and interest payments related to our outstanding indebtedness (no significant principal payments until 2024), dividends to our shareholders, and potential stock repurchases and acquisitions or investments. We have met and intend to continue to meet these liquidity requirements primarily with available cash and cash provided by operations, and long-term borrowings, and we also have availability under our unsecured Revolver. Our liquidity at March 31, 2022, is as follows (in thousands):
Cash and equivalents | $ | 1,189,528 | |||||||
Revolver availability | 1,187,913 | ||||||||
Total liquidity | $ | 2,377,441 |
Our total outstanding debt remained consistent at $3.1 billion during the first quarter of 2022. Our total long-term debt to capitalization ratio (representing our long-term debt, including current maturities, divided by the sum of our long-term debt, redeemable noncontrolling interests, and our total stockholders’ equity) was 30.6% and 32.9% at March 31, 2022, and December 31, 2021, respectively.
Our unsecured credit agreement has a senior unsecured revolving credit facility (Facility), which provides a $1.2 billion unsecured Revolver, and matures in December 2024. Subject to certain conditions, we have the opportunity to increase the Facility size by $500.0 million. The unsecured Revolver is available to fund working capital, capital expenditures, and other general corporate purposes. The Facility contains financial covenants and other covenants pertaining to our ability to incur indebtedness and permit liens on certain assets. Our ability to borrow funds within the terms of the unsecured Revolver is dependent upon our continued compliance with the financial and other covenants. At March 31, 2022, we had $1.2 billion of availability on the Revolver, $12.1 million of outstanding letters of credit and other obligations which reduce availability, and there were no borrowings outstanding.
19
The financial covenants under our Facility state that we must maintain an interest coverage ratio of not less than 2.50:1.00. Our interest coverage ratio is calculated by dividing our last-twelve-months (LTM) consolidated Adjusted EBITDA (earnings before interest, taxes, depreciation, amortization, and certain other non-cash transactions as allowed in the Facility) by our LTM gross interest expense, less amortization of financing fees. In addition, a debt to capitalization ratio of not more than 0.60:1.00 must be maintained. At March 31, 2022, our interest coverage ratio and debt to capitalization ratio were 54.22:1.00 and 0.31:1.00, respectively. We were, therefore, in compliance with these covenants at March 31, 2022, and we anticipate we will continue to be in compliance during the next twelve months.
Working Capital. We generated cash flow from operations of $819.0 million in the first quarter of 2022 compared to $262.2 million in the same 2021 period. Operational working capital (representing amounts invested in trade receivables and inventories, less current liabilities other than income taxes payable and debt) increased $757.2 million, or 23%, to $4.1 billion at March 31, 2022, due primarily to increased accounts receivable, consistent with increased net sales, and funding of the $359.8 million in 2021 company-wide profit sharing.
Capital Investments. During the first quarter of 2022, we invested $159.3 million in property, plant and equipment, primarily within our steel operations segment, compared with $309.9 million invested during the same period in 2021. Spending on the Southwest-Sinton Flat Roll Steel Division decreased in the first quarter of 2022 versus the same period in 2021 as we near completion of the construction phase. We entered 2022 with ample liquidity of $2.4 billion to provide for our currently planned 2022 capital requirements.
Cash Dividends. As a reflection of continued confidence in our current and future cash flow generation ability and financial position, we increased our quarterly cash dividend by 31% to $0.34 per share in the first quarter of 2022 (from $0.26 per share in 2021), resulting in declared cash dividends of $64.3 million during the first quarter of 2022, compared to $54.9 million during the same period in 2021. We paid cash dividends of $50.7 million and $52.7 million during the first quarters of 2022 and 2021, respectively. Our board of directors, along with executive management, approves the payment of dividends on a quarterly basis. The determination to pay cash dividends in the future is at the discretion of our board of directors, after taking into account various factors, including our financial condition, results of operations, outstanding indebtedness, current and anticipated cash needs and growth plans.
Other. In February 2020, our board of directors authorized a share repurchase program of up to $500.0 million of our common stock, which was fully utilized in July 2021. In July 2021, our board of directors authorized an additional share repurchase program of up to $1.0 billion of our common stock, which was fully utilized in March 2022. In February 2022, our board of directors authorized an additional share repurchase program of up to $1.25 billion of our common stock. Under the share repurchase programs, purchases take place as and when we determine in open market or private transactions made based upon the market price of our common stock, the nature of other investment opportunities or growth projects, our cash flows from operations, and general economic conditions. The share repurchase programs do not require us to acquire any specific number of shares, and may be modified, suspended, extended or terminated by us at any time. The share repurchase programs do not have an expiration date. There were $389.2 million of share repurchases during the first quarter of 2022 and none during the same period in 2021. As of March 31, 2022, we had $1.24 billion remaining available to purchase under the 2022 share repurchase program.
Our ability to meet our debt service obligations and reduce our total debt will depend upon our future performance which, in turn, will depend upon general economic, financial, and business conditions, along with competition, legislation and regulatory factors that are largely beyond our control. In addition, we cannot assure that our operating results, cash flows, access to credit markets and capital resources will be sufficient for repayment of our indebtedness in the future. We believe that based upon current levels of operations and anticipated growth, cash flows from operations, together with other available sources of funds, including borrowings under our Revolver, if necessary, will be adequate for the next twelve months for making required payments of principal and interest on our indebtedness, funding working capital requirements, and funding anticipated capital expenditures.
20
ITEM 3. QUANTITATIVE AND QUALITATIVE DISCLOSURES ABOUT MARKET RISK
Commodity Risk
In the normal course of business, we are exposed to the market risk and price fluctuations related to the sale of our products and to the purchase of raw materials used in our operations, such as metallic raw materials, electricity, natural gas and its transportation services, fuel, air products, zinc, and electrodes. Our risk strategy associated with product sales has generally been to obtain competitive prices for our products and to allow operating results to reflect market price movements dictated by supply and demand.
Our risk strategy associated with the purchase of raw materials utilized within our operations has generally been to make some commitments with suppliers relating to future expected requirements for some commodities such as electricity, water, natural gas and its transportation services, fuel, air products, zinc, and electrodes. Certain of these commitments contain provisions which require us to “take or pay” for specified quantities without regard to actual usage for periods of generally up to 5 years for physical commodity requirements and commodity transportation requirements, with some extending beyond, and for up to 16 years for air products and 30 years for water products. We utilized such “take or pay” requirements during the past three years under these contracts, except for certain air products at our idle Minnesota ironmaking operations. We believe that production requirements will be such that consumption of the products or services purchased under these commitments will occur in the normal production process, other than certain air products related to our idled Minnesota ironmaking operations.
In our metals recycling and steel operations, we have certain fixed price contracts with various customers and suppliers for future delivery of nonferrous and ferrous metals. Our risk strategy has been to enter into base metal financial contracts with the goal to protect the profit margin, within certain parameters, that was contemplated when we entered into the transaction with the customer or vendor. At March 31, 2022, we had a cumulative unrealized gain associated with these financial contracts of $7.7 million, substantially all of which have a settlement date within the next twelve months. We believe the customer contracts associated with the financial contracts will be fully consummated.
ITEM 4. CONTROLS AND PROCEDURES
| (a) | Evaluation of Disclosure Controls and Procedures |
As required, we carried out an evaluation, under the supervision and with the participation of our principal executive officer and principal financial officer, of the effectiveness of our disclosure controls and procedures, as defined in rules 13a-15(e) and 15d-15(e) under the Securities Exchange Act of 1934, as amended (the Exchange Act). Based on this evaluation, our principal executive officer and principal financial officer concluded that, as of March 31, 2022, the end of the period covered by this quarterly report, our disclosure controls and procedures were designed to provide and were effective to provide reasonable assurance that the information required to be disclosed by us in the reports we file or submit under the Exchange Act is recorded, processed, summarized and reported within the time periods specified in the applicable rules and forms, and that it is accumulated and communicated to our management, including our principal executive and principal financial officers, as appropriate to allow timely decisions regarding required disclosure.
| (b) | Changes in Internal Controls Over Financial Reporting |
No changes in our internal control over financial reporting (as defined in Rules 13a-15(f) and 15d-15(f) under the Exchange Act) occurred during the fiscal quarter ended March 31, 2022, that has materially affected, or is reasonably likely to materially affect, our internal control over financial reporting.
21
PART II OTHER INFORMATION
ITEM 1. LEGAL PROCEEDINGS
We are involved in various litigation matters, including administrative proceedings, regulatory proceedings, governmental investigations, environmental matters, and commercial and construction contract disputes, none of which are currently expected to have a material impact on our financial condition, results of operations, or liquidity.
We may also be involved from time to time in various governmental investigations, regulatory proceedings or judicial actions seeking penalties, injunctive relief, and/or remediation under federal, state and local environmental laws and regulations. The United States EPA has conducted such investigations and proceedings involving us, in some instances along with state environmental regulators, under various environmental laws, including RCRA, CERCLA, the Clean Water Act and the Clean Air Act. Some of these matters have resulted in fines or penalties, exclusive of interest and costs, which did not exceed $1 million in aggregate, as of March 31, 2022.
ITEM 1A. RISK FACTORS
No material changes have occurred to the indicated risk factors as disclosed in our Annual Report on Form 10-K for the year ended December 31, 2021.
ITEM 2. UNREGISTERED SALES OF EQUITY SECURITIES AND USE OF PROCEEDS
(c) Issuer Purchases of Equity Securities
We purchased the following equity securities registered by us pursuant to Section 12 of the Exchange Act during the three-month period ended March 31, 2022.
Period | Total Number of Shares Purchased | Average Price Paid per Share | Total Number of Shares Purchased as Part of Publicly Announced Programs (1) (2) | Maximum Dollar Value of Shares That May Yet be Purchased Under the Programs | |||||||||
Quarter ended March 31, 2022 | |||||||||||||
January 1 - 31 | 1,454,259 | $ | 55.14 | 1,454,259 | $ | 303,190 | |||||||
February 1 - 28 | 3,420,039 | 61.70 | 3,420,039 | 1,342,188 | |||||||||
March 1 - 31 | 1,283,121 | 76.38 | 1,283,121 | 1,244,189 | |||||||||
6,157,419 | 6,157,419 | ||||||||||||
| (1) | On July 6, 2021, we announced that our board of directors had authorized a share purchase program of up to $1.0 billion of our common stock. This program was completed in March 2022. |
| (2) | On February 25, 2022, we announced that our board of directors had authorized an additional share purchase program of up to $1.25 billion of our common stock. |
ITEM 3. DEFAULTS UPON SENIOR SECURITIES
None.
ITEM 4. MINE SAFETY DISCLOSURES
Information required to be furnished pursuant to Item 4 concerning mine safety disclosure matters by Section 1503(a) of the Dodd-Frank Wall Street Reform and Consumer Protection Act and Item 104 of Regulation S-K (17 CFR 229.104), is included in Exhibit 95 to this quarterly report.
22
ITEM 6. EXHIBITS
Reference is made to the Exhibit Index preceding the signature page hereto, which Exhibit Index is hereby incorporated into this item.
EXHIBIT INDEX
Articles of Incorporation | |
3.1 | |
3.2 | |
Executive Officer Certifications | |
31.1* | |
31.2* | |
32.1* | |
32.2* | |
Other | |
95* | |
XBRL Documents | |
101.INS* | XBRL Instance Document - the instance document does not appear in the Interactive Data File because its XBRL tags are embedded within the Inline XBRL document. |
101.SCH* | Inline XBRL Taxonomy Extension Schema Document |
101.CAL* | Inline XBRL Taxonomy Extension Calculation Document |
101.DEF* | Inline XBRL Taxonomy Definition Document |
101.LAB* | Inline XBRL Taxonomy Extension Label Document |
101.PRE* | Inline XBRL Taxonomy Presentation Document |
104* | Cover Page Interactive Data File (formatted as Inline XBRL and contained in Exhibit 101) |
* | Filed concurrently herewith |
24
SIGNATURE
Pursuant to the requirements of the Securities Exchange Act of 1934, the registrant has duly caused this report to be signed on its behalf by the undersigned, thereunto duly authorized.
April 29, 2022 | ||
| ||
STEEL DYNAMICS, INC. | ||
By: | /s/ Theresa E. Wagler | |
Theresa E. Wagler | ||
Executive Vice President and Chief Financial Officer | ||
(Principal Financial Officer and Principal Accounting Officer) |
25
Serious News for Serious Traders! Try StreetInsider.com Premium Free!
You May Also Be Interested In
- Steel Dynamics (STLD) Tops Q1 EPS by 16c
- PMD Device Solutions Publishes 2023 Annual Report
- Transaction in Own Shares
Create E-mail Alert Related Categories
SEC FilingsSign up for StreetInsider Free!
Receive full access to all new and archived articles, unlimited portfolio tracking, e-mail alerts, custom newswires and RSS feeds - and more!
