

Form 10-Q Jones Lang LaSalle Incom For: Mar 31
 Tweet
Tweet Share
ShareUNITED STATES
SECURITIES AND EXCHANGE COMMISSION
Washington, D.C. 20549
_________________________________
FORM 10-Q
_________________________________
| QUARTERLY REPORT PURSUANT TO SECTION 13 OR 15(d) OF THE SECURITIES EXCHANGE ACT OF 1934 | |||||
For the quarterly period ended March 31, 2022
OR
| TRANSITION REPORT PURSUANT TO SECTION 13 OR 15(d) OF THE SECURITIES EXCHANGE ACT OF 1934 | |||||
For the transition period from to
Commission file number: 000-51948
_________________________________

(Exact name of registrant as specified in its charter)
_________________________________
| (State or other jurisdiction of incorporation or organization) | (I.R.S. Employer Identification Number) | |||||||
(Address of principal executive offices, including Zip Code)
(312 ) 897-4000
(Registrant’s telephone number, including area code)
N/A
(Former name or former address, if changed since last report)
_________________________________
Securities registered pursuant to Section 12(b) of the Act: None
Indicate by check mark whether the registrant (1) has filed all reports required to be filed by Section 13 or 15(d) of the Securities Exchange Act of 1934 during the preceding 12 months (or for such shorter period that the registrant was required to file such reports), and (2) has been subject to such filing requirements for the past 90 days. Yes ☑ NO ☐
Indicate by check mark whether the registrant has submitted electronically every Interactive Data File required to be submitted pursuant to Rule 405 of Regulation S-T (§232.405 of this chapter) during the preceding 12 months (or for such shorter period that the registrant was required to submit such files). Yes ☑ NO ☐
Indicate by check mark whether the registrant is a large accelerated filer, an accelerated filer, a non-accelerated filer, a smaller reporting company, or an emerging growth company. See definitions of "large accelerated filer," "accelerated filer," "smaller reporting company" and "emerging growth company" in Rule 12b-2 of the Exchange Act.
| Large accelerated filer | ☐ | Accelerated filer | ☐ | |||||||||||||||||
| ☑ | Smaller reporting company | |||||||||||||||||||
| Emerging growth company | ||||||||||||||||||||
If an emerging growth company, indicate by check mark if the registrant has elected not to use the extended transition period for complying with any new or revised financial accounting standards provided pursuant to Section 13(a) of the Exchange Act. ☐
Indicate by check mark whether the registrant is a shell company (as defined in Rule 12b-2 of the Exchange Act). YES ☐ NO ☑
The number of shares of the registrant’s Common Stock, $.01 par value, outstanding on May 16, 2022 were 105,696,898 shares of Class A Common Stock, 23,755,997 shares of Class M Common Stock, 5,930,623 shares of Class A-I Common Stock, 84,744,571 shares of Class M-I Common Stock and 6,041,611 shares of Class D Common Stock.
Jones Lang LaSalle Income Property Trust, Inc.
INDEX
| PAGE NUMBER | |||||
2
Item 1. Financial Statements.
Jones Lang LaSalle Income Property Trust, Inc.
CONSOLIDATED BALANCE SHEETS
$ in thousands, except per share amounts
| March 31, 2022 | December 31, 2021 | ||||||||||
| ASSETS | (Unaudited) | ||||||||||
| Investments in real estate: | |||||||||||
Land (including from VIEs of $ | $ | $ | |||||||||
Buildings and equipment (including from VIEs of $ | |||||||||||
Less accumulated depreciation (including from VIEs of $( | ( | ( | |||||||||
| Net property and equipment | |||||||||||
| Investment in unconsolidated real estate affiliates | |||||||||||
| Real estate fund investments | |||||||||||
| Investments in real estate and other assets held for sale | |||||||||||
| Net investments in real estate | |||||||||||
| Investment in marketable securities | |||||||||||
Cash and cash equivalents (including from VIEs of $ | |||||||||||
Restricted cash (including from VIEs of $ | |||||||||||
Tenant accounts receivable, net (including from VIEs of $ | |||||||||||
Deferred expenses, net (including from VIEs of $ | |||||||||||
Acquired intangible assets, net (including from VIEs of $ | |||||||||||
Deferred rent receivable, net (including from VIEs of $ | |||||||||||
Prepaid expenses and other assets (including from VIEs of $ | |||||||||||
| TOTAL ASSETS | $ | $ | |||||||||
| LIABILITIES AND EQUITY | |||||||||||
Mortgage notes and other debt payable, net (including from VIEs of $ | $ | $ | |||||||||
| Liabilities held for sale | |||||||||||
Accounts payable and other liabilities (including from VIEs of $ | |||||||||||
| Financing obligation | |||||||||||
| Accrued offering costs | |||||||||||
Accrued interest (including from VIEs of $ | |||||||||||
Accrued real estate taxes (including from VIEs of $ | |||||||||||
| Advisor fees payable | |||||||||||
Acquired intangible liabilities, net (including from VIEs of $ | |||||||||||
| TOTAL LIABILITIES | |||||||||||
| Commitments and contingencies | |||||||||||
| Redeemable noncontrolling interests | |||||||||||
| Equity: | |||||||||||
Class A common stock: $ | |||||||||||
Class M common stock: $ | |||||||||||
Class A-I common stock: $ | |||||||||||
Class M-I common stock: $ | |||||||||||
Class D common stock: $ | |||||||||||
Additional paid-in capital (net of offering costs of $ | |||||||||||
| Distributions to stockholders | ( | ( | |||||||||
| Retained earnings | |||||||||||
| Total Jones Lang LaSalle Income Property Trust, Inc. stockholders’ equity | |||||||||||
| Noncontrolling interests | |||||||||||
| Total equity | |||||||||||
| TOTAL LIABILITIES AND EQUITY | $ | $ | |||||||||
The abbreviation “VIEs” above means consolidated Variable Interest Entities.
See notes to consolidated financial statements.
3
Jones Lang LaSalle Income Property Trust, Inc.
CONSOLIDATED STATEMENTS OF OPERATIONS
$ in thousands, except share and per share amounts
(Unaudited)
| Three Months Ended March 31, 2022 | Three Months Ended March 31, 2021 | ||||||||||
| Revenues: | |||||||||||
| Rental revenue | $ | $ | |||||||||
| Other revenue | |||||||||||
| Total revenues | |||||||||||
| Operating expenses: | |||||||||||
| Real estate taxes | |||||||||||
| Property operating expenses | |||||||||||
| Property general and administrative | |||||||||||
| Advisor fees | |||||||||||
| Company level expenses | |||||||||||
| Depreciation and amortization | |||||||||||
| Total operating expenses | |||||||||||
| Other income (expenses): | |||||||||||
| Interest expense | ( | ( | |||||||||
| Income (loss) from unconsolidated real estate affiliates and fund investments | ( | ||||||||||
| Investment income on marketable securities | |||||||||||
| Net realized gain upon sale of marketable securities | |||||||||||
| Net unrealized change in fair value of investment in marketable securities | ( | ||||||||||
| Gain on disposition of property and extinguishment of debt, net | |||||||||||
| Total other income and (expenses) | |||||||||||
| Net income | |||||||||||
| Less: Net income attributable to the noncontrolling interests | ( | ( | |||||||||
| Net income attributable to Jones Lang LaSalle Income Property Trust, Inc. | $ | $ | |||||||||
| Net income attributable to Jones Lang LaSalle Income Property Trust, Inc. per share-basic and diluted: | |||||||||||
| Class A | |||||||||||
| Class M | |||||||||||
| Class A-I | |||||||||||
| Class M-I | |||||||||||
| Class D | |||||||||||
| Weighted average common stock outstanding-basic and diluted | |||||||||||
See notes to consolidated financial statements.
4
Jones Lang LaSalle Income Property Trust, Inc.
CONSOLIDATED STATEMENTS OF EQUITY
$ in thousands, except share and per share amounts (Unaudited)
| Common Stock | Additional Paid In Capital | Distributions to Stockholders | Retained Earnings / (Accumulated Deficit) | Noncontrolling Interests | Total Equity | ||||||||||||||||||||||||||||||||||||
| Shares | Amount | ||||||||||||||||||||||||||||||||||||||||
| Balance, January 1, 2021 | $ | $ | $ | ( | $ | ( | $ | $ | |||||||||||||||||||||||||||||||||
| Issuance of common stock | — | — | — | ||||||||||||||||||||||||||||||||||||||
| Repurchase of shares | ( | ( | ( | — | — | — | ( | ||||||||||||||||||||||||||||||||||
| Conversion of shares | ( | — | — | — | — | — | |||||||||||||||||||||||||||||||||||
| Offering costs | — | — | ( | — | — | — | ( | ||||||||||||||||||||||||||||||||||
| Stock based compensation | — | — | — | — | |||||||||||||||||||||||||||||||||||||
| Net income | — | — | — | — | |||||||||||||||||||||||||||||||||||||
| Cash distributed to noncontrolling interests | — | — | — | — | — | ( | ( | ||||||||||||||||||||||||||||||||||
Distributions declared per share ($ | — | — | — | ( | — | — | ( | ||||||||||||||||||||||||||||||||||
Balance, March 31, 2021 | $ | $ | $ | ( | $ | $ | $ | ||||||||||||||||||||||||||||||||||
| Balance, January 1, 2022 | $ | $ | $ | ( | $ | $ | $ | ||||||||||||||||||||||||||||||||||
| Issuance of common stock | — | — | — | ||||||||||||||||||||||||||||||||||||||
| Repurchase of shares | ( | ( | ( | — | — | — | ( | ||||||||||||||||||||||||||||||||||
| Conversion of shares | ( | — | — | — | — | — | |||||||||||||||||||||||||||||||||||
| Offering costs | — | — | ( | — | — | — | ( | ||||||||||||||||||||||||||||||||||
| Stock based compensation | — | — | — | — | |||||||||||||||||||||||||||||||||||||
| Net income | — | — | — | — | |||||||||||||||||||||||||||||||||||||
| Cash distributed to noncontrolling interests | — | — | — | — | — | ( | ( | ||||||||||||||||||||||||||||||||||
| Allocation to redeemable noncontrolling interests | — | — | — | — | ( | (3,922) | (6,970) | ||||||||||||||||||||||||||||||||||
Distributions declared per share ($ | — | — | — | ( | — | — | ( | ||||||||||||||||||||||||||||||||||
Balance, March 31, 2022 | $ | $ | $ | ( | $ | $ | $ | ||||||||||||||||||||||||||||||||||
See notes to consolidated financial statements.
5
Jones Lang LaSalle Income Property Trust, Inc.
CONSOLIDATED STATEMENTS OF CASH FLOWS
$ in thousands (Unaudited)
| Three Months Ended March 31, 2022 | Three Months Ended March 31, 2021 | ||||||||||
| CASH FLOWS FROM OPERATING ACTIVITIES: | |||||||||||
| Net income | $ | $ | |||||||||
| Adjustments to reconcile net income to net cash (used in) provided by operating activities: | |||||||||||
| Depreciation and amortization | |||||||||||
| Gain on disposition of property and extinguishment of debt | ( | ( | |||||||||
| Net realized gain upon sale of marketable securities | ( | ||||||||||
| Net unrealized loss in fair value of marketable securities | |||||||||||
| Straight line rent | ( | ( | |||||||||
| (Income) loss from unconsolidated real estate affiliates and fund investments | ( | ||||||||||
| Distributions from unconsolidated real estate affiliates and fund investments | |||||||||||
| Net changes in assets, liabilities and other | ( | ( | |||||||||
| Net cash (used in) provided by operating activities | ( | ||||||||||
| CASH FLOWS FROM INVESTING ACTIVITIES: | |||||||||||
| Purchase of real estate investments | ( | ( | |||||||||
| Proceeds from sale of real estate investments and fixed assets | |||||||||||
| Capital improvements and lease commissions | ( | ( | |||||||||
| Investment in unconsolidated real estate affiliates | ( | ( | |||||||||
| Deposits for investments under contract | ( | ( | |||||||||
| Investment in marketable securities | ( | ||||||||||
| Proceeds from sale of marketable securities | |||||||||||
| Net cash used in investing activities | ( | ( | |||||||||
| CASH FLOWS FROM FINANCING ACTIVITIES: | |||||||||||
| Issuance of common stock | |||||||||||
| Repurchase of shares | ( | ( | |||||||||
| Offering costs | ( | ( | |||||||||
| Distributions to stockholders | ( | ( | |||||||||
| Distributions paid to noncontrolling interests | ( | ( | |||||||||
| Deposits for loan commitments | ( | ||||||||||
| Draws on credit facility | |||||||||||
| Payment on credit facility | ( | ( | |||||||||
| Proceeds from mortgage notes and other debt payable | |||||||||||
| Debt issuance costs | ( | ( | |||||||||
| Payment on early extinguishment of debt | |||||||||||
| Principal payments on mortgage notes and other debt payable | ( | ( | |||||||||
| Net cash provided by financing activities | |||||||||||
| Net increase in cash, cash equivalents and restricted cash | ( | ||||||||||
| Cash, cash equivalents and restricted cash at the beginning of the period | |||||||||||
| Cash, cash equivalents and restricted cash at the end of the period | $ | $ | |||||||||
| Reconciliation of cash, cash equivalents and restricted cash shown per Consolidated Balance Sheets to cash, cash equivalents and restricted cash per Consolidated Statements of Cash Flows | |||||||||||
Cash and cash equivalents | $ | $ | |||||||||
Restricted cash | |||||||||||
| Cash, cash equivalents and restricted cash at the end of the period | $ | $ | |||||||||
| Supplemental disclosure of cash flow information: | |||||||||||
| Interest paid | $ | $ | |||||||||
| Non-cash activities: | |||||||||||
| Write-offs of receivables | $ | ( | $ | ( | |||||||
| Write-offs of retired assets and liabilities | |||||||||||
| Change in liability for capital expenditures | ( | ( | |||||||||
| Net liabilities transferred at disposition of real estate investment | |||||||||||
| Net liabilities assumed at acquisition | |||||||||||
| Change in issuance of common stock receivable and redemption of common stock payable | ( | ( | |||||||||
| Change in accrued offering costs | |||||||||||
6
Jones Lang LaSalle Income Property Trust, Inc.
NOTES TO CONSOLIDATED FINANCIAL STATEMENTS
$ in thousands, except per share amounts
NOTE 1—ORGANIZATION
General
Except where the context suggests otherwise, the terms “we,” “us,” “our” and the “Company” refer to Jones Lang LaSalle Income Property Trust, Inc. The terms “Advisor” and “LaSalle” refer to LaSalle Investment Management, Inc.
Jones Lang LaSalle Income Property Trust, Inc. is an externally advised, daily valued perpetual-life real estate investment trust ("REIT") that owns and manages a diversified portfolio of residential, industrial, office, retail and other properties located in the United States. Over time, our real estate portfolio may be further diversified on a global basis through the acquisition of properties outside of the United States and may be complemented by investments in real estate-related debt and equity securities. We were incorporated on May 28, 2004 under the laws of the State of Maryland. We believe that we have operated in such a manner to qualify to be taxed as a REIT for federal income tax purposes commencing with the taxable year ended December 31, 2004, when we first elected REIT status. As of March 31, 2022, we owned interests in a total of 119 properties and over 4,000 single-family rental houses located in 26 states.
We own all or substantially all of our assets through JLLIPT Holdings, LP, a Delaware limited partnership (our “operating partnership”), of which we are a limited partner and JLLIPT Holdings GP, LLC, our wholly owned subsidiary, is the sole general partner. The use of our operating partnership to hold all or substantially all of our assets is referred to as an Umbrella Partnership Real Estate Investment Trust ("UPREIT"). By using an UPREIT structure, a property owner who desires to defer taxable gain on the disposition of his property may transfer the property to our operating partnership in exchange for limited partnership interests in the operating partnership ("OP Units") and defer taxation of gain until the limited partnership interests are disposed of in a taxable transaction. As of March 31, 2022, we raised aggregate proceeds from the issuance of OP Units in our operating partnership of $88,925 96.8 % of the OP Units of our operating partnership. The remaining 3.2 % of the OP Units are held by third parties.
From our inception to March 31, 2022, we have received approximately $4,210,010 in gross offering proceeds from various public and private offerings of shares of our common stock. On October 1, 2012, we commenced our initial public offering of common stock and since that time we have offered shares of our common stock in various public offerings registered with the Securities and Exchange Commission (the "SEC").
On December 21, 2021, our most recent public offering (the "Current Public Offering") of up to $3,000,000 in any combination of shares of our Class A, Class M, Class A-I and Class M-I common stock was declared effective by the SEC. As of March 31, 2022, we have raised aggregate gross proceeds from the sale of shares of our common stock in our Current Public Offering of $249,802 . We intend to continue to offer shares of our common stock on a continuous basis for an indefinite period of time by filing a new registration statement before the end of each offering.
In addition to our public offerings, on March 3, 2015, we commenced a private offering (the "Private Offering") of up to $350,000 in shares of our Class D common stock with an indefinite duration. As of March 31, 2022, we have raised aggregate gross proceeds of $98,188 . In addition, on October 16, 2019, we, through our operating partnership, initiated a program (the “DST Program”) to raise up to $500,000 , which our board of directors increased to $1,000,000 on August 10, 2021, in private placements exempt from registration under the Securities Act of 1933, as amended, through the sale of beneficial interests to accredited investors in specific Delaware statutory trusts holding real properties ("DST Properties"), which may be sourced from our real properties or from third parties. As of March 31, 2022, we have raised $465,408 from our DST Program.
As of March 31, 2022, 104,576,961 37,681,185 9,335,732 shares of Class A-I common stock, 61,681,208 shares of Class M-I common stock, and 6,041,611 shares of Class D common stock were outstanding and held by a total of 21,336 stockholders.
LaSalle acts as our advisor pursuant to the advisory agreement among us, our operating partnership and LaSalle (the "Advisory Agreement"). The term of our Advisory Agreement expires June 5, 2022, subject to an unlimited number of successive one-year renewals. Our Advisor, a registered investment advisor with the SEC, has broad discretion with respect to our investment decisions and is responsible for selecting our investments and for managing our investment portfolio pursuant to the terms of the Advisory Agreement. Our executive officers are employees of and compensated by our Advisor. We have no employees, as all operations are managed by our Advisor.
7
NOTE 2—SUMMARY OF SIGNIFICANT ACCOUNTING POLICIES
Basis of Presentation and Principles of Consolidation
The accompanying consolidated financial statements have been prepared in accordance with U.S. generally accepted accounting principles (“GAAP”), the instructions to Form 10-Q and Rule 10-01 of Regulation S-X and include the accounts of our wholly owned subsidiaries, consolidated variable interest entities ("VIE") and the unconsolidated investment in real estate affiliates accounted for under the equity method of accounting. We consider the authoritative guidance of accounting for investments in common stock, investments in real estate ventures, investors accounting for an investee when the investor has the majority of the voting interest but the minority partners have certain approval or veto rights, determining whether a general partner or general partners as a group controls a limited partnership or similar entity when the limited partners have certain rights and the consolidation of VIEs in which we own less than a 100 % interest. All significant intercompany balances and transactions have been eliminated in consolidation.
Parenthetical disclosures are shown on our Consolidated Balance Sheets regarding the amounts of VIE assets and liabilities that are consolidated. As of March 31, 2022, our VIEs included The District at Howell Mill, Grand Lakes Marketplace, Presley Uptown, 237 Via Vera Cruz, 4211 Starboard Drive, 13500 Danielson Drive, 2840 Loker Ave, and 15890 Bernardo Center Drive due to the joint venture structures and our partners having limited participation rights and no kick-out rights. The creditors of our VIEs do not have general recourse to us.
Noncontrolling interests represent the minority members’ proportionate share of equity. At acquisition, the assets, liabilities and noncontrolling interests were measured and recorded at the estimated fair value. Noncontrolling interests will increase for the minority members’ share of net income of these entities and contributions and decrease for the minority members’ share of net loss and distributions. As of March 31, 2022, noncontrolling interests represented the minority members’ proportionate share of the equity of The District at Howell Mill and the operating partnership.
Redeemable noncontrolling interests represent noncontrolling interests which are redeemable at the option of the holder or in circumstances out of our control and therefore are accounted for as temporary equity. The carrying amount of the redeemable noncontrolling interests is adjusted over time on an accretive basis to reflect the fair value at the time the noncontrolling interest become redeemable by the holder. Changes in the redemption value of redeemable noncontrolling interest are recorded as an allocation of retained earnings on our Consolidated Statements of Equity. During the three months ended March 31, 2022, we recorded an allocation from noncontrolling interests to redeemable noncontrolling interests in the amount of $3,922. We have redeemable noncontrolling interest related to Grand Lakes Marketplace, Presley Uptown, 237 Via Vera Cruz, 4211 Starboard Drive, 13500 Danielson Drive, 2840 Loker Ave, and 15890 Bernardo Center Drive as of March 31, 2022. As of March 31, 2022, $6,970 related to these third party joint ventures was included in Redeemable noncontrolling interests on our Consolidated Balance Sheet of which $2,870 is immediately puttable by the holder of the noncontrolling interest.
The accompanying unaudited interim consolidated financial statements have been prepared in accordance with the accounting policies described in the consolidated financial statements and related notes included in our Annual Report on Form 10-K filed with the SEC on March 11, 2022 (our “2021 Form 10-K”) and should be read in conjunction with such consolidated financial statements and related notes. The following notes to these interim consolidated financial statements highlight changes to the notes included in the December 31, 2021 audited consolidated financial statements included in our 2021 Form 10-K and present interim disclosures as required by the SEC.
8
Restricted Cash
Restricted cash includes amounts established pursuant to various agreements for loan escrow accounts, loan commitments and property sale proceeds. When we sell a property, we can elect to enter into a like-kind exchange pursuant to the applicable Internal Revenue Service guidance whereby the proceeds from the sale are placed in escrow with a qualified intermediary until a replacement property can be purchased. At March 31, 2022, our restricted cash balance on our Consolidated Balance Sheets was primarily related to common stock subscriptions received in advance of the issuance of the common stock and loan escrow amounts.
Deferred Expenses
Deferred expenses consist of lease commissions. Lease commissions are capitalized and amortized over the term of the related lease as a component of depreciation and amortization expense. Accumulated amortization of deferred expenses at March 31, 2022 and December 31, 2021 was $8,528 and $8,436 , respectively.
Acquisitions
We have allocated a portion of the purchase price of our acquisitions to acquired intangible assets, which include acquired in-place lease intangibles, acquired above-market in-place lease intangibles and acquired ground lease intangibles, which are reported net of accumulated amortization of $102,523 and $102,842 at March 31, 2022 and December 31, 2021, respectively, on the accompanying Consolidated Balance Sheets. The acquired intangible liabilities represent acquired below-market in-place leases, which are reported net of accumulated amortization of $15,445 and $15,481 at March 31, 2022 and December 31, 2021, respectively, on the accompanying Consolidated Balance Sheets.
Assets and Liabilities Measured at Fair Value
The Financial Accounting Standards Board’s (“FASB”) guidance for fair value measurement and disclosure states that fair value is an exit price, representing the amount that would be received to sell an asset or paid to transfer a liability in an orderly transaction between market participants. As such, fair value is a market-based measurement that should be determined based on assumptions that market participants would use in pricing an asset or liability. As a basis for considering assumptions, authoritative guidance establishes a three-tier fair value hierarchy, which prioritizes the inputs used in measuring fair value as follows:
•Level 1—Inputs are quoted prices (unadjusted) in active markets for identical assets or liabilities that we have access to at the measurement date.
•Level 2—Observable inputs, other than quoted prices included in Level 1 that are observable for the asset or liability, either directly or indirectly. Level 2 inputs are those in markets for which there are few transactions, the prices are not current, little public information exists or instances where prices vary substantially over time or among brokered market makers.
•Level 3—Unobservable inputs for the asset or liability. Unobservable inputs are those inputs that reflect our own assumptions that market participants would use to price the asset or liability based on the best available information.
The authoritative guidance requires the disclosure of the fair value of our financial instruments for which it is practicable to estimate that value. The guidance does not apply to all balance sheet items. Market information as available or present value techniques have been utilized to estimate the amounts required to be disclosed. Since such amounts are estimates, there can be no assurance that the disclosed value of any financial instrument could be realized by immediate settlement of the instrument.
9
Our investments in marketable securities are valued using Level 1 inputs as the securities are publicly traded on major stock exchanges.
Real estate fund investments accounted for under the fair value option fall within Level 3 of the hierarchy. The fair value is recorded based upon changes in the NAV of the limited partnership as determined from the financial statements of the real estate fund. During the three months ended March 31, 2022 and 2021, we recorded a net increase in fair value classified within the Level 3 category of $23,908 and $1,081 , respectively, which related to our investments in the NYC Retail Portfolio (as defined below) and the Single-family Rental Portfolio (see Note 4-Unconsolidated Real Estate Affiliates and Fund Investments).
We have estimated the fair value of our mortgage notes and other debt payable reflected on the Consolidated Balance Sheets at amounts that are based upon an interpretation of available market information and valuation methodologies (including discounted cash flow analysis with regard to fixed rate debt) for similar loans made to borrowers with similar credit ratings and for the same maturities. The fair value of our mortgage notes and other debt payable using Level 2 inputs was $67,899 lower and $3,794 higher than the aggregate carrying amounts at March 31, 2022 and December 31, 2021, respectively. Such fair value estimates are not necessarily indicative of the amounts that would be realized upon disposition of our mortgage notes payable.
Derivative Financial Instruments
We record all derivatives on the Consolidated Balance Sheets at fair value in prepaid expenses and other assets or accounts payable and other accrued expenses. Changes in the fair value of our derivatives are recorded as a component of interest expense on our Consolidated Statements of Operations as we have not designated our derivative instruments as hedges. Our objective in using interest rate derivatives is to manage our exposure to interest rate movements. To accomplish this objective, we use interest rate swaps.
As of March 31, 2022, we had the following outstanding interest rate derivatives related to managing our interest rate risk:
Interest Rate Derivative | Number of Instruments | Notional Amount | ||||||||||||
| Interest Rate Swaps | $ | |||||||||||||
The fair value of our interest rate swaps represent liabilities of $595 and $2,580 at March 31, 2022 and December 31, 2021, respectively.
Investment in Marketable Securities
In accordance with our investment guidelines, investments in marketable securities consist of stock of publicly traded REITs. The net unrealized change in the fair value of our investments in marketable securities is recorded in earnings as part of net income in accordance with Accounting Standard Update ("ASU") 2016-1, Financial Statements - Overall (Subtopic 825-10) - Recognition and Measurement of Financial Assets and Financial Liabilities.
Ground Lease
As of March 31, 2022, we have a single ground lease arrangement for which we are the lessee and recorded a right-of-use asset within prepaid expenses and other assets on our Consolidated Balance Sheets in the amount of $2,094 and a lease liability within accounts payable and other liabilities on our Consolidated Balance Sheets in the amount of $2,247 .
Use of Estimates
The preparation of consolidated financial statements in conformity with GAAP requires us to make estimates and assumptions. These estimates and assumptions impact the reported amounts of assets and liabilities and the disclosure of contingent assets and liabilities at the date of the consolidated financial statements and the reported amounts of revenues and expenses during the reporting period. For example, significant estimates and assumptions have been made with respect to useful lives of assets, recoverable amounts of receivables, fair value of derivatives and real estate assets, initial valuations and related amortization periods of deferred costs and intangibles, particularly with respect to property acquisitions. Actual results could differ from those estimates.
10
Recently Issued Accounting Pronouncements
In March 2020, the FASB issued ASU No. 2020-04, Reference Rate Reform (Topic 848) ("ASU 2020-04"), which provides guidance containing practical expedients for reference rate reform related activities that impact debt, leases, derivatives and other contracts. The guidance in ASU 2020-04 is optional and may be elected over time as reference rate reform activities occur. We are evaluating the impact of this guidance.
NOTE 3—PROPERTY
The primary reason we make acquisitions of real estate investments in the industrial, office, residential, retail and other property sectors is to invest capital contributed by stockholders in a diversified portfolio of real estate assets. All references to square footage and units are unaudited.
Acquisitions
On March 30, 2022, we acquired Jefferson Lake Howell, a 384-unit residential property located in Casselberry, Florida for approximately $154,100 . The acquisition was funded with cash on hand and a draw on our Credit Facility (defined below).
We allocated the purchase price for our 2022 acquisition in accordance with authoritative guidance as follows:
2022 Acquisitions | |||||
| Land | $ | ||||
| Building and equipment | |||||
| In-place lease intangible (acquired intangible assets) | |||||
| $ | |||||
| Amortization period for intangible assets and liabilities | |||||
Dispositions
On January 6, 2022, we sold Norfleet Distribution Center, a 702,000 square foot industrial property located in Kansas City, Missouri for approximately $60,375 less closing costs. We recorded a gain on the sale of the property in the amount of approximately $34,186 .
On January 24, 2022, we sold The Edge at Lafayette, a 207,000 square foot student housing apartment property located in Lafayette, Louisiana for approximately $16,500 less closing costs. We recorded a gain on the sale of the property in the amount of approximately $13 .
NOTE 4—UNCONSOLIDATED REAL ESTATE AFFILIATES AND FUND INVESTMENTS
In addition to investments in consolidated properties, we may make investments in real estate, which are classified as unconsolidated real estate affiliates under GAAP. The residential sector includes apartment properties and single-family rental homes.
Unconsolidated Real Estate Affiliates
The following represent our unconsolidated real estate affiliates as of March 31, 2022 and December 31, 2021.
| Carrying Amount of Investment | ||||||||||||||||||||||||||||||||
| Property | Property Type | Location | Acquisition Date | March 31, 2022 | December 31, 2021 | |||||||||||||||||||||||||||
| Chicago Parking Garage | Other | Chicago, IL | December 23, 2014 | $ | $ | |||||||||||||||||||||||||||
| Pioneer Tower | Office | Portland, OR | June 28, 2016 | |||||||||||||||||||||||||||||
| The Tremont | Residential | Burlington, MA | July 19, 2018 | |||||||||||||||||||||||||||||
| The Huntington | Residential | Burlington, MA | July 19, 2018 | |||||||||||||||||||||||||||||
| Siena Suwanee Town Center | Residential | Suwanee, GA | December 15, 2020 | |||||||||||||||||||||||||||||
| Kingston at McLean Crossing | Residential | McLean, VA | December 3, 2021 | |||||||||||||||||||||||||||||
| Total | $ | $ | ||||||||||||||||||||||||||||||
11
Summarized Combined Statements of Operations—Unconsolidated Real Estate Affiliates—Equity Method Investments
| Three Months Ended March 31, 2022 | Three Months Ended March 31, 2021 | ||||||||||
| Total revenues | $ | $ | |||||||||
| Total operating expenses | |||||||||||
| Operating income (loss) | $ | $ | ( | ||||||||
| Interest expense | ( | ||||||||||
| Net income (loss) | $ | $ | ( | ||||||||
Real Estate Fund Investments
NYC Retail Portfolio
On December 8, 2015, a wholly owned subsidiary of ours acquired an approximate 28 % interest in a newly formed limited partnership, Madison NYC Core Retail Partners, L.P., which acquired an approximate 49 % interest in entities that initially owned 15 retail properties located in the greater New York City area (the “NYC Retail Portfolio”), the result of which is that we own an approximate 14 % interest in the NYC Retail Portfolio. The purchase price for such portion was approximately $85,600 including closing costs. As of March 31, 2022, the NYC Retail Portfolio owned eight retail properties totaling approximately 1,940,000 square feet across urban infill locations in Manhattan, Brooklyn, Queens and New Jersey.
At acquisition we made the election to account for our interest in the NYC Retail Portfolio under the fair value option. We have no unfunded commitments. Our investment in the NYC Retail Portfolio is presented on our Consolidated Balance Sheets within real estate fund investments. Changes in the fair value of our investment as well as cash distributions received are recorded on our Consolidated Statements of Operations within income from unconsolidated real estate affiliates and fund investments. As of March 31, 2022 and December 31, 2021, the carrying amount of our investment in the NYC Retail Portfolio was $83,427 and $84,874 , respectively. During the three months ended March 31, 2022, we recorded a decrease in fair value of our investment in the NYC Retail Portfolio of $1,447 and received no cash distributions. During the three months ended March 31, 2021, we recorded an increase in fair value of our investment in the NYC Retail Portfolio of $1,081 and received no cash distributions.
Single-Family Rental Portfolio
On August 5, 2021, we acquired a 47 % interest in a portfolio of approximately 4,000 stabilized single family rental homes located in various markets across the United States, including Atlanta, Dallas, Phoenix, Nashville and Charlotte, among others (the "Single-Family Rental Portfolio"). The portfolio is encumbered by securitized mortgages in a net amount of approximately $760,000 maturing in the fourth quarter of 2025 at a weighted average interest rate of 2.1 %. The equity purchase price of our 47 % interest was approximately $205,000 . We funded the transaction using cash on hand and a draw on our Revolving Credit Facility.
At acquisition we made the election to account for our interest in the Single-Family Rental Portfolio under the fair value option. As of March 31, 2022 and December 31, 2021, the carrying amount of our investment in the Single-Family Rental Portfolio was $293,386 and $268,031 , respectively. During the three months ended March 31, 2022, we recorded an increase in fair value of our investment in the Single-Family Rental Portfolio of $25,355. During the three months ended March 31, 2022, we received distributions of income totaling $2,355 . This cash distribution of income increased income from unconsolidated real estate affiliates and fund investments.
Summarized Statement of Operations—NYC Retail Portfolio Investment and Single-Family Rental Portfolio—Fair Value Option Investment
| Three Months Ended March 31, 2022 | Three Months Ended March 31, 2021 | ||||||||||
| Total revenue | $ | $ | |||||||||
| Net investment income (loss) | ( | ||||||||||
| Net change in unrealized gain on investment in real estate venture | |||||||||||
| Net income | $ | $ | |||||||||
12
NOTE 5—MORTGAGE NOTES AND OTHER DEBT PAYABLE
Mortgage notes and other debt payable have various maturities through 2032 and consist of the following:
Mortgage notes and other debt payable | Maturity Date | Interest Rate | Amount payable as of | |||||||||||||||||||||||
| March 31, 2022 | December 31, 2021 | |||||||||||||||||||||||||
Mortgage notes payable (1) | June 1, 2023 - March 1, 2032 | $ | $ | |||||||||||||||||||||||
| Credit facility | ||||||||||||||||||||||||||
| Revolving line of credit | May 25, 2024 | |||||||||||||||||||||||||
| Bridge loan | June 1, 2022 | |||||||||||||||||||||||||
| Term loans | May 25, 2024 | |||||||||||||||||||||||||
| TOTAL | $ | $ | ||||||||||||||||||||||||
| Net debt discount on assumed debt and debt issuance costs | ( | ( | ||||||||||||||||||||||||
| Mortgage notes and other debt payable, net | $ | $ | ||||||||||||||||||||||||
________
(1) During the three months ending March 31, 2022, we entered into the following new mortgage notes payable:
•On March 1, 2022, we entered into a $55,800 mortgage payable on Reserve at Venice. The mortgage note bears an interest of 2.98 % and matures on March 1, 2032.
•On March 1, 2022, we entered into a $40,000 mortgage payable on Friendship Distribution Center. The mortgage note bears an interest rate of SOFR plus 1.75% (2.03 % at March 31, 2022) and matures on March 1, 2029.
Aggregate future principal payments of mortgage notes and other debt payable as of March 31, 2022 are as follows:
Year | Amount | |||||||
| 2022 | $ | |||||||
| 2023 | ||||||||
| 2024 | ||||||||
| 2025 | ||||||||
| 2026 | ||||||||
| Thereafter | ||||||||
| Total | $ | |||||||
Credit Facility
On May 24, 2021, we entered into a credit agreement providing for a $650,000 revolving line of credit and unsecured term loan (collectively, the “Credit Facility”) with a syndicate of eight lenders led by JPMorgan Chase Bank, N.A., Bank of America, N.A., PNC Capital Markets LLC and Wells Fargo Bank, N.A. The Credit Facility provides us with the ability, from time to time, to increase the size of the Credit Facility up to a total of $800 million, subject to receipt of lender commitments and other conditions. The $650,000 Credit Facility consists of a $415,000 revolving credit facility (the “Revolving Credit Facility”) and a $235,000 term loan (the “Term Loan”). The Revolving Credit Facility contains a sublimit of $25,000 for letters of credit. The primary interest rate for the Revolving Credit Facility is based on LIBOR, plus a margin ranging from 1.40 % to 2.10 %, depending on our total leverage ratio. The primary interest rate for the Term Loan is based on LIBOR, plus a margin ranging from 1.35 % to 2.05 %, depending on our total leverage ratio. The maturity date of the Revolving Credit Facility and the Term Loan is May 24, 2024 . Based on our current total leverage ratio, we can elect to borrow at LIBOR plus 1.45% and LIBOR plus 1.40% for the Revolving Credit Facility and Term Loan, respectively, or alternatively, we can choose to borrow at a “base rate” equal to (i) the highest of (a) the Federal Funds Rate plus 0.5%, (b) the prime rate announced by JPMorgan Chase Bank, N.A., and (c) LIBOR plus 1.0%, plus (ii) a margin ranging from 0.40% to 1.10% for base rate loans under the Revolving Credit Facility or a margin ranging from 0.35% to 1.05% for base rate loans under the Term Loan. If the “base rate” is less than 1.0%, it will be deemed to be 1.0% for purposes of the Credit Facility. We intend to use the Revolving Credit Facility to cover short-term capital needs, for new property acquisitions and working capital. We may not draw funds on our Credit Facility if we (i) experience a material adverse effect, which is defined to include, among other things, (a) a material adverse effect on the
13
business, assets, operations or financial condition of the Company taken as a whole; (b) the inability of any loan party to perform any of its obligations under any loan document; or (c) a material adverse effect upon the validity or enforceability of any loan document or (ii) are in default, as that term is defined in the agreement, including a default under certain other loan agreements and/or guarantees entered into by us or our subsidiaries. As of March 31, 2022, we believe no material adverse effects had occurred. The Credit Facility provides for alternative rate benchmarks in the event that LIBOR is no longer appropriate or available.
On December 10, 2021, we entered into an additional $100,000 short-term bridge loan (the "Bridge Loan") with JPMorgan Chase Bank, N.A. under the same terms as our Credit Facility. The Bridge Loan bears interest at the secured overnight financing rate ("SOFR") plus 1.45% to 2.15% depending on our total leverage ratio. The maturity date of the Bridge Loan is June 10, 2022 and has two, three month extension options. Based on our current total leverage ratio, this borrowing is priced at SOFR plus 1.70%.
Borrowings under the Credit Facility are guaranteed by us and certain of our subsidiaries. The Credit Facility requires the maintenance of certain financial covenants, including: (i) unencumbered property pool leverage ratio; (ii) debt service coverage ratio; (iii) maximum total leverage ratio; (iv) fixed charges coverage ratio; (v) minimum NAV; (vi) maximum secured debt ratio; (vii) maximum secured recourse debt ratio; (viii) maximum permitted investments; and (ix) unencumbered property pool criteria. The Credit Facility provides the flexibility to move assets in and out of the unencumbered property pool during the term of the Credit Facility.
At March 31, 2022, we had $205,000 outstanding under the Revolving Credit Facility at LIBOR + 1.65%, $235,000 outstanding under the Term Loan at LIBOR + 1.60 %, and $100,000 outstanding under the Bridge Loan at SOFR +1.70%. We swapped the LIBOR portion on $190,000 of our Term Loan to a blended fixed rate of 1.93 % (all in rate of 3.53 % at March 31, 2022) and swapped $90,000 of the Revolving Credit Facility to a fixed rate of 2.64 % (all in rate of 4.04 % at March 31, 2022). The interest rate swap agreements have maturity dates ranging from May 26, 2022 through February 17, 2023.
Covenants
At March 31, 2022, we were in compliance with all debt covenants.
Debt Issuance Costs
14
NOTE 6—COMMON STOCK
We have five classes of common stock: Class A, Class M, Class A-I, Class M-I, and Class D. The fees payable to LaSalle Investment Management Distributors, LLC, an affiliate of our Advisor and the dealer manager for our offerings (the "Dealer Manager"), with respect to each outstanding share of each class, as a percentage of NAV, are as follows:
Selling Commission (1) | Dealer Manager Fee (2) | |||||||||||||
| Class A Shares | up to 3.0% | 0.85% | ||||||||||||
| Class M Shares | — | 0.30% | ||||||||||||
| Class A-I Shares | up to 1.5% | 0.30% | ||||||||||||
| Class M-I Shares | — | None | ||||||||||||
Class D Shares (3) | up to 1.0% | None | ||||||||||||
________
(1) Selling commissions are paid on the date of sale of our common stock.
(2) We accrue all future dealer manager fees up to the ten percent regulatory limitation as accrued offering costs on our Consolidated Balance Sheets on the date of sale of our common stock. For NAV calculation purposes, dealer manager fees are accrued daily, on a continuous basis equal to 1/365th of the stated fee. Each Class A, Class M and Class A-I share sold in a public offering will automatically convert into the number of Class M-I shares based on the then-current applicable NAV of each class on the date following the termination of the primary portion of such public offering in which we, with the assistance of the Dealer Manager, determine that total underwriting compensation paid with respect to such public offering equals 10% of the gross proceeds from the primary portion of such public offering.
(3) Shares of Class D common stock are only being offered pursuant to a private offering.
Stock Transactions
The stock transactions for each of our classes of common stock for the three months ended March 31, 2022 were as follows:
Shares of Class A Common Stock | Shares of Class M Common Stock | Shares of Class A-I Common Stock | Shares of Class M-I Common Stock | Shares of Class D Common Stock | |||||||||||||||||||||||||
Balance, December 31, 2021 | |||||||||||||||||||||||||||||
| Issuance of common stock | |||||||||||||||||||||||||||||
| Repurchase of common stock | ( | ( | ( | ( | ( | ||||||||||||||||||||||||
| Share conversions | ( | ( | |||||||||||||||||||||||||||
Balance, March 31, 2022 | |||||||||||||||||||||||||||||
Stock Issuances
The stock issuances for our classes of common stock, including those issued through our distribution reinvestment plan, for the three months ended March 31, 2022 were as follows:
| Three Months Ended March 31, 2022 | ||||||||||||||
# of shares | Amount | |||||||||||||
| Class A Shares | $ | |||||||||||||
| Class M Shares | ||||||||||||||
| Class A-I Shares | ||||||||||||||
| Class M-I Shares | ||||||||||||||
| Class D Shares | ||||||||||||||
| Total | $ | |||||||||||||
15
Share Repurchase Plan
Our share repurchase plan allows stockholders, subject to a one-year holding period, with certain exceptions, to request that we repurchase all or a portion of their shares of common stock on a daily basis at that day's NAV per share, limited to 5 % of aggregate Company NAV per quarter. For the three months ended March 31, 2022, we repurchased 3,012,118 shares of common stock in the amount of $41,266 . During the three months ended March 31, 2021, we repurchased 3,830,592 shares of common stock in the amount of $44,794 .
Distribution Reinvestment Plan
Pursuant to our distribution reinvestment plan, holders of shares of any class of our common stock may elect to have their cash distributions reinvested in additional shares of our common stock at the NAV per share applicable to the class of shares being purchased on the distribution date. For the three months ended March 31, 2022, we issued 1,217,520 shares of common stock for $17,666 under the distribution reinvestment plan. For the three months ended March 31, 2021, we issued 1,161,954 shares of common stock for $13,734 under the distribution reinvestment plan.
Operating Partnership Units
In connection with the acquisitions of Siena Suwanee Town Center and South San Diego Distribution Center, we issued 7,037,257 OP Units to third parties for a total of $88,925 . After a one-year holding period, holders of OP Units generally have the right to cause the operating partnership to redeem all or a portion of their OP Units for, at our sole discretion, shares of our common stock, cash, or a combination of both. During the three months ended March 31, 2022 we did not issue any additional OP Units.
Earnings Per Share
We compute net income per share for Class A, Class M, Class A-I, Class M-I and Class D common stock using the two-class method. Our Advisor may earn a performance fee (see Note 9-Related Party Transactions), which may impact the net income of each class of common stock differently. In periods where no performance fee is recognized in our Consolidated Statements of Operations and Comprehensive Income, the net income per share will be the same for each class of common stock.
Basic and diluted net income per share for each class of common stock is computed using the weighted-average number of common shares outstanding during the period for each class of common stock. We have not issued any dilutive or potentially dilutive securities, and thus the basic and diluted net income per share for a given class of common stock is the same for each period presented.
The following table sets forth the computation of basic and diluted net income per share for each of our Class A, Class M, Class A-I, Class M-I and Class D common stock:
| Three Months Ended March 31, 2022 | |||||||||||||||||||||||||||||
Class A | Class M | Class A-I | Class M-I | Class D | |||||||||||||||||||||||||
| Basic and diluted net income per share: | |||||||||||||||||||||||||||||
| Allocation of net income per share before performance fee | $ | $ | $ | $ | $ | ||||||||||||||||||||||||
| Allocation of performance fee | |||||||||||||||||||||||||||||
| Total | $ | $ | $ | $ | $ | ||||||||||||||||||||||||
| Weighted average number of common shares outstanding | |||||||||||||||||||||||||||||
| Basic and diluted net income per share: | $ | $ | $ | $ | $ | ||||||||||||||||||||||||
| Three Months Ended March 31, 2021 | |||||||||||||||||||||||||||||
Class A | Class M | Class A-I | Class M-I | Class D | |||||||||||||||||||||||||
| Basic and diluted net loss per share: | |||||||||||||||||||||||||||||
| Allocation of net loss per share before performance fee | $ | $ | $ | $ | $ | ||||||||||||||||||||||||
| Weighted average number of common shares outstanding | |||||||||||||||||||||||||||||
| Basic and diluted net loss per share: | $ | $ | $ | $ | $ | ||||||||||||||||||||||||
16
17
NOTE 7—DST PROGRAM
On October 16, 2019, we, through our operating partnership, initiated the DST Program, and on August 10, 2021, our board of directors approved an increase to raise up to a total of $1,000,000 in private placements through the sale of beneficial interests in specific Delaware statutory trusts (“DST”) holding DST Properties, which may be sourced from our existing portfolio or from newly acquired properties sourced from third parties. Each DST Property will be leased back by a wholly owned subsidiary of our operating partnership on a long-term basis of up to ten years pursuant to a master lease agreement. The master lease agreements are expected to be guaranteed by our operating partnership. As compensation for the master lease guarantee, our operating partnership will retain a fair market value purchase option giving it the right, but not the obligation, to acquire the beneficial interests in the DST from the investors at any time after two years from the closing of the applicable DST offering in exchange for OP Units or cash, at our discretion.
The sale of beneficial interests in the DST Property will be accounted for as a failed sale-leaseback transaction due to the fair market value purchase option retained by the operating partnership and as such, the property will remain on our books and records. The proceeds received from each DST offering will be accounted for as a financing obligation on the Consolidated Balance Sheets. Upfront costs for legal work and debt placement costs for the DST totaling $2,162 are accounted for as deferred loan costs and are netted against the financing obligation.
Under the master lease, we are responsible for subleasing the DST Property to tenants, for covering all costs associated with operating the underlying DST Property, and for paying base rent to the DST that owns such property. For financial reporting purposes (and not for income tax purposes), the DST Properties are included in our consolidated financial statements, with the master lease rent payments accounted for using the interest method whereby a portion is accounted for as interest expense and a portion is accounted for as a reduction of the outstanding principal balance of the financing obligation. For the three months ended March 31, 2022 and March 31, 2021, we recorded non-cash interest expense related to the master lease in the amounts of $3,824 and $1,350 , respectively. Upon the determination that it is probable that we will exercise the fair market value purchase option, we will recognize additional interest expense or interest income to the financing obligation to account for the difference between the fair value of the property and the outstanding liabilities. We determined that certain properties were probable for exercising the fair market value purchase option and recorded additional non-cash interest expense of $2,567 during the three months ended March 31, 2022. We will remeasure the fair value of these properties at each balance sheet date and adjust the non-cash interest expense recognized over the remaining term of the master lease for any changes in fair value. If we elect to repurchase the property prior to the maturity date of the master lease, we will record the difference between the repurchase amount and the financial obligation as additional non-cash interest expense in the period of repurchase. For financial reporting purposes, the rental revenues and rental expenses associated with the underlying property of each master lease are included in the respective line items on our Consolidated Statements of Operations and Comprehensive Income. The net amount we receive from the underlying DST Properties may be more or less than the amount we pay to the investors in the specific DST and could fluctuate over time.
As of March 31, 2022, we have sold $465,408 in interests related to the DST Program. As of March 31, 2022, the following properties are included in our DST Program:
•The Reserve at Johns Creek,
•Summit at San Marcos,
•Mason Mill Distribution Center,
•San Juan Medical Center,
•The Penfield,
•Milford Crossing,
•Villas at Legacy,
•Montecito Marketplace,
•Whitestown Distribution Center,
•Louisville Airport Distribution Center,
•The Preserve at the Meadows,
•The Rockwell,
•9101 Stony Point Drive,
•Reserve at Venice, and
•Friendship Distribution Center.
18
NOTE 8—RENTALS UNDER OPERATING LEASES
We receive rental income from operating leases. The minimum future rentals from consolidated properties based on operating leases in place at March 31, 2022 are as follows:
| Year | Amount | |||||||
| 2022 | $ | |||||||
| 2023 | ||||||||
| 2024 | ||||||||
| 2025 | ||||||||
| 2026 | ||||||||
| Thereafter | ||||||||
| Total | $ | |||||||
NOTE 9—RELATED PARTY TRANSACTIONS
Pursuant to our Advisory Agreement with LaSalle, we pay a fixed advisory fee of 1.25 % of our NAV calculated daily. The Advisory Agreement allows for a performance fee to be earned for each share class based on the total return of that share class or OP Unit during the calendar year. The performance fee is calculated as 10 % of the return in excess of 7 % per annum. The term of our Advisory Agreement expires June 5, 2023, subject to an unlimited number of successive one year renewals.
Fixed advisory fees for the three months ended March 31, 2022 and 2021 were $9,374 and $6,325 , respectively. Performance fees for the three months ended March 31, 2022 were $8,484 . There were no performance fees for the three months ended March 31, 2021. Included in Advisor fees payable at March 31, 2022 was $3,393 of fixed advisory fee expense and $8,484 of performance fee expense. Included in Advisor fees payable for the year ended December 31, 2021 was $2,998 of fixed advisory fee expense and $36,711 of performance fee expenses.
We pay Jones Lang LaSalle Americas, Inc. (“JLL Americas”), an affiliate of our Advisor, for property management, construction management, leasing, mortgage brokerage and sales brokerage services performed at various properties we own. For the three months ended March 31, 2022 and 2021, we paid JLL Americas $419 and $166 , respectively, for property management and leasing services. During the three months ended March 31, 2022, there were no mortgage brokerage fees paid to JLL Americas. During the three months ended March 31, 2021, we paid JLL Americas $162 in mortgage brokerage fees related to the mortgage note payable for Townlake of Coppell.
We pay the Dealer Manager selling commissions and dealer manager fees in connection with our offerings. For the three months ended March 31, 2022 and 2021, we paid the Dealer Manager selling commissions and dealer manager fees totaling $3,762 and $2,614 , respectively. A majority of the selling commissions and dealer manager fees are reallowed to participating broker-dealers. Included in accrued offering costs, at March 31, 2022 and December 31, 2021, were $152,529 and $135,663 of future dealer manager fees payable, respectively.
As of March 31, 2022 and December 31, 2021, we owed $2,244 and $2,113 , respectively, for organization and offering costs paid by LaSalle (see Note 6-Common Stock). These costs are included in accrued offering costs.
LaSalle Investment Management Distributors, LLC also serves as the dealer manager for the DST Program on a “best efforts” basis. Our taxable REIT subsidiary, which is a wholly owned subsidiary of our operating partnership, will pay the Dealer Manager upfront selling commissions, upfront dealer manager fees and placement fees of up to 5.0 %, 1.0 % and 1.0 %, respectively, of the gross purchase price per unit of beneficial interest sold in the DST Program. All upfront selling commissions and upfront dealer manager fees are reallowed to participating broker-dealers. For the three months ended March 31, 2022 and 2021, the taxable REIT subsidiary paid $125 and $1,027 , respectively, to the Dealer Manager. In addition, the Dealer Manager may receive an ongoing investor servicing fee that is calculated daily on a continuous basis from year to year equal to 1/365th of (a) 0.25% of the total equity of each outstanding unit of beneficial interest for such day, payable by the DSTs; (b) 0.85% of the NAV of each outstanding Class A OP Unit, 0.30% of the NAV of each outstanding Class M OP Unit or 0.30% of the NAV of each outstanding Class A-I OP Unit for such day issued in connection with our operating partnership's fair market value purchase option, payable by our operating partnership; and (c) 0.85% of the NAV of each outstanding Class A share, 0.30% of the NAV of each outstanding Class M share or 0.30% of the NAV of each outstanding Class A-I share for such
19
day issued in connection with the investors' redemption right, payable by us. The investor servicing fee may continue for so long as the investor in the DST Program holds beneficial interests, Class A, Class M and Class A-I OP Units or Class A, Class M and Class A-I shares that were issued in connection with the DST Program. No investor servicing fee will be paid on Class M-I OP Units or Class M-I shares. For the three months ended March 31, 2022 and 2021, the DSTs paid $287 and $126 , respectively, in investor servicing fees to the Dealer Manager in connection with the DST Program.
LaSalle also serves as the manager for the DST Program. Each DST pays the manager a management fee equal to a to-be-agreed upon percentage of the total equity of such DST. For the three months ended March 31, 2022 and 2021, the DSTs paid $184 and $76 , respectively, in management fees to our Advisor in connection with the DST Program.
NOTE 10—COMMITMENTS AND CONTINGENCIES
We are involved in various claims and litigation matters arising in the ordinary course of business, some of which involve claims for damages. Many of these matters are covered by insurance, although they may nevertheless be subject to deductibles or retentions. Although the ultimate liability for these matters cannot be determined, based upon information currently available, we believe the ultimate resolution of such claims and litigation will not have a material adverse effect on our financial position, results of operations or liquidity.
From time to time, we have entered into contingent agreements for the acquisition and financing of properties. Such acquisitions and financings are subject to satisfactory completion of due diligence or meeting certain leasing or occupancy thresholds.
We are subject to fixed ground lease payments on South Beach Parking Garage of $112 per year until September 30, 2024, which will increase every five years thereafter by the lesser of 12% or the cumulative CPI over the previous five year period. We are also subject to a variable ground lease payment calculated as 2.5% of revenue. The lease expires September 30, 2041 and has a ten-year renewal option.
The operating agreement for Grand Lakes Marketplace allows the unrelated third party joint venture partner, owning a 10% interest, to put its interest to us at a market determined value.
The operating agreement for 237 Via Vera Cruz, 13500 Danielson Street, 4211 Starboard, 2840 Loaker Avenue and 15890 Bernardo Center Drive allows the unrelated third party joint venture partner, owning a 5% interest, to put its interest to us at a market determined value starting July 31, 2024.
NOTE 11—SEGMENT REPORTING
20
Industrial | Office | Residential | Retail | Other | Total | ||||||||||||||||||||||||||||||
Assets as of March 31, 2022 | $ | $ | $ | $ | $ | $ | |||||||||||||||||||||||||||||
Assets as of December 31, 2021 | |||||||||||||||||||||||||||||||||||
| Three Months Ended March 31, 2022 | |||||||||||||||||||||||||||||||||||
| Capital expenditures by segment | $ | $ | $ | $ | $ | $ | |||||||||||||||||||||||||||||
| Revenues: | |||||||||||||||||||||||||||||||||||
| Rental revenue | $ | $ | $ | $ | $ | $ | |||||||||||||||||||||||||||||
| Other revenue | |||||||||||||||||||||||||||||||||||
| Total revenues | $ | $ | $ | $ | $ | $ | |||||||||||||||||||||||||||||
| Operating expenses: | |||||||||||||||||||||||||||||||||||
| Real estate taxes | $ | $ | $ | $ | $ | $ | |||||||||||||||||||||||||||||
| Property operating expenses | |||||||||||||||||||||||||||||||||||
| Total segment operating expenses | $ | $ | $ | $ | $ | $ | |||||||||||||||||||||||||||||
| Reconciliation to net income | |||||||||||||||||||||||||||||||||||
| Property general and administrative | $ | ||||||||||||||||||||||||||||||||||
| Advisor fees | |||||||||||||||||||||||||||||||||||
| Company level expenses | |||||||||||||||||||||||||||||||||||
| Depreciation and amortization | |||||||||||||||||||||||||||||||||||
| Total operating expenses | $ | ||||||||||||||||||||||||||||||||||
| Other income and (expenses): | |||||||||||||||||||||||||||||||||||
| Interest expense | ( | ||||||||||||||||||||||||||||||||||
| Gain from unconsolidated real estate affiliates and fund investment | |||||||||||||||||||||||||||||||||||
| Investment income on marketable securities | |||||||||||||||||||||||||||||||||||
| Net realized gain upon sale of marketable securities | |||||||||||||||||||||||||||||||||||
| Net unrealized change in fair value of investment in marketable securities | ( | ||||||||||||||||||||||||||||||||||
| Gain on disposition of property and extinguishment of debt, net | |||||||||||||||||||||||||||||||||||
| Total other income and (expenses) | $ | ||||||||||||||||||||||||||||||||||
| Net income | $ | ||||||||||||||||||||||||||||||||||
Reconciliation to total consolidated assets as of March 31, 2022 | |||||||||||||||||||||||||||||||||||
| Assets per reportable segments | $ | ||||||||||||||||||||||||||||||||||
| Investment in unconsolidated real estate affiliates, real estate fund investments and corporate level assets | |||||||||||||||||||||||||||||||||||
| Total consolidated assets | $ | ||||||||||||||||||||||||||||||||||
Reconciliation to total consolidated assets as of December 31, 2021 | |||||||||||||||||||||||||||||||||||
| Assets per reportable segments | |||||||||||||||||||||||||||||||||||
| Investment in unconsolidated real estate affiliates, real estate fund investments and corporate level assets | |||||||||||||||||||||||||||||||||||
| Total consolidated assets | $ | ||||||||||||||||||||||||||||||||||
21
Industrial | Office | Residential | Retail | Other | Total | ||||||||||||||||||||||||||||||
| Three Months Ended March 31, 2021 | |||||||||||||||||||||||||||||||||||
| Capital expenditures by segment | $ | $ | $ | $ | $ | $ | |||||||||||||||||||||||||||||
| Revenues: | |||||||||||||||||||||||||||||||||||
Rental revenue | $ | $ | $ | $ | $ | $ | |||||||||||||||||||||||||||||
Other revenue | |||||||||||||||||||||||||||||||||||
| Total revenues | $ | $ | $ | $ | $ | $ | |||||||||||||||||||||||||||||
| Operating expenses: | |||||||||||||||||||||||||||||||||||
| Real estate taxes | $ | $ | $ | $ | $ | $ | |||||||||||||||||||||||||||||
| Property operating expenses | |||||||||||||||||||||||||||||||||||
| Total segment operating expenses | $ | $ | $ | $ | $ | $ | |||||||||||||||||||||||||||||
| Reconciliation to net income | |||||||||||||||||||||||||||||||||||
| Property general and administrative | $ | ||||||||||||||||||||||||||||||||||
| Advisor fees | |||||||||||||||||||||||||||||||||||
| Company level expenses | |||||||||||||||||||||||||||||||||||
| Depreciation and amortization | |||||||||||||||||||||||||||||||||||
| Total operating expenses | $ | ||||||||||||||||||||||||||||||||||
| Other income and (expenses): | |||||||||||||||||||||||||||||||||||
| Interest expense | ( | ||||||||||||||||||||||||||||||||||
| Loss from unconsolidated real estate affiliates and fund investment | ( | ||||||||||||||||||||||||||||||||||
| Gain on disposition of property and extinguishment of debt, net | |||||||||||||||||||||||||||||||||||
| Total other income and (expenses) | $ | ||||||||||||||||||||||||||||||||||
| Net Income | $ | ||||||||||||||||||||||||||||||||||
NOTE 12—INVESTMENT IN MARKETABLE SECURITIES
The following is a summary of our investment in marketable securities held as of March 31, 2022 and December 31, 2021, which consisted entirely of stock of publicly traded REITs.
| March 31, 2022 | December 31, 2021 | ||||||||||
| Investment in marketable securities - cost | $ | ||||||||||
| Unrealized gains | |||||||||||
| Unrealized losses | ( | ( | |||||||||
| Net unrealized (loss) gain | ( | ||||||||||
| Investment in marketable securities - fair value | $ | $ | |||||||||
22
NOTE 13—SUBSEQUENT EVENTS
On April 8, 2022, we acquired Northeast Atlanta Distribution Center, a 459,000 square foot industrial property located in Jefferson, GA for approximately $54,100 .
On April 28, 2022, we entered into a credit agreement providing for a $1,000,000 revolving line of credit and unsecured term loan (collectively, the “Credit Facility”) with a syndicate of nine lenders led by JPMorgan Chase Bank, N.A., Bank of America, N.A., PNC Capital Markets LLC, Wells Fargo Securities, LLC and Capital One, National Association. The Credit Facility provides us with the ability, from time to time, to increase the size of the Credit Facility up to a total of $1,300,000, subject to receipt of lender commitments and other conditions. The $1,000,000 Credit Facility consists of a $600,000 revolving credit facility (the “Revolving Credit Facility”) and a $400,000 term loan (the “Term Loan”). The primary interest rate for the Revolving Credit Facility is based on one-month SOFR plus 0.10% (“Adjusted Term SOFR”), plus a margin ranging from 1.30 % to 2.00 %, depending on our total leverage ratio. The primary interest rate for the Term Loan is based on Adjusted Term SOFR, plus a margin ranging from 1.25 % to 1.95 %, depending on our total leverage ratio. The maturity date of the Revolving Credit Facility is April 28, 2025 and the Term Loan is April 28, 2027 . The credit facility contains two, twelve-month extension options at our election. Based on our current total leverage ratio, we can elect to borrow at Adjusted Term SOFR plus 1.35% and Adjusted Term SOFR plus 1.30% for the Revolving Credit Facility and Term Loan, respectively, or alternatively, we can choose to borrow at a “base rate” equal to (i) the highest of (a) the Federal Funds Rate plus 0.5%, (b) the prime rate announced by JPMorgan Chase Bank, N.A., and (c) Adjusted Term SOFR plus 1.0%, plus (ii) a margin ranging from 0.30% to 1.00% for base rate loans under the Revolving Credit Facility or a margin ranging from 0.25% to 0.95% for base rate loans under the Term Loan. If the “base rate” is less than 1.0%, it will be deemed to be 1.0% for purposes of the Credit Facility.
On April 29, 2022, we acquired Flagstaff Medical Center, a 26,000 square foot medical office property located in Flagstaff, AZ for approximately $17,200 .
On May 10, 2022, our board of directors approved a gross dividend for the second quarter of 2022 of $0.14 per share to stockholders of record as of June 28, 2022. The dividend will be paid on or around June 29, 2022. Class A, Class M, Class A-I, Class M-I and Class D stockholders will receive $0.14 per share, less applicable class-specific fees, if any.
On May 10, 2022, we renewed our Advisory Agreement for a one-year term expiring on June 5, 2023, without any other changes.
* * * * * *
23
| Item 2. | Management’s Discussion and Analysis of Financial Condition and Results of Operations. | ||||
$ in thousands, except per share amounts
Cautionary Note Regarding Forward-Looking Statements
This Quarterly Report on Form 10-Q ("Form 10-Q") may contain forward-looking statements within the meaning of Section 21E of the Securities Exchange Act of 1934, as amended (the “Exchange Act”), and Section 27A of the Securities Act of 1933, as amended (the "Securities Act"), regarding, among other things, our plans, strategies and prospects, both business and financial. Forward-looking statements include, but are not limited to, statements that represent our beliefs concerning future operations, strategies, financial results or other developments. Forward-looking statements can be identified by the use of forward-looking terminology such as, but not limited to, “may,” “should,” “expect,” “anticipate,” “estimate,” “would be,” “believe,” or “continue” or the negative or other variations of comparable terminology. Because these forward-looking statements are based on estimates and assumptions that are subject to significant business, economic and competitive uncertainties, many of which are beyond our control or are subject to change, actual results could be materially different. Although we believe that our plans, intentions and expectations reflected in or suggested by these forward-looking statements are reasonable, we cannot assure you that we will achieve or realize these plans, intentions or expectations. Forward-looking statements are inherently subject to risks, uncertainties and assumptions. Readers are cautioned not to place undue reliance on these forward-looking statements, which speak only as of the date this Form 10-Q is filed with the SEC. Except as required by law, we do not undertake to update or revise any forward-looking statements contained in this Form 10-Q. Important factors that could cause actual results to differ materially from the forward-looking statements are disclosed in “Item 1A. Risk Factors,” “Item 1. Business” and “Item 7. Management’s Discussion and Analysis of Financial Condition and Results of Operations” contained in our 2021 Form 10-K and our periodic reports filed with the SEC.
Management Overview
The following Management’s Discussion and Analysis of Financial Condition and Results of Operations (“MD&A”) is intended to help the reader understand our results of operations and financial condition. This MD&A is provided as a supplement to, and should be read in conjunction with, our consolidated financial statements and the accompanying notes to the consolidated financial statements appearing elsewhere in this Form 10-Q. All references to numbered Notes are to specific notes to our consolidated financial statements beginning on page 7 of this Form 10-Q, and the descriptions referred to are incorporated into the applicable portion of this section by reference. References to “base rent” in this Form 10-Q refer to cash payments made under the relevant lease(s), excluding real estate taxes and certain property operating expenses that are paid by us and are recoverable under the relevant lease(s) and exclude adjustments for straight-line rent revenue and above- and below-market lease amortization.
The discussions surrounding our portfolio of properties refer to our Consolidated Properties, including our DST Properties, and our Unconsolidated Properties which can be found below (see Item 2 - Properties).
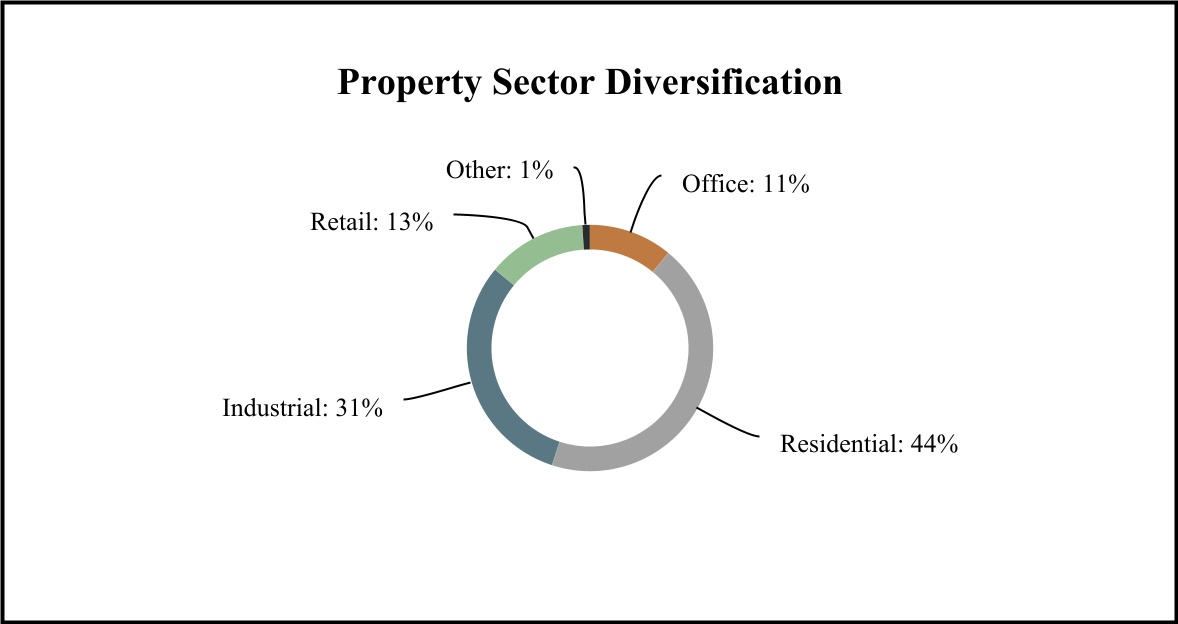
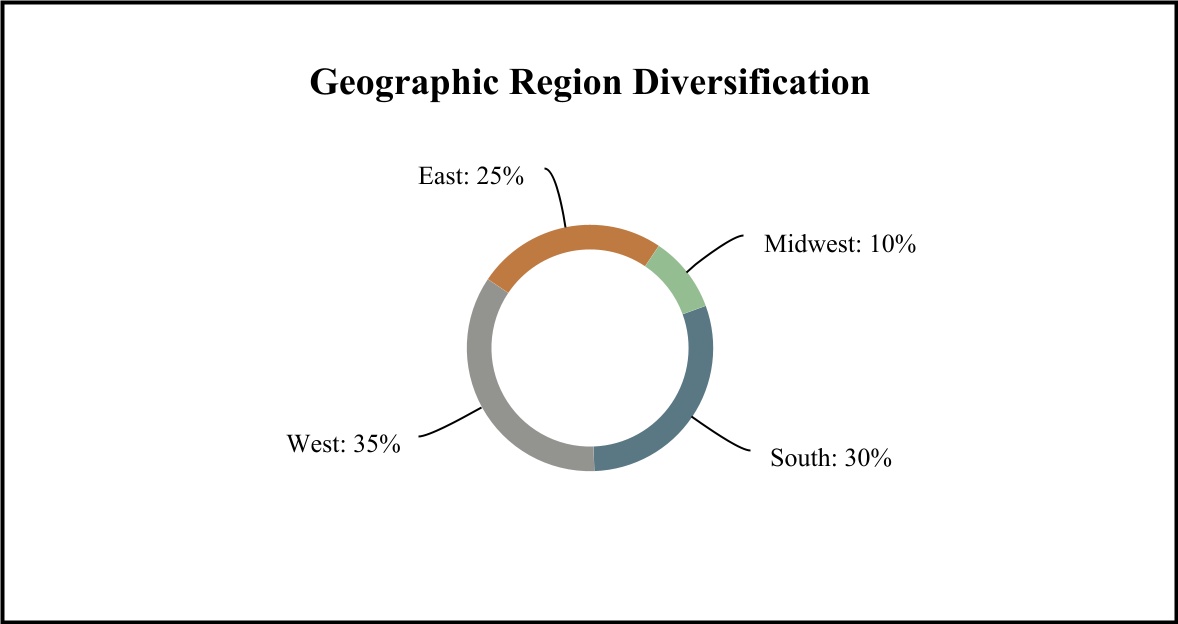
Our primary business is the ownership and management of a diversified portfolio of industrial, office, residential, retail and other properties primarily located in the United States. The residential sector includes apartment properties and single-family rental homes. It is expected that over time our real estate portfolio will be further diversified on a global basis and will be further complemented by investments in real estate-related assets.
We are managed by our Advisor, LaSalle Investment Management, Inc., a subsidiary of our Sponsor, Jones Lang LaSalle Incorporated (NYSE: JLL), a leading global financial and professional services firm that specializes in commercial real estate and investment management. We hire property management and leasing companies to provide the on-site, day-to-day management and leasing services for our properties. When selecting a property management or leasing company for one of our properties, we look for service providers that have a strong local market or industry presence, create portfolio efficiencies, have the ability to develop new business for us and will provide a strong internal control environment that will comply with our Sarbanes-Oxley Act of 2002 internal control requirements. We currently use a mix of property management and leasing service providers that include large national real estate service firms, including an affiliate of our Advisor and smaller local firms.
24
We seek to minimize risk and maintain stability of income and principal value through broad diversification across property sectors and geographic markets and by balancing tenant lease expirations and debt maturities across the real estate portfolio. Our diversification goals also take into account investing in sectors or regions we believe will create returns consistent with our investment objectives. Under normal conditions, we intend to pursue investments principally in well-located, well-leased properties within the industrial, office, residential, retail and other sectors. We expect to actively manage the mix of properties and markets over time in response to changing operating fundamentals within each property sector and to changing economies and real estate markets in the geographic areas considered for investment. When consistent with our investment objectives, we also seek to maximize the tax efficiency of our investments through like-kind exchanges and other tax planning strategies.
The following charts summarize our portfolio diversification by property sector and geographic region based upon the fair value of our properties. These tables provide examples of how our Advisor evaluates our real estate portfolio when making investment decisions.
Estimated Percent of Fair Value as of March 31, 2022:
25
Our investments are not materially impacted by seasonality, despite certain of our retail tenants being impacted by seasonality. Percentage rents (rents computed as a percentage of tenant sales) that we earn from investments in retail properties may, in the future, be impacted by seasonality.
Use of Estimates
The preparation of financial statements in conformity with GAAP requires us to make estimates and assumptions. These estimates and assumptions impact the reported amounts of assets and liabilities and the disclosure of contingent assets and liabilities at the date of the financial statements and the reported amounts of revenues and expenses during the reporting period. For example, significant estimates and assumptions have been made with respect to the useful lives of assets, recoverable amounts of receivables, fair value of derivatives and real estate assets, initial valuations and related amortization periods of deferred costs and intangibles, particularly with respect to property acquisitions. Actual results could differ from those estimates.
Critical Accounting Policies
This MD&A is based upon our consolidated financial statements, which have been prepared in accordance with GAAP. The preparation of these consolidated financial statements requires management to make estimates and judgments that affect the reported amounts of assets, liabilities, revenues and expenses. Management bases its estimates on historical experience and assumptions that are believed to be reasonable under the circumstances, the results of which form the basis for making judgments about carrying value of assets and liabilities that are not readily apparent from other sources. Actual results may differ from these estimates under different assumptions or conditions. We believe there have been no significant changes during the three months ended March 31, 2022 to the items that we disclosed as our critical accounting policies and estimates under “Item 7. Management’s Discussion and Analysis of Financial Condition and Results of Operations” in our 2021 Form 10-K.
Initial Valuations and Estimated Useful Lives or Amortization Periods for Real Estate Investments and Intangibles
These estimates are particularly important as they are used for the allocation of purchase price between building, land and other identifiable intangibles, including above, below and at-market leases. As a result, the impact of these estimates on our operations could be substantial. Significant differences in annual depreciation or amortization expense may result from the differing useful life or amortization periods related to such purchased assets and liabilities.
Impairment of Long-Lived Assets
Our estimate of the expected future cash flows used in testing for impairment is subjective and based on, among other things, our estimates regarding future market conditions, rental rates, occupancy levels, costs of tenant improvements, leasing commissions and other tenant concessions, assumptions regarding the residual value of our properties at the end of our anticipated holding period, discount rates and the length of our anticipated holding period. These assumptions could differ materially from actual results. If changes in our strategy or the market conditions result in a reduction in the holding period and an earlier sale date, an impairment loss could be recognized and such loss could be material. No such strategy changes or market conditions have been identified as of March 31, 2022.
Collectibility of Rental Revenue
Individual leases are evaluated for collectibility at each reporting period. We evaluate the collectibility of rents and other receivables at each reporting period based on factors including, among others, tenants' payment history, the financial condition of the tenant, business conditions and trends in the industry in which the tenant operates and economic conditions in the geographic area where the property is located. If evaluation of these factors or others indicates it is not probable we will collect substantially all rent we recognize an adjustment to rental revenue. If our judgment or estimation regarding probability of collection changes we may adjust or record additional rental revenue in the period such conclusion is reached.
26
Properties
Properties owned at March 31, 2022, including DST Properties, are as follows:
Percentage Leased as of March 31, 2022 | ||||||||||||||||||||||||||||||||
Property Name | Location | Acquisition Date | Ownership % | Net Rentable Square Feet | ||||||||||||||||||||||||||||
| Consolidated Properties: | ||||||||||||||||||||||||||||||||
| Industrial Segment: | ||||||||||||||||||||||||||||||||
| Kendall Distribution Center | Atlanta, GA | June 30, 2005 | 100% | 409,000 | 100% | |||||||||||||||||||||||||||
| Suwanee Distribution Center | Suwanee, GA | June 28, 2013 | 100 | 559,000 | 100 | |||||||||||||||||||||||||||
| Grand Prairie Distribution Center | ||||||||||||||||||||||||||||||||
| 3325 West Trinity Boulevard | Grand Prairie, TX | January 22, 2014 | 100 | 277,000 | 100 | |||||||||||||||||||||||||||
| 3324 West Trinity Boulevard | Grand Prairie, TX | May 31, 2019 | 100 | 145,000 | 100 | |||||||||||||||||||||||||||
| Charlotte Distribution Center | Charlotte, NC | June 27, 2014 | 100 | 347,000 | 100 | |||||||||||||||||||||||||||
| DFW Distribution Center | ||||||||||||||||||||||||||||||||
| 4050 Corporate Drive | Grapevine, TX | April 15, 2015 | 100 | 441,000 | 100 | |||||||||||||||||||||||||||
| 4055 Corporate Drive | Grapevine, TX | April 15, 2015 | 100 | 202,000 | 89 | |||||||||||||||||||||||||||
| O'Hare Industrial Portfolio | ||||||||||||||||||||||||||||||||
| 200 Lewis | Wood Dale, IL | September 30, 2015 | 100 | 31,000 | 100 | |||||||||||||||||||||||||||
| 1225 Michael Drive | Wood Dale, IL | September 30, 2015 | 100 | 109,000 | 100 | |||||||||||||||||||||||||||
| 1300 Michael Drive | Wood Dale, IL | September 30, 2015 | 100 | 71,000 | 100 | |||||||||||||||||||||||||||
| 1301 Mittel Drive | Wood Dale, IL | September 30, 2015 | 100 | 53,000 | 100 | |||||||||||||||||||||||||||
| 1350 Michael Drive | Wood Dale, IL | September 30, 2015 | 100 | 56,000 | 100 | |||||||||||||||||||||||||||
| 2501 Allan Drive | Elk Grove, IL | September 30, 2015 | 100 | 198,000 | 100 | |||||||||||||||||||||||||||
| 2601 Allan Drive | Elk Grove, IL | September 30, 2015 | 100 | 124,000 | 100 | |||||||||||||||||||||||||||
| Tampa Distribution Center | Tampa, FL | April 11, 2016 | 100 | 386,000 | 100 | |||||||||||||||||||||||||||
| Aurora Distribution Center | Aurora, IL | May 19, 2016 | 100 | 305,000 | 100 | |||||||||||||||||||||||||||
| Valencia Industrial Portfolio: | ||||||||||||||||||||||||||||||||
| 28150 West Harrison Parkway | Valencia, CA | June 29, 2016 | 100 | 87,000 | 100 | |||||||||||||||||||||||||||
| 28145 West Harrison Parkway | Valencia, CA | June 29, 2016 | 100 | 114,000 | 100 | |||||||||||||||||||||||||||
| 28904 Paine Avenue | Valencia, CA | June 29, 2016 | 100 | 117,000 | 100 | |||||||||||||||||||||||||||
| 25045 Tibbitts Avenue | Santa Clarita, CA | June 29, 2016 | 100 | 142,000 | 100 | |||||||||||||||||||||||||||
| Pinole Point Distribution Center: | ||||||||||||||||||||||||||||||||
| 6000 Giant Road | Richmond, CA | September 8, 2016 | 100 | 225,000 | 100 | |||||||||||||||||||||||||||
| 6015 Giant Road | Richmond, CA | September 8, 2016 | 100 | 252,000 | 100 | |||||||||||||||||||||||||||
| 6025 Giant Road | Richmond, CA | December 29, 2016 | 100 | 41,000 | 100 | |||||||||||||||||||||||||||
| Mason Mill Distribution Center | Buford, GA | December 20, 2017 | 100 | 340,000 | 100 | |||||||||||||||||||||||||||
| Fremont Distribution Center | ||||||||||||||||||||||||||||||||
| 45275 Northport Court | Fremont, CA | March 29, 2019 | 100 | 117,000 | 100 | |||||||||||||||||||||||||||
| 45630 Northport Loop East | Fremont, CA | March 29, 2019 | 100 | 120,000 | 100 | |||||||||||||||||||||||||||
| Taunton Distribution Center | Taunton, MA | August 23, 2019 | 100 | 200,000 | 100 | |||||||||||||||||||||||||||
| Chandler Distribution Center | ||||||||||||||||||||||||||||||||
| 1725 East Germann Road | Chandler, AZ | December 5, 2019 | 100 | 122,000 | 100 | |||||||||||||||||||||||||||
| 1825 East Germann Road | Chandler, AZ | December 5, 2019 | 100 | 89,000 | 100 | |||||||||||||||||||||||||||
| Fort Worth Distribution Center | Fort Worth, TX | October 23, 2020 | 100 | 351,000 | 100 | |||||||||||||||||||||||||||
| Whitestown Distribution Center | ||||||||||||||||||||||||||||||||
| 4993 Anson Boulevard | Whitestown, IN | December 11, 2020 | 100 | 280,000 | 100 | |||||||||||||||||||||||||||
| 5102 E 500 South | Whitestown, IN | December 11, 2020 | 100 | 440,000 | 100 | |||||||||||||||||||||||||||
| Louisville Distribution Center | Shepherdsville, KY | January 21, 2021 | 100 | 1,040,000 | 100 | |||||||||||||||||||||||||||
| Southeast Phoenix Distribution Center | ||||||||||||||||||||||||||||||||
| 6511 West Frye Road | Chandler, AZ | February 23, 2021 | 100 | 102,000 | 100 | |||||||||||||||||||||||||||
27
Percentage Leased as of March 31, 2022 | ||||||||||||||||||||||||||||||||
Property Name | Location | Acquisition Date | Ownership % | Net Rentable Square Feet | ||||||||||||||||||||||||||||
| 6565 West Frye Road | Chandler, AZ | February 23, 2021 | 100 | 118,000 | 100 | |||||||||||||||||||||||||||
| 6615 West Frey Road | Chandler, AZ | February 23, 2021 | 100 | 136,000 | 100 | |||||||||||||||||||||||||||
| 6677 West Frye Road | Chandler, AZ | February 23, 2021 | 100 | 118,000 | 100 | |||||||||||||||||||||||||||
| Louisville Airport Distribution Center | Louisville, KY | June 24, 2021 | 100 | 284,000 | 100 | |||||||||||||||||||||||||||
| 237 Via Vera Cruz (1) | San Marcos, CA | July 2, 2021 | 95 | 66,000 | 100 | |||||||||||||||||||||||||||
| 13500 Danielson Street (1) | Poway, CA | July 2, 2021 | 95 | 73,000 | 100 | |||||||||||||||||||||||||||
| 4211 Starboard Drive (1) | Fremont, CA | July 9, 2021 | 95 | 130,000 | 100 | |||||||||||||||||||||||||||
| 5 National Way | Durham, NC | September 28, 2021 | 100 | 188,000 | 100 | |||||||||||||||||||||||||||
| 47 National Way | Durham, NC | September 28, 2021 | 100 | 187,000 | 100 | |||||||||||||||||||||||||||
| Friendship Distribution Center | ||||||||||||||||||||||||||||||||
| 4627 Distribution Pkwy | Buford, GA | October 20, 2021 | 100 | 126,000 | 100 | |||||||||||||||||||||||||||
| 4630 Distribution Pkwy | Buford, GA | October 20, 2021 | 100 | 149,000 | 100 | |||||||||||||||||||||||||||
| 4646 Distribution Pkwy | Buford, GA | October 20, 2021 | 100 | 102,000 | 100 | |||||||||||||||||||||||||||
| 4651 Distribution Pkwy | Buford, GA | October 20, 2021 | 100 | 272,000 | 100 | |||||||||||||||||||||||||||
| South San Diego Distribution Center | ||||||||||||||||||||||||||||||||
| 2001 Sanyo Avenue | San Diego, CA | October 28, 2021 | 100 | 320,000 | 100 | |||||||||||||||||||||||||||
| 2055 Sanyo Avenue | San Diego, CA | October 28, 2021 | 100 | 209,000 | 87 | |||||||||||||||||||||||||||
| 2065 Sanyo Avenue | San Diego, CA | October 28, 2021 | 100 | 136,000 | 100 | |||||||||||||||||||||||||||
| 1755 Britannia Drive | Elgin, IL | November 16, 2021 | 100 | 80,000 | 100 | |||||||||||||||||||||||||||
| 2451 Bath Road | Elgin, IL | November 16, 2021 | 100 | 327,000 | 100 | |||||||||||||||||||||||||||
| 687 Conestoga Parkway | Shepardsville, KY | November 17, 2021 | 100 | 327,000 | 100 | |||||||||||||||||||||||||||
| 2840 Loker Avenue | Carlsbad, CA | November 30, 2021 | 95 | 104,000 | 100 | |||||||||||||||||||||||||||
| 15890 Bernardo Center Drive | San Diego, CA | November 30, 2021 | 95 | 48,000 | 100 | |||||||||||||||||||||||||||
| Office Segment: | ||||||||||||||||||||||||||||||||
| Monument IV at Worldgate | Herndon, VA | August 27, 2004 | 100% | 228,000 | 100% | |||||||||||||||||||||||||||
| 140 Park Avenue | Florham Park, NJ | December 21, 2015 | 100 | 100,000 | 100 | |||||||||||||||||||||||||||
| San Juan Medical Center | San Juan Capistrano, CA | April 1, 2016 | 100 | 40,000 | 100 | |||||||||||||||||||||||||||
| Genesee Plaza | ||||||||||||||||||||||||||||||||
| 9333 Genesee Ave | San Diego, CA | July 2, 2019 | 100 | 80,000 | 78 | |||||||||||||||||||||||||||
| 9339 Genesee Ave | San Diego, CA | July 2, 2019 | 100 | 81,000 | 91 | |||||||||||||||||||||||||||
| Fountainhead Corporate Park | ||||||||||||||||||||||||||||||||
| Fountainhead Corporate Park I | Tempe, AZ | February 6, 2020 | 100 | 167,000 | 100 | |||||||||||||||||||||||||||
| Fountainhead Corporate Park II | Tempe, AZ | February 6, 2020 | 100 | 128,000 | 100 | |||||||||||||||||||||||||||
| 170 Park Avenue | Florham Park, NJ | February 2, 2021 | 100 | 147,000 | 100 | |||||||||||||||||||||||||||
| 9101 Stony Point Drive | Richmond, VA | September 15, 2021 | 100 | 87,000 | 100 | |||||||||||||||||||||||||||
| North Tampa Surgery Center | Odessa, FL | October 8, 2021 | 100 | 13,000 | 100 | |||||||||||||||||||||||||||
| Duke Medical Center | Durham, NC | December 23, 2021 | 100 | 60,000 | 96 | |||||||||||||||||||||||||||
| KC Medical Office Portfolio | ||||||||||||||||||||||||||||||||
| 8600 NE 82nd Street | Kansas City, MO | December 23, 2021 | 100 | 11,000 | 100 | |||||||||||||||||||||||||||
| 1203 SW 7 Highway | Blue Springs, MO | December 23, 2021 | 100 | 10,000 | 100 | |||||||||||||||||||||||||||
| Roeland Park Medical Office | Roeland Park, KS | December 28, 2021 | 100 | 30,000 | 100 | |||||||||||||||||||||||||||
| South Reno Medical Center | Reno, NV | December 28, 2021 | 100 | 32,000 | 100 | |||||||||||||||||||||||||||
| Sugar Land Medical Plaza | Sugar Land, TX | December 30, 2021 | 100 | 37,000 | 100 | |||||||||||||||||||||||||||
| Residential Segment: | ||||||||||||||||||||||||||||||||
| Townlake of Coppell | Coppell, TX | May 22, 2015 | 100 | 351,000 | 95 | |||||||||||||||||||||||||||
| AQ Rittenhouse | Philadelphia, PA | July 30, 2015 | 100 | 92,000 | 98 | |||||||||||||||||||||||||||
| Lane Parke Apartments | Mountain Brook, AL | May 26, 2016 | 100 | 263,000 | 90 | |||||||||||||||||||||||||||
28
Percentage Leased as of March 31, 2022 | ||||||||||||||||||||||||||||||||
Property Name | Location | Acquisition Date | Ownership % | Net Rentable Square Feet | ||||||||||||||||||||||||||||
| Dylan Point Loma | San Diego, CA | August 9, 2016 | 100 | 204,000 | 96 | |||||||||||||||||||||||||||
| The Penfield | St. Paul, MN | September 22, 2016 | 100 | 245,000 | 96 | |||||||||||||||||||||||||||
| 180 North Jefferson | Chicago, IL | December 1, 2016 | 100 | 217,000 | 96 | |||||||||||||||||||||||||||
| Jory Trail at the Grove | Wilsonville, OR | July 14, 2017 | 100 | 315,000 | 95 | |||||||||||||||||||||||||||
| The Reserve at Johns Creek | Johns Creek, GA | July 28, 2017 | 100 | 244,000 | 96 | |||||||||||||||||||||||||||
| Villas at Legacy | Plano, TX | June 6, 2018 | 100 | 340,000 | 95 | |||||||||||||||||||||||||||
| Stonemeadow Farms | Bothell, WA | May 13, 2019 | 100 | 228,000 | 97 | |||||||||||||||||||||||||||
| Summit at San Marcos | Chandler, AZ | July 31, 2019 | 100 | 257,000 | 97 | |||||||||||||||||||||||||||
| Presley Uptown (1) | Charlotte, NC | September 30, 2019 | 98 | 190,000 | 96 | |||||||||||||||||||||||||||
| Princeton North Andover | North Andover, MA | May 3, 2021 | 100 | 204,000 | 97 | |||||||||||||||||||||||||||
| The Preserve at the Meadows | Fort Collins, CO | August 23, 2021 | 100 | 208,000 | 96 | |||||||||||||||||||||||||||
| The Rockwell | Berlin, MA | August 31, 2021 | 100 | 233,000 | 98 | |||||||||||||||||||||||||||
| Miramont Apartments | Fort Collins, CO | September 29, 2021 | 100 | 212,000 | 97 | |||||||||||||||||||||||||||
| Pinecone Apartments | Fort Collins, CO | September 29, 2021 | 100 | 176,000 | 99 | |||||||||||||||||||||||||||
| Reserve at Venice | North Venice, FL | December 17, 2021 | 100 | 268,000 | 94 | |||||||||||||||||||||||||||
| Woodside Trumbull | Trumbull, CT | December 21, 2021 | 100 | 207,000 | 89 | |||||||||||||||||||||||||||
| Jefferson Lake Howell | Casselberry, FL | March 30, 2022 | 100 | 374,000 | 91 | |||||||||||||||||||||||||||
| Retail Segment: | ||||||||||||||||||||||||||||||||
| The District at Howell Mill (1) | Atlanta, GA | June 15, 2007 | 88% | 306,000 | 96% | |||||||||||||||||||||||||||
| Grand Lakes Marketplace (1) | Katy, TX | September 17, 2013 | 90 | 131,000 | 75 | |||||||||||||||||||||||||||
| Oak Grove Plaza | Sachse, TX | January 17, 2014 | 100 | 120,000 | 94 | |||||||||||||||||||||||||||
| Rancho Temecula Town Center | Temecula, CA | June 16, 2014 | 100 | 165,000 | 97 | |||||||||||||||||||||||||||
| Skokie Commons | Skokie, IL | May 15, 2015 | 100 | 97,000 | 98 | |||||||||||||||||||||||||||
| Whitestone Market | Austin, TX | September 30, 2015 | 100 | 145,000 | 99 | |||||||||||||||||||||||||||
| Maui Mall | Kahului, HI | December 22, 2015 | 100 | 235,000 | 83 | |||||||||||||||||||||||||||
| Silverstone Marketplace | Scottsdale, AZ | July 27, 2016 | 100 | 78,000 | 93 | |||||||||||||||||||||||||||
| Kierland Village Center | Scottsdale, AZ | September 30, 2016 | 100 | 118,000 | 98 | |||||||||||||||||||||||||||
| Timberland Town Center | Beaverton, OR | September 30, 2016 | 100 | 92,000 | 96 | |||||||||||||||||||||||||||
| Montecito Marketplace | Las Vegas, NV | August 8, 2017 | 100 | 190,000 | 95 | |||||||||||||||||||||||||||
| Milford Crossing | Milford, MA | January 29, 2020 | 100 | 159,000 | 99 | |||||||||||||||||||||||||||
| Other Segment: | ||||||||||||||||||||||||||||||||
| South Beach Parking Garage (2) | Miami Beach, FL | January 28, 2014 | 100% | 130,000 | N/A | |||||||||||||||||||||||||||
| Unconsolidated Properties: | ||||||||||||||||||||||||||||||||
| Chicago Parking Garage (3) | Chicago, IL | December 23, 2014 | 100% | 167,000 | N/A | |||||||||||||||||||||||||||
| NYC Retail Portfolio (4)(5) | NY/NJ | December 8, 2015 | 14 | 1,938,000 | 91 | |||||||||||||||||||||||||||
| Pioneer Tower (6) | Portland, OR | June 28, 2016 | 100 | 296,000 | 68 | |||||||||||||||||||||||||||
| The Tremont (1) | Burlington, MA | July 19, 2018 | 75 | 175,000 | 97 | |||||||||||||||||||||||||||
| The Huntington (1) | Burlington, MA | July 19, 2018 | 75 | 115,000 | 93 | |||||||||||||||||||||||||||
| Siena Suwanee Town Center | Suwanee, GA | December 15, 2020 | 100 | 226,000 | 92 | |||||||||||||||||||||||||||
| Single-Family Rental Portfolio (5) | Various | August 5, 2021 | 47 | 7,207,000 | 96 | |||||||||||||||||||||||||||
| Kingston at McLean Crossing (1) | McLean, VA | December 3, 2021 | 80 | 223,000 | 97 | |||||||||||||||||||||||||||
________
(1)We own a majority interest in the joint venture that owns a fee simple interest in this property.
(2)The parking garage contains 343 stalls. This property is owned leasehold.
(3)We own a condominium interest in the building that contains a 366 stall parking garage.
29
(4)We own an approximate 14% interest in a portfolio of eight urban infill retail properties located in the greater New York City area.
(5)We have elected the fair value option to account for this investment.
(6)We own a condominium interest in the building that contains a 17 story multi-tenant office property.
Operating Statistics
We generally hold investments in properties with high occupancy rates leased to quality tenants under long-term, non-cancelable leases. We believe these leases are beneficial to achieving our investment objectives. The following table shows our operating statistics by property type for our consolidated properties as of March 31, 2022:
| Number of Properties | Total Area (Sq Ft) | % of Total Area | Occupancy % | Average Minimum Base Rent per Occupied Sq Ft (1) | |||||||||||||||||||||||||
| Industrial | 55 | 11,392,000 | 59 | % | 99 | % | $ | 6.31 | |||||||||||||||||||||
| Office | 16 | 1,251,000 | 6 | 98 | 32.16 | ||||||||||||||||||||||||
| Residential | 20 | 4,828,000 | 24 | 95 | 22.51 | ||||||||||||||||||||||||
| Retail | 12 | 1,836,000 | 9 | 94 | 20.84 | ||||||||||||||||||||||||
| Other | 1 | 130,000 | 1 | N/A | N/A | ||||||||||||||||||||||||
| Total | 104 | 19,437,000 | 99 | % | 98 | % | $ | 13.36 | |||||||||||||||||||||
________
(1)Amount calculated as in-place minimum base rent for all occupied space at March 31, 2022 and excludes any straight line rents, tenant recoveries and percentage rent revenues.
As of March 31, 2022, our average effective annual rent per square foot, calculated as average minimum base rent per occupied square foot less tenant concessions and allowances, was $12.31 for our consolidated properties.
Recent Events and Outlook
Property Valuations
Property valuations across our portfolio are seeing positive valuation increases especially within our residential, industrial and healthcare properties driven by good underlying property fundamentals and strong capital markets.
Credit Facility
On May 24, 2021, we entered into our Credit Facility providing for a $650,000 revolving line of credit and unsecured term loan made up of a $415,000 Revolving Credit Facility and a $235,000 Term Loan. The Credit Facility provides us with the ability, from time to time, to increase the size of the Credit Facility up to a total of $800,000, subject to receipt of lender commitments and other conditions. We are in compliance with our debt covenants as of March 31, 2022. We expect to maintain compliance with our debt covenants.
Liquidity
At March 31, 2022, we had in excess of $124,000 in total cash on hand and $210,000 of capacity under our Credit Facility. Looking at the remainder of 2022 and into 2023, we expect to utilize our cash on hand and Credit Facility capacity to acquire new properties, fund repurchases of our shares and fund quarterly distributions.
Share Repurchase Plan
During the first quarter of 2022, we repurchased $41,266 of our common stock pursuant to our share repurchase plan, which had a quarterly limit of $139,775. The quarterly limit on repurchases is calculated as 5% of our NAV as of the last day of the previous quarter. The limit for the second quarter of 2022 is $161,697.
30
General Company and Market Commentary
On December 21, 2021, the SEC declared our Current Public Offering effective registering up to $3,000,000 in any combination of shares of our Class A, Class M, Class A-I and Class M-I common stock, consisting of up to $2,700,000 of shares offered in our primary offering and up to $300,000 in shares offered pursuant to our distribution reinvestment plan. We intend to offer shares of our common stock on a continuous basis for an indefinite period of time by filing a new registration statement before the end of each offering period, subject to regulatory approval. The per share purchase price varies from day to day and, on each day, equals our NAV per share for each class of common stock, plus, for Class A and Class A-I shares, applicable selling commissions. The Dealer Manager is distributing shares of our common stock in our Current Public Offering. We intend to primarily use the net proceeds from the offering, after we pay the fees and expenses attributable to the offerings and our operations, to (1) grow and further diversify our portfolio by making investments in accordance with our investment strategy and policies, (2) reduce borrowings and repay indebtedness incurred under various financing instruments and (3) fund repurchases of our shares under our share repurchase plan.
On March 3, 2015, we commenced our Private Offering of up to $350,000 in shares of our Class D common stock with an indefinite duration. Proceeds from our Private Offering will be used for the same corporate purposes as the proceeds from our public offerings.
On October 16, 2019, we through our operating partnership, initiated the DST Program to raise up to $500,000, which our board of directors increased to $1,000,000 on August 10, 2021, in private placements exempt from registration under the Securities Act through the sale of beneficial interests to accredited investors in specific DSTs holding DST Properties, which may be sourced from our real properties or from third parties.
Capital Raised and Use of Proceeds
As of March 31, 2022, we have raised gross proceeds of over $3,368,000 from our public and private offerings and private share sales since 2012. We used these proceeds along with proceeds from mortgage debt to acquire approximately $4,653,000 of real estate investments, deleverage the Company by repaying mortgage loans of approximately $647,000 and repurchase shares of our common stock for approximately $947,000.
Property Acquisitions
On March 30, 2022, we acquired Jefferson Lake Howell, a 384-unit residential property located in Casselberry, Florida for approximately $154,100. The acquisition was funded with cash on hand and a draw on our Credit Facility.
Property Dispositions
On January 6, 2022, we sold Norfleet Distribution Center, a 702,000 square foot industrial property located in Kansas City, Missouri for approximately $60,375 less closing costs. We recorded a gain on the sale of the property in the amount of approximately $34,186.
On January 24, 2022, we sold The Edge at Lafayette, a 207,000 square foot student housing apartment property located in Lafayette, Louisiana for approximately $16,500 less closing costs. We recorded a gain on the sale of the property in the amount of approximately $13.
Financing
On March 1, 2022, we entered into a $55,800 mortgage payable on Reserve at Venice. The mortgage note bears an interest of 2.98% and matures on March 1, 2032.
On March 1, 2022, we entered into a $40,000 mortgage payable on Friendship Distribution Center. The mortgage note bears an interest rate of SOFR plus 1.75% (2.03% at March 31, 2022) and matures on March 1, 2029.
Investment Objectives and Strategy
Our primary investment objectives are:
•to generate an attractive level of current income for distribution to our stockholders;
•to preserve and protect our stockholders' capital investments;
•to achieve appreciation of our NAV over time; and
•to enable stockholders to utilize real estate as an asset class in diversified, long-term investment portfolios.
31
We cannot ensure that we will achieve our investment objectives. Our charter places numerous limitations on us with respect to the manner in which we may invest our funds. In most cases, these limitations cannot be changed unless our charter is amended, which may require the approval of our stockholders.
The cornerstone of our investment strategy is to acquire and manage income-producing commercial real estate properties and real estate-related assets around the world. We believe this strategy enables us to provide our stockholders with a portfolio that is well-diversified across property type, geographic region and industry, both in the United States and internationally. It is our belief that adding international investments to our portfolio over time will serve as an effective tool to construct a well-diversified portfolio designed to provide our stockholders with stable distributions and attractive long-term risk-adjusted returns.
We believe that our broadly diversified portfolio benefits our stockholders by providing:
•diversification of sources of income;
•access to attractive real estate opportunities currently in the United States and, over time, around the world; and
•exposure to a return profile that should have lower correlations with other investments.
Since real estate markets are often cyclical in nature, our strategy allows us to more effectively deploy capital into property types and geographic regions where the underlying investment fundamentals are relatively strong or strengthening and away from those property types and geographic regions where such fundamentals are relatively weak or weakening. We intend to meet our investment objectives by selecting investments across multiple property types and geographic regions to achieve portfolio stability, diversification, current income and favorable risk-adjusted returns. To a lesser degree, we also intend to invest in debt and equity interests backed principally by real estate, which we refer to collectively as “real estate-related assets.”
We will leverage LaSalle's broad commercial real estate research and strategy platform and resources to employ a research-based investment philosophy focused on building a portfolio of commercial properties and real estate-related assets that we believe has the potential to provide stable income streams and outperform market averages over an extended holding period. Furthermore, we believe that having access to LaSalle and JLL's international organization and platform, with real estate professionals living and working full time throughout our global target markets, will be a valuable resource to us when considering and executing upon international investment opportunities.
Our board of directors has adopted investment guidelines for our Advisor to implement and actively monitor in order to allow us to achieve and maintain diversification in our overall investment portfolio. Our board of directors formally reviews our investment guidelines on an annual basis and our investment portfolio on a quarterly basis or, in each case, more often as they deem appropriate. Our board of directors reviews the investment guidelines to ensure that the guidelines are being followed and are in the best interests of our stockholders. Each such determination and the basis therefor shall be set forth in the minutes of the meetings of our board of directors. Changes to our investment guidelines must be approved by our board of directors but do not require notice to or the vote of stockholders.
We seek to invest:
•up to 95% of our assets in properties;
•up to 25% of our assets in real estate-related assets; and
•up to 15% of our assets in cash, cash equivalents and other short-term investments.
Notwithstanding the above, the actual percentage of our portfolio that is invested in each investment type may from time to time be outside these target levels due to numerous factors including, but not limited to, large inflows of capital over a short period of time, lack of attractive investment opportunities or increases in anticipated cash requirements for repurchase requests.
We expect to maintain a targeted Company leverage ratio (calculated as our share of total liabilities divided by our share of the fair value of total assets) of between 30% and 50%. We intend to use low leverage, or in some cases possibly no leverage, to finance new acquisitions in order to maintain our targeted Company leverage ratio. Our Company leverage ratio was 39% as of March 31, 2022.
32
2022 Key Initiatives
During the remainder of 2022, we intend to use capital raised from our public and private offerings and the DST Program to acquire new investment opportunities, repurchase stock under our share repurchase plan and fund quarterly distributions. We look to make investments that fit with our investment objectives and guidelines. Likely investment candidates may include well-located, well-leased residential properties, industrial properties, medical office properties and publicly traded REIT securities. We will also attempt to further our geographic diversification. We will look to keep the Company leverage ratio in the 30% to 50% range in the near term consistent with traditional core real estate. We also intend to use our Revolving Credit Facility to allow us to efficiently manage our cash flows.
33
Results of Operations
General
Our revenues are primarily received from tenants in the form of fixed minimum base rents and recoveries of operating expenses. Our expenses primarily relate to the costs of operating and financing the properties. Our share of the net income or net loss from our unconsolidated real estate affiliates is included in income from unconsolidated affiliates and fund investments. We believe the following analysis of reportable segments provides important information about the operating results of our real estate investments, such as trends in total revenues or operating expenses that may not be as apparent in a period-over-period comparison of the entire Company. We group our investments in real estate assets from continuing operations into five reportable operating segments based on the type of property, which are residential, industrial, office, retail and other. Operations from corporate level items and real estate assets sold are excluded from reportable segments.
Properties acquired or sold during any of the periods presented are presented within the recent acquisitions and sold properties line. The properties currently presented within the recent acquisitions and sold properties line include the properties listed as acquired in the current or prior year in the Properties section above in addition to South Seattle Distribution Cener (sold in 2021), Norfleet Distribution Center (sold in 2022) and The Edge at Lafayette (sold in 2022). Properties owned for the three months ended March 31, 2022 and 2021 are referred to as our comparable properties.
Results of Operations for the Three Months Ended March 31, 2022 and 2021
Revenues
The following chart sets forth revenues by reportable segment for the three months ended March 31, 2022 and 2021:
| Three Months Ended March 31, 2022 | Three Months Ended March 31, 2021 | $ Change | % Change | ||||||||||||||||||||
| Revenues: | |||||||||||||||||||||||
| Rental revenue | |||||||||||||||||||||||
| Residential | $ | 16,541 | $ | 15,188 | $ | 1,353 | 8.9 | % | |||||||||||||||
| Industrial | 13,610 | 12,742 | 868 | 6.8 | |||||||||||||||||||
| Office | 7,368 | 6,852 | 516 | 7.5 | |||||||||||||||||||
| Retail | 13,615 | 12,053 | 1,562 | 13.0 | |||||||||||||||||||
| Other | 61 | 32 | 29 | 90.6 | |||||||||||||||||||
| Comparable properties total | $ | 51,195 | $ | 46,867 | $ | 4,328 | 9.2 | % | |||||||||||||||
| Recent acquisitions and sold properties | 23,760 | 3,864 | 19,896 | 514.9 | |||||||||||||||||||
| Total rental revenue | $ | 74,955 | $ | 50,731 | $ | 24,224 | 47.7 | % | |||||||||||||||
| Other revenue | |||||||||||||||||||||||
| Residential | $ | 814 | $ | 730 | $ | 84 | 11.5 | % | |||||||||||||||
| Industrial | 40 | 4 | 36 | 900.0 | |||||||||||||||||||
| Office | 293 | 371 | (78) | (21.0) | |||||||||||||||||||
| Retail | 72 | 83 | (11) | (13.3) | |||||||||||||||||||
| Other | 601 | 631 | (30) | (4.8) | |||||||||||||||||||
| Comparable properties total | $ | 1,820 | $ | 1,819 | $ | 1 | 0.1 | % | |||||||||||||||
| Recent acquisitions and sold properties | 396 | 31 | 365 | 1,177 | |||||||||||||||||||
| Total other revenue | $ | 2,216 | $ | 1,850 | $ | 366 | 19.8 | % | |||||||||||||||
| Total revenues | $ | 77,171 | $ | 52,581 | $ | 24,590 | 46.8 | % | |||||||||||||||
Rental revenues at comparable properties increased $4,328 for the three months ended March 31, 2022 as compared to the same period in 2021. The increase of $1,562 within our retail segment was primarily related to an increase in collections from tenants that experienced a decrease in operations from COVID-19 in 2021 as well as an increase in recovery revenue related to increased operating expenses within the segment during the three months ended March 31, 2022. The increase in rental
34
revenue from our residential, industrial and office segments are primarily related to higher rental rates and higher occupancy at several of the properties during the three months ended March 31, 2022 as compared to the same period of 2021.
Other revenues relate mainly to parking and nonrecurring revenue such as lease termination fees. Other revenue at comparable properties increased by $1 for the three months ended March 31, 2022 as compared to the same period in 2021. The minimal increase is primarily related to lease termination fees and increased parking revenue collected in 2022 within our residential segment. The increase was offset by a decrease in lease termination revenue of $50 within our office segment related to collections made in the three months ended March 31, 2021 that did not reoccur in 2022.
Operating Expenses
The following chart sets forth real estate taxes and property operating expenses by reportable segment, for the three months ended March 31, 2022 and 2021:
| Three Months Ended March 31, 2022 | Three Months Ended March 31, 2021 | $ Change | % Change | ||||||||||||||||||||
| Operating expenses: | |||||||||||||||||||||||
| Real estate taxes | |||||||||||||||||||||||
| Residential | $ | 3,026 | $ | 3,049 | $ | (23) | (0.8) | % | |||||||||||||||
| Industrial | 2,366 | 2,237 | 129 | 5.8 | |||||||||||||||||||
| Office | 871 | 799 | 72 | 9.0 | |||||||||||||||||||
| Retail | 1,671 | 1,633 | 38 | 2.3 | |||||||||||||||||||
| Other | 113 | 115 | (2) | (1.7) | |||||||||||||||||||
| Comparable properties total | $ | 8,047 | $ | 7,833 | $ | 214 | 2.7 | % | |||||||||||||||
| Recent acquisitions and sold properties | 3,264 | 253 | 3,011 | 1,190 | |||||||||||||||||||
| Total real estate taxes | $ | 11,311 | $ | 8,086 | $ | 3,225 | 39.9 | % | |||||||||||||||
| Property operating expenses | |||||||||||||||||||||||
| Residential | $ | 4,784 | $ | 4,363 | $ | 421 | 9.6 | % | |||||||||||||||
| Industrial | 1,328 | 1,235 | 93 | 7.5 | |||||||||||||||||||
| Office | 1,582 | 1,472 | 110 | 7.5 | |||||||||||||||||||
| Retail | 2,124 | 2,046 | 78 | 3.8 | |||||||||||||||||||
| Other | 208 | 194 | 14 | 7.2 | |||||||||||||||||||
| Comparable properties total | $ | 10,026 | $ | 9,310 | $ | 716 | 7.7 | % | |||||||||||||||
| Recent acquisitions and sold properties | 3,975 | 601 | 3,374 | 561.4 | |||||||||||||||||||
| Total property operating expenses | $ | 14,001 | $ | 9,911 | $ | 4,090 | 41.3 | % | |||||||||||||||
| Total operating expenses | $ | 25,312 | $ | 17,997 | $ | 7,315 | 40.6 | % | |||||||||||||||
Real estate taxes at comparable properties increased by $214 for the three months ended March 31, 2022 as compared to the same period in 2021. Our properties are reassessed periodically by the taxing authorities, which may result in increases or decreases in the real estates taxes that we owe. Overall, we expect real estate taxes to increase over time; however, we utilize real estate tax consultants to attempt to control assessment increases.
Property operating expenses consist of the costs of ownership and operation of the real estate investments, many of which are recoverable under net leases. Examples of property operating expenses include insurance, utilities and repair and maintenance expenses. Property operating expenses at comparable properties increased $716 for the three months ended March 31, 2022 as compared to the same period in 2021. The increases in three months ending March 31, 2022 as compared to 2021 generally relate to higher property management fees due to high rents, higher salary costs and higher utility costs in some markets.
35
The following chart sets forth revenues and expenses not directly related to the operations of the reportable segments for the three months ended March 31, 2022 and 2021:
| Three Months Ended March 31, 2022 | Three Months Ended March 31, 2021 | $ Change | % Change | ||||||||||||||||||||
| Property general and administrative | $ | 697 | $ | 660 | $ | 37 | 5.6 | % | |||||||||||||||
| Advisor fees | 17,858 | 6,325 | 11,533 | 182.3 | |||||||||||||||||||
| Company level expenses | 1,074 | 1,193 | (119) | (10.0) | |||||||||||||||||||
| Depreciation and amortization | 32,974 | 19,945 | 13,029 | 65.3 | |||||||||||||||||||
| Interest expense | 17,852 | 9,262 | 8,590 | 92.7 | |||||||||||||||||||
| (Gain) loss from unconsolidated affiliates and fund investments | (29,025) | 339 | (29,364) | (8,662) | |||||||||||||||||||
| Investment income on marketable securities | (304) | — | (304) | 100.0 | |||||||||||||||||||
| Net realized gain upon sale of marketable securities | (79) | — | (79) | 100.0 | |||||||||||||||||||
| Net unrealized change in fair value of investment in marketable securities | 2,984 | — | 2,984 | 100.0 | |||||||||||||||||||
| Gain on disposition of property and extinguishment of debt, net | (31,492) | (33,422) | 1,930 | (5.8) | |||||||||||||||||||
| Total revenues and expenses | $ | 12,539 | $ | 4,302 | $ | 8,237 | 191.5 | % | |||||||||||||||
Property general and administrative expenses relate mainly to property expenses unrelated to the operations of the property. Property general and administrative expenses increased slightly during the three months ended March 31, 2022 as compared to the same period in 2021 primarily due to the increase in the size of the number of properties.
Advisor fees relate to the fixed advisory and performance fees earned by the Advisor. Fixed fees increase or decrease based on changes in our NAV, which is primarily impacted by changes in capital raised and the value of our properties. The performance fee is accrued when the total return per share for a share class exceeds 7% for that calendar year, and in such years our Advisor will receive 10% of the excess total return above the 7% threshold. The increase in advisor fees of $11,533 for the three months ended March 31, 2022 as compared to the same period in 2021 is primarily related an increase in NAV and to the accrual of a performance fee in the amount of $8,484.
Company level expenses relate mainly to our compliance and administration related costs. The decrease of $119 in company level expenses for the three months ended March 31, 2022 is primarily related to an decrease in professional fees.
Depreciation and amortization expense is impacted by the values assigned to buildings, personal property and in-place lease assets as part of the initial purchase price allocation. The increase of $13,029 in depreciation and amortization expense for the three months ended March 31, 2022 as compared to the same period in 2021 was primarily related to the acquisition of new properties.
Interest expense increased by $8,590 for the three months ended March 31, 2022 as compared to the same period in 2021 primarily as a result of a $4,523 of increased interest expense from new mortgage notes payable placed on several properties and increased usage of our Credit Facility in 2022 as well as $5,042 increased interest expense on the financial obligations related to the DST Program, which includes non-cash interest expense related to the properties deemed probable for repurchase. Offsetting the increase were unrealized gains on our interest rate swaps in the amount of $1,985 during the three months ended March 31, 2022 compared to unrealized gains of $939 during the same period of 2021.
Loss from unconsolidated affiliates and fund investments relates to the income from Chicago Parking Garage, Pioneer Tower, The Tremont, The Huntington, Siena Suwanee Town Center and Kingston at McLean Crossing as well as changes in fair value and operating distributions received from our investment in the NYC Retail Portfolio and Single-Family Rental Portfolio. During the three months ended March 31, 2022, we recorded a $25,355 increase in the fair value of our investment in Single-Family Rental Portfolio. During the three months ended March 31, 2022, we recorded a $1,447 decrease in the fair value of our investment in the NYC Retail Portfolio as compared to an $1,081 increase in the fair value during the same period of 2021.
Investment income on marketable securities relate to dividends earned on our portfolio of publicly traded REIT securities. We earned $304 on investment income during the three months ended March 31, 2022.
Net realized gain upon the sale of marketable securities relate to sales of individual stocks within our portfolio of publicly traded REIT stocks. We recorded a realized gain of $79 during the three months ended March 31, 2022.
36
Net unrealized change in fair value of investment in marketable securities relate to changes in fair value of our portfolio of publicly traded REIT securities. We recorded an unrealized loss of $2,984 during the three months ended March 31, 2022.
Gain on disposition of property and extinguishment of debt, net decreased by $1,930 during three months ending March 31, 2022 as compared to the three months ended March 31, 2021. During the three months ending March 31, 2022 we disposed of Norfleet Distribution Center and The Edge at Lafayette. During the three months ended March 31, 2021 we disposed of South Seattle Disposition Center.
37
Funds From Operations
Consistent with real estate industry and investment community preferences, we consider funds from operations ("FFO") as a supplemental measure of the operating performance for a real estate investment trust and a complement to GAAP measures because it facilitates an understanding of the operating performance of our properties. The National Association of Real Estate Investment Trusts ("NAREIT") defines FFO as net income (loss) attributable to the Company (computed in accordance with GAAP), excluding gains or losses from cumulative effects of accounting changes, extraordinary items, impairment write-downs of depreciable real estate and sales of properties, plus real estate related depreciation and amortization and after adjustments for these items related to noncontrolling interests and unconsolidated affiliates.
FFO does not give effect to real estate depreciation and amortization because these amounts are computed to allocate the cost of a property over its useful life. We also use Adjusted FFO ("AFFO") as a supplemental measure of operating performance. We define AFFO as FFO adjusted for straight-line rental income, amortization of above- and below-market leases, amortization of net discount on assumed debt, gains or losses on the extinguishment and modification of debt, performance fees based on the investment returns on shares of our common stock and acquisition expenses. Because values for well-maintained real estate assets have historically increased or decreased based upon prevailing market conditions, we believe that FFO and AFFO provide investors with an additional view of our operating performance.
In order to provide a better understanding of the relationship between FFO, AFFO and GAAP net income, the most directly comparable GAAP financial reporting measure, we have provided reconciliations of GAAP net income attributable to Jones Lang LaSalle Income Property Trust, Inc. to FFO, and FFO to AFFO. FFO and AFFO do not represent cash flow from operating activities in accordance with GAAP, should not be considered alternatives to GAAP net income and are not measures of liquidity or indicators of our ability to make cash distributions. We believe that to more comprehensively understand our operating performance, FFO and AFFO should be considered along with the reported net income attributable to Jones Lang LaSalle Income Property Trust, Inc. and our cash flows in accordance with GAAP, as presented in our consolidated financial statements. Our presentations of FFO and AFFO are not necessarily comparable to the similarly titled measures of other REITs due to the fact that not all REITs use the same definitions.
The following table presents a reconciliation of the most comparable GAAP amount of net income attributable to Jones Lang LaSalle Income Property Trust, Inc. to NAREIT FFO for the periods presented:
| Reconciliation of GAAP net income to NAREIT FFO | Three Months Ended March 31, 2022 | Three Months Ended March 31, 2021 | |||||||||
Net income attributable to Jones Lang LaSalle Income Property Trust, Inc. Common Stockholders (1) | $ | 37,935 | $ | 30,105 | |||||||
Real estate depreciation and amortization (1) | 35,189 | 23,422 | |||||||||
Gain on disposition of property and unrealized gain on investment in unconsolidated real estate affiliate (1) | (53,588) | (34,416) | |||||||||
| NAREIT FFO attributable to Jones Lang LaSalle Income Property Trust, Inc. Common Stockholders | $ | 19,536 | $ | 19,111 | |||||||
| Weighted average shares outstanding, basic and diluted | 212,104,884 | 174,765,072 | |||||||||
| NAREIT FFO per share, basic and diluted | $ | 0.09 | $ | 0.11 | |||||||
________
(1) Excludes amounts attributable to noncontrolling interests and includes our ownership share of both consolidated properties and unconsolidated real estate affiliates.
38
We believe AFFO is useful to investors because it provides supplemental information regarding the performance of our portfolio over time.
The following table presents a reconciliation of NAREIT FFO to AFFO for the periods presented:
| Reconciliation of NAREIT FFO to AFFO | Three Months Ended March 31, 2022 | Three Months Ended March 31, 2021 | |||||||||
| NAREIT FFO attributable to Jones Lang LaSalle Income Property Trust, Inc. Common Stockholders | $ | 19,536 | $ | 19,111 | |||||||
Straight-line rental income (1) | (1,687) | (595) | |||||||||
Amortization of above- and below-market leases (1) | (818) | (762) | |||||||||
Amortization of net discount on assumed debt (1) | (333) | (58) | |||||||||
Gain on derivative instruments and extinguishment or modification of debt (1) | (4,462) | (776) | |||||||||
Adjustment for investments accounted for under the fair value option (2) | 1,432 | 444 | |||||||||
Net unrealized change in fair value of investment in marketable securities (1) | 2,886 | — | |||||||||
Performance fees (1) | 8,207 | — | |||||||||
Acquisition expenses (1) | 35 | 108 | |||||||||
Adjustment for DST Program properties (3) | 477 | (1,327) | |||||||||
| AFFO attributable to Jones Lang LaSalle Income Property Trust, Inc. Common Stockholders | $ | 25,273 | $ | 16,145 | |||||||
| Weighted average shares outstanding, basic and diluted | 212,104,884 | 174,765,072 | |||||||||
| AFFO per share, basic and diluted | $ | 0.12 | $ | 0.09 | |||||||
________
(1) Excludes amounts attributable to noncontrolling interests and includes our ownership share of both consolidated properties and unconsolidated real estate affiliates.
(2) Represents the normal and recurring AFFO reconciling adjustments for the NYC Retail Portfolio and Single-Family Rental Portfolio.
(3) Adjustments to reflect the AFFO attributable to the Company for DST Program properties. Prior periods adjusted to conform to current period presentation.
39
NAV as of March 31, 2022
The following table provides a breakdown of the major components of our NAV as of March 31, 2022:
| March 31, 2022 | |||||||||||||||||||||||||||||||||||
| Component of NAV | Class A Shares | Class M Shares | Class A-I Shares | Class M-I Shares | Class D Shares | Total | |||||||||||||||||||||||||||||
Real estate investments (1) | $ | 2,425,928 | $ | 875,516 | $ | 217,131 | $ | 1,433,230 | $ | 140,196 | $ | 5,092,001 | |||||||||||||||||||||||
| Debt | (965,835) | (348,569) | (86,446) | (570,612) | (55,816) | (2,027,278) | |||||||||||||||||||||||||||||
| Other assets and liabilities, net | 80,620 | 29,095 | 7,216 | 47,630 | 4,659 | 169,220 | |||||||||||||||||||||||||||||
| Estimated enterprise value premium | None assumed | None assumed | None assumed | None assumed | None assumed | None assumed | |||||||||||||||||||||||||||||
| NAV | $ | 1,540,713 | $ | 556,042 | $ | 137,901 | $ | 910,248 | $ | 89,039 | $ | 3,233,943 | |||||||||||||||||||||||
| Number of outstanding shares | 104,576,961 | 37,681,185 | 9,335,732 | 61,681,208 | 6,041,611 | ||||||||||||||||||||||||||||||
| NAV per share | $ | 14.73 | $ | 14.76 | $ | 14.77 | $ | 14.76 | $ | 14.74 | |||||||||||||||||||||||||
________
(1)The value of our real estate investments was greater than the historical cost by 9.8% as of March 31, 2022.
The following table provides a breakdown of the major components of our NAV as of December 31, 2021:
| December 31, 2021 | |||||||||||||||||||||||||||||||||||
| Component of NAV | Class A Shares | Class M Shares | Class A-I Shares | Class M-I Shares | Class D Shares | Total | |||||||||||||||||||||||||||||
Real estate investments (1) | $ | 2,307,210 | $ | 842,232 | $ | 216,341 | $ | 1,217,062 | $ | 173,358 | $ | 4,756,203 | |||||||||||||||||||||||
| Debt | (988,699) | (360,918) | (92,708) | (521,543) | (74,289) | (2,038,157) | |||||||||||||||||||||||||||||
| Other assets and liabilities, net | 37,998 | 13,871 | 3,563 | 20,044 | 2,856 | 78,332 | |||||||||||||||||||||||||||||
| Estimated enterprise value premium | None assumed | None assumed | None assumed | None assumed | None assumed | None assumed | |||||||||||||||||||||||||||||
| NAV | $ | 1,356,509 | $ | 495,185 | $ | 127,196 | $ | 715,563 | $ | 101,925 | $ | 2,796,378 | |||||||||||||||||||||||
| Number of outstanding shares | 100,038,362 | 36,458,191 | 9,356,309 | 52,676,693 | 7,513,281 | ||||||||||||||||||||||||||||||
| NAV per share | $ | 13.56 | $ | 13.58 | $ | 13.59 | $ | 13.58 | $ | 13.57 | |||||||||||||||||||||||||
________
(1)The value of our real estate investments was greater than the historical cost by 3.6% as of December 31, 2021.
The increase in NAV per share from December 31, 2021 to March 31, 2022, was related to a net increase of 5.9% in the value of our portfolio. Property operations for the three months ended March 31, 2022 had an insignificant impact on NAV as dividends declared offset property operations for the period. Our NAV for the different share classes is reduced by normal and recurring class-specific fees and offering and organization costs.
40
The following are key assumptions (shown on a weighted-average basis) that are used in the discounted cash flow models to estimate the value of our real estate investments as of March 31, 2022:
| Industrial | Office | Residential | Retail | Other (1) | Total Company | ||||||||||||||||||||||||||||||
| Exit capitalization rate | 4.44 | % | 5.30 | % | 4.39 | % | 5.49 | % | 6.25 | % | 4.71 | % | |||||||||||||||||||||||
| Discount rate/internal rate of return (IRR) | 5.60 | 6.16 | 5.86 | 6.36 | 7.80 | 5.91 | |||||||||||||||||||||||||||||
| Annual market rent growth rate | 3.44 | 2.86 | 3.30 | 2.76 | 3.07 | 3.20 | |||||||||||||||||||||||||||||
| Holding period (years) | 10.00 | 10.00 | 10.00 | 10.00 | 21.68 | 10.08 | |||||||||||||||||||||||||||||
________
(1) Other includes two standalone parking garages. South Beach Parking Garage is subject to a ground lease and the appraisal incorporates discounted cash flows over its remaining lease term and therefore does not utilize an exit capitalization rate.
The following are key assumptions (shown on a weighted-average basis) that are used in the discounted cash flow models to estimate the value of our real estate investments as of December 31, 2021:
| Industrial | Office | Residential | Retail | Other (1) | Total Company | ||||||||||||||||||||||||||||||
| Exit capitalization rate | 4.61 | % | 5.54 | % | 4.51 | % | 5.49 | % | 6.25 | % | 4.85 | % | |||||||||||||||||||||||
| Discount rate/internal rate of return (IRR) | 5.62 | 6.32 | 5.94 | 6.42 | 7.80 | 5.99 | |||||||||||||||||||||||||||||
| Annual market rent growth rate | 3.30 | 2.77 | 3.31 | 2.74 | 3.07 | 3.14 | |||||||||||||||||||||||||||||
| Holding period (years) | 10.00 | 10.00 | 10.00 | 10.00 | 21.83 | 10.09 | |||||||||||||||||||||||||||||
________
(1) Other includes Chicago and South Beach parking garages. South Beach Parking Garage is subject to a ground lease, the appraisal incorporates discounted cash flows over its remaining lease term and therefore does not utilize an exit capitalization rate.
While we believe our assumptions are reasonable, a change in these assumptions would impact the calculation of the value of our real estate investments. For example, assuming all other factors remain unchanged, the changes listed below would result in the following effects on our real estate investment value:
| Input | March 31, 2022 | December 31, 2021 | ||||||||||||||||||
| Discount Rate - weighted average | 0.25% increase | (1.8) | % | (1.7) | % | |||||||||||||||
| Exit Capitalization Rate - weighted average | 0.25% increase | (3.2) | (2.8) | |||||||||||||||||
| Annual market rent growth rate - weighted average | 0.25% decrease | (1.4) | (1.2) | |||||||||||||||||
The fair value of our mortgage notes and other debt payable was estimated to be approximately $67,899 lower and $4,054 higher than the carrying values at March 31, 2022 and December 31, 2021, respectively. The NAV per share would have increased by $0.31 and decreased by $0.02 per share at March 31, 2022 and December 31, 2021, respectively, if we were to have included the fair value of our mortgage notes and other debt payable in our methodology to determine NAV.
The selling commission and dealer manager fee are offering costs and are recorded as a reduction of capital in excess of par value. Selling commissions are paid on the date of sale of our common stock. We accrue all future dealer manager fees up to the ten percent regulatory limit on the date of sale of our common stock. For NAV calculation purposes, dealer manger fees are accrued daily, on a continuous basis equal to 1/365th of the stated fee. Dealer manager fees payable are included in accrued offering costs on our Consolidated Balance Sheets. Dealer manager fees payable as of March 31, 2022 and December 31, 2021 were $152,529 and $135,663, respectively.
41
The following table reconciles stockholders' equity per our Consolidated Balance Sheet to our NAV:
| March 31, 2022 | |||||
| Stockholders' equity under GAAP | $ | 1,919,120 | |||
| Adjustments: | |||||
Accrued dealer manager fees (1) | 151,016 | ||||
Organization and offering costs (2) | 698 | ||||
Unrealized real estate appreciation (3) | 816,793 | ||||
Accumulated depreciation, amortization and other (4) | 346,316 | ||||
| NAV | $ | 3,233,943 | |||
________
(1) Accrued dealer manager fees represents the accrual for future dealer manager fees for Class A, Class M and Class A-I shares. We accrue all future dealer manager fees up to the ten percent regulatory limit on the date of sale of our common stock as an offering cost. For NAV calculation purposes, dealer manger fees are accrued daily, on a continuous basis equal to 1/365th of the stated fee.
(2) The Advisor advanced organization and offering costs on our behalf through March 31, 2022. Such costs are reimbursed to the Advisor ratably over 36 months. Under GAAP, organization costs are expensed as incurred and offering costs are charged to equity as such amounts are incurred. For NAV, such costs are recognized as a reduction to NAV ratably over 36 months.
(3) Our investments in real estate are presented under historical cost in our GAAP Consolidated Financial Statements. As such, any increases in the fair market value of our investments in real estate are not included in our GAAP results. For purposes of determining our NAV, our investments in real estate are recorded at fair value.
(4) We depreciate our investments in real estate and amortize certain other assets and liabilities in accordance with GAAP. Such depreciation and amortization is not recorded for purposes of determining our NAV. Additionally, we make other fair value adjustments to our NAV to account for differences with historical cost GAAP; an example would be straight-line rent revenue.
Limitations and Risks
As with any valuation methodology, our methodology is based upon a number of estimates and assumptions that may not be accurate or complete. Our valuation methodology may not result in the determination of the fair value of our net assets as our mortgage notes and other debt payable are valued at cost. Different parties with different assumptions and estimates could derive a different NAV per share. Accordingly, with respect to our NAV per share, we can provide no assurance that:
•a stockholder would be able to realize this NAV per share upon attempting to resell his or her shares;
•we would be able to achieve for our stockholders the NAV per share upon a listing of our shares of common stock on a national securities exchange, selling our real estate portfolio or merging with another company; or
•the NAV per share, or the methodologies relied upon to estimate the NAV per share, will be found by any regulatory authority to comply with any regulatory requirements.
Furthermore, the NAV per share was calculated as of a particular point in time. The NAV per share will fluctuate over time in response to, among other things, changes in real estate market fundamentals, capital markets activities and attributes specific to the properties and leases within our portfolio.
42
Liquidity and Capital Resources
Our primary uses and sources of cash are as follows:
| Uses | Sources | |||||||||||||
| Short-term liquidity and capital needs such as: | • | Operating cash flow, including the receipt of distributions of our share of cash flow produced by our unconsolidated real estate affiliates and fund investment | ||||||||||||
• | Interest payments on debt | |||||||||||||
• | Distributions to stockholders | • | Proceeds from secured loans collateralized by individual properties | |||||||||||
• | Fees payable to our Advisor | |||||||||||||
• | Minor improvements made to individual properties that are not recoverable through expense recoveries or common area maintenance charges to tenants | • | Proceeds from our Revolving Credit Facility | |||||||||||
• | Sales of our shares | |||||||||||||
• | General and administrative costs | • | Sales of real estate investments | |||||||||||
• | Costs associated with capital raising in our continuous public offering, private offering and DST Program | • | Proceeds from our private offering | |||||||||||
• | Other Company level expenses | • | Draws from lender escrow accounts | |||||||||||
• | Lender escrow accounts for real estate taxes, insurance, and capital expenditures | • | Sales of beneficial interests in the DST Program | |||||||||||
• | Fees payable to our Dealer Manager | |||||||||||||
| Longer-term liquidity and capital needs such as: | ||||||||||||||
• | Acquisitions of new real estate investments | |||||||||||||
• | Expansion of existing properties | |||||||||||||
• | Tenant improvements and leasing commissions | |||||||||||||
• | Debt repayment requirements, including both principal and interest | |||||||||||||
• | Repurchases of our shares pursuant to our share repurchase plan | |||||||||||||
• | Fees payable to our Advisor | |||||||||||||
• | Fees payable to our Dealer Manager | |||||||||||||
The sources and uses of cash for the three months ended March 31, 2022 and 2021 were as follows:
| Three Months Ended March 31, 2022 | Three Months Ended March 31, 2021 | $ Change | |||||||||||||||
| Net cash (used in) provided by operating activities | $ | ( | $ | 17,172 | $ | (30,903) | |||||||||||
| Net cash used in investing activities | ( | (166,868) | 82,179 | ||||||||||||||
| Net cash provided by financing activities | 121,042 | 41,472 | |||||||||||||||
Net cash (used in) provided by operating activities decreased by $30,900 for the three months ended March 31, 2022 as compared to the same period in 2021. The decrease in cash from operating activities is primarily due to the payment of the performance fee earned in 2021 in the amount of $36,711 offset by increase in cash from new acquisitions as well as increased rent collections from several tenants primarily in our retail segment.
Net cash used in investing activities decreased by $82,179 for the three months ended March 31, 2022 as compared to the same period in 2021. The decrease was primarily related to decreased acquisitions made during the three months ended March 31, 2022 as compared to the same period in 2021.
Net cash provided by financing activities decreased by $41,469 for the three months ended March 31, 2022 as compared to the same period in 2021. The change is primarily related to an increase of $65,796 in stock issuance during the three months ended March 31, 2022 as compared to the same period in 2021. Offsetting the increase was $29,252 less of net proceeds from mortgage notes and other debt payment during the three months ended March 31, 2022 as compared to the same period in 2021.
43
Financing
We have relied primarily on fixed-rate financing, locking in what were favorable spreads between real estate income yields and mortgage interest rates and have tried to maintain a balanced schedule of debt maturities. We also use interest rate derivatives to manage our exposure to interest rate movements on our variable rate debt. The following consolidated debt table provides information on the outstanding principal balances and the weighted average interest rates at March 31, 2022 and December 31, 2021:
| Consolidated Debt | |||||||||||||||||||||||
| March 31, 2022 | December 31, 2021 | ||||||||||||||||||||||
| Principal Balance | Weighted Average Interest Rate | Principal Balance | Weighted Average Interest Rate | ||||||||||||||||||||
| Fixed | $ | 1,322,079 | 3.33 | % | $ | 1,268,220 | 3.37 | % | |||||||||||||||
| Variable | 496,400 | 1.91 | 551,400 | 1.71 | |||||||||||||||||||
| Total | $ | 1,818,479 | 2.94 | % | $ | 1,819,620 | 2.86 | % | |||||||||||||||
Covenants
At March 31, 2022, we were in compliance with all debt covenants.
Other Sources
On December 21, 2021, our Current Public Offering registration statement was declared effective with the SEC (Commission File No. 333-256823) to register up to $3,000,000 in any combination of shares of our Class A, Class M, Class A-I and Class M-I common stock, consisting of up to $2,700,000 of shares offered in our primary offering and up to $300,000 in shares offered pursuant to our distribution reinvestment plan. We intend to offer shares of our common stock on a continuous basis for an indefinite period of time by filing a new registration statement before the end of each three-year offering period, subject to regulatory approval. We intend to use the net proceeds from the Current Public Offering, which are not used to pay the fees and other expenses attributable to our operations, to (1) grow and further diversify our portfolio by making investments in accordance with our investment strategy and policies, (2) repay indebtedness incurred under various financing instruments and (3) fund repurchases under our share repurchase plan.
On March 3, 2015, we commenced the Private Offering of up to $350,000 in shares of our Class D common stock with an indefinite duration. Proceeds from our Private Offering will be used for the same corporate purposes as the proceeds of our public offerings. We will reserve the right to terminate the Private Offering at any time and to extend the Private Offering term to the extent permissible under applicable law.
On October 16, 2019, we through our operating partnership, initiated the DST Program to raise up to $500,000, which our board of directors increased to $1,000,000 on August 10, 2021, in private placements exempt from registration under the Securities Act, as amended, through the sale of beneficial interests to accredited investors in specific DSTs holding real properties, which may be sourced from our real properties or from third parties.
Contractual Cash Obligations and Commitments
From time to time, we enter into contingent agreements for the acquisition and financing of properties. Such acquisitions and financings are subject to satisfactory completion of due diligence or meeting certain leasing or occupancy thresholds.
We are subject to fixed ground lease payments on South Beach Parking Garage of $112 per year until September 30, 2024 and these payments will increase every five years thereafter by the lesser of 12% or the cumulative CPI over the previous five year period. We are also subject to a variable ground lease payment calculated as 2.5% of revenue. The lease expires September 30, 2041 and has a ten-year renewal option.
The operating agreement for Grand Lakes Marketplace allows the unrelated third party joint venture partner, owning a 10% interest, to put its interest to us at a market determined value.
The operating agreement for 237 Via Vera Cruz, 13500 Danielson Street, 4211 Starboard, 2840, Loaker Avenue and 15890 Bernardo Center Drive allows the unrelated third party joint venture partner, owning a 5% interest, to put its interest to us at a market determined value starting July 31, 2024.
The operating agreement for Presley Uptown allows the unrelated third party joint venture partner, owning a 2.5% interest, to put its interest to us at a market determined value starting September 30, 2022 until September 30, 2024.
44
Off Balance Sheet Arrangements
None.
Distributions to Stockholders
To remain qualified as a REIT for federal income tax purposes, we must distribute or pay tax on 100% of our capital gains and distribute at least 90% of ordinary taxable income to stockholders.
The following factors, among others, will affect operating cash flow and, accordingly, influence the decisions of our board of directors regarding distributions:
•scheduled increases in base rents of existing leases;
•changes in minimum base rents and/or overage rents attributable to replacement of existing leases with new or renewal leases;
•changes in occupancy rates at existing properties and procurement of leases for newly acquired or developed properties;
•necessary capital improvement expenditures or debt repayments at existing properties;
•ability of our tenants to pay rent as a result of the impact of COVID-19 on their financial condition; and
•our share of distributions of operating cash flow generated by the unconsolidated real estate affiliates, less management costs and debt service on additional loans that have been or will be incurred.
We anticipate that operating cash flow, cash on hand, proceeds from dispositions of real estate investments or refinancings will provide adequate liquidity to conduct our operations, fund general and administrative expenses, fund operating costs and interest payments and allow distributions to our stockholders in accordance with the REIT qualification requirements of the Internal Revenue Code of 1986, as amended.
Item 3. | Quantitative and Qualitative Disclosures About Market Risk. | ||||
We are subject to market risk associated with changes in interest rates in terms of our variable-rate debt and the price of new fixed-rate debt for refinancing of existing debt. We manage our interest rate risk exposure by obtaining fixed-rate loans where possible as well as by entering into interest rate cap and swap agreements. As of March 31, 2022, we had consolidated debt of $1,818,479. Including the $1,523 net debt discount on assumed debt and debt issuance costs, we have consolidated debt of $1,816,956 at March 31, 2022. We also entered into interest rate swap agreements on $190,000 of debt, which cap the LIBOR rate at between 1.4% and 2.6%. A 0.25% movement in the interest rate on the $496,400 of variable-rate debt would have resulted in a $1,241 annualized increase or decrease in consolidated interest expense and cash flow from operating activities.
We are subject to interest rate risk with respect to our fixed-rate financing in that changes in interest rates will impact the fair value of our fixed-rate financing. To determine fair market value, the fixed-rate debt is discounted at a rate based on an estimate of current lending rates, assuming the debt is outstanding through maturity and considering the collateral. At March 31, 2022, the fair value of our consolidated debt was estimated to be $67,899 lower than the carrying value of $1,818,479 If treasury rates were 0.25% higher as of March 31, 2022, the fair value of our consolidated debt would have been $72,029 lower than the carrying value.
Item 4. | Controls and Procedures. | ||||
Evaluation of Disclosure Controls and Procedures
Under the supervision and with the participation of our management, including our chief executive officer and chief financial officer, we conducted an evaluation of the effectiveness of the design and operation of our disclosure controls and procedures (as defined in Rules 13a-15(e) and 15d-15(e) under the Exchange Act), as of the end of the period covered by this report. Based on management’s evaluation as of March 31, 2022, our chief executive officer and chief financial officer concluded that our disclosure controls and procedures were effective to provide reasonable assurance that the information required to be disclosed by us in our reports that we file or submit under the Exchange Act is recorded, processed, summarized and reported within the time periods specified in the SEC’s rules and forms and such information is accumulated and
45
communicated to management, including our chief executive officer and chief financial officer, as appropriate, to allow timely decisions regarding required disclosure.
Changes in Internal Control Over Financial Reporting
There have not been any changes in our internal control over financial reporting (as such term is defined in Rule 13a-15(f) under the Securities and Exchange Act of 1934, as amended) during the quarter ended March 31, 2022 that have materially affected, or are reasonably likely to materially affect, our internal control over financial reporting. We have not experienced any material impact to our internal control over financial reporting to date as a result of most of the employees of our Advisor and its affiliates working remotely due to the COVID-19 pandemic.
PART II
OTHER INFORMATION
Item 1. | Legal Proceedings. | ||||
We are involved in various claims and litigation matters arising in the ordinary course of business, some of which involve claims for damages. Many of these matters are covered by insurance, although they may nevertheless be subject to deductibles or retentions. Although the ultimate liability for these matters cannot be determined, based upon information currently available, we believe the ultimate resolution of such claims and litigation will not have a material adverse effect on our financial position, results of operations or liquidity.
Item 1A. | Risk Factors. | ||||
There have been no material changes to the risk factors previously disclosed under "Item 1A. Risk Factors" 2021 Form 10-K.
| Item 2. | Unregistered Sales of Equity Securities and Use of Proceeds. | ||||
Issuer Purchases of Equity Securities
Our share repurchase plan limits repurchases during any calendar quarter to shares with an aggregate value (based on the repurchase price per share on the day the repurchase is effected) of 5% of the combined NAV of all classes of shares as of the last day of the previous calendar quarter, which means that in any 12-month period, we limit repurchases to approximately 20% of our total NAV. If the quarterly volume limitation is reached on or before the third business day of a calendar quarter, repurchase requests during the next quarter will be satisfied on a stockholder by stockholder basis, which we refer to as a “per stockholder allocation,” instead of a first-come, first-served basis. Pursuant to the per stockholder allocation, each of our stockholders would be allowed to request repurchase at any time during such quarter of a total number of shares not to exceed 5% of the shares of common stock the stockholder held as of the end of the prior quarter. The per stockholder allocation requirement will remain in effect for each succeeding quarter for which the total repurchases for the immediately preceding quarter exceeded four percent of our NAV on the last business day of such preceding quarter. If total repurchases during a quarter for which the per stockholder allocation applies are equal to or less than four percent of our NAV on the last business day of such preceding quarter, then repurchases will again be first-come, first-served for the next succeeding quarter and each quarter thereafter.
During the three months ended March 31, 2022, we repurchased 3,012,118 shares of common stock under the share repurchase plan.
| Period | Total Number of Shares Purchased | Average Price Paid per Share | Total Number of Shares Purchased as Part of Publicly Announced Plans or Programs | Maximum Number of Shares that May Yet Be Purchased Pursuant to the Program (1) | ||||||||||||||||||||||
| January 1 - January 31, 2022 | 1,931,656 | $ | 13.52 | 1,931,656 | — | |||||||||||||||||||||
| February 1 - February 28, 2022 | 531,858 | 13.73 | 531,858 | — | ||||||||||||||||||||||
| March 1 - March 31, 2022 | 548,604 | 14.29 | 548,604 | — | ||||||||||||||||||||||
Total | 3,012,118 | $ | 13.70 | 3,012,118 | — | |||||||||||||||||||||
________
46
(1) Repurchases are limited as described above.
Unregistered Sales of Equity Securities
On March 3, 2015, we commenced the Private Offering of up to $350,000 in shares of our Class D common stock with an indefinite duration. No Class D shares were issued during the three months ended March 31, 2022.
Item 3. | Defaults Upon Senior Securities. | ||||
Not applicable.
Item 4. | Mine Safety Disclosures. | ||||
Not applicable.
Item 5. | Other Information. | ||||
None.
47
Item 6. | Exhibits. | ||||
| Exhibit No. | Description | |||||||
31.1* | Certification of Chief Executive Officer Pursuant to Section 302 of the Sarbanes-Oxley Act of 2002. | |||||||
31.2* | Certification of Chief Financial Officer Pursuant to Section 302 of the Sarbanes-Oxley Act of 2002. | |||||||
32.1* | Certification of Chief Executive Officer Pursuant to Section 906 of the Sarbanes-Oxley Act of 2002. | |||||||
32.2* | Certification of Chief Financial Officer Pursuant to Section 906 of the Sarbanes-Oxley Act of 2002. | |||||||
| 101.INS* | XBRL Instance Document | |||||||
| 101.SCH* | XBRL Schema Document | |||||||
| 101.CAL* | XBRL Calculation Linkbase Document | |||||||
| 101.DEF* | Definition Linkbase Document | |||||||
| 101.LAB* | XBRL Labels Linkbase Document | |||||||
| 101.PRE* | XBRL Presentation Linkbase Document | |||||||
| 104* | Cover Page Intereactive Data File (formatted as inline XBRL with applicable taxonomy extension information contained in Exhibits 101) | |||||||
__________
* Filed herewith.
48
SIGNATURES
Pursuant to the requirements of Section 13 or 15(d) of the Securities Exchange Act of 1934, the Registrant, Jones Lang LaSalle Income Property Trust, Inc., has duly caused this report to be signed on its behalf by the undersigned, thereunto duly authorized.
| JONES LANG LASALLE INCOME PROPERTY TRUST, INC. | |||||||||||
| Date: | May 16, 2022 | By: | /s/ C. Allan Swaringen | ||||||||
| C. Allan Swaringen | |||||||||||
| President, Chief Executive Officer | |||||||||||
| JONES LANG LASALLE INCOME PROPERTY TRUST, INC. | |||||||||||
| Date: | May 16, 2022 | By: | /s/ Gregory A. Falk | ||||||||
| Gregory A. Falk | |||||||||||
| Chief Financial Officer and Treasurer | |||||||||||
49
Serious News for Serious Traders! Try StreetInsider.com Premium Free!
You May Also Be Interested In
- Perk Labs Announces Closing of Non-Brokered Private Placements
- ROSEN, A LEADING AND TOP RANKED LAW FIRM, Encourages Morgan Stanley Investors to Inquire About Securities Class Action Investigation – MS
- Tuktu Resources Ltd. Announces 2023 Year-End Results and Reserves
Create E-mail Alert Related Categories
SEC FilingsSign up for StreetInsider Free!
Receive full access to all new and archived articles, unlimited portfolio tracking, e-mail alerts, custom newswires and RSS feeds - and more!
