

Form 10-K PITNEY BOWES INC /DE/ For: Dec 31
 Tweet
Tweet Share
ShareUNITED STATES
SECURITIES AND EXCHANGE COMMISSION
WASHINGTON, D.C. 20549
FORM 10-K
ANNUAL REPORT PURSUANT TO SECTION 13 OR 15(d) OF THE SECURITIES EXCHANGE ACT OF 1934
For the fiscal year ended December 31 , 20211-3579
| State of incorporation: | I.R.S. Employer Identification No. | |||||||||||||
| Address: | ||||||||||||||||||||
| Telephone Number: | ||||||||||||||||||||
Securities registered pursuant to Section 12(b) of the Act:
| Title of Each Class | Trading Symbol(s) | Name of Each Exchange on Which Registered | ||||||||||||
Indicate by check mark if the registrant is a well-known seasoned issuer, as defined in Rule 405 of the Securities Act. Yes þ No ¨
Indicate by check mark if the registrant is not required to file reports pursuant to Section 13 or Section 15(d) of the Act. Yes ¨ No þ
Indicate by check mark whether the registrant (1) has filed all reports required to be filed by Section 13 or 15(d) of the Securities Exchange Act of 1934 during the preceding 12 months (or for such shorter period that the registrant was required to file such reports), and (2) has been subject to such filing requirements for the past 90 days. Yes þ No ¨
Indicate by check mark whether the registrant has submitted electronically every Interactive Data File required to be submitted pursuant to Rule 405 of Regulation S-T (section 232.405 of this chapter) during the preceding 12 months (or for such shorter period that the registrant was required to submit such files) Yes þ No ¨
Indicate by check mark whether the registrant is a large accelerated filer, an accelerated filer, a non-accelerated filer, a smaller reporting company, or an emerging growth company. See definition of "large accelerated filer," "accelerated filer," "smaller reporting company," and "emerging growth company" in Rule 12b-2 of the Exchange Act.
| þ | Accelerated filer | o | Non-accelerated filer | o | |||||||||||||
| Smaller reporting company | Emerging growth company | ||||||||||||||||
If an emerging growth company, indicate by check mark whether the registrant has elected not to use the extended transition period for complying with new or revised financial accounting standards provided pursuant to Section 13(a) of the Exchange Act. ¨
Indicate by check mark whether the registrant has filed a report on and attestation to its management's assessment of the effectiveness of its internal control over financial reporting under Section 404(b) of the Sarbanes-Oxley Act (15 U.S.C. 7262(b)) by the registered public accounting firm that prepared or issued its audit report. Yes ☑ No ¨
Indicate by check mark whether the registrant is a shell company (as defined in Rule 12b-2 of the Act). Yes ☐ No þ
As of June 30, 2021, the aggregate market value of the registrant's common stock held by non-affiliates of the registrant was $2 billion based on the closing sale price as reported on the New York Stock Exchange. At January 31, 2022, there were 174,855,086 outstanding shares of common stock, $1 par value.
DOCUMENTS INCORPORATED BY REFERENCE
Portions of the registrant's proxy statement to be filed within 120 days after our fiscal year end in connection with the Annual Meeting of Stockholders to be held May 2, 2022, are incorporated by reference in Part III of this Form 10-K.
1
PITNEY BOWES INC.
TABLE OF CONTENTS
| Page Number | ||||||||
| PART I | ||||||||
| Item 1. | ||||||||
| Item 1A. | ||||||||
| Item 1B. | ||||||||
| Item 2. | ||||||||
| Item 3. | ||||||||
| Item 4. | ||||||||
| PART II | ||||||||
| Item 5. | ||||||||
| Item 6. | ||||||||
| Item 7. | ||||||||
| Item 7A. | ||||||||
| Item 8. | ||||||||
| Item 9. | ||||||||
| Item 9A. | ||||||||
| Item 9B. | ||||||||
| Item 9C. | ||||||||
| PART III | ||||||||
| Item 10. | ||||||||
| Item 11. | ||||||||
| Item 12. | ||||||||
| Item 13. | ||||||||
| Item 14. | ||||||||
| PART IV | ||||||||
| Item 15. | ||||||||
| Item 16. | ||||||||
2
PART I
Forward-Looking Statements
This Annual Report on Form 10-K (Annual Report) contains statements that are forward-looking. We believe that these forward-looking statements are reasonable based on our current expectations and assumptions. However, we caution readers that any forward-looking statement within the meaning of Section 27A of the Securities Act of 1933 and Section 21E of the Securities Exchange Act of 1934 are subject to risks and uncertainties and actual results could differ materially. Words such as "estimate," "target," "project," "plan," "believe," "expect," "anticipate," "intend" and similar expressions may identify such forward-looking statements. We undertake no obligation to publicly update or revise any forward-looking statement, whether as a result of new information, future events or otherwise, except as required by law. Forward-looking statements in this Annual Report speak only as of the date hereof, and forward-looking statements in documents attached that are incorporated by reference speak only as of the date of those documents.
Although we believe that the expectations reflected in any of our forward-looking statements are reasonable, actual results could differ materially from those projected or assumed in our forward-looking statements. Our future financial condition, results of operations and forward-looking statements are subject to change and to inherent risks and uncertainties, as disclosed or incorporated by reference in our filings with the Securities and Exchange Commission (the SEC). In particular, we continue to navigate the impacts of the COVID-19 pandemic (COVID-19) and the effect that its unpredictability is having on our, and our client's business, financial performance and results of operations. Other factors which could cause future financial performance to differ materially from the expectations, and which may also be exacerbated by COVID-19 or a negative change in the economy, include, without limitation:
•declining physical mail volumes
•changes in postal regulations or the operations and financial health of posts in the U.S. or other major markets, or changes to the broader postal or shipping markets
•the loss of, or significant changes to, our contractual relationships with the United States Postal Service (USPS) or USPS' performance under those contracts
•our ability to continue to grow and manage unexpected fluctuations in volumes, gain additional economies of scale and improve profitability within our Global Ecommerce segment
•changes in labor and transportation availability and costs
•global supply chain issues adversely impacting our third-party suppliers' ability to provide us products and services
•declines in demand for our ecommerce services resulting from supply chain delays or interruptions affecting our retail clients, or changes in retail consumer behavior or spending patterns
•competitive factors, including pricing pressures, technological developments and the introduction of new products and services by competitors
•the loss of some of our larger clients in our Global Ecommerce and Presort Services segments
•the impacts of inflation and rising prices on our costs and expenses, and to our clients and retail consumers
•expenses and potential impacts resulting from a breach of security, including cyber-attacks or other comparable events
•the potential impacts on our cost of debt due to potential interest rate increases
•our success at managing customer credit risk
•capital market disruptions or credit rating downgrades that adversely impact our ability to access capital markets at reasonable costs
•our success in developing and marketing new products and services and obtaining regulatory approvals, if required
•the continued availability and security of key information technology systems and the cost to comply with information security requirements and privacy laws
•changes in international trade policies, including the imposition or expansion of trade tariffs
•changes in tax laws, rulings or regulations
•our success at managing relationships and costs with outsource providers of certain functions and operations
•changes in banking regulations or the loss of our Industrial Bank charter
•changes in foreign currency exchange rates
•increased environmental and climate change requirements or other developments in these areas
•intellectual property infringement claims
•the use of the postal system for transmitting harmful biological agents, illegal substances or other terrorist attacks
•impact of acts of nature on the services and solutions we offer
Further information about factors that could materially affect us, including our results of operations and financial condition, is contained in Item 1A. "Risk Factors" in this Annual Report.
3
ITEM 1. BUSINESS
General
Pitney Bowes Inc. (we, us, our, or the company) is a global shipping and mailing company that provides technology, logistics, and financial services to small and medium sized businesses, large enterprises, including more than 90 percent of the Fortune 500, retailers and government clients around the world. These clients rely on us to remove the complexity and increase the efficiency in their sending of mail and parcels. For additional information, visit www.pitneybowes.com.
Business Segments
Global Ecommerce
Domestic parcel services offers retailers a cost-effective parcel delivery and returns network for end consumers. We operate numerous domestic parcel sortation centers connected by a nationwide transportation network, enabling us to pick up parcels from retailer distribution centers and move them through our physical network. We also offer fulfillment services, providing pick, pack and ship services for clients through four fulfillment centers co-located within four of our larger parcel sortation centers to facilitate same-day entry into our parcel delivery network.
Cross-border solutions manages all aspects of the international shopping and shipping experience. Our proprietary technology enables global tracking and logistics services; calculates duty, tax and shipping costs at checkout; enables multi-currency pricing, payment processing and fraud management; ensures compliance with product restrictions and produces all documentation requirements to meet export complexities and customs clearance. Our proprietary technology is utilized by direct merchants and major online marketplaces facilitating millions of parcels to be shipped worldwide.
Digital delivery services enables clients to reduce transportation and logistics costs, select the best carrier based on need and cost, improve delivery times and track packages in real-time. Powered by our shipping APIs, clients can purchase postage, print shipping labels and access shipping and tracking services from multiple carriers that can be easily integrated into any web application such as online shopping carts or ecommerce sites and provide guaranteed delivery times and flexible payment options.
Presort Services
We are a workshare partner of the USPS and national outsource provider of mail sortation services that allow clients to qualify large volumes of First-Class Mail, Marketing Mail and Marketing Mail Flats and Bound Printed Matter for postal workshare discounts. Our network of operating centers throughout the United States and fully-customized proprietary technology provides clients with end-to-end solutions from pick up to delivery into the postal system network, expedited mail delivery and optimal postage savings.
Sending Technology Solutions
We provide clients with physical and digital mailing and shipping technology solutions and other applications to help simplify and save on the sending, tracking and receiving of letters, parcels and flats. We also offer supplies and maintenance services for these offerings. Our cloud enabled infrastructure provides software-as-a-service (SaaS) offerings delivered online and via connected or mobile devices. Our latest offerings are designed on an open platform architecture that have the capabilities to leverage partnerships with carriers, developers and other innovative companies to deliver value to our clients. We offer financing alternatives that enable clients to finance equipment and product purchases.
Through our wholly owned subsidiary, The Pitney Bowes Bank (the Bank), we offer our clients in the United States a revolving credit solution that enables clients to make meter rental payments and purchase postage, services and supplies and an interest-bearing deposit solution to clients who prefer to prepay postage. Additionally, we offer financing alternatives that enable clients to finance or lease other manufacturers’ equipment and provide working capital.
We provide revolving credit solutions to clients in Canada and the U.K. that enable them to make meter rental payments and purchase postage, services and supplies.
We establish credit approval limits and procedures based on the credit quality of the client and the type of product or service provided. We closely monitor the portfolio by analyzing industry sectors and delinquency trends by product line, industry and client to ensure reserve levels and credit policies reflect current trends. Management continuously monitors credit lines and collection resources and revises credit policies as necessary.
Seasonality
A larger percentage of our revenue is earned in the fourth quarter relative to the other quarters, driven primarily by higher shipping volumes during the holiday season.
4
Sales and Services
We market our products, solutions and services through a direct and inside sales force, global and regional partner channels, direct mailings and digital channels. We provide call-center, online and on-site support services for our products and solutions. Support services are primarily provided under maintenance contracts.
Competition
Our businesses face competition from large, multinational companies and smaller, more narrowly focused regional and local firms. We compete on the basis of technology and innovation, breadth of product offerings, our ability to design and tailor targeted solutions to meet client needs, performance, service and support, price, quality and brand.
We must continue to invest in our current technologies, products and solutions, and in the development of new technologies, products and solutions in order to maintain and improve our competitive position. We frequently encounter new competitors as the markets in which we participate evolve and newer businesses enter our existing markets.
A summary of the competitive environment for each of our segments is as follows:
Global Ecommerce
The domestic parcel services and cross-border solutions market includes competitors of various sizes, including companies with greater financial resources than us. Some of these competitors specialize in point solutions or freight forwarding services, are full-service ecommerce business process outsourcers and online marketplaces with international logistic support, or major global delivery services companies. We also face competition from companies that can offer both domestic and cross-border solutions in a single package which creates pricing leverage. The principal competitive factors include speed of delivery, price, ease of integration and use, innovative services, reliability, functionality and scalability. We compete based on the accuracy, reliability and scalability of our platform and logistics services, our ability to provide clients and their customers a one-stop full-service ecommerce experience and the ability to provide a more customized shipping solution than some of the larger competitors in the industry.
Our digital delivery services business competes with technology providers who help make shipping easier and more cost-effective. These technology providers range from large, established companies to smaller companies offering negotiated carrier rates. The principal competitive factors include technology stability and reliability, innovation, access to preferred shipping rates and ease of integration with existing systems.
Presort Services
We face competition from regional and local presort providers, cooperatives of multiple local presort providers, consolidators and service bureaus that offer presort solutions as part of a larger bundle of outsourcing services. We also face competition from large mailers that have sufficient volumes and the capability to sort their own mailings in-house and could use excess capacity to offer presort services to others. The principal competitive factors include price, innovative service, delivery speed, tracking and reporting, industry expertise and economies of scale. Our competitive advantages include our extensive network of presort facilities capable of processing significant volumes and our innovative proprietary technology that provides clients with reliable, secure and precise services and maximum postage discounts.
Sending Technology Solutions
We face competition from other mail equipment and solutions providers and those that offer online shipping and mailing products and services solutions. Additionally, the growth of alternative communication methods as compared to physical mail continue to grow, which creates competition to mail and also to our offerings that enable clients to use the mail efficiently. We differentiate ourselves from our competitors through our breadth of physical and digital offerings, including cloud enabled SaaS and open platform architecture offerings; pricing; available financing and payment offerings; product reliability; support services; and our extensive knowledge of the shipping and mailing industry.
Our financing operations face competition, in varying degrees, from large, diversified financial institutions, including leasing companies, commercial finance companies and commercial banks, as well as small, specialized firms. We believe our competitive advantage that differentiates us from our competitors is the breadth of our financing and payment solutions and our ability to seamlessly integrate these solutions into our clients' shipping and mailing operations.
Also see Item 1A. Risk Factors for further details regarding the competition our businesses face.
5
Research, Development and Intellectual Property
We invest in research and development activities to develop new products and solutions, enhance the effectiveness and functionality of existing products and solutions and deliver high value technology and differentiated services in high value segments of the market.
Third-Party Suppliers
Our Sending Technology Solutions (SendTech Solutions) segment depends on third-party suppliers and outsource providers for a variety of services and product components and the hosting of our SaaS offerings. Our Global Ecommerce and Presort Services segments rely on third party suppliers to help equip our facilities, provide warehouse support and assist with our logistical operations. All of our businesses and corporate functions depend on third-party providers for a variety of data analytics, sales, reporting and other functions. In certain instances, we rely on single-sourced or limited-sourced suppliers and outsourcing vendors around the world because doing so is advantageous due to quality, price or lack of alternative sources. We have risk mitigation programs to monitor conditions affecting our suppliers' ability to fulfill expected commitments. We believe that our available sources for services, components, supplies, logistics and manufacturing are adequate.
Regulatory Matters
We are subject to the regulations of postal authorities worldwide related to product specifications of our postage meters. Our Presort Services segment is also subject to regulations of the USPS. The Bank is chartered as an Industrial Bank under the laws of the State of Utah. The Bank and certain company affiliates that provide services to the Bank are subject to the regulations of the Utah Department of Financial Institutions and the Federal Deposit Insurance Corporation. We are also subject to transportation regulations for various parts of our business, customs and trade regulations worldwide related to our cross-border shipping services and regulations concerning data privacy and security for our businesses that use, process and store certain personal, confidential or proprietary data.
Climate Change
Although climate change has had no material impact on our operations to date, the risk of increasingly severe climate events or the risk that those events happen more frequently could affect one or more of our facilities and our ability to conduct daily operations in the future. Increasing regulatory restrictions in response to climate change could also materially affect our costs, especially with respect to transportation.
Human Capital
We have approximately 11,500 employees, with approximately 80% located in the United States. We also rely on a contingent hourly workforce to supplement our full-time workforce to meet fluctuating demand. We seek to create a high-performance culture that will drive and sustain enhanced value for all our stakeholders. To attract, retain and engage the talent needed, we strive to maintain a diverse, inclusive and safe workplace, with equitable opportunities for growth and development, supported by competitive compensation, benefits and health and wellness programs, and by programs that build connections between our employees and their communities.
Diversity and Inclusion
We believe that maintaining a diverse workforce and an inclusive environment for our workforce is important to our success. We celebrate a rich mix of countries, cultures, ages, races, ethnicities, gender identities, sexual orientation, abilities and perspectives that showcase our humanity, differentiate us as individuals and enhance our businesses.
Employee Engagement and Development
We emphasize employee development and training and provide professional development initiatives, training, experiential learning and inclusion networks to our employees to enable them to advance their skills and achieve career goals. We also believe employee engagement is important to the company's success and conduct a survey annually that has driven participation rates with scores reflecting high levels of employee engagement.
Health, Safety and Wellness
We are committed to the health, safety and wellness of our employees. We provide our employees and their families with access to a variety of flexible and convenient health and wellness programs.
In response to COVID-19, we implemented significant changes that we determined were in the best interest of our employees, and the communities in which we operate, and which comply with local and federal government regulations. As the pandemic conditions change, we adapt our approach to keep our employees safe, including allowing them to work remotely when they do not need to be in any of our facilities and adapting our requirements around social distancing or the use of personal protective equipment. We have also
6
taken steps to encourage-but not require-our employees to get vaccinated. We continuously monitor the rate of infection of our employees both overall and in specific facilities.
All of our offices and facilities are open for employees. There are some employees who have been working full-time in our offices and operating centers due to the nature of their work; some have chosen to come in regularly and others are predominantly working from home, coming into our office for purposeful activities. Over the course of the pandemic, we have been developing and will continue to adapt our workplace strategy to reflect the current changes in how people work. As we develop and adjust these approaches, we focus on doing so with an emphasis on maintaining a high level of performance while ensuring an inclusive and safe work environment. This approach provides a consistent framework for recognizing the evolving ways in which we work to deliver value to our stakeholders – warehouse employees who are onsite every day, service technicians, salespeople and drivers travelling to client sites, and office workers working in an array of flexible models. We continue to encourage our employees to get vaccinated, social distance where appropriate, provide and encourage the use of personal protective equipment and monitor the health of our employees. We expect to continue to implement safety measures as necessary and take further actions as government authorities require or recommend, or as we determine to be in the best interests of our employees, customers, partners and suppliers.
Available Information
Our Annual Reports on Form 10-K, Quarterly Reports on Form 10-Q, Current Reports on Form 8-K and any amendments thereto filed with, or furnished to, the SEC, are available, free of charge, through the Investor Relations section of our website at www.investorrelations.pitneybowes.com or from the SEC's website at www.sec.gov, as soon as reasonably practicable after these reports are electronically filed with, or furnished to, the SEC. The other information found on our website is not part of this or any other report we file with or furnish to the SEC.
Information About Our Executive Officers
| Name | Age | Title | Executive Officer Since | |||||||||||||||||
| Marc B. Lautenbach | 60 | President and Chief Executive Officer | 2012 | |||||||||||||||||
| Johnna G. Torsone | 71 | Executive Vice President and Chief Human Resources Officer | 1993 | |||||||||||||||||
| Daniel J. Goldstein | 60 | Executive Vice President and Chief Legal Officer and Corporate Secretary | 2010 | |||||||||||||||||
| Christoph Stehmann | 59 | Executive Vice President, International Sending Technology Solutions | 2016 | |||||||||||||||||
| Jason C. Dies | 52 | Executive Vice President and President, Sending Technology Solutions | 2017 | |||||||||||||||||
| Gregg Zegras | 54 | Executive Vice President and President, Global Ecommerce | 2020 | |||||||||||||||||
| Ana Maria Chadwick | 50 | Executive Vice President and Chief Financial Officer | 2021 | |||||||||||||||||
| James Fairweather | 50 | Executive Vice President, Chief Innovation Officer | 2021 | |||||||||||||||||
There are no family relationships among the above officers. The above officers have served in various executive positions with the company for at least the past five years except as follows:
Mr. Dies was appointed Executive Vice President and President, Sending Technology Solutions in October 2017. He joined the company in 2015 as President, Document Messaging Technologies (DMT). Prior to joining the company, Mr. Dies was employed at IBM where he held several leadership positions in North America, Europe, and Asia across diverse business units.
Mr. Zegras was appointed Executive Vice President and President, Global Ecommerce in July 2020. He joined the company in 2013 as President, Imagitas. Prior to joining the company, Mr. Zegras held several executive leadership positions, including at NBC Universal, Sharecare and Hearst Entertainment.
Ms. Chadwick joined the company as Executive Vice President and Chief Financial Officer on January 29, 2021. Prior to joining the company, Ms. Chadwick was employed at GE Capital as President and CEO of GE Capital Global Legacy Solutions. Ms. Chadwick spent over 20 years at GE Capital, where she held several executive positions, including Controller of GE Capital Americas and CFO at GE Capital Energy Financial Services.
Mr. Fairweather was appointed Executive Vice President and Chief Innovation Officer in May 2021. Prior to this, he was Senior Vice President and Chief Technology Officer, Commerce Services. He has been a leader in the company's strategic digital transformation and technology initiatives across Design, SaaS, Data Science and Analytics, API Management, Security and Mobility.
7
ITEM 1A. RISK FACTORS
Our operations face certain risks that should be considered in evaluating our business. We manage and mitigate these risks on a proactive basis, using an enterprise risk management program. Nevertheless, the following risk factors, some of which may be beyond our control, could materially affect our business, financial condition, results of operations, brand and reputation, and may cause future results to be materially different than our current expectations. These risk factors are not intended to be all inclusive.
COVID-19 Pandemic Risks
Our business, financial condition and results of operations have been, and will continue to be, affected by the unpredictability, duration, and severity of the ongoing COVID-19 pandemic.
The ongoing COVID-19 pandemic has impacted, and is expected to continue to impact, our business, operations, and financial performance. Given the unpredictability, duration, and, at times, the severity of resurgences of the pandemic, its ultimate effect on our business, operations and financial performance remains uncertain. There are many factors, not within our control, which could affect the pandemic's ultimate impact on our businesses and our ability to execute our business strategies and initiatives in the expected time frame. These include, but are not limited to: the response of governments, businesses and individuals to the pandemic; its impact on the labor force, the global economy and economic activity (including inflation), and the spending habits of consumers and businesses; disruptions in global supply chains; and significant volatility and disruption of financial markets. In addition to having the effect of potentially heightening many of our other risk factors in this section, the COVID-19 pandemic has, and may continue to, adversely affect the following to the detriment of our business, including:
•Our ability to sell products and provide services to our clients, fulfill orders, and install equipment on a timely basis and market to prospective new clients due to social distancing rules and heightened security policies.
•The acceleration of the decline of physical mail volumes in the geographies in which we operate, which adversely affects both our Presort Services and SendTech Solutions segments. We cannot yet assess the extent to which these declines in mail volumes, and resulting impact to our business, are permanent or temporary.
•The financial health of posts around the world, especially that of the USPS, given the adverse effects associated with the declines in physical mail volumes. If these financial difficulties are not resolved, or if any resolution requires posts to operate differently, price in a manner that hurts their competitiveness or further reduces postal volume or causes them to change their contractual relationships with their partners or vendors, these changes could have a material adverse effect on our business.
•Costs and reduced labor productivity associated with extended safety protocols, higher levels of employees out sick, hiring and training temporary labor, redirecting volumes to other facilities, and complying with government mandates.
•Global Ecommerce’s costs, including those relating to postage, transportation, and warehouse space, resulting from sudden and significant increases or decreases in volumes, due to unexpected short-term shifts in consumer spending patterns or short-term interruptions or delays in our retail client’s supply chains.
•Our ability to timely obtain parts, supplies, or finished goods from our vendors in order to meet our sales obligations or equip our facilities.
•The frequency of long-distance airplane flights, resulting in higher costs and at times, reduced demand for our Global Ecommerce cross-border offerings.
•Delinquencies in collections and bankruptcies in our clients, which could affect our cash flow. Client requests for potential payment deferrals or other contract modifications could also reduce the profitability or ongoing cash flow from some of our current customers.
•Third-party service providers ability to satisfy their performance obligations to us, which in turn affects our ability to satisfy our service commitments to our clients.
•Our earnings or cash flows, which could result in additional credit rating downgrades, higher costs of borrowing, or limit our access to additional debt.
8
Mailing and Shipping Industry Risks
Further significant deterioration in the financial condition of the USPS, or the national posts in our other major markets, could affect the ability of those posts to provide services to us or our clients, which could adversely affect client demand for our offerings and thus our financial performance.
We are dependent on financially viable national posts in the geographic markets where we operate, particularly in the United States. A significant portion of our revenue depends upon the ability of these posts, especially the USPS, to provide competitive mail and package delivery services to our clients and the quality of the services they provide. Their ability to provide high quality service at affordable rates in turn depends upon their ongoing financial strength. If the posts are unable to continue to provide these services into the future, our financial performance will be adversely affected.
Our ability to compete in the package shipping market in the United States depends upon certain contractual relationships we have with the USPS and the successful performance of those services.
The USPS is our primary provider for the “last mile” component of our parcel delivery services in the United States. This represents a significant component of our cost in offering these services. If we are unable to receive competitive pricing from the USPS or take advantage of lower cost USPS options, our ability to compete with private carriers and to achieve profitable revenue growth will be adversely affected. The quality of service we provide to our clients also depends upon the quality of delivery services received from the USPS. As the ecommerce market continues to evolve, and as the USPS implements changes to its network, if the USPS’ service performance is materially worse than that of the private carriers, we may lose clients to competition and our financial performance will be adversely affected.
We are subject to postal regulations and processes, which could adversely affect our financial performance.
A significant portion of our business is subject to regulation and oversight by the USPS and posts in other major markets. These postal authorities have the power to regulate some of our current products and services. They also must approve many of our new or future product and service offerings before we can bring them to market. If our new or future product and service offerings are not approved, there are significant conditions to approval, regulations on our existing products or services are changed or, we fall out of compliance with those regulations, our financial performance could be adversely affected.
If we are not able to respond to the continuing decline in the volume of physical mail delivered via traditional postal services, our financial performance could be adversely affected.
Traditional mail volumes continue to decline and impact our current and future financial results, primarily within our SendTech Solutions and Presort Services segments. An accelerated or sudden decline could result from changes in communication behavior or available communication technologies, reductions to the Universal Service Obligation (USO) under which the USPS and other national posts are required to deliver to every address in a country with similar pricing and frequency, pandemics, and legislation or regulations that mandate electronic substitution for communication by mail, prohibit certain types of mailings, increase the difficulty of using information or materials in the mail, or impose higher taxes or fees on postal services. If we are not successful at meeting the continuing challenges faced in our mailing business, or if physical mail volumes were to experience an accelerated or sudden decline, our financial performance could be adversely affected.
Significant changes to the laws regulating the USPS or other posts, or changes in their operating models could have an adverse effect on our financial performance.
As a significant portion of our revenue and earnings is dependent on postal operations, changes in the laws and regulations that affect how posts operate could have an adverse effect on our financial performance. As posts consider new strategies for their operations in an era of declining mail volumes and increasing package volumes, if we are unable to work with posts to support those strategies, our financial performance could be adversely affected.
Business Operational Risks
We face intense competition in the industries in which we operate.
The markets for our products and services in each of our segments are highly competitive. In our Global Ecommerce segment, we face competition in our shipping business from full-service ecommerce business process outsourcers, online marketplaces, freight forwarders, and major global delivery services companies, including those that can offer both domestic and cross-border solutions in a single package. Our digital delivery business competes with technology providers ranging from large, established companies to
9
smaller companies offering negotiated carrier rates. If we cannot compete against these competitors with, among other things, speed of delivery, price, reliability, functionality and scalability of our platform and logistic services and ease of integration and use, we may lose clients, incur additional costs and suffer from reduced margins, and the financial results of the segment may be adversely affected. Our Presort Services segment faces competition from regional and local presort providers, cooperatives of multiple local presort providers, consolidators and service bureaus that offer presort solutions as part of a larger bundle of outsourcing services and large volume mailers that have sufficient volumes and the capability to presort their own mailings in-house and could use excess capacity to offer presort services to others. If we are not able to effectively compete on price, innovative service, delivery speed, tracking and reporting, we may lose clients and the financial results of the segment may be adversely affected. Our Sending Technology Solutions segment faces competition from other mail equipment and solutions providers, companies that offer products and services as alternative means of message communications and those that offer online shipping and mailing products and services solutions. In addition, our financing operations face competition, in varying degrees, from large, diversified financial institutions, including leasing companies, commercial finance companies and commercial banks, as well as small, specialized firms. If we are not able to differentiate ourselves from our competitors or effectively compete with them, the financial results of the segment may be adversely affected.
The evolution of our businesses to more digital and shipping-related services has resulted in a decline in our overall profit margins. If we cannot increase our volumes while at the same time reduce our costs, our overall profitability could be adversely affected.
As our businesses shift to more digital and shipping-related services, the relative revenue contribution from our shipping-related offerings now exceeds that of the revenue from our mailing-related offerings. We expect the revenue contribution from shipping services to continue to grow; however, profit margins on these services are lower than those for our mailing-related offerings. Accordingly, if we cannot gain additional economies of scale through increasing volumes, lowering our cost per piece and in turn, improve margins and profitability, our short and long-term financial performance will be adversely affected.
Seasonality of the Global Ecommerce segment, unexpected declines in consumer demand or the performance of our retail customers, or unexpected spikes in the costs of labor or transportation, especially during the fourth quarter, could adversely affect our overall performance.
Our Global Ecommerce segment derives the majority of its revenue from its retail clients. The retail industry is subject to cyclical trends in consumer sentiment and spending habits that are affected by many factors, including prevailing economic conditions, recession or fears of recession, inflation, unemployment levels, pandemics (as continues to be the case with the COVID-19 pandemic) or geopolitical events. Our retail clients are also dependent on third party suppliers to provide them with either raw materials or finished goods to meet the product demands of their clients. Moreover, Global Ecommerce’s annual financial results are also highly dependent on its performance during the peak holiday season in the fourth quarter. If consumer sentiment or spending habits deteriorate or change such that the demand for our clients’ online products is negatively impacted, or if our clients encounter supply chain challenges, we could incur unexpected costs and revenue declines, and if these factors impact our fourth quarter, as occurred in 2021 due to the COVID-19 pandemic, the impact on the segment's financial results could be more severe.
The loss of any of our largest clients in our Global Ecommerce segment could adversely affect the financial performance of that segment.
The Global Ecommerce segment receives a large portion of its revenue from a relatively small number of clients and business partners. The loss of any of these larger clients or business partners, or a substantial reduction in their use of our products or services, could have a material adverse effect on the revenue and profitability of the segment. There can be no assurance that our larger clients and business partners will continue to utilize our products or services at current levels, or that we would be able to replace any of these clients or business partners with others who can generate revenue at current levels.
If we fail to effectively manage our third-party suppliers, or if their ability to perform were negatively impacted, our business, financial performance and reputation could be adversely affected.
Our SendTech Solutions segment relies on third-party suppliers for services and components for our mailing equipment, spare parts, supplies and services and for the hosting of our SaaS offerings. We also rely on third party suppliers to help us equip our Presort and Ecommerce facilities and to provide us with services related to some of our operations. In certain instances, we rely on single-sourced or limited-sourced suppliers around the world because of advantages in quality, price or lack of alternative sources. If our suppliers are not able to provide these services, components or equipment to us in a timely manner, or if the supply chain constraints we are currently experiencing due to the COVID-19 pandemic were to worsen, the quality of the goods or services received were to deteriorate, our relationship with certain suppliers were to be terminated, or if the costs of using these third parties were to increase
10
and we were not able to find alternate suppliers, we could lose clients, incur significant disruptions in manufacturing and operations and increased costs, including higher freight and re-engineering costs.
Fluctuations in transportation costs or disruptions to transportation services in our Global Ecommerce or Presort Services segments could adversely affect client satisfaction or our financial performance.
In addition to our reliance on the USPS, our Global Ecommerce and Presort Services segments rely upon independent third-party transportation service providers to transport a significant portion of our parcel and mail volumes. Some of our providers may also be our competitors. The use of these providers is subject to risks, including our ability to negotiate acceptable terms, increased competition during peak periods, capacity issues, performance problems, extreme weather, natural or man-made disasters, pandemics, increased fuel costs, labor shortages or disputes and other unforeseen difficulties. Any disruption to the timely supply of these services for any reason, any dramatic increase in the cost of these services or any deterioration of the performance of these services (each of which we experienced, at times, during the COVID-19 pandemic), could adversely affect client satisfaction or our financial performance. Given our continued reliance upon these providers, any future unforeseen disruptions affecting these providers could similarly adversely affect client satisfaction and our financial performance.
Our business depends on the our ability to attract, retain and maintain good relationships with, employees at a reasonable cost to meet the needs of our business and to consistently deliver highly differentiated, competitive offerings.
The rapid growth of the ecommerce industry has resulted in intense competition for employees in the shipping, transportation and logistics industry, including drivers and warehouse employees. The COVID-19 pandemic has accelerated this industry growth resulting in our Global Ecommerce segment experiencing a higher demand, and increased competition, for labor, especially in our warehouses. This increased demand and competition for workers has also impacted our Presort Services segment. We supplement our Global Ecommerce and Presort Services workforce with contingent hourly workers from staffing agencies on an as-needed basis. Due to increased demand and competition, concern over exposure to COVID-19 and other factors, at times during the COVID-19 pandemic, we experienced labor shortages, increased costs and reduced productivity. If we experience similar labor shortages again, do not effectively manage our use of such contingent workers, or if our staffing agencies chose to terminate their relationship with us and we cannot find alternative providers, it could result in increased costs and adversely affect our operations. Moreover, given the nature of our Global Ecommerce and Presort Services employee base, if we cannot continue to maintain good relationships with those employees resulting in employee dissatisfaction and turnover, our operating costs could significantly increase, and our operational flexibility could be significantly reduced.
There is also significant competition for the talent needed to develop our other products and services. Increased competition for employees has resulted in higher wages and costs of other benefits necessary to attract and retain employees with the right skill sets. Additional labor costs which may also impact our business include those triggered by regulatory actions; increased health care and workers’ compensation insurance expenses; and, those costs associated with the COVID-19 pandemic, which in our Global Ecommerce and Presort Services segments, continues to include costs resulting from reduced productively (staggering shifts, breaks to enhance social distancing and higher levels of employees out sick), costs for extended safety protocols in our warehouses and incremental costs required to hire temporary labor.
Our inability to obtain and protect our intellectual property and defend against claims of infringement by others may negatively impact our financial performance.
Our businesses are not materially dependent on any one patent or license or group of related patents and licenses; however, our business success depends in part upon protecting our intellectual property rights, including proprietary technology developed or obtained through acquisitions. We rely on copyrights, patents, trademarks and trade secrets and other intellectual property laws to establish and protect our proprietary rights. If we are unable to protect our intellectual property rights, our competitive position may suffer, which could adversely affect our revenue and profitability. The continued evolution of patent law and the nature of our innovation work may affect the number of patents we are able to receive for our development efforts. As we continue to transition our business to more software and service-based offerings, patent protection of these innovations will be more difficult to obtain. In addition, from time to time, third parties may claim that we, our clients, or our suppliers, have infringed their intellectual property rights. These claims, if successful, may require us to redesign affected products, enter into costly settlement or license agreements, pay damage awards, or face a temporary or permanent injunction prohibiting us from marketing or selling certain products.
11
If we fail to comply with government contracting regulations, our financial performance, brand name and reputation could suffer.
We have a significant number of contracts with governmental entities. Government contracts are subject to extensive and complex procurement laws and regulations, along with regular audits and investigations by government agencies. If one or more government agencies discovers contractual noncompliance by us or one of our subcontractors in the course of an audit or investigation, we may be subject to various civil or criminal penalties and administrative sanctions, which could include the termination of the contract, reimbursement of payments received, fines and debarment from doing business with one or more governments. Any of these events could not only affect our financial performance, but also adversely affect our brand and reputation.
We may not fully realize the anticipated benefits of strategic acquisitions and divestitures which may harm our financial performance.
We may make strategic acquisitions or divest certain businesses. These actions may involve significant risks and uncertainties, which could have an adverse effect on our financial performance, including:
•difficulties in achieving anticipated benefits or synergies;
•difficulties in integrating newly acquired businesses and operations, including combining product and service offerings and entering new markets, or reducing fixed costs previously associated with divested businesses;
•the loss of key employees or clients of businesses acquired or divested;
•significant charges for employee severance and other restructuring costs, legal, accounting and financial advisory fees; and
•possible goodwill and asset impairment charges as divestitures and changes in our business model may adversely affect the recoverability of certain long- lived assets and valuation of our operating segments.
Our capital investments to develop new products and offerings or expand our current operations may not yield the anticipated benefits.
We are making significant capital investments in new products, services, and facilities. If we are not successful in these new product or service introductions at the levels anticipated when making the investments, there may be an adverse effect on our financial performance.
Cybersecurity and Technology Risks
Our financial performance and our reputation could be adversely affected, and we could be subject to legal liability or regulatory enforcement actions, if we or our suppliers are unable to protect against, or effectively respond to, cyberattacks or other cyber incidents.
We depend on the security of our and our suppliers' information technology systems to support numerous business processes and activities, to service our clients, and to enable consumer transactions and postal services. There are numerous cybersecurity risks to these systems, including individual and group criminal hackers, industrial espionage, denial of service attacks, ransomware and malware attacks, attacks on the software supply chain, and employee errors and/or malfeasance. These cyber threats are constantly evolving, thereby increasing the difficulty of preventing, detecting, and successfully defending against them. Successful breaches could, among other things, disrupt our operations or result in the unauthorized disclosure, theft and misuse of company, client, consumer and employee sensitive and confidential information, all of which could adversely affect our financial performance. Cybersecurity breaches could result in financial liability to other parties, governmental investigations, regulatory enforcement actions and penalties, and our brand and reputation could be damaged. Although we maintain insurance coverage relating to cybersecurity incidents, we may incur costs or financial losses that are either not insured against or not fully covered through our insurance.
We have security systems, procedures, and business continuity plans in place-and require our suppliers to have them as well. These security systems, procedures, and business continuity plans are designed to ensure the continuous and uninterrupted performance of our information technology systems, protect against unauthorized access to information or disruption to our services, and minimize the impact of and the time to detect, respond, and recover from a breach should one occur. Despite the protections we have in place, we have suffered cyber-events in the past. In response to these attacks, we implemented a variety of measures to further enhance our cybersecurity protections and minimize the impact of any future attack. None of these systems are fool proof and like all companies, intrusions will occur, and have occurred, from time to time. Our goal is to prevent meaningful incursions and minimize the overall impact of those that occur.
12
Failure to comply with data privacy and protection laws and regulations could subject us to legal liability and adversely affect our reputation and our financial performance.
Our businesses use, process, and store proprietary information and personal, sensitive, or confidential data relating to our business, clients, and employees. Privacy laws and similar regulations in many jurisdictions where we do business require that we take significant steps to safeguard that information, and these laws and regulations continue to evolve. The scope of the laws that may be applicable to us is often uncertain and may be conflicting. In addition, new laws may add a broad array of requirements on how we handle or use information and increase our compliance obligations. For example, the European Union greatly increased the jurisdictional reach of European Law by enacting the General Data Protection Regulation (GDPR), which, among other things, enhanced an individual’s rights with respect to their information and ongoing litigation in the European Union continues to create uncertainty in how to demonstrate compliance. In the United States, several states have enacted different laws regarding personal information and privacy that impose significant new requirements on consumer personal information. Other countries or states may enact laws or regulations in the future that have similar or additional requirements. Although we continually monitor and assess the impact of these laws and regulations, their interpretation and enforcement are uncertain, subject to change, and may require substantial costs to monitor and implement. Failure to comply with data privacy and protection laws and regulations could also result in government enforcement actions (which could include substantial civil and/or criminal penalties) and private litigation, which could adversely affect our reputation and financial performance.
If we or our suppliers encounter unforeseen interruptions or difficulties in the operation of our cloud-based applications, our business could be disrupted, our reputation and relationships may be harmed, and our financial performance could be adversely affected.
Our business relies upon the continuous and uninterrupted performance of our and our suppliers' cloud-based applications and systems to support numerous business processes, to service our clients and to support their transactions with their customers and postal services. Our applications and systems, and those of our partners, may be subject to interruptions due to technological errors, system capacity constraints, software errors or defects, human errors, computer or communications failures, power loss, adverse acts of nature and other unexpected events. We have business continuity and disaster recovery plans in place to protect our business operations in case of such events and we also require our suppliers to have the same. Nonetheless, there can be no guarantee that these plans will function as designed. If we are unable to limit interruptions or successfully correct them in a timely manner or at all, it could result in lost revenue, loss of critical data, significant expenditures of capital, a delay or loss in market acceptance of our services and damage to our reputation, brand and relationships, any of which could have an adverse effect on our business and our financial performance.
Macroeconomic and General Regulatory Risks
Future credit rating downgrades or capital market disruptions could adversely affect our ability to maintain adequate liquidity to provide competitive financing services to our clients and to fund various discretionary priorities.
We provide competitive finance offerings to our clients and fund discretionary priorities, such as business investments, strategic acquisitions, dividend payments and share repurchases through a combination of cash generated from operations, deposits held at the Bank and access to capital markets. Our ability to access U.S. capital markets and the associated cost of borrowing is dependent upon our credit ratings and is subject to capital market volatility. Given our current credit rating, we may experience reduced financial or strategic flexibility and higher costs when we do access the U.S. capital markets. We maintain a $500 million revolving credit facility that requires we maintain certain financial and nonfinancial covenants.
A significant decline in cash flows, noncompliance with any of the covenants under the revolving credit facility, further credit rating downgrades, material capital market disruptions, significant withdrawals by depositors at the Bank, adverse changes to our industrial loan charter or an increase in our credit default swap spread could impact our ability to maintain adequate liquidity to provide competitive finance offerings to our clients, refinance maturing debt and fund other financing activities, which in turn, could adversely affect our financial performance.
Our Global Ecommerce segment is exposed to increased foreign exchange rate fluctuations.
The sales generated from many of our clients’ internationally focused websites running on our cross-border platform are exposed to foreign exchange rate fluctuations. Currently, our platforms are located in the U.S. and the U.K. and a majority of consumers making purchases through these platforms are in a limited number of foreign countries. A strengthening of the U.S. Dollar or British Pound relative to currencies in the countries where we do the most business impacts our ability to compete internationally as the cost of similar international products improves relative to the cost of U.S. and U.K. retailers' products. A strong U.S. Dollar or British Pound would likely result in a decrease in international sales volumes, which would adversely affect the segment's revenue and profitability.
13
Our operations and financial performance may be negatively affected by changes in trade policies, tariffs and regulations.
Our Global Ecommerce segment is subject to significant trade regulations, taxes, and duties throughout the world. Any changes to these regulations could potentially impose increased documentation and delivery requirements, delay delivery times and subject us to increased costs and additional liabilities, which could adversely affect our financial performance. Within the last four years, the United States increased tariffs for certain goods, which triggered other nations to also increase tariffs on certain of their goods. For our Global Ecommerce segment, tariff increases, or even an environment of uncertainty surrounding trade issues, could reduce demand and adversely affect its financial performance. For our SendTech Solutions segment, increased tariffs resulted in additional costs on certain components used in some of our products.
If we do not keep pace with evolving expectations and regulators in the areas of Environmental, Social and Governance (ESG) and address the potential impact of climate change on our costs and operations, our reputation and results of operations may be adversely affected.
The set of topics incorporated within the term ESG in general, and climate change in particular, cover a range of issues that pose potential risks to our operations. From an environmental perspective, the impact of climate change and a potential increase in extreme weather events may pose risk to the operation of our sortation facilities and the ability to transport mail and packages. The increased focus on alternative energy sources and the need to reduce our carbon footprint over time, could result in higher investments in capital spending and increased operational costs. There are also a series of laws related to product stewardship and waste disposal to which we need to comply. From a “social” perspective, a failure to meet employee expectations around safety and diversity, equity and inclusion could impact our ability to recruit new employees and retain talent. Finally, from a “governance” perspective, if we do not maintain a good governance processes in general or do not satisfy investor stakeholder expectations on ESG, our reputation and attractiveness to portions of the investment community could be adversely affected.
ITEM 1B. UNRESOLVED STAFF COMMENTS
None.
ITEM 2. PROPERTIES
We lease numerous facilities worldwide, including our corporate headquarters located in Stamford, Connecticut, fulfillment centers, parcel operations and mail sortation facilities, service locations, data centers and call centers.
Our Global Ecommerce segment leases four fulfillment centers that comprise the majority of our fulfillment operations. Our Global Ecommerce and Presort Services segments conduct parcel operations and mail sortation operations through a network of over 50 operating centers throughout the United States. Our SendTech Solutions segment leases a manufacturing and distribution facility in Indianapolis. This facility is significant as it stores a majority of the SendTech Solutions products, supplies and inventories.
Should any facility be unable to function as intended for an extended period of time, our ability to service our clients and operating results could be impacted.
We conduct most of our research and development activities in facilities located in Noida and Pune, India and Shelton, Connecticut. Management believes that our facilities are in good operating condition, materially utilized and adequate for our current business needs.
ITEM 3. LEGAL PROCEEDINGS
See Note 16 Commitments and Contingencies for additional information.
ITEM 4. MINE SAFETY DISCLOSURES
Not applicable.
14
PART II
ITEM 5. MARKET FOR THE COMPANY'S COMMON EQUITY, RELATED STOCKHOLDER MATTERS AND ISSUER PURCHASES OF EQUITY SECURITIES
Our common stock is principally traded on the New York Stock Exchange (NYSE) under the symbol "PBI". At January 31, 2022, we had 12,812 common stockholders of record.
Share Repurchases
We periodically repurchase shares of our common stock to manage the dilution created by shares issued under employee stock plans and for other purposes. During 2021 and 2020, we did not repurchase any additional shares of our common stock and in 2019, we repurchased 18.6 million shares of our common stock at an aggregate price of $105 million. At December 31, 2021, we have authorization from our Board of Directors to repurchase up to of $16 million of our common stock.
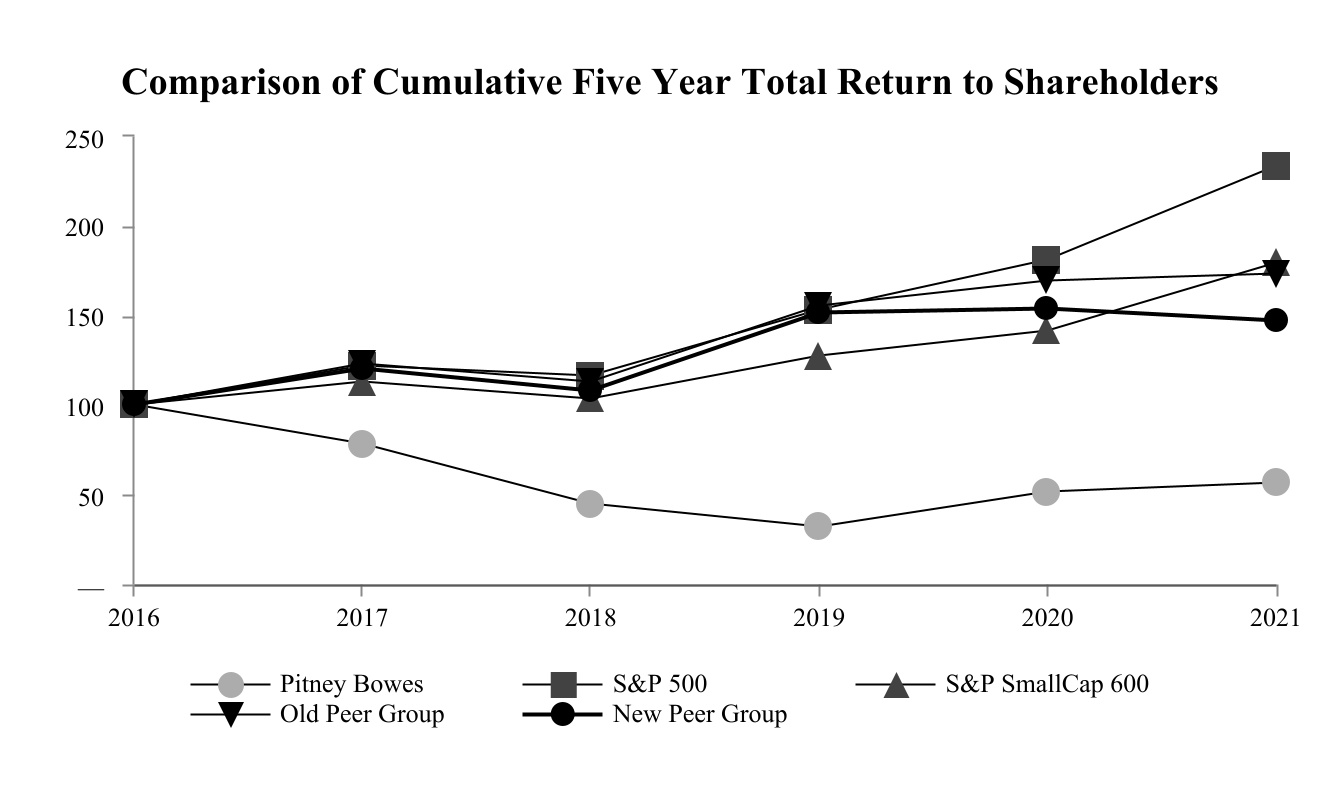
Stock Performance Graph
We revised our peer group from last year to exclude companies that were no longer publicly listed on an exchange and to include additional companies to align with our changing business offerings.
Our new peer group is comprised of: ACCO Brands Corporation, Alliance Data Systems Corporation, Avery Dennison Corporation, Cimpress plc, Deluxe Corporation, Diebold Nixdorf, Incorporated, Etsy, Inc., Fidelity National Information Services, Inc., Fiserv, Inc., Hub Group, Inc., NCR Corporation, Overstock.com, Inc., Rockwell Automation, Inc., Ryder System, Inc., Schneider National, Inc., The Western Union Company, W.W. Grainger, Inc. and Xerox Holdings Corporation.
The old peer group was comprised of: ACCO Brands Corporation, Alliance Data Systems Corporation, Deluxe Corporation, Diebold Nixdorf, Incorporated, Echo Global Logistics, Inc., Fidelity National Information Services, Inc., Fiserv, Inc., Hub Group, Inc., NCR Corporation, R.R. Donnelley & Sons Company, Rockwell Automation, Inc., Stamps.com Inc., The Western Union Company and Xerox Holdings Corporation.
The accompanying graph shows the annual change in the value of a $100 investment in Pitney Bowes Inc., the Standard and Poor's (S&P) 500 Composite Index, the S&P SmallCap 600 Composite Index, the old peer group and our new peer group over a five-year period assuming the reinvestment of dividends. On a total return basis, a $100 investment on December 31, 2016 in Pitney Bowes Inc., the S&P 500 Composite Index, the S&P SmallCap 600 Composite Index, the old peer group and our new peer group would have been worth $57, $233, $180, $173 and $147 respectively, on December 31, 2021.
All information is based upon data independently provided to us by Standard & Poor's Corporation and is derived from their official total return calculation. Total return for the S&P 500 and S&P SmallCap 600 Composite Indexes and our peer group is based on market capitalization, weighted for each year. The stock price performance is not necessarily indicative of future stock price performance.
15
ITEM 6. [RESERVED]
16
ITEM 7. MANAGEMENT'S DISCUSSION AND ANALYSIS OF FINANCIAL CONDITION AND RESULTS OF
OPERATIONS
The following discussion of our financial condition and operating results should be read in conjunction with our risk factors, consolidated financial statements and related notes. This discussion includes forward-looking statements based on management's current expectations, estimates and projections and involves risks and uncertainties. Actual results may differ significantly from those currently expressed. A detailed discussion of risks and uncertainties that could cause actual results to differ materially from such forward-looking statements is outlined under "Forward-Looking Statements" and "Item 1A. Risk Factors" in this Form 10-K. All table amounts are presented in thousands of dollars.
Throughout this discussion, we refer to revenue growth on a constant currency basis. Constant currency measures exclude the impact of changes in currency exchange rates from the prior period under comparison. We believe that excluding the impacts of currency exchange rates provides investors a better understanding of the underlying revenue performance. Constant currency change is calculated by converting the current period non-U.S. dollar denominated revenue using the prior year’s exchange rate. Where constant currency measures are not provided, the actual change and constant currency change are the same.
Management measures segment profitability and performance using segment earnings before interest and taxes (EBIT). Segment EBIT is calculated by deducting from segment revenue the related costs and expenses attributable to the segment. Segment EBIT excludes interest, taxes, general corporate expenses, restructuring charges, asset and goodwill impairment charges and other items not allocated to a business segment. Management believes that it provides investors a useful measure of operating performance and underlying trends of the business. Segment EBIT may not be indicative of our overall consolidated performance and therefore, should be read in conjunction with our consolidated results of operations.
A discussion of our financial condition and results of operations for the year ended December 31, 2019, can be found under Item 7 “Management's Discussion and Analysis of Financial Condition and Results of Operations” in our Annual Report on Form 10-K for the fiscal year ended December 31, 2020, filed with the SEC on February 19, 2021.
Overview
Financial Results Summary - Year Ended December 31:
| Revenue | |||||||||||||||||||||||
| Years Ended December 31, | |||||||||||||||||||||||
| 2021 | 2020 | Actual % change | Constant Currency % Change | ||||||||||||||||||||
| Business services | $ | 2,334,674 | $ | 2,191,306 | 7 | % | 6 | % | |||||||||||||||
| Support services | 460,888 | 473,292 | (3) | % | (3) | % | |||||||||||||||||
| Financing | 294,418 | 341,034 | (14) | % | (15) | % | |||||||||||||||||
| Equipment sales | 350,138 | 314,882 | 11 | % | 10 | % | |||||||||||||||||
| Supplies | 159,438 | 159,282 | — | % | (1) | % | |||||||||||||||||
| Rentals | 74,005 | 74,279 | — | % | (1) | % | |||||||||||||||||
| Total revenue | $ | 3,673,561 | $ | 3,554,075 | 3 | % | 3 | % | |||||||||||||||
| Revenue | |||||||||||||||||||||||
| Years Ended December 31, | |||||||||||||||||||||||
| 2021 | 2020 | Actual % change | Constant currency % change | ||||||||||||||||||||
| Global Ecommerce | $ | 1,702,580 | $ | 1,618,897 | 5 | % | 4 | % | |||||||||||||||
| Presort Services | 573,480 | 521,212 | 10 | % | 10 | % | |||||||||||||||||
| SendTech Solutions | 1,397,501 | 1,413,966 | (1) | % | (2) | % | |||||||||||||||||
| Total | $ | 3,673,561 | $ | 3,554,075 | 3 | % | 3 | % | |||||||||||||||
17
| EBIT | |||||||||||||||||
| Years Ended December 31, | |||||||||||||||||
| 2021 | 2020 | % change | |||||||||||||||
| Global Ecommerce | $ | (98,673) | $ | (82,894) | (19) | % | |||||||||||
| Presort Services | 79,721 | 55,799 | 43 | % | |||||||||||||
| SendTech Solutions | 429,415 | 442,648 | (3) | % | |||||||||||||
| Total Segment EBIT | $ | 410,463 | $ | 415,553 | (1) | % | |||||||||||
Revenue increased 3% in 2021 compared to 2020. Business services revenue, which primarily includes revenue from Presort Services and Global Ecommerce, increased 7% (6% at constant currency) compared to the prior year. Presort Services revenue increased 10% primarily due to higher mail volumes, pricing actions and investments made in the network and technology to enable a higher level of five-digit sortation services. Global Ecommerce revenue increased 5% (4% at constant currency) primarily due to higher cross-border volumes. SendTech Solutions revenue declined 1% (2% at constant currency) primarily due to lower financing revenue and support services revenue, partially offset by higher equipment sales. Financing revenue declined 14% (15% at constant currency) primarily due to lower lease extensions and lower fee income and prior year gains from the sales of investment securities. Support services revenue declined 3% driven by a declining meter population and a shift to cloud-enabled products. Equipment sales increased 11% (10% at constant currency) primarily due to the effect of COVID-19 on prior year equipment sales.
Segment EBIT in 2021 decreased 1% compared to 2020. Global Ecommerce EBIT declined 19% primarily due to a $14 million unfavorable vendor price adjustment driven by lower domestic parcel delivery volumes, SendTech Solutions EBIT decreased 3% primarily driven by a decline in revenue. and Presort Services EBIT increased 43% primarily due to higher revenue and improved productivity from investments made in the network and technology. Refer to Results of Operations section for further information.
Outlook
We continue to invest in market opportunities and new solutions and services across all our businesses, optimizing our operations and implementing cost savings initiatives to drive long-term value. During 2021, we invested significantly in our facilities, network and technologies to expand operations, improve productivity and gain economies of scale. Going forward, we will focus our investments on gaining further network efficiencies and economies of scale within our Global Ecommerce and Presort Services operations and in market opportunities and new solutions and services across all our businesses. Our portfolio continues to shift to higher growth, lower margin, markets. As we continue to invest in Global Ecommerce with a view to, and ahead of, our expectations for long term growth, it is possible that near term margins will be under pressure. However, we expect margins to improve as we build scale and realize the full benefits of our investments and optimizations.
The impacts of COVID-19 on our businesses and financial results remain uncertain. Supply chain issues continue to pose challenges for us and our clients' ability to meet their customers' demand. These supply chain issues could continue to impact our customers' behavior as well as that of end consumers, which could impact our shipping and delivery volumes. The duration and severity of these supply chain issues is unknown and unpredictable. There are some unique factors not within our control that could affect our business; however, we believe we can navigate the current conditions and will continue to take proactive steps to manage our operations and mitigate related financial impacts.
On a consolidated basis, we expect revenue growth in the low to mid-single digit range in 2022 compared to 2021. Within Global Ecommerce, we anticipate revenue growth in 2022 and margin and profit improvements from pricing initiatives and productivity improvements from the benefits of the investments we made in our facilities and network. However, we also expect continued growth of the market's need for transportation services and labor to generate increased costs. Within Presort Services, we expect revenue growth in 2022 and margin and profit improvements as productivity initiatives, increased automation and facilities consolidation and optimization will more than offset expected higher labor and transportation costs. Within SendTech Solutions, we expect overall revenue to decline, growth in our cloud-enabled shipping solutions and margins to remain strong.
18
RESULTS OF OPERATIONS
REVENUE AND SEGMENT EBIT
Global Ecommerce
Global Ecommerce includes the revenue and related expenses from domestic parcel services, cross-border solutions and digital delivery services.
| Revenue | Cost of Revenue | Gross Margin | |||||||||||||||||||||||||||||||||||||||||||||
| Years Ended December 31, | Years Ended December 31, | Years Ended December 31, | |||||||||||||||||||||||||||||||||||||||||||||
| 2021 | 2020 | Actual % change | Constant Currency % change | 2021 | 2020 | 2021 | 2020 | ||||||||||||||||||||||||||||||||||||||||
| Business services | $ | 1,702,580 | $ | 1,618,897 | 5 | % | 4 | % | $ | 1,577,628 | $ | 1,480,612 | 7.3 | % | 8.5 | % | |||||||||||||||||||||||||||||||
| Segment EBIT | |||||||||||||||||||||||||||||||||||||||||||||||
| Years Ended December 31, | |||||||||||||||||||||||||||||||||||||||||||||||
| 2021 | 2020 | Actual % change | |||||||||||||||||||||||||||||||||||||||||||||
| Segment EBIT | $ | (98,673) | $ | (82,894) | (19) | % | |||||||||||||||||||||||||||||||||||||||||
Global Ecommerce revenue increased 5% as reported (4% at constant currency) in 2021 compared to 2020 due to revenue growth of 7% from higher cross-border volumes, partially offset by revenue decline of 2% from lower domestic parcel delivery volumes.
Total gross margin declined $13 million and gross margin percentage declined to 7.3% from 8.5% primarily due to a $14 million unfavorable vendor price adjustment driven by lower domestic parcel delivery volumes and higher transportation, postal and labor costs, partially offset by the impact of higher revenue.
Segment EBIT for 2021 was a loss of $99 million compared to a loss of $83 million in the prior year. The increase in EBIT loss was driven by the decline in gross margin and $2 million in higher operating expenses.
Presort Services
Presort Services includes revenue and related expenses from sortation services to qualify large volumes of First Class Mail, Marketing Mail, Marketing Mail Flats and Bound Printed Matter for postal worksharing discounts.
| Revenue | Cost of Revenue | Gross Margin | |||||||||||||||||||||||||||||||||||||||||||||
| Years Ended December 31, | Years Ended December 31, | Years Ended December 31, | |||||||||||||||||||||||||||||||||||||||||||||
| 2021 | 2020 | Actual % change | Constant Currency % change | 2021 | 2020 | 2021 | 2020 | ||||||||||||||||||||||||||||||||||||||||
| Business services | $ | 573,480 | $ | 521,212 | 10 | % | 10 | % | $ | 431,382 | $ | 402,599 | 24.8 | % | 22.8 | % | |||||||||||||||||||||||||||||||
| Segment EBIT | |||||||||||||||||||||||||||||||||||||||||||||||
| Years Ended December 31, | |||||||||||||||||||||||||||||||||||||||||||||||
| 2021 | 2020 | Actual % change | |||||||||||||||||||||||||||||||||||||||||||||
| Segment EBIT | $ | 79,721 | $ | 55,799 | 43 | % | |||||||||||||||||||||||||||||||||||||||||
Presort Services revenue increased 10% in 2021 compared to 2020. The processing of Marketing Mail, First Class Mail and Marketing Mail Flats and Bound Printed Matter contributed revenue growth of 5%, 4% and 1%, respectively, primarily due to the impact of increased mail volumes, improvements in five-digit sortation, pricing actions and benefits from the impacts of COVID-19 that adversely affected mail volumes in 2020.
Gross margin increased $23 million and gross margin percentage increased to 24.8% from 22.8% primarily due to the increase in revenue and improved productivity, partially offset by increased labor and transportation costs of $16 million and $6 million, respectively, due to increased competition and demand for these resources.
Segment EBIT increased $24 million or 43% in 2021 compared to 2020 due to the increase in revenue and gross margin.
19
SendTech Solutions
SendTech Solutions includes the revenue and related expenses from physical and digital mailing and shipping technology solutions, financing, services, supplies and other applications to help simplify and save on the sending, tracking and receiving of letters, parcels and flats.
| Revenue | Cost of Revenue | Gross Margin | |||||||||||||||||||||||||||||||||||||||||||||
| Years Ended December 31, | Years Ended December 31, | Years Ended December 31, | |||||||||||||||||||||||||||||||||||||||||||||
| 2021 | 2020 | Actual % change | Constant Currency % change | 2021 | 2020 | 2021 | 2020 | ||||||||||||||||||||||||||||||||||||||||
| Business services | $ | 58,614 | $ | 51,197 | 14 | % | 15 | % | $ | 25,174 | $ | 20,694 | 57.1 | % | 59.6 | % | |||||||||||||||||||||||||||||||
| Support services | 460,888 | 473,292 | (3) | % | (3) | % | 147,716 | 148,293 | 67.9 | % | 68.7 | % | |||||||||||||||||||||||||||||||||||
| Financing | 294,418 | 341,034 | (14) | % | (15) | % | 47,059 | 48,162 | 84.0 | % | 85.9 | % | |||||||||||||||||||||||||||||||||||
| Equipment sales | 350,138 | 314,882 | 11 | % | 10 | % | 251,714 | 234,987 | 28.1 | % | 25.4 | % | |||||||||||||||||||||||||||||||||||
| Supplies | 159,438 | 159,282 | — | % | (1) | % | 43,980 | 41,679 | 72.4 | % | 73.8 | % | |||||||||||||||||||||||||||||||||||
| Rentals | 74,005 | 74,279 | — | % | (1) | % | 24,427 | 25,600 | 67.0 | % | 65.5 | % | |||||||||||||||||||||||||||||||||||
| Total | $ | 1,397,501 | $ | 1,413,966 | (1) | % | (2) | % | $ | 540,070 | $ | 519,415 | 61.4 | % | 63.3 | % | |||||||||||||||||||||||||||||||
| Segment EBIT | |||||||||||||||||||||||||||||||||||||||||||||||
| Years Ended December 31, | |||||||||||||||||||||||||||||||||||||||||||||||
| 2021 | 2020 | Actual % change | |||||||||||||||||||||||||||||||||||||||||||||
| Segment EBIT | $ | 429,415 | $ | 442,648 | (3) | % | |||||||||||||||||||||||||||||||||||||||||
SendTech Solutions revenue decreased 1% (2% at constant currency) in 2021 compared to 2020. Financing revenue declined 14% (15% at constant currency) primarily due to lower lease extensions of $18 million as more clients opted to lease new equipment rather than simply extend leases on existing equipment, lower fee income of $10 million and a prior year gain of $10 million from sales of investment securities. Support services revenue declined 3% primarily due to a declining meter population and shift to cloud-enabled products, which generally require less service due to ease of use. Partially offsetting these decreases, equipment sales increased 11% (10% at constant currency), primarily due to the adverse impact on demand and our inability to perform on-site service and installations in the prior year due to COVID-19 and business services revenue increased 14% (15% at constant currency) primarily due to growth in our shipping products.
Gross margin decreased to 61.4% from 63.3% in the prior year primarily due to declines in financing and support services gross margin, partially offset by an increase in equipment sales gross margin. Financing gross margin decreased to 84.0% from 85.9% due to declining revenue and rising interest rates. Support services gross margin decreased to 67.9% from 68.7% primarily due to the decline in revenue. Equipment sales gross margin increased to 28.1% from 25.4% primarily driven by lower engineering costs.
Segment EBIT decreased $13 million, or 3% in 2021 compared to 2020, primarily driven by the decline in gross margin of $38 million, partially offset by lower credit loss provision of $23 million.
UNALLOCATED CORPORATE EXPENSES
The majority of our selling, general and administrative (SG&A) expense is recorded directly or allocated to our reportable segments. SG&A expenses not recorded directly or allocated to our reportable segments are reported as unallocated corporate expenses. Unallocated corporate expenses primarily represents corporate administrative functions such as finance, marketing, human resources, legal, information technology and innovation.
| Years Ended December 31, | |||||||||||||||||
| 2021 | 2020 | Actual % change | |||||||||||||||
| Unallocated corporate expenses | $ | 207,774 | $ | 200,406 | 4 | % | |||||||||||
Unallocated corporate expenses in 2021 increased 4% compared to the prior year primarily driven by higher employee-related expenses of $5 million and higher insurance costs of $5 million.
20
CONSOLIDATED EXPENSES
Selling, general and administrative
SG&A expense of $924 million in 2021 decreased 4%, or $39 million, compared to 2020, primarily due to lower credit loss provision of $34 million and lower professional fees of $16 million, partially offset by higher employee-related expenses of $24 million.
Research and development (R&D)
R&D expense increased 22%, or $8 million in 2021 compared to 2020, primarily due to investments in our Global Ecommerce segment.
Restructuring charges and asset impairments
Restructuring charges and asset impairments for the year ended December 31, 2021 were $19 million and primarily includes costs for employee severance and facility closures. See Note 12 to the Consolidated Financial Statements for further information.
Other components of net pension and postretirement cost (income)
Other components of net pension and postretirement cost (income) for the year ended December 31, 2021 was $1 million. The amount of other components of net pension and postretirement cost (income) recognized each year will vary based on actuarial assumptions and actual results of our pension plans. See Note 14 to the Consolidated Financial Statements for further information.
Other expense, net
Other expense for the year ended December 31, 2021 was $42 million and includes a $56 million loss from the refinancing of debt, a $10 million gain from the sale of a business, $3 million of insurance proceeds and a $1 million gain from an asset sale. See Note 11 to the Consolidated Financial Statements for further information.
INCOME TAXES AND DISCONTINUED OPERATIONS
Income taxes
The effective tax rate for 2021 includes benefits of $7 million from the resolution of tax matters, $5 million due to tax legislation in the U.K., $3 million from an affiliate reorganization and $2 million from the vesting of restricted stock, partially offset by a charge of $6 million on the pre-tax gain of $10 million from the sale of a business as the tax basis was lower than the book basis and a charge of $1 million for the write-off of deferred tax assets associated with the expiration of out-of-the-money stock options. See Note 15 to the Consolidated Financial Statements for further information.
Discontinued operations, net of tax
Loss from discontinued operations, net of tax for 2021 of $5 million includes adjustments related to the sale of our Software Solutions business in 2019 and Production Mail business in 2018. See Note 4 to the Consolidated Financial Statements for further information.
21
LIQUIDITY AND CAPITAL RESOURCES
At December 31, 2021 we had cash, cash equivalents and short-term investments of $747 million, which includes $162 million held at our foreign subsidiaries used to support the liquidity needs of those subsidiaries. Our ability to maintain adequate liquidity for our operations is dependent upon a number of factors, including our revenue and earnings, our clients ability to pay their balances on a timely basis, the impacts of COVID-19 on macroeconomic conditions and our ability to take further cost savings and cash conservation measures if necessary. At this time, we believe that existing cash and investments, cash generated from operations and borrowing capacity under our $500 million revolving credit facility will be sufficient to fund our cash needs for the next 12 months.
Cash Flow Summary
The change in cash and cash equivalents is as follows:
| 2021 | 2020 | Increase/(decrease) | |||||||||||||||
| Net cash from operating activities | $ | 301,515 | $ | 301,972 | $ | (457) | |||||||||||
| Net cash from investing activities | (155,251) | (75,692) | (79,559) | ||||||||||||||
| Net cash from financing activities | (330,371) | (235,371) | (95,000) | ||||||||||||||
| Effect of exchange rate changes on cash and cash equivalents | (4,863) | 6,099 | (10,962) | ||||||||||||||
| Change in cash and cash equivalents | $ | (188,970) | $ | (2,992) | $ | (185,978) | |||||||||||
Operating activities
Cash provided by operating activities in 2021 of $302 million was flat compared to the prior year. Cash flow from operations was positively impacted by $3 million from changes in working capital and by $38 million due to a tax payment related to a discontinued operation in the prior year. These improvements in cash were offset by lower earnings before noncash charges.
Investing activities
Cash used in investing activities for 2021 increased $80 million compared to the prior year, primarily due to higher capital expenditures as we invested significantly during the year in our facilities, our network and technologies to expand operations, improve productivity and gain economies of scale in our Global Ecommerce and Presort Services operations. In 2020, we prioritized and limited our capital expenditures in connection with COVID-19.
Net cash from investing activities in 2021 also benefited by $43 million from the timing of purchases and maturities of investment securities, but was negatively impacted by lower proceeds from the sale of assets and businesses of $29 million and higher acquisition spending of $8 million. Proceeds from the sale of assets and businesses in 2021 includes $28 million from the sale of a business and $2 million of asset sales, while proceeds in 2020 included $46 million from the surrender of company-owned life insurance policies and $12 million from the sale of an equity investment. In November 2021, we acquired CrescoData, a Platform-as-a-Service business, for $15 million.
Financing activities
Cash used in financing activities for 2021 increased $95 million compared to the prior year primarily due to higher net repayments of debt of $61 million, higher premiums and fees paid to refinance debt of $18 million and a reduction in reserve deposits of $11 million.
Debt Activity
In 2021, we refinanced a significant amount of our near-term maturities, reducing our total debt and extending our maturity profile. Specifically, we issued a $400 million 6.875% unsecured note due March 2027, a $350 million 7.25% unsecured note due March 2029 and entered into a seven-year $450 million secured term loan maturing March 2028. We redeemed all the October 2021 notes, an aggregate $363 million of the May 2022 notes, April 2023 notes and March 2024 notes under a tender offer, the remaining balance of the May 2022 notes and the remaining balance of the January 2025 term loan. We also extended the maturities of our $500 million secured revolving credit facility and our $380 million secured term loan from November 2024 to March 2026. A $56 million pre-tax loss was incurred on the refinancing of debt.
In connection with the refinancing, we terminated interest rate swap agreements with an aggregate notional amount of $500 million and entered into new interest rate swap agreements with an aggregate notional amount of $200 million. Under the terms of the new swap agreements, we pay fixed-rate interest of 0.56% and receive variable-rate interest based on one-month LIBOR. The variable interest rate under the term loans and the swaps reset monthly.
22
The credit agreement that governs the revolving credit facility and term loans contains financial and non-financial covenants. At December 31, 2021, we were in compliance with all covenants and there were no outstanding borrowings under the revolving credit facility.
Future Cash Requirements
The following table summarizes our known and contractually committed cash requirements at December 31, 2021 (in millions):
| Payments due in | |||||||||||||||||||||||||||||||||||||||||
| Total | 2022 | 2023 | 2024 | 2025 | 2026 | Thereafter | |||||||||||||||||||||||||||||||||||
| Debt maturities | $ | 2,365 | $ | 25 | $ | 120 | $ | 282 | $ | 43 | $ | 261 | $ | 1,634 | |||||||||||||||||||||||||||
| Lease obligations | 286 | 53 | 47 | 42 | 34 | 29 | 81 | ||||||||||||||||||||||||||||||||||
| Purchase obligations | 240 | 240 | — | — | — | — | — | ||||||||||||||||||||||||||||||||||
| Retiree medical payments | 104 | 13 | 12 | 12 | 11 | 11 | 45 | ||||||||||||||||||||||||||||||||||
| Total | $ | 2,995 | $ | 331 | $ | 179 | $ | 336 | $ | 88 | $ | 301 | $ | 1,760 | |||||||||||||||||||||||||||
Debt
We have debt with a principal balance of $2.4 billion outstanding at December 31, 2021. Approximately 74% of this debt is at fixed rates, including the effect of interest rate swaps, and the remaining 26% of debt is at variable rates based on LIBOR or other similar rates. The weighted average interest rate of our variable rate debt at December 31, 2021 was 3.1%. We estimate that cash interest payments for the next 12 months will be $130 - $140 million.
Required debt repayments over the next 12 months are $25 million and we do not have material principal maturities until 2024. Accordingly, we do not anticipate the need to access the U.S. capital markets in the next 12 months. See Note 13 to the Consolidated Financial Statements for information regarding our debt.
Lease obligations
We lease real estate and equipment under operating and capital lease arrangements. These leases have terms of up to 15 years and include renewal options.
In November 2021, we entered into an agreement to sell our Shelton, Connecticut facility for approximately $50 million and simultaneously enter into a ten year lease agreement. Total base lease payments over the ten-year term will be approximately $41 million and are not included in the table above. This transaction is expected to close in the first quarter of 2022. Additionally, lease payments in the table above do not include $21 million of payments for leases signed but not yet commenced at December 31, 2021. See Note 8 and Note 17 to the Consolidated Financial Statements for further information.
Purchase obligations
Purchase obligations include unrecorded agreements to purchase goods and services that are enforceable and legally binding upon us and that specify all significant terms, including fixed or minimum quantities to be purchased; fixed, minimum or variable price provisions; and the approximate timing of the transaction. Purchase obligations exclude agreements that are cancellable without penalty.
In addition to the above known and contractually committed cash payments, we anticipate using cash for the following items:
Capital Expenditures
We continue to invest in our facilities, products, solutions and technology to grow our businesses, gain additional economies of scale, provide new and innovative products and solutions and compete effectively in our markets. Capital expenditures are evaluated and approved by senior leadership based on several factors, including expected impacts on revenue growth, productivity enhancements, service improvements and cost savings.
Capital expenditures totaled $184 million and $105 million for the years ended December 31, 2021 and 2020, respectively. During 2021, we invested significantly in our facilities, network and technologies to expand operations, improve productivity and gain economies of scale in our Global Ecommerce and Presort operations. In 2020, in response to COVID-19, we prioritized and limited our capital expenditures.
23
Dividends
We have historically paid a quarterly dividend to our shareholders. Each quarter, our Board of Directors considers our recent and projected earnings and other capital needs and priorities in deciding whether to approve a dividend. We expect to continue to pay a quarterly dividend of $0.05 per share; however, our Board of Directors may decide to increase or decrease this amount or to not approve the payment of a dividend at any time and for any reason without notice. Assuming the current $0.05 per quarter dividend payment, we estimate that dividend payments will be approximately $35 million in 2022. There are no material restrictions on our ability to declare dividends.
Share Repurchases
We may repurchase shares of our common stock to manage the dilution created by shares issued under employee stock plans and for other purposes. At December 31, 2021, we have authorization from our Board of Directors to repurchase up to of $16 million of our common stock. As of February 16, 2022, we have spent $8 million to repurchase 1.5 million shares of our common stock.
Off Balance Sheet Arrangements
At December, 31, 2021, we had approximately $25 million outstanding letters of credit guarantees with financial institutions that are primarily issued as security for insurance, leases, customs and other performance obligations. In general, we would only be liable for the amount of these guarantees in the event of default in the performance of our obligations, the probability of which we believe is remote.
24
Critical Accounting Estimates
The preparation of our financial statements in conformity with GAAP requires management to make estimates and assumptions about certain items that affect the reported amounts of assets, liabilities, revenues, expenses and accompanying disclosures, including the disclosure of contingent assets and liabilities. The accounting policies below have been identified by management as those policies that are most critical to our financial statements due to the estimates and assumptions required. Management believes that the estimates and assumptions used are reasonable and appropriate based on the information available at the time the financial statements were prepared; however, actual results could differ from those estimates and assumptions. See Note 1 to the Consolidated Financial Statements for a summary of our accounting policies.
Revenue recognition
We derive revenue from multiple sources including the sale and lease of equipment, equipment rentals, financing, support services and business services. Certain transactions are consummated at the same time and can therefore generate revenue from multiple sources. The most common form of these arrangements involves a sale or noncancelable lease of equipment, meter services and an equipment maintenance agreement. We are required to determine whether each product and service within the contract should be treated as a separate performance obligation (unit of accounting) for revenue recognition purposes. We recognize revenue for performance obligations when control is transferred to the customer. Transfer of control may occur at a point in time or over time, depending on the nature of the contract and the performance obligation.
Revenue is allocated among performance obligations based on relative standalone selling prices (SSP), which are a range of selling prices that we would sell the good or service to a customer on a separate basis. SSP are established for each performance obligation at the inception of the contract and can be observable prices or estimated. Revenue is allocated to the meter service and equipment maintenance agreement elements using their respective observable selling prices charged in standalone and renewal transactions. For sale and lease transactions, the SSP of the equipment is based on a range of observable selling prices in standalone transactions. We recognize revenue on non-lease transactions when control of the equipment transfers to the customer, which is upon delivery for customer installable models and upon installation or customer acceptance for other models. We recognize revenue on equipment for lease transactions upon shipment for customer installable models and upon installation or customer acceptance for other models.
Impairment review
Goodwill is tested annually for impairment at the reporting unit level during the fourth quarter or sooner if circumstances indicate an impairment may exist. The impairment test for goodwill determines the fair value of each reporting unit and compares it to the reporting unit's carrying value, including goodwill. If the fair value of a reporting unit is less than its carrying value, an impairment loss is recognized for the difference, not to exceed the carrying amount of goodwill.
Testing goodwill for impairment requires us to identify our reporting units and assign assets and liabilities, including goodwill, to each reporting unit. The fair value of a reporting unit is based on one or a combination of techniques, which include a discounted cash flow model, multiples of competitors, and/or multiples from sales of like businesses. To determine fair value using a discounted cash flow model, management's cash flow projections include significant judgements and assumptions relating to revenue growth rates, projected operating income and discount rate. Changes in any of these estimates or assumptions could materially affect the determination of fair value and the associated goodwill impairment assessment for each reporting unit. Events and circumstances that could materially impact the fair value determination of a reporting unit and potentially result in a non-cash impairment charge in future periods, include, but are not limited to, changing consumer behaviors, our ability to manage volumes, gain economies of scale and improve profitability in the Global Ecommerce business, prolonged supply chain issues, inflation and rising interest rates.
Long-lived and finite-lived intangible assets are reviewed for impairment whenever events or changes in circumstances indicate that the carrying amount may not be fully recoverable. The estimated future undiscounted cash flows expected to result from the use and eventual disposition of the assets is compared to the carrying value. If the sum of the undiscounted cash flows is less than the asset's carrying value, an impairment charge is recorded for an amount by which the carrying value exceeds its fair value. The fair value of the impaired asset is determined using probability weighted expected cash flow estimates, quoted market prices when available and appraisals, as appropriate. We derive the cash flow estimates from our long-term business plans and historical experience. Changes in the estimates and assumptions incorporated in our impairment assessment could materially affect the determination of fair value and the associated impairment charge.
Allowances for credit losses
Finance receivables are comprised of sales-type leases, secured loans and unsecured revolving loans. We provide an allowance for probable credit losses based on historical loss experience, adverse situations that may affect a client's ability to pay and current economic conditions and outlook based on reasonable and supportable forecasts.
25
Total allowance for credit losses as a percentage of finance receivables was 2% at December 31, 2021 and 3% at December 31, 2020. Holding all other assumptions constant, a 0.25% change in the allowance rate at December 31, 2021 would have reduced pre-tax income by $3 million.
Trade accounts receivable are generally due within 30 days after the invoice date. Accounts deemed uncollectible are written off against the allowance after all collection efforts have been exhausted and management deems the account to be uncollectible. We believe that our accounts receivable credit risk is low because of the geographic and industry diversification of our clients and small account balances for most of our clients.
The allowance for credit losses as a percentage of trade accounts receivables was 3% at December 31, 2021 and 5% at December 31, 2020. Holding all other assumptions constant, a 0.25% change in the allowance rate at December 31, 2021 would have reduced pre-tax income by $1 million.
Income taxes and valuation allowance
We are subject to income taxes in the U.S. and numerous foreign jurisdictions. Our annual tax rate is based on income, statutory tax rates, tax reserve changes and tax planning opportunities available to us in the various jurisdictions in which we operate. Significant judgment is required in determining the annual tax rate and in evaluating our tax positions. We regularly assess the likelihood of tax adjustments in each of the tax jurisdictions in which we have operations and account for the related financial statement implications. We have established tax reserves that we believe are appropriate given the possibility of tax adjustments. Determining the appropriate level of tax reserves requires judgment regarding the uncertain application of tax laws. Reserves are adjusted when information becomes available or when an event occurs indicating a change in the reserve is appropriate. Changes in tax reserves could have a material impact on our financial condition or results of operations.
Significant judgment is also required in determining the amount of deferred tax assets that will ultimately be realized and corresponding deferred tax asset valuation allowance. When estimating the necessary valuation allowance, we consider all available evidence for each jurisdiction including historical operating results, estimates of future taxable income and the feasibility of ongoing tax planning strategies. If new information becomes available that would alter our estimate of the amount of deferred tax assets that will ultimately be realized, we adjust the valuation allowance through income tax expense. Changes in the deferred tax asset valuation allowance could have a material impact on our financial condition or results of operations.
Pension benefits
The calculation of net periodic pension expense and determination of net pension obligations are dependent on assumptions and estimates relating to, among other things, the discount rate (interest rate used to discount the future estimated liability) and the expected rate of return on plan assets. These assumptions are evaluated and updated annually.
The discount rate for our largest plan, the U.S. Qualified Pension Plan (the U.S. Plan) and our largest foreign plan, the U.K. Qualified Pension Plan (the U.K. Plan) used in the determination of net periodic pension expense for 2021 was 2.55% and 1.30%, respectively. For 2022, the discount rate used in the determination of net periodic pension expense for the U.S. Plan and the U.K. Plan will be 2.85% and 1.85%, respectively. A 0.25% change in the discount rate would not materially impact annual pension expense for the U.S. Plan or the U.K. Plan. A 0.25% change in the discount rate would impact the projected benefit obligation of the U.S. Plan and U.K. Plan by $45 million and $27 million, respectively.
The expected rate of return on plan assets used in the determination of net periodic pension expense for 2021 was 5.60% for the U.S. Plan and 4.75% for the U.K. Plan. For 2022, the expected rate of return on plan assets used in the determination of net periodic pension expense for the U.S. Plan will be 5.10% and the U.K. Plan will be 4.0%. A 0.25% change in the expected rate of return on plan assets would impact annual pension expense for the U.S. Plan by $4 million and the U.K. Plan by $1 million.
Actual pension plan results that differ from our assumptions and estimates are accumulated and amortized primarily over the life expectancy of plan participants and affect future pension expense. Net pension expense is also based on a market-related valuation of plan assets where differences between the actual and expected return on plan assets are recognized over a five-year period. Plan benefits for participants in a majority of our U.S. and foreign pension plans are frozen.
Residual value of leased assets
Equipment residual values are determined at the inception of the lease using estimates of the equipment's fair value at the end of the lease term. Residual value estimates impact the determination of whether a lease is classified as an operating lease or a sales-type lease. Fair value estimates of equipment at the end of the lease term are based on historical renewal experience, used equipment markets, competition and technological changes.
26
We evaluate residual values on an annual basis or sooner if circumstances warrant. Declines in estimated residual values considered "other-than-temporary" are recognized immediately. Increases in estimated future residual values are not recognized until the equipment is remarketed. If the actual residual value of leased assets were 10% lower than management's current estimates and considered "other-than-temporary", pre-tax income would be $5 million lower.
Legal and Regulatory Matters
See Regulatory Matters in Item 1, Other Tax Matters in Note 15 to the Consolidated Financial Statements for regulatory matters regarding our tax returns and Note 16 to the Consolidated Financial Statements for information regarding our legal proceedings.
Foreign Currency Exchange
The functional currency for most of our foreign operations is the local currency. Changes in the value of the U.S. dollar relative to the currencies of countries in which we operate impact our reported assets, liabilities, revenue and expenses. Exchange rate fluctuations can also impact the settlement of intercompany receivables and payables between our subsidiaries in different countries. During 2021, 15% of our consolidated revenue was from operations outside the United States and the translation of foreign currencies to the U.S. dollar did not have a material impact on revenues or operating results for the year ended December 31, 2021.
ITEM 7A. QUANTITATIVE AND QUALITATIVE DISCLOSURES ABOUT MARKET RISK
We are exposed to market risks primarily from changes in foreign currency exchange rates and interest rates. To manage these market risks, we employ derivatives according to established policies and procedures, including foreign currency contracts and interest rate swaps. We do not use derivatives for speculative purposes. We are also exposed to credit risk on our accounts receivable and finance receivable portfolio.
Foreign Exchange Risk
Our foreign currency risks include the translation of local currency balances of foreign subsidiaries and transaction gains and losses associated with intercompany loans, transactions denominated in currencies other than a location’s functional currency and forecasted inventory purchases between affiliates and third parties. Our objective in managing exposure to foreign currency is to reduce the volatility in earnings and cash flows associated with fluctuations in foreign currency exchange rates. The principal currencies actively hedged are the British Pound, Canadian Dollar and the Euro.
At December 31, 2021 and 2020, we had outstanding foreign currency exchange rate contracts to mitigate the currency risk associated with forecasted inventory purchases between affiliates and third parties. These contracts are designated as cash flow hedges and changes in fair value are recognized in accumulated other comprehensive income, a component of stockholders’ equity. At December 31, 2021 and 2020, we also had outstanding foreign currency exchange rate contracts to mitigate the currency risk associated with intercompany loans and related interest denominated in foreign currencies. These contracts are not designated as hedging instruments and changes in fair value of the derivative contract and transaction gains and losses associated with the revaluation of the intercompany loans are recorded in earnings. Changes in the fair values of foreign currency derivative contracts recognized in earnings are generally offset by transaction gains and losses on the underlying intercompany loans.
Interest Rate Risk
We are exposed to interest rate risk principally in relation to our variable-rate debt borrowings. At December 31, 2021 and 2020, 26% and 27% or our debt was at variable rates, respectively. The weighted average interest rate of our variable rate debt at December 31, 2021 and 2020 was 3.1% and 4.5%, respectively. A 100 basis point change in the effective interest rate of our variable rate debt in 2021 would have increased interest expense approximately $6 million.
We also maintain a significant investment portfolio comprised of fixed-rate interest-bearing money market funds, government and municipal securities, corporate securities and mortgage and asset-backed securities. Changes in interest rates impact the fair value of these investments; however, these securities are designated as available-for-sale, and changes in fair value due to changes in interest rates are recognized as accumulated other comprehensive income, a component of equity, and does not impact net income. We have the intent and ability to hold securities to maturity and therefore, do not expect to recognize impairment losses on investment securities in an unrealized loss position.
Credit Risk
We are exposed to credit risk on our accounts receivable and finance receivable balances. This risk is mitigated due to our large, diverse client base, dispersed over various geographic regions and industrial sectors. No single client comprised more than 10% of our consolidated net sales in 2021 or 2020. We maintain provisions for potential credit losses based on historical experience, age of
27
receivable, current economic conditions and future outlook and other relevant factors that may impact our customers’ ability to pay. We continually evaluate the adequacy of our allowance for credit losses and adjust as necessary.
ITEM 8. FINANCIAL STATEMENTS AND SUPPLEMENTARY DATA
See "Index to Consolidated Financial Statements and Schedules" in this Form 10-K.
ITEM 9. CHANGES IN AND DISAGREEMENTS WITH ACCOUNTANTS ON ACCOUNTING AND FINANCIAL DISCLOSURE
None.
ITEM 9A. CONTROLS AND PROCEDURES
Evaluation of Disclosure Controls and Procedures
We maintain disclosure controls and procedures (as defined in Rule 13a-15(e) and Rule 15d-15(e) under the Securities Exchange Act of 1934, as amended (the Exchange Act)), that are designed to reasonably assure that information required to be disclosed in reports filed or submitted under the Exchange Act is recorded, processed, summarized and reported within the time periods specified in the Securities and Exchange Commission’s rules and forms, and to reasonably assure that such information is accumulated and communicated to management, including our Chief Executive Officer (CEO) and Chief Financial Officer (CFO), to allow timely decisions regarding required disclosure.
Any system of controls and procedures, no matter how well designed and operated, can provide only reasonable (and not absolute) assurance of achieving the desired control objectives. Under the direction of our CEO and CFO, management evaluated the effectiveness of the design and operation of our disclosure controls and procedures as required by Rule 13a-15 or Rule 15d-15 under the Exchange Act. Notwithstanding this caution, the CEO and CFO have reasonable assurance that the disclosure controls and procedures were effective as of December 31, 2021.
Management's Report on Internal Control over Financial Reporting
Management is responsible for establishing and maintaining adequate internal control over financial reporting as defined in Rules 13a-15(f) and 15d-15(f) under the Exchange Act. Management assessed the effectiveness of the internal control over financial reporting as of December 31, 2021 under the criteria set forth by the Committee of Sponsoring Organizations of the Treadway Commission (COSO) in Internal Control - Integrated Framework (2013) and concluded that the internal control over financial reporting was effective.
The effectiveness of our internal control over financial reporting as of December 31, 2021 has been audited by PricewaterhouseCoopers LLP, an independent registered public accounting firm, as stated in their report in this Form 10-K.
Changes in Internal Control over Financial Reporting
There have been no changes in our internal control over financial reporting during the three months ended December 31, 2021, that have materially affected, or are reasonably likely to materially affect, such internal control over financial reporting.
ITEM 9B. OTHER INFORMATION
None.
ITEM 9C. DISCLOSURE REGARDING FOREIGN JURISDICTIONS THAT PREVENT INSPECTIONS
None.
28
PART III
ITEM 10. DIRECTORS, EXECUTIVE OFFICERS AND CORPORATE GOVERNANCE
Other than information regarding our executive officers disclosed in Part I of this Annual Report, the information required by this Item is incorporated by reference to our Proxy Statement to be filed in connection with the 2022 Annual Meeting of Stockholders.
Code of Ethics
We have Business Practices Guidelines (BPG) that apply to all our officers and other employees and a Code of Business Conduct and Ethics (the Code) that applies to our Board of Directors. The BPG and the Code are posted on our corporate governance website located at www.pb.com/us/our-company/leadership-and-governance/corporate-governance.html. Amendments to either the BPG or the Code and any waiver from a provision of the BPG or the Code requiring disclosure will be disclosed on our corporate governance website.
Audit Committee - Audit Committee Financial Expert
The information regarding the Audit Committee, its members and the Audit Committee financial experts is incorporated by reference to our Proxy Statement to be filed in connection with the 2022 Annual Meeting of Stockholders.
ITEM 11. EXECUTIVE COMPENSATION
The information required by this Item is incorporated by reference to our Proxy Statement to be filed in connection with the 2022 Annual Meeting of Stockholders.
ITEM 12. SECURITY OWNERSHIP OF CERTAIN BENEFICIAL OWNERS AND MANAGEMENT AND RELATED STOCKHOLDER MATTERS
EQUITY COMPENSATION PLAN INFORMATION TABLE
The following table provides information as of December 31, 2021 regarding the number of shares of common stock that may be issued under our equity compensation plans.
| Plan Category | (a) Number of securities to be issued upon exercise of outstanding options, warrants and rights | (b) Weighted-average exercise price of outstanding options, warrants and rights | (c) Number of securities remaining available for future issuance under equity compensation plans excluding securities reflected in column (a) | |||||||||||||||||
Equity compensation plans approved by security holders | 11,120,069 | $10.64 | 119,940,056 | |||||||||||||||||
Equity compensation plans not approved by security holders | — | — | — | |||||||||||||||||
| Total | 11,120,069 | $10.64 | 119,940,056 | |||||||||||||||||
Other than information regarding securities authorized for issuance under equity compensation plans, the information required by this Item is incorporated by reference to our Proxy Statement to be filed in connection with the 2022 Annual Meeting of Stockholders.
ITEM 13. CERTAIN RELATIONSHIPS, RELATED TRANSACTIONS AND DIRECTOR INDEPENDENCE
The information required by this Item is incorporated by reference to our Proxy Statement to be filed in connection with the 2022 Annual Meeting of Stockholders.
ITEM 14. PRINCIPAL ACCOUNTANT FEES AND SERVICES
The information required by this Item is incorporated by reference to our Proxy Statement to be filed in connection with the 2022 Annual Meeting of Stockholders.
29
PART IV
ITEM 15. EXHIBITS AND FINANCIAL STATEMENT SCHEDULES
(a)(1) Index to Consolidated Financial Statements and Schedules | Page Number in Form 10-K | ||||
| Consolidated Statements of Income (Loss) for the years ended December 31, 2021, 2020 and 2019 | |||||
| Consolidated Statements of Comprehensive Income (Loss) for the years ended December 31, 2021, 2020 and 2019 | |||||
| Consolidated Balance Sheets at December 31, 2021 and 2020 | |||||
| Consolidated Statements of Cash Flows for the years ended December 31, 2021, 2020 and 2019 | |||||
| Consolidated Statements of Stockholders' Equity for the years ended December 31, 2021, 2020 and 2019 | |||||
| Notes to Consolidated Financial Statements | |||||
| Schedule II - Valuation and Qualifying Accounts and Reserves for the years ended December 31, 2021, 2020 and 2019 | |||||
(a)(2) Exhibits
Reg. S-K exhibits | Description | Status or incorporation by reference | ||||||
| 3(a) | Amended and Restated Certificate of Incorporation of Pitney Bowes Inc. | |||||||
| 3(b) | Pitney Bowes Inc. Amended and Restated By-laws (effective May 10, 2013) | |||||||
| 4 | Description of Registered Securities | |||||||
| 4(a) | Form of Indenture between the Company and SunTrust Bank, as Trustee | |||||||
| 4(b) | Supplemental Indenture No. 1 dated April 18, 2003 between the Company and SunTrust Bank, as Trustee | |||||||
| 4(d) | First Supplemental Indenture, by and among Pitney Bowes Inc., The Bank of New York, and Citibank, N.A., to the Indenture, dated as of February 14, 2005, by and between the Company and Citibank | |||||||
| 4(e) | Supplemental Indenture No. 2 dated as of February 26, 2020, by and between the Company and The Bank of New York Mellon, as trustee | |||||||
| 4(f) | Indenture, dated March 19, 2021, among Pitney Bowes Inc., the guarantors party thereto and Truist Bank, as trustee, with respect to Pitney Bowes Inc.'s 6.875% Senior Notes due 2027. | |||||||
| 4(g) | Indenture, dated March 19, 2021, among Pitney Bowes Inc., the guarantors party thereto and Truist Bank, as trustee, with respect to Pitney Bowes Inc.'s 7.250% Senior Notes due 2029. | |||||||
| 10(a) * | Retirement Plan for Directors of Pitney Bowes Inc. | |||||||
| 10(b.3) * | Pitney Bowes Inc. Directors' Stock Plan (Amended and Restated effective May 12, 2014) | |||||||
| 10(c) * | Pitney Bowes Stock Plan (as amended and restated as of January 1, 2002) | |||||||
| 10(d) * | Pitney Bowes Inc. 2007 Stock Plan (as amended November 7, 2009) | |||||||
| 10(e) * | Pitney Bowes Inc. Key Employees' Incentive Plan (as amended and restated February 4, 2019) | |||||||
| 10(f) * | Pitney Bowes Severance Plan (as amended and restated as of January 1, 2008) | |||||||
30
PART IV
Reg. S-K exhibits | Description | Status or incorporation by reference | ||||||
| 10(g) * | Pitney Bowes Senior Executive Severance Policy (as amended and restated as of February 4, 2019) | |||||||
| 10(h) * | Pitney Bowes Inc. Deferred Incentive Savings Plan for the Board of Directors, as amended and restated effective January 1, 2009 | |||||||
| 10(i) * | Pitney Bowes Inc. Deferred Incentive Savings Plan as amended and restated effective January 1, 2009 | |||||||
| 10(j) * | Pitney Bowes Inc. 1998 U.K. S.A.Y.E. Stock Option Plan | |||||||
| 10(k) * | Form of Long Term Incentive Award Agreement | |||||||
| 10(m)* | Pitney Bowes Director Equity Deferral plan dated November 8, 2013 (effective May 12, 2014) | |||||||
| 10(o)* | Pitney Bowes Executive Equity Deferral Plan dated November 7, 2014 | |||||||
| 10(p)* | Pitney Bowes Inc. 2013 Stock Plan | |||||||
| 10(q)* | Amended and Restated Pitney Bowes Inc. 2018 Stock Plan | |||||||
| 10(r) | Credit Agreement, dated as of November 1, 2019 (the "Credit Agreement"), among the company, the lenders and issuing banks party thereto and JPMorgan Chase Bank, N.A., as administrative agent. | |||||||
| 10(s) | First Incremental Facility Amendment, dated as of February 19, 2020, to the Credit Agreement, among the company, the lenders and issuing banks party thereto and JPMorgan Chase Bank, N.A., administrative agent. | |||||||
| 10(t) | First Amendment, dated as of March 19, 2021, among Pitney Bowes Inc., the subsidiaries of Pitney Bowes Inc. party thereto, the lenders and issuing banks party thereto, and JPMorgan Chase Bank, N.A., as administrative agent | |||||||
| 10(u) | First Refinancing Agreement, dated as of March 19, 2021, among Pitney Bowes Inc., the subsidiaries of Pitney Bowes Inc. party thereto and JPMorgan Chase Bank, N.A., as administrative agent and refinancing tranche B term lender. | |||||||
| 18 | Preferability letter on change in accounting principle | |||||||
| 21 | Subsidiaries of the registrant | |||||||
| 23 | Consent of independent registered accounting firm | |||||||
| 31.1 | Certification of Chief Executive Officer Pursuant to Rules 13a-14(a) and 15d-14(a) under the Securities Exchange Act of 1934, as amended. | |||||||
| 31.2 | Certification of Chief Financial Officer Pursuant to Rules 13a-14(a) and 15d-14(a) under the Securities Exchange Act of 1934, as amended. | |||||||
| 32.1 | Certification of Chief Executive Officer Pursuant to 18 U.S.C. Section 1350 | |||||||
| 32.2 | Certification of Chief Financial Officer Pursuant to 18 U.S.C. Section 1350 | |||||||
31
PART IV
Reg. S-K exhibits | Description | Status or incorporation by reference | ||||||
| 101.SCH | XBRL Taxonomy Extension Schema Document | |||||||
| 101.CAL | XBRL Taxonomy Calculation Linkbase Document | |||||||
| 101.DEF | XBRL Taxonomy Definition Linkbase Document | |||||||
| 101.LAB | XBRL Taxonomy Label Linkbase Document | |||||||
| 101.PRE | XBRL Taxonomy Presentation Linkbase Document | |||||||
| 104 | The cover page from the Company's Annual Report on Form 10-K for the year ended December 31, 2021, formatted in Inline XBRL (included as Exhibit 101). | |||||||
* The Exhibits identified above with an asterisk (*) are management contracts or compensatory plans or arrangements.
The Company has outstanding certain other long-term indebtedness. Such long-term indebtedness does not exceed 10% of the total assets of the Company; therefore, copies of instruments defining the rights of holders of such indebtedness are not included as exhibits. The Company agrees to furnish copies of such instruments to the SEC upon request.
ITEM 16. FORM 10-K SUMMARY
None
32
PART IV
SIGNATURES
Pursuant to the requirements of Section 13 or 15(d) of the Securities Exchange Act of 1934, the Registrant has duly caused this report to be signed on its behalf by the undersigned, thereunto duly authorized.
Date: February 22, 2022 PITNEY BOWES INC.
Registrant
By: /s/ Marc B. Lautenbach
Marc B. Lautenbach
President and Chief Executive Officer
Pursuant to the requirements of the Securities Exchange Act of 1934, this report has been signed below by the following persons on behalf of the Registrant and in the capacities and on the dates indicated.
| Signature | Title | Date | ||||||||||||
/s/ Marc B. Lautenbach Marc B. Lautenbach | President and Chief Executive Officer - Director (Principal Executive Officer) | February 22, 2022 | ||||||||||||
/s/ Ana Maria Chadwick Ana Maria Chadwick | Executive Vice President, Chief Financial Officer (Principal Financial Officer) | February 22, 2022 | ||||||||||||
/s/ Joseph R. Catapano Joseph R. Catapano | Vice President, Chief Accounting Officer (Principal Accounting Officer) | February 22, 2022 | ||||||||||||
/s/ Michael I. Roth Michael I. Roth | Non-Executive Chairman - Director | February 22, 2022 | ||||||||||||
/s/ Anne M. Busquet Anne M. Busquet | Director | February 22, 2022 | ||||||||||||
/s/ Robert M. Dutkowsky Robert M. Dutkowsky | Director | February 22, 2022 | ||||||||||||
/s/ Anne Sutherland Fuchs Anne Sutherland Fuchs | Director | February 22, 2022 | ||||||||||||
/s/ Mary J. Steele Guilfoile Mary J. Steele Guilfoile | Director | February 22, 2022 | ||||||||||||
/s/ S. Douglas Hutcheson S. Douglas Hutcheson | Director | February 22, 2022 | ||||||||||||
/s/ Linda S. Sanford Linda S. Sanford | Director | February 22, 2022 | ||||||||||||
/s/ David L. Shedlarz David L. Shedlarz | Director | February 22, 2022 | ||||||||||||
/s/ Sheila A. Stamps Sheila A. Stamps | Director | February 22, 2022 | ||||||||||||
33
PART IV
| Page Number | ||||||||
Report of Independent Registered Public Accounting Firm (PCAOB ID: | ||||||||
| Consolidated Financial Statements of Pitney Bowes Inc. | ||||||||
| Consolidated Statements of Income (Loss) for the years ended December 31, 2021, 2020 and 2019 | ||||||||
| Consolidated Statements of Comprehensive Income (Loss) for the years ended December 31, 2021, 2020 and 2019 | ||||||||
| Consolidated Balance Sheets at December 31, 2021 and 2020 | ||||||||
| Consolidated Statements of Cash Flows for the years ended December 31, 2021, 2020 and 2019 | ||||||||
| Consolidated Statements of Stockholders' Equity for the years ended December 31, 2021, 2020 and 2019 | ||||||||
| Financial Statement Schedule | ||||||||
| Schedule II - Valuation and Qualifying Accounts and Reserves for the years ended December 31, 2021, 2020 and 2019 | ||||||||
34
Report of Independent Registered Public Accounting Firm
To the Board of Directors and Stockholders of Pitney Bowes Inc.
Opinions on the Financial Statements and Internal Control over Financial Reporting
We have audited the accompanying consolidated balance sheets of Pitney Bowes Inc. and its subsidiaries (the “Company”) as of December 31, 2021 and 2020, and the related consolidated statements of income (loss), comprehensive income (loss), stockholders’ equity and cash flows for each of the three years in the period ended December 31, 2021, including the related notes and financial statement schedule listed in the index appearing under Item 15(a)(1) (collectively referred to as the “consolidated financial statements”). We also have audited the Company's internal control over financial reporting as of December 31, 2021, based on criteria established in Internal Control - Integrated Framework (2013) issued by the Committee of Sponsoring Organizations of the Treadway Commission (COSO).
In our opinion, the consolidated financial statements referred to above present fairly, in all material respects, the financial position of the Company as of December 31, 2021 and 2020, and the results of its operations and its cash flows for each of the three years in the period ended December 31, 2021 in conformity with accounting principles generally accepted in the United States of America. Also in our opinion, the Company maintained, in all material respects, effective internal control over financial reporting as of December 31, 2021, based on criteria established in Internal Control - Integrated Framework (2013) issued by the COSO.
Changes in Accounting Principles
As discussed in Note 1 to the consolidated financial statements, the Company changed the manner in which it accounts for inventory in 2021 and the manner in which it accounts for credit losses on financial assets in 2020.
Basis for Opinions
The Company's management is responsible for these consolidated financial statements, for maintaining effective internal control over financial reporting, and for its assessment of the effectiveness of internal control over financial reporting, included in Management’s Report on Internal Control over Financial Reporting appearing under Item 9A. Our responsibility is to express opinions on the Company’s consolidated financial statements and on the Company's internal control over financial reporting based on our audits. We are a public accounting firm registered with the Public Company Accounting Oversight Board (United States) (PCAOB) and are required to be independent with respect to the Company in accordance with the U.S. federal securities laws and the applicable rules and regulations of the Securities and Exchange Commission and the PCAOB.
We conducted our audits in accordance with the standards of the PCAOB. Those standards require that we plan and perform the audits to obtain reasonable assurance about whether the consolidated financial statements are free of material misstatement, whether due to error or fraud, and whether effective internal control over financial reporting was maintained in all material respects.
Our audits of the consolidated financial statements included performing procedures to assess the risks of material misstatement of the consolidated financial statements, whether due to error or fraud, and performing procedures that respond to those risks. Such procedures included examining, on a test basis, evidence regarding the amounts and disclosures in the consolidated financial statements. Our audits also included evaluating the accounting principles used and significant estimates made by management, as well as evaluating the overall presentation of the consolidated financial statements. Our audit of internal control over financial reporting included obtaining an understanding of internal control over financial reporting, assessing the risk that a material weakness exists, and testing and evaluating the design and operating effectiveness of internal control based on the assessed risk. Our audits also included performing such other procedures as we considered necessary in the circumstances. We believe that our audits provide a reasonable basis for our opinions.
Definition and Limitations of Internal Control over Financial Reporting
A company’s internal control over financial reporting is a process designed to provide reasonable assurance regarding the reliability of financial reporting and the preparation of financial statements for external purposes in accordance with generally accepted accounting principles. A company’s internal control over financial reporting includes those policies and procedures that (i) pertain to the maintenance of records that, in reasonable detail, accurately and fairly reflect the transactions and dispositions of the assets of the company; (ii) provide reasonable assurance that transactions are recorded as necessary to permit preparation of financial statements in accordance with generally accepted accounting principles, and that receipts and expenditures of the company are being made only in accordance with authorizations of management and directors of the company; and (iii) provide reasonable assurance regarding prevention or timely detection of unauthorized acquisition, use, or disposition of the company’s assets that could have a material effect on the financial statements.
35
Because of its inherent limitations, internal control over financial reporting may not prevent or detect misstatements. Also, projections of any evaluation of effectiveness to future periods are subject to the risk that controls may become inadequate because of changes in conditions, or that the degree of compliance with the policies or procedures may deteriorate.
Critical Audit Matters
The critical audit matter communicated below is a matter arising from the current period audit of the consolidated financial statements that was communicated or required to be communicated to the audit committee and that (i) relates to accounts or disclosures that are material to the consolidated financial statements and (ii) involved our especially challenging, subjective, or complex judgments. The communication of critical audit matters does not alter in any way our opinion on the consolidated financial statements, taken as a whole, and we are not, by communicating the critical audit matter below, providing a separate opinion on the critical audit matter or on the accounts or disclosures to which it relates.
Goodwill Impairment Assessment – Global Ecommerce Reporting Unit
As described in Notes 1 and 9 to the consolidated financial statements, the Company’s consolidated goodwill balance was $1,135 million as of December 31, 2021, and the goodwill balance associated with the Global Ecommerce reporting unit was $395 million. Goodwill is tested annually for impairment at the reporting unit level during the fourth quarter or sooner if circumstances indicate an impairment may exist. The impairment test for goodwill determines the fair value of each reporting unit and compares it to the reporting unit’s carrying value, including goodwill. If the fair value of a reporting unit is less than its carrying value an impairment loss is recognized for the difference, not to exceed the carrying amount of goodwill. During the fourth quarter of 2021, management performed its annual goodwill impairment test to assess the recoverability of the carrying value of goodwill and determined that the fair value of the Global Ecommerce reporting unit exceeded its carrying value and therefore no impairment was recorded. As disclosed by management, the fair value of the Global Ecommerce reporting unit was estimated by management using a discounted cash flow model. Management’s cash flow projections included judgments and assumptions relating to revenue growth rates, projected operating income, and the discount rate.
The principal considerations for our determination that performing procedures relating to the goodwill impairment assessment of the Global Ecommerce reporting unit is a critical audit matter are (i) the significant judgment by management when developing the fair value of the reporting unit; (ii) a high degree of auditor judgment, subjectivity, and effort in performing procedures and evaluating management’s significant assumptions related to revenue growth rates, certain forecasted costs included in the determination of projected operating income and the discount rate; and (iii) the audit effort involved the use of professionals with specialized skill and knowledge.
Addressing the matter involved performing procedures and evaluating audit evidence in connection with forming our overall opinion on the consolidated financial statements. These procedures included testing the effectiveness of controls relating to management’s goodwill impairment assessment, including controls over the valuation of the Global Ecommerce reporting unit. These procedures also included, among others (i) testing management’s process for developing the fair value estimate; (ii) evaluating the appropriateness of the discounted cash flow model; (iii) testing the completeness and accuracy of underlying data used in the model; and (iv) evaluating the reasonableness of the significant assumptions used by management related to the revenue growth rates, certain forecasted costs included in the determination of projected operating income, and the discount rate. Evaluating management’s assumptions related to revenue growth rates and certain forecasted costs included in the determination of projected operating income involved evaluating whether the assumptions used by management were reasonable considering (i) the current and past performance of the reporting unit, (ii) the consistency with external market and industry data, and (iii) whether these assumptions were consistent with evidence obtained in other areas of the audit. Professionals with specialized skill and knowledge were used to assist in the evaluation of management’s discounted cash flow model and the discount rate assumption.
/s/ PricewaterhouseCoopers LLP
February 22, 2022
We have served as the Company’s auditor since 1934.
36
PITNEY BOWES INC.
CONSOLIDATED STATEMENTS OF INCOME (LOSS)
(In thousands, except per share amounts)
| Years Ended December 31, | |||||||||||||||||
| 2021 | 2020 | 2019 | |||||||||||||||
| Revenue: | |||||||||||||||||
| Business services | $ | $ | $ | ||||||||||||||
| Support services | |||||||||||||||||
| Financing | |||||||||||||||||
| Equipment sales | |||||||||||||||||
| Supplies | |||||||||||||||||
| Rentals | |||||||||||||||||
| Total revenue | |||||||||||||||||
| Costs and expenses: | |||||||||||||||||
| Cost of business services | |||||||||||||||||
| Cost of support services | |||||||||||||||||
| Financing interest expense | |||||||||||||||||
| Cost of equipment sales | |||||||||||||||||
| Cost of supplies | |||||||||||||||||
| Cost of rentals | |||||||||||||||||
| Selling, general and administrative | |||||||||||||||||
| Research and development | |||||||||||||||||
| Restructuring charges and asset impairments | |||||||||||||||||
| Goodwill impairment | |||||||||||||||||
| Interest expense, net | |||||||||||||||||
| Other components of net pension and postretirement cost (income) | ( | ( | |||||||||||||||
| Other expense, net | |||||||||||||||||
| Total costs and expenses | |||||||||||||||||
| (Loss) income from continuing operations before income taxes | ( | ( | |||||||||||||||
| (Benefit) provision for income taxes | ( | ( | |||||||||||||||
| Income (loss) from continuing operations | ( | ||||||||||||||||
| (Loss) income from discontinued operations, net of tax | ( | ||||||||||||||||
| Net (loss) income | $ | ( | $ | ( | $ | ||||||||||||
Basic (loss) earnings per share attributable to common stockholders (1): | |||||||||||||||||
| Continuing operations | $ | $ | ( | $ | |||||||||||||
| Discontinued operations | ( | ||||||||||||||||
| Net (loss) income | $ | ( | $ | ( | $ | ||||||||||||
Diluted (loss) earnings per share attributable to common stockholders (1): | |||||||||||||||||
| Continuing operations | $ | $ | ( | $ | |||||||||||||
| Discontinued operations | ( | ||||||||||||||||
| Net (loss) income | $ | ( | $ | ( | $ | ||||||||||||
(1)The sum of the earnings per share amounts may not equal the totals due to rounding.
See Notes to Consolidated Financial Statements
37
PITNEY BOWES INC.
CONSOLIDATED STATEMENTS OF COMPREHENSIVE INCOME (LOSS)
(In thousands)
| Years Ended December 31, | |||||||||||||||||
| 2021 | 2020 | 2019 | |||||||||||||||
| Net (loss) income | $ | ( | $ | ( | $ | ||||||||||||
| Other comprehensive income, net of tax: | |||||||||||||||||
Foreign currency translations, net of tax of $( | ( | ||||||||||||||||
Net unrealized gain (loss) on cash flow hedges, net of tax of $ | ( | ||||||||||||||||
Net unrealized (loss) gain on available for sale securities, net of tax of $( | ( | ( | |||||||||||||||
Adjustments to pension and postretirement plans, net of tax of $ | ( | ( | |||||||||||||||
Amortization of pension and postretirement costs, net of tax of $ | |||||||||||||||||
| Other comprehensive income, net of tax | |||||||||||||||||
| Comprehensive income (loss) | $ | $ | ( | $ | |||||||||||||
See Notes to Consolidated Financial Statements
38
PITNEY BOWES INC.
CONSOLIDATED BALANCE SHEETS
(In thousands, except share amounts)
| December 31, 2021 | December 31, 2020 | ||||||||||
| ASSETS | |||||||||||
| Current assets: | |||||||||||
| Cash and cash equivalents | $ | $ | |||||||||
Short-term investments (includes $ | |||||||||||
Accounts and other receivables (net of allowance of $ | |||||||||||
Short-term finance receivables (net of allowance of $ | |||||||||||
| Inventories | |||||||||||
| Current income taxes | |||||||||||
| Other current assets and prepayments | |||||||||||
| Total current assets | |||||||||||
| Property, plant and equipment, net | |||||||||||
| Rental property and equipment, net | |||||||||||
Long-term finance receivables (net of allowance of $ | |||||||||||
| Goodwill | |||||||||||
| Intangible assets, net | |||||||||||
| Operating lease assets | |||||||||||
| Noncurrent income taxes | |||||||||||
Other assets (includes $ | |||||||||||
| Total assets | $ | $ | |||||||||
| LIABILITIES AND STOCKHOLDERS’ EQUITY | |||||||||||
| Current liabilities: | |||||||||||
| Accounts payable and accrued liabilities | $ | $ | |||||||||
| Customer deposits at the Bank | |||||||||||
| Current operating lease liabilities | |||||||||||
| Current portion of long-term debt | |||||||||||
| Advance billings | |||||||||||
| Current income taxes | |||||||||||
| Total current liabilities | |||||||||||
| Long-term debt | |||||||||||
| Deferred taxes on income | |||||||||||
| Tax uncertainties and other income tax liabilities | |||||||||||
| Noncurrent operating lease liabilities | |||||||||||
| Other noncurrent liabilities | |||||||||||
| Total liabilities | |||||||||||
| Commitments and contingencies (See Note 16) | |||||||||||
| Stockholders' equity: | |||||||||||
Common stock, $ | |||||||||||
| Additional paid-in capital | |||||||||||
| Retained earnings | |||||||||||
| Accumulated other comprehensive loss | ( | ( | |||||||||
Treasury stock, at cost ( | ( | ( | |||||||||
| Total stockholders’ equity | |||||||||||
| Total liabilities and stockholders’ equity | $ | $ | |||||||||
See Notes to Consolidated Financial Statements
39
PITNEY BOWES INC.
CONSOLIDATED STATEMENTS OF CASH FLOWS
(In thousands)
| Years Ended December 31, | |||||||||||||||||
| 2021 | 2020 | 2019 | |||||||||||||||
| Cash flows from operating activities: | |||||||||||||||||
| Net (loss) income | $ | ( | $ | ( | $ | ||||||||||||
| Loss (income) from discontinued operations, net of tax | ( | ( | |||||||||||||||
| Adjustments to reconcile net (loss) income to net cash provided by operating activities: | |||||||||||||||||
| Depreciation and amortization | |||||||||||||||||
| Allowance for credit losses | |||||||||||||||||
| Stock-based compensation | |||||||||||||||||
| Amortization of debt fees | |||||||||||||||||
| Loss on debt refinancing | |||||||||||||||||
| Restructuring charges and asset impairments | |||||||||||||||||
| Restructuring payments | ( | ( | ( | ||||||||||||||
| Pension contributions and retiree medical payments | ( | ( | ( | ||||||||||||||
| (Gain) loss on sale of assets/businesses | ( | ( | |||||||||||||||
| Goodwill impairment | |||||||||||||||||
| Deferred tax (benefit) provision | ( | ||||||||||||||||
| Changes in operating assets and liabilities, net of acquisitions/divestitures: | |||||||||||||||||
| Accounts and other receivables | ( | ( | |||||||||||||||
| Finance receivables | |||||||||||||||||
| Inventories | ( | ( | |||||||||||||||
| Other current assets and prepayments | ( | ( | ( | ||||||||||||||
| Accounts payable and accrued liabilities | |||||||||||||||||
| Current and noncurrent income taxes | ( | ||||||||||||||||
| Advance billings | ( | ( | |||||||||||||||
| Other, net | ( | ||||||||||||||||
| Net cash from operating activities: continuing operations | |||||||||||||||||
| Net cash from operating activities: discontinued operations | ( | ||||||||||||||||
| Net cash from operating activities | |||||||||||||||||
| Cash flows from investing activities: | |||||||||||||||||
| Capital expenditures | ( | ( | ( | ||||||||||||||
| Purchases of investment securities | ( | ( | ( | ||||||||||||||
| Proceeds from sales/maturities of investment securities | |||||||||||||||||
| Net investment in loan receivables | ( | ( | ( | ||||||||||||||
| Proceeds from sale of assets/businesses, net of cash sold | |||||||||||||||||
| Acquisitions, net of cash acquired | ( | ( | ( | ||||||||||||||
| Other investing activities | ( | ||||||||||||||||
| Net cash from investing activities: continuing operations | ( | ( | ( | ||||||||||||||
| Net cash from investing activities: discontinued operations | ( | ( | |||||||||||||||
| Net cash from investing activities | ( | ( | |||||||||||||||
| Cash flows from financing activities: | |||||||||||||||||
| Proceeds from the issuance of debt, net of discount | |||||||||||||||||
| Principal payments of debt | ( | ( | ( | ||||||||||||||
| Premiums and fees to refinance debt | ( | ( | ( | ||||||||||||||
| Dividends paid to stockholders | ( | ( | ( | ||||||||||||||
| Customer deposits at the Bank | |||||||||||||||||
| Common stock repurchases | ( | ||||||||||||||||
| Other financing activities | ( | ( | ( | ||||||||||||||
| Net cash from financing activities | ( | ( | ( | ||||||||||||||
| Effect of exchange rate changes on cash and cash equivalents | ( | ||||||||||||||||
| Change in cash and cash equivalents | ( | ( | |||||||||||||||
| Cash and cash equivalents at beginning of period | |||||||||||||||||
| Cash and cash equivalents at end of period | $ | $ | $ | ||||||||||||||
See Notes to Consolidated Financial Statements
40
PITNEY BOWES INC.
CONSOLIDATED STATEMENTS OF STOCKHOLDERS' EQUITY
(In thousands)
| Preferred stock | Preference stock | Common Stock | Additional Paid-in Capital | Retained earnings | Accumulated other comprehensive loss | Treasury stock | Total equity | ||||||||||||||||||||||||||||||||||||||||
| Balance at December 31, 2018 | $ | $ | $ | $ | $ | $ | ( | $ | ( | $ | |||||||||||||||||||||||||||||||||||||
| Cumulative effect of accounting change | — | — | — | — | — | ||||||||||||||||||||||||||||||||||||||||||
| Net income | — | — | — | — | — | — | |||||||||||||||||||||||||||||||||||||||||
| Other comprehensive income | — | — | — | — | — | — | |||||||||||||||||||||||||||||||||||||||||
| Cash dividends | |||||||||||||||||||||||||||||||||||||||||||||||
Common ($ | — | — | — | — | ( | — | — | ( | |||||||||||||||||||||||||||||||||||||||
| Preference | — | — | — | — | ( | — | — | ( | |||||||||||||||||||||||||||||||||||||||
| Issuance of treasury stock | — | — | — | ( | — | — | ( | ||||||||||||||||||||||||||||||||||||||||
| Conversions to common stock | — | ( | — | ( | — | — | |||||||||||||||||||||||||||||||||||||||||
Redemption of preferred/preference stock | ( | ( | — | ( | — | — | — | ( | |||||||||||||||||||||||||||||||||||||||
| Stock-based compensation | — | — | — | — | — | — | |||||||||||||||||||||||||||||||||||||||||
| Repurchase of common stock | — | — | — | — | — | — | ( | ( | |||||||||||||||||||||||||||||||||||||||
| Balance at December 31, 2019 | ( | ( | |||||||||||||||||||||||||||||||||||||||||||||
| Cumulative effect of accounting change | — | — | — | — | ( | — | — | ( | |||||||||||||||||||||||||||||||||||||||
| Net loss | — | — | — | — | ( | — | — | ( | |||||||||||||||||||||||||||||||||||||||
| Other comprehensive income | — | — | — | — | — | — | |||||||||||||||||||||||||||||||||||||||||
Dividends ($ | — | — | — | — | ( | — | — | ( | |||||||||||||||||||||||||||||||||||||||
| Issuance of treasury stock | — | — | — | ( | — | — | ( | ||||||||||||||||||||||||||||||||||||||||
| Stock-based compensation | — | — | — | — | — | — | |||||||||||||||||||||||||||||||||||||||||
| Balance at December 31, 2020 | ( | ( | |||||||||||||||||||||||||||||||||||||||||||||
| Net loss | — | — | — | — | ( | — | — | ( | |||||||||||||||||||||||||||||||||||||||
| Other comprehensive income | — | — | — | — | — | — | |||||||||||||||||||||||||||||||||||||||||
Dividends ($ | — | — | — | — | ( | — | — | ( | |||||||||||||||||||||||||||||||||||||||
| Issuance of treasury stock | — | — | — | ( | — | — | ( | ||||||||||||||||||||||||||||||||||||||||
Stock-based compensation | — | — | — | — | — | — | |||||||||||||||||||||||||||||||||||||||||
| Balance at December 31, 2021 | $ | $ | $ | $ | $ | $ | ( | $ | ( | $ | |||||||||||||||||||||||||||||||||||||
See Notes to Consolidated Financial Statements
41
PITNEY BOWES INC.
NOTES TO CONSOLIDATED FINANCIAL STATEMENTS
(Tabular amounts in thousands, except per share amounts)
1. Summary of Significant Accounting Policies
Basis of Presentation
The accompanying Consolidated Financial Statements of Pitney Bowes Inc. and its wholly owned subsidiaries (we, us, our, or the company) have been prepared in conformity with accounting principles generally accepted in the United States of America (GAAP). Intercompany transactions and balances have been eliminated. Certain prior year amounts have been reclassified to conform to the current year presentation.
Effective October 1, 2021, we elected to adopt the FIFO inventory valuation methodology where we had previously valued inventory on a last-in, first-out (LIFO) basis. We believe that the FIFO basis provides a better matching of revenues and expenses, more closely resembles the physical flow of inventory, provides a consistent valuation methodology throughout our locations and improves comparability with industry peers. We retrospectively applied this change in accounting principle and recorded a cumulative effect adjustment to increase the 2019 opening inventory balance by $4 million and retained earnings by $3 million (net of tax). Financial statements for the years ended December 31, 2020 and 2019 and at December 31, 2020 have been recast and the impact on our previously issued financial statements is presented in the following tables. Had we not elected to adopt the FIFO inventory valuation methodology, 2021 cost of equipment sales would have been approximately $2 million higher and inventory would have been approximately $2 million lower.
| Year Ended December 31, 2020 | |||||||||||||||||
| Consolidated Statement of Income (Loss) | As Previously Reported | Adjustments | As Revised | ||||||||||||||
| Cost of equipment sales | $ | $ | ( | $ | |||||||||||||
| Total costs and expenses | $ | $ | ( | $ | |||||||||||||
| (Loss) income from continuing operations before income taxes | $ | ( | $ | $ | ( | ||||||||||||
| (Benefit) provision for income taxes | $ | $ | $ | ||||||||||||||
| Income (loss) from continuing operations | $ | ( | $ | $ | ( | ||||||||||||
| Net (loss) income | $ | ( | $ | $ | ( | ||||||||||||
| Basic (loss) earnings per share - continuing operations | $ | ( | $ | $ | ( | ||||||||||||
| Basic (loss) earnings per share | $ | ( | $ | $ | ( | ||||||||||||
| Diluted (loss) earnings per share - continuing operations | $ | ( | $ | $ | ( | ||||||||||||
| Diluted (loss) earnings per share | $ | ( | $ | $ | ( | ||||||||||||
| Year Ended December 31, 2019 | |||||||||||||||||
| Consolidated Statement of Income (Loss) | As Previously Reported | Adjustments | As Revised | ||||||||||||||
| Cost of equipment sales | $ | $ | $ | ||||||||||||||
| Total costs and expenses | $ | $ | $ | ||||||||||||||
| (Loss) income from continuing operations before income taxes | $ | $ | ( | $ | |||||||||||||
| (Benefit) provision for income taxes | $ | ( | $ | ( | $ | ( | |||||||||||
| Income (loss) from continuing operations | $ | $ | ( | $ | |||||||||||||
| Net (loss) income | $ | $ | ( | $ | |||||||||||||
| Basic (loss) earnings per share - continuing operations | $ | $ | $ | ||||||||||||||
| Basic (loss) earnings per share | $ | $ | $ | ||||||||||||||
| Diluted (loss) earnings per share - continuing operations | $ | $ | ( | $ | |||||||||||||
| Diluted (loss) earnings per share | $ | $ | $ | ||||||||||||||
42
PITNEY BOWES INC.
NOTES TO CONSOLIDATED FINANCIAL STATEMENTS
(Tabular amounts in thousands, except per share amounts)
| December 31, 2020 | |||||||||||||||||
| Consolidated Balance Sheet | As Previously Reported | Adjustments | As Revised | ||||||||||||||
| Inventories | $ | $ | $ | ||||||||||||||
| Total current assets | $ | $ | $ | ||||||||||||||
| Noncurrent income taxes | $ | $ | ( | $ | |||||||||||||
| Total assets | $ | $ | $ | ||||||||||||||
| Retained earnings | $ | $ | $ | ||||||||||||||
| Total stockholders' equity | $ | $ | $ | ||||||||||||||
| Total liabilities and stockholders' equity | $ | $ | $ | ||||||||||||||
| Year Ended December 31, 2020 | |||||||||||||||||
| Consolidated Statement of Cash Flows | As Previously Reported | Adjustments | As Revised | ||||||||||||||
| Net (loss) income | $ | ( | $ | $ | ( | ||||||||||||
| Deferred tax (benefit) provision | $ | $ | $ | ||||||||||||||
| (Increase) decrease in inventories | $ | $ | ( | $ | |||||||||||||
| Year Ended December 31, 2019 | |||||||||||||||||
| Consolidated Statement of Cash Flows | As Previously Reported | Adjustments | As Revised | ||||||||||||||
| Net (loss) income | $ | $ | ( | $ | |||||||||||||
| Deferred tax (benefit) provision | $ | $ | ( | $ | |||||||||||||
| (Increase) decrease in inventories | $ | ( | $ | $ | ( | ||||||||||||
Marketable Securities
Marketable investment securities are classified as available-for-sale or hold-to-maturity. Investment securities classified as available-for-sale are recorded at fair value with changes in fair value due to market conditions (i.e., interest rates) recorded in accumulated other comprehensive loss (AOCL), and changes in fair value due to credit conditions recorded in earnings. Purchase premiums and discounts are amortized using the effective interest method over the term of the security. Gains and losses on the sale of available-for-sale securities are recorded on the trade date using the specific identification method. There were no
43
PITNEY BOWES INC.
NOTES TO CONSOLIDATED FINANCIAL STATEMENTS
(Tabular amounts in thousands, except per share amounts)
Accounts and Other Receivables and Allowance for Credit Losses
Accounts receivable are generally due within 30 days after the invoice date. We provide an allowance for credit losses based on historical loss experience, the age of the receivables, specific troubled accounts and other currently available information.
Finance Receivables and Allowance for Credit Losses
Finance receivables are comprised of sales-type leases, secured loans and unsecured loans. Sales-type leases and secured loans are from financing options provided to clients for Pitney Bowes equipment or leasing of other manufacturers' equipment and are generally due in installments over periods ranging from to five years . Unsecured loans comprise revolving credit lines offered to our clients for postage and supplies and working capital purposes. These revolving credit lines are generally due monthly; however, clients may rollover outstanding balances. Interest is recognized on finance receivables using the effective interest method. Annual fees are recognized ratably over the annual period covered and client acquisition costs are expensed as incurred.
We provide an allowance for credit losses based on historical loss experience, the nature of our portfolios, adverse situations that may affect a client's ability to pay and current economic conditions and outlook based on reasonable and supportable forecasts. We continually evaluate the adequacy of the allowance for credit losses and adjust as necessary.
Fixed Assets
Property, plant and equipment and rental equipment are stated at cost and depreciated principally using the straight-line method over their estimated useful lives, which are 50 years for buildings, 10 to 20 years for building improvements, up to 3 years for internal use software development costs, 3 to 12 years for machinery and equipment and 4 to 6 years for rental equipment. Major improvements that add to the productive capacity or extend the life of an asset are capitalized while repairs and maintenance are charged to expense. Leasehold improvements are amortized over the shorter of their estimated useful life or the remaining lease term. Fully depreciated assets are retained in fixed assets and accumulated depreciation until they are removed from service.
Intangible Assets
Finite-lived intangible assets are amortized using the straight-line method over their estimated useful lives of up to 10 years.
Deferred Costs
Revenue Recognition
We derive revenue from multiple sources including sales, rentals, financing and services. Certain transactions are consummated at the same time and can therefore generate revenue from multiple sources. The most common form of these transactions involves a sale or noncancelable lease of equipment, meter services and an equipment maintenance agreement. We determine whether each product and service within the contract should be treated as a separate performance obligation (unit of accounting) for revenue recognition purposes. For contracts that include multiple performance obligations, the transaction price is allocated based on relative standalone selling prices (SSP), which are a range of selling prices that we would sell a product or service to a customer on a separate basis. SSP are established for each performance obligation at the inception of the contract and can be observable prices or estimated. The
44
PITNEY BOWES INC.
NOTES TO CONSOLIDATED FINANCIAL STATEMENTS
(Tabular amounts in thousands, except per share amounts)
allocation of the transaction price to the various performance obligations impacts the timing of revenue recognition, but does not change the total revenue recognized. More specifically, revenue related to our offerings is recognized as follows:
Business services
Business services includes fulfillment, delivery and return services, cross-border solutions, mail processing services and shipping subscription solutions, Revenue for fulfillment, delivery and return services, cross-border solutions and mail processing services is recognized over time using an output method based on the number of parcels or mail pieces either processed or delivered, depending on the service type, since that measure best depicts the value of goods and services transferred to the client over the contract period. Revenue for shipping subscription solutions is recognized ratably over the contract period as the client obtains equal benefit from these services through the period. We review third party relationships and record revenue on a gross basis when we act as a principal in a transaction and on a net basis when we act as an agent between a client and vendor. In determining whether we are acting as principal or agent, we consider several factors such as whether we are the primary obligor to the client or have control over pricing.
Support services
Support services revenue includes revenue from maintenance, professional and subscription services for our mailing equipment and professional services for our digital delivery services. Revenue is allocated to these services using selling prices charged in standalone replacement and renewal transactions. Revenue for maintenance and subscription services is recognized ratably over the contract period and revenue for professional services is recognized when services are provided.
Financing
We provide financing for our products primarily through sales-type leases and revolving lines of credit for the purchase of postage and supplies. Financing revenue also includes finance income, late fees and investment income, gains and losses at the Bank. We record financing income over the lease term using the effective interest method. Financing revenue also includes amounts related to sales-type leases that customers have extended or renewed for an additional term. Revenue for these contracts is recognized over the term of the modified lease using the effective interest method. We believe that our sales-type lease portfolio contains only normal collection risk.
Equipment residual values are determined at the inception of the lease using management's best estimate of fair value at the end of the lease term. Fair value estimates are determined based on historical renewal experience, used equipment markets, competition and technological changes. We evaluate residual values on an annual basis or sooner if circumstances warrant. Declines in estimated residual values considered "other-than-temporary" are recognized immediately. Increases in estimated future residual values are not recognized until the equipment is remarketed.
Equipment sales
We sell and lease equipment directly to customers and to distributors (re-sellers) throughout the world. The amount of revenue allocated to the equipment is based on a range of observable selling prices in standalone transactions. Revenue from the sale of equipment under sales-type leases is recognized as control of the equipment transfers to the customer, which is upon shipment for self-installed products and upon installation or customer acceptance for other products. Revenue from the direct sale of equipment is recognized as control of the equipment transfers to the customer, which is upon delivery for self-installed products and upon installation or customer acceptance for other products. We do not typically offer any rights of return.
Supplies
Supplies revenue includes revenue from supplies for our mailing equipment and is recognized upon delivery.
Rentals
Rentals revenue includes revenue from mailing equipment that does not meet the criteria to be accounted for as a sales-type lease. We may invoice in advance for rentals according to the terms of the agreement. Advanced billings are initially deferred and recognized on a straight-line basis over the billing period. Revenue generated from financing clients for the continued use of equipment subsequent to the expiration of the original lease is recognized as rentals revenue.
Shipping and Handling
Shipping and handling costs are recognized as costs of revenue as incurred.
Research and Development Costs
Research and development costs are charged to expense as incurred. Costs include research, development and engineering activities relating to the development of new products and solutions and enhancements of existing products and solutions. Costs primarily
45
PITNEY BOWES INC.
NOTES TO CONSOLIDATED FINANCIAL STATEMENTS
(Tabular amounts in thousands, except per share amounts)
Restructuring Charges
Costs associated with restructuring actions primarily include employee severance and related separation costs and contract termination costs, primarily real estate leases. Employee severance and related costs are recognized when a liability is incurred, which is generally upon communication to the affected employees, and the amount to be paid is both probable and reasonably estimable. Severance accruals are based on company policy, historical experience and negotiated settlements. Contract termination costs for real estate leases are recognized as incurred.
Stock-based Compensation
We primarily issue restricted stock units and non-qualified stock options under our stock award plans. Compensation expense for stock-based awards is measured based on the estimated fair value of the awards expected to vest and recognized ratably over the requisite service period. The fair value of restricted stock units is estimated based on the fair value of our common stock on the grant date, less the present value of expected dividends. The fair value of non-qualified stock options is determined using the Black-Scholes valuation model. We believe that these valuation techniques and the underlying assumptions are appropriate in estimating the fair value of stock awards. Forfeitures are estimated at the time of grant to recognize expense for those awards that are expected to vest and are based on our historical forfeiture rates. Stock-based compensation expense is recognized primarily in selling, general and administrative expense.
Impairment Review
Long-lived assets and finite-lived intangible assets are reviewed for impairment whenever events or changes in circumstances indicate that the carrying amount may not be fully recoverable. The estimated undiscounted future cash flows expected to result from the use and eventual disposition of the asset is compared to the asset's carrying value. The fair value of the asset is determined using probability weighted expected cash flow estimates, derived from our long-term business plans and historical experience, quoted market prices when available and appraisals, as appropriate.
Goodwill is tested annually for impairment at the reporting unit level during the fourth quarter or sooner if circumstances indicate an impairment may exist. The impairment test for goodwill determines the fair value of each reporting unit and compares it to the reporting unit's carrying value, including goodwill. If the fair value of a reporting unit exceeds the carrying value of the net assets assigned to that reporting unit, goodwill is not impaired and no further testing is required. If the carrying value of the net assets assigned to the reporting unit exceeds the fair value of the reporting unit, the goodwill impairment loss is calculated as the difference between these amounts, limited to the amount of goodwill allocated to the reporting unit.
During the fourth quarter of 2021, we performed our annual goodwill impairment test to assess the recoverability of the carrying value of goodwill and determined that the fair value of each reporting unit exceeded its carrying value and no impairment was recorded.
Derivative Instruments
In the normal course of business, we are exposed to the impact of changes in foreign currency exchange rates and interest rates. We limit these risks by following established risk management policies and procedures, including the use of derivatives. We use derivative instruments to limit the effects of currency exchange rate fluctuations on financial results and manage the related cost of debt. We do not use derivatives for trading or speculative purposes.
Derivative instruments are measured at fair value and reported as assets and liabilities on the consolidated balance sheets, as applicable. The accounting for changes in fair value depends on the intended use of the derivative, the resulting designation and the effectiveness of the instrument in offsetting the risk exposure it is designed to hedge. To qualify as a hedge, a derivative must be highly effective in offsetting the risk designated for hedging purposes. The hedge relationship must be formally documented at inception, detailing the particular risk management objective and strategy for the hedge. The effectiveness of the hedge relationship is evaluated on a retrospective and prospective basis.
46
PITNEY BOWES INC.
NOTES TO CONSOLIDATED FINANCIAL STATEMENTS
(Tabular amounts in thousands, except per share amounts)
Income Taxes
We recognize deferred tax assets and liabilities for the future tax consequences attributable to differences between the carrying amounts of assets and liabilities and their respective tax bases. Deferred tax assets and liabilities are measured using the enacted tax rates expected to apply to taxable income in the years in which those temporary differences are expected to be recovered or settled. The effect of a change in tax rates on deferred tax assets and liabilities is recognized in income in the period that includes the enactment date of such change. A valuation allowance is provided when it is more likely than not that a deferred tax asset will not be realized. In estimating the necessity and amount of a valuation allowance, we consider all available evidence for each jurisdiction, including historical operating results, estimates of future taxable income and the feasibility of ongoing tax planning strategies. We adjust the valuation allowance through income tax expense when new information becomes available that would alter our determination of the amount of deferred tax assets that will ultimately be realized.
Earnings per Share
Basic earnings per share is computed based on the weighted-average number of common shares outstanding during the year. Diluted earnings per share is computed based on the weighted-average number of common shares outstanding during the year plus the dilutive effect of common stock equivalents.
Loss Contingencies
In the ordinary course of business, we are routinely defendants in, or party to, a number of pending and threatened legal actions. On a quarterly basis, we review the status of each significant matter and assess the potential financial exposure. If the potential loss from any claim or legal action is considered probable and can be reasonably estimated, we establish a liability for the estimated loss. The assessment of the ultimate outcome of each claim or legal action and the determination of the potential financial exposure requires significant judgment. Estimates of potential liabilities for claims or legal actions are based only on information that is available at that time. As additional information becomes available, we may revise our estimates, and these revisions could have a material impact on our results of operations and financial position. Legal fees are expensed as incurred.
New Accounting Pronouncements
New Accounting Pronouncements - Standards Adopted in 2021
In January 2021, we adopted ASU 2019-12, Simplifying the Accounting for Income Taxes. The ASU simplifies the accounting for income taxes by removing certain exceptions to the general principles and also clarifies and amends existing guidance. The adoption of this standard did not have a material impact on our consolidated financial statements.
In December 2021, we adopted ASU 2021-08, Business Combinations (Topic 805): Accounting for Contract Assets and Contract Liabilities from Contracts with Customers. The ASU requires that an entity (the acquirer) recognize and measure contract assets and contract liabilities acquired in a business combination in accordance with ASC 606. The adoption of this standard did not have a material impact on our consolidated financial statements.
New Accounting Pronouncements - Standards Not Yet Adopted
In March 2020, the FASB issued ASU 2020-04, Reference Rate Reform (Topic 848): Facilitation of the Effects of Reference Rate Reform on Financial Reporting. The transition to new reference interest rates will require certain contracts to be modified and the ASU is intended to provide temporary optional expedients and exceptions to U.S. GAAP guidance on contract modifications and hedge accounting to ease the financial reporting burdens related to the expected market transition from the London Interbank Offered Rate (LIBOR) and other interbank offered rates to alternative reference rates. The accommodations provided by the ASU are effective through December 31, 2022 and may be applied at the beginning of any interim period within that time frame.
We have matched LIBOR-based debt with LIBOR based interest rate swaps and have elected to apply the practical expedient related to probability and the assessment of the effectiveness for future LIBOR-indexed cash flows, which assumes that the debt instrument will use the same index rate as its corresponding interest rate swap once a new reference rate is established to replace LIBOR. We may apply other expedients as additional reference rate changes occur. We continue to assess the impact of this standard on our consolidated financial statements.
47
PITNEY BOWES INC.
NOTES TO CONSOLIDATED FINANCIAL STATEMENTS
(Tabular amounts in thousands, except per share amounts)
2. Revenue
Disaggregated Revenue
The following tables disaggregate our revenue by source and timing of recognition:
| Year Ended December 31, 2021 | ||||||||||||||||||||
| Global Ecommerce | Presort Services | SendTech Solutions | Revenue from products and services | Revenue from leasing transactions and financing | Total consolidated revenue | |||||||||||||||
| Revenue from products and services | ||||||||||||||||||||
| Business services | $ | $ | $ | $ | $ | $ | ||||||||||||||
| Support services | ||||||||||||||||||||
| Financing | ||||||||||||||||||||
| Equipment sales | ||||||||||||||||||||
| Supplies | ||||||||||||||||||||
| Rentals | ||||||||||||||||||||
| Subtotal | $ | $ | ||||||||||||||||||
| Revenue from leasing transactions and financing | ||||||||||||||||||||
| Financing | ||||||||||||||||||||
| Equipment sales | ||||||||||||||||||||
| Rentals | ||||||||||||||||||||
| Total revenue | $ | $ | $ | $ | ||||||||||||||||
| Timing of revenue recognition from products and services | ||||||||||||||||||||
| Products/services transferred at a point in time | $ | $ | $ | $ | ||||||||||||||||
| Products/services transferred over time | ||||||||||||||||||||
| Total | $ | $ | $ | $ | ||||||||||||||||
| Year Ended December 31, 2020 | ||||||||||||||||||||
| Global Ecommerce | Presort Services | SendTech Solutions | Revenue from products and services | Revenue from leasing transactions and financing | Total consolidated revenue | |||||||||||||||
| Revenue from products and services | ||||||||||||||||||||
| Business services | $ | $ | $ | $ | $ | $ | ||||||||||||||
| Support services | ||||||||||||||||||||
| Financing | ||||||||||||||||||||
| Equipment sales | ||||||||||||||||||||
| Supplies | ||||||||||||||||||||
| Rentals | ||||||||||||||||||||
| Subtotal | $ | $ | ||||||||||||||||||
| Revenue from leasing transactions and financing | ||||||||||||||||||||
| Financing | ||||||||||||||||||||
| Equipment sales | ||||||||||||||||||||
| Rentals | ||||||||||||||||||||
| Total revenue | $ | $ | $ | $ | ||||||||||||||||
| Timing of revenue recognition from products and services | ||||||||||||||||||||
| Products/services transferred at a point in time | $ | $ | $ | $ | ||||||||||||||||
| Products/services transferred over time | ||||||||||||||||||||
| Total | $ | $ | $ | $ | ||||||||||||||||
48
PITNEY BOWES INC.
NOTES TO CONSOLIDATED FINANCIAL STATEMENTS
(Tabular amounts in thousands, except per share amounts)
| Year Ended December 31, 2019 | ||||||||||||||||||||
| Global Ecommerce | Presort Services | SendTech Solutions | Revenue from products and services | Revenue from leasing transactions and financing | Total consolidated revenue | |||||||||||||||
| Revenue from products and services | ||||||||||||||||||||
| Business services | $ | $ | $ | $ | $ | $ | ||||||||||||||
| Support services | ||||||||||||||||||||
| Financing | ||||||||||||||||||||
| Equipment sales | ||||||||||||||||||||
| Supplies | ||||||||||||||||||||
| Rentals | ||||||||||||||||||||
| Subtotal | $ | $ | ||||||||||||||||||
| Revenue from leasing transactions and financing | ||||||||||||||||||||
| Financing | ||||||||||||||||||||
| Equipment sales | ||||||||||||||||||||
| Rentals | ||||||||||||||||||||
| Total revenue | $ | $ | $ | $ | ||||||||||||||||
| Timing of revenue recognition from products and services | ||||||||||||||||||||
| Products/services transferred at a point in time | $ | $ | $ | $ | ||||||||||||||||
| Products/services transferred over time | ||||||||||||||||||||
| Total | $ | $ | $ | $ | ||||||||||||||||
Our performance obligations for revenue from products and services are as follows:
Business services includes fulfillment, delivery and return services, cross-border solutions, mail processing services and shipping subscription solutions. Revenue for fulfillment, delivery and return services, cross-border solutions and mail processing services is recognized over time using an output method based on the number of parcels or mail pieces either processed or delivered, depending on the service type, since that measure best depicts the value of goods and services transferred to the client over the contract period. Contract terms for these services range from to five years followed by annual renewal periods. Revenue for shipping subscription solutions is recognized ratably over the contract period as the client obtains equal benefit from these services through the period.
Support services includes providing maintenance, professional and subscription services for our equipment and digital mailing and shipping technology solutions. Contract terms range from to five years , depending on the term of the lease contract for the related equipment. Revenue for maintenance and subscription services is recognized ratably over the contract period and revenue for professional services is recognized when services are provided.
Equipment sales generally includes the sale of mailing and shipping equipment, excluding sales-type leases. We recognize revenue upon delivery for self-install equipment and upon acceptance or installation for other equipment. We provide a warranty that the equipment is free of defects and meets stated specifications. The warranty is not considered a separate performance obligation.
Supplies revenue includes revenue from supplies for our mailing equipment and is recognized upon delivery.
Revenue from leasing transactions and financing includes revenue from sales-type and operating leases, finance income, late fees and investment income, gains and losses at the Bank.
Advance Billings from Contracts with Customers
| Balance Sheet Location | December 31, 2021 | December 31, 2020 | Increase/ (decrease) | ||||||||||||||||||||
| Advance billings, current | Advance billings | $ | $ | $ | ( | ||||||||||||||||||
| Advance billings, noncurrent | Other noncurrent liabilities | $ | $ | $ | ( | ||||||||||||||||||
49
PITNEY BOWES INC.
NOTES TO CONSOLIDATED FINANCIAL STATEMENTS
(Tabular amounts in thousands, except per share amounts)
Advance billings are recorded when cash payments are due in advance of our performance. Revenue is recognized ratably over the contract term. Items in advance billings primarily relate to support services on mailing equipment. Revenue recognized during the twelve months ended December 31, 2021 includes $106 million of advance billings at the beginning of the period. Advance billings, current at December 31, 2021 and 2020 also includes $6 million and $8 million, respectively, from leasing transactions.
Future Performance Obligations
Future performance obligations include revenue streams bundled with our leasing contracts, primarily maintenance and subscription services. The transaction prices allocated to future performance obligations will be recognized as follows:
| 2022 | 2023 | 2024-2026 | Total | ||||||||||||||||||||
| SendTech Solutions | $ | $ | $ | $ | |||||||||||||||||||
The table above does not include revenue for performance obligations under contracts with terms less than 12 months or revenue for performance obligations where revenue is recognized based on the amount billable to the customer.
3. Segment Information
Our reportable segments are Global Ecommerce, Presort Services and SendTech Solutions. The principal products and services of each reportable segment are as follows:
Global Ecommerce: Includes the revenue and related expenses from domestic parcel services, cross-border solutions and digital delivery services.
Presort Services: Includes the revenue and related expenses from sortation services to qualify large volumes of First Class Mail, Marketing Mail, Marketing Mail Flats and Bound Printed Matter for postal worksharing discounts.
SendTech Solutions: Includes the revenue and related expenses from physical and digital mailing and shipping technology solutions,
financing, services, supplies and other applications to help simplify and save on the sending, tracking and receiving of letters, parcels
and flats.
Management measures segment profitability and performance using segment earnings before interest and taxes (EBIT). Segment EBIT is calculated by deducting from segment revenue the related costs and expenses attributable to the segment. Segment EBIT excludes interest, taxes, general corporate expenses, restructuring charges, asset and goodwill impairment charges and other items not allocated to a particular business segment. Costs related to shared assets are allocated to the relevant segments. Management believes that it provides investors a useful measure of operating performance and underlying trends of the business. Segment EBIT may not be indicative of our overall consolidated performance and therefore, should be read in conjunction with our consolidated results of operations. The following tables provide information about our reportable segments and reconciliation of segment EBIT to net (loss) income. As a result of change from LIFO to FIFO inventory valuation discussed in Note 1, SendTech Solutions EBIT for 2020 and 2019 has also been recast.
| Revenue | |||||||||||||||||
| Years Ended December 31, | |||||||||||||||||
| 2021 | 2020 | 2019 | |||||||||||||||
| Global Ecommerce | $ | $ | $ | ||||||||||||||
| Presort Services | |||||||||||||||||
| SendTech Solutions | |||||||||||||||||
| Total revenue | $ | $ | $ | ||||||||||||||
| Geographic data: | |||||||||||||||||
| United States | $ | $ | $ | ||||||||||||||
| Outside United States | |||||||||||||||||
| Total revenue | $ | $ | $ | ||||||||||||||
50
PITNEY BOWES INC.
NOTES TO CONSOLIDATED FINANCIAL STATEMENTS
(Tabular amounts in thousands, except per share amounts)
| EBIT | |||||||||||||||||
| Years Ended December 31, | |||||||||||||||||
| 2021 | 2020 | 2019 | |||||||||||||||
| Global Ecommerce | $ | ( | $ | ( | $ | ( | |||||||||||
| Presort Services | |||||||||||||||||
| SendTech Solutions | |||||||||||||||||
| Total segment EBIT | |||||||||||||||||
| Reconciling items: | |||||||||||||||||
| Interest, net | ( | ( | ( | ||||||||||||||
| Unallocated corporate expenses | ( | ( | ( | ||||||||||||||
| Restructuring charges and asset impairments | ( | ( | ( | ||||||||||||||
| Goodwill impairment | ( | ||||||||||||||||
| Loss on debt refinancing | ( | ( | ( | ||||||||||||||
| Gain (loss) on sale of assets/businesses | ( | ||||||||||||||||
| Transaction costs | ( | ( | ( | ||||||||||||||
| Benefit (provision) for income taxes | ( | ||||||||||||||||
| Income (loss) from continuing operations | ( | ||||||||||||||||
| (Loss) income from discontinued operations, net of tax | ( | ||||||||||||||||
| Net (loss) income | $ | ( | $ | ( | $ | ||||||||||||
| Depreciation and amortization | |||||||||||||||||
| Years Ended December 31, | |||||||||||||||||
| 2021 | 2020 | 2019 | |||||||||||||||
| Global Ecommerce | $ | $ | $ | ||||||||||||||
| Presort Services | |||||||||||||||||
| SendTech Solutions | |||||||||||||||||
| Total for reportable segments | |||||||||||||||||
| Corporate | |||||||||||||||||
| Total depreciation and amortization | $ | $ | $ | ||||||||||||||
| Capital expenditures | |||||||||||||||||
| Years Ended December 31, | |||||||||||||||||
| 2021 | 2020 | 2019 | |||||||||||||||
| Global Ecommerce | $ | $ | $ | ||||||||||||||
| Presort Services | |||||||||||||||||
| SendTech Solutions | |||||||||||||||||
| Total for reportable segments | |||||||||||||||||
| Corporate | |||||||||||||||||
| Total capital expenditures | $ | $ | $ | ||||||||||||||
51
PITNEY BOWES INC.
NOTES TO CONSOLIDATED FINANCIAL STATEMENTS
(Tabular amounts in thousands, except per share amounts)
| Assets | |||||||||||||||||
| December 31, | |||||||||||||||||
| 2021 | 2020 | 2019 | |||||||||||||||
| Global Ecommerce | $ | $ | $ | ||||||||||||||
| Presort Services | |||||||||||||||||
| SendTech Solutions | |||||||||||||||||
| Total for reportable segments | |||||||||||||||||
| Cash and cash equivalents | |||||||||||||||||
| Short-term investments | |||||||||||||||||
| Assets of discontinued operations | |||||||||||||||||
| Long-term investments | |||||||||||||||||
| Other corporate assets | |||||||||||||||||
| Consolidated assets | $ | $ | $ | ||||||||||||||
| Identifiable long-lived assets: | |||||||||||||||||
| United States | $ | $ | $ | ||||||||||||||
| Outside United States | |||||||||||||||||
| Total | $ | $ | $ | ||||||||||||||
4. Discontinued Operations
Discontinued operations includes net working capital and other adjustments relating to the sale of Software Solutions business in 2019 (except for the software business in Australia, which closed in January 2020), and the Production Mail business in 2018. Discontinued operations for the year ended December 31, 2021 also includes a tax charge related to the sale of the Production Mail business. Discontinued operations for the year ended December 31, 2019 also includes the operating results of the Software Solutions business.
Selected financial information of discontinued operations is as follows:
| Year Ended December 31, 2021 | |||||||||||||||||
| Software Solutions | Production Mail | Total | |||||||||||||||
| Loss on sale | $ | ( | $ | $ | ( | ||||||||||||
| Tax provision | |||||||||||||||||
| Loss from discontinued operations, net of tax | $ | ( | |||||||||||||||
| Year Ended December 31, 2020 | |||||||||||||||||
| Software Solutions | Production Mail | Total | |||||||||||||||
| Gain (loss) on sale | $ | $ | ( | $ | |||||||||||||
| Tax benefit | ( | ||||||||||||||||
| Income from discontinued operations, net of tax | $ | ||||||||||||||||
52
PITNEY BOWES INC.
NOTES TO CONSOLIDATED FINANCIAL STATEMENTS
(Tabular amounts in thousands, except per share amounts)
| Year Ended December 31, 2019 | |||||||||||||||||
| Software Solutions | Production Mail | Total | |||||||||||||||
| Revenue | $ | $ | $ | ||||||||||||||
| Earnings (loss) from discontinued operations | $ | $ | ( | $ | |||||||||||||
| Gain (loss) on sale | ( | ||||||||||||||||
| Income (loss) from discontinued operations before taxes | $ | $ | ( | ||||||||||||||
| Tax provision | |||||||||||||||||
| Income from discontinued operations, net of tax | $ | ||||||||||||||||
5. Earnings per Share (EPS)
The calculations of basic and diluted earnings per share are presented below. The sum of earnings per share amounts may not equal the totals due to rounding.
| Years Ended December 31, | |||||||||||||||||
| 2021 | 2020 | 2019 | |||||||||||||||
| Numerator: | |||||||||||||||||
| Income (loss) from continuing operations | $ | $ | ( | $ | |||||||||||||
| (Loss) income from discontinued operations, net of tax | ( | ||||||||||||||||
| Net (loss) income (numerator for diluted EPS) | ( | ( | |||||||||||||||
| Less: Preference stock dividend | |||||||||||||||||
| (Loss) income attributable to common stockholders (numerator for basic EPS) | $ | ( | $ | ( | $ | ||||||||||||
| Denominator: | |||||||||||||||||
| Weighted-average shares used in basic EPS | |||||||||||||||||
Dilutive effect of common stock equivalents (1) | |||||||||||||||||
| Weighted-average shares used in diluted EPS | |||||||||||||||||
| Basic (loss) earnings per share: | |||||||||||||||||
| Continuing operations | $ | $ | ( | $ | |||||||||||||
| Discontinued operations | ( | ||||||||||||||||
| Net (loss) income | $ | ( | $ | ( | $ | ||||||||||||
| Diluted (loss) earnings per share: | |||||||||||||||||
| Continuing operations | $ | $ | ( | $ | |||||||||||||
| Discontinued operations | ( | ||||||||||||||||
| Net (loss) income | $ | ( | $ | ( | $ | ||||||||||||
| Common stock equivalents excluded from calculation of diluted earnings per share because their impact would be anti-dilutive: | |||||||||||||||||
(1) Due to the loss from continuing operations for the year ended December 31, 2020, common stock equivalents of 2,483 were excluded from the calculation of diluted earnings per share as the impact would have been anti-dilutive.
53
PITNEY BOWES INC.
NOTES TO CONSOLIDATED FINANCIAL STATEMENTS
(Tabular amounts in thousands, except per share amounts)
6. Inventories
Inventories consisted of the following:
| December 31, | |||||||||||
| 2021 | 2020 | ||||||||||
| Raw materials | $ | $ | |||||||||
| Supplies and service parts | |||||||||||
| Finished products | |||||||||||
| Total inventory, net | $ | $ | |||||||||
7. Finance Assets and Lessor Operating Leases
Finance Assets
All finance receivables are in our SendTech segment. We segregate our finance receivables into a North America portfolio and International portfolio. Finance receivables consisted of the following:
| December 31, 2021 | December 31, 2020 | ||||||||||||||||||||||||||||||||||
| North America | International | Total | North America | International | Total | ||||||||||||||||||||||||||||||
| Sales-type lease receivables | |||||||||||||||||||||||||||||||||||
| Gross finance receivables | $ | $ | $ | $ | $ | $ | |||||||||||||||||||||||||||||
| Unguaranteed residual values | |||||||||||||||||||||||||||||||||||
| Unearned income | ( | ( | ( | ( | ( | ( | |||||||||||||||||||||||||||||
| Allowance for credit losses | ( | ( | ( | ( | ( | ( | |||||||||||||||||||||||||||||
| Net investment in sales-type lease receivables | |||||||||||||||||||||||||||||||||||
| Loan receivables | |||||||||||||||||||||||||||||||||||
| Loan receivables | |||||||||||||||||||||||||||||||||||
| Allowance for credit losses | ( | ( | ( | ( | ( | ( | |||||||||||||||||||||||||||||
| Net investment in loan receivables | |||||||||||||||||||||||||||||||||||
| Net investment in finance receivables | $ | $ | $ | $ | $ | $ | |||||||||||||||||||||||||||||
Maturities of finance receivables at December 31, 2021 were as follows:
| Sales-type Lease Receivables | Loan Receivables | ||||||||||||||||||||||||||||||||||
| North America | International | Total | North America | International | Total | ||||||||||||||||||||||||||||||
| 2022 | $ | $ | $ | $ | $ | $ | |||||||||||||||||||||||||||||
| 2023 | |||||||||||||||||||||||||||||||||||
| 2024 | |||||||||||||||||||||||||||||||||||
| 2025 | |||||||||||||||||||||||||||||||||||
| 2026 | |||||||||||||||||||||||||||||||||||
| Thereafter | |||||||||||||||||||||||||||||||||||
| Total | $ | $ | $ | $ | $ | $ | |||||||||||||||||||||||||||||
54
PITNEY BOWES INC.
NOTES TO CONSOLIDATED FINANCIAL STATEMENTS
(Tabular amounts in thousands, except per share amounts)
Allowance for Credit Losses
Activity in the allowance for credit losses on finance receivables was as follows:
| Sales-type Lease Receivables | Loan Receivables | ||||||||||||||||||||||||||||
| North America | International | North America | International | Total | |||||||||||||||||||||||||
| Balance at December 31, 2018 | $ | $ | $ | $ | $ | ||||||||||||||||||||||||
| Amounts charged to expense | |||||||||||||||||||||||||||||
| Write-offs | ( | ( | ( | ( | ( | ||||||||||||||||||||||||
| Recoveries | |||||||||||||||||||||||||||||
| Other | ( | ( | |||||||||||||||||||||||||||
| Balance at December 31, 2019 | |||||||||||||||||||||||||||||
| Cumulative effect of accounting change | ( | ( | |||||||||||||||||||||||||||
| Amounts charged to expense | |||||||||||||||||||||||||||||
| Write-offs | ( | ( | ( | ( | ( | ||||||||||||||||||||||||
| Recoveries | |||||||||||||||||||||||||||||
| Other | ( | ( | |||||||||||||||||||||||||||
| Balance at December 31, 2020 | |||||||||||||||||||||||||||||
| Amounts charged to expense | ( | ( | ( | ||||||||||||||||||||||||||
| Write-offs | ( | ( | ( | ( | ( | ||||||||||||||||||||||||
| Recoveries | |||||||||||||||||||||||||||||
| Other | ( | ( | ( | ||||||||||||||||||||||||||
| Balance at December 31, 2021 | $ | $ | $ | $ | $ | ||||||||||||||||||||||||
Aging of Receivables
The aging of gross finance receivables was as follows:
| December 31, 2021 | |||||||||||||||||||||||||||||
| Sales-type Lease Receivables | Loan Receivables | ||||||||||||||||||||||||||||
| North America | International | North America | International | Total | |||||||||||||||||||||||||
| Amounts 0 - 90 days | $ | $ | $ | $ | $ | ||||||||||||||||||||||||
| Amounts > 90 days | |||||||||||||||||||||||||||||
| Total | $ | $ | $ | $ | $ | ||||||||||||||||||||||||
| Amounts > 90 days | |||||||||||||||||||||||||||||
| Still accruing interest | $ | $ | $ | $ | $ | ||||||||||||||||||||||||
| Not accruing interest | |||||||||||||||||||||||||||||
| Total | $ | $ | $ | $ | $ | ||||||||||||||||||||||||
| December 31, 2020 | |||||||||||||||||||||||||||||
| Sales-type Lease Receivables | Loan Receivables | ||||||||||||||||||||||||||||
| North America | International | North America | International | Total | |||||||||||||||||||||||||
| Amounts 0 - 90 days | $ | $ | $ | $ | $ | ||||||||||||||||||||||||
| Amounts > 90 days | |||||||||||||||||||||||||||||
| Total | $ | $ | $ | $ | $ | ||||||||||||||||||||||||
| Amounts > 90 days | |||||||||||||||||||||||||||||
| Still accruing interest | $ | $ | $ | $ | $ | ||||||||||||||||||||||||
| Not accruing interest | |||||||||||||||||||||||||||||
| Total | $ | $ | $ | $ | $ | ||||||||||||||||||||||||
55
PITNEY BOWES INC.
NOTES TO CONSOLIDATED FINANCIAL STATEMENTS
(Tabular amounts in thousands, except per share amounts)
Credit Quality
The extension of credit and management of credit lines to new and existing clients uses a combination of a client's credit score, where available, a detailed manual review of their financial condition and payment history or an automated process. Once credit is granted, the payment performance of the client is managed through automated collections processes and is supplemented with direct follow up should an account become delinquent. We have robust automated collections and extensive portfolio management processes to ensure that our global strategy is executed, collection resources are allocated and enhanced tools and processes are implemented as needed.
Over 85 % of our finance receivables are within our North American portfolio. We use a third party to score the majority of this portfolio on a quarterly basis using a proprietary commercial credit score. The relative scores are determined based on a number of factors, including financial information, payment history, company type and ownership structure. We stratify the third party's credit scores of our clients into low, medium and high-risk accounts. Due to timing and other issues, our entire portfolio may not be scored at period end. We report these amounts as "Not Scored"; however, absence of a score is not indicative of the credit quality of the account. The third-party credit score is used to predict the payment behaviors of our clients and the probability that an account will become greater than 90 days past due during the subsequent 12-month period.
•Low risk accounts are companies with very good credit scores and a predicted delinquency rate of less than 5 %.
•Medium risk accounts are companies with average to good credit scores and a predicted delinquency rate between 5 % and 10 %.
•High risk accounts are companies with poor credit scores, are delinquent or are at risk of becoming delinquent. The predicted delinquency rate would be greater than 10 %.
We do not use a third party to score our International portfolio because the cost to do so is prohibitive as there is no single credit score model that covers all countries. Accordingly, the entire International portfolio is reported in the Not Scored category. This portfolio comprises approximately 15 % of our total finance receivables. Most of our International credit applications are small dollar applications (i.e. below $50 thousand) and are subjected to an automated review process. Larger credit applications are manually reviewed, which includes obtaining client financial information, credit reports and other available information.
The table below shows the gross sales-type lease receivable and loan receivable balances by relative risk class and year of origination based on the relative scores of the accounts within each class as of December 31, 2021 and 2020.
| Sales Type Lease Receivables | Loan Receivables | Total | |||||||||||||||||||||||||||||||||||||||||||||
| 2021 | 2020 | 2019 | 2018 | 2017 | Prior | ||||||||||||||||||||||||||||||||||||||||||
| Low | $ | $ | $ | $ | $ | $ | $ | $ | |||||||||||||||||||||||||||||||||||||||
| Medium | |||||||||||||||||||||||||||||||||||||||||||||||
| High | |||||||||||||||||||||||||||||||||||||||||||||||
| Not Scored | |||||||||||||||||||||||||||||||||||||||||||||||
| Total | $ | $ | $ | $ | $ | $ | $ | $ | |||||||||||||||||||||||||||||||||||||||
| Sales Type Lease Receivables | Loan Receivables | Total | |||||||||||||||||||||||||||||||||||||||||||||
| 2020 | 2019 | 2018 | 2017 | 2016 | Prior | ||||||||||||||||||||||||||||||||||||||||||
| Low | $ | $ | $ | $ | $ | $ | $ | $ | |||||||||||||||||||||||||||||||||||||||
| Medium | |||||||||||||||||||||||||||||||||||||||||||||||
| High | |||||||||||||||||||||||||||||||||||||||||||||||
| Not Scored | |||||||||||||||||||||||||||||||||||||||||||||||
| Total | $ | $ | $ | $ | $ | $ | $ | $ | |||||||||||||||||||||||||||||||||||||||
56
PITNEY BOWES INC.
NOTES TO CONSOLIDATED FINANCIAL STATEMENTS
(Tabular amounts in thousands, except per share amounts)
Lease Income
Lease income from sales-type leases, excluding variable lease payments, was as follows:
| Years Ended December 31, | |||||||||||||||||
| 2021 | 2020 | 2019 | |||||||||||||||
| Profit recognized at commencement | $ | $ | $ | ||||||||||||||
| Interest income | |||||||||||||||||
| Total lease income from sales-type leases | $ | $ | $ | ||||||||||||||
Lessor Operating Leases
We also lease mailing equipment under operating leases with terms of to five years . Maturities of these operating leases are as follows:
| 2022 | $ | ||||
| 2023 | |||||
| 2024 | |||||
| 2025 | |||||
| 2026 | |||||
| Thereafter | |||||
| Total | $ | ||||
8. Fixed Assets
Fixed assets consisted of the following:
| December 31, | |||||||||||
| 2021 | 2020 | ||||||||||
| Land | $ | $ | |||||||||
| Machinery and equipment | |||||||||||
| Capitalized software | |||||||||||
| Buildings and improvements | |||||||||||
| Accumulated depreciation | ( | ( | |||||||||
| Property, plant and equipment, net | $ | $ | |||||||||
| Rental property and equipment | $ | $ | |||||||||
| Accumulated depreciation | ( | ( | |||||||||
| Rental property and equipment, net | $ | $ | |||||||||
Depreciation expense was $132 million, $127 million and $123 million for the years ended December 31, 2021, 2020 and 2019, respectively.
In November 2021, we entered into an agreement to sell our Shelton, Connecticut facility and simultaneously entered into a ten year lease agreement. This transaction did not close as of December 31, 2021, and accordingly, the net book value for the building and land of $36 million was classified as assets held-for-sale in other current assets and prepayments in the December 31, 2021 Consolidated Balance Sheet. See also Note 21 Subsequent Events.
57
PITNEY BOWES INC.
NOTES TO CONSOLIDATED FINANCIAL STATEMENTS
(Tabular amounts in thousands, except per share amounts)
9. Intangible Assets and Goodwill
Intangible Assets
Intangible assets consisted of the following:
| December 31, 2021 | December 31, 2020 | ||||||||||||||||||||||||||||||||||
| Gross Carrying Amount | Accumulated Amortization | Net Carrying Amount | Gross Carrying Amount | Accumulated Amortization | Net Carrying Amount | ||||||||||||||||||||||||||||||
| Customer relationships | $ | $ | ( | $ | $ | $ | ( | $ | |||||||||||||||||||||||||||
| Software & technology | ( | ( | |||||||||||||||||||||||||||||||||
| Total intangible assets, net | $ | $ | ( | $ | $ | $ | ( | $ | |||||||||||||||||||||||||||
Amortization expense was $30 million, $33 million and $36 million for the years ended December 31, 2021, 2020 and 2019, respectively.
Future amortization expense for intangible assets at December 31, 2021 is as follows:
| 2022 | $ | ||||
| 2023 | |||||
| 2024 | |||||
| 2025 | |||||
| 2026 | |||||
| Thereafter | |||||
| Total | $ | ||||
Actual amortization expense may differ from the amounts above due to, among other things, fluctuations in foreign currency exchange rates, acquisitions, divestitures and impairment charges.
Goodwill
Changes in the carrying amount of goodwill by reporting segment are shown in the tables below.
| Goodwill before accumulated impairment | Accumulated impairment | December 31, 2020 | Acquisitions/dispositions | FX Impact | December 31, 2021 | ||||||||||||||||||||||||||||||
| Global Ecommerce | $ | $ | ( | $ | $ | ( | $ | $ | |||||||||||||||||||||||||||
| Presort Services | |||||||||||||||||||||||||||||||||||
| SendTech Solutions | ( | ||||||||||||||||||||||||||||||||||
| Total goodwill | $ | $ | ( | $ | $ | ( | $ | ( | $ | ||||||||||||||||||||||||||
| December 31, 2019 | Acquisitions | Impairment | FX Impact | December 31, 2020 | |||||||||||||||||||||||||
| Global Ecommerce | $ | $ | $ | ( | $ | $ | |||||||||||||||||||||||
| Presort Services | |||||||||||||||||||||||||||||
| SendTech Solutions | |||||||||||||||||||||||||||||
| Total goodwill | $ | $ | $ | ( | $ | $ | |||||||||||||||||||||||
58
PITNEY BOWES INC.
NOTES TO CONSOLIDATED FINANCIAL STATEMENTS
(Tabular amounts in thousands, except per share amounts)
10. Fair Value Measurements and Derivative Instruments
We measure certain financial assets and liabilities at fair value on a recurring basis. Fair value is a market-based measure considered from the perspective of a market participant rather than an entity-specific measure. An entity is required to classify certain assets and liabilities measured at fair value based on the following fair value hierarchy that prioritizes the inputs used to measure fair value:
Level 1 – Unadjusted quoted prices in active markets for identical assets and liabilities.
Level 2 – Quoted prices for identical assets and liabilities in markets that are not active, quoted prices for similar assets and liabilities in active markets or other inputs that are observable or can be corroborated by observable market data for substantially the full term of the assets or liabilities.
Level 3 – Unobservable inputs that are supported by little or no market activity, may be derived from internally developed methodologies based on management's best estimate of fair value and that are significant to the fair value of the asset or liability.
Financial assets and liabilities are classified in their entirety based on the lowest level of input that is significant to the fair value measurement. Our assessment of the significance of a particular input to the fair value measurement requires judgment and may affect its placement within the fair value hierarchy. The following tables show, by level within the fair value hierarchy, our financial assets and liabilities that are accounted for at fair value on a recurring basis.
| December 31, 2021 | |||||||||||||||||||||||
| Level 1 | Level 2 | Level 3 | Total | ||||||||||||||||||||
| Assets: | |||||||||||||||||||||||
| Investment securities | |||||||||||||||||||||||
| Money market funds | $ | $ | $ | $ | |||||||||||||||||||
| Equity securities | |||||||||||||||||||||||
| Commingled fixed income securities | |||||||||||||||||||||||
Government and related securities | |||||||||||||||||||||||
| Corporate debt securities | |||||||||||||||||||||||
| Mortgage-backed / asset-backed securities | |||||||||||||||||||||||
| Derivatives | |||||||||||||||||||||||
| Interest rate swap | |||||||||||||||||||||||
| Foreign exchange contracts | |||||||||||||||||||||||
| Total assets | $ | $ | $ | $ | |||||||||||||||||||
| Liabilities: | |||||||||||||||||||||||
| Derivatives | |||||||||||||||||||||||
| Foreign exchange contracts | $ | $ | ( | $ | $ | ( | |||||||||||||||||
| Total liabilities | $ | $ | ( | $ | $ | ( | |||||||||||||||||
59
PITNEY BOWES INC.
NOTES TO CONSOLIDATED FINANCIAL STATEMENTS
(Tabular amounts in thousands, except per share amounts)
| December 31, 2020 | |||||||||||||||||||||||
| Level 1 | Level 2 | Level 3 | Total | ||||||||||||||||||||
| Assets: | |||||||||||||||||||||||
| Investment securities | |||||||||||||||||||||||
| Money market funds | $ | $ | $ | $ | |||||||||||||||||||
| Equity securities | |||||||||||||||||||||||
| Commingled fixed income securities | |||||||||||||||||||||||
Government and related securities | |||||||||||||||||||||||
| Corporate debt securities | |||||||||||||||||||||||
| Mortgage-backed / asset-backed securities | |||||||||||||||||||||||
| Derivatives | |||||||||||||||||||||||
| Foreign exchange contracts | |||||||||||||||||||||||
| Total assets | $ | $ | $ | $ | |||||||||||||||||||
| Liabilities: | |||||||||||||||||||||||
| Derivatives | |||||||||||||||||||||||
| Interest rate swaps | $ | $ | ( | $ | $ | ( | |||||||||||||||||
| Foreign exchange contracts | ( | ( | |||||||||||||||||||||
| Total liabilities | $ | $ | ( | $ | $ | ( | |||||||||||||||||
Investment Securities
The valuation of investment securities is based on a market approach using inputs that are observable, or can be corroborated by observable data, in an active marketplace. The following information relates to our classification within the fair value hierarchy:
•Money Market Funds: Money market funds typically invest in government securities, certificates of deposit, commercial paper and other highly liquid, low risk securities. Money market funds are principally used for overnight deposits and are classified as Level 1 when unadjusted quoted prices in active markets are available and as Level 2 when they are not actively traded on an exchange.
•Equity Securities: Equity securities are comprised of mutual funds investing in U.S. and foreign stocks. These mutual funds are classified as Level 2.
•Commingled Fixed Income Securities: Commingled fixed income securities are comprised of mutual funds that invest in a variety of fixed income securities, including securities of the U.S. government and its agencies, corporate debt, mortgage-backed securities and asset-backed securities. Fair value is based on the value of the underlying investments owned by each fund, minus its liabilities, divided by the number of shares outstanding, as reported by the fund manager. These mutual funds are classified as Level 1 when unadjusted quoted prices in active markets are available and as Level 2 when they are not actively traded on an exchange.
•Government and Related Securities: Debt securities are classified as Level 1 where active, high volume trades for identical securities exist. Valuation adjustments are not applied to these securities. Debt securities are classified as Level 2 where fair value is determined using quoted market prices for similar securities or benchmarking model derived prices to quoted market prices and trade data for identical or comparable securities.
•Corporate Debt Securities: Corporate debt securities are valued using recently executed comparable transactions, market price quotations or bond spreads for the same maturity as the security. These securities are classified as Level 2.
•Mortgage-Backed Securities / Asset-Backed Securities: These securities are valued based on external pricing indices or on external price/spread data. These securities are classified as Level 2.
Derivative Securities
•Foreign Exchange Contracts: The valuation of foreign exchange derivatives is based on a market approach using observable market inputs, such as foreign currency spot and forward rates and yield curves. These securities are classified as Level 2.
•Interest Rate Swaps: The valuation of interest rate swaps is based on an income approach using inputs that are observable or that can be derived from, or corroborated by, observable market data. These securities are classified as Level 2.
60
PITNEY BOWES INC.
NOTES TO CONSOLIDATED FINANCIAL STATEMENTS
(Tabular amounts in thousands, except per share amounts)
Available-For-Sale Securities
Available-for-sale securities consisted of the following:
| December 31, 2021 | |||||||||||||||||||||||
| Amortized cost | Gross unrealized gains | Gross unrealized losses | Estimated fair value | ||||||||||||||||||||
| Government and related securities | $ | $ | $ | ( | $ | ||||||||||||||||||
| Corporate debt securities | ( | ||||||||||||||||||||||
| Commingled fixed income securities | ( | ||||||||||||||||||||||
| Mortgage-backed / asset-backed securities | ( | ||||||||||||||||||||||
| Total | $ | $ | $ | ( | $ | ||||||||||||||||||
| December 31, 2020 | |||||||||||||||||||||||
| Amortized cost | Gross unrealized gains | Gross unrealized losses | Estimated fair value | ||||||||||||||||||||
| Government and related securities | $ | $ | $ | ( | $ | ||||||||||||||||||
| Corporate debt securities | ( | ||||||||||||||||||||||
| Commingled fixed income securities | |||||||||||||||||||||||
| Mortgage-backed / asset-backed securities | ( | ||||||||||||||||||||||
| Total | $ | $ | $ | ( | $ | ||||||||||||||||||
Investment securities in a loss position were as follows:
| December 31, 2021 | December 31, 2020 | ||||||||||||||||||||||
| Fair Value | Gross unrealized losses | Fair Value | Gross unrealized losses | ||||||||||||||||||||
| Greater than 12 continuous months | |||||||||||||||||||||||
| Government and related securities | $ | $ | $ | $ | |||||||||||||||||||
| Corporate debt securities | |||||||||||||||||||||||
| Mortgage-backed / asset-backed securities | |||||||||||||||||||||||
| Total | $ | $ | $ | $ | |||||||||||||||||||
| Less than 12 continuous months | |||||||||||||||||||||||
| Government and related securities | $ | $ | $ | $ | |||||||||||||||||||
| Corporate debt securities | |||||||||||||||||||||||
| Commingled fixed income securities | |||||||||||||||||||||||
| Mortgage-backed / asset-backed securities | |||||||||||||||||||||||
| Total | $ | $ | $ | $ | |||||||||||||||||||
At December 31, 2021, approximately 37 % of total securities in the investment portfolio were in a net loss position. Our allowance for credit losses on available-for-sale investment securities is not significant, but we believe it is adequate as our investments are primarily in highly liquid U.S. government and agency securities, high grade corporate bonds and municipal bonds. We have not recognized an impairment on investment securities in an unrealized loss position because we have the ability and intent to hold these securities until recovery of the unrealized losses or expect to receive the stated principal and interest at maturity.
61
PITNEY BOWES INC.
NOTES TO CONSOLIDATED FINANCIAL STATEMENTS
(Tabular amounts in thousands, except per share amounts)
At December 31, 2021, scheduled maturities of available-for-sale securities were as follows:
| Amortized cost | Estimated fair value | ||||||||||
| Within 1 year | $ | $ | |||||||||
| After 1 year through 5 years | |||||||||||
| After 5 years through 10 years | |||||||||||
| After 10 years | |||||||||||
| Total | $ | $ | |||||||||
The actual maturities may not coincide with scheduled maturities as certain securities contain early redemption features and/or allow for the prepayment of obligations with or without penalty.
Held-to-Maturity Securities
Held-to-maturity securities at December 31, 2021 and 2020 totaled $20 million and $75 million, respectively.
Derivative Instruments
Foreign Exchange Contracts
We enter into foreign exchange contracts to mitigate the currency risk associated with anticipated inventory purchases between affiliates and from third parties. These contracts are designated as cash flow hedges. The effective portion of the gain or loss on cash flow hedges is included in AOCL in the period that the change in fair value occurs and is reclassified to earnings in the period that the hedged item is recorded in earnings. At December 31, 2021 and 2020, outstanding contracts associated with these anticipated transactions had a notional amount of $1 million and $8 million, respectively.
Interest Rate Swaps
We enter into interest rate swaps to manage the cost of debt. At December 31, 2021, we had outstanding interest rate swap agreements with a notional value of $200 million that are designated as cash flow hedges. The fair value of the interest rate swaps is recorded as a derivative asset or liability at the end of each reporting period with the change in fair value reflected in AOCL. At December 31, 2020, we had interest rate swap agreements with a notional value of $500 million that was terminated during 2021.
The fair value of our derivative instruments was as follows:
| December 31, | ||||||||||||||||||||
| Designation of Derivatives | Balance Sheet Location | 2021 | 2020 | |||||||||||||||||
| Derivatives designated as hedging instruments | ||||||||||||||||||||
| Foreign exchange contracts | Other current assets and prepayments | $ | $ | |||||||||||||||||
| Accounts payable and accrued liabilities | ( | ( | ||||||||||||||||||
| Interest rate swaps | Other assets (Other noncurrent liabilities) | ( | ||||||||||||||||||
| Derivatives not designated as hedging instruments | ||||||||||||||||||||
| Foreign exchange contracts | Other current assets and prepayments | |||||||||||||||||||
| Accounts payable and accrued liabilities | ( | ( | ||||||||||||||||||
| Total derivative assets | ||||||||||||||||||||
| Total derivative liabilities | ( | ( | ||||||||||||||||||
| Total net derivative asset (liability) | $ | $ | ( | |||||||||||||||||
The amounts included in AOCL at December 31, 2021 will be recognized in earnings within the next 12 months. No amount of ineffectiveness was recorded in earnings for these designated cash flow hedges.
62
PITNEY BOWES INC.
NOTES TO CONSOLIDATED FINANCIAL STATEMENTS
(Tabular amounts in thousands, except per share amounts)
The following represents the results of cash flow hedging relationships:
| Years Ended December 31, | ||||||||||||||||||||||||||||||||
| Derivative Gain (Loss) Recognized in AOCI (Effective Portion) | Location of Gain (Loss) (Effective Portion) | Gain (Loss) Reclassified from AOCI to Earnings (Effective Portion) | ||||||||||||||||||||||||||||||
| Derivative Instrument | 2021 | 2020 | 2021 | 2020 | ||||||||||||||||||||||||||||
| Foreign exchange contracts | $ | $ | ( | Revenue | $ | $ | ( | |||||||||||||||||||||||||
| Cost of sales | ( | |||||||||||||||||||||||||||||||
| Interest rate swaps | ( | Interest Expense | ( | |||||||||||||||||||||||||||||
| $ | $ | ( | $ | ( | $ | ( | ||||||||||||||||||||||||||
We also enter into foreign exchange contracts to minimize the impact of exchange rate fluctuations on short-term intercompany loans and related interest that are denominated in a foreign currency. The revaluation of the intercompany loans and interest and the mark-to-market adjustment on the derivatives are both recorded in earnings. All outstanding contracts at December 31, 2021 mature over the next three months.
The following represents the mark-to-market adjustment on our non-designated derivative instruments:
| Years Ended December 31, | ||||||||||||||||||||
| Derivative Gain (Loss) Recognized in Earnings | ||||||||||||||||||||
| Derivatives Instrument | Location of Derivative Gain (Loss) | 2021 | 2020 | |||||||||||||||||
| Foreign exchange contracts | Selling, general and administrative expense | $ | ( | $ | ||||||||||||||||
Fair Value of Financial Instruments
Our financial instruments include cash and cash equivalents, investment securities, accounts receivable, loan receivables, derivative instruments, accounts payable and debt. The carrying value for cash and cash equivalents, accounts receivable, loans receivable, held-to-maturity investment securities and accounts payable approximate fair value. The fair value of available-for-sale investment securities and derivative instruments are presented above. The fair value of our debt is estimated based on recently executed transactions and market price quotations. The inputs used to determine the fair value of our debt were classified as Level 2 in the fair value hierarchy. The carrying value and estimated fair value of our debt was as follows:
| December 31, | |||||||||||
| 2021 | 2020 | ||||||||||
| Carrying value | $ | $ | |||||||||
| Fair value | $ | $ | |||||||||
11. Supplemental Financial Statement Information
Activity in the allowance for credit losses on accounts receivable is presented below.
| Balance at beginning of year | Cumulative effect of accounting change | Amounts charged to expense | Write-offs, recoveries and other | Balance at end of year | Accounts and other receivables | Other assets | |||||||||||||||||||||||||||||||||||
| 2021 | $ | $ | $ | $ | ( | $ | $ | $ | |||||||||||||||||||||||||||||||||
| 2020 | $ | $ | $ | $ | ( | $ | $ | $ | |||||||||||||||||||||||||||||||||
| 2019 | $ | $ | $ | $ | ( | $ | $ | $ | |||||||||||||||||||||||||||||||||
63
PITNEY BOWES INC.
NOTES TO CONSOLIDATED FINANCIAL STATEMENTS
(Tabular amounts in thousands, except per share amounts)
Other expense, net consisted of the following:
| Years Ended December 31, | |||||||||||||||||
| 2021 | 2020 | 2019 | |||||||||||||||
| Loss on refinancing of debt | $ | $ | $ | ||||||||||||||
| Insurance proceeds | ( | ( | |||||||||||||||
| (Gain) loss on sale of assets/businesses | ( | ( | |||||||||||||||
| Other expense, net | $ | $ | $ | ||||||||||||||
Supplemental cash flow information is as follows:
| Years Ended December 31, | |||||||||||||||||
| 2021 | 2020 | 2019 | |||||||||||||||
| Purchases of property and equipment in accounts payable | $ | $ | $ | ||||||||||||||
| Cash interest paid | $ | $ | $ | ||||||||||||||
| Cash income tax payments, net of refunds | $ | $ | $ | ||||||||||||||
Selected balance sheet information is as follows:
| December 31, | |||||||||||
| 2021 | 2020 | ||||||||||
| Other assets: | |||||||||||
| Long-term investments | $ | $ | |||||||||
Other (net of allowance of $ | |||||||||||
| Total | $ | $ | |||||||||
| Accounts payable and accrued liabilities: | |||||||||||
| Accounts payable | $ | $ | |||||||||
| Customer deposits | |||||||||||
| Employee related liabilities | |||||||||||
| Other | |||||||||||
| Total | $ | $ | |||||||||
| Other noncurrent liabilities: | |||||||||||
| Pension liabilities | $ | $ | |||||||||
| Postretirement medical benefits | |||||||||||
| Other | |||||||||||
| Total | $ | $ | |||||||||
64
PITNEY BOWES INC.
NOTES TO CONSOLIDATED FINANCIAL STATEMENTS
(Tabular amounts in thousands, except per share amounts)
12. Restructuring Charges and Asset Impairments
Activity in our restructuring reserves was as follows:
| Severance and other exit costs | |||||
| Balance at December 31, 2019 | $ | ||||
| Expenses, net | |||||
| Cash payments | ( | ||||
| Noncash activity | ( | ||||
| Balance at December 31, 2020 | |||||
| Expenses, net | |||||
| Cash payments | ( | ||||
| Noncash activity | ( | ||||
| Balance at December 31, 2021 | $ | ||||
65
PITNEY BOWES INC.
NOTES TO CONSOLIDATED FINANCIAL STATEMENTS
(Tabular amounts in thousands, except per share amounts)
13. Debt
| December 31, | |||||||||||||||||
| Interest rate | 2021 | 2020 | |||||||||||||||
| Notes due October 2021 | |||||||||||||||||
| Notes due May 2022 | |||||||||||||||||
| Notes due April 2023 | |||||||||||||||||
| Notes due March 2024 | |||||||||||||||||
| Notes due March 2027 | |||||||||||||||||
| Notes due March 2029 | |||||||||||||||||
| Notes due January 2037 | |||||||||||||||||
| Notes due March 2043 | |||||||||||||||||
| Term loan due March 2026 | LIBOR + | ||||||||||||||||
| Term loan due January 2025 | LIBOR + | ||||||||||||||||
| Term loan due March 2028 | LIBOR + | ||||||||||||||||
| Other debt | |||||||||||||||||
| Principal amount | |||||||||||||||||
| Less: unamortized costs, net | |||||||||||||||||
| Total debt | |||||||||||||||||
| Less: current portion long-term debt | |||||||||||||||||
| Long-term debt | $ | $ | |||||||||||||||
In 2021, we issued a $400 million 6.875 % unsecured note due March 2027, a $350 million 7.25 % unsecured note due March 2029 and entered into a seven-year $450 million secured term loan maturing March 2028. We redeemed all the outstanding October 2021 notes and an aggregate $363 500 million secured revolving credit facility and our $380 million secured term loan from November 2024 to March 2026. A $56 million pre-tax loss was incurred on the refinancing of debt.
The credit agreement that governs the revolving credit facility and term loans contains financial and non-financial covenants. At December 31, 2021, we were in compliance with all covenants and there were no outstanding borrowings under the revolving credit facility.
We also terminated interest rate swap agreements with an aggregate notional value of $500 million and entered into new interest rate swap agreements with an aggregate notional amount of $200 million. Under the terms of the new swap agreements, we pay fixed-rate interest of 0.56 % and receive variable-rate interest based on one-month LIBOR. The variable interest rate under the term loans and the swaps reset monthly. We received $2 million from the termination of the $500 million interest rate swap agreements, which was recorded in AOCL and will be recognized ratably in income through 2024.
At December 31, 2021, the interest rate of the 2028 Term Loan was 4.1 % and the interest rate on the 2026 Term Loan was 1.9 %.
Annual maturities of outstanding principal at December 31, 2021 are as follows:
| 2022 | $ | ||||
| 2023 | |||||
| 2024 | |||||
| 2025 | |||||
| 2026 | |||||
| Thereafter | |||||
| Total | $ | ||||
66
PITNEY BOWES INC.
NOTES TO CONSOLIDATED FINANCIAL STATEMENTS
(Tabular amounts in thousands, except per share amounts)
14. Retirement Plans and Postretirement Medical Benefits
Retirement Plans
We provide retirement benefits to eligible employees in the U.S. and outside the U.S. under various defined benefit retirement plans. Benefit accruals under most of our significant defined benefit plans have been frozen. The benefit obligations and funded status of defined benefit pension plans are as follows:
| United States | Foreign | ||||||||||||||||||||||
| 2021 | 2020 | 2021 | 2020 | ||||||||||||||||||||
| Accumulated benefit obligation | $ | $ | $ | $ | |||||||||||||||||||
| Projected benefit obligation | |||||||||||||||||||||||
| Benefit obligation - beginning of year | $ | $ | $ | $ | |||||||||||||||||||
| Service cost | |||||||||||||||||||||||
| Interest cost | |||||||||||||||||||||||
| Actuarial (gain) loss | ( | ( | |||||||||||||||||||||
| Foreign currency changes | ( | ||||||||||||||||||||||
| Settlements and curtailments | ( | ( | ( | ||||||||||||||||||||
| Benefits paid | ( | ( | ( | ( | |||||||||||||||||||
| Benefit obligation - end of year | $ | $ | $ | $ | |||||||||||||||||||
| Fair value of plan assets | |||||||||||||||||||||||
| Fair value of plan assets - beginning of year | $ | $ | $ | $ | |||||||||||||||||||
| Actual return on plan assets | |||||||||||||||||||||||
| Company contributions | |||||||||||||||||||||||
| Settlements and curtailments | ( | ( | ( | ||||||||||||||||||||
| Foreign currency changes | ( | ||||||||||||||||||||||
| Benefits paid | ( | ( | ( | ( | |||||||||||||||||||
| Fair value of plan assets - end of year | $ | $ | $ | $ | |||||||||||||||||||
| Amounts recognized in the Consolidated Balance Sheets | |||||||||||||||||||||||
| Noncurrent asset | $ | $ | $ | $ | |||||||||||||||||||
| Current liability | ( | ( | ( | ( | |||||||||||||||||||
| Noncurrent liability | ( | ( | ( | ( | |||||||||||||||||||
| Funded status | $ | ( | $ | ( | $ | ( | $ | ( | |||||||||||||||
Information provided in the table below is only for pension plans with an accumulated benefit obligation in excess of plan assets:
| United States | Foreign | ||||||||||||||||||||||
| 2021 | 2020 | 2021 | 2020 | ||||||||||||||||||||
| Projected benefit obligation | $ | $ | $ | $ | |||||||||||||||||||
| Accumulated benefit obligation | $ | $ | $ | $ | |||||||||||||||||||
| Fair value of plan assets | $ | $ | $ | $ | |||||||||||||||||||
67
PITNEY BOWES INC.
NOTES TO CONSOLIDATED FINANCIAL STATEMENTS
(Tabular amounts in thousands, except per share amounts)
| Pretax amounts recognized in AOCI consist of: | |||||||||||||||||||||||
| United States | Foreign | ||||||||||||||||||||||
| 2021 | 2020 | 2021 | 2020 | ||||||||||||||||||||
| Net actuarial loss | $ | $ | $ | $ | |||||||||||||||||||
| Prior service (credit) cost | ( | ( | |||||||||||||||||||||
| Transition asset | ( | ( | |||||||||||||||||||||
| Total | $ | $ | $ | $ | |||||||||||||||||||
The components of net periodic benefit cost (income) for defined benefit pension plans were as follows:
| United States | Foreign | ||||||||||||||||||||||||||||||||||
| 2021 | 2020 | 2019 | 2021 | 2020 | 2019 | ||||||||||||||||||||||||||||||
| Service cost | $ | $ | $ | $ | $ | $ | |||||||||||||||||||||||||||||
| Interest cost | |||||||||||||||||||||||||||||||||||
| Expected return on plan assets | ( | ( | ( | ( | ( | ( | |||||||||||||||||||||||||||||
| Amortization of net transition asset | ( | ( | |||||||||||||||||||||||||||||||||
| Amortization of prior service (credit) cost | ( | ( | ( | ||||||||||||||||||||||||||||||||
| Amortization of net actuarial loss | |||||||||||||||||||||||||||||||||||
| Settlements and curtailments | |||||||||||||||||||||||||||||||||||
| Net periodic benefit cost (income) | $ | $ | $ | ( | $ | ( | $ | ( | $ | ( | |||||||||||||||||||||||||
Other changes in plan assets and benefit obligations for defined benefit pension plans recognized in other comprehensive income were as follows:
| United States | Foreign | ||||||||||||||||||||||
| 2021 | 2020 | 2021 | 2020 | ||||||||||||||||||||
| Net actuarial (gain) loss | $ | ( | $ | $ | ( | $ | |||||||||||||||||
| Amortization of net actuarial loss | ( | ( | ( | ( | |||||||||||||||||||
| Amortization of prior service credit (cost) | ( | ( | |||||||||||||||||||||
| Net transition asset | |||||||||||||||||||||||
| Settlements and curtailments | ( | ( | ( | ||||||||||||||||||||
| Total recognized in other comprehensive income | $ | ( | $ | $ | ( | $ | |||||||||||||||||
68
PITNEY BOWES INC.
NOTES TO CONSOLIDATED FINANCIAL STATEMENTS
(Tabular amounts in thousands, except per share amounts)
Weighted-average actuarial assumptions used to determine year end benefit obligations and net periodic benefit cost for defined benefit pension plans include:
| 2021 | 2020 | 2019 | |||||||||||||||||||||||||||||||||
| United States | |||||||||||||||||||||||||||||||||||
| Used to determine benefit obligations | |||||||||||||||||||||||||||||||||||
| Discount rate | |||||||||||||||||||||||||||||||||||
| Rate of compensation increase | N/A | N/A | N/A | ||||||||||||||||||||||||||||||||
| Used to determine net periodic benefit cost | |||||||||||||||||||||||||||||||||||
| Discount rate | |||||||||||||||||||||||||||||||||||
| Expected return on plan assets | |||||||||||||||||||||||||||||||||||
| Rate of compensation increase | N/A | N/A | N/A | ||||||||||||||||||||||||||||||||
| Foreign | |||||||||||||||||||||||||||||||||||
| Used to determine benefit obligations | |||||||||||||||||||||||||||||||||||
| Discount rate | % | - | % | - | % | - | |||||||||||||||||||||||||||||
| Rate of compensation increase | % | - | % | - | % | - | |||||||||||||||||||||||||||||
| Used to determine net periodic benefit cost | |||||||||||||||||||||||||||||||||||
| Discount rate | % | - | % | - | % | - | |||||||||||||||||||||||||||||
| Expected return on plan assets | % | - | % | - | % | - | |||||||||||||||||||||||||||||
| Rate of compensation increase | % | - | % | - | % | - | |||||||||||||||||||||||||||||
A discount rate is used to determine the present value of our future benefit obligations. The discount rate for our U.S. pension and postretirement medical benefit plans is determined by matching the expected cash flows associated with our benefit obligations to a pool of corporate long-term, high-quality fixed income debt instruments available as of the measurement date. The discount rate for our largest foreign plan, the U.K. Qualified Pension Plan (the U.K. Plan), is determined using a model that discounts each year's estimated benefit payments by an applicable spot rate derived from a yield curve created from a large number of high quality corporate bonds. For our other smaller foreign pension plans, the discount rate is selected based on high-quality fixed income indices available in the country in which the plan is domiciled.
The expected return on plan assets is based on the target asset allocation for the applicable pension plan and expected rates of return for various asset classes in the investment portfolio after analyzing historical experience and future expectations of returns and volatility of the asset classes.
Investment Strategy and Asset Allocation
The investment strategy for our pension plans is to maximize returns within reasonable and prudent risk levels, achieve and maintain full funding of the accumulated benefit obligation and the actuarial liabilities and earn the expected rate of return while adhering to local regulations and restrictions.
Pension plan assets are invested in accordance with our strategic asset allocation policy. Pension plan assets are exposed to various risks, including interest rate risks, market risks and credit risks. Investments are diversified across asset classes and within each class to reduce the risk of large losses and are periodically rebalanced. Derivatives, such as swaps, options, forwards and futures contracts may be used for market exposure, to alter risk/return characteristics and to manage foreign currency exposure. We do not have any significant concentrations of credit risk within the plan assets.
69
PITNEY BOWES INC.
NOTES TO CONSOLIDATED FINANCIAL STATEMENTS
(Tabular amounts in thousands, except per share amounts)
U.S. Pension Plans
Investment objectives and investment managers are reviewed periodically. Target and actual asset allocations for the U.S. pension plans were as follows:
| Target allocation | Percent of Plan Assets at December 31, | ||||||||||||||||
| 2022 | 2021 | 2020 | |||||||||||||||
| Asset category | |||||||||||||||||
| Equities | % | % | % | ||||||||||||||
| Multi-asset credit | % | % | % | ||||||||||||||
| Fixed income | % | % | % | ||||||||||||||
| Real estate | % | % | % | ||||||||||||||
| Private equity | % | % | % | ||||||||||||||
| Total | % | % | % | ||||||||||||||
Foreign Pension Plans
Our foreign pension plan assets are managed by outside investment managers and monitored regularly by local trustees and our corporate personnel. Target and actual asset allocations for the U.K. Plan, which comprises 79 % of the total foreign pension plan assets, were as follows:
| Target Allocation | Percent of Plan Assets at December 31, | ||||||||||||||||
| 2022 | 2021 | 2020 | |||||||||||||||
| Asset category | |||||||||||||||||
| Global equities | % | % | % | ||||||||||||||
| Fixed income | % | % | % | ||||||||||||||
| Real estate | % | % | % | ||||||||||||||
| Diversified growth | % | % | % | ||||||||||||||
| Cash | % | % | % | ||||||||||||||
| Total | % | % | % | ||||||||||||||
70
PITNEY BOWES INC.
NOTES TO CONSOLIDATED FINANCIAL STATEMENTS
(Tabular amounts in thousands, except per share amounts)
Fair Value Measurements of Plan Assets
The following tables show the U.S. and foreign pension plans' assets, by level within the fair value hierarchy. The plan asset categories presented in the following tables are subsets of the broader asset allocation categories.
United States Pension Plans
| December 31, 2021 | |||||||||||||||||||||||
| Level 1 | Level 2 | Level 3 | Total | ||||||||||||||||||||
| Money market funds | $ | $ | $ | $ | |||||||||||||||||||
| Equity securities | |||||||||||||||||||||||
| Commingled fixed income securities | |||||||||||||||||||||||
Government and related securities | |||||||||||||||||||||||
| Corporate debt securities | |||||||||||||||||||||||
| Mortgage-backed /asset-backed securities | |||||||||||||||||||||||
| Real estate | |||||||||||||||||||||||
| Securities lending collateral | |||||||||||||||||||||||
| Total plan assets at fair value | $ | $ | $ | $ | |||||||||||||||||||
| Securities lending payable | ( | ||||||||||||||||||||||
| Investments valued at NAV | |||||||||||||||||||||||
| Cash | |||||||||||||||||||||||
| Other | ( | ||||||||||||||||||||||
| Fair value of plan assets | $ | ||||||||||||||||||||||
| December 31, 2020 | |||||||||||||||||||||||
| Level 1 | Level 2 | Level 3 | Total | ||||||||||||||||||||
| Money market funds | $ | $ | $ | $ | |||||||||||||||||||
| Equity securities | |||||||||||||||||||||||
| Commingled fixed income securities | |||||||||||||||||||||||
Government and related securities | |||||||||||||||||||||||
| Corporate debt securities | |||||||||||||||||||||||
| Mortgage-backed /asset-backed securities | |||||||||||||||||||||||
| Real estate | |||||||||||||||||||||||
| Securities lending collateral | |||||||||||||||||||||||
| Total plan assets at fair value | $ | $ | $ | $ | |||||||||||||||||||
| Securities lending payable | ( | ||||||||||||||||||||||
| Investments valued at NAV | |||||||||||||||||||||||
| Cash | |||||||||||||||||||||||
| Other | ( | ||||||||||||||||||||||
| Fair value of plan assets | $ | ||||||||||||||||||||||
71
PITNEY BOWES INC.
NOTES TO CONSOLIDATED FINANCIAL STATEMENTS
(Tabular amounts in thousands, except per share amounts)
Foreign Plans
| December 31, 2021 | |||||||||||||||||||||||
| Level 1 | Level 2 | Level 3 | Total | ||||||||||||||||||||
| Money market funds | $ | $ | $ | $ | |||||||||||||||||||
| Equity securities | |||||||||||||||||||||||
| Commingled fixed income securities | |||||||||||||||||||||||
Government and related securities | |||||||||||||||||||||||
| Corporate debt securities | |||||||||||||||||||||||
| Real estate | |||||||||||||||||||||||
| Diversified growth funds | |||||||||||||||||||||||
| Total plan assets at fair value | $ | $ | $ | $ | |||||||||||||||||||
| Cash | |||||||||||||||||||||||
| Other | |||||||||||||||||||||||
| Fair value of plan assets | $ | ||||||||||||||||||||||
| December 31, 2020 | |||||||||||||||||||||||
| Level 1 | Level 2 | Level 3 | Total | ||||||||||||||||||||
| Money market funds | $ | $ | $ | $ | |||||||||||||||||||
| Equity securities | |||||||||||||||||||||||
| Commingled fixed income securities | |||||||||||||||||||||||
Government and related securities | |||||||||||||||||||||||
| Corporate debt securities | |||||||||||||||||||||||
| Real estate | |||||||||||||||||||||||
| Diversified growth funds | |||||||||||||||||||||||
| Total plan assets at fair value | $ | $ | $ | $ | |||||||||||||||||||
| Cash | |||||||||||||||||||||||
| Other | |||||||||||||||||||||||
| Fair value of plan assets | $ | ||||||||||||||||||||||
The following information relates to our classification of investments into the fair value hierarchy:
•Money Market Funds: Money market funds typically invest in government securities, certificates of deposit, commercial paper and other highly liquid, low risk securities. Money market funds are principally used for overnight deposits and are classified as Level 1 when unadjusted quoted prices in active markets are available and as Level 2 when they are not actively traded on an exchange.
•Equity Securities: Equity securities are comprised of mutual funds investing in U.S. and foreign stocks. These mutual funds are classified as Level 2.
•Commingled Fixed Income Securities: Commingled fixed income securities are comprised of mutual funds that invest in a variety of fixed income securities, including securities of the U.S. government and its agencies, corporate debt, mortgage-backed securities and asset-backed securities. Fair value is based on the value of the underlying investments owned by each fund, minus its liabilities, divided by the number of shares outstanding, as reported by the fund manager. These mutual funds are classified as Level 1 when unadjusted quoted prices in active markets are available and as Level 2 when they are not actively traded on an exchange.
•Government and Related Securities: Debt securities are classified as Level 1 where active, high volume trades for identical securities exist. Valuation adjustments are not applied to these securities. Debt securities are classified as Level 2 where fair value is determined using quoted market prices for similar securities or benchmarking model derived prices to quoted market prices and trade data for identical or comparable securities.
72
PITNEY BOWES INC.
NOTES TO CONSOLIDATED FINANCIAL STATEMENTS
(Tabular amounts in thousands, except per share amounts)
•Corporate Debt Securities: Corporate debt securities are valued using recently executed comparable transactions, market price quotations or bond spreads for the same maturity as the security. These securities are classified as Level 2.
•Mortgage-Backed Securities / Asset-Backed Securities: These securities are valued based on external pricing indices or on external price/spread data. These securities are classified as Level 2.
•Real Estate: include units in open-ended commingled real estate funds. Funds that are valued and traded on a daily basis in an active market are classified as Level 2. Investments that are valued on an annual basis by certified appraisers are classified as Level 3. The valuation techniques used to value Level 3 investments include the cost approach, sales-comparison method and the income approach.
•Diversified Growth Funds: comprised of units in commingled diversified growth funds that comprise a mix of different asset classes. The underlying investments may not be listed on an exchange in an active market or traded on a daily basis and may fall into all three fair value categories. Accordingly, these securities are classified as Level 3.
•Securities Lending Fund: represents a commingled fund through our custodian's securities lending program. The U.S. pension plan lends securities that are held within the plan to other banks and/or brokers, and receives collateral, typically cash. This collateral is invested in a commingled fund that invests in short-term fixed income securities. This investment is classified as Level 2. This amount invested in the fund is offset by a corresponding liability reflected in the U.S. pension plan's net assets available for benefits.
Investments Valued at Net Asset Value (NAV)
Represents investments in private equity limited partnerships that are measured at fair value using the Net Asset Value (NAV) per share as a practical expedient and are not categorized in the fair value hierarchy. There is no active market for these investments and the pension plan receives a proportionate share of the gains, losses and expenses in accordance with the partnership agreements. There is a remaining unfunded commitment of $8 million at December 31, 2021. These investments comprise 1.1 % of total U.S. Pension Fund assets at both December 31, 2021 and 2020.
Level 3 Gains and Losses
The following table summarizes the changes in the fair value of Level 3 assets:
| U.S. Plans | Foreign Plans | ||||||||||||||||
| Real estate | Real estate | Diversified Growth Funds | |||||||||||||||
| Balance at December 31, 2019 | $ | $ | $ | ||||||||||||||
| Realized gains | |||||||||||||||||
| Unrealized losses | ( | ( | |||||||||||||||
| Net purchases, sales and settlements | ( | ||||||||||||||||
| Foreign currency and other | |||||||||||||||||
| Balance at December 31, 2020 | |||||||||||||||||
| Realized gains | |||||||||||||||||
| Unrealized gains | |||||||||||||||||
| Net purchases, sales and settlements | ( | ||||||||||||||||
| Foreign currency and other | ( | ( | |||||||||||||||
| Balance at December 31, 2021 | $ | $ | $ | ||||||||||||||
73
PITNEY BOWES INC.
NOTES TO CONSOLIDATED FINANCIAL STATEMENTS
(Tabular amounts in thousands, except per share amounts)
Postretirement Medical Benefits
We provide certain employer subsidized health care and employer provided life insurance benefits in the U.S. and Canada to eligible retirees and their dependents. The cost of these benefits is recognized over the period the employee provides credited service to the company. The benefit obligation and funded status for postretirement medical benefit plans are as follows:
| 2021 | 2020 | ||||||||||
| Benefit obligation | |||||||||||
| Benefit obligation - beginning of year | $ | $ | |||||||||
| Service cost | |||||||||||
| Interest cost | |||||||||||
| Actuarial (gain) loss | ( | ||||||||||
| Foreign currency changes | |||||||||||
| Benefits paid, net | ( | ( | |||||||||
Benefit obligation - end of year (1) | $ | $ | |||||||||
| Fair value of plan assets | |||||||||||
| Fair value of plan assets - beginning of year | $ | $ | |||||||||
| Company contribution | |||||||||||
| Benefits paid, net | ( | ( | |||||||||
| Fair value of plan assets - end of year | $ | $ | |||||||||
| Amounts recognized in the Consolidated Balance Sheets | |||||||||||
| Current liability | $ | ( | $ | ( | |||||||
| Non-current liability | ( | ( | |||||||||
| Funded status | $ | ( | $ | ( | |||||||
(1) The benefit obligation for U.S. postretirement medical benefits plan was $126 million and $153 million at December 31, 2021 and 2020, respectively.
Pretax amounts recognized in AOCI consist of:
| 2021 | 2020 | ||||||||||
| Net actuarial loss | $ | $ | |||||||||
| Prior service cost | |||||||||||
| Total | $ | $ | |||||||||
The components of net periodic benefit cost for postretirement medical benefit plans were as follows:
| 2021 | 2020 | 2019 | |||||||||||||||
| Service cost | $ | $ | $ | ||||||||||||||
| Interest cost | |||||||||||||||||
| Amortization of prior service cost | |||||||||||||||||
| Amortization of net actuarial loss | |||||||||||||||||
| Net periodic benefit cost | $ | $ | $ | ||||||||||||||
74
PITNEY BOWES INC.
NOTES TO CONSOLIDATED FINANCIAL STATEMENTS
(Tabular amounts in thousands, except per share amounts)
Other changes in benefit obligation for postretirement medical benefit plans recognized in other comprehensive income were as follows:
| 2021 | 2020 | ||||||||||
| Net actuarial (gain) loss | $ | ( | $ | ||||||||
| Amortization of net actuarial loss | ( | ( | |||||||||
| Amortization of prior service cost | ( | ( | |||||||||
| Total recognized in other comprehensive income | $ | ( | $ | ||||||||
The weighted-average discount rates used to determine end of year benefit obligation and net periodic pension cost include:
| 2021 | 2020 | 2019 | |||||||||||||||
| Discount rate used to determine benefit obligation | |||||||||||||||||
| U.S. | % | % | % | ||||||||||||||
| Canada | % | % | % | ||||||||||||||
| Discount rate used to determine net period benefit cost | |||||||||||||||||
| U.S. | % | % | % | ||||||||||||||
| Canada | % | % | % | ||||||||||||||
The assumed health care cost trend rate used in measuring the accumulated postretirement benefit obligation for the U.S. plan was 6.8 % and 7.0 % for 2021 and 2020, respectively. The assumed health care trend rate is 6.50 % for 2022 and will gradually decline to 5.0 % by the year 2028 and remain at that level thereafter. Assumed health care cost trend rates have a significant effect on the amounts reported for the health care plans.
Estimated Future Benefit Payments
The following benefit payments, which reflect expected future service, are expected to be paid.
| Pension Benefits | Postretirement Medical Benefits | ||||||||||
| 2022 | $ | $ | |||||||||
| 2023 | |||||||||||
| 2024 | |||||||||||
| 2025 | |||||||||||
| 2026 | |||||||||||
| Thereafter | |||||||||||
| $ | $ | ||||||||||
During 2022, we estimate making contributions of $6 million to our U.S. pension plans and $10 million to our foreign pension plans.
Savings Plans
We offer voluntary defined contribution plans to our U.S. employees designed to help them accumulate additional savings for retirement. We provide a core contribution to all employees, regardless if they participate in the plan, and match a portion of each participating employees' contribution, based on eligible pay. Total contributions to our defined contribution plans were $27 million in 2021 and $28 million in 2020.
75
PITNEY BOWES INC.
NOTES TO CONSOLIDATED FINANCIAL STATEMENTS
(Tabular amounts in thousands, except per share amounts)
15. Income Taxes
Income (loss) from continuing operations before taxes consisted of the following:
| Years Ended December 31, | |||||||||||||||||
| 2021 | 2020 | 2019 | |||||||||||||||
| U.S. | $ | ( | $ | ( | $ | ||||||||||||
| International | |||||||||||||||||
| Total | $ | ( | $ | ( | $ | ||||||||||||
The provision (benefit) for income taxes from continuing operations consisted of the following:
| Years Ended December 31, | |||||||||||||||||
| 2021 | 2020 | 2019 | |||||||||||||||
| U.S. Federal: | |||||||||||||||||
| Current | $ | ( | $ | ( | $ | ( | |||||||||||
| Deferred | ( | ||||||||||||||||
| ( | ( | ( | |||||||||||||||
| U.S. State and Local: | |||||||||||||||||
| Current | ( | ( | |||||||||||||||
| Deferred | ( | ||||||||||||||||
| ( | ( | ||||||||||||||||
| International: | |||||||||||||||||
| Current | |||||||||||||||||
| Deferred | ( | ( | |||||||||||||||
| ( | |||||||||||||||||
| Total current | ( | ( | |||||||||||||||
| Total deferred | ( | ||||||||||||||||
| Total (benefit) provision for income taxes | $ | ( | $ | $ | ( | ||||||||||||
| Effective tax rate | % | ( | % | ( | % | ||||||||||||
The effective tax rate for 2021 includes benefits of $7 million from the resolution of tax matters, $5 million due to tax legislation in the U.K., $3 million from an affiliate reorganization and $2 million from the vesting of restricted stock, partially offset by charges of $6 million on the pre-tax gain of $10 million from the sale of a business as the tax basis was lower than the book basis and $1 million for the write-off of deferred tax assets associated with the expiration of out-of-the-money stock options.
The effective tax rate for 2020 includes a $12 million charge for the surrender of company owned life insurance policies, a $5 million benefit for the correction of tax balances in certain domestic and international tax jurisdictions, a $3 million benefit due to regulations enacted into law, a $2 million benefit for the carryback of net operating losses resulting from the CARES Act and a benefit of $2 million on the $198 million goodwill impairment charge as the majority of this charge is nondeductible.
The effective tax rate for 2019 includes benefits of $23 million from the release of a foreign valuation allowance and $9 million from the resolution of certain tax examinations. The effective tax rate for 2019 also includes a tax of $3 million on the $18 million book loss from the disposition of operations in certain international markets, primarily due to nondeductible basis differences.
76
PITNEY BOWES INC.
NOTES TO CONSOLIDATED FINANCIAL STATEMENTS
(Tabular amounts in thousands, except per share amounts)
A reconciliation of income taxes computed at the federal statutory rate and our provision for income taxes consist of the following:
| Years Ended December 31, | |||||||||||||||||
| 2021 | 2020 | 2019 | |||||||||||||||
| Federal statutory provision | $ | ( | $ | ( | $ | ||||||||||||
State and local income taxes (1) | ( | ( | |||||||||||||||
Impact of foreign operations taxed at rates other than the U.S. statutory rate (2) | ( | ( | ( | ||||||||||||||
| Accrual/release of uncertain tax amounts related to foreign operations | ( | ||||||||||||||||
| U.S. tax impacts of foreign income in the U.S. | ( | ||||||||||||||||
| CARES Act carryback benefit | ( | ( | |||||||||||||||
| Tax incentives/credits/exempt income | ( | ( | ( | ||||||||||||||
| Unrealized stock compensation benefits | ( | ||||||||||||||||
| Surrender of company-owned life insurance policies | |||||||||||||||||
| Goodwill impairment | |||||||||||||||||
Other, net (3) | ( | ( | ( | ||||||||||||||
| (Benefit) provision for income taxes | $ | ( | $ | $ | ( | ||||||||||||
(1) Includes a charge of $2 million for the surrender of company-owned life insurance for the year ended December 31, 2020.
(2) Includes a benefit of $5 million for a deferred rate change for the year ended December 31, 2021, a benefit of $3 million for tax balance corrections and a deferred tax rate change benefit of $2 million for the year ended December 31, 2020 and a foreign valuation allowance release of $23 million and a $3 million tax on the disposition of operations in certain international markets for the year ended December 31, 2019.
77
PITNEY BOWES INC.
NOTES TO CONSOLIDATED FINANCIAL STATEMENTS
(Tabular amounts in thousands, except per share amounts)
Deferred tax liabilities and assets consisted of the following:
| December 31, | |||||||||||
| 2021 | 2020 | ||||||||||
| Deferred tax liabilities: | |||||||||||
| Depreciation | $ | ( | $ | ( | |||||||
| Deferred profit (for tax purposes) on sale to finance subsidiary | ( | ( | |||||||||
| Lease revenue and related depreciation | ( | ( | |||||||||
| Intangible assets | ( | ( | |||||||||
| Operating lease liability | ( | ( | |||||||||
| Other | ( | ( | |||||||||
| Gross deferred tax liabilities | ( | ( | |||||||||
| Deferred tax assets: | |||||||||||
| Postretirement medical benefits | |||||||||||
| Pension | |||||||||||
| Operating lease asset | |||||||||||
| Inventory and equipment capitalization | |||||||||||
| Restructuring charges | |||||||||||
| Long-term incentives | |||||||||||
| Net operating loss | |||||||||||
| Tax credit carry forwards | |||||||||||
| Tax uncertainties gross-up | |||||||||||
| Other | |||||||||||
| Gross deferred tax assets | |||||||||||
| Less: Valuation allowance | ( | ( | |||||||||
| Net deferred tax assets | |||||||||||
| Total deferred taxes, net | $ | ( | $ | ( | |||||||
The valuation allowance relates primarily to certain foreign, state and local net operating loss and tax credit carryforwards that will more-likely-than-not expire unutilized.
We have a federal net operating loss carryforward of $157 million as of December 31, 2021, the majority of which has an indefinite carryforward period. We have net operating loss carryforwards in international jurisdictions of $163 million as of December 31, 2021, of which $150 million can be carried forward indefinitely and the remainder expire over the next 20 years. We also have net operating loss carryforwards in most states totaling $1.1 billion that will expire over the next 20 years. In addition, we have tax credit carryforwards of $66 million, of which $51 million can be carried forward indefinitely and the remainder expire over the next 11 years.
As of December 31, 2021, we assert that we are permanently reinvested in our pre-1987 and post-2017 undistributed earnings of $264 million as well as all other outside basis differences. While a determination of the full liability that would be incurred if these earnings were repatriated is not practicable, we have estimated the withholding taxes would be approximately $2 million.
78
PITNEY BOWES INC.
NOTES TO CONSOLIDATED FINANCIAL STATEMENTS
(Tabular amounts in thousands, except per share amounts)
Uncertain Tax Positions
A reconciliation of the amount of unrecognized tax benefits is as follows:
| 2021 | 2020 | 2019 | |||||||||||||||
| Balance at beginning of year | $ | $ | $ | ||||||||||||||
| Increases from prior period positions | |||||||||||||||||
| Decreases from prior period positions | ( | ( | ( | ||||||||||||||
| Increases from current period positions | |||||||||||||||||
| Decreases relating to settlements with tax authorities | ( | ( | ( | ||||||||||||||
| Reductions from lapse of applicable statute of limitations | ( | ( | ( | ||||||||||||||
| Balance at end of year | $ | $ | $ | ||||||||||||||
The amount of the unrecognized tax benefits at December 31, 2021, 2020 and 2019 that would affect the effective tax rate if recognized was $39 million, $44 million and $54 million, respectively.
On a regular basis, we conclude tax return examinations, statutes of limitations expire, and court decisions interpret tax law. We regularly assess tax uncertainties in light of these developments. As a result, it is reasonably possible that the amount of our unrecognized tax benefits will decrease in the next 12 months, and we expect this change could be up to 10 % of our unrecognized tax benefits. We recognize interest and penalties related to uncertain tax positions in our provision for income taxes. Amounts included in our provision for income taxes related to interest and penalties on uncertain tax positions for each of the years ended December 31, 2021, 2020 and 2019 were not significant. We had approximately $4
Other Tax Matters
The Internal Revenue Service examinations of our consolidated U.S. income tax returns for tax years prior to 2018 are closed to audit; however, various post-2016 U.S. state and local tax returns are still subject to examination, with some states in appeals from 2011. For our significant non-U.S. jurisdictions, Canada is closed to examination through 2016 except for a specific issue arising in earlier years, France is closed through 2019, Germany is closed through 2016 and the U.K. is closed through 2018. We also have other less significant tax filings currently subject to examination.
We regularly assess the likelihood of tax adjustments in each of the tax jurisdictions in which we have operations and account for the related financial statement implications. We believe we have established tax reserves that are appropriate given the possibility of tax adjustments. However, determining the appropriate level of tax reserves requires judgment regarding the uncertain application of tax law and the possibility of tax adjustments. Future changes in tax reserve requirements could have a material impact, positive or negative, on our results of operations, financial position and cash flows.
16. Commitments and Contingencies
79
PITNEY BOWES INC.
NOTES TO CONSOLIDATED FINANCIAL STATEMENTS
(Tabular amounts in thousands, except per share amounts)
17. Leased Assets and Liabilities
We lease real estate and equipment under operating and finance lease agreements. Our leases have terms of up to 15 years, and may include an option to extend the lease for up to 5 years. At lease commencement, a lease liability and corresponding right-of-use asset is recognized. Lease liabilities represent the present value of future lease payments over the expected lease term, including options to extend or terminate the lease when it is reasonably certain those options will be exercised. Lease payments include all fixed payments and variable payments tied to an index, but exclude costs such as common area maintenance charges, property taxes, insurance and mileage. The present value of our lease liability is determined using our incremental borrowing rate at lease commencement. Information regarding operating and financing leases are as follows:
| Leases | Balance Sheet Location | December 31, 2021 | December 31, 2020 | |||||||||||||||||
| Assets | ||||||||||||||||||||
| Operating | Operating lease assets | $ | $ | |||||||||||||||||
| Finance | ||||||||||||||||||||
| Total leased assets | $ | $ | ||||||||||||||||||
| Liabilities | ||||||||||||||||||||
| Operating | Current operating lease liabilities | $ | $ | |||||||||||||||||
| Noncurrent operating lease liabilities | ||||||||||||||||||||
| Finance | ||||||||||||||||||||
| Total lease liabilities | $ | $ | ||||||||||||||||||
| Years Ended December 31, | |||||||||||||||||
| Lease Cost | 2021 | 2020 | 2019 | ||||||||||||||
| Operating lease expense | $ | $ | $ | ||||||||||||||
| Finance lease expense | |||||||||||||||||
| Amortization of leased assets | |||||||||||||||||
| Interest on lease liabilities | |||||||||||||||||
| Variable lease expense | |||||||||||||||||
| Sublease income | ( | ( | ( | ||||||||||||||
| Total expense | $ | $ | $ | ||||||||||||||
Operating lease expense includes immaterial amounts related to leases with terms of 12 months or less.
| Future Lease Payments | Operating Leases | Finance Leases | Total | ||||||||||||||
| 2022 | $ | $ | $ | ||||||||||||||
| 2023 | |||||||||||||||||
| 2024 | |||||||||||||||||
| 2025 | |||||||||||||||||
| 2026 | |||||||||||||||||
| Thereafter | |||||||||||||||||
| Total | |||||||||||||||||
| Less: present value discount | |||||||||||||||||
| Lease liability | $ | $ | $ | ||||||||||||||
Future lease payments exclude $21 million of payments for leases signed but not yet commenced at December 31, 2021.
80
PITNEY BOWES INC.
NOTES TO CONSOLIDATED FINANCIAL STATEMENTS
(Tabular amounts in thousands, except per share amounts)
| Lease Term and Discount Rate | December 31, 2021 | December 31, 2020 | |||||||||
| Weighted-average remaining lease term | |||||||||||
| Operating leases | |||||||||||
| Finance leases | |||||||||||
| Weighted-average discount rate | |||||||||||
| Operating leases | |||||||||||
| Finance leases | |||||||||||
| Years Ended December 31, | |||||||||||||||||
| Cash Flow Information | 2021 | 2020 | 2019 | ||||||||||||||
| Operating cash outflows - operating leases | $ | $ | $ | ||||||||||||||
| Operating cash outflows - finance leases | $ | $ | $ | ||||||||||||||
| Financing cash outflows - finance leases | $ | $ | $ | ||||||||||||||
| Leased assets obtained in exchange for new lease obligations | |||||||||||||||||
| Operating leases | $ | $ | $ | ||||||||||||||
| Finance leases | $ | $ | $ | ||||||||||||||
18. Stockholders' Equity
The following table summarizes the changes in shares of Common Stock outstanding and Treasury Stock:
| Common Stock Outstanding | Treasury Stock | ||||||||||
| Balance at December 31, 2018 | |||||||||||
| Repurchases of common stock | ( | ||||||||||
| Issuance of treasury stock | ( | ||||||||||
| Conversions to common stock | ( | ||||||||||
| Balance at December 31, 2019 | |||||||||||
| Issuance of treasury stock | ( | ||||||||||
| Balance at December 31, 2020 | |||||||||||
| Issuance of treasury stock | ( | ||||||||||
| Balance at December 31, 2021 | |||||||||||
81
PITNEY BOWES INC.
NOTES TO CONSOLIDATED FINANCIAL STATEMENTS
(Tabular amounts in thousands, except per share amounts)
19. Accumulated Other Comprehensive Loss
Reclassifications out of accumulated other comprehensive loss were as follows:
| Gain (Loss) Reclassified from AOCL (a) | |||||||||||||||||
| Years Ended December 31, | |||||||||||||||||
| 2021 | 2020 | 2019 | |||||||||||||||
| Cash flow hedges | |||||||||||||||||
| Revenue | $ | $ | ( | $ | |||||||||||||
| Cost of sales | ( | ||||||||||||||||
| Interest expense | ( | ||||||||||||||||
| Total before tax | ( | ( | |||||||||||||||
| Tax (benefit) provision | ( | ( | |||||||||||||||
| Net of tax | $ | ( | $ | ( | $ | ||||||||||||
| Available for sale securities | |||||||||||||||||
| Financing revenue | $ | ( | $ | $ | |||||||||||||
| Selling, general and administrative expense | ( | ||||||||||||||||
| Total before tax | ( | ||||||||||||||||
| Tax (benefit) provision | ( | ||||||||||||||||
| Net of tax | $ | ( | $ | $ | |||||||||||||
Pension and Postretirement Benefit Plans (b) | |||||||||||||||||
| Transition asset | $ | $ | $ | ||||||||||||||
| Prior service costs | ( | ( | ( | ||||||||||||||
| Actuarial losses | ( | ( | ( | ||||||||||||||
| Settlement | ( | ( | ( | ||||||||||||||
| Total before tax | ( | ( | ( | ||||||||||||||
| Tax benefit | ( | ( | ( | ||||||||||||||
| Net of tax | $ | ( | $ | ( | $ | ( | |||||||||||
(a) Amounts in parentheses indicate reductions to income and increases to other comprehensive income.
(b) Reclassified from accumulated other comprehensive loss to other components of net pension and postretirement cost. These amounts are included in net periodic costs for defined benefit pension plans and postretirement medical benefit plans (see Note 14 for additional details).
82
PITNEY BOWES INC.
NOTES TO CONSOLIDATED FINANCIAL STATEMENTS
(Tabular amounts in thousands, except per share amounts)
Changes in accumulated other comprehensive loss, net of tax, were as follows:
| Cash flow hedges | Available-for-sale securities | Pension and postretirement benefit plans | Foreign currency adjustments | Total | |||||||||||||||||||||||||
| Balance at December 31, 2018 | $ | $ | ( | $ | ( | $ | ( | $ | ( | ||||||||||||||||||||
| Other comprehensive loss before reclassifications | ( | ||||||||||||||||||||||||||||
| Amounts reclassified from accumulated other comprehensive loss | ( | ( | |||||||||||||||||||||||||||
| Net other comprehensive income | |||||||||||||||||||||||||||||
| Balance at December 31, 2019 | ( | ( | ( | ||||||||||||||||||||||||||
| Other comprehensive (loss) income before reclassifications | ( | ( | ( | ||||||||||||||||||||||||||
| Amounts reclassified from accumulated other comprehensive loss | ( | ||||||||||||||||||||||||||||
| Net other comprehensive (loss) income | ( | ( | ( | ||||||||||||||||||||||||||
| Balance at December 31, 2020 | ( | ( | ( | ||||||||||||||||||||||||||
| Other comprehensive income (loss) before reclassifications | ( | ( | |||||||||||||||||||||||||||
| Amounts reclassified from accumulated other comprehensive loss | |||||||||||||||||||||||||||||
| Net other comprehensive income (loss) | ( | ( | |||||||||||||||||||||||||||
| Balance at December 31, 2021 | $ | $ | ( | $ | ( | $ | ( | $ | ( | ||||||||||||||||||||
20. Stock-Based Compensation Plans
We may grant restricted stock units, non-qualified stock options and performance stock units to eligible employees. All stock-based awards are approved by the Executive Compensation Committee of the Board of Directors. We settle stock awards with treasury shares. At December 31, 2021, there were 119,940,056 shares available for future grants.
Restricted Stock Units
Restricted stock units (RSUs) typically vest ratably over a three-year service period and entitle the holder to shares of common stock as the units vest. The following table summarizes information about RSUs:
| 2021 | 2020 | ||||||||||||||||||||||
| Shares | Weighted average fair value | Shares | Weighted average fair value | ||||||||||||||||||||
| Outstanding - beginning of the year | $ | $ | |||||||||||||||||||||
| Granted | |||||||||||||||||||||||
| Vested | ( | ( | |||||||||||||||||||||
| Forfeited | ( | ( | |||||||||||||||||||||
| Outstanding - end of the year | $ | $ | |||||||||||||||||||||
The fair value of RSUs is determined based on the stock price on the grant date less the present value of expected dividends. At December 31, 2021, there was $9 million of unrecognized compensation cost related to RSUs that is expected to be recognized over a weighted-average period of 1.6 years. The intrinsic value of RSUs outstanding at December 31, 2021 was $38 million. The fair value of RSUs vested during 2021, 2020 and 2019 was $22 million, $6 million and $8 million, respectively. During 2019, we granted 3,113,886 RSUs at a weighted average fair value of $6.56 .
In 2021 and 2020, we granted 121,455 and 282,131 RSUs, respectively, to non-employee directors. These RSUs vest one year from the grant date.
83
PITNEY BOWES INC.
NOTES TO CONSOLIDATED FINANCIAL STATEMENTS
(Tabular amounts in thousands, except per share amounts)
Performance Stock Units
Performance stock units (PSUs) are stock awards where the number of shares ultimately received by the employee is conditional upon the attainment of certain performance targets and total shareholder return relative to peer companies. PSUs vest at the end of a three-year service period and the actual number of shares awarded may range from 0 % to 200 % of the target award. The final determination of the number of shares to be issued is made by the Board of Directors, who may reduce, but not increase, the number of shares to be awarded (negative discretion). PSUs are accounted for as variable awards until the end of the service period when the grant date is established.
The following table summarizes share information about PSUs:
| 2021 | 2020 | ||||||||||||||||||||||
| Shares | Weighted average fair value | Shares | Weighted average fair value | ||||||||||||||||||||
| Outstanding - beginning of the year | $ | $ | |||||||||||||||||||||
| Vested | ( | ( | |||||||||||||||||||||
| Forfeited | ( | ( | |||||||||||||||||||||
| Outstanding - end of the year | $ | $ | |||||||||||||||||||||
Share-based compensation expense for PSUs is recognized ratably over the service period based on the number shares expected to be awarded and the fair value of an award. The fair value of PSUs is determined using a Monte Carlo simulation model. Due to the variability of these awards, significant fluctuations in share-based compensation expense for PSUs recognized from one period to the next are possible. During 2019, we granted 1,368,182 PSUs at an initial award date fair value of $6.60 .
Stock Options
Stock options are granted at an exercise price equal to or greater than the stock price of our common stock on the grant date. Options vest ratably over three years and expire ten years from the grant date. At December 31, 2021, there was $2 million of unrecognized compensation cost related to stock options that is expected to be recognized over a weighted-average period of 1.4 years. The intrinsic value of options outstanding at December 31, 2021 was $7 million and the intrinsic value of options exercisable was not significant.
The following table summarizes information about stock option activity:
| 2021 | 2020 | ||||||||||||||||||||||
| Shares | Per share weighted average exercise prices | Shares | Per share weighted average exercise prices | ||||||||||||||||||||
| Options outstanding - beginning of the year | $ | $ | |||||||||||||||||||||
| Granted | |||||||||||||||||||||||
| Exercised | ( | ( | |||||||||||||||||||||
| Canceled | ( | ( | |||||||||||||||||||||
| Expired | ( | ( | |||||||||||||||||||||
| Options outstanding - end of the year | $ | $ | |||||||||||||||||||||
| Options exercisable - end of the year | $ | $ | |||||||||||||||||||||
There were no stock option exercises in 2019.
84
PITNEY BOWES INC.
NOTES TO CONSOLIDATED FINANCIAL STATEMENTS
(Tabular amounts in thousands, except per share amounts)
The following table provides additional information about stock options outstanding and exercisable at December 31, 2021:
| Options Outstanding | Options Exercisable | |||||||||||||||||||||||||||||||||||||
| Range of per share exercise prices | Shares | Per share weighted-average exercise price | Weighted-average remaining contractual life | Shares | Per share weighted-average exercise price | Weighted-average remaining contractual life | ||||||||||||||||||||||||||||||||
$ | $ | $ | ||||||||||||||||||||||||||||||||||||
$ | $ | $ | ||||||||||||||||||||||||||||||||||||
$ | $ | $ | ||||||||||||||||||||||||||||||||||||
| $ | $ | |||||||||||||||||||||||||||||||||||||
The fair value of stock options is determined using a Black-Scholes valuation model and requires assumptions be made regarding the expected stock price volatility, risk-free interest rate, life of the award and dividend yield. The expected stock price volatility is based on historical price changes of our stock. The risk-free interest rate is based on U.S. Treasuries with a term equal to the expected life of the award. The expected life of the award and expected dividend yield are based on historical experience.
The following table lists the weighted average of assumptions used to calculate the fair value of stock options granted:
| Years Ended December 31, | |||||||||||||||||
| 2021 | 2020 | 2019 | |||||||||||||||
| Expected dividend yield | % | % | % | ||||||||||||||
| Expected stock price volatility | % | % | % | ||||||||||||||
| Risk-free interest rate | % | % | % | ||||||||||||||
| Expected life | |||||||||||||||||
| Weighted-average fair value per option granted | $ | $ | $ | ||||||||||||||
| Fair value of options granted | $ | $ | $ | ||||||||||||||
Employee Stock Purchase Plan (ESPP)
21. Subsequent Event
85
PITNEY BOWES INC.
NOTES TO CONSOLIDATED FINANCIAL STATEMENTS
(Tabular amounts in thousands, except per share amounts)
22. Quarterly Financial Data (unaudited)
Effective October 1, 2021, we elected to adopt the FIFO inventory valuation methodology where we had previously valued inventory on the LIFO basis. Accordingly, amounts previously reported for all quarters of 2020 and the first, second and third quarters of 2021 have been recast from what was previously reported in our quarterly filings on Form 10-Q and annual filing on Form 10-K.
| First Quarter | Second Quarter | Third Quarter | Fourth Quarter | Total | |||||||||||||||||||||||||
| 2021 | |||||||||||||||||||||||||||||
| Revenue | $ | $ | $ | $ | $ | ||||||||||||||||||||||||
| Cost of revenue | |||||||||||||||||||||||||||||
| Operating expenses | |||||||||||||||||||||||||||||
| (Loss) income from continuing operations before income taxes | ( | ( | |||||||||||||||||||||||||||
| (Benefit) provision for income taxes | ( | ( | ( | ( | |||||||||||||||||||||||||
| (Loss) income from continuing operations | ( | ||||||||||||||||||||||||||||
| Income (loss) from discontinued operations | ( | ( | ( | ( | |||||||||||||||||||||||||
| Net (loss) income | $ | ( | $ | $ | $ | $ | ( | ||||||||||||||||||||||
Basic (loss) earnings per share (1) | |||||||||||||||||||||||||||||
| Continuing operations | $ | ( | $ | $ | $ | $ | |||||||||||||||||||||||
| Discontinued operations | ( | ( | ( | ||||||||||||||||||||||||||
| Net (loss) income | $ | ( | $ | $ | $ | $ | ( | ||||||||||||||||||||||
Diluted (loss) earnings per share (1) | |||||||||||||||||||||||||||||
| Continuing operations | $ | ( | $ | $ | $ | $ | |||||||||||||||||||||||
| Discontinued operations | ( | ( | ( | ||||||||||||||||||||||||||
| Net (loss) income | $ | ( | $ | $ | $ | $ | ( | ||||||||||||||||||||||
| First Quarter | Second Quarter | Third Quarter | Fourth Quarter | Total | |||||||||||||||||||||||||
| 2020 | |||||||||||||||||||||||||||||
| Revenue | $ | $ | $ | $ | $ | ||||||||||||||||||||||||
| Cost of revenues | |||||||||||||||||||||||||||||
| Operating expenses | |||||||||||||||||||||||||||||
| Income (loss) from continuing operations before income taxes | ( | ( | |||||||||||||||||||||||||||
| Provision (benefit) for income taxes | ( | ( | |||||||||||||||||||||||||||
| (Loss) income from continuing operations | ( | ( | ( | ||||||||||||||||||||||||||
| (Loss) income from discontinued operations | ( | ||||||||||||||||||||||||||||
| Net (loss) income | $ | ( | $ | ( | $ | $ | $ | ( | |||||||||||||||||||||
Basic (loss) earnings per share (1): | |||||||||||||||||||||||||||||
| Continuing operations | $ | ( | $ | $ | $ | $ | ( | ||||||||||||||||||||||
| Discontinued operations | ( | ||||||||||||||||||||||||||||
| Net (loss) income | $ | ( | $ | ( | $ | $ | $ | ( | |||||||||||||||||||||
Diluted (loss) earnings per share (1): | |||||||||||||||||||||||||||||
| Continuing operations | $ | ( | $ | $ | $ | $ | ( | ||||||||||||||||||||||
| Discontinued operations | ( | ||||||||||||||||||||||||||||
| Net (loss) income | $ | ( | $ | ( | $ | $ | $ | ( | |||||||||||||||||||||
(1) The sum of earnings per share amounts may not equal the totals due to rounding.
86
PITNEY BOWES INC.
SCHEDULE II - VALUATION AND QUALIFYING ACCOUNTS AND RESERVES
(Dollars in thousands)
| Description | Balance at beginning of year | Additions charged to expense | Deductions | Balance at end of year | ||||||||||||||||||||||
| Valuation allowance for deferred tax asset | ||||||||||||||||||||||||||
| 2021 | $ | $ | $ | ( | $ | |||||||||||||||||||||
| 2020 | $ | $ | $ | ( | $ | |||||||||||||||||||||
| 2019 | $ | $ | $ | ( | $ | |||||||||||||||||||||
87
Serious News for Serious Traders! Try StreetInsider.com Premium Free!
You May Also Be Interested In
- Pitney Bowes Named ‘Best Employer for Diversity’ by Forbes for Sixth Consecutive Year
- ROSEN, A LEADING AND TOP RANKED LAW FIRM, Encourages Lifecore Biomedical Inc. f/k/a Landec Corporation Investors to Inquire About Securities Class Action Investigation – LFCR, LNDC
- DiCello Levitt LLP Announces Investor Class Action Lawsuit Filed Against Perion Network Ltd. (Nasdaq: Peri) and Lead Plaintiff Deadline
Create E-mail Alert Related Categories
SEC FilingsSign up for StreetInsider Free!
Receive full access to all new and archived articles, unlimited portfolio tracking, e-mail alerts, custom newswires and RSS feeds - and more!
