

Form 10-K MOTORCAR PARTS AMERICA For: Mar 31
 Tweet
Tweet Share
ShareUNITED STATES SECURITIES AND EXCHANGE COMMISSION
Washington, D.C. 20549
Form 10-K
ANNUAL REPORT PURSUANT TO SECTION 13 OR 15(d) OF THE SECURITIES EXCHANGE ACT OF 1934 |
For the fiscal year ended March 31, 2021
OR
TRANSITION REPORT PURSUANT TO SECTION 13 OR 15(d) OF THE SECURITIES EXCHANGE ACT OF 1934 |
For the transition period from _____________ to ______________
Commission File No. 001-33861
.
(Exact name of registrant as specified in its charter)
(State or other jurisdiction of incorporation or organization) |
(I.R.S. Employer Identification No.) |
|
(Address of principal executive offices) |
Zip Code |
Registrant’s telephone number, including area code: (310 ) 212-7910
Securities registered pursuant to Section 12(b) of the Act:
Title of each class |
Trading symbol(s) |
Name of each exchange on which registered |
Securities registered pursuant to Section 12(g) of the Act: None
Indicate by check mark if the registrant is a well-known seasoned issuer, as defined in Rule 405 of the Securities Act. Yes £ No R
Indicate by check mark if the registrant is not required to file reports pursuant to Section 13 or Section 15(d) of the Act. Yes £ No R
Indicate by check mark whether the registrant: (1) has filed all reports required to be filed by Section 13 or 15(d) of the Securities Exchange Act of 1934 during the preceding 12 months (or for such shorter period that the registrant was required to file such reports), and (2) has been subject to such filing requirements for the past 90 days. Yes R No £
Indicate by check mark whether the registrant has submitted electronically every Interactive Data File required to be submitted pursuant to Rule 405 of Regulation S-T during the preceding 12 months (or for such shorter period that the registrant was required to submit such files). Yes R No £
Indicate by check mark whether the registrant is a large accelerated filer, an accelerated filer, a non-accelerated filer, smaller reporting company, or an emerging growth company. See the definitions of “large accelerated filer,” “accelerated filer,” “smaller reporting company,” “emerging growth company” in Rule 12b-2 of the Exchange Act. (Check one):
Large accelerated filer ☐ |
||
Non-accelerated filer ☐ |
Smaller reporting company |
|
Emerging growth company |
If an emerging growth company, indicate by check mark if the registrant has elected not to use the extended transition period for complying with any new or revised financial accounting standards provided pursuant to Section 13(a) of the Exchange Act. ☐
Indicate by check mark whether the registrant has filed a report on and attestation to its management’s assessment of the effectiveness of its internal control over financial reporting under Section 404(b) of the Sarbanes-Oxley Act (15 U.S.C. 7262(b)) by the registered public accounting firm that prepared or issued its audit report. R
Indicate by check mark whether the registrant is a shell company (as defined in Rule 12b-2 of the Act). Yes ☐ No R
As of September 30, 2020, which was the last business day of the registrant’s most recently completed fiscal second quarter, the aggregate market value of the registrant’s common stock held by non-affiliates of the registrant was approximately $289,923,000 based on the closing sale price as reported on the NASDAQ Global Select Market.
There were 19,045,965 shares of common stock outstanding as of June 7, 2021.
DOCUMENTS INCORPORATED BY REFERENCE:
In accordance with General Instruction G (3) of Form 10-K, the information required by Part III hereof will either be incorporated into this Form 10-K by reference to the registrant’s Definitive Proxy Statement for the registrant’s next Annual Meeting of Stockholders filed within 120 days of March 31, 2021 or will be included in an amendment to this Form 10-K filed within 120 days of March 31, 2021.
PART I |
|
5 |
|
12 |
|
20 |
|
21 |
|
21 |
|
21 |
|
PART II |
|
22 |
|
24 |
|
25 |
|
42 |
|
43 |
|
43 |
|
43 |
|
44 |
|
PART III |
|
45 |
|
45 |
|
45 |
|
45 |
|
45 |
|
PART IV |
|
46 |
|
50 |
|
51 |
|
MOTORCAR PARTS OF AMERICA, INC.
GLOSSARY
The following terms are frequently used in the text of this report and have the meanings indicated below.
“Used Core” — An automobile part which has previously been used in the operation of a vehicle. Generally, the Used Core is an original equipment (“OE”) automobile part installed by the vehicle manufacturer and subsequently removed for replacement. Used Cores contain salvageable parts, which are an important raw material in the remanufacturing process. We obtain most Used Cores by providing credits to our customers for Used Cores returned to us under our core exchange programs. Our customers receive these Used Cores from consumers who deliver a Used Core to obtain credit from our customers upon the purchase of a newly remanufactured automobile part. When sufficient Used Cores are not available from our customers, we purchase Used Cores from core brokers, who are in the business of buying and selling Used Cores. The Used Cores purchased from core brokers or returned to us by our customers under the core exchange programs, and which have been physically received by us, are part of our raw material and work-in-process inventory. Used Cores returned by consumers to our customers but not yet returned to us are classified as contract assets until we physically receive these Used Cores.
“Remanufactured Core” — The Used Core underlying an automobile part that has gone through the remanufacturing process and through that process has become part of a newly remanufactured automobile part. The remanufacturing process takes a Used Core, breaks it down into its component parts, replaces those components that cannot be reused and reassembles the salvageable components of the Used Core and additional new components into a remanufactured automobile part. Remanufactured Cores held for sale at our customer locations are included in long-term contract assets. The Remanufactured Core portion of stock adjustment returns are classified as contract assets until we physically receive them.
CAUTIONARY NOTE REGARDING FORWARD-LOOKING STATEMENTS
Unless the context otherwise requires, all references in this Annual Report on Form 10-K to “the Company,” “we,” “us,” “MPA,” and “our” refer to Motorcar Parts of America, Inc. and its subsidiaries.
This Form 10-K may contain forward-looking statements within the meaning of the Private Securities Litigation Reform Act of 1995 with respect to our future performance that involve risks and uncertainties. Various factors could cause actual results to differ materially from those expressed or implied by such statements. These factors include, but are not limited to: the current and future impacts of the COVID-19 public health crisis; concentration of sales to a small number of customers; changes in the financial condition of or our relationship with any of our major customers; increases in the average accounts receivable collection period; the loss of sales to customers; delays in payments by customers; the increasing customer pressure for lower prices and more favorable payment and other terms; lower revenues than anticipated from new and existing contracts; the increasing demands on our working capital; the significant strain on working capital associated with large inventory purchases from customers; lower efficiency or production due to stay at home orders or other restrictions issued by governments due to COVID-19 concerns; any meaningful difference between expected production needs and ultimate sales to our customers; investments in operational changes or acquisitions; our ability to obtain any additional financing we may seek or require; our ability to maintain positive cash flows from operations; our failure to meet the financial covenants or the other obligations set forth in our credit agreement and the lenders’ refusal to waive any such defaults; increases in interest rates; the impact of high gasoline prices; consumer preferences and general economic conditions; increased competition in the automotive parts industry including increased competition from Chinese and other offshore manufacturers; difficulty in obtaining Used Cores and component parts or increases in the costs of those parts; supply chain delays or stoppages due to shipping delays; political, criminal or economic instability in any of the foreign countries where we conduct operations; currency exchange fluctuations; potential tariffs, unforeseen increases in operating costs; risks associated with cyber-attacks; risks associated with conflict minerals; the impact of new tax laws and interpretations thereof; uncertainties affecting our ability to estimate our tax rate and other factors discussed herein and in our other filings with the Securities and Exchange Commission (the “SEC”). These and other risks and uncertainties may cause our actual results to differ materially and adversely from those expected in any forward-looking statements. Readers are directed to risks and uncertainties identified below under “Risk Factors” and elsewhere in this report for additional detail regarding factors that may cause actual results to be different than those expressed in our forward-looking statements. Except as required by law, we undertake no obligation to revise or update publicly any forward-looking statements for any reason.
PART I
General
We are a leading supplier of automotive aftermarket non-discretionary replacement parts and test solutions and diagnostic equipment.
Consistent with our strategic vision statement to be “The Global Leader for Parts and Solutions that Move Our World Today and Tomorrow”, we have implemented a multi-pronged platform for growth in hard parts and solutions, which are discussed further in the sections below. We operate in the $130 billion market for non-discretionary automotive aftermarket replacement hard parts business in North America. Our current products in the hard parts business include a significant presence in the rotating electrical category (alternators and starters). In January 2019, we expanded our presence into the non-discretionary automotive aftermarket replacement parts for heavy-duty truck, industrial, marine and agricultural applications category with the acquisition of Dixie Electric, Ltd (“Dixie”), a privately held manufacturer and remanufacturer of alternators and starters, based in Ontario, Canada. This acquisition added an estimated $698 million market opportunity for heavy duty rotating electrical to our existing rotating electrical business.
We have a scalable infrastructure, and our growth opportunities remain abundant. Our growth strategy relating to hard parts includes growing market share in all of our existing hard parts product lines with a significant focus on our expanding line of brake products.
In addition to our hard parts business, we are focused on expanding our test solutions and diagnostic equipment for performance, endurance, and production of multiple components in the electric power train – providing simulation, emulation, and production applications for the electrification of both automotive and aerospace industries, including electric vehicle charging systems.
Our premium non-discretionary automotive aftermarket replacement parts for light-duty applications are primarily sold to automotive retail chain stores and warehouse distributors throughout North America, and to major automobile manufacturers for both their aftermarket programs and warranty replacement programs (“OES”). The current population of light-duty vehicles in the U.S. is approximately 281 million, and the average age of these vehicles is approximately 12 years and is expected to continue to grow, in particular during recession years. The aged vehicle population provides favorable opportunities for sales of our parts. Although miles driven can fluctuate for various reasons, including fuel prices, they have been generally increasing for several years prior to 2020. Demand for replacement parts generally increases with the age of vehicles and miles driven.
The automotive aftermarket is divided into two markets. The first is the do-it-yourself (“DIY”) market, which is generally serviced by the large retail chain outlets and on-line resellers. Consumers who purchase parts from the DIY channel generally install parts into their vehicles themselves. In most cases, this is a less expensive alternative than having the repair performed by a professional installer. The second is the professional installer market, commonly known as the do-it-for-me (“DIFM”) market. Traditional warehouse distributors, dealer networks, and commercial divisions of retail chains service this market. Generally, the consumer in this channel is a professional parts installer. Our products are distributed to both the DIY and DIFM markets. The distinction between these two markets has become less defined over the years, as retail outlets leverage their distribution strength and store locations to attract professional customers.
Our non-discretionary automotive aftermarket replacement parts for heavy-duty truck, industrial, marine, and agricultural applications, which have some overlap with the automotive aftermarket, are also sold via specialty distribution channels through OES, fleet, and auto electric outlets.
Our position within the test solutions and diagnostic equipment market is particularly promising, as discussed above. We have expanded our test solutions and diagnostic equipment applications for combustion engine vehicles, including bench top testers for alternators and starters, and offer test solutions and diagnostic equipment for the pre- and post-production of electric vehicles, as well as software emulation of power systems applications for the electrification of all forms of transportation, including automobiles, trucks and the emerging electrification of systems with the aerospace industry including electric vehicle charging systems. The global automotive component and powertrain test solutions and diagnostic equipment market represents a multi-billion-dollar market, and solidly establishes our growth for today and the future, as electrification becomes increasingly important around the world.
Growth Strategies and Key Initiatives
As noted above, we have a multi-pronged growth strategy: first, we are focused on growing our aftermarket hard parts business in the North American marketplace; second, we are focused on growing our leadership position in test solutions and diagnostic equipment by providing innovative and intuitive solutions to our customers; and third, we are focused on growing our electric vehicle testing business servicing original equipment manufacturers for automotive and aerospace applications on a global basis.
To accomplish our strategic vision, we are focused on the following key initiatives:
Hard Parts
| • | Grow our current product lines both with existing and potential new customers. We continue to develop and offer current and new sales programs to ensure that we are supporting our customers’ businesses. We remain dedicated to managing growth and continuing to focus on enhancements to our infrastructure and making investments in resources to support our customers. We have globally positioned manufacturing and distribution centers to support our continuous growth. |
| • | Introduction of new product lines. We continue to strive to expand our business by exploring new product lines, including working with our customers to identify potential new product opportunities. |
| • | Creating value for our customers. A core part of our strategy is ensuring that we add meaningful value for our customers. We consistently support and pilot our customers’ supply management initiatives in addition to providing demand analytics, inventory management services, online training guides, and market share and retail store layout information to our customers. |
| • | Technological innovation. We continue to expand our research and development teams as we further develop in-house technologies and advanced testing methods. This elevated level of technology aims to deliver our customers high quality products and support services. |
Test Solutions and Diagnostic Equipment
Rotating Electrical
| • | We provide industry-leading test solutions and diagnostic equipment to both the original equipment and aftermarket. We are continuously upgrading our equipment to accommodate testing for the latest alternator and starter technology for both existing and new customers. These software and hardware upgrades are also available for existing products that the customer is using. In addition, we provide industry leading maintenance and service support for our test solutions and diagnostic equipment to provide a better end-user experience and value to our customers. |
Electric Vehicle and Aerospace
| • | Market and grow our new product lines on a global basis. We offer products and services that cater to automotive test solutions and diagnostic equipment for inverter and electric motors for both development and production. In addition, we provide power supply hardware and emulation software diagnostic products. Our strategy is to market these products on a global basis to OE manufacturers as well as suppliers to the OE manufacturers for development and production of electric vehicles and electric vehicle charging systems. We believe this is a rapidly emerging business, and see the opportunity for accelerating growth rates. In addition, we are well-positioned to supply test solutions and diagnostic equipment to the aerospace industry to support its shift to electric power driven control systems in airplanes. |
Products
We carry approximately 36,000 stock keeping units (“SKUs”) to support automotive replacement parts and test solutions and diagnostic equipment. Our products are sold under our customers’ widely recognized private label brand names and our own brand names including Quality-Built®, Pure Energy™, Xtreme®, Talon®, Reliance™, D&V Electronics, Dixie Electric, DelStar®, and Select Power Source™.
Our products include (i) rotating electrical products such as alternators and starters, (ii) wheel hub assemblies and bearings, (iii) brake-related products, which include brake calipers, brake boosters, brake rotors, brake pads, and brake master cylinders, and (iv) test solutions and diagnostic equipment used for electric vehicle powertrain development and manufacturing including electric motor test systems, e-axle test systems, advanced power emulators, charging unit test systems, test systems for alternators, starters, belt starter generators and bench-top testers used by the automotive retail segment, and turbochargers.
Segment Reporting
Pursuant to the guidance provided under the Financial Accounting Standards Board (“FASB”) Accounting Standards Codification (“ASC”) for segment reporting, we have identified our chief operating decision maker (“CODM”), reviewed the documents used by the CODM, and understand how such documents are used by the CODM to make financial and operating decisions. We have determined through this review process that our business comprises three separate operating segments. Two of the operating segments meet all the aggregation criteria, and are aggregated. The remaining operating segment does not meet the quantitative thresholds for individual disclosure and we have combined our operating segments into a single reportable segment.
Sales, Marketing and Distribution
We sell our products to the largest automotive chains, including Advance (inclusive of Carquest, Autopart International, and Worldpac), AutoZone, Genuine Parts (NAPA), and O’Reilly with an aggregate of approximately 25,000 retail outlets. In addition, our products are sold to OES customers, professional installers, and a diverse group of automotive warehouse distributors. We also sell test solutions and diagnostic equipment via direct and indirect sales channels, technical conferences, and trade shows to some of the world’s best automotive companies, and to the aerospace/aviation sector. During fiscal 2021, we sold approximately 99% of our products in North America, with approximately 1% of our products sold in Asian and European countries.
We publish printed and electronic catalogs with part numbers and applications for our hard parts products along with a detailed technical glossary and informational database. In addition, we publish printed and electronic product and service brochures and data sheets for our test solutions and diagnostic equipment and service offerings. We believe that we maintain one of the most extensive catalog and product identification systems available to the market.
We primarily ship our products from our facilities and various third-party warehouse distribution centers in North America, including our 410,000 square foot distribution center in Tijuana, Mexico.
Customers: Customer Concentration. While we continually seek to diversify our customer base, we currently derive, and have historically derived, a substantial portion of our sales from a small number of large customers. Sales to our three largest customers in the aggregate represented 87%, 84%, and 83%, and sales to our largest customer, AutoZone, represented 42%, 38%, and 38% of our net sales during fiscal 2021, 2020 and 2019, respectively. Any meaningful reduction in the level of sales to any of these customers, deterioration of the financial condition of any of these customers or the loss of any of these customers could have a materially adverse impact on our business, results of operations, and financial condition.
Customer Arrangements; Impact on Working Capital. We have various length agreements with our customers. Under these agreements, which in most cases have initial terms of at least four years, we are designated as the exclusive or primary supplier for specified categories of our products. Because of the very competitive nature of the market and the limited number of customers for these products, our customers have sought and obtained price concessions, significant marketing allowances and more favorable delivery and payment terms in consideration for our designation as a customer’s exclusive or primary supplier. These incentives differ from contract to contract and can include: (i) the purchase of Remanufactured Core inventory on customer shelves, (ii) the issuance of a specified amount of credits against receivables in accordance with a schedule set forth in the relevant contract, (iii) support for a particular customer’s research or marketing efforts provided on a scheduled basis, (iv) discounts granted in connection with each individual shipment of product, and (v) store expansion or product development support. These contracts typically require that we meet ongoing performance standards. Our contracts with our customers expire at various dates through December 2024.
While these longer-term agreements strengthen our customer relationships, the increased demand for our products often requires that we increase our inventories and personnel. Customer demands that we purchase and maintain their Remanufactured Core inventory also requires the use of our working capital. The marketing and other allowances we typically grant our customers in connection with our new or expanded customer relationships adversely impact near-term revenues, profitability and associated cash flows from these arrangements. However, we believe the investment we make in these new or expanded customer relationships will improve our overall liquidity and cash flow from operations over time.
Competition
Our business is highly competitive. We compete with several large and medium-sized companies, including BBB Industries and Cardone Industries for hard parts, and AVL and Horiba for test solutions and diagnostic equipment, and a large number of smaller regional and specialty companies. We also compete with other overseas manufacturers, particularly those located in China who are increasing their operations and could become a significant competitive force in the future.
We believe that the reputations for quality, reliability, and customer service that a supplier provides are significant factors in our customers’ purchase decisions. We continuously strive to increase our competitive and technical advantages as the industry and technologies rapidly evolve. Our advanced power emulators are protected by U.S. patents that provide us a strong competitive barrier for a large segment of the market and allow us to be lower cost and more efficient.
We believe our ability to educate also helps to distinguish us from many of our competitors. We have created an online library of video courses, aimed at supporting our customers as they seek to train the next generation of technicians. We also offer live and web-based training courses via our recently created education facility within our Torrance, California headquarters. We believe our ability to provide quality replacement automotive parts, rapid and reliable delivery capabilities as well as promotional support also distinguishes us from many of our competitors. In addition, favorable pricing, our core exchange programs, and extended payment terms are also very important competitive factors in customers’ purchase decisions.
We seek to protect our proprietary processes and other information by relying on trade secret laws and non-disclosure and confidentiality agreements with certain of our employees and other persons who have access to that information.
Operations
Production Process for Non-discretionary Replacement Parts. The majority of our products are remanufactured at our facilities in Mexico, Canada, and to a lesser extent in Malaysia. We continue to maintain production of certain remanufactured units that require specialized service and/or rapid turnaround in our Torrance, California facility. We also manufacture and assemble new products at our facilities in Malaysia and India. Our remanufacturing process begins with the receipt of Used Cores from our customers or core brokers. The Used Cores are evaluated for inventory control purposes and then sorted by part number. Each Used Core is completely disassembled into its fundamental components. The components are cleaned in an environmentally sound process that employs customized equipment and cleaning materials in accordance with the required specifications of the particular component. All components known to be subject to major wear and those components determined not to be reusable or repairable are replaced by new components. Non-salvageable components of the Used Core are sold as scrap.
After the cleaning process is complete, the salvageable components of the Used Core are inspected and tested as prescribed by our IATF 16949 and ISO 9001:2015 approved quality programs, which have been implemented throughout the production processes. IATF 16949 and ISO 9001:2015 are internationally recognized, world class, quality programs. Upon passage of all tests, which are monitored by designated quality control personnel, all the component parts are assembled in a work cell into a finished product. Inspection and testing are conducted at multiple stages of the remanufacturing process, and each finished product is inspected and tested on equipment designed to simulate performance under operating conditions. To maximize remanufacturing efficiency, we store component parts ready for assembly in our production facilities.
Our remanufacturing processes combine product families with similar configurations into dedicated factory work cells. This remanufacturing process, known as “lean manufacturing,” eliminated a large number of inventory moves and the need to track inventory movement through the remanufacturing process. This lean manufacturing process has been fully implemented at our existing production facilities and we expect to implement this process at our recently acquired facilities. This manufacturing enables us to significantly reduce the time it takes to produce a finished product. We continue to explore opportunities for improving efficiencies in our remanufacturing process.
Production Process for Test Solutions and Diagnostic Equipment. Our test solutions and diagnostic equipment are engineered and manufactured in North America at facilities in Toronto, Canada and Binghamton, New York, U.S. Our facility in Canada is certified under ISO 9001:2015 quality management system, which mandates that we foster continuous improvement to our manufacturing processes. Materials for custom systems are purchased in a “just-in-time” environment while materials for standard systems are purchased in economic quantities. All materials and components are inspected and tested when required. Certain components require certificates of compliance or test results from our vendors prior to shipping to us. Our manufacturing process combines skilled labor from certified and licensed technicians with raw materials, manufactured components, purchased components, and purchased capital components to complete our test solutions and diagnostic equipment. All test solutions and diagnostic equipment are inspected and tested per our quality control program, which has been approved by the ISO 9001:2015 quality management system.
Our facility in New York, U.S., manufactures test solutions and diagnostic equipment using purchased electronic and custom components that are primarily assembled at this facility. While some circuit card assemblies are handled by outside subcontractors, most of the assemblies are manufactured in-house along with the fabrication of electronic subassemblies. Quality control and testing is completed on these subassemblies prior to their final installation into the overall equipment rack that includes mechanical, electrical and plumbing operations. Final inspection and acceptance testing are performed to predefined procedures prior to the equipment being packaged in a crate for shipment.
Used Cores. The majority of our Used Cores are obtained from customers through the core exchange programs. To supplement Used Cores received from our customers we purchase Used Cores from core brokers. Although this is not a primary source of Used Cores, it is a critical source for meeting our raw material demands. Remanufacturing consumes, on average, more than one Used Core for each remanufactured unit produced since not all Used Cores are reusable. The yield rates depend upon both the product and customer specifications.
We recycle materials, including metal from the Used Cores and corrugated packaging, in keeping with our focus of positively impacting the environment.
Purchased Finished Goods. In addition to our remanufactured goods, we also purchase finished goods from various suppliers, including several located in Asia. We perform supplier qualification, product inspection and testing according to our IATF 16949 or ISO 9001:2015 certified quality systems to assure product quality levels. We also perform periodic site audits of our suppliers’ manufacturing facilities.
Environmental, Social and Governance (ESG) and Human Capital
Our Culture. Our Company was founded in 1968 on the values of integrity, common decency and respect for others. Our core values are Excellence, Passion/Productivity, Innovation/Integrity, Community and Quality (“EPICQ”) and characterize our daily corporate focus. These values are embodied in our Code of Ethics, which has been adopted by our Board of Directors to serve as a statement of principles to guide our decision-making and reinforce our commitment to these values in all aspects of our business. We believe that our commitment to our Company, our employees and the communities within which we operate has led to high employee satisfaction and low employee turnover, and our commitment to our customers, suppliers and business partners has resulted in high customer satisfaction, as evidenced by the customer awards that we routinely win, and decades-long customer relationships.
Environmental. Environmental and sustainable processes have been our hallmark since the Company’s establishment. We take our commitment to environmental stewardship seriously. The use of Remanufactured Cores results in a substantial reduction of raw materials and energy consumption. With the potential to significantly reduce material and energy consumption, industry sources believe that remanufacturing is the most efficient and sustainable process for producing aftermarket replacement parts – making our business practices green by nature. See more information on this at investors.motorcarparts.com/esg. Highlights of our eco-friendly remanufacturing processes include:
| • | sorting the Used Cores returned by customers utilizing an innovative and efficient core-sorting process; |
| • | reconditioning and re-utilizing durable components after passing rigorous testing processes; |
| • | savings of raw materials due to a reduction in the required materials used in the remanufacturing production process, compared with new product processes; and |
| • | recycling of water, cardboard, and metal. |
Human Capital. We regard our team members as integral to our strategic growth and success. We recognize that safety, inclusion, and offering exciting opportunities are fundamental to facilitating high retention and satisfaction of high performance team members. Equally important, we provide competitive compensation and excellent benefit programs, and support numerous programs that build connections between our team members and their communities. We believe our team members share our corporate ethics and values, as demonstrated in their daily interactions with customers, co-workers, vendors, and the public at large.
As of March 31, 2021, we employed approximately 5,700 people, with 400 people in the United States and 4,800 people in Mexico, 200 people Canada, and 300 people in Malaysia. Approximately 5,300 people are production employees. We have non-union and unionized facilities. Approximately 4,700 production employees are covered by a local union. We believe we have a strong relationship with the union that represents our employees.
Our facilities are located in labor markets with readily available access to skilled and unskilled workers. Our relationship and communication with our unionized and non-represented workforce is good.
Inclusion and Diversity. We believe an inclusive workforce is critical to our success, with an ongoing focus on the hiring, retention, and advancement of women and other underrepresented ethnic groups. Our Board of Directors includes two women and four African Americans. The Company employs 33% women and 67% men globally. In the United States, 71% of our workforce are considered ethnic minorities.
Health, Safety and Wellness. The success of our business is connected to the safety and well-being of our team members and their families. We provide our employees and their families with flexible and convenient health and wellness programs – including protection and security to lessen concerns about missing work and the potential financial impact. Our programs are intended to support the physical and mental well-being with the tools and resources for employees to improve or maintain their health, and we encourage engagement in healthy behaviors for team members and their families.
In response to the COVID-19 pandemic, we implemented numerous changes in the interest of our team members. All of these changes meet and/or exceed Centers for Disease Control, World Health Organization, and other government regulations. These programs involve providing employees with flexible working arrangements – including, where appropriate, the ability to work from home, and the implementation of numerous safety policies and practices at all of our facilities. Please see the discussion in Item 7. "Management's Discussion and Analysis of Financial Condition and Results of Operations" as well as in Item 1A "Risk Factors" for further information regarding the COVID-19 pandemic.
Compensation and benefits. We provide competitive compensation and benefit programs that meet the needs of our employees, and are tailored to their local markets. In addition to wages and salaries, these programs may include annual cash bonuses, stock awards, a 401(k) Plan, healthcare, and insurance, and implemented methodologies to manage performance, provide feedback and develop talent.
Social Responsibility. We are firmly committed to social responsibility. While safety, respect, and inclusion have always been fundamental to our company, these qualities are more important than ever given the global pandemic and the impact it is having on our employees, family members, and the community at large. Medical professionals are onsite or within close proximity to our operations, and management is doing everything possible to address the challenges. In addition, our socially responsible initiatives include subsidized food programs for certain employees and donations to community organizations, sponsorship of sport teams and weekend family events, which hopefully, will become possible again as our Company and the world recovers.
Information Security and Risk Oversight
We have an information security risk program committed to regular risk management practices surrounding the protection of confidential data. This program includes various technical controls, including security monitoring, data leakage protection, network segmentation and access controls around the computer resources that house confidential or sensitive data. We have also implemented employee awareness training programs around phishing, malware, and other cyber risks. We continually evaluate the security environment surrounding the handling and control of our critical data and have instituted additional measures to help protect us from system intrusion or data breaches.
Recently, our Board of Directors appointed the Audit Committee with direct oversight to the Company’s: (i) information security policies, including periodic assessment of risk of information security breach, training program, significant threat changes and vulnerabilities and monitoring metrics and (ii) effectiveness of information security policy implementation. Our Audit Committee is comprised entirely of independent directors, one of whom has significant work experience related to information security issues or oversight. Management will report information security instances to the Audit Committee as they occur, if material, and will provide a summary multiple times per year to the Audit Committee.
Governmental Regulation
Our operations are subject to various regulations governing, among other things, emissions to air, discharge to waters, and the generation, handling, storage, transportation, treatment and disposal of waste and other materials. We believe that our businesses, operations and facilities have been and are being operated in compliance in all material respects with applicable environmental and health and safety laws and regulations, many of which provide for substantial fines and criminal sanctions for violations. Potentially significant expenditures, however, could be required in order to comply with evolving environmental and health and safety laws, regulations or requirements that may be adopted or imposed in the future.
Access to Public Information
We file annual, quarterly and current reports, proxy statements and other information with the SEC. Our SEC filings are available free of charge to the public over the Internet at the SEC’s website at www.sec.gov. In addition, our SEC filings and Code of Ethics are available free of charge on our website www.motorcarparts.com. The information contained on the websites referenced in this Form 10-K is not incorporated by reference into this filing. Further, our references to website URLs are intended to be inactive textual references only.
While we believe the risk factors described below are all the material risks currently facing our business, additional risks we are not presently aware of or that we currently believe are immaterial may also impair our business operations. Our financial condition or results of operations could be materially and adversely impacted by these risks, and the trading price of our common stock could be adversely impacted by any of these risks. In assessing these risks, you should also refer to the other information included in or incorporated by reference into this Form 10-K, including our consolidated financial statements and related notes thereto appearing elsewhere or incorporated by reference in this Form 10-K.
Risks Related to the COVID-19 Pandemic
The current pandemic from the outbreak of COVID-19 could have a material impact on our results of operations and financial condition, and the continuation of this pandemic, further outbreaks of COVID-19, or any future outbreak of other highly infectious diseases or public health emergencies could have a similar or worse impact.
The outbreak of the COVID-19 pandemic has led to adverse impacts on the U.S. and global economies and created uncertainty regarding the potential effects on our employees, supply chain, operations, and customer demand. The COVID-19 pandemic could impact our operations and the operations of our customers, suppliers, and vendors because of quarantines, facility closures, travel, and logistics restrictions. The extent to which the COVID-19 pandemic impacts us will depend on numerous factors and future developments, which are highly uncertain and cannot be predicted, including, but not limited to: (i) the severity of the virus, (ii) the occurrence and duration of additional spikes, (iii) the effects of the pandemic on customers, suppliers, and vendors, (iv) the remedial actions and stimulus measures adopted by local, state and federal governments, (v) the availability and acceptance of vaccines, and (vi) the extent to which normal economic and operating conditions can resume. Even after the COVID-19 pandemic has subsided, we may continue to experience adverse impacts to our business because of an economic recession or depression that has occurred or may occur in the future. We could experience adverse impacts from COVID-19 in a number of ways, including, but not limited to, the following which have occurred to some extent during this fiscal year:
| • | supply chain delays or stoppages due to shipping delays (cargo ship, train and truck shortages as well as staffing shortages) resulting in increased freight costs, closed supplier facilities or distribution centers, reduced workforces, scarcity of raw materials and scrutiny or embargoing of goods produced in infected areas; |
| • | reduced and/or deferred consumer demand for our products as a result of the economic downturn, during the COVID-19 pandemic; |
| • | change in demand for or availability of our products as a result of our customers modifying their restocking, fulfillment, or shipping practices; |
| • | increased raw material, and other input costs resulting from market volatility; |
| • | increased working capital needs and/or an increase in trade accounts receivable write-offs as a result of increased financial pressures on our suppliers or customers; and |
| • | fluctuations in foreign currency exchange rates or interest rates resulting from market uncertainties. |
At this time, we are unable to predict accurately the impact the COVID-19 pandemic will have on our business and financial condition, in the future.
Risks Related to Our Business and Industry
We rely on a few large customers for a majority of our business, and the loss of any of these customers, significant changes in the prices, marketing allowances or other important terms provided to any of these customers or adverse developments with respect to the financial condition of these customers could reduce our net income and operating results.
Our net sales are concentrated among a small number of large customers. Sales to our three largest customers in the aggregate represented 87%, and sales to our largest customer represented 42% of our net sales during fiscal 2021. We are under ongoing pressure from our major customers to offer lower prices, extended payment terms, increased marketing and other allowances and other terms more favorable to these customers because our sales to these customers are concentrated, and the market in which we operate is very competitive. These customer demands have put continued pressure on our operating margins and profitability, resulted in periodic contract renegotiation to provide more favorable prices and terms to these customers and significantly increased our working capital needs. In addition, this customer concentration leaves us vulnerable to any adverse change in the financial condition of these customers. Changes in terms with, significant allowances for and collections from these customers could affect our operating results and cash flows. The loss of or a significant decline in sales to any of these customers could adversely affect our business, results of operations, and financial condition.
Failure to compete effectively could reduce our market share and significantly harm our financial performance.
Our industry is highly competitive, and our success depends on our ability to compete with suppliers of automotive aftermarket products, some of which may have substantially greater financial, marketing and other resources than we do. The automotive aftermarket industry is highly competitive, and our success depends on our ability to compete with domestic and international suppliers of automotive aftermarket products. Due to the diversity of our product offering, we compete with several large and medium-sized companies, including BBB Industries and Cardone Industries for hard parts, and AVL and Horiba for test solutions and diagnostic equipment and a large number of smaller regional and specialty companies and numerous category specific competitors. In addition, we face competition from original equipment manufacturers, which, through their automotive dealerships, supply many of the same types of replacement parts we sell.
Some of our competitors may have larger customer bases and significantly greater financial, technical and marketing resources than we do. These factors may allow our competitors to:
| • | respond more quickly than we can to new or emerging technologies and changes in customer requirements by devoting greater resources than we can to the development, promotion and sale of automotive aftermarket products; |
| • | engage in more extensive research and development; and |
| • | spend more money and resources on marketing and promotion. |
In addition, other overseas competitors, particularly those located in China, are increasing their operations and could become a significant competitive force in the future. Increased competition could put additional pressure on us to reduce prices or take other actions, which may have an adverse effect on our operating results. We may also lose significant customers or lines of business to competitors.
If we do not respond appropriately, the evolution of the automotive industry could adversely affect our business.
The automotive industry is increasingly focused on the development of hybrid and electric vehicles and of advanced driver assistance technologies, with the goal of developing and introducing a commercially-viable, fully-automated driving experience. There has also been an increase in consumer preferences for mobility on demand services, such as car and ride sharing, as opposed to automobile ownership, which may result in a long-term reduction in the number of vehicles per capita. In addition, some industry participants are exploring transportation through alternatives to automobiles. These evolving areas have also attracted increased competition from entrants outside the traditional automotive industry. If we do not continue to innovate and develop, or acquire, new and compelling products that capitalize upon new technologies, such as D&V Electronics, in response to consumer preferences, this could have an adverse impact on our results of operations.
Work stoppages, production shutdowns and similar events could significantly disrupt our business.
Because the automotive industry relies heavily on just-in-time delivery of components during the assembly and manufacture of vehicles, a work stoppage or production shutdown at one or more of our manufacturing and assembly facilities could have adverse effects on our business. During fiscal 2021, we experienced multiple shutdowns at our production facilities in Mexico, Canada and Asia due to the COVID-19 pandemic, but none had a material effect on production or sales. Due to production issues, sales were deferred in some cases. Similarly, if one or more of our customers were to experience a work stoppage or production shutdown, that customer would likely halt or limit purchases of our products, which could result in the shutdown of the related manufacturing facilities. A significant disruption in the supply of key components due to a work stoppage or production shutdown at one of our suppliers or any other supplier could have the same consequences and, accordingly, have an adverse effect on our financial results.
Unfavorable economic conditions may adversely affect our business.
Adverse changes in economic conditions, including inflation, recession, increased fuel prices, tariffs, and unemployment levels, availability of consumer credit, taxation or instability in the financial markets or credit markets may either lower demand for our products or increase our operational costs, or both. In addition, elections and other changes in the political landscape could have similar effects. Such conditions may also materially impact our customers, suppliers and other parties with whom we do business. Our revenue will be adversely affected if demand for our products declines. The impact of unfavorable economic conditions may also impair the ability of our customers to pay for products they have purchased. As a result, reserves for doubtful accounts and write-offs of accounts receivables may increase and failure to collect a significant portion of amounts due on those receivables could have a material adverse effect upon our business, results of operations, and financial condition.
Interruptions or delays in obtaining component parts could impair our business and adversely affect our operating results.
In our remanufacturing processes, we obtain Used Cores, primarily through the core exchange programs with our customers, and component parts from third-party manufacturers. To supplement Used Cores received from our customers we purchase Used Cores from core brokers. Historically, the Used Core returned from customers together with purchases from core brokers have provided us with an adequate supply of Used Cores. If there was a significant disruption in the supply of Used Cores, whether as a result of increased Used Core acquisitions by existing or new competitors or otherwise, our operating activities could be materially and adversely impacted. In addition, a number of the other components used in the remanufacturing process are available from a very limited number of suppliers. We are, as a result, vulnerable to any disruption in component supply, and any meaningful disruption in this supply would materially and adversely impact our operating results.
Increases in the market prices of key component raw materials could increase the cost of our products and negatively impact our profitability.
In light of the continuous pressure on pricing which we have experienced from our large customers, we may not be able to recoup the higher costs of our products due to changes in the prices of raw materials, particularly aluminum, copper, steel, and cardboard. If we are unable to recover a substantial portion of our raw materials from Used Cores returned to us by our customers through the core exchange programs, the prices of Used Cores that we purchase may reflect the impact of changes in the cost of raw materials. Sustained raw material price increases has had a non-material impact on our product costs and profitability to date, but we are unable to determine the overall impact, in the future, at this time.
Our financial results are affected by automotive parts failure rates that are outside of our control.
Our operating results are affected over the long term by automotive parts failure rates. These failure rates are impacted by a number of factors outside of our control, including product designs that have resulted in greater reliability, the number of miles driven by consumers, and the average age of vehicles on the road. A reduction in the failure rates of automotive parts would adversely affect our sales and profitability.
Our reliance on foreign suppliers for some of the automotive parts we sell to our customers or included in our products presents risks to our business.
A significant portion of automotive parts and components we use in our remanufacturing process are imported from suppliers located outside the U.S., including China and other countries in Asia. As a result, we are subject to various risks of doing business in foreign markets and importing products from abroad, such as the following, which we have experienced in the last fiscal year:
| • | significant delays in the delivery of cargo due to port security considerations; |
| • | imposition of duties, taxes, tariffs or other charges on imports; |
| • | financial or political instability in any of the countries in which our product is manufactured; |
| • | potential recalls or cancellations of orders for any product that does not meet our quality standards; |
| • | disruption of imports by labor disputes or strikes and local business practices; |
| • | natural disasters, disease epidemics and health related concerns, which could result in closed factories, reduced workforces, scarcity of raw materials and scrutiny or embargoing of goods produced in infected areas; |
It is also possible, in the future, that we may experience the following risks related to doing business in foreign markets and importing products from abroad, such as the following:
| • | imposition of new legislation relating to import quotas or other restrictions that may limit the quantity of our product that may be imported into the U.S. from countries or regions where we do business; |
| • | political or military conflict involving the U.S., which could cause a delay in the transportation of our products and an increase in transportation costs; |
| • | heightened terrorism security concerns, which could subject imported goods to additional, more frequent or more thorough inspections, leading to delays in deliveries or impoundment of goods for extended periods; |
| • | inability of our non-U.S. suppliers to obtain adequate credit or access liquidity to finance their operations; and |
| • | our ability to enforce any agreements with our foreign suppliers. |
Any of the foregoing factors, or a combination of them, could increase the cost or reduce the supply of products available to us and materially and adversely impact our business, financial condition, results of operations or liquidity.
In addition, because we depend on independent third parties to manufacture a significant portion of our wheel hub, brake calipers, brake master cylinders, and other purchased finished goods, we cannot be certain that we will not experience operational difficulties with such manufacturers, such as reductions in the availability of production capacity, errors in complying with merchandise specifications, insufficient quality controls and failure to meet production deadlines or increases in manufacturing costs.
An increase in the cost or a disruption in the flow of our imported products may significantly decrease our sales and profits.
Merchandise manufactured offshore represents a significant portion of our total product purchases. A disruption in the shipping or cost of such merchandise may significantly decrease our sales and profits. In addition, if imported merchandise becomes more expensive or unavailable, the transition to alternative sources may not occur in time to meet our demands. Merchandise from alternative sources may also be of lesser quality and more expensive than those we currently import. Risks associated with our reliance on imported merchandise include disruptions in the shipping and importation or increase in the costs of imported products. For example, common risks include:
| • | raw material shortages; |
| • | problems with oceanic shipping, including shipping container shortages; |
| • | increased customs inspections of import shipments or other factors causing delays in shipments; and |
| • | increases in shipping rates, all of which we experienced. |
As well as the following common risks, which we may experience in the future:
| • | work stoppages; |
| • | strikes and political unrest; |
| • | economic crises; |
| • | international disputes and wars; |
| • | loss of “most favored nation” trading status by the U. S. in relations to a particular foreign country; |
| • | import duties; and |
| • | import quotas and other trade sanctions. |
Products manufactured overseas and imported into the U.S. and other countries are subject to import restrictions and duties, which could delay their delivery or increase their cost. Following an audit in fiscal 2019, the U.S. Customs and Border Protection stated that it believed that we owed additional duties of approximately $17 million from 2011 through mid-2018 relating to products that we imported from Mexico. We do not believe that this amount is correct and believe that we have numerous defenses and are disputing this amount vigorously. We cannot assure you that the U.S. Customs and Border Protection will agree or that we will not need to accrue or pay additional amounts in the future.
Our operating results may continue to fluctuate significantly.
We have experienced significant variations in our annual and quarterly results of operations. These fluctuations have resulted from many factors, including shifts in the demand and pricing for our products, general economic conditions, including changes in prevailing interest rates, and the introduction of new products. Our gross profit percentage fluctuates due to numerous factors, some of which are outside of our control. These factors include the timing and level of marketing allowances provided to our customers, actual sales during the relevant period, pricing strategies, the mix of products sold during a reporting period, and general market and competitive conditions. We also incur allowances, accruals, charges and other expenses that differ from period to period based on changes in our business, which causes our operating income to fluctuate.
Regulations related to conflict minerals could adversely impact our business.
The Dodd-Frank Wall Street Reform and Consumer Protection Act (“Dodd-Frank”) contains provisions to improve transparency and accountability concerning the supply of certain minerals, known as “conflict minerals”, originating from the Democratic Republic of Congo (“DRC”) and adjoining countries. These rules could adversely affect the sourcing, supply, and pricing of materials used in our products, as the number of suppliers who provide conflict-free minerals may be limited. We may also suffer reputational harm if we determine that certain of our products contain minerals not determined to be conflict-free or if we are unable to modify our products to avoid the use of such materials. We may also face challenges in satisfying customers who may require that our products be certified as containing conflict-free minerals.
The products we manufacture or contract to manufacture contain small quantities of Tin and Gold. We manufacture or contract to manufacture one product with small quantities of Tantalum. For the reporting year ending December 31, 2020, we increased the number of our first tier suppliers surveyed to include our undercar and brake product lines, as well as our subsidiaries. This inquiry yielded 289 smelters, refiners, or metal processing facilities for these minerals that are, or could be, in our supply chain. Of these, 68% were validated as conflict-free, per publicly available information on the Conflict Free Sourcing Initiative website. We have not been able to ascertain the conflict-free status of the remaining smelters or refiners.
Our strategy for managing risks associated with conflict minerals in products includes continuing to encourage our suppliers to engage in conflict-free sourcing and obtaining data from our suppliers that is more applicable to the products we purchase. We continue to monitor progress on industry efforts to ascertain whether some facilities that suppliers identified are actually smelters. We do not believe conflict minerals pose risk to our operations. We are a member of the Automobile Industry Action Group (AIAG) and support their efforts in the conflict minerals area.
Natural disasters or other disruptions in our business in California and Baja California, Mexico could increase our operating expenses or cause us to lose revenues.
A substantial portion of our operations are located in California and Baja California, Mexico, including our headquarters, remanufacturing and warehouse facilities. Any natural disaster, such as an earthquake, or other damage to our facilities from weather, fire or other events could cause us to lose inventory, delay delivery of orders to customers, incur additional repair-related expenses, disrupt our operations or otherwise harm our business. These events could also disrupt our information systems, which would harm our ability to manage our operations worldwide and compile and report financial information. As a result, we could incur additional expenses or liabilities or lose revenues, which could exceed any insurance coverage and would adversely affect our financial condition and results of operations.
Our past material weakness, and any future failure to maintain effective internal control over financial reporting, may affect our ability to accurately report our financial results and could materially and adversely affect the market price of our common stock.
Under the Sarbanes-Oxley Act, we must maintain effective disclosure controls and procedures and internal control over financial reporting, which requires significant resources and management oversight. Effective internal and disclosure controls are necessary for us to provide reliable financial reports and effectively prevent fraud and to operate successfully as a public company. If we cannot provide reliable financial reports or prevent fraud, our reputation and operating results would be harmed. We cannot assure you that our internal control over financial reporting will be effective in the future or that other material weakness will not be discovered in the future. Any failure to maintain effective controls or timely effect any necessary improvement of our internal and disclosure controls could harm operating results or cause us to fail to meet our reporting obligations, which could affect our ability to remain listed with the NASDAQ Global Select Market or subject us to adverse regulatory consequences. Ineffective internal and disclosure controls could also cause investors to lose confidence in our reported financial information, which would likely have a negative effect on the trading price of our stock.
Risks Related to Our Overseas Operations
Our offshore remanufacturing and logistic activities expose us to increased political and economic risks and place a greater burden on management to achieve quality standards.
Our overseas operations, especially our operations in Mexico, increase our exposure to political, criminal or economic instability in the host countries and to currency fluctuations. Risks are inherent in international operations, including:
| • | exchange controls and currency restrictions; |
| • | currency fluctuations and devaluations; |
| • | changes in local economic conditions; |
| • | repatriation restrictions (including the imposition or increase of withholding and other taxes on remittances and other payments by foreign subsidiaries); |
| • | global sovereign uncertainty and hyperinflation in certain foreign countries; |
| • | laws and regulations relating to export and import restrictions; |
| • | exposure to government actions; |
| • | increased required employment related costs; and |
| • | exposure to local political or social unrest including resultant acts of war, terrorism or similar events. |
These and other factors may have a material adverse effect on our offshore activities and on our business, results of operations and financial condition. Our overall success as a business depends substantially upon our ability to manage our foreign operations. We may not continue to succeed in developing and implementing policies and strategies that are effective in each location where we do business, and failure to do so could materially and adversely impact our business, results of operations, and financial condition.
Unfavorable currency exchange rate fluctuations could adversely affect us.
We are exposed to market risk from material movements in foreign exchange rates between the U.S. dollar and the currencies of the foreign countries in which we operate. In fiscal 2021, approximately 23% of our total expenses were in currencies other than the U.S. dollar. As a result of our extensive operations in Mexico, our primary risk relates to changes in the rates between the U.S. dollar and the Mexican peso. To mitigate this currency risk, we enter into forward foreign exchange contracts to exchange U.S. dollars for Mexican pesos. We also enter into forward foreign exchange contracts to exchange U.S. dollars for Chinese yuan in order to mitigate risk related to our purchases and payments to our Chinese vendors. The extent to which we use forward foreign exchange contracts is periodically reviewed in light of our estimate of market conditions and the terms and length of anticipated requirements. The use of derivative financial instruments allows us to reduce our exposure to the risk that the eventual net cash outflow resulting from funding the expenses of the foreign operations will be materially affected by changes in the exchange rates. We do not engage in currency speculation or hold or issue financial instruments for trading purposes. These contracts generally expire in a year or less. Any change in the fair value of foreign exchange contracts is accounted for as an increase or decrease to “foreign exchange impact of lease liabilities and forward contracts” in the consolidated statements of operations. We recorded a non-cash gain of $7,713,000 and a non-cash loss of $6,491,000 due to the change in the fair value of the forward foreign currency exchange contracts during fiscal 2021 and 2020, respectively. In addition, we recorded a gain of $9,893,000 and a loss of $11,710,000 in connection with the remeasurement of foreign currency-denominated lease liabilities during fiscal 2021 and 2020, respectively.
Changes in trade policy and other factors beyond our control could materially adversely affect our business.
The former presidential administration advocated for greater restrictions on international trade generally, including with respect to the North American Free Trade Agreement (“NAFTA”) and the World Trade Organization (the “WTO”). In December 2019, the United States, Mexico and Canada signed the amended United States-Mexico-Canada Agreement (the “USMCA”), which replaced NAFTA. In July 2020, the U.S. notified the United Nations of its intention to withdraw from the WTO. While the current presidential administration has rejoined the WTO, it remains difficult to predict what affect the USMCA, the WTO or other trade agreements and organizations will have on our business. If the U.S. were to withdraw from or materially modify any other international trade agreements to which it is a party or if the U.S. imposes significant additional tariffs on imports from China or other restrictions, it could have an adverse impact on our business.
Possible new tariffs that might be imposed by the United States government could have a material adverse effect on our results of operations.
The U.S. government has placed tariffs on certain goods imported from China and may impose new tariffs on goods imported from China and other countries, including products that we import. In retaliation, China has responded by imposing tariffs on a wide range of products imported from the U.S. and by adjusting the value of its currency. If renegotiations of existing tariffs are unsuccessful or additional tariffs or trade restrictions are implemented by the U.S. or other countries in connection with a global trade war, the resulting escalation of trade tensions could have a material adverse effect on world trade and the global economy. Even in the absence of further tariffs or trade restrictions, the related uncertainty and the market's fear of an economic slowdown could lead to a decrease in consumer spending and we may experience lower net sales than expected. Reduced net sales may result in reduced operating cash flows if we are not able to appropriately manage inventory levels or leverage expenses.
Risks Related to Our Indebtedness
Our debt can impact our operating results and cash flows and limit our operations.
As of March 31, 2021, we had $104,464,000 of debt outstanding, most of which is at variable interest rates. Fluctuations in those rates could impact our operating results and cash flows. In addition, our credit facility has covenants that limit aspects of our operations. We may also incur additional debt in the future, which could further increase our leverage, reduce our cash flow or further restrict our business.
Our lenders may not waive future defaults under our credit agreements.
Our credit agreement with our lenders contains certain financial and other covenants. If we fail to meet any of these covenants in the future, there is no assurance that our lenders will waive any such defaults. If obtained, any such waiver may impose significant costs or covenants on us.
Risks Related to Owning Our Stock
Our stock price may be volatile and could decline substantially.
Our stock price has fluctuated in the past and may decline substantially in the future as a result of developments in our business, the volatile nature of the stock market, and other factors beyond our control. Our stock price and the stock market generally has, from time to time, experienced extreme price and volume fluctuations. Many factors may cause the market price for our common stock to decline, including: (i) our operating results failing to meet the expectations of securities analysts or investors in any period, (ii) downward revisions in securities analysts’ estimates, (iii) market perceptions concerning our future earnings prospects, (iv) public or private sales of a substantial number of shares of our common stock, (v) adverse changes in general market conditions or economic trends, and (vi) market shocks generally or in our industry, such as what has recently occurred in connection with COVID-19.
General Risk Factors
We may continue to make strategic acquisitions of other companies or businesses and these acquisitions introduce significant risks and uncertainties, including risks related to integrating the acquired businesses and achieving benefits from the acquisitions.
In order to position ourselves to take advantage of growth opportunities, we have made, and may continue to make, strategic acquisitions that involve significant risks and uncertainties. These risks and uncertainties include:
| • | the difficulty in integrating newly-acquired businesses and operations in an efficient and effective manner; |
| • | the challenges in achieving strategic objectives, cost savings and other benefits from acquisitions; |
| • | the potential loss of key employees of the acquired businesses; |
| • | the risk of diverting the attention of senior management from our operations; |
| • | risks associated with integrating financial reporting and internal control systems; |
| • | difficulties in expanding information technology systems and other business processes to accommodate the acquired businesses; and |
| • | future impairments of any goodwill of an acquired business. |
We may also incur significant expenses to pursue and consummate acquisitions. Any of the foregoing, or a combination of them, could cause us to incur additional expenses and materially and adversely impact our business, financial condition, results of operations, or liquidity.
If our technology and telecommunications systems were to fail, or we were not able to successfully anticipate, invest in or adopt technological advances in our industry, it could have an adverse effect on our operations.
We rely on computer and telecommunications systems to communicate with our customers and vendors and manage our business. The temporary or permanent loss of our computer and telecommunications equipment and software systems, through casualty, operating malfunction, software virus or service provider failure, could disrupt our operations. In addition, our future growth may require additional investment in our systems to keep up with technological advances in our industry. If we are not able to invest in or adopt changes to our systems, or such upgrades take longer or cost more than anticipated, our business, financial condition and operating results may be adversely affected.
Cyber-attacks or other breaches of information technology security could adversely impact our business and operations.
The incidence of cyber-attacks and other breaches of information technology security have increased worldwide during the COVID-19 pandemic. Cyber-attacks or other breaches of network or information technology security may cause equipment failure or disruption to our operations. Such attacks, which include the use of malware, computer viruses and other means for disruption or unauthorized access, on companies have increased in frequency, scope and potential harm in recent years. While, to the best of our knowledge, we have not been subject to cyber-attacks or to other cyber incidents which, individually or in the aggregate, have been material to our operations or financial conditions, the preventive actions we take to reduce the risk of cyber incidents and protect our information technology and networks may be insufficient to repel a major cyber-attack in the future. To the extent that any disruption or security breach results in a loss or damage to our data or unauthorized disclosure of confidential information, it could cause significant damage to our reputation, affect our relationship with our customers, suppliers and employees, and lead to claims against us and ultimately harm our business. Additionally, we may be required to incur significant costs to protect against damage caused by these disruptions or security breaches in the future. While we maintain specific cyber insurance coverage, which may apply in the event of various breach scenarios, the amount of coverage may not be adequate in any particular case. Furthermore, because cyber threat scenarios are inherently difficult to predict and can take many forms, some breaches may not be covered under our cyber insurance coverage.
Weakness in conditions in the global credit markets and macroeconomic factors could adversely affect our financial condition and results of operations.
Any weakness in the credit markets could result in significant constraints on liquidity and availability of borrowing terms from lenders and accounts payable terms with vendors. Modest economic growth in most major industrial countries in the world and uncertain prospects for continued growth threaten to cause tightening of the credit markets, more stringent lending standards and terms, and higher interest rates. The persistence of these conditions could have a material adverse effect on our borrowings and the availability, terms and cost of such borrowings. In addition, deterioration in the U.S. economy could materially and adversely impact our operating results.
None.
The following sets forth the location, type of facility, square footage and ownership interest in each of our material facilities.
Location |
Type of Facility |
Approx. Square Feet |
Leased or Owned |
Expiration |
||||
Torrance, CA |
Remanufacturing, Warehouse, Administrative, and Office |
231,000 |
Leased |
March 2032 |
||||
Tijuana, Mexico |
Remanufacturing, Warehouse, and Office |
312,000 |
Leased |
August 2033 |
||||
Tijuana, Mexico |
Distribution Center and Office |
410,000 |
Leased |
December 2032 |
||||
Tijuana, Mexico |
Remanufacturing, Warehouse, and Office |
199,000 |
Leased |
December 2032 |
||||
Tijuana, Mexico |
Core Induction, Warehouse, and Office |
173,000 |
Leased |
December 2032 |
||||
Ontario, Canada |
Remanufacturing, Warehouse, and Office |
157,000 |
Leased |
May 2023 |
||||
Ontario, Canada |
Manufacturing, Warehouse, and Office |
35,000 |
Leased |
December 2022 |
||||
Singapore & Malaysia |
Remanufacturing, Warehouse, and Office |
114,000 |
Leased |
Various through December 2022 |
||||
Shanghai, China |
Warehouse and Office |
27,000 |
Leased |
March 2023 |
||||
We believe the above mentioned facilities are sufficient to satisfy our current and foreseeable operations.
We are subject to various lawsuits and claims in the normal course of business. In addition, government agencies and self-regulatory organizations have the ability to conduct periodic examinations of and administrative proceedings regarding our business. Following an audit in fiscal 2019, the U.S. Customs and Border Protection stated that it believed that we owed additional duties of approximately $17 million from 2011 through mid-2018 relating to products that we imported from Mexico. We do not believe that this amount is correct and believe that we have numerous defenses and are disputing this amount vigorously. We cannot assure you that the U.S. Customs and Border Protection will agree or that we will not need to accrue or pay additional amounts in the future.
Not applicable.
PART II
Item 5. Market for Registrant’s Common Equity, Related Stockholder Matters and Issuer Purchases of Equity Securities
Our common stock is traded on the NASDAQ Global Select Market under the trading symbol MPAA. As of June 7, 2021, there were 19,045,965 shares of common stock outstanding held by 10 holders of record.
Purchases of Equity Securities by the Issuer
Share repurchase activity during the fourth quarter of fiscal 2021 was as follows:
Periods |
Total Number of Shares Purchased |
Average Price Paid Per Share |
Total Number of Shares Purchased as Part of Publicly Announced Plans or Programs |
Approximate Dollar Value of Shares That May Yet Be Purchased Under the Plans or Programs (1) |
||||||||||||
January 1 - January 31, 2021: |
||||||||||||||||
Open market and privately negotiated purchases |
- |
$ |
- |
- |
$ |
21,308,000 |
||||||||||
February 1 - February 28, 2021: |
||||||||||||||||
Open market and privately negotiated purchases |
54,960 |
$ |
20.72 |
54,960 |
20,169,000 |
|||||||||||
March 1 - March 31, 2021: |
||||||||||||||||
Open market and privately negotiated purchases |
- |
$ |
- |
- |
20,169,000 |
|||||||||||
Total |
54,960 |
54,960 |
$ |
20,169,000 |
||||||||||||
| (1) | As of March 31, 2021, $16,831,000 of the $37,000,000 was utilized and $20,169,000 remains available to repurchase shares under the authorized share repurchase program, subject to the limit in our Credit Facility. We retired the 730,521 shares repurchased under this program through March 31, 2021. Our share repurchase program does not obligate us to acquire any specific number of shares and shares may be repurchased in privately negotiated and/or open market transactions. |
Equity Compensation Plan Information
The following summarizes our equity compensation plans as of March 31, 2021:
Plan Category |
Number of securities to be issued upon exercise of outstanding options, warrants and rights (a) |
Weighted-average exercise price of outstanding options warrants and rights (b) |
Number of securities remaining available for future issuance under equity compensation plans (excluding securities reflected in column (a)) (c) |
|||||||||
Equity compensation plans approved by security holders |
2,099,369 |
(1) |
$ |
17.51 |
(2) |
1,344,548 |
(3) |
|||||
Equity compensation plans not approved by security holders |
N/A |
N/A |
N/A |
|||||||||
Total |
2,099,369 |
$ |
17.51 |
1,344,548 |
||||||||
| (1) | Consists of (i) stock options issued under the 2004 Non-Employee Director Stock Option Plan, (ii) restricted stock units and restricted stock (collectively “RSUs”) and stock options issued under the Fourth Amended and Restated 2010 Incentive Award Plan (the “2010 Plan”), and (iii) RSUs issued under our 2014 Non-Employee Director Incentive Award Plan (the “2014 Plan”). |
| (2) | The weighted average exercise price does not reflect the shares that will be issued in connection with the settlement of RSUs, since RSUs have no exercise price. |
| (3) | Consists of shares available for future issuance under our 2010 Plan and 2014 Plan. |
Stock Performance Graph
The following graph compares the cumulative return to holders of our common stock for the five years ending March 31, 2021 with the NASDAQ Composite Total Returns Index and the Zacks Retail and Wholesale Auto Parts Index. The comparison assumes $100 was invested at the close of business on March 31, 2016 in our common stock and in each of the comparison groups, and assumes reinvestment of dividends.
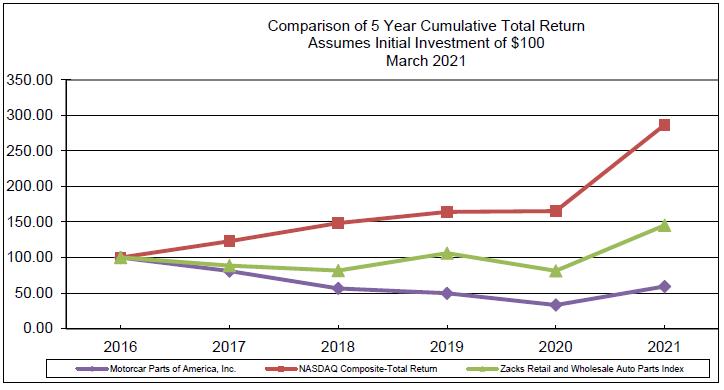
None.
The following discussion contains forward-looking statements, including, without limitation, our expectations and statements regarding our outlook and future revenues, expenses, results of operations, liquidity, plans, strategies and objectives of management and any assumptions underlying any of the foregoing. Our actual results may differ significantly from those projected in the forward-looking statements. Our forward-looking statements and factors that might cause future actual results to differ materially from our recent results or those projected in the forward-looking statements include, but are not limited to, those discussed in the section titled “Cautionary Note Regarding Forward-Looking Statements” and “Risk Factors” of this Annual Report on Form 10-K. Except as required by law, we assume no obligation to update the forward-looking statements or our risk factors for any reason.
Management Overview
We have a multi-pronged platform for growth within the non-discretionary automotive aftermarket for the replacement parts and test solutions and diagnostic equipment industry, through organic growth and acquisitions. Our investments in infrastructure and human resources, including the opening of our new 410,000 square foot distribution center, the realignment of our production sites, and the significant expansion of manufacturing capacity for multiple product lines, continues to be transformative and scalable.
New products introduced through our growth strategies include: (i) the addition of brake calipers in August 2019; (ii) alternators and starters for heavy-duty truck, industrial, marine, and agriculture applications, through an acquisition in January 2019; (iii) brake power boosters in August 2016; and (iv) turbochargers through an acquisition in July 2016. In addition, our test solutions and diagnostic equipment include: (a) the design and manufacture of test solutions and diagnostic equipment for alternators, starters, belt-start generators (stop start and hybrid technology), and electric power trains for electric vehicles through an acquisition in July 2017 and (b) the design and manufacture of advanced power emulators (AC and DC) and custom power electronic products for the automotive and aerospace industries through an acquisition in December 2018.
Impact of the Novel Coronavirus (“COVID-19”)
The COVID-19 pandemic has spread globally and created significant volatility, uncertainty and economic disruption in many countries, including the countries in which we operate. National, state and local governments in these countries have implemented a variety of measures in response that have the effect of restricting or limiting, among other activities, the operations of certain businesses.
We experienced a significant reduction in customer demand for our products during April 2020. Although the demand for our products has substantially recovered, we continue to experience disruptions with worldwide supply chain and logistics services. We are unable to predict accurately the ultimate long-term impact that COVID-19 will have on our business and financial condition. While the near-term outlook appears positive, any additional government shutdowns or additional spikes could negatively impact our business and financial condition. There have been no serious outbreaks in any of our production facilities; however, a serious outbreak could affect our production capabilities.
Our business has continued to operate as we have been declared an essential business; however, we experienced inefficiencies in our operations due to the implementation of additional personnel safety measures throughout our facilities, which negatively affects our operating efficiencies. These personnel safety measures included adding an additional shift in conjunction with reducing the number of hours in the existing shift, greater spacing (less personnel) in production areas and sanitizing procedures between shifts. High-risk employees at all of our facilities have been required to remain at home; however, they continue to receive their compensation. We also implemented safe work practices across all of our facilities, including work from home rules, staggered shifts, Plexiglas barriers, and many other safety precautions. Our employees have embraced the challenges of working remotely, continuing to operate through constant communication with team members.
Enhanced levels of communication at all levels within the organization are critical to address the ever-changing landscape brought on by COVID-19, especially with most of our office staff continuing to work from home. Such efforts have included, board check-in meetings and executive committee meetings, as needed, and regular town hall style communications with all employees.
To date, we have incurred increased costs as a result of COVID-19, including increased employee costs, such as expanded benefits and frontline incentives, and other operating costs, such as costs associated with the provision of personal protective equipment, which have negatively impacted our profitability. During fiscal 2021, these expanded benefits, supply costs and other COVID-19 related costs resulted in $7,316,000 of total expense included in cost of goods sold and operating expenses in the consolidated statements of operations. During fiscal 2021, we received $1,130,000, in payments from the Canadian Government under the Canadian Emergency Wage Subsidy program and our Asian subsidiaries received $171,000 from their local government assistance programs. These payments are recorded as a reduction of cost of goods sold and operating expenses in the consolidated statements of operations. In addition, we deferred the employer’s share of social security taxes of $1,170,000, of which $585,000 is included in accrued liabilities and $585,000 is included in other liabilities in the consolidated balance sheet at March 31, 2021.
Due to the seriousness of the COVID-19 pandemic and the unknown future impact on our business, we conserved liquidity wherever practicable, implemented a worldwide travel ban, and put additional controls on all expenses. Initially, we implemented furloughs, layoffs, and salary reductions, which were reinstated as of September 30, 2020.
Segment Reporting
Pursuant to the guidance provided under the Financial Accounting Standards Board (“FASB”) Accounting Standards Codification (“ASC”) for segment reporting, we have identified our chief operating decision maker (“CODM”), reviewed the documents used by the CODM, and understand how such documents are used by the CODM to make financial and operating decisions. We have determined through this review process that our business comprises three separate operating segments. Two of the operating segments meet all the aggregation criteria, and are aggregated. The remaining operating segment does not meet the quantitative thresholds for individual disclosure and we have combined our operating segments into a single reportable segment.
Critical Accounting Policies
We prepare our consolidated financial statements in accordance with generally accepted accounting principles, or GAAP, in the United States. Our significant accounting policies are discussed in detail below and in Note 2 of the notes to consolidated financial statements.
In preparing our consolidated financial statements, we use estimates and assumptions for matters that are inherently uncertain. We base our estimates on historical experiences and reasonable assumptions. Our use of estimates and assumptions affect the reported amounts of assets, liabilities and the amount and timing of revenues and expenses we recognize for and during the reporting period. Actual results may differ from our estimates.
Due to the COVID-19 pandemic, there has been uncertainty and disruption in the global economy and financial markets. We are not currently aware of any specific event or circumstance that would require an update to our estimates or judgments or a revision of the carrying value of our assets or liabilities as of March 31, 2021. These estimates may change, as new events occur and additional information is obtained. Actual results could differ materially from these estimates under different assumptions or conditions.
Our remanufacturing operations include core exchange programs for the core portion of the finished good. The Used Cores that we acquire and are returned to us from our customers are a necessary raw material for remanufacturing. We also offer our customers marketing and other allowances that impact revenue recognition. These elements of our business give rise to more complex accounting than many businesses our size or larger.
Recently Adopted Accounting Pronouncements
Measurement of Credit Losses on Financial Instruments
In June 2016, the FASB issued an accounting pronouncement related to the measurement of credit losses on financial instruments. This pronouncement, along with a subsequent Accounting Standards Updates (“ASU”) issued to clarify certain provisions of the new guidance, changed the impairment model for most financial assets and requires the use of an “expected loss” model for instruments measured at amortized cost. Under this model, entities will be required to estimate the lifetime expected credit loss on such instruments and record an allowance to offset the amortized cost basis of the financial asset, resulting in a net presentation of the amount expected to be collected on the financial asset. The adoption of this guidance on April 1, 2020 increased our disclosures for our expected credit losses but did not have a material effect on our consolidated financial statements.
Prior to April 1, 2020, accounts receivable were recorded at cost less an allowance for doubtful accounts. The net amount of accounts receivable and corresponding allowance for doubtful accounts were presented in the consolidated balance sheets. We maintained an allowance for uncollectible accounts receivable for estimated losses resulting from the failure or inability of our customers to make required payments. Furthermore, receivable balances were assessed quarterly for impairment and an allowance was recorded if the receivable was considered impaired. Subsequent to April 1, 2020, accounts receivable are recorded at amortized cost less an allowance for credit losses that are not expected to be recovered. The net amount of accounts receivable and corresponding allowance for credit losses are presented in the consolidated balance sheets. We maintain an allowance for credit losses resulting from the expected failure or inability of our customers to make required payments. We recognize the allowance for credit losses at inception and reassess quarterly based on the asset’s expected collectability. The allowance is based on multiple factors including historical experience with bad debts, the credit quality of the customer base, the aging of such receivables and current macroeconomic conditions, such as COVID-19, as well as expectations of conditions in the future, if applicable. Our allowance for credit losses is based on the assessment of the collectability of assets pooled together with similar risk characteristics.
We record a provision for expected credit losses using a loss-rate method based on the ratio of our historical write-offs to our average trade accounts receivable. At each reporting period, we will assess whether financial assets in a pool continue to display similar risk characteristics. If particular receivables no longer display risk characteristics that are similar to those of the receivables in the pool, we may determine that we need to move those receivables to a different pool or perform an individual assessment of expected credit losses for those specific receivables.
Fair Value Measurements
In August 2018, the FASB issued guidance which changed the disclosure requirements for fair value measurements by removing, adding and modifying certain disclosures, including the range and weighted average of significant unobservable inputs used to develop Level 3 fair value measurements. The amendments on changes in unrealized gains and losses, the range and weighted average of significant unobservable inputs used to develop Level 3 measurements, and the narrative description of measurement uncertainty are applied prospectively only for the most recent interim or annual period presented in the initial year of adoption. All other amendments should be applied retrospectively applied to all periods presented upon their effective date. The adoption of this guidance on April 1, 2020 modified certain of our disclosures for our Level 3 fair value measurements but did not have an impact on our consolidated financial statements.
Reference Rate Reform
In March 2020, the FASB issued guidance that, for a limited time, eases the potential burden in accounting for reference rate reform. The new guidance provides optional expedients and exceptions for applying GAAP to contracts, hedging relationships and other transactions affected by reference rate reform if certain criteria are met. The amendments apply only to contracts and hedging relationships that reference the London Interbank Offered Rate (“LIBOR”) or another reference rate expected to be discontinued due to reference rate reform. These amendments are effective immediately and may be applied prospectively to contract modifications made and hedging relationships entered into or evaluated on or before December 31, 2022. We will apply these amendments prospectively. The adoption of this guidance on April 1, 2020 did not have an impact on our consolidated financial statements for the year ended March 31, 2021.
Accounting Pronouncements Not Yet Adopted
Income Taxes
In December 2019, the FASB issued guidance that simplifies the accounting for income taxes, eliminates certain exceptions within ASC 740, Income Taxes, and clarifies certain aspects of the current guidance to promote consistent application. This guidance is effective for annual and interim periods in fiscal years beginning after December 15, 2020. Early adoption is permitted. The adoption of this guidance on April 1, 2021 is not expected to have any material impact on our consolidated financial statements.
Inventory
Inventory is comprised of: (i) Used Core and component raw materials, (ii) work-in-process, and (iii) remanufactured and purchased finished goods.
Used Core, component raw materials, and purchased finished goods are stated at the lower of average cost or net realizable value.
Work-in-process is in various stages of production and is valued at the average cost of Used Cores and component raw materials issued to work orders still open, including allocations of labor and overhead costs. Historically, work-in-process inventory has not been material compared to the total inventory balance.
Remanufactured finished goods include: (i) the Used Core cost and (ii) the cost of component raw materials, and allocations of labor and variable and fixed overhead costs (the “Unit Cost”). The allocations of labor and variable and fixed overhead costs are based on the actual use of the production facilities over the prior 12 months which approximates normal capacity. This method prevents the distortion in allocated labor and overhead costs that would occur during short periods of abnormally low or high production. In addition, we exclude certain unallocated overhead such as severance costs, duplicative facility overhead costs, start-up costs, training, and spoilage from the calculation and expenses these unallocated overhead as period costs. Purchased finished goods also include an allocation of fixed overhead costs.
The estimate of net realizable value is subjective and based on our judgment and knowledge of current industry demand and management’s projections of industry demand. The estimates may, therefore, be revised if there are changes in the overall market for our products or market changes that in our judgment, impact our ability to sell or liquidate potentially excess or obsolete inventory. Net realizable value is determined at least quarterly as follows:
| • | Net realizable value for finished goods by customer by product line are determined based on the agreed upon selling price with the customer for a product in the trailing 12 months. We compare the average selling price, including any discounts and allowances, to the finished goods cost of on-hand inventory less any reserve for excess and obsolete inventory. Any reduction of value is recorded as cost of goods sold in the period in which the revaluation is identified. |
| • | Net realizable value for Used Cores are determined based on current core purchase prices from core brokers to the extent that core purchases in the trailing 12 months are significant. Remanufacturing consumes, on average, more than one Used Core for each remanufactured unit produced since not all Used Cores are reusable. The yield rates depend upon both the product and customer specifications. We purchase Used Cores from core brokers to supplement our yield rates and Used Cores not returned under the core exchange programs. We also consider the net selling price our customers have agreed to pay for Used Cores that are not returned under our core exchange programs to assess whether Used Core cost exceeds Used Core net realizable value on a by customer by product line basis. Any reduction of core cost is recorded as cost of goods sold in the period in which the revaluation is identified. |
| • | We record an allowance for potentially excess and obsolete inventory based upon recent sales history, the quantity of inventory on-hand, and a forecast of potential use of the inventory. We periodically review inventory to identify excess quantities and part numbers that are experiencing a reduction in demand. Any part numbers with quantities identified during this process are reserved for at rates based upon our judgment, historical rates, and consideration of possible scrap and liquidation values which may be as high as 100% of cost if no liquidation market exists for the part. As a result of this process, we recorded reserves for excess and obsolete inventory of $13,246,000 and $13,208,000 at March 31, 2021 and 2020, respectively. |
We record vendor discounts as a reduction of inventories and are recognized as a reduction to cost of sales as the inventories are sold.
Inventory Unreturned
Inventory unreturned represents our estimate, based on historical data and prospective information provided directly by the customer, of finished goods shipped to customers that we expect to be returned, under our general right of return policy, after the balance sheet date. Inventory unreturned includes only the Unit Cost of a finished good. The return rate is calculated based on expected returns within the normal operating cycle, which is generally one year. As such, the related amounts are classified in current assets. Inventory unreturned is valued in the same manner as our finished goods inventory.
Contract Assets
Contract assets consists of: (i) the core portion of the finished goods shipped to customers, (ii) upfront payments to customers in connection with customer contracts, (iii) core premiums paid to customers, (iv) finished goods premiums paid to customers, and (v) long-term core inventory deposits.
Remanufactured Cores held at customers’ locations as a part of the finished goods sold to the customer are classified as long-term contract assets. These assets are valued at the lower of cost or net realizable value of Used Cores on hand (See Inventory above). For these Remanufactured Cores, we expect the finished good containing the Remanufactured Core to be returned under our general right of return policy or a similar Used Core to be returned to us by the customer, under our core exchange programs in each case, for credit. Remanufactured Cores and Used Cores returned by consumers to our customers but not yet returned to us are classified as “Cores expected to be returned by customers”, which are included in short-term contract assets until we physically receive them during our normal operating cycle, which is generally one year.
Upfront payments to customers represent the marketing allowances, such as sign-on bonuses, slotting fees, and promotional allowances provided to our customers. These allowances are recognized as an asset and amortized over the appropriate period of time as a reduction of revenue if we expect to generate future revenues associated with the upfront payment. If we do not expect to generate additional revenue, then the upfront payment is recognized in the consolidated statements of operations when payment occurs as a reduction of revenue. Upfront payments expected to be amortized during our normal operating cycle, which is generally one year, are classified as short-term contract assets.
Core premiums paid to customers represent the difference between the Remanufactured Core acquisition price paid to customers generally in connection with new business, and the related Used Core cost, which is treated as an asset and recognized as a reduction of revenue through the later of the date at which related revenue is recognized or the date at which the sales incentive is offered. We consider, among other things, the length of our largest ongoing customer relationships, duration of customer contracts, and the average life of vehicles on the road in determining the appropriate period of time over which to amortize these premiums. These core premiums are amortized over a period typically ranging from six to eight years, adjusted for specific circumstances associated with the arrangement. Core premiums are recorded as long-term contract assets. Core premiums expected to be amortized within our normal operating cycle, which is generally one year, are classified as short-term contract assets.
Finished goods premiums paid to customers represent the difference between the finished good acquisition price paid to customers, generally in connection with new business, and the related finished good cost, which is treated as an asset and recognized as a reduction of revenue through the later of the date at which related revenue is recognized or the date at which the sales incentive is offered. We consider, among other things, the length of our largest ongoing customer relationships, duration of customer contracts, and the average life of vehicles on the road in determining the appropriate period of time over which to amortize these premiums. Finished goods premiums are amortized over a period typically ranging from six to eight years, adjusted for specific circumstances associated with the arrangement. Finished goods premiums are recorded as long-term contract assets. Finished goods premiums expected to be amortized within our normal operating cycle, which is generally one year, are classified as short-term contract assets.
Long-term core inventory deposits represent the cost of Remanufactured Cores we have purchased from customers, which are held by the customers and remain on the customers’ premises. The costs of these Remanufactured Cores were established at the time of the transaction based on the then current cost. The selling value of these Remanufactured Cores was established based on agreed upon amounts with these customers. We expect to realize the selling value and the related cost of these Remanufactured Cores should our relationship with a customer end, a possibility that we consider remote based on existing long-term customer agreements and historical experience.
Revenue Recognition
Revenue is recognized when performance obligations under the terms of a contract with our customers are satisfied; generally, this occurs with the transfer of control of our products. Revenue is measured as the amount of consideration we expect to receive in exchange for transferring goods or providing services. Revenue is recognized net of all anticipated returns, marketing allowances, volume discounts, and other forms of variable consideration.
Revenue is recognized either when products are shipped or when delivered, depending on the applicable contract terms. Bill and hold shipments are shipped out to the customer as ex-works; in which the customer makes arrangements and is responsible for their shipping cost. No freight or shipping costs are accrued for revenue under the terms of shipments made as ex-works.
The price of a finished remanufactured product sold to customers is generally comprised of separately invoiced amounts for the Remanufactured Core included in the product (“Remanufactured Core value”) and the unit portion included in the product (“Unit Value”), for which revenue is recorded based on our then current price list, net of applicable discounts and allowances. The Remanufactured Core value is recorded as a net revenue based upon the estimate of Used Cores that will not be returned by the customer for credit. These estimates are subjective and based on management’s judgment and knowledge of historical, current, and projected return rates. As reconciliations are completed with the customers the actual rates at which Used Cores are not being returned may differ from the current estimates. This may result in periodic adjustments of the estimated contract asset and liability amounts recorded and may impact the projected revenue recognition rates used to record the estimated future revenue. These estimates may also be revised if there are changes in contractual arrangements with customers, or changes in business practices. A significant portion of the remanufactured automotive parts sold to customers are replaced by similar Used Cores sent back for credit by customers under the core exchange programs (as described in further detail below). The number of Used Cores sent back under the core exchange programs is generally limited to the number of similar Remanufactured Cores previously shipped to each customer.
Revenue Recognition — Core Exchange Programs
Full price Remanufactured Cores: When remanufactured products are shipped, certain customers are invoiced for the Remanufactured Core value of the product at the full Remanufactured Core sales price. For these Remanufactured Cores, revenue is only recognized based upon an estimate of the rate at which these customers will pay cash for Remanufactured Cores in lieu of sending back similar Used Cores for credits under the core exchange programs. The remainder of the full price Remanufactured Core value invoiced to these customers is established as a long-term contract liability rather than being recognized as revenue in the period the products are shipped as we expect these Remanufactured Cores to be returned for credit under our core exchange programs.
Nominal price Remanufactured Cores: Certain other customers are invoiced for the Remanufactured Core value of the product shipped at a nominal (generally $0.01 or less) Remanufactured Core price. For these nominal Remanufactured Cores, revenue is only recognized based upon an estimate of the rate at which these customers will pay cash for Remanufactured Cores in lieu of sending back similar Used Cores for credits under the core exchange programs. Revenue amounts are calculated based on contractually agreed upon pricing for these Remanufactured Cores for which the customers are not returning similar Used Cores. The remainder of the nominal price Remanufactured Core value invoiced to these customers is established as a long-term contract liability rather than being recognized as revenue in the period the products are shipped as we expect these Remanufactured Cores to be returned for credit under our core exchange programs.
Revenue Recognition; General Right of Return
Customers are allowed to return goods that their end-user customers have returned to them, whether or not the returned item is defective (warranty returns). In addition, under the terms of certain agreements and industry practice, customers from time to time are allowed stock adjustments when their inventory of certain product lines exceeds the anticipated sales to end-user customers (stock adjustment returns). Customers have various contractual rights for stock adjustment returns, which are typically less than 5% of units sold. In some instances, a higher level of returns is allowed in connection with significant restocking orders. The aggregate returns are generally limited to less than 20% of unit sales.
The allowance for warranty returns is established based on a historical analysis of the level of this type of return as a percentage of total unit sales. The allowance for stock adjustment returns is based on specific customer inventory levels, inventory movements, and information on the estimated timing of stock adjustment returns provided by customers. Stock adjustment returns do not occur at any specific time during the year. The return rate for stock adjustments is calculated based on expected returns within the normal operating cycle, which is generally one year.
The Unit Value of the warranty and stock adjustment returns are treated as reductions of revenue based on the estimations made at the time of the sale. The Remanufactured Core value of warranty and stock adjustment returns are provided for as indicated in the paragraph “Revenue Recognition – Core Exchange Programs”.
As is standard in the industry, we only accept returns from on-going customers. If a customer ceases doing business with us, we have no further obligation to accept additional product returns from that customer. Similarly, we accept product returns and grant appropriate credits to new customers from the time the new customer relationship is established.
Contract Liability
Contract liability consists of: (i) customer allowances earned, (ii) accrued core payments, (iii) customer core returns accruals, (iv) core bank liability, (v) finished goods liabilities, and (vi) customer deposits.
Customer allowances earned includes all marketing allowances provided to customers. Such allowances include sales incentives and concessions. Voluntary marketing allowances related to a single exchange of product are recorded as a reduction of revenues at the time the related revenues are recorded or when such incentives are offered. Other marketing allowances, which may only be applied against future purchases, are recorded as a reduction to revenues in accordance with a schedule set forth in the relevant contract. Sales incentive amounts are recorded based on the value of the incentive provided. Customer allowances to be provided to customers within our normal operating cycle, which is generally one year, are considered short-term contract liabilities and the remainder are recorded as long-term contract liabilities.
Accrued core payments represent the sales price of Remanufactured Cores purchased from customers, generally in connection with new business, which are held by these customers and remain on their premises. The sales price of these Remanufactured Cores will be realized when our relationship with a customer ends, a possibility that we consider remote based on existing long-term customer agreements and historical experience. The payments to be made to customers for purchases of Remanufactured Cores within our normal operating cycle, which is generally one year, are considered short-term contract liabilities and the remainder are recorded as long-term contract liabilities.
Customer core returns accruals represent the full and nominally priced Remanufactured Cores shipped to our customers. When we ship product, we recognize an obligation to accept a similar Used Core sent back under the core exchange programs based upon the Remanufactured Core price agreed upon by us and our customer. The contract liability related to Used Cores returned by consumers to our customers but not yet returned to us are classified as short-term contract liabilities until we physically receive these Used Cores as they are expected to be returned during our normal operating cycle, which is generally one year and the remainder are recorded as long-term contract liabilities.
The core bank liability represents the full Remanufactured Core sales price for cores returned under our core exchange programs. The payment for these returned cores are made over a contractual repayment period pursuant to our agreement with this customer. Payments to be made within our normal operating cycle, which is generally one year, are considered short-term contract liabilities and the remainder are recorded as long-term contract liabilities.
Finished goods liabilities represents the agreed upon price of finished goods acquired from customers, generally in connection with new business. The payment for these finished goods are made over a contractual repayment period pursuant to our agreement with the customer. Payments to be made within our normal operating cycle, which is generally one year, are considered short-term contract liabilities and the remainder are recorded as long-term contract liabilities.
Customer deposits represent the receipt of prepayments from customers for the obligation to transfer goods or services in the future. We classify these customer deposits as short-term contract liabilities as we expect to satisfy these obligations within our normal operating cycle, which generally one year.
Customer Finished Goods Returns Accrual
The customer finished goods returns accrual represents our estimate of our exposure to customer returns, including warranty returns, under our general right of return policy to allow customers to return items that their end user customers have returned to them and from time to time, stock adjustment returns when the customers’ inventory of certain product lines exceeds the anticipated sales to end-user customers. The customer finished goods returns accrual represents the Unit Value of the estimated returns and is classified as a current liability due to the expectation that these returns will occur within the normal operating cycle of one year. Our customer finished goods returns accrual was $31,524,000 and $25,326,000 at March 31, 2021 and 2020, respectively. The increase in the customer finished goods returns accrual resulted from higher sales during the fourth quarter of fiscal 2021 compared with the same period of the prior year.
Income Taxes
We account for income taxes using the liability method, which measures deferred income taxes by applying enacted statutory rates in effect at the balance sheet date to the differences between the tax basis of assets and liabilities and their reported amounts in the financial statements. The resulting asset or liability is adjusted to reflect changes in the tax laws as they occur. A valuation allowance is provided to reduce deferred tax assets when it is more likely than not that a portion of the deferred tax asset will not be realized.
Realization of deferred tax assets is dependent upon our ability to generate sufficient future taxable income. Significant judgment is required in determining our provision for income taxes, our deferred tax assets and liabilities and any valuation allowance recorded against our net deferred tax assets. We make these estimates and judgments about our future taxable income that are based on assumptions that are consistent with our future plans. A valuation allowance is established when we believe it is not more likely than not all or some of a deferred tax assets will be realized. In evaluating our ability to recover deferred tax assets within the jurisdiction in which they arise, we consider all available positive and negative evidence. Deferred tax assets arising primarily as a result of net operating loss carry-forwards and research and development credits in connection with our Canadian operations have been offset completely by a valuation allowance due to the uncertainty of their utilization in future periods. Should the actual amount differ from our estimate, the amount of our valuation allowance could be impacted.
We have made an accounting policy election to recognize the U.S. tax effects of global intangible low-taxed income as a component of income tax expense in the period the tax arises.
Results of Operations
The following discussion and analysis should be read together with the financial statements and notes thereto appearing elsewhere herein.
The following summarizes certain key operating data for the periods indicated:
Fiscal Years Ended March 31, |
||||||||||||
2021 |
2020 |
2019 |
||||||||||
Cash flows provided by (used in) operations |
$ |
56,089,000 |
$ |
18,795,000 |
$ |
(40,328,000 |
) |
|||||
Finished goods turnover (1) |
4.1 |
4.1 |
4.9 |
|||||||||
| (1) | Finished goods turnover is calculated by dividing the cost of goods sold for the year by the average between beginning and ending non-core finished goods inventory values, for each fiscal year. Fiscal 2020 and 2019 have been updated to conform to the current year presentation for non-core finished goods turnover. We believe that this provides a useful measure of our ability to turn our inventory into revenues. |
Fiscal 2021 Compared with Fiscal 2020
Net Sales and Gross Profit
The following summarizes net sales and gross profit:
Fiscal Years Ended March 31, |
||||||||
2021 |
2020 |
|||||||
Net sales |
$ |
540,782,000 |
$ |
535,831,000 |
||||
Cost of goods sold |
431,321,000 |
417,431,000 |
||||||
Gross profit |
109,461,000 |
118,400,000 |
||||||
Gross profit percentage |
20.2 |
% |
22.1 |
% |
||||
Net Sales. Our net sales for fiscal 2021 were $540,782,000, which represents an increase of $4,951,000, or 0.9%, from fiscal 2020 of $535,831,000. Sales for fiscal 2021 included $12,779,000 in core revenue due to a realignment of inventory at two customer distribution centers with expected future sales benefits as product mix changes. This increase in sales was partially offset by the negative impact from a number of factors related to the global COVID-19 pandemic, including disruptions with worldwide supply chain and logistics services.
Sales mix for fiscal 2021 compared with fiscal 2020 for: (i) rotating electrical products represented 72.8% compared with 73.3%, (ii) wheel hubs products represented 15.6% compared with 14.9%; (iii) brake-related products represented 9.7% compared with 8.9%; and (iv) test solutions and diagnostic equipment and other products represented 1.9% compared with 2.9%.
Gross Profit. Our gross profit was $109,461,000, or 20.2% of net sales, for fiscal 2021 compared with $118,400,000, or 22.1% of net sales, for fiscal 2020. Our gross profit was impacted by the global COVID-19 pandemic, including disruptions with worldwide supply chain, logistics services, and related higher freight costs. Higher freight costs impacted gross profit by approximately $1,785,000, or 0.3%. Additionally, our gross profit was further impacted by $5,268,000, or 1.0%, due to COVID-19 related costs for wages and personal protective equipment.
Our gross profit for fiscal 2021 and fiscal 2020 was also impacted by: (i) transition expenses in connection with the expansion of our operations in Mexico of $16,353,000 and $8,337,000, respectively, and (ii) amortization of core premiums paid to customers related to new business of $6,590,000 and $4,501,000, respectively.
In addition, gross profit was impacted by (i) a $3,561,000 benefit for revised tariff costs for fiscal 2021, (ii) non-cash quarterly revaluation of cores that are part of the finished goods on the customers’ shelves (which are included in contract assets) to the lower of cost or net realizable value and a gain due to realignment of inventory at two customer distribution centers, which resulted in a net write-down of $209,000 for fiscal 2021 compared with a write-down of $10,799,000 for fiscal 2020, (iii) customer allowances and return accruals related to new business of $408,000 and $1,065,000, and (iv) net tariff costs of $332,000 and $1,067,000 not passed through to customers for fiscal 2021 and fiscal 2020, respectively.
Our prior year gross profit was impacted by cost of $133,000 in connection with the cancellation of a customer contract.
Operating Expenses
The following summarizes operating expenses:
Fiscal Years Ended March 31, |
||||||||
2021 |
2020 |
|||||||
General and administrative |
$ |
53,847,000 |
$ |
53,224,000 |
||||
Sales and marketing |
18,024,000 |
21,037,000 |
||||||
Research and development |
8,563,000 |
9,200,000 |
||||||
Foreign exchange impact of lease liabilities and forward contracts |
(17,606,000 |
) |
18,201,000 |
|||||
Percent of net sales |
||||||||
General and administrative |
10.0 |
% |
9.9 |
% |
||||
Sales and marketing |
3.3 |
% |
3.9 |
% |
||||
Research and development |
1.6 |
% |
1.7 |
% |
||||
Foreign exchange impact of lease liabilities and forward contracts |
(3.3 |
)% |
3.4 |
% |
||||
General and Administrative. Our general and administrative expenses for fiscal 2021 were $53,847,000, which represents an increase of $623,000, or 1.2%, from fiscal 2020 of $53,224,000. The increase in general and administrative expense was primarily due to increased costs for our expansion in Mexico and other COVID-19 related costs, such as supply costs and expanded benefits to employees. In addition, our general and administrative expenses increased due to (i) $1,824,000 of increased share-based compensation expense and bonus expense due to headcount increase and improved results and (ii) $343,000 of increased expense due to changes in revaluations of contingent consideration. These increases were partially offset by (i) $3,718,000 of decreased professional services due to our concerted efforts to implement new more efficient systems and enhance our in house resources, (ii) $1,933,000 of increased gain resulting from foreign currency transactions, and (iii) $768,000 of decreased travel resulting from the COVID-19 pandemic.
Sales and Marketing. Our sales and marketing expenses for fiscal 2021 were $18,024,000, which represents a decrease of $3,013,000, or 14.3%, from fiscal 2020 of $21,037,000. The decrease in sales and marketing expense was primarily due to our cost-cutting measures in response to COVID-19. These decreases in sales and marketing expense were primarily due to (i) $1,362,000 from decreased travel, (ii) $848,000 of decreased trade shows expense, (iii) $665,000 from decreased advertising and marketing expense, and (iv) $421,000 from decreased employee-related expenses. These decreases in sales and marketing for fiscal 2021 were partially offset by $362,000 of increased commissions.
Research and Development. Our research and development expenses for fiscal 2021 were $8,563,000, which represents a decrease of $637,000, or 6.9%, from fiscal 2020 of $9,200,000. The decrease in research and development expense was primarily due to our cost-cutting measures in response to COVID-19. These decreases in research and development were primarily due to (i) $447,000 of decreased employee-related expenses, (ii) $134,000 of decreased travel, and (iii) $96,000 of decreased outside services.
Foreign Exchange Impact of Lease Liabilities and Forward Contracts. The remeasurement of our foreign currency denominated lease liabilities resulted in a non-cash gain of $9,893,000 compared with a non-cash loss of $11,710,000 for fiscal 2021 and fiscal 2020, respectively, due to movements in foreign exchange rates. In addition, the changes in the fair values of forward foreign currency exchange contracts resulted in a non-cash gain of $7,713,000 compared with a non-cash loss of $6,491,000 for fiscal 2021 and fiscal 2020, respectively.
Interest Expense
Interest Expense, net. Our interest expense, net for fiscal 2021 was $15,770,000, which represents a decrease of $9,269,000, or 37.0%, from fiscal 2020 of $25,039,000. This decrease in interest expense was primarily due to lower interest rates and lower average outstanding balances under our credit facility.
Provision for Income Taxes
Income Tax. We recorded income tax expense of $9,387,000, or an effective tax rate of 30.4%, for fiscal 2021 compared with a benefit of $1,011,000, or an effective tax rate of 12.2%, for fiscal 2020. The effective tax rate for fiscal 2021, was primarily impacted by foreign income taxed at rates that are different from the federal statutory rate and non-deductible executive compensation under Internal Revenue Code Section 162(m). In addition, the effective tax rate for fiscal 2020 was impacted by net operating loss carry-backs in connection with the CARES Act.
Fiscal 2020 Compared with Fiscal 2019
Net Sales and Gross Profit
The following summarizes net sales and gross profit:
Fiscal Years Ended March 31, |
||||||||
2020 |
2019 |
|||||||
Net sales |
$ |
535,831,000 |
$ |
472,797,000 |
||||
Cost of goods sold |
417,431,000 |
383,623,000 |
||||||
Gross profit |
118,400,000 |
89,174,000 |
||||||
Gross profit percentage |
22.1 |
% |
18.9 |
% |
||||
Net Sales. Our net sales for fiscal 2020 increased by $63,034,000, or 13.3%, to $535,831,000 compared with net sales for fiscal 2019 of $472,797,000, reflecting continued growth across all of our product lines. In addition, our net sales for fiscal 2020 were positively impacted by: (i) our expansion of automotive aftermarket brake product offerings with the introduction of brake calipers in August 2019, which contributed net sales of $28,118,000 and (ii) $19,663,000 due to the full-year impact of acquisitions completed during the latter part of fiscal 2019.
Sales mix for fiscal 2020 compared with fiscal 2019 for: (i) rotating electrical products represented 73.3% compared with 78.9%, (ii) wheel hubs products represented 14.9% compared with 15.7%; (iii) brake-related products represented 8.9% compared with 3.1%; and (iv) test solutions and diagnostic equipment and other products represented 2.9% compared with 2.3%.
Gross Profit. Our gross profit was $118,400,000, or 22.1% of net sales for fiscal 2020 compared with $89,174,000, or 18.9% of net sales for fiscal 2019.
The gross profit margin increase of 3.2% was primarily due to a lower non-cash quarterly revaluation of cores that are part of the finished goods on the customers’ shelves and lower customer allowances related to new business for fiscal 2020 as compared with fiscal 2019. The non-cash quarterly revaluation of cores that are part of the finished goods on the customers’ shelves (which are included in contract assets) to the lower of cost or net realizable value, resulted in a write-down of $10,799,000, which impacted gross margin by 2.0%, compared with $18,843,000, which impacted gross margin by 4.0%, for fiscal 2020 and fiscal 2019, respectively.
Our gross profit for fiscal 2020 and fiscal 2019 was further impacted by: (i) transition expenses in connection with the expansion of our operations in Mexico of $8,337,000 and $8,178,000, respectively, (ii) amortization of core premiums paid to customers related to new business of $4,501,000 and $4,127,000, respectively, (iii) customer allowances and return accruals related to new business of $1,065,000 and $6,042,000, respectively, and (iv) net tariff costs of $1,067,000 and $1,526,000, respectively, which were paid for products sold before price increases were effective. Gross profit for fiscal 2020 was further impacted by a cost of $133,000 incurred in connection with the cancellation of a customer contract. In addition, gross profit for fiscal 2019 was impacted by core sales of $7,753,000, less related cost of goods sold of $7,750,000, and a cost of $767,000 incurred in connection with the cancellation of a customer contract, and a cost of goods sold impact of $104,000 for inventory step-up in connection with our December 2018 acquisition.
Operating Expenses
The following summarizes operating expenses:
Fiscal Years Ended March 31, |
||||||||
2020 |
2019 |
|||||||
General and administrative |
$ |
53,224,000 |
$ |
45,000,000 |
||||
Sales and marketing |
21,037,000 |
19,542,000 |
||||||
Research and development |
9,200,000 |
8,014,000 |
||||||
Foreign exchange impact of lease liabilities and forward contracts |
18,201,000 |
972,000 |
||||||
Percent of net sales |
||||||||
General and administrative |
9.9 |
% |
9.5 |
% |
||||
Sales and marketing |
3.9 |
% |
4.1 |
% |
||||
Research and development |
1.7 |
% |
1.7 |
% |
||||
Foreign exchange impact of lease liabilities and forward contracts |
3.4 |
% |
0.2 |
% |
||||
General and Administrative. Our general and administrative expenses for fiscal 2020 were $53,224,000, which represents an increase of $8,224,000, or 18.3%, from fiscal 2019 of $45,000,000. This increase was primarily due to: (i) $2,888,000 of increased bonus and other incentives, (ii) $1,485,000 of general and administrative expenses due to the full-year impact of our fiscal 2019 acquisitions, (iii) $1,315,000 of expense in connection with our internal control remediation efforts, (iv) $1,206,000 for personnel to support our growth initiatives, (v) $1,204,000 of increased professional services, (vi) $789,000 in aggregate foreign currency transaction losses, (vii) $571,000 of increased amortization of intangible assets in connection with our fiscal 2019 acquisitions, and (viii) $544,000 of increased depreciation expense. These increases were partially offset by a decrease in share-based compensation expense of $1,423,000.
Sales and Marketing. Our sales and marketing expenses for fiscal 2020 were $21,037,000, which represents an increase of $1,495,000, or 7.7%, from fiscal 2019 of $19,542,000. The increase was due primarily to: (i) $2,261,000 of increased sales and marketing expenses due to the full-year impact of our fiscal 2019 acquisitions and (ii) $722,000 for personnel to support our growth initiatives. These increases in sales and marketing expenses were partially offset by: (i) $701,000 of decreased marketing expenses related to product changeovers in connection with new business, (ii) $401,000 of decreased trade shows expenses, and (iii) $291,000 of decreased travel.
Research and Development. Our research and development expenses for fiscal 2020 were $9,200,000, which represents an increase of $1,186,000, or 14.8%, from fiscal 2019 of $8,014,000. The increase was primarily due to: (i) $866,000 of increased research and development expenses due to the full year impact of our fiscal 2019 acquisitions and (ii) $474,000 for personnel to support our growth initiatives. These increases were partially offset by $221,000 of decreased supplies.
Foreign Exchange Impact of Lease Liabilities and Forward Contracts. The remeasurement of our foreign currency-denominated lease liabilities resulted in a non-cash loss of $11,710,000 for fiscal 2020 due to movements in foreign exchange rates. We adopted the new lease guidance on April 1, 2019. In addition, the changes in the fair values of the forward foreign currency exchange contracts resulted in non-cash losses of $6,491,000 and $972,000 for fiscal 2020 and fiscal 2019, respectively.
Interest Expense
Interest Expense, net. Our interest expense, net for fiscal 2020 was $25,039,000, which represents an increase of $1,812,000, or 7.8%, from fiscal 2019 of $23,227,000. The increase in interest expense was primarily due to increased average outstanding borrowings to support our growth initiatives, including our product line expansion and our inventory levels. The increased utilization of our accounts receivable discount programs was offset by a decrease in the weighted average discount rate from these programs.
Provision for Income Taxes
Income Tax. We recorded an income tax benefit of $1,011,000, or an effective tax rate of 12.2%, for fiscal 2020 compared with income tax expense $268,000, or an effective tax rate of (3.5%), fiscal 2019. The effective tax rate for fiscal 2020 was impacted by net operating loss carry-backs in connection with the CARES Act. In addition, the effective tax rate for each year was impacted by (i) valuation allowances, (ii) the impact of the non-deductible executive compensation under Internal Revenue Code Section 162(m), and (iii) foreign income taxed at rates that are different from the federal statutory rate.
Liquidity and Capital Resources
Overview
We had working capital (current assets minus current liabilities) of $96,725,000 and $90,624,000, a ratio of current assets to current liabilities of 1.3:1.0, at March 31, 2021 and 2020, respectively. The increase in working capital was due primarily to the buildup of our inventory to meet anticipated future demand partially offset by the associated increase in our accounts payable balances. In addition, we used cash and collections of accounts receivable balances to pay down our credit facility during fiscal 2021.
We generated cash during fiscal 2021 from operations and the use of receivable discount programs. As we manage through the impacts of the COVID-19 pandemic, we have access to our existing cash, as well as our available credit facilities to meet short-term liquidity needs. We believe our cash and cash equivalents, short-term investments, use of receivable discount programs, amounts available under our credit facility, and other sources are sufficient to satisfy our expected future working capital needs, repayment of the current portion of our term loans, and lease and capital expenditure obligations over the next 12 months.
Cash Flows
The following summarizes cash flows as reflected in the consolidated statements of cash flows:
Fiscal Years Ended March 31, |
||||||||||||
2021 |
2020 |
2019 |
||||||||||
Cash provided by (used in): |
||||||||||||
Operating activities |
$ |
56,089,000 |
$ |
18,795,000 |
$ |
(40,328,000 |
) |
|||||
Investing activities |
(14,214,000 |
) |
(11,594,000 |
) |
(22,610,000 |
) |
||||||
Financing activities |
(76,567,000 |
) |
32,153,000 |
59,936,000 |
||||||||
Effect of exchange rates on cash and cash equivalents |
599,000 |
351,000 |
(136,000 |
) |
||||||||
Net (decrease) increase in cash and cash equivalents |
$ |
(34,093,000 |
) |
$ |
39,705,000 |
$ |
(3,138,000 |
) |
||||
Additional selected cash flow data: |
||||||||||||
Depreciation and amortization |
$ |
11,144,000 |
$ |
9,561,000 |
$ |
7,329,000 |
||||||
Capital expenditures |
13,942,000 |
14,156,000 |
11,149,000 |
|||||||||
Fiscal 2021 Compared with Fiscal 2020
Net cash provided by operating activities was $56,089,000 and $18,795,000 for fiscal 2021 and fiscal 2020, respectively. The significant change in our operating activities for the current year was due to (i) increased collections of accounts receivable, (ii) the buildup of our inventory to meet anticipated future demand partially offset by the associated increase in our accounts payable balances, and (iii) increased operating results (net income plus the net add-back for non-cash transactions in earnings). In addition, our operating activities continued to be significantly impacted by our growth initiatives, including our new expanded footprint and product lines.
Net cash used in investing activities was $14,214,000 and $11,594,000 for fiscal 2021 and fiscal 2020, respectively. The change was due primarily to the redemption of short-term investments during the prior year.
Net cash used in financing activities was $76,567,000 for fiscal 2021 compared with net cash provided by financing activities $32,153,000 for fiscal 2020. The significant change in our financing activities resulted from the pay down of our debt by $71,750,000 for fiscal 2021 compared with borrowing to support our growth initiatives, including the expansion of our operations in Mexico and our product line expansion for fiscal 2020.
Fiscal 2020 Compared with Fiscal 2019
Net cash provided by operating activities was $18,795,000 during fiscal 2020 compared with net cash used in operating activities of $40,328,000 during fiscal 2019. Our operating activities were significantly impacted by our growth initiatives, including our product line expansion, and our inventory levels.
Net cash used in investing activities was $11,594,000 and $22,610,000 during fiscal 2020 and fiscal 2019, respectively. This change was due primarily to no acquisition-related activities and redemptions of short-term investments partially offset by increased purchases of plant and equipment for our current operations and the expansion of our operations in Mexico during fiscal 2020.
Net cash provided by financing activities was $32,153,000 and $59,936,000 during fiscal 2020 and fiscal 2019, respectively. The significant change in our financing activities during fiscal 2020 as compared with fiscal 2019 was due mainly to lower net borrowings under our credit facility partially offset by the payment of $1,955,000 in contingent consideration liabilities during fiscal 2020. In addition, during fiscal 2019, we used $4,062,000 for share repurchases.
Capital Resources
Debt
We are party to a $268,620,000 senior secured financing, (as amended from time to time, the “Credit Facility”) with a syndicate of lenders, and PNC Bank, National Association, as administrative agent, consisting of (i) a $238,620,000 revolving loan facility, subject to borrowing base restrictions, a $24,000,000 sublimit for borrowings by Canadian borrowers, and a $20,000,000 sublimit for letters of credit (the “Revolving Facility”) and (ii) a $30,000,000 term loan facility (the “Term Loans”). The loans under the Credit Facility mature on June 5, 2023. The Credit Facility currently permits the payment of up to $30,000,000 of dividends and share repurchases for fiscal year 2021, subject to pro forma compliance with financial covenants. In connection with the Credit Facility, the lenders have a security interest in substantially all of our assets.
The Term Loans require quarterly principal payments of $937,500. The Credit Facility bears interest at rates equal to either LIBOR plus a margin of 2.25%, 2.50% or 2.75% or a reference rate plus a margin of 1.25%, 1.50% or 1.75%, in each case depending on the senior leverage ratio as of the applicable measurement date. There is also a facility fee of 0.375% to 0.50%, depending on the senior leverage ratio as of the applicable measurement date. The interest rate on our Term Loans and Revolving Facility was 2.62% at March 31, 2021, and 4.34% and 3.64%, respectively, at March 31, 2020.
The Credit Facility, among other things, requires us to maintain certain financial covenants including a maximum senior leverage ratio and a minimum fixed charge coverage ratio. We were in compliance with all financial covenants as of March 31, 2021. Our Consolidated EBITDA for the purposes of bank covenant calculations was $73,519,000 for fiscal 2021.
On May 28, 2021, we entered into a third amendment to the Amended Credit Facility (the “Third Amendment”). The Third Amendment, among other things, (i) extends the maturity date to May 28, 2026 from June 5, 2023, (ii) modifies the fixed charge coverage ratio financial covenant, and (iii) modifies the definition of “Consolidated EBITDA”. The modifications to the financial covenants were effective as of March 31, 2021.
The following summarizes the financial covenants required under the Credit Facility:
Financial covenants required per the Credit Facility |
Calculation as of March 31, 2021 |
|||||||
Maximum senior leverage ratio |
3.00 |
1.46 |
||||||
Minimum fixed charge coverage ratio |
1.10 |
1.26 |
||||||
We had cash of $15,523,000 at March 31, 2021 and paid down our outstanding debt by $71,750,000 during fiscal 2021. In addition to other covenants, the Credit Facility places limits on our ability to incur liens, incur additional indebtedness, make loans and investments, engage in mergers and acquisitions, engage in asset sales, redeem or repurchase capital stock, alter the business conducted by us and our subsidiaries, transact with affiliates, prepay, redeem or purchase subordinated debt, and amend or otherwise alter debt agreements.
We had $84,000,000 and $152,000,000 outstanding under the Revolving Facility at March 31, 2021 and 2020, respectively. In addition, $6,193,000 was outstanding for letters of credit at March 31, 2021. At March 31, 2021, after certain contractual adjustments, $125,296,000 was available under the Revolving Facility.
Receivable Discount Programs
We use receivable discount programs with certain customers and their respective banks. Under these programs, we have options to sell those customers’ receivables to those banks at a discount to be agreed upon at the time the receivables are sold. These discount arrangements allow us to accelerate receipt of payment on customers’ receivables. While these arrangements have reduced our working capital needs, there can be no assurance that these programs will continue in the future. Interest expense resulting from these programs would increase if interest rates rise, if utilization of these discounting arrangements expands, if customers extend their payment to us, or if the discount period is extended to reflect more favorable payment terms to customers.
The following is a summary of the receivable discount programs:
Fiscal Years Ended March 31, |
||||||||
2021 |
2020 |
|||||||
Receivables discounted |
$ |
491,285,000 |
$ |
461,484,000 |
||||
Weighted average days |
334 |
346 |
||||||
Weighted average discount rate |
2.1 |
% |
3.3 |
% |
||||
Amount of discount as interest expense |
$ |
9,513,000 |
$ |
14,780,000 |
||||
Off-Balance Sheet Arrangements
At March 31, 2021, we had no off-balance sheet financing or other arrangements with unconsolidated entities or financial partnerships (such as entities often referred to as structured finance or special purpose entities) established for purposes of facilitating off-balance sheet financing or other debt arrangements or for other contractually narrow or limited purposes.
Multi-year Customer Agreements
We have or are renegotiating long-term agreements with many of our major customers. Under these agreements, which in most cases have initial terms of at least four years, we are designated as the exclusive or primary supplier for specified categories of our products. Because of the very competitive nature of the market and the limited number of customers for these products, our customers have sought and obtained price concessions, significant marketing allowances and more favorable delivery and payment terms in consideration for our designation as a customer’s exclusive or primary supplier. These incentives differ from contract to contract and can include (i) the issuance of a specified amount of credits against receivables in accordance with a schedule set forth in the relevant contract, (ii) support for a particular customer’s research or marketing efforts provided on a scheduled basis, (iii) discounts granted in connection with each individual shipment of product, and (iv) other marketing, research, store expansion or product development support. These contracts typically require that we meet ongoing performance standards. Our contracts with our customers expire at various dates through December 2024.
While these longer-term agreements strengthen our customer relationships, the increased demand for our products often requires that we increase our inventories and personnel. Customer demands that we purchase their Remanufactured Core inventory also require the use of our working capital. The marketing and other allowances we typically grant our customers in connection with our new or expanded customer relationships adversely impact the near-term revenues, profitability and associated cash flows from these arrangements. However, we believe the investment we make in these new or expanded customer relationships will improve our overall liquidity and cash flow from operations over time.
Share Repurchase Program
Our board of directors approved a stock repurchase program of up to $37,000,000 of our common stock. During fiscal 2021 and 2019, we repurchased 54,960 and 163,815 shares of our common stock, respectively, for $1,139,000 and $4,062,000, respectively. During fiscal 2020 we did not repurchase any shares of our common stock. As of March 31, 2021, $16,831,000 was utilized and $20,169,000 remains available to repurchase shares under the authorized share repurchase program, subject to the limit in our Credit Facility. We retired the 730,521 shares repurchased under this program through March 31, 2021. Our share repurchase program does not obligate us to acquire any specific number of shares and shares may be repurchased in privately negotiated and/or open market transactions.
Subsequent Event
Credit Facility
On May 28, 2021, we entered into a third amendment to the Amended Credit Facility (the “Third Amendment”). The Third Amendment, among other things, (i) extends the maturity date to May 28, 2026 from June 5, 2023, (ii) modifies the fixed charge coverage ratio financial covenant, and (iii) modifies the definition of “Consolidated EBITDA”. The modifications to the financial covenants were effective as of March 31, 2021.
Capital Expenditures and Commitments
Our total capital expenditures, including capital leases and non-cash capital expenditures, were $16,806,000 for fiscal 2021 and $19,511,000 for fiscal 2020. These capital expenditures primarily include the purchase of equipment for our current operations and the expansion of our operations in Mexico. We expect to incur approximately $12,300,000 of capital expenditures for our current operations and approximately $4,000,000 for continued expansion of our operations in Mexico during fiscal 2022. We have used and expect to continue using our working capital and additional capital lease obligations to finance these capital expenditures.
Contractual Obligations
The following summarizes our contractual obligations and other commitments as of March 31, 2021 and the effect such obligations could have on our cash flows in future periods:
Less than |
1 to 3 |
3 to 5 |
More than 5 |
|||||||||||||||||
Contractual Obligations |
Total |
1 year |
years |
years |
years |
|||||||||||||||
Finance lease obligations (1) |
$ |
8,343,000 |
$ |
2,962,000 |
$ |
3,853,000 |
$ |
1,528,000 |
$ |
- |
||||||||||
Operating lease obligations (2) |
127,006,000 |
10,406,000 |
21,156,000 |
20,344,000 |
75,100,000 |
|||||||||||||||
Revolving loan (3) |
84,000,000 |
- |
- |
- |
84,000,000 |
|||||||||||||||
Term loan (4) |
22,109,000 |
4,282,000 |
8,152,000 |
7,791,000 |
1,884,000 |
|||||||||||||||
Accrued core payment (5) |
8,062,000 |
6,358,000 |
1,408,000 |
296,000 |
- |
|||||||||||||||
Core bank liability (6) |
20,184,000 |
2,018,000 |
4,036,000 |
4,036,000 |
10,094,000 |
|||||||||||||||
Finished goods liabilities (7) |
4,700,000 |
1,958,000 |
2,742,000 |
- |
- |
|||||||||||||||
Unrecognized tax benefits (8) |
- |
- |
- |
- |
- |
|||||||||||||||
Other long-term obligations (9) |
64,025,000 |
25,874,000 |
15,542,000 |
9,656,000 |
12,953,000 |
|||||||||||||||
Total |
$ |
338,429,000 |
$ |
53,858,000 |
$ |
56,889,000 |
$ |
43,651,000 |
$ |
184,031,000 |
||||||||||
| (1) | Finance lease obligations represent amounts due under finance leases for various types of equipment. |
| (2) | Operating lease obligations represent amounts due for rent under our leases for all our facilities, certain equipment, and our Company automobile. During the first quarter of fiscal 2022, we renewed the lease for our corporate headquarters in Torrance, California for an additional 10-year period. We have included the future minimum lease payments of this renewal as a contractual obligation although this lease was not included in the operating lease assets and operating lease liabilities as of March 31, 2021. |
| (3) | Our revolving loan obligations are under our current Credit Facility that matures on June 5, 2023. On May 28, 2021, we entered into the Third Amendment, which among other things, extended the maturity date of the Credit Facility to May 28, 2026 from June 5, 2023. Accordingly, we have reflected the maturity date in the payments of contractual obligations above. This debt is classified as a short term liability on our balance sheet as we expect to use our working capital to repay the amounts outstanding under our revolving loan. |
| (4) | Term loan obligations represent the amounts due for principal payments as well as interest payments to be made. Interest payments were calculated based upon the interest rate for our term loan using the LIBOR option at March 31, 2021, which was 2.62%. On May 28, 2021, we entered into the Third Amendment, which among other things, extended the maturity date of the Credit Facility to May 28, 2026 from June 5, 2023. Accordingly, we have reflected the payment of our term loan through this date. |
| (5) | Accrued core payment represents the amounts due for principal of $7,757,000 and interest payments of $305,000 to be made in connection with the purchases of Remanufactured Cores from our customers, which are held by these customers and remain on their premises. |
| (6) | The core bank liability represents the amounts due for principal of $18,488,000 and interest payments of $1,696,000 to be made in connection with the return of Used Cores from our customers. |
| (7) | Finished goods liabilities represents the amounts due for principal of $4,561,000 and interest payments of $139,000 to be made in connection with the purchase of finished goods from our customers. |
| (8) | We are unable to reliably estimate the timing of future payments related to uncertain tax position liabilities at March 31, 2021; therefore, future tax payment accruals related to uncertain tax positions in the amount of $1,104,000 have been excluded from the table above. |
| (9) | Other long-term obligations represent commitments we have with certain customers to provide marketing allowances in consideration for multi-year customer agreements to provide products over a defined period. We are not obligated to provide these marketing allowances should our business relationships end with these customers. |
Our primary market risk relates to changes in interest rates, foreign currency exchange rates, and customer credit. We do not enter into derivatives or other financial instruments for trading or speculative purposes. As our overseas operations expand, our exposure to the risks associated with foreign currency fluctuations will continue to increase.
Interest rate risk
We are exposed to changes in interest rates primarily as a result of our borrowing and receivable discount programs, which have interest costs that vary with interest rate movements. Our credit facility bears interest at variable base rates, plus an applicable margin. At March 31, 2021, our net debt obligations totaled $104,464,000. If interest rates were to increase 1%, our net annual interest expense would have increased by approximately $1,045,000. In addition, for each $10,000,000 of accounts receivable we discount over a period of 180 days, a 1% increase in interest rates would increase our interest expense by $50,000.
Foreign currency risk
We are exposed to foreign currency exchange risk inherent in our anticipated purchases and expenses denominated in currencies other than the U.S. dollar. We transact business in the following foreign currencies; Mexican pesos, Malaysian ringgit, Singapore dollar, Chinese yuan, and the Canadian dollar. Our primary currency risks result from fluctuations in the value of the Mexican peso and to a lesser extent the Chinese yuan. To mitigate these risks, we enter into forward foreign currency exchange contracts to exchange U.S. dollars for these foreign currencies. The extent to which we use forward foreign currency exchange contracts is periodically reviewed in light of our estimate of market conditions and the terms and length of anticipated requirements. The use of derivative financial instruments allows us to reduce our exposure to the risk that the eventual net cash outflow resulting from funding the expenses of the foreign operations will be materially affected by changes in exchange rates. These contracts generally expire in a year or less. Any changes in the fair values of our forward foreign currency exchange contracts are reflected in current period earnings. Based upon our forward foreign currency exchange contracts related to these currencies, an increase of 10% in exchange rates at March 31, 2021 would have increased our operating expenses by approximately $3,932,000. During fiscal 2021 and fiscal 2020, a gain of $7,713,000 and a loss of $6,491,000, respectively, was recorded due to the change in the value of the forward foreign currency exchange contracts subsequent to entering into the contracts. In addition, we recorded a gain of $9,893,000 and a loss of $11,710,000 in connection with the remeasurement of foreign currency-denominated lease liabilities during fiscal 2021 and fiscal 2020, respectively.
Credit Risk
We regularly review our accounts receivable and allowance for credit losses by considering factors such as historical experience, credit quality and age of the accounts receivable, and the current economic conditions that may affect a customer’s ability to pay such amounts owed to us. The majority of our sales are to leading automotive aftermarket parts suppliers. We believe the credit risk with respect to trade accounts receivable is limited due to our credit evaluation process and the nature of our customers. However, should our customers experience significant cash flow problems, our financial position and results of operations could be materially and adversely affected, and the maximum amount of loss that would be incurred would be the outstanding receivable balance, Used Cores expected to be returned by customers, and the value of the Remanufactured Cores held at customers’ locations. We maintain an allowance for credit losses that, in our opinion, provides for an adequate reserve to cover losses that may be incurred.
The information required by this item is set forth in the consolidated financial statements, commencing on page F-1 included herein.
None.
Evaluation of Disclosure Controls and Procedures
Management, with the participation of our Chief Executive Officer (“CEO”), Chief Financial Officer (“CFO”) and Chief Accounting Officer (“CAO”), has evaluated the effectiveness of our disclosure controls and procedures (as defined in Rules 13a- 15(e) and 15d-15(e) under the Securities Exchange Act of 1934, as amended, or the “Exchange Act,”) as of the end of the period covered by this Annual Report on Form 10-K.
Our disclosure controls and procedures are designed to provide reasonable assurance that information we are required to disclose in the reports we file or submit under the Exchange Act is accumulated and communicated to our management, including our CEO, CFO and CAO, as appropriate to allow timely decisions regarding required disclosures, and is recorded, processed, summarized, and reported within the time periods specified in the SEC’s rules and forms. Based on this evaluation, our CEO, CFO and CAO have concluded that our disclosure controls and procedures were effective at the reasonable assurance level as of March 31, 2021.
Management’s Annual Report on Internal Control over Financial Reporting
Management is responsible for establishing and maintaining adequate internal control over financial reporting, as defined in Rules 13a-15(f) and 15d- 15(f) under the Exchange Act. Our internal control over financial reporting is a process designed to provide reasonable assurance regarding the reliability of financial reporting and the preparation of our financial statements for external purposes in accordance with generally accepted accounting principles.
Management assessed the effectiveness of our internal control over financial reporting as of March 31, 2021 using the criteria set forth by the Committee of Sponsoring Organizations of the Treadway Commission in Internal Control—Integrated Framework (2013). Based on its assessment, our management, including our CEO and CFO, has concluded that our internal control over financial reporting was effective as of March 31, 2021.
The effectiveness of our internal control over financial reporting as of March 31, 2021 has been audited by the Company’s independent registered public accounting firm, Ernst & Young LLP. Their assessment is included in the accompanying Report of Independent Registered Public Accounting Firm on Internal Control over Financial Reporting.
Change in Internal Control Over Financial Reporting
There was no change in our internal control over financial reporting (as defined in Rules 13a-15(f) and 15d-15(f) under the Exchange Act) identified in connection with the evaluation of our internal control performed during the period covered by this report, that has materially affected, or is reasonably likely to materially affect, our internal control over financial reporting.
Inherent Limitations on Effectiveness of Controls
Management recognizes that a control system, no matter how well conceived and operated, can provide only reasonable, not absolute, assurance that the objectives of the control system are met. Further, the design of a control system must reflect the fact that there are resource constraints, and the benefits of controls must be considered relative to their costs. Because of the inherent limitations in all control systems, no evaluation of controls can provide absolute assurance that all control issues and instances of fraud or error, if any, have been detected. These inherent limitations include the realities that judgments in decision making can be faulty, and that breakdowns can occur because of a simple error or mistake.
Additionally, controls can be circumvented by the individual acts of some persons, by collusion of two or more people, or by management override of the controls. The design of any system of controls also is based in part upon certain assumptions about the likelihood of future events, and there can be no assurance that any design will succeed in achieving its stated goals under all potential future conditions; over time, controls may become inadequate because of changes in conditions, or the degree of compliance with policies or procedures may deteriorate. Because of the inherent limitations in a cost-effective control system, misstatements due to error or fraud may occur and not be detected.
None.
PART III
The information required by this item is incorporated by reference to our Definitive Proxy Statement in connection with our next Annual Meeting of Stockholders (the “Proxy Statement”).
The information required by this item is incorporated by reference to the Proxy Statement.
Item 12. Security Ownership of Certain Beneficial Owners and Management and Related Stockholder Matters
The information required by this item is incorporated by reference to the Proxy Statement.
The information required by this item is incorporated by reference to the Proxy Statement.
The information required by this item is incorporated by reference to the Proxy Statement.
PART IV
| a. | Documents filed as part of this report: |
| (1) | Index to Consolidated Financial Statements: |
Reports of Independent Registered Public Accounting Firm |
53 |
Consolidated Balance Sheets |
F-1 |
Consolidated Statements of Operations |
F-2 |
Consolidated Statements of Comprehensive Income (Loss) |
F-3 |
Consolidated Statements of Shareholders’ Equity |
F-4 |
Consolidated Statements of Cash Flows |
F-5 |
Notes to Consolidated Financial Statements |
F-6 |
(2) Schedules.
Schedule II — Valuation and Qualifying Accounts |
S-1 |
| (3) | Exhibits: |
Number |
Description of Exhibit |
Method of Filing |
||
3.1 |
Certificate of Incorporation of the Company |
Incorporated by reference to Exhibit 3.1 to the Company’s Registration Statement on Form SB-2 declared effective on March 22, 1994 (the “1994 Registration Statement”). |
||
3.2 |
Amendment to Certificate of Incorporation of the Company |
Incorporated by reference to Exhibit 3.2 to the Company’s Registration Statement on Form S-1 (No. 33-97498) declared effective on November 14, 1995 (the “1995 Registration Statement”). |
||
3.3 |
Amendment to Certificate of Incorporation of the Company |
|||
3.4 |
Amendment to Certificate of Incorporation of the Company |
|||
3.5 |
Amendment to Certificate of Incorporation of the Company |
|||
3.6 |
Amended and Restated By-Laws of the Company |
|||
3.7 |
Certificate of Amendment of the Certificate of Incorporation of the Company |
|||
3.8 |
Amendment to the Amended and Restated By-Laws of the Company |
Number |
Description of Exhibit |
Method of Filing |
||
3.9 |
Amendment to the Amended and Restated By-Laws of the Company |
|||
4.1 |
2004 Non-Employee Director Stock Option Plan |
|||
4.2 |
2010 Incentive Award Plan |
|||
4.3 |
Amended and Restated 2010 Incentive Award Plan |
|||
4.4 |
Second Amended and Restated 2010 Incentive Award Plan |
|||
4.5 |
2014 Non-Employee Director Incentive Award Plan |
|||
4.6 |
Third Amended and Restated 2010 Incentive Award Plan |
|||
4.7 |
Fourth Amended and Restated 2010 Incentive Award Plan |
|||
10.1 |
Form of Indemnification Agreement for officers and directors |
|||
10.2 |
Amended and Restated Employment Agreement, dated as of December 31, 2008, by and between the Company and Selwyn Joffe |
|||
10.3 |
Employment Agreement, dated as of May 18, 2012, between Motorcar Parts of America, Inc., and Selwyn Joffe |
|||
10.4 |
Form of Stock Option Notice for use in connection with stock options granted to Selwyn Joffe pursuant to the Motorcar Parts of America, Inc. 2010 Incentive Award Plan |
|||
10.5 |
Form of Stock Option Agreement for use in connection with stock options granted to Selwyn Joffe pursuant to the Motorcar Parts of America, Inc. 2010 Incentive Award Plan |
Number |
Description of Exhibit |
Method of Filing |
||
10.6* |
Revolving Credit, Term Loan and Security Agreement, dated as of June 3, 2015, among Motorcar Parts of America, Inc., each lender from time to time party thereto, and PNC Bank, National Association, as administrative agent |
|||
10.7 |
First Amendment to Revolving Credit, Term Loan and Security Agreement, dated as of November 5, 2015, among Motorcar Parts of America, Inc., each lender from time to time party thereto, and PNC Bank, National Association, as administrative agent |
|||
10.8 |
Consent and Second Amendment to Revolving Credit, Term Loan and Security Agreement, dated as of May 19, 2016, among Motorcar Parts of America, Inc., each lender from time to time party thereto, and PNC Bank, National Association, as administrative agent |
|||
10.9 |
Third Amendment to Revolving Credit, Term Loan and Security Agreement, dated as of March 24, 2017, among Motorcar Parts of America, Inc., each lender from time to time party thereto, and PNC Bank, National Association, as administrative agent |
|||
10.10 |
Fourth Amendment to Revolving Credit, Term Loan and Security Agreement, dated as of April 24, 2017, among Motorcar Parts of America, Inc., each lender from time to time party thereto and PNC Bank, National Association, as administrative agent |
|||
10.11 |
Fifth Amendment to Revolving Credit, Term Loan and Security Agreement, dated as of July 18, 2017, among Motorcar Parts of America, Inc., each lender from time to time party thereto and PNC Bank, National Association, as administrative agent |
|||
10.12* |
Amended and Restated Credit Facility, dated as of June 5, 2018, among Motorcar Parts of America, Inc., each lender from time to time party thereto and PNC Bank, National Association, as administrative agent |
Number |
Description of Exhibit |
Method of Filing |
||
10.13 |
First Amendment to Amended and Restated Loan Agreement, dated as of November 14, 2018, among Motorcar Parts of America, Inc., D & V Electronics Ltd., each lender from time to time party thereto, and PNC Bank, National Association, as administrative agent |
|||
10.14 |
Amendment No. 2 to Employment Agreement, dated as of February 5, 2019, between Motorcar Parts of America, Inc., and Selwyn Joffe |
|||
10.15 |
Second Amendment to Amended and Restated Loan Agreement, dated as of June 4, 2019, among Motorcar Parts of America, Inc., D&V Electronics Ltd., Dixie Electric Ltd., Dixie Electric Inc., each lender from time to time party thereto, and PNC Bank, National Association, as administrative agent |
|||
10.16 |
Amendment No. 3 to Employment Agreement, dated as of March 30, 2020, between Motorcar Parts of America, Inc., and Selwyn Joffe |
|||
10.17 |
Amendment No. 4 to Employment Agreement, dated as of May 21, 2020, between Motorcar Parts of America, Inc., and Selwyn Joffe |
|||
10.18 |
Third Amendment to Amended and Restated Loan Agreement, dated as of May 28, 2021, among Motorcar Parts of America, Inc., D&V Electronics Ltd., Dixie Electric Ltd., Dixie Electric Inc., each lender from time to time party thereto, and PNC Bank, National Association, as administrative agent |
|||
List of Subsidiaries |
Filed herewith. |
|||
Consent of Independent Registered Public Accounting Firm Ernst & Young LLP |
Filed herewith. |
Number |
Description of Exhibit |
Method of Filing |
||
Certification of Chief Executive Officer pursuant to Section 302 of the Sarbanes Oxley Act of 2002 |
Filed herewith. |
|||
Certification of Chief Financial Officer pursuant to Section 302 of the Sarbanes Oxley Act of 2002 |
Filed herewith. |
|||
Certification of Chief Accounting Officer pursuant to Section 302 of the Sarbanes Oxley Act of 2002 |
Filed herewith. |
|||
Certifications of Chief Executive Officer, Chief Financial Officer and Chief Accounting Officer pursuant to Section 906 of the Sarbanes Oxley Act of 2002 |
Filed herewith. |
|||
101.INS |
Inline XBRL Instance Document (the instance document does not appear in the Interactive Data File because its XBRL tags are embedded within the XBRL document) |
Filed herewith. |
||
101.SCM |
Inline XBRL Taxonomy Extension Schema Document |
Filed herewith. |
||
101.CAL |
Inline XBRL Taxonomy Extension Calculation Linkbase Document |
Filed herewith. |
||
101.DEF |
Inline XBRL Taxonomy Extension Definition Linkbase Document |
Filed herewith. |
||
101.LAB |
Inline XBRL Taxonomy Extension Label Linkbase Document |
Filed herewith. |
||
101.PRE |
Inline XBRL Taxonomy Extension Presentation Linkbase Document |
Filed herewith. |
||
104 |
Cover Page Interactive Data File (formatted as inline XBRL and contained in Exhibit 101) |
Filed herewith. |
* Portions of this exhibit have been granted confidential treatment by the SEC.
The agreements and other documents filed as exhibits to this report are not intended to provide factual information or other disclosure other than with respect to the terms of the agreements or other documents themselves, and you should not rely on them for that purpose. In particular, any representations and warranties made by us in those agreements or other documents were made solely within the specific context of the relevant agreement or document and may not describe the actual state of affairs as of the date they were made or at any other time.
None.
Pursuant to the requirements of Section 15(d) of the Securities Exchange Act of 1934, the Registrant has duly caused this report to be signed on its behalf by the undersigned, thereunto duly authorized.
MOTORCAR PARTS OF AMERICA, INC. |
||
Dated: June 14, 2021 |
By: |
/s/ David Lee |
David Lee |
||
Chief Financial Officer |
||
Dated: June 14, 2021 |
By: |
/s/ Kamlesh Shah |
Kamlesh Shah |
||
Chief Accounting Officer |
||
Pursuant to the requirements of the Securities Exchange Act of 1934, this Report on Form 10-K has been signed by the following persons on behalf of the Registrant in the capacities and on the dates indicated:
/s/ Selwyn Joffe |
Chief Executive Officer and Director |
June 14, 2021 |
|
Selwyn Joffe |
(Principal Executive Officer) |
||
/s/ David Lee |
Chief Financial Officer |
June 14, 2021 |
|
David Lee |
(Principal Financial Officer) |
||
/s/ Kamlesh Shah |
Chief Accounting Officer |
June 14, 2021 |
|
Kamlesh Shah |
(Principal Accounting Officer) |
||
/s/ Scott Adelson |
Director |
June 14, 2021 |
|
Scott Adelson |
|||
/s/ Rudolph Borneo |
Director |
June 14, 2021 |
|
Rudolph Borneo |
|||
/s/ Philip Gay |
Director |
June 14, 2021 |
|
Philip Gay |
|||
/s/ Duane Miller |
Director |
June 14, 2021 |
|
Duane Miller |
|||
/s/ Jeffrey Mirvis |
Director |
June 14, 2021 |
|
Jeffrey Mirvis |
|||
/s/ David Bryan |
Director |
June 14, 2021 |
|
David Bryan |
|||
/s/ Joseph Ferguson |
Director |
June 14, 2021 |
|
Joseph Ferguson |
|||
/s/ Barbara Whittaker |
Director |
June 14, 2021 |
|
Barbara Whittaker |
|||
/s/ Jamy Rankin |
Director |
June 14, 2021 |
|
Jamy Rankin |
MOTORCAR PARTS OF AMERICA, INC.
AND SUBSIDIARIES
CONTENTS
Page |
|
53 |
|
F-1 |
|
F-2 |
|
F-3 |
|
F-4 |
|
F-5 |
|
F-6 |
|
S-1 |
To the Shareholders and the Board of Directors of Motorcar Parts of America, Inc.
Opinion on Internal Control over Financial Reporting
We have audited Motorcar Parts of America, Inc. and subsidiaries’ internal control over financial reporting as of March 31, 2021, based on criteria established in Internal Control-Integrated Framework issued by the Committee of Sponsoring Organizations of the Treadway Commission (2013 framework) (the COSO criteria). In our opinion, Motorcar Parts of America, Inc. and subsidiaries (the Company) maintained, in all material respects, effective internal control over financial reporting as of March 31, 2021, based on the COSO criteria.
We also have audited, in accordance with the standards of the Public Company Accounting Oversight Board (United States) (PCAOB), the consolidated balance sheets of the Company as of March 31, 2021 and 2020, the related consolidated statements of operations, comprehensive income (loss), shareholders' equity and cash flows for each of the three years in the period ended March 31, 2021, and the related notes and financial statement schedule and our report dated June 14, 2021 expressed an unqualified opinion thereon.
Basis for Opinion
The Company’s management is responsible for maintaining effective internal control over financial reporting and for its assessment of the effectiveness of internal control over financial reporting included in the accompanying Management’s Report on Internal Control Over Financial Reporting. Our responsibility is to express an opinion on the Company’s internal control over financial reporting based on our audit. We are a public accounting firm registered with the PCAOB and are required to be independent with respect to the Company in accordance with the U.S. federal securities laws and the applicable rules and regulations of the Securities and Exchange Commission and the PCAOB.
We conducted our audit in accordance with the standards of the PCAOB. Those standards require that we plan and perform the audit to obtain reasonable assurance about whether effective internal control over financial reporting was maintained in all material respects.
Our audit included obtaining an understanding of internal control over financial reporting, assessing the risk that a material weakness exists, testing and evaluating the design and operating effectiveness of internal control based on the assessed risk, and performing such other procedures as we considered necessary in the circumstances. We believe that our audit provides a reasonable basis for our opinion.
Definition and Limitations of Internal Control Over Financial Reporting
A company’s internal control over financial reporting is a process designed to provide reasonable assurance regarding the reliability of financial reporting and the preparation of financial statements for external purposes in accordance with generally accepted accounting principles. A company’s internal control over financial reporting includes those policies and procedures that (1) pertain to the maintenance of records that, in reasonable detail, accurately and fairly reflect the transactions and dispositions of the assets of the company; (2) provide reasonable assurance that transactions are recorded as necessary to permit preparation of financial statements in accordance with generally accepted accounting principles, and that receipts and expenditures of the company are being made only in accordance with authorizations of management and directors of the company; and (3) provide reasonable assurance regarding prevention or timely detection of unauthorized acquisition, use, or disposition of the company’s assets that could have a material effect on the financial statements.
Because of its inherent limitations, internal control over financial reporting may not prevent or detect misstatements. Also, projections of any evaluation of effectiveness to future periods are subject to the risk that controls may become inadequate because of changes in conditions, or that the degree of compliance with the policies or procedures may deteriorate.
/s/ Ernst & Young LLP |
Los Angeles, California
June 14, 2021
REPORT OF INDEPENDENT REGISTERED PUBLIC ACCOUNTING FIRM
To the Shareholders and the Board of Directors of Motorcar Parts of America, Inc.
Opinion on the Financial Statements
We have audited the accompanying consolidated balance sheets of Motorcar Parts of America, Inc. and subsidiaries (the Company) as of March 31, 2021 and 2020, the related consolidated statements of operations, comprehensive income (loss), shareholders' equity and cash flows for each of the three years in the period ended March 31, 2021, and the related notes and financial statement schedule listed in the Index at Item 15 (collectively referred to as the “consolidated financial statements”). In our opinion, the consolidated financial statements present fairly, in all material respects, the financial position of the Company at March 31, 2021 and 2020, and the results of its operations and its cash flows for each of the three years in the period ended March 31, 2021, in conformity with U.S. generally accepted accounting principles.
We also have audited, in accordance with the standards of the Public Company Accounting Oversight Board (United States) (PCAOB), the Company’s internal control over financial reporting as of March 31, 2021, based on criteria established in Internal Control-Integrated Framework issued by the Committee of Sponsoring Organizations of the Treadway Commission (2013 framework), and our report dated June 14, 2021 expressed an unqualified opinion thereon.
Basis for Opinion
These financial statements are the responsibility of the Company's management. Our responsibility is to express an opinion on the Company’s financial statements based on our audits. We are a public accounting firm registered with the PCAOB and are required to be independent with respect to the Company in accordance with the U.S. federal securities laws and the applicable rules and regulations of the Securities and Exchange Commission and the PCAOB.
We conducted our audits in accordance with the standards of the PCAOB. Those standards require that we plan and perform the audit to obtain reasonable assurance about whether the financial statements are free of material misstatement, whether due to error or fraud. Our audits included performing procedures to assess the risks of material misstatement of the financial statements, whether due to error or fraud, and performing procedures that respond to those risks. Such procedures included examining, on a test basis, evidence regarding the amounts and disclosures in the financial statements. Our audits also included evaluating the accounting principles used and significant estimates made by management, as well as evaluating the overall presentation of the financial statements. We believe that our audits provide a reasonable basis for our opinion.
Critical Audit Matters
The critical audit matters communicated below are matters arising from the current period audit of the financial statements that were communicated or required to be communicated to the audit committee and that: (1) relate to accounts or disclosures that are material to the financial statements and (2) involved our especially challenging, subjective or complex judgments. The communication of critical audit matters does not alter in any way our opinion on the consolidated financial statements, taken as a whole, and we are not, by communicating the critical audit matters below, providing separate opinions on the critical audit matters or on the accounts or disclosures to which they relate.
Contractual Agreements with Core Exchange Programs |
|
Description of the Matter |
As more fully described in Note 2 to the consolidated financial statements, the Company enters into contractual arrangements with customers (core exchange programs) which represent the majority of the Company’s sales for products that contain remanufactured cores. At March 31, 2021, contract assets and contract liabilities related to core exchange programs recorded on the consolidated balance sheet were $297,153,000 and $166,295,000, respectively. Auditing contract assets and contract liabilities related to the core exchange programs involved complex auditor judgment due to the unique terms of each customer arrangement which impact the completeness, existence, valuation and classification of contract assets and liabilities. |
How We Addressed the Matter in Our Audit |
We obtained an understanding, evaluated the design and tested the operating effectiveness of controls over management’s review of contracts with customers, management’s assessment of the accounting for core exchange programs, including unique contractual terms, and management’s review of the related contract assets and liabilities including controls over the completeness and accuracy of data. Our audit procedures to test the contract assets and contract liabilities related to core exchange programs included, among others, (i) reviewing agreements and amendments for significant customers, (ii) testing the completeness of management’s identification of contractual terms, (iii) evaluating the consistency of the accounting treatment with the Company's policies; and (v) testing the completeness and accuracy of the underlying data used in management’s analyses. |
Marketing Allowances |
|
Description of the Matter |
As more fully described in Note 2 and Note 14 to the consolidated financial statements, revenue is recognized net of applicable marketing allowances. These marketing allowances vary by contract and can include (i) the issuance of a specified amount of credits against receivables, (ii) support for research or marketing efforts, (iii) discounts granted in connection with shipments of product, and (iv) other marketing, research, store expansion or product development support. At March 31, 2021, marketing allowances recorded on the Company’s consolidated balance sheet was $16,826,000, which is presented within contract liabilities. Auditing the completeness of marketing allowances was complex because marketing allowances vary by contract and could be impacted by unrecorded marketing allowances provided to customers. |
How We Addressed the Matter in Our Audit |
We obtained an understanding, evaluated the design and tested the operating effectiveness of controls over the marketing allowances processes. For example, we tested controls over management’s review of contracts with customers containing marketing allowances, management’s review of the completeness and accuracy of data used in the marketing accrual analysis at period end and management’s review of credits issued to customers subsequent to the balance sheet date. Our audit procedures to test marketing allowances included, among others, reviewing significant contracts with customers, obtaining confirmations of contractual terms and conditions from a sample of the Company’s customers, and testing credits issued or payments made to customers throughout the year. We tested the completeness and accuracy of data used in the calculation of the marketing allowance by agreeing contractual terms to the underlying agreements. In addition, we evaluated the relationship between revenue and marketing allowances and assessed subsequent events to determine whether there was any new information that would require adjustments to the amounts recorded. |
/s/ Ernst & Young LLP |
We have served as the Company’s auditor since 2007.
Los Angeles, California
June 14, 2021
MOTORCAR PARTS OF AMERICA, INC. AND SUBSIDIARIES
March 31, 2021 |
March 31, 2020 |
|||||||
ASSETS |
||||||||
Current assets: |
||||||||
Cash and cash equivalents |
$ |
$ |
||||||
Short-term investments |
||||||||
Accounts receivable — net |
||||||||
Inventory — net |
||||||||
Inventory unreturned |
||||||||
Contract assets |
||||||||
Income tax receivable |
||||||||
Prepaid expenses and other current assets |
||||||||
Total current assets |
||||||||
Plant and equipment — net |
||||||||
Operating lease assets |
||||||||
Deferred income taxes |
||||||||
Long-term contract assets |
||||||||
Goodwill |
||||||||
Intangible assets — net |
||||||||
Other assets |
||||||||
TOTAL ASSETS |
$ |
$ |
||||||
LIABILITIES AND SHAREHOLDERS’ EQUITY |
||||||||
Current liabilities: |
||||||||
Accounts payable |
$ |
$ |
||||||
Accrued liabilities |
||||||||
Customer finished goods returns accrual |
||||||||
Contract liabilities |
||||||||
Revolving loan |
||||||||
Other current liabilities |
||||||||
Operating lease liabilities |
||||||||
Current portion of term loan |
||||||||
Total current liabilities |
||||||||
Term loan, less current portion |
||||||||
Contract liabilities, less current portion |
||||||||
Deferred income taxes |
||||||||
Operating lease liabilities, less current portion |
||||||||
Other liabilities |
||||||||
Total liabilities |
||||||||
Commitments and contingencies |
||||||||
Shareholders’ equity: |
||||||||
Preferred stock; par value $ |
||||||||
Series A junior participating preferred stock; par value $ |
||||||||
Common stock; par value $ |
||||||||
Additional paid-in capital |
||||||||
Retained earnings |
||||||||
Accumulated other comprehensive loss |
( |
) |
( |
) |
||||
Total shareholders’ equity |
||||||||
TOTAL LIABILITIES AND SHAREHOLDERS’ EQUITY |
$ |
$ |
||||||
The accompanying notes to consolidated financial statements are an integral part hereof.
MOTORCAR PARTS OF AMERICA, INC. AND SUBSIDIARIES
Years Ended March 31, |
||||||||||||
2021 |
2020 |
2019 |
||||||||||
Net sales |
$ |
$ |
$ |
|||||||||
Cost of goods sold |
||||||||||||
Gross profit |
||||||||||||
Operating expenses: |
||||||||||||
General and administrative |
||||||||||||
Sales and marketing |
||||||||||||
Research and development |
||||||||||||
Foreign exchange impact of lease liabilities and forward contracts |
( |
) |
||||||||||
Total operating expenses |
||||||||||||
Operating income |
||||||||||||
Interest expense, net |
||||||||||||
Income (loss) before income tax expense (benefit) |
( |
) |
( |
) |
||||||||
Income tax expense(benefit) |
( |
) |
||||||||||
Net income (loss) |
$ |
$ |
( |
) |
$ |
( |
) |
|||||
Basic net income (loss) per share |
$ |
$ |
( |
) |
$ |
( |
) |
|||||
Diluted net income (loss) per share |
$ |
$ |
( |
) |
$ |
( |
) |
|||||
Weighted average number of shares outstanding: |
||||||||||||
Basic |
||||||||||||
Diluted |
||||||||||||
The accompanying notes to consolidated financial statements are an integral part hereof.
MOTORCAR PARTS OF AMERICA, INC. AND SUBSIDIARIES
Years Ended March 31, |
||||||||||||
2021 |
2020 |
2019 |
||||||||||
Net income (loss) |
$ |
$ |
( |
) |
$ |
( |
) |
|||||
Other comprehensive loss, net of tax: |
||||||||||||
Foreign currency translation loss |
( |
) |
( |
) |
( |
) |
||||||
Total other comprehensive loss, net of tax |
( |
) |
( |
) |
( |
) |
||||||
Comprehensive income (loss) |
$ |
$ |
( |
) |
$ |
( |
) |
|||||
The accompanying notes to consolidated financial statements are an integral part hereof.
MOTORCAR PARTS OF AMERICA, INC. AND SUBSIDIARIES
Common Stock |
||||||||||||||||||||||||
Shares |
Amount |
Additional Paid-in Capital Common Stock |
Retained Earnings |
Accumulated Other Comprehensive Loss |
Total |
|||||||||||||||||||
Balance at March 31, 2018 |
$ |
$ |
$ |
$ |
( |
) |
$ |
|||||||||||||||||
Cumulative-effect adjustment for the adoption of ASU 2016-01 |
( |
) |
||||||||||||||||||||||
Balance at April 1, 2018 |
$ |
$ |
$ |
$ |
( |
) |
$ |
|||||||||||||||||
Compensation recognized under employee stock plans |
- |
|||||||||||||||||||||||
Exercise of stock options |
||||||||||||||||||||||||
Issuance of common stock upon vesting of RSUs, net of shares withheld for employee taxes |
( |
) |
( |
) |
||||||||||||||||||||
Repurchase and cancellation of treasury stock, including fees |
( |
) |
( |
) |
( |
) |
( |
) |
||||||||||||||||
Foreign currency translation |
- |
( |
) |
( |
) |
|||||||||||||||||||
Net loss |
- |
( |
) |
( |
) |
|||||||||||||||||||
Balance at March 31, 2019 |
$ |
$ |
$ |
$ |
( |
) |
$ |
|||||||||||||||||
Compensation recognized under employee stock plans |
- |
|||||||||||||||||||||||
Exercise of stock options |
||||||||||||||||||||||||
Issuance of common stock upon vesting of RSUs, net of shares withheld for employee taxes |
( |
) |
( |
) |
||||||||||||||||||||
Foreign currency translation |
- |
( |
) |
( |
) |
|||||||||||||||||||
Net loss |
- |
( |
) |
( |
) |
|||||||||||||||||||
Balance at March 31, 2020 |
$ |
$ |
$ |
$ |
( |
) |
$ |
|||||||||||||||||
Compensation recognized under employee stock plans |
- |
|||||||||||||||||||||||
Exercise of stock options |
||||||||||||||||||||||||
Issuance of common stock upon vesting of RSUs, net of shares withheld for employee taxes |
( |
) |
( |
) |
||||||||||||||||||||
Repurchase and cancellation of treasury stock, including fees |
( |
) |
( |
) |
( |
) |
( |
) |
||||||||||||||||
Foreign currency translation |
- |
( |
) |
( |
) |
|||||||||||||||||||
Net income |
- |
|||||||||||||||||||||||
Balance at March 31, 2021 |
$ |
$ |
$ |
$ |
( |
) |
$ |
|||||||||||||||||
The accompanying notes to consolidated financial statements are an integral part hereof.
MOTORCAR PARTS OF AMERICA, INC. AND SUBSIDIARIES
Years Ended March 31, |
||||||||||||
2021 |
2020 |
2019 |
||||||||||
Cash flows from operating activities: |
||||||||||||
Net income (loss) |
$ |
$ |
( |
) |
$ |
( |
) |
|||||
Adjustments to reconcile net income (loss) to net cash provided by (used in) operating activities: |
||||||||||||
Depreciation and amortization |
||||||||||||
Amortization of intangible assets |
||||||||||||
Amortization and write-off of debt issuance costs |
||||||||||||
Amortization of interest on contract liabilities, net |
||||||||||||
Amortization of core premiums paid to customers |
||||||||||||
Amortization of finished goods premiums paid to customers |
||||||||||||
Non-cash lease expense |
||||||||||||
Foreign exchange impact of lease liabilities and forward contracts |
( |
) |
||||||||||
Foreign currency remeasurement (gain) loss |
( |
) |
||||||||||
Loss (gain) due to the change in the fair value of the contingent consideration |
( |
) |
||||||||||
Gain on short-term investments |
( |
) |
( |
) |
( |
) |
||||||
Net provision for inventory reserves |
||||||||||||
Net provision for customer payment discrepancies |
||||||||||||
Net provision for doubtful accounts |
( |
) |
||||||||||
Deferred income taxes |
( |
) |
( |
) |
( |
) |
||||||
Share-based compensation expense |
||||||||||||
Loss on disposal of plant and equipment |
||||||||||||
Change in operating assets and liabilities, net of effects of acquisitions: |
||||||||||||
Accounts receivable |
( |
) |
||||||||||
Inventory |
( |
) |
( |
) |
( |
) |
||||||
Inventory unreturned |
( |
) |
( |
) |
( |
) |
||||||
Income tax receivable |
( |
) |
||||||||||
Prepaid expenses and other current assets |
( |
) |
( |
) |
||||||||
Other assets |
( |
) |
( |
) |
||||||||
Accounts payable and accrued liabilities |
( |
) |
||||||||||
Customer finished goods returns accrual |
||||||||||||
Contract assets, net |
( |
) |
( |
) |
( |
) |
||||||
Contract liabilities, net |
( |
) |
||||||||||
Operating lease liabilities |
( |
) |
( |
) |
||||||||
Other liabilities |
||||||||||||
Net cash provided by (used in) operating activities |
( |
) |
||||||||||
Cash flows from investing activities: |
||||||||||||
Purchase of plant and equipment |
( |
) |
( |
) |
( |
) |
||||||
Purchase of business, net of cash acquired |
( |
) |
||||||||||
Proceeds from sale of plant and equipment |
||||||||||||
(Payments for) redemptions of short term investments |
( |
) |
( |
) |
||||||||
Net cash used in investing activities |
( |
) |
( |
) |
( |
) |
||||||
Cash flows from financing activities: |
||||||||||||
Borrowings under revolving loan |
||||||||||||
Repayments under revolving loan |
( |
) |
( |
) |
( |
) |
||||||
Borrowings under term loan |
||||||||||||
Repayments of term loan |
( |
) |
( |
) |
( |
) |
||||||
Payments for debt issuance costs |
( |
) |
( |
) |
||||||||
Payments on finance lease obligations |
( |
) |
( |
) |
( |
) |
||||||
Payment of contingent consideration |
( |
) |
( |
) |
||||||||
Exercise of stock options |
||||||||||||
Cash used to net share settle equity awards |
( |
) |
( |
) |
( |
) |
||||||
Repurchase of common stock, including fees |
( |
) |
( |
) |
||||||||
Net cash (used in) provided by financing activities |
( |
) |
||||||||||
Effect of exchange rate changes on cash and cash equivalents |
( |
) |
||||||||||
Net (decrease) increase in cash and cash equivalents |
( |
) |
( |
) |
||||||||
Cash and cash equivalents — Beginning of year |
||||||||||||
Cash and cash equivalents — End of year |
$ |
$ |
$ |
|||||||||
Supplemental disclosures of cash flow information: |
||||||||||||
Cash paid for interest, net |
$ |
$ |
$ |
|||||||||
Cash paid for income taxes, net of refunds |
||||||||||||
Cash paid for operating leases |
||||||||||||
Cash paid for finance leases |
||||||||||||
Plant and equipment acquired under finance lease |
||||||||||||
Assets acquired under operating leases |
||||||||||||
Contingent consideration |
||||||||||||
Non-cash capital expenditures |
||||||||||||
The accompanying notes to consolidated financial statements are an integral part hereof.
MOTORCAR PARTS OF AMERICA, INC. AND SUBSIDIARIES
1. Company Background and Organization
Motorcar Parts of America, Inc. and its subsidiaries (the “Company”, or “MPA”) is a leading supplier of automotive aftermarket non-discretionary replacement parts and test solutions and diagnostic equipment. These replacement parts are primarily sold to automotive retail chain stores and warehouse distributors throughout North America and to major automobile manufacturers for both their aftermarket programs and warranty replacement programs (“OES”). The Company’s test solutions and diagnostic equipment primarily serves the global automotive component and powertrain testing market. The Company’s products include (i) rotating electrical products such as alternators and starters, (ii) wheel hub assemblies and bearings, (iii) brake-related products, which include brake calipers, brake boosters, brake rotors, brake pads, and brake master cylinders, and (iv) test solutions and diagnostic equipment used for electric vehicle powertrain development and manufacturing including electric motor test systems, e-axle test systems, advanced power emulators, charging unit test systems, test systems for alternators, starters, belt starter generators and bench-top testers used by the automotive retail segment and turbochargers.
The Company primarily ships its products from its facilities and various third-party warehouse distribution centers in North America, including the Company’s 410,000 square foot distribution center in Tijuana, Mexico.
Impact of the Novel Coronavirus (“COVID-19”)
The outbreak of the COVID-19 pandemic adversely impacted the U.S. and global economies and created uncertainty regarding the potential effects on the Company’s employees, supply chain, operations, and customer demand. The COVID-19 pandemic could impact the Company’s operations and the operations of its customers, suppliers, and vendors because of quarantines, facility closures, travel, and logistics restrictions. The extent to which the COVID-19 pandemic impacts the Company will depend on numerous factors and future developments, which are highly uncertain and cannot be predicted, including, but not limited to: (i) the severity of the virus, (ii) the occurrence and duration of additional spikes, (iii) the effects of the pandemic on customers, suppliers, and vendors, (iv) the remedial actions and stimulus measures adopted by local, state and federal governments, (v) the availability and acceptance of vaccines, and (vi) the extent to which normal economic and operating conditions can resume. Even after the COVID-19 pandemic has subsided, the Company may continue to experience adverse impacts to its business because of an economic recession or depression that has occurred or may occur in the future.
2. Summary of Significant Accounting Policies
Recently Adopted Accounting Pronouncements
Measurement of Credit Losses on Financial Instruments
In June 2016, the FASB issued an accounting pronouncement related to the measurement of credit losses on financial instruments. This pronouncement, along with a subsequent Accounting Standards Updates (“ASU”) issued to clarify certain provisions of the new guidance, changed the impairment model for most financial assets and requires the use of an “expected loss” model for instruments measured at amortized cost. Under this model, entities are required to estimate the lifetime expected credit loss on such instruments and record an allowance to offset the amortized cost basis of the financial asset, resulting in a net presentation of the amount expected to be collected on the financial asset. The adoption of this guidance on April 1, 2020 increased the Company’s disclosures for its expected credit losses but did not have a material effect on its consolidated financial statements.
Prior to April 1, 2020, accounts receivable were recorded at cost less an allowance for doubtful accounts. The net amount of accounts receivable and corresponding allowance for doubtful accounts were presented in the consolidated balance sheets. The Company maintained an allowance for uncollectible accounts receivable for estimated losses resulting from the failure or inability of its customers to make required payments. Furthermore, receivable balances were assessed quarterly for impairment and an allowance was recorded if the receivable was considered impaired. Subsequent to April 1, 2020, accounts receivable are recorded at amortized cost less an allowance for credit losses that are not expected to be recovered. The net amount of accounts receivable and corresponding allowance for credit losses are presented in the consolidated balance sheets. The Company maintains allowances for credit losses resulting from the expected failure or inability of its customers to make required payments. The Company recognizes the allowance for credit losses at inception and reassess quarterly based on the asset’s expected collectability. The allowance is based on multiple factors including historical experience with bad debts, the credit quality of the customer base, the aging of such receivables and current macroeconomic conditions, such as COVID-19, as well as expectations of conditions in the future, if applicable. The Company’s allowance for credit losses is based on the assessment of the collectability of assets pooled together with similar risk characteristics.
The Company records a provision for expected credit losses using a loss-rate method based on the ratio of its historical write-offs to its average trade accounts receivable. At each reporting period, the Company assesses whether financial assets in a pool continue to display similar risk characteristics. If particular receivables no longer display risk characteristics that are similar to those of the receivables in the pool, the Company may determine that it needs to move those receivables to a different pool or perform an individual assessment of expected credit losses for those specific receivables.
Fair Value Measurements
In August 2018, the FASB issued guidance which changed the disclosure requirements for fair value measurements by removing, adding and modifying certain disclosures, including the range and weighted-average of significant unobservable inputs used to develop Level 3 fair value measurements. The amendments on changes in unrealized gains and losses, the range and weighted average of significant unobservable inputs used to develop Level 3 measurements, and the narrative description of measurement uncertainty are applied prospectively only for the most recent interim or annual period presented in the initial year of adoption. All other amendments should be applied retrospectively applied to all periods presented upon their effective date. The adoption of this guidance on April 1, 2020 modified certain of the Company’s disclosures for its Level 3 fair value measurements but did not have an impact on its consolidated financial statements.
Reference Rate Reform
In March 2020, the FASB issued guidance that, for a limited time, eases the potential burden in accounting for reference rate reform. The new guidance provides optional expedients and exceptions for applying GAAP to contracts, hedging relationships and other transactions affected by reference rate reform if certain criteria are met. The amendments apply only to contracts and hedging relationships that reference the London Interbank Offered Rate or another reference rate expected to be discontinued due to reference rate reform. These amendments are effective immediately and may be applied prospectively to contract modifications made and hedging relationships entered into or evaluated on or before December 31, 2022. The Company will apply these amendments prospectively. The adoption of this guidance on April 1, 2020 did not have an impact on the Company’s consolidated financial statements for the year ended March 31, 2021.
Accounting Pronouncements Not Yet Adopted
Income Taxes
In December 2019, the FASB issued guidance that simplifies the accounting for income taxes, eliminates certain exceptions within ASC 740, Income Taxes, and clarifies certain aspects of the current guidance to promote consistent application. This guidance is effective for annual and interim periods in fiscal years beginning after December 15, 2020. Early adoption is permitted. The adoption of this guidance on April 1, 2021 is not expected to have any material impact on the Company’s consolidated financial statements.
Reclassifications
Certain reclassifications have been made to the presentation of the prior year consolidated financial statements to conform to the current year presentation.
Principles of Consolidation
The accompanying consolidated financial statements include the accounts of Motorcar Parts of America, Inc. and its wholly owned subsidiaries. All significant inter-company accounts and transactions have been eliminated.
Segment Reporting
Pursuant to the guidance provided under the Financial Accounting Standards Board (“FASB”) Accounting Standards Codification (“ASC”) for segment reporting, the Company has identified its chief operating decision maker (“CODM”), reviewed the documents used by the CODM, and understands how such documents are used by the CODM to make financial and operating decisions. The Company has determined through this review process that its business comprises three separate operating segments. Two of the operating segments meet all the aggregation criteria, and are aggregated. The remaining operating segment does not meet the quantitative thresholds for individual disclosure and the Company has combined its operating segments into one reportable segment.
Cash and Cash Equivalents
Cash primarily consists of cash on hand and bank deposits. Cash equivalents consist of money market funds. The Company considers all highly liquid investments purchased with an original or remaining maturity of less than three months at the date of purchase to be cash equivalents. Cash and cash equivalents are maintained with various financial institutions.
Accounts Receivable
The Company’s accounts receivable are recorded at amortized cost less an allowance for credit losses that are not expected to be recovered. The net amount of accounts receivable and corresponding allowance for credit losses are presented in the consolidated balance sheets. The Company maintains allowances for credit losses resulting from the expected failure or inability of its customers to make required payments. The Company does not require collateral for accounts receivable. The Company believes its credit risk with respect to trade accounts receivable is limited due to its credit evaluation process and the long-term nature of its relationships with its largest customers. The Company utilizes a historical loss rate method, adjusted for any changes in economic conditions or risk characteristics, to estimate its expected credit losses each period. When developing an estimate of expected credit losses, the Company considers all available relevant information regarding the collectability of cash flows, including historical information, current conditions, and reasonable and supportable forecasts of future economic conditions over the contractual life of the receivable. The historical loss rate method considers past write-offs of trade accounts receivable over a period commensurate with the initial term of the Company’s contracts with its customers. The Company recognizes the allowance for credit losses at inception and reassesses quarterly based on management’s expectation of the asset’s collectability. The Company’s accounts receivable are short-term in nature and written off only when all collection attempts have failed.
The Company has receivable discount programs that have been established with certain major customers and their respective banks. Under these programs, the Company has the option to sell those customers’ receivables to those banks at a discount to be agreed upon at the time the receivables are sold. Once the customer chooses which outstanding invoices are going to be made available for discounting, the Company can accept or decline the bundle of invoices provided. The receivable discount programs are non-recourse, and funds cannot be reclaimed by the customer or its bank after the related invoices have been discounted.
Inventory
Inventory is comprised of: (i) Used Core and component raw materials, (ii) work-in-process, (iii) remanufactured finished goods and purchased finished goods.
Used Core, component raw materials, and purchased finished goods are stated at the lower of average cost or net realizable value.
Work-in-process is in various stages of production and is valued at the average cost of Used Cores and component raw materials issued to work orders still open, including allocations of labor and overhead costs. Historically, work-in-process inventory has not been material compared to the total inventory balance.
Remanufactured finished goods include: (i) the Used Core cost and (ii) the cost of component raw materials, and allocations of labor and variable and fixed overhead costs (the “Unit Cost”). The allocations of labor and variable and fixed overhead costs are based on the actual use of the production facilities over the prior 12 months which approximates normal capacity. This method prevents the distortion in allocated labor and overhead costs that would occur during short periods of abnormally low or high production. In addition, the Company excludes certain unallocated overhead such as severance costs, duplicative facility overhead costs, start-up costs, training, and spoilage from the calculation and expenses these unallocated overhead as period costs. Purchased finished goods also include an allocation of fixed overhead costs.
The estimate of net realizable value is subjective and based on management’s judgment and knowledge of current industry demand and management’s projections of industry demand. The estimates may, therefore, be revised if there are changes in the overall market for the Company’s products or market changes that in management’s judgment, impact its ability to sell or liquidate potentially excess or obsolete inventory. Net realizable value is determined at least quarterly as follows:
| • | Net realizable value for finished goods by customer by product line are determined based on the agreed upon selling price with the customer for a product in the trailing 12 months. The Company compares the average selling price, including any discounts and allowances, to the finished goods cost of on-hand inventory less any reserve for excess and obsolete inventory. Any reduction of value is recorded as cost of goods sold in the period in which the revaluation is identified. |
| • | Net realizable value for Used Cores are determined based on current core purchase prices from core brokers to the extent that core purchases in the trailing 12 months are significant. Remanufacturing consumes, on average, more than one Used Core for each remanufactured unit produced since not all Used Cores are reusable. The yield rates depend upon both the product and consumer specifications. The Company purchases Used Cores from core brokers to supplement its yield rates and Used Cores not returned under the core exchange programs. The Company also considers the net selling price its customers have agreed to pay for Used Cores that are not returned under its core exchange programs to assess whether Used Core cost exceeds Used Core net realizable value on a by customer by product line basis. Any reduction of core cost is recorded as cost of goods sold in the period in which the revaluation is identified. |
| • | The Company records an allowance for potentially excess and obsolete inventory based upon recent sales history, the quantity of inventory on-hand, and a forecast of potential use of the inventory. The Company periodically reviews inventory to identify excess quantities and part numbers that are experiencing a reduction in demand. Any part numbers with quantities identified during this process are reserved for at rates based upon management’s judgment, historical rates, and consideration of possible scrap and liquidation values which may be as high as |
The Company records vendor discounts as a reduction of inventories and are recognized as a reduction to cost of sales as the inventories are sold.
Inventory Unreturned
Inventory unreturned represents the Company’s estimate, based on historical data and prospective information provided directly by the customer, of finished goods shipped to customers that the Company expects to be returned under its general right of return policy, after the balance sheet date. Inventory unreturned includes only the Unit Cost of a finished good. The return rate is calculated based on expected returns within the normal operating cycle, which is generally one year . As such, the related amounts are classified in current assets. Inventory unreturned is valued in the same manner as the Company’s finished goods inventory.
Contract Assets
Contract assets consists of: (i) the core portion of the finished goods shipped to customers, (ii) upfront payments to customers in connection with customer contracts, (iii) core premiums paid to customers, (iv) finished goods premiums paid to customers, and (v) long-term core inventory deposits.
Remanufactured Cores held at customers’ locations as a part of the finished goods sold to the customer are classified as long-term contract assets. These assets are valued at the lower of cost or net realizable value of Used Cores on hand (See Inventory above). For these Remanufactured Cores, the Company expects the finished good containing the Remanufactured Core to be returned under the Company’s general right of return policy or a similar Used Core to be returned to the Company by the customer, under the Company’s core exchange programs in each case, for credit. The Remanufactured Cores and Used Cores returned by consumers to the Company’s customers but not yet returned to the Company are classified as “Cores expected to be returned by customers”, which are included in short-term contract assets until the Company physically receives them during its normal operating cycle, which is generally one year.
Upfront payments to customers represent the marketing allowances, such as sign-on bonuses, slotting fees, and promotional allowances provided by the Company to its customers. These allowances are recognized as an asset and amortized over the appropriate period of time as a reduction of revenue if the Company expects to generate future revenues associated with the upfront payment. If the Company does not expect to generate additional revenue, then the upfront payment is recognized in the consolidated statements of operations when payment occurs as a reduction of revenue. Upfront payments expected to be amortized during the Company’s normal operating cycle, which is generally one year, are classified as short-term contract assets.
Core premiums paid to customers represent the difference between the Remanufactured Core acquisition price paid to customers generally in connection with new business, and the related Used Core cost, which is treated as an asset and recognized as a reduction of revenue through the later of the date at which related revenue is recognized or the date at which the sales incentive is offered. The Company considers, among other things, the length of its largest ongoing customer relationships, duration of customer contracts, and the average life of vehicles on the road in determining the appropriate period of time over which to amortize these premiums. These core premiums are amortized over a period typically ranging from to eight years , adjusted for specific circumstances associated with the arrangement. Core premiums are recorded as long-term contract assets. Core premiums expected to be amortized within the Company’s normal operating cycle, which is generally one year, are classified as short-term contract assets.
Finished goods premiums paid to customers represent the difference between the finished good acquisition price paid to customers, generally in connection with new business, and the related finished good cost, which is treated as an asset and recognized as a reduction of revenue through the later of the date at which related revenue is recognized or the date at which the sales incentive is offered. The Company considers, among other things, the length of its largest ongoing customer relationships, duration of customer contracts, and the average life of vehicles on the road in determining the appropriate period of time over which to amortize these premiums. Finished goods premiums are amortized over a period typically ranging from to eight years , adjusted for specific circumstances associated with the arrangement. Finished goods premiums are recorded as long-term contract assets. Finished goods premiums expected to be amortized within our normal operating cycle, which is generally one year, are classified as short-term contract assets.
Long-term core inventory deposits represent the cost of Remanufactured Cores the Company has purchased from customers, which are held by the customers and remain on the customers’ premises. The costs of these Remanufactured Cores were established at the time of the transaction based on the then current cost. The selling value of these Remanufactured Cores was established based on agreed upon amounts with these customers. The Company expects to realize the selling value and the related cost of these Remanufactured Cores should its relationship with a customer end, a possibility that the Company considers remote based on existing long-term customer agreements and historical experience.
Customer Finished Goods Returns Accrual
The customer finished goods returns accrual represents the Company’s estimate of its exposure to customer returns, including warranty returns, under its general right of return policy to allow customers to return items that their end user customers have returned to them and from time to time, stock adjustment returns when the customers’ inventory of certain product lines exceeds the anticipated sales to end-user customers. The customer finished goods returns accrual represents the Unit Value of the estimated returns and is classified as a current liability due to the expectation that these returns will occur within the normal operating cycle of one year.
Income Taxes
The Company accounts for income taxes using the liability method, which measures deferred income taxes by applying enacted statutory rates in effect at the balance sheet date to the differences between the tax basis of assets and liabilities and their reported amounts in the financial statements. The resulting asset or liability is adjusted to reflect changes in the tax laws as they occur. A valuation allowance is provided to reduce deferred tax assets when it is more likely than not that a portion of the deferred tax asset will not be realized.
The primary components of the Company’s income tax expense were (i) federal income taxes, (ii) state income taxes, (iii) foreign income taxed at rates that are different from the federal statutory rate, (iv) change in realizable deferred tax items, (v) impact of the non-deductible executive compensation under Internal Revenue Code Section 162(m), (vi) income taxes associated with uncertain tax positions, and (vii) the impact of net operating loss carry-backs in connection with the Coronavirus Aid, Relief and Economic Security Act (the “CARES Act”), which was signed into law on March 27, 2020.
Realization of deferred tax assets is dependent upon the Company’s ability to generate sufficient future taxable income. Significant judgment is required in determining the Company’s provision for income taxes, deferred tax assets and liabilities and any valuation allowance recorded against the Company’s net deferred tax assets. The Company makes these estimates and judgments about its future taxable income that are based on assumptions that are consistent with the Company’s future plans. A valuation allowance is established when the Company believes it is not more likely than not all or some of a deferred tax assets will be realized. In evaluating the Company’s ability to recover deferred tax assets within the jurisdiction in which they arise, the Company considers all available positive and negative evidence. Deferred tax assets arising primarily as a result of net operating loss carry-forwards and research and development credits in connection with the Company’s Canadian operations have been offset completely by a valuation allowance due to the uncertainty of their utilization in future periods. Should the actual amount differ from the Company’s estimates, the amount of the valuation allowance could be impacted.
The Company has made an accounting policy election to recognize the U.S. tax effects of global intangible low-taxed income as a component of income tax expense in the period the tax arises.
Plant and Equipment
Plant and equipment are stated at cost, less accumulated depreciation. The cost of additions and improvements are capitalized, while maintenance and repairs are charged to expense when incurred. Depreciation is provided on a straight-line basis in amounts sufficient to relate the cost of depreciable assets to operations over their estimated service lives. Machinery and equipment are depreciated over a range from to ten years . Office equipment and fixtures are depreciated over a range from to ten years . Leasehold improvements are depreciated over the lives of the respective leases or the service lives of the leasehold improvements, whichever is shorter. Depreciation of assets recorded under finance leases is included in depreciation expense. The Company evaluates plant and equipment, including leasehold improvements, equipment, construction in progress, and right-of-use assets for impairment whenever events or circumstances indicate that the carrying value of an asset or asset group may not be recoverable. There were no indicators of impairment at March 31, 2021.
Leases
The Company determines if an arrangement contains a lease at inception. Lease assets and lease liabilities are recorded based on the present value of lease payments over the lease term, which includes the minimum unconditional term of the lease. Certain of the Company’s leases include options to extend the leases for up to five years . When the Company has the option to extend the lease term, terminate the lease before the contractual expiration date, or purchase the leased asset, and it is reasonably certain that it will exercise the option, the option is considered in determining the classification and measurement of the lease. The lease assets are recorded net of any lease incentives received. The Company exempts leases with an initial term of 12 months or less from balance sheet recognition and, for all classes of assets, combines non-lease components with lease components. Lease assets are tested for impairment in the same manner as long-lived assets used in operations.
The Company uses its incremental borrowing rate for each of its leases in determining the present value of its expected lease payments based on the information available at the lease commencement date as the rate implicit for each of its leases is not readily detainable. The Company’s incremental borrowing rate is determined by analyzing and combining (i) an applicable risk-free rate, (ii) a financial spread adjustment, and (iii) any lease specific adjustment. Certain leases contain provisions for property-related costs that are variable in nature for which the Company is responsible, including common area maintenance and other property operating services, which are expensed as incurred and not included in the determination of lease assets and lease liabilities. These costs are calculated based on a variety of factors including property values, tax and utility rates, property services fees, and other factors. The Company records rent expense for operating leases, some of which have escalating rent payments, on a straight-line basis over the lease term.
The Company has material non-functional currency leases. As required for other monetary liabilities, lessees shall remeasure a foreign currency-denominated lease liability using the exchange rate at each reporting date, but the lease assets are nonmonetary assets measured at historical rates, which are not affected by subsequent changes in the exchange rates. The Company recorded a gain of $9,893,000 and a loss of $11,710,000 during the years ended March 31, 2021 and 2020, respectively, which are included in “foreign exchange impact of lease liabilities and forward contracts” in the consolidated statements of operations. See Note 10 for additional information regarding the Company’s leases.
Goodwill
The Company evaluates goodwill for impairment at least annually during the fourth quarter of each fiscal year or more frequently when an event occurs or circumstances change that indicate the carrying value may not be recoverable. The goodwill impairment test is performed at the reporting unit level, which represents the Company’s operating segments. In testing for goodwill impairment, the Company may elect to utilize a qualitative assessment to evaluate whether it is more likely than not that the fair value of the reporting unit is less than its carrying amount. If the Company’s qualitative assessment indicates that goodwill impairment is more likely than not, it will proceed with performing the quantitative assessment. If the fair value of the reporting unit exceeds its carrying value, goodwill is not considered impaired. If the carrying value of the reporting unit exceeds its fair value an impairment loss will be recognized for the amount by which the carrying value exceeds the reporting unit’s fair value. The Company completed the required annual testing of goodwill impairment for each of the reporting units during the fourth quarter of the year ended March 31, 2021, and determined through the qualitative assessment that its goodwill of $3,205,000 was not impaired.
Intangible Assets
The Company’s intangible assets other than goodwill are finite–lived and amortized on a straight-line basis over their respective useful lives. The Company analyzes its finite-lived intangible assets for impairment when and if indicators of impairment exist. At March 31, 2021, the Company’s intangible assets were $5,329,000 , and there were no indicators of impairment.
Debt Issuance Costs
Debt issuance costs include fees and costs incurred to obtain financing. Debt issuance costs related to the Company’s term loans are presented in the balance sheet as a direct deduction from the carrying amount of the term loans. Debt issuance costs related to the Company’s revolving loan are presented in prepaid expenses and other current assets in the accompanying consolidated balance sheets, regardless of whether or not there are any outstanding borrowings under the revolving loan. These fees and costs are amortized using the straight-line method, which approximates the effective interest rate method, over the terms of the related loans and are included in interest expense in the Company’s consolidated statements of operations.
Foreign Currency Translation
For financial reporting purposes, the functional currency of the foreign subsidiaries is the local currency. The assets and liabilities of foreign operations for which the local currency is the functional currency are translated into the U.S. dollar at the exchange rate in effect at the balance sheet date, while revenues and expenses are translated at average exchange rates during the year. The accumulated foreign currency translation adjustment is presented as a component of comprehensive income or loss in the consolidated statements of shareholders’ equity. During the years ended March 31, 2021 and 2020, aggregate foreign currency transaction gains of $1,144,000 and losses of $789,000 , respectively, were recorded in general and administrative expenses.
Revenue Recognition
Revenue is recognized when performance obligations under the terms of a contract with its customers are satisfied; generally, this occurs with the transfer of control of its products. Revenue is measured as the amount of consideration the Company expects to receive in exchange for transferring goods or providing services. Revenue is recognized net of all anticipated returns, marketing allowances, volume discounts, and other forms of variable consideration.
Revenue is recognized either when products are shipped or when delivered, depending on the applicable contract terms. Bill and hold shipments are shipped out to the customer as ex-works; in which the customer makes arrangements and is responsible for their shipping cost. No freight or shipping costs are accrued for revenue under the terms of shipments made as ex-works.
The price of a finished remanufactured product sold to customers is generally comprised of separately invoiced amounts for the Remanufactured Core included in the product (“Remanufactured Core value”) and the unit portion included in the product (“Unit Value”), for which revenue is recorded based on our then current price list, net of applicable discounts and allowances. The Remanufactured Core value is recorded as a net revenue based upon the estimate of Used Cores that will not be returned by the customer for credit. These estimates are subjective and based on management’s judgment and knowledge of historical, current, and projected return rates. As reconciliations are completed with the customers the actual rates at which Used Cores are not being returned may differ from the current estimates. This may result in periodic adjustments of the estimated contract asset and liability amounts recorded and may impact the projected revenue recognition rates used to record the estimated future revenue. These estimates may also be revised if there are changes in contractual arrangements with customers, or changes in business practices. A significant portion of the remanufactured automotive parts sold to customers are replaced by similar Used Cores sent back for credit by customers under the core exchange programs (as described in further detail below). The number of Used Cores sent back under the core exchange programs is generally limited to the number of similar Remanufactured Cores previously shipped to each customer.
Revenue Recognition — Core Exchange Programs
Full price Remanufactured Cores: When remanufactured products are shipped, certain customers are invoiced for the Remanufactured Core value of the product at the full Remanufactured Core sales price. For these Remanufactured Cores, revenue is only recognized based upon an estimate of the rate at which these customers will pay cash for Remanufactured Cores in lieu of sending back similar Used Cores for credits under the core exchange programs. The remainder of the full price Remanufactured Core value invoiced to these customers is established as a long-term contract liability rather than being recognized as revenue in the period the products are shipped as the Company expects these Remanufactured Cores to be returned for credit under its core exchange programs.
Nominal price Remanufactured Cores: Certain other customers are invoiced for the Remanufactured Core value of the product shipped at a nominal (generally $0.01 or less) Remanufactured Core price. For these nominal Remanufactured Cores, revenue is only recognized based upon an estimate of the rate at which these customers will pay cash for Remanufactured Cores in lieu of sending back similar Used Cores for credits under the core exchange programs. Revenue amounts are calculated based on contractually agreed upon pricing for these Remanufactured Cores for which the customers are not returning similar Used Cores. The remainder of the nominal price Remanufactured Core value invoiced to these customers is established as a long-term contract liability rather than being recognized as revenue in the period the products are shipped as the Company expects these Remanufactured Cores to be returned for credit under its core exchange programs.
Revenue Recognition; General Right of Return
Customers are allowed to return goods that their end-user customers have returned to them, whether or not the returned item is defective (warranty returns). In addition, under the terms of certain agreements and industry practice, customers from time to time are allowed stock adjustments when their inventory of certain product lines exceeds the anticipated sales to end-user customers (stock adjustment returns). Customers have various contractual rights for stock adjustment returns, which are typically less than 5 % of units sold. In some instances, a higher level of returns is allowed in connection with significant restocking orders. The aggregate returns are generally limited to less than 20 % of unit sales.
The allowance for warranty returns is established based on a historical analysis of the level of this type of return as a percentage of total unit sales. The allowance for stock adjustment returns is based on specific customer inventory levels, inventory movements, and information on the estimated timing of stock adjustment returns provided by customers. Stock adjustment returns do not occur at any specific time during the year. The return rate for stock adjustments is calculated based on expected returns within the normal operating cycle, which is generally one year.
The Unit Value of the warranty and stock adjustment returns are treated as reductions of revenue based on the estimations made at the time of the sale. The Remanufactured Core value of warranty and stock adjustment returns are provided for as indicated in the paragraph “Revenue Recognition – Core Exchange Programs”.
As is standard in the industry, the Company only accepts returns from on-going customers. If a customer ceases doing business with the Company, it has no further obligation to accept additional product returns from that customer. Similarly, the Company accepts product returns and grants appropriate credits to new customers from the time the new customer relationship is established.
Shipping Costs
The Company includes shipping and handling charges in the gross invoice price to customers and classifies the total amount as revenue. All shipping and handling costs are expensed as cost of sales as inventory is sold.
Contract Liability
Contract liability consists of: (i) customer allowances earned, (ii) accrued core payments, (iii) customer core returns accruals, (iv) core bank liability, (v) finished goods liabilities, and (vi) customer deposits.
Customer allowances earned includes all marketing allowances provided to customers. Such allowances include sales incentives and concessions. Voluntary marketing allowances related to a single exchange of product are recorded as a reduction of revenues at the time the related revenues are recorded or when such incentives are offered. Other marketing allowances, which may only be applied against future purchases, are recorded as a reduction to revenues in accordance with a schedule set forth in the relevant contract. Sales incentive amounts are recorded based on the value of the incentive provided. See Note 14 for a description of all marketing allowances. Customer allowances to be provided to customers within the Company’s normal operating cycle, which is generally one year, are considered short-term contract liabilities and the remainder are recorded as long-term contract liabilities.
Accrued core payments represent the sales price of Remanufactured Cores purchased from customers, generally in connection with new business, which are held by these customers and remain on their premises. The sales price of these Remanufactured Cores will be realized when the Company’s relationship with a customer ends, a possibility that the Company considers remote based on existing long-term customer agreements and historical experience. The payments to be made to customers for purchases of Remanufactured Cores within the Company’s normal operating cycle, which is generally one year, are considered short-term contract liabilities and the remainder are recorded as long-term contract liabilities.
Customer core returns accruals represent the full and nominally priced Remanufactured Cores shipped to the Company’s customers. When the Company ships the product, it recognizes an obligation to accept a similar Used Core sent back under the core exchange programs based upon the Remanufactured Core price agreed upon by the Company and its customer. The Contract liability related to Used Cores returned by consumers to the Company’s customers but not yet returned to the Company are classified as short-term contract liabilities until the Company physically receives these Used Cores as they are expected to be returned during the Company’s normal operating cycle, which is generally one year and the remainder are recorded as long-term contract liabilities.
The core bank liability represents the full Remanufactured Core sales price paid for cores returned under the core exchange programs. The payment for these cores are made over a contractual repayment period pursuant to the Company’s agreement with this customer. Payments to be made within the Company’s normal operating cycle, which is generally one year, are considered short-term contract liabilities and the remainder are recorded as long-term contract liabilities.
Finished goods liabilities represents the agreed upon price of finished goods purchased from customers, generally in connection with new business. The payment for these finished goods are made over a contractual repayment period pursuant to the Company’s agreement with the customer. Payments to be made within the Company’s normal operating cycle, which is generally one year, are considered short-term contract liabilities and the remainder are recorded as long-term contract liabilities.
Customer deposits represent the receipt of prepayments from customers for the obligation to transfer goods or services in the future. The Company classifies these customer deposits as short-term contract liabilities as the Company expects to satisfy these obligations within its normal operating cycle, which is generally one year.
Advertising Costs
The Company expenses all advertising costs as incurred. Advertising expenses for the years ended March 31, 2021, 2020 and 2019 were $507,000 , $773,000 and $819,000 , respectively.
Net Income (Loss) Per Share
Basic net income (loss) per share is computed by dividing net income (loss) by the weighted average number of shares of common stock outstanding during the period. Diluted net income (loss) per share includes the effect, if any, from the potential exercise or conversion of securities, such as stock options and warrants, which would result in the issuance of incremental shares of common stock to the extent such impact is not anti-dilutive.
The following presents a reconciliation of basic and diluted net income (loss) per share.
Years Ended March 31, |
||||||||||||
2021 |
2020 |
2019 |
||||||||||
Net income (loss) |
$ |
$ |
( |
) |
$ |
( |
) |
|||||
Basic shares |
||||||||||||
Effect of dilutive stock options and warrants |
||||||||||||
Diluted shares |
||||||||||||
Net income (loss) per share: |
||||||||||||
Basic net income (loss) per share |
$ |
$ |
( |
) |
$ |
( |
) |
|||||
Diluted net income (loss) per share |
$ |
$ |
( |
) |
$ |
( |
) |
|||||
Potential common shares that would have the effect of increasing diluted net income per share or decreasing diluted net loss per share are considered to be anti-dilutive and as such, these shares are not included in calculating diluted net income (loss) per share. For the years ended March 31, 2021, 2020 and 2019, there were 1,279,251 , 1,738,106 , and 1,580,299 , respectively, of potential common shares not included in the calculation of diluted net income (loss) per share because their effect was anti-dilutive.
Use of Estimates
The preparation of consolidated financial statements in conformity with accounting principles generally accepted in the United States (“GAAP”) requires management to make estimates and assumptions that affect the reported amounts in the consolidated financial statements and accompanying notes. Actual results could differ from those estimates. On an on-going basis, the Company evaluates its estimates, including allowances for credit losses, valuation of inventory, valuation of long-lived assets, goodwill and intangible assets, depreciation and amortization of long-lived assets, litigation matters, valuation of deferred tax assets, share-based compensation, sales returns and other customer marketing allowances, and the incremental borrowing rate used in determining the present value of lease liabilities. Although the Company does not believe that there is a reasonable likelihood that there will be a material change in the future estimate or in the assumptions used in calculating the estimate, unforeseen changes in the industry, or business could materially impact the estimate and may have a material adverse effect on its business, financial condition and results of operations.
Financial Instruments
The carrying amounts of cash, short-term investments, accounts receivable, accounts payable and accrued liabilities approximate their fair value due to the short-term nature of these instruments. The carrying amounts of the revolving loan, term loan and other long-term liabilities approximate their fair value based on current rates for instruments with similar characteristics.
Share-Based Payments
The Black-Scholes option-pricing model requires the input of subjective assumptions including the expected volatility of the underlying stock and the expected holding period of the option. These subjective assumptions are based on both historical and other information. Changes in the values assumed and used in the model can materially affect the estimate of fair value.
The following summarizes the Black-Scholes option-pricing model assumptions used to derive the weighted average fair value of the stock options granted during the periods noted.
Years Ended March 31, |
||||||||||||
2021 |
2020 |
2019 |
||||||||||
Weighted average risk free interest rate |
% |
% |
% |
|||||||||
Weighted average expected holding period (years) |
||||||||||||
Weighted average expected volatility |
% |
% |
% |
|||||||||
Weighted average expected dividend yield |
||||||||||||
Weighted average fair value of options granted |
$ |
$ |
$ |
|||||||||
Credit Risk
The Company regularly reviews its accounts receivable and allowance for credit losses by considering factors such as historical experience, credit quality and age of the accounts receivable, and the current economic conditions that may affect a customer’s ability to pay. The majority of the Company’s sales are to leading automotive aftermarket parts suppliers. Management believes the credit risk with respect to trade accounts receivable is limited due to the Company’s credit evaluation process, the nature of its customers, and its accounts receivable discount programs. However, should the Company’s customers experience significant cash flow problems, its financial position and results of operations could be materially and adversely affected, and the maximum amount of loss that would be incurred would be the outstanding receivable balance, Used Cores expected to be returned by customers, and the value of the Remanufactured Cores held at customers’ locations. The Company maintains an allowance for credit losses that, in its opinion, provides for an adequate reserve to cover losses that may be incurred.
Deferred Compensation Plan
The Company has a deferred compensation plan for certain members of management. The plan allows participants to defer salary and bonuses. The assets of the plan, which are held in a trust and are subject to the claims of the Company’s general creditors under federal and state laws in the event of insolvency, are recorded as short-term investments in the consolidated balance sheets. Consequently, the trust qualifies as a Rabbi trust for income tax purposes. The plan’s assets consist primarily of mutual funds and are recorded at market value with any unrealized gain or loss recorded as general and administrative expense. The carrying value of plan assets was $1,652,000 and $850,000 , and the deferred compensation liability, which is included in other current liabilities in the accompanying consolidated balance sheets, was $1,652,000 and $850,000 at March 31, 2021 and 2020, respectively. During the years ended March 31, 2021, 2020, and 2019, the Company made contributions of $96,000 , $79,000 and $113,000 , respectively.
During the years ended March 31, 2021 and 2020, the Company redeemed $46,000 and $2,802,000 , respectively, of its short-term investments for the payment of deferred compensation liabilities.
The following summarizes the gain (loss) on the Company’s equity investments:
Years Ended March 31, |
||||||||||||
2021 |
2020 |
2019 |
||||||||||
Net gain recognized on equity securities |
$ |
$ |
$ |
|||||||||
Less: net gain recognized on equity securities sold |
||||||||||||
Unrealized gain (loss) recognized on equity securities still held |
$ |
$ |
( |
) |
$ |
|||||||
Comprehensive Income or Loss
Comprehensive income or loss is defined as the change in equity during a period resulting from transactions and other events and circumstances from non-owner sources. The Company’s total comprehensive income or loss consists of net unrealized income or loss from foreign currency translation adjustments.
3. Goodwill and Intangible Assets
Goodwill
The Company had goodwill of $3,205,000
Intangible Assets
The following is a summary of acquired intangible assets subject to amortization:
March 31, 2021 |
March 31, 2020 |
|||||||||||||||||||
Weighted Average Amortization Period |
Gross Carrying Value |
Accumulated Amortization |
Gross Carrying Value |
Accumulated Amortization |
||||||||||||||||
Intangible assets subject to amortization |
0 |
|||||||||||||||||||
Trademarks |
$ |
$ |
$ |
$ |
||||||||||||||||
Customer relationships |
||||||||||||||||||||
Developed technology |
||||||||||||||||||||
Total |
$ |
$ |
$ |
$ |
||||||||||||||||
During the years ended March 31, 2021 and 2020, the Company retired $291,000 and $470,000 , respectively, of fully amortized intangible assets.
Amortization expense for acquired intangible assets is as follows:
Years Ended March 31, |
||||||||||||
2021 |
2020 |
2019 |
||||||||||
Amortization expense |
$ |
$ |
$ |
|||||||||
The estimated future amortization expense for acquired intangible assets subject to amortization is as follows:
Year Ending March 31, |
||||
2022 |
$ |
|||
2023 |
||||
2024 |
||||
2025 |
||||
2026 |
||||
Thereafter |
||||
Total |
$ |
|||
4. Accounts Receivable — Net
The Company has trade accounts receivable that result from the sale of goods and services. Accounts receivable — net includes offset accounts related to customer payment discrepancies, returned goods authorizations (“RGAs”) issued for in-transit unit returns, and allowances for credit losses.
Accounts receivable — net is comprised of the following:
March 31, 2021 |
March 31, 2020 |
|||||||
Accounts receivable — trade |
$ |
$ |
||||||
Allowance for credit losses |
( |
) |
( |
) |
||||
Customer payment discrepancies |
( |
) |
( |
) |
||||
Customer returns RGA issued |
( |
) |
( |
) |
||||
Less: total accounts receivable offset accounts |
( |
) |
( |
) |
||||
Total accounts receivable — net |
$ |
$ |
||||||
The following table provides a roll-forward of the allowance for credit losses that is deducted from accounts receivable to present the net amount expected to be collected. During the year ended March 31, 2021, the Company wrote off amounts previously fully reserved for in connection the bankruptcy filing of one of its customers.
Year Ended March 31, 2021 |
||||
Balance at beginning of period |
$ |
|||
Provision for expected credit losses |
||||
Recoveries |
( |
) |
||
Amounts written off charged against the allowance |
( |
) |
||
Balance at end of period |
$ |
|||
5. Inventory
Inventory is comprised of the following:
March 31, 2021 |
March 31, 2020 |
|||||||
Raw materials |
$ |
$ |
||||||
Work in process |
||||||||
Finished goods |
||||||||
Less allowance for excess and obsolete inventory |
( |
) |
( |
) |
||||
Total |
$ |
$ |
||||||
Inventory unreturned |
$ |
$ |
||||||
6. Contract Assets
During the year ended March 31, 2021, the Company reduced the carrying value of Remanufactured Cores held at customers’ locations by $4,600,000 .
Contract assets are comprised of the following:
March 31, 2021 |
March 31, 2020 |
|||||||
Short-term contract assets |
||||||||
Cores expected to be returned by customers |
$ |
$ |
||||||
Upfront payments to customers |
||||||||
Finished goods premiums paid to customers |
||||||||
Core premiums paid to customers |
||||||||
Total short-term contract assets |
$ |
$ |
||||||
Remanufactured cores held at customers’ locations |
$ |
$ |
||||||
Upfront payments to customers |
||||||||
Finished goods premiums paid to customers |
||||||||
Core premiums paid to customers |
||||||||
Long-term core inventory deposits |
||||||||
Total long-term contract assets |
$ |
$ |
||||||
7. Plant and Equipment
Plant and equipment is comprised of the following:
March 31, 2021 |
March 31, 2020 |
|||||||
Machinery and equipment |
$ |
$ |
||||||
Office equipment and fixtures |
||||||||
Leasehold improvements |
||||||||
Less accumulated depreciation |
( |
) |
( |
) |
||||
Total |
$ |
$ |
||||||
Plant and equipment located in the foreign countries where the Company has facilities, net of accumulated depreciation, totaled $45,831,000 and $35,410,000 , of which $42,215,000 and $31,845,000 is located in Mexico, at March 31, 2021 and 2020, respectively.
8. Debt
The Company is party to a $268,620,000 senior secured financing, (as amended from time to time, the “Credit Facility”) with a syndicate of lenders, and PNC Bank, National Association, as administrative agent, consisting of (i) a $238,620,000 revolving loan facility, subject to borrowing base restrictions, a $24,000,000 sublimit for borrowings by Canadian borrowers, and a $20,000,000 sublimit for letters of credit (the “Revolving Facility”) and (ii) a $30,000,000 term loan facility (the “Term Loans”). The loans under the Credit Facility mature on June 5, 2023 . The Credit Facility currently permits the payment of up to $30,000,000 of dividends and share repurchases for fiscal year 2021, subject to pro forma compliance with financial covenants. In connection with the Credit Facility, the lenders have a security interest in substantially all of the assets of the Company.
The Term Loans require quarterly principal payments of $937,500 . The Credit Facility bears interest at rates equal to either LIBOR plus a margin of 2.25 %, 2.50 % or 2.75 % or a reference rate plus a margin of 1.25 %, 1.50 % or 1.75 %, in each case depending on the senior leverage ratio as of the applicable measurement date. There is also a facility fee of 0.375 % to 0.50 %, depending on the senior leverage ratio as of the applicable measurement date. The interest rate on the Company’s Term Loans and Revolving Facility was 2.62 4.34 % and 3.64 %, respectively, at March 31, 2020.
The Credit Facility, among other things, requires the Company to maintain certain financial covenants including a maximum senior leverage ratio and a minimum fixed charge coverage ratio. The Company was in compliance with all financial covenants at March 31, 2021.
On May 28, 2021, the Company entered into a third amendment to the Amended Credit Facility (the “Third Amendment”). The Third Amendment, among other things, (i) extends the maturity date to May 28, 2026 from June 5, 2023 , (ii) modifies the fixed charge coverage ratio financial covenant, and (iii) modifies the definition of “Consolidated EBITDA”. The modifications to the financial covenants were effective as of March 31, 2021.
The Company had cash of $15,523,000 at March 31, 2021 and paid down its outstanding debt by $71,750,000 during the year ended March 31, 2021. In addition to other covenants, the Credit Facility places limits on the Company’s ability to incur liens, incur additional indebtedness, make loans and investments, engage in mergers and acquisitions, engage in asset sales, redeem or repurchase capital stock, alter the business conducted by the Company and its subsidiaries, transact with affiliates, prepay, redeem or purchase subordinated debt, and amend or otherwise alter debt agreements.
The Company’s Term Loans are comprised of the following:
March 31, 2021 |
March 31, 2020 |
|||||||
Principal amount of Term Loans |
$ |
$ |
||||||
Unamortized financing fees |
( |
) |
( |
) |
||||
Net carrying amount of Term Loans |
||||||||
Less current portion of Term Loans |
( |
) |
( |
) |
||||
Long-term portion of Term Loans |
$ |
$ |
||||||
Future repayments of the Company’s Term Loans are as follows:
Year Ending March 31, |
||||
2022 |
$ |
|||
2023 |
||||
2024 |
||||
Total payments |
$ |
|||
The Company had $84,000,000 and $152,000,000 outstanding under the Revolving Facility at March 31, 2021 and 2020, respectively. In addition, $6,193,000 was reserved for letters of credit at March 31, 2021. At March 31, 2021, after certain adjustments, $125,296,000 was available under the Revolving Facility.
9. Contract Liabilities
Contract liabilities are comprised of the following:
March 31, 2021 |
March 31, 2020 |
|||||||
Short-term contract liabilities |
||||||||
Customer core returns accruals |
$ |
$ |
||||||
Customer allowances earned |
||||||||
Customer deposits |
||||||||
Finished goods liabilities |
||||||||
Core bank liability |
||||||||
Accrued core payment |
||||||||
Total short-term contract liabilities |
$ |
$ |
||||||
Long-term contract liabilities |
||||||||
Customer core returns accruals |
$ |
$ |
||||||
Customer allowances earned |
||||||||
Finished goods liabilities |
||||||||
Core bank liability |
||||||||
Accrued core payment |
||||||||
Total long-term contract liabilities |
$ |
$ |
||||||
10. Leases
The Company leases various facilities in North America and Asia under operating leases expiring through August 2033. During the year ended March 31, 2021, the following material operating leases commenced: (i) the lease of the Company’s 173,000 square foot core induction, warehouse, and office facility in Mexico, which resulted in an increase in the operating lease liability of $12,724,000 and (ii) the renewal of the Company’s 157,000 square foot remanufacturing, warehouse, and office facility in Canada, which resulted in an increase in the operating lease liability of $2,715,000 . During the first quarter of fiscal 2022, the Company renewed the lease for its corporate headquarters in Torrance, California, for an additional 10 -year period, and accordingly it is not included in the operating lease assets and operating lease liabilities as of March 31, 2021. Total commitments for this agreement, which expires in , are $20,789,000 . The Company also has finance leases for certain office and manufacturing equipment, which generally range from to five years .
The Company has material non-functional currency leases, which resulted in a remeasurement gain of $9,893,000 compared with a loss of $11,710,000 during the years ended March 31, 2021 and 2020, respectively. These remeasurement gains and losses are included in “foreign exchange impact of lease liabilities and forward contracts” in the consolidated statements of operations.
Balance sheet information for leases is comprised of the following:
March 31, 2021 |
March 31, 2020 |
||||||||
Leases |
Classification |
||||||||
Assets: |
|||||||||
Operating |
Operating lease assets |
$ |
$ |
||||||
Finance |
Plant and equipment |
||||||||
Total leased assets |
$ |
$ |
|||||||
Liabilities: |
|||||||||
Current |
|||||||||
Operating |
Operating lease liabilities |
$ |
$ |
||||||
Finance |
Other current liabilities |
||||||||
Long-term |
|||||||||
Operating |
Long-term operating lease liabilities |
||||||||
Finance |
Other liabilities |
||||||||
Total lease liabilities |
$ |
$ |
|||||||
Lease cost recognized in the consolidated statement of operations is comprised of the following:
Years Ended March 31, |
||||||||
2021 |
2020 |
|||||||
Lease cost |
||||||||
Operating lease cost (1) |
$ |
$ |
||||||
Short-term lease cost |
||||||||
Variable lease cost |
||||||||
Finance lease cost: |
||||||||
Amortization of finance lease assets |
||||||||
Interest on finance lease liabilities |
||||||||
Total lease cost |
$ |
$ |
||||||
| (1) |
Maturities of lease commitments at March 31, 2021 were as follows:
Maturity of lease liabilities |
Operating Leases |
Finance Leases |
Total |
|||||||||
2022 |
$ |
$ |
$ |
|||||||||
2023 |
||||||||||||
2024 |
||||||||||||
2025 |
||||||||||||
2026 |
||||||||||||
Thereafter |
||||||||||||
Total lease payments |
||||||||||||
Less amount representing interest |
( |
) |
( |
) |
( |
) |
||||||
Present value of lease liabilities |
$ |
$ |
$ |
|||||||||
Other information about leases is as follows:
March 31, 2021 |
March 31, 2020 |
|||||||
Lease term and discount rate |
||||||||
Weighted-average remaining lease term (years): |
||||||||
Finance leases |
||||||||
Operating leases |
||||||||
Weighted-average discount rate: |
||||||||
Finance leases |
% |
% |
||||||
Operating leases |
% |
% |
||||||
11. Accounts Receivable Discount Programs
The Company uses receivable discount programs with certain customers and their respective banks. Under these programs, the Company may sell those customers’ receivables to those banks at a discount to be agreed upon at the time the receivables are sold. These discount arrangements allow the Company to accelerate receipt of payment on customers’ receivables.
The following is a summary of the Company’s accounts receivable discount programs:
Years Ended March 31, |
||||||||
2021 |
2020 |
|||||||
Receivables discounted |
$ |
$ |
||||||
Weighted average days |
||||||||
Weighted average discount rate |
% |
% |
||||||
Amount of discount as interest expense |
$ |
$ |
||||||
12. Financial Risk Management and Derivatives
Purchases and expenses denominated in currencies other than the U.S. dollar, which are primarily related to the Company’s facilities overseas, expose the Company to market risk from material movements in foreign exchange rates between the U.S. dollar and the foreign currencies. The Company’s primary risk exposure is from fluctuations in the value of the Mexican peso and to a lesser extent the Chinese yuan. To mitigate these risks, the Company enters into forward foreign currency exchange contracts to exchange U.S. dollars for these foreign currencies. The extent to which forward foreign currency exchange contracts are used is modified periodically in response to the Company’s estimate of market conditions and the terms and length of anticipated requirements.
The Company enters into forward foreign currency exchange contracts in order to reduce the impact of foreign currency fluctuations and not to engage in currency speculation. The use of derivative financial instruments allows the Company to reduce its exposure to the risk that the eventual cash outflow resulting from funding the expenses of the foreign operations will be materially affected by changes in exchange rates between the U.S. dollar and the foreign currencies. The Company does not hold or issue financial instruments for trading purposes. The forward foreign currency exchange contracts are designated for forecasted expenditure requirements to fund foreign operations.
The Company had forward foreign currency exchange contracts with a U.S. dollar equivalent notional value of $41,819,000 and $42,052,000 at March 31, 2021 and 2020, respectively. These contracts generally have a term of one year or less, at rates agreed at the inception of the contracts. The counterparty to this derivative transaction is a major financial institution with investment grade credit rating; however, the Company is exposed to credit risk with this institution. The credit risk is limited to the potential unrealized gains (which offset currency fluctuations adverse to the Company) in any such contract should this counterparty fail to perform as contracted. Any changes in the fair values of forward foreign currency exchange contracts are included in “foreign exchange impact of lease liabilities and forward contracts” in the consolidated statements of operations.
The following shows the effect of the Company’s derivative instruments on its consolidated statements of operations:
Gain (Loss) Recognized as Foreign Exchange Impact of Lease Liabilities and Forward Contracts |
||||||||||||
Derivatives Not Designated as |
Years Ended March 31, |
|||||||||||
Hedging Instruments |
2021 |
2020 |
2019 |
|||||||||
Forward foreign currency exchange contracts |
$ |
$ |
( |
) |
$ |
( |
) |
|||||
The fair value of the forward foreign currency exchange contracts of $1,429,000 is included in prepaid and other current assets in the consolidated balance sheet at March 31, 2021. The fair value of the forward foreign currency exchange contracts of $6,284,000 is included other current liabilities in the accompanying consolidated balance sheet at March 31, 2020. The changes in the fair values of forward foreign currency exchange contracts are included in “foreign exchange impact of lease liabilities and forward contracts” in the consolidated statements of cash flows for the years ended March 31, 2021, 2020, and 2019.
13. Fair Value Measurements
The Company defines fair value as the price that would be received to sell an asset or paid to transfer a liability (an exit price) in the principal or most advantageous market for the asset or liability in an orderly transaction between market participants on the measurement date. The Company uses a three-tier valuation hierarchy based upon observable and unobservable inputs:
| • | Level 1 — Valuation is based upon quoted prices (unadjusted) in active markets for identical assets or liabilities. |
| • | Level 2 — Valuation is based upon quoted prices for similar assets and liabilities in active markets, or other inputs that are observable for the asset or liability, either directly or indirectly, for substantially the full term of the financial instrument. |
| • | Level 3 — Valuation is based upon unobservable inputs that are significant to the fair value measurement. |
The fair value hierarchy requires the use of observable market data when available. In instances in which the inputs used to measure fair value fall into different levels of the fair value hierarchy, the fair value measurement has been determined based on the lowest level input that is significant to the fair value measurement in its entirety. The Company’s assessment of the significance of a particular item to the fair value measurement in its entirety requires judgment, including the consideration of inputs specific to the asset or liability.
The following sets forth by level within the fair value hierarchy, the Company’s financial assets and liabilities that were accounted for at fair value on a recurring basis according to the valuation techniques the Company used to determine their fair values at:
March 31, 2021 |
March 31, 2020 |
|||||||||||||||||||||||||||||||
Fair Value Measurements Using Inputs Considered as |
Fair Value Measurements Using Inputs Considered as |
|||||||||||||||||||||||||||||||
Fair Value |
Level 1 |
Level 2 |
Level 3 |
Fair Value |
Level 1 |
Level 2 |
Level 3 |
|||||||||||||||||||||||||
Assets |
||||||||||||||||||||||||||||||||
Short-term investments |
||||||||||||||||||||||||||||||||
Mutual funds |
$ |
$ |
$ |
$ |
$ |
$ |
$ |
$ |
||||||||||||||||||||||||
Prepaid expenses and other current assets |
||||||||||||||||||||||||||||||||
Forward foreign currency exchange contracts |
||||||||||||||||||||||||||||||||
Liabilities |
||||||||||||||||||||||||||||||||
Accrued liabilities |
||||||||||||||||||||||||||||||||
Short-term contingent consideration |
||||||||||||||||||||||||||||||||
Other current liabilities |
||||||||||||||||||||||||||||||||
Deferred compensation |
||||||||||||||||||||||||||||||||
Forward foreign currency exchange contracts |
||||||||||||||||||||||||||||||||
Other liabilities |
||||||||||||||||||||||||||||||||
Long-term contingent consideration |
||||||||||||||||||||||||||||||||
Short-term Investments and Deferred Compensation
The Company’s short-term investments, which fund its deferred compensation liabilities, consist of investments in mutual funds. These investments are classified as Level 1 as the shares of these mutual funds trade with sufficient frequency and volume to enable the Company to obtain pricing information on an ongoing basis.
Forward Foreign Currency Exchange Contracts
The forward foreign currency exchange contracts are primarily measured based on the foreign currency spot and forward rates quoted by the banks or foreign currency dealers (See Note 12).
Contingent Consideration
In December 2018, the Company completed the acquisition of certain assets and assumption of certain liabilities from Mechanical Power Conversion, LLC (“E&M”). In connection with this acquisition, the Company is contingently obligated to make additional payments to the former owners of E&M up to an aggregate of $5,200,000 over a three-year period.
E&M Research and Development (“R&D”) Event Milestone
In connection with the Company’s E&M acquisition in December 2018, it had a two-year R&D event milestone based on technology development and transfer. The milestone was achieved and, as a result, the Company paid $1,250,000 to the former owners of E&M during the year ended March 31, 2021. The fair value of the two-year R&D event milestone was $1,130,000 at March 31, 2020, determined using a probability weighted method with commensurate with the term of the contingent consideration.
E&M Gross Profit Earn-out Consideration
The fair value of the three-year 910,000 and $1,230,000 at March 31, 2021 and 2020, respectively, determined using a Monte Carlo Simulation Model. Any subsequent changes in the fair value of the contingent consideration liability will be recorded in current period earnings as a general and administrative expense. The second year milestone was achieved and, as a result, the Company paid $723,000 to the former owners of E&M during the year ended March 31, 2021.
The assumptions used to determine the fair value is as follows:
March 31, 2021 |
March 31, 2020 |
|||||||
Risk free interest rate |
% |
% |
||||||
Counter party rate |
% |
% |
||||||
Expected volatility |
% |
% |
||||||
Weighted average cost of capital |
% |
% |
||||||
Dixie Revenue Earn-out Consideration
In January 2019, the Company completed the acquisition of all the equity interests of Dixie. In connection with this acquisition, the Company was contingently obligated to make additional payments to the former owners of Dixie up to $1,130,000 over a two-year period. The fair value of the two-year 0 and $293,000 at March 31, 2021 and 2020, determined using a Monte Carlo Simulation Model.
The following table summarizes the activity for financial assets and liabilities utilizing Level 3 fair value measurements:
Years Ended March 31, |
||||||||
2021 |
2020 |
|||||||
Contingent Consideration |
Contingent Consideration |
|||||||
Beginning balance |
$ |
$ |
||||||
Newly issued |
||||||||
Changes in revaluation of contingent consideration included in earnings |
( |
) |
||||||
Exercises/settlements |
( |
) |
( |
) |
||||
Ending balance |
$ |
$ |
||||||
During the years ended March 31, 2021 and 2020, the Company had no significant measurements of assets or liabilities at fair value on a nonrecurring basis subsequent to their initial recognition.
The carrying amounts of cash and cash equivalents, accounts receivable, accounts payable and accrued liabilities approximate their fair value due to the short-term nature of these instruments. The carrying amounts of the revolving loan, term loan and other long-term liabilities approximate their fair value based on the variable nature of interest rates and current rates for instruments with similar characteristics.
14. Commitments and Contingencies
Warranty Returns
The Company allows its customers to return goods that their consumers have returned to them, whether or not the returned item is defective (“warranty returns”). The Company accrues an estimate of its exposure to warranty returns based on a historical analysis of the level of this type of return as a percentage of total unit sales. Amounts charged to expense for these warranty returns are considered in arriving at the Company’s net sales.
The following summarizes the changes in the warranty return accrual:
Years Ended March 31, |
||||||||||||
2021 |
2020 |
2019 |
||||||||||
Balance at beginning of year |
$ |
$ |
$ |
|||||||||
Acquisition (1) |
||||||||||||
Charged to expense |
||||||||||||
Amounts processed |
( |
) |
( |
) |
( |
) |
||||||
Balance at end of year |
$ |
$ |
$ |
|||||||||
| (1) |
Commitments to Provide Marketing Allowances under Long-Term Customer Contracts
The Company has or is renegotiating long-term agreements with many of its major customers. Under these agreements, which in most cases have initial terms of at least four years , the Company is designated as the exclusive or primary supplier for specified categories of the Company’s products. Because of the very competitive nature of the market and the limited number of customers for these products, the Company’s customers have sought and obtained price concessions, significant marketing allowances, and more favorable delivery and payment terms in consideration for the Company’s designation as a customer’s exclusive or primary supplier. These incentives differ from contract to contract and can include (i) the issuance of a specified amount of credits against receivables in accordance with a schedule set forth in the relevant contract, (ii) support for a particular customer’s research or marketing efforts provided on a scheduled basis, (iii) discounts granted in connection with each individual shipment of product, and (iv) other marketing, research, store expansion or product development support. These contracts typically require that the Company meet ongoing performance standards. The Company’s contracts with its customers expire at various dates through December 2024. While these longer-term agreements strengthen the Company’s customer relationships, the increased demand for the Company’s products often requires that the Company increase its inventories and personnel. Customer demands that the Company purchase their Remanufactured Core inventory also require the use of the Company’s working capital.
The marketing and other allowances the Company typically grants its customers in connection with its new or expanded customer relationships adversely impact the near-term revenues, profitability, and associated cash flows from these arrangements. Such allowances include sales incentives and concessions and typically consist of: (i) allowances which may only be applied against future purchases and are recorded as a reduction to revenues in accordance with a schedule set forth in the long-term contract, (ii) allowances related to a single exchange of product that are recorded as a reduction of revenues at the time the related revenues are recorded or when such incentives are offered, and (iii) amortization of core premiums paid to customers generally in connection with new business.
The following summarizes the breakout of allowances discussed above, recorded as a reduction to revenues:
Years Ended March 31, |
||||||||||||
2021 |
2020 |
2019 |
||||||||||
Allowances incurred under long-term customer contracts |
$ |
$ |
$ |
|||||||||
Allowances related to a single exchange of product |
||||||||||||
Amortization of core premiums paid to customers |
||||||||||||
Total customer allowances recorded as a reduction of revenues |
$ |
$ |
$ |
|||||||||
The following presents the Company’s commitments to incur allowances, excluding allowances related to a single exchange of product, which will be recognized as a reduction to revenue when the related revenue is recognized:
Year Ending March 31, |
||||
2022 |
$ |
|||
2023 |
||||
2024 |
||||
2025 |
||||
2026 |
||||
Thereafter |
||||
Total marketing allowances |
$ |
|||
Contingencies
The Company is subject to various lawsuits and claims. In addition, government agencies and self-regulatory organizations have the ability to conduct periodic examinations of and administrative proceedings regarding the Company’s business. Following an audit in fiscal 2019, the U.S. Customs and Border Protection stated that it believed that the Company owed additional duties of approximately $17 million from 2011 through mid-2018 relating to products that it imported from Mexico. The Company does not believe that this amount is correct and believes that it has numerous defenses and is disputing this amount vigorously. The Company cannot assure that the U.S. Customs and Border Protection will agree or that it will not need to accrue or pay additional amounts in the future.
15. Significant Customer and Other Information
Significant Customer Concentrations
The Company’s largest customers accounted for the following total percentage of net sales:
Years Ended March 31, |
||||||||||||
2021 |
2020 |
2019 |
||||||||||
Customer A |
% |
% |
% |
|||||||||
Customer B |
% |
% |
% |
|||||||||
Customer C |
% |
% |
% |
|||||||||
The Company’s largest customers accounted for the following total percentage of accounts receivable — trade:
March 31, 2021 |
March 31, 2020 |
|||||||
Customer A |
% |
% |
||||||
Customer B |
% |
% |
||||||
Customer C |
% |
|||||||
Geographic and Product Information
The Company’s products are predominantly sold in the U.S. and accounted for the following total percentage of net sales:
Years Ended March 31, |
||||||||||||
2021 |
2020 |
2019 |
||||||||||
Rotating electrical products |
% |
% |
% |
|||||||||
Wheel hub products |
% |
% |
% |
|||||||||
Brake-related products |
% |
% |
% |
|||||||||
Other products |
% |
% |
% |
|||||||||
% |
% |
% |
||||||||||
Significant Supplier Concentrations
No suppliers accounted for more than 10% of the Company’s inventory purchases for the years ended March 31, 2021, 2020, and 2019.
16. Income Taxes
The income tax expense (benefit) is as follows:
Years Ended March 31, |
||||||||||||
2021 |
2020 |
2019 |
||||||||||
Current tax expense |
||||||||||||
Federal |
$ |
$ |
$ |
|||||||||
State |
||||||||||||
Foreign |
||||||||||||
Total current tax expense |
||||||||||||
Deferred tax (benefit) expense |
||||||||||||
Federal |
( |
) |
( |
) |
( |
) |
||||||
State |
( |
) |
( |
) |
||||||||
Foreign |
( |
) |
( |
) |
||||||||
Total deferred tax benefit |
( |
) |
( |
) |
( |
) |
||||||
Total income tax expense (benefit) |
$ |
$ |
( |
) |
$ |
|||||||
Deferred income taxes consist of the following:
March 31, 2021 |
March 31, 2020 |
|||||||
Assets |
||||||||
Allowance for bad debts |
$ |
$ |
||||||
Customer allowances earned |
||||||||
Allowance for stock adjustment returns |
||||||||
Inventory adjustments |
||||||||
Stock options |
||||||||
Operating lease liabilities |
||||||||
Estimate for returns |
||||||||
Accrued compensation |
||||||||
Net operating losses |
||||||||
Tax credits |
||||||||
Other |
||||||||
Total deferred tax assets |
$ |
$ |
||||||
Liabilities |
||||||||
Plant and equipment, net |
( |
) |
( |
) |
||||
Intangibles, net |
( |
) |
( |
) |
||||
Operating lease |
( |
) |
( |
) |
||||
Other |
( |
) |
( |
) |
||||
Total deferred tax liabilities |
$ |
( |
) |
$ |
( |
) |
||
Less valuation allowance |
$ |
( |
) |
$ |
( |
) |
||
Total |
$ |
$ |
||||||
As of March 31, 2021, the Company had federal net operating loss carryforwards of $828,000 related to its January 2019 acquisition, state net operating loss carryforwards of $1,130,000 and foreign net operating loss carryforwards of $14,931,000 . The federal net operating loss carryforwards expire beginning fiscal year , the state net operating loss carryforwards expire beginning fiscal year , and the foreign net operating loss carryforwards expire beginning fiscal year . As of March 31, 2021, the Company also had non-US tax credit carryforwards of $1,828,000 , which will expire beginning fiscal year . A full valuation allowance was established on the federal and foreign net operating loss and tax credits carryforward as the Company believes it is more likely than not these tax attributes would not be realizable in the future. The net increase in the valuation allowance was $670,000 during the year ended March 31, 2021.
Realization of deferred tax assets is dependent upon the Company’s ability to generate sufficient future taxable income. Significant judgment is required in determining the Company’s provision for income taxes, deferred tax assets and liabilities and any valuation allowance recorded against the Company’s net deferred tax assets. The Company makes these estimates and judgments about its future taxable income that are based on assumptions that are consistent with the Company’s future plans. A valuation allowance is established when the Company believes it is not more likely than not all or some of a deferred tax assets will be realized. In evaluating the Company’s ability to recover deferred tax assets within the jurisdiction in which they arise, the Company considers all available positive and negative evidence. Deferred tax assets arising primarily as a result of non-US net operating loss carry-forwards and non-US research and development credits in connection with the Company’s Canadian operations have been offset completely by a valuation allowance due to the uncertainty of their utilization in future periods. Should the actual amount differ from the Company’s estimates, the amount of the valuation allowance could be impacted.
For the years ended March 31, 2021, 2020, and 2019, the primary components of the Company’s income tax expense were (i) federal income taxes, (ii) state income taxes, (iii) foreign income taxed at rates that are different from the federal statutory rate, (iv) change in realizable deferred tax items, (v) impact of the non-deductible executive compensation under Internal Revenue Code Section 162(m), (vi) income taxes associated with uncertain tax positions, and (vii) the impact of net operating loss carry-backs in connection with the CARES Act.
The difference between the income tax expense at the federal statutory rate and the Company’s effective tax rate is as follows:
Years Ended March 31, |
||||||||||||
2021 |
2020 |
2019 |
||||||||||
Statutory federal income tax rate |
% |
% |
% |
|||||||||
State income tax rate, net of federal benefit |
% |
( |
)% |
( |
)% |
|||||||
Excess tax benefit from stock compensation |
% |
( |
)% |
% |
||||||||
Foreign income taxed at different rates |
% |
% |
- |
% |
||||||||
Return to provision adjustments |
% |
( |
)% |
- |
% |
|||||||
Non-deductible executive compensation |
% |
( |
)% |
( |
)% |
|||||||
Change in valuation allowance |
% |
( |
)% |
( |
)% |
|||||||
Net operating loss carryback |
- |
% |
% |
- |
% |
|||||||
Uncertain tax positions |
% |
% |
% |
|||||||||
Research and development credit |
( |
)% |
% |
% |
||||||||
Non-deductible transaction costs |
- |
% |
- |
% |
( |
)% |
||||||
Other income tax |
% |
( |
)% |
% |
||||||||
% |
% |
( |
)% |
|||||||||
The Company and its subsidiaries file income tax returns in the U.S. federal jurisdiction and various state and foreign jurisdictions with varying statutes of limitations. At March 31, 2021, the Company is not under examination in any jurisdiction and the years ended March 31, 2017 through 2020 remain subject to examination. The Company believes no significant changes in the unrecognized tax benefits will occur within the next 12 months.
A reconciliation of the beginning and ending amount of unrecognized tax benefits is as follows:
Years Ended March 31, |
||||||||||||
2021 |
2020 |
2019 |
||||||||||
Balance at beginning of period |
$ |
$ |
$ |
|||||||||
Additions based on tax positions related to the current year |
||||||||||||
Additions for tax positions of prior year |
||||||||||||
Reductions for tax positions of prior year |
( |
) |
( |
) |
( |
) |
||||||
Balance at end of period |
$ |
$ |
$ |
|||||||||
At March 31, 2021, 2020 and 2019, there are $923,000 , $823,000 and $938,000 of unrecognized tax benefits that if recognized would affect the annual effective tax rate.
The Company recognizes interest and penalties accrued related to unrecognized tax benefits as part of income tax expense. During the years ended March 31, 2021, 2020, and 2019, the Company recognized approximately $(16,000 ), $(50,000 ), and $(23,000 ) in interest and penalties, respectively. The Company had approximately $58,000 and $74,000 for the payment of interest and penalties accrued at March 31, 2021 and 2020, respectively.
The Company intends to indefinitely reinvest its undistributed earnings from foreign subsidiaries in foreign operations and no incremental U.S. tax or withholding taxes have been provided for these earnings.
17. Defined Contribution Plans
The Company has a 401(k) plan covering all employees who are 21 years of age with at least six months of service. The plan permits eligible employees to make contributions up to certain limitations, with the Company matching 50 % of each participating employee’s contribution up to the first 6 % of employee compensation. Employees are immediately vested in their voluntary employee contributions and vest in the Company’s matching contributions ratably over five years . The Company’s matching contribution to the 401(k) plan was $507,000 , $496,000 , and $445,000 for the years ended March 31, 2021, 2020, and 2019, respectively.
18. Share-based Payments
At March 31, 2021, there were 342,000 shares of the Company’s common stock reserved for grants to the Company’s non-employee directors under the 2014 Non-Employee Director Incentive Award Plan (the “2014 Plan”). Under the 2014 Plan, (i) 69,732 and 53,784 of restricted stock units were outstanding and (ii) 76,746 and 143,909 shares of common stock were available for grant under this plan at March 31, 2021 and 2020, respectively.
At March 31, 2021, there were 5,150,000 shares of common stock reserved for grant to all employees of the Company under the 2010 Incentive Award Plan (the “2010 Plan”). Under the 2010 Plan, (i) 184,752 and 148,199 shares of restricted stock units were outstanding, (ii) options to purchase 1,714,885 and 1,485,123 shares of common stock were outstanding, (iii) 100,000 and no restricted shares were outstanding, and (iv) 1,267,802 and 629,823 shares of common stock were available for grant at March 31, 2021 and 2020, respectively.
In addition, at March 31, 2021 and 2020, options to purchase 30,000 and 51,000 shares of common stock, respectively, were outstanding under the 2004 Non-Employee Director Stock Option Plan. No
The shares of common stock issued upon exercise of a previously granted stock option are considered new issuances from shares reserved for issuance upon adoption of the various plans.
Stock Options
The following is a summary of stock option transactions:
Number of Shares |
Weighted Average Exercise Price |
|||||||
Outstanding at March 31, 2020 |
$ |
|||||||
Granted |
$ |
|||||||
Exercised |
( |
) |
$ |
|||||
Forfeited |
( |
) |
$ |
|||||
Outstanding at March 31, 2021 |
$ |
|||||||
At March 31, 2021, options to purchase 603,256 shares of common stock were unvested at the weighted average exercise price of $17.10 .
Based on the market value of the Company’s common stock at March 31, 2021, 2020, and 2019, the pre-tax intrinsic value of options exercised was $546,000 , $508,000 , and $788,000 , respectively. The total fair value of stock options vested during the years ended March 31, 2021, 2020, and 2019 was $2,184,000 , $2,189,000 , and $1,973,000 , respectively.
The following summarizes information about the options outstanding at March 31, 2021:
Options Outstanding |
Options Exercisable |
|||||||||||||||||||||||||||
Range of Exercise price |
Shares |
Weighted Average Exercise Price |
Weighted Average Remaining Life In Years |
Aggregate Intrinsic Value |
Shares |
Weighted Average Exercise Price |
Weighted Average Remaining Life In Years |
Aggregate Intrinsic Value |
||||||||||||||||||||
$ |
$ |
$ |
||||||||||||||||||||||||||
$ |
||||||||||||||||||||||||||||
$ |
||||||||||||||||||||||||||||
$ |
||||||||||||||||||||||||||||
$ |
||||||||||||||||||||||||||||
$ |
$ |
$ |
$ |
|||||||||||||||||||||||||
The aggregate intrinsic values in the above table represent the pre-tax value of all in-the-money options if all such options had been exercised on March 31, 2021 based on the Company’s closing stock price of $22.50 as of that date.
At March 31, 2021, there was $2,745,000 of total unrecognized compensation expense from stock-based compensation granted under the plans, which is related to non-vested shares. The compensation expense is expected to be recognized over a weighted average vesting period of 1.8 years.
Restricted Stock Units and Restricted Stock (collectively “RSUs”)
During the years ended March 31, 2021 and 2020 the Company granted 251,801 and 113,483 shares of RSUs, respectively, with an estimated grant date fair value of $4,150,000 and $2,112,000 , respectively, which was based on the closing market price on the date of grant. The fair value related to these awards is recognized as compensation expense over the vesting period. These awards generally vest in three equal installments beginning each anniversary from the grant date, subject to continued employment. Upon vesting, these awards may be net share settled to cover the required withholding tax with the remaining amount converted into an equivalent number of shares of common stock. Total shares withheld during the years ended March 31, 2021 and 2020 were 22,202 and 58,802 , respectively, based on the value of these awards as determined by the Company’s closing stock price on the vesting date.
The following is a summary of non-vested RSUs:
Number of Shares |
Weighted Average Grant Date Fair Value |
|||||||
Non-vested at March 31, 2020 |
$ |
|||||||
Granted |
$ |
|||||||
Vested |
( |
) |
$ |
|||||
Forfeited |
( |
) |
$ |
|||||
Non-vested at March 31, 2021 |
$ |
|||||||
As of March 31, 2021, there was $3,637,000 of unrecognized compensation expense related to these awards, which will be recognized over the remaining vesting period of approximately 1.6 years.
19. Share Repurchase Program
The Company’s board of directors approved a stock repurchase program of up to $37,000,000 of its common stock. During the years ended March 31, 2021 and 2019, the Company repurchased 54,960 and 163,815 shares of its common stock, respectively, for $1,139,000 and $4,062,000 , respectively. During the year ended March 31, 2020 the Company did no t repurchase any shares of its common stock. As of March 31, 2021, $16,831,000 was utilized and $20,169,000 remains available to repurchase shares under the authorized share repurchase program, subject to the limit in the Company’s Credit Facility. The Company retired the 730,521 shares repurchased under this program through March 31, 2021. The Company’s share repurchase program does not obligate it to acquire any specific number of shares and shares may be repurchased in privately negotiated and/or open market transactions.
20. Subsequent Event
Credit Facility
On May 28, 2021, the Company entered into a third amendment to the Amended Credit Facility (the “Third Amendment”). The Third Amendment, among other things, (i) extends the maturity date to May 28, 2026 from June 5, 2023 , (ii) modifies the fixed charge coverage ratio financial covenant, and (iii) modifies the definition of “Consolidated EBITDA”. The modifications to the financial covenants were effective as of March 31, 2021.
21. Unaudited Quarterly Financial Data
The following summarizes selected quarterly financial data for the year ended March 31, 2021:
First Quarter |
Second Quarter |
Third Quarter |
Fourth Quarter |
|||||||||||||
Net sales |
$ |
$ |
$ |
$ |
||||||||||||
Cost of goods sold |
||||||||||||||||
Gross profit |
||||||||||||||||
Operating expenses: |
||||||||||||||||
General and administrative |
||||||||||||||||
Sales and marketing |
||||||||||||||||
Research and development |
||||||||||||||||
Foreign exchange impact of lease liabilities and forward contracts |
( |
) |
( |
) |
( |
) |
||||||||||
Total operating expenses |
||||||||||||||||
Operating income |
||||||||||||||||
Other expense: |
||||||||||||||||
Interest expense, net |
||||||||||||||||
Income (loss) before income tax expense (benefit) |
( |
) |
||||||||||||||
Income tax expense (benefit) |
( |
) |
||||||||||||||
Net income (loss) |
$ |
( |
) |
$ |
$ |
$ |
||||||||||
Basic net income (loss) per share |
$ |
( |
) |
$ |
$ |
$ |
||||||||||
Diluted net income (loss) per share |
$ |
( |
) |
$ |
$ |
$ |
||||||||||
The following summarizes selected quarterly financial data for the year ended March 31, 2020:
First Quarter |
Second Quarter |
Third Quarter |
Fourth Quarter |
|||||||||||||
Net sales |
$ |
$ |
$ |
$ |
||||||||||||
Cost of goods sold |
||||||||||||||||
Gross profit |
||||||||||||||||
Operating expenses: |
||||||||||||||||
General and administrative |
||||||||||||||||
Sales and marketing |
||||||||||||||||
Research and development |
||||||||||||||||
Foreign exchange impact of lease liabilities and forward contracts |
( |
) |
( |
) |
||||||||||||
Total operating expenses |
||||||||||||||||
Operating income |
( |
) |
( |
) |
||||||||||||
Other expense: |
||||||||||||||||
Interest expense, net |
||||||||||||||||
Income (loss) before income tax expense (benefit) |
( |
) |
( |
) |
||||||||||||
Income tax expense (benefit) |
( |
) |
( |
) |
||||||||||||
Net income (loss) |
$ |
( |
) |
$ |
$ |
$ |
( |
) |
||||||||
Basic net income (loss) per share |
$ |
( |
) |
$ |
$ |
$ |
( |
) |
||||||||
Diluted net income (loss) per share |
$ |
( |
) |
$ |
$ |
$ |
( |
) |
||||||||
Quarterly and year-to-date computations of per share amounts are made independently. Therefore, the sum of per share amounts for the quarters may not agree with per share amounts for the year shown elsewhere in the Annual Report on Form 10-K.
Schedule II — Valuation and Qualifying Accounts
Accounts Receivable — Allowance for credit losses
Years Ended March 31, |
Description |
Balance at beginning of year |
Charge to (recovery of) bad debts expense |
Acquisition |
Amounts written off |
Balance at end of year |
|||||||||||||||
2021 |
Allowance for credit losses |
$ |
$ |
( |
) |
$ |
$ |
$ |
|||||||||||||
2020 |
Allowance for credit losses |
$ |
$ |
$ |
$ |
$ |
|||||||||||||||
2019 |
Allowance for credit losses |
$ |
$ |
$ |
(1) |
$ |
$ |
||||||||||||||
| (1) |
Accounts Receivable — Allowance for customer-payment discrepancies
Years Ended March 31, |
Description |
Balance at beginning of year |
Charge to discrepancies expense |
Acquisition |
Amounts Processed |
Balance at end of year |
|||||||||||||||
2021 |
Allowance for customer-payment discrepancies |
$ |
$ |
$ |
$ |
$ |
|||||||||||||||
2020 |
Allowance for customer-payment discrepancies |
$ |
$ |
$ |
$ |
$ |
|||||||||||||||
2019 |
Allowance for customer-payment discrepancies |
$ |
$ |
$ |
$ |
$ |
|||||||||||||||
Inventory — Allowance for excess and obsolete inventory
Years Ended March 31, |
Description |
Balance at beginning of year |
Provision for excess and obsolete inventory |
Acquisition |
Amounts written off |
Balance at end of year |
|||||||||||||||
2021 |
0Allowance for excess and obsolete inventory |
$ |
$ |
$ |
$ |
$ |
|||||||||||||||
2020 |
Allowance for excess and obsolete inventory |
$ |
$ |
$ |
$ |
$ |
|||||||||||||||
2019 |
Allowance for excess and obsolete inventory |
$ |
$ |
$ |
$ |
$ |
|||||||||||||||
S-1
Serious News for Serious Traders! Try StreetInsider.com Premium Free!
You May Also Be Interested In
- ROSEN, TOP RANKED INVESTOR COUNSEL, Encourages Shoals Technologies Group, Inc. Investors to Secure Counsel Before Important Deadline in Securities Class Action – SHLS
- Bombardier Announces the Election of its Board of Directors
- Intuitive Announces Board of Directors Elections and Retirements
Create E-mail Alert Related Categories
SEC FilingsSign up for StreetInsider Free!
Receive full access to all new and archived articles, unlimited portfolio tracking, e-mail alerts, custom newswires and RSS feeds - and more!
