

Form 10-K HAVERTY FURNITURE COMPAN For: Dec 31
 Tweet
Tweet Share
ShareUNITED STATES SECURITIES AND
EXCHANGE COMMISSION
Washington,
D.C. 20549
FORM 10-K
For the fiscal year ended December 31, 2021
OR
For the transition period from _____ to _____
Commission file number: 1-14445
|
|
|
|
(State of Incorporation)
|
(IRS Employer Identification Number)
|
|
|
|
|
(Address of principal executive offices)
|
|
|
(
|
|
|
(Registrant’s telephone number, including area code)
|
|
Securities registered pursuant to Section 12(b) of the Securities Exchange Act of 1934
|
Title of each class
|
Trading Symbol(s)
|
Name of each exchange on which registered
|
|
|
|
|
|
|
|
|
Securities registered pursuant to Section 12(g) of the Act: None.
Indicate by check mark if the registrant is a well-known seasoned issuer, as defined in Rule 405 of the Securities Act. Yes ☐
No ☒
Indicate by check mark if the registrant is not required to file reports pursuant to Section 13 or Section 15(d) of the Act. Yes ☐
No ☒
Indicate by check mark whether the registrant (1) has filed all reports required to be filed by Section 13 or 15(d) of the Securities Exchange Act of 1934 during
the preceding 12 months (or for such shorter period that the registrant was required to file such reports), and (2) has been subject to such filing requirements for the past 90 days. Yes ☒ No ☐
Indicate by check mark whether the registrant has submitted electronically every
Interactive Data File required to be submitted pursuant to Rule 405 of Regulation S-T (§232.405 of this chapter) during the preceding 12 months (or for such shorter period that the registrant was required to submit such files). Yes ☒ No ☐
Indicate by check mark whether the registrant is a large accelerated filer, an accelerated filer, a non-accelerated filer, a smaller reporting company or an
emerging growth company. See the definitions of “large accelerated filer,” “accelerated filer,” “smaller reporting company,” and “emerging growth company” i Rule 12b-2 of the Exchange Act.
|
|
Accelerated filer ☐
|
|
Non-accelerated filer ☐
|
Smaller reporting company
|
|
Emerging growth company
|
If an emerging growth company, indicate by check mark if the registrant has elected not to use the extended transition period for complying with any new or revised
financial accounting standards provided pursuant to Section 13(a) of the Exchange Act. ☐
Indicate by check mark whether the registrant has filed a report on and attestation to its management’s assessment of the effectiveness of its internal control
over financial reporting under Section 404(b) of the Sarbanes-Oxley Act (15 U.S.C. 7262(b)) by the registered public accounting firm that prepared or issued its audit report. ☒
Indicate by check mark whether the registrant is a shell company (as defined in Rule 12b-2 of the Act). Yes ☐ No ☒
As of June 30, 2021, the aggregate market value of the registrant’s common stock held by non-affiliates of the registrant was $733,304,138 (based on the closing sale prices of the registrant’s two classes of common stock as reported by the New York Stock Exchange).
There were 15,677,765 shares of common stock and 1,287,142 shares of Class A common stock, each with a par value of $1.00 per share outstanding at February 25, 2022.
DOCUMENTS INCORPORATED BY REFERENCE
Portions of the registrant’s Proxy Statement for the Annual Meeting of Stockholders to be held May 9, 2022 are incorporated by reference into Part III of this
Annual Report on Form 10-K.
HAVERTY FURNITURE COMPANIES, INC.
Annual Report on Form 10-K for the year ended December 31, 2021
|
PART I
|
|||
|
1
|
|||
|
5
|
|||
|
11
|
|||
|
12
|
|||
|
12
|
|||
|
12
|
|||
|
13
|
|||
|
PART II
|
|||
|
15
|
|||
|
17
|
|||
|
17
|
|||
|
26
|
|||
|
26
|
|||
|
27
|
|||
|
27
|
|||
|
29
|
|||
|
29
|
|||
|
PART III
|
|||
|
29
|
|||
|
29
|
|||
|
29
|
|||
|
29
|
|||
|
30
|
|||
|
PART IV
|
|||
|
30
|
|||
|
33
|
|||
FORWARD-LOOKING STATEMENTS
In addition to historical information, this document contains “forward-looking statements” – that is, statements related to future, not past, events. In this context, forward-looking statements often address our expected future business and
financial performance and financial condition. These statements are within the meaning of Section 27A of the Securities Act of 1933 and Section 21F of the Securities Exchange Act of 1934.
Forward-looking statements include, but are not limited to:
|
●
|
projections of sales or comparable store sales, gross profit, SG&A expenses, capital expenditures or other financial measures;
|
|
●
|
descriptions of anticipated plans or objectives of our management for operations or products;
|
|
●
|
forecasts of performance;
|
|
●
|
anticipated impact on our business of the continuing COVID-19 pandemic and other macro-economic conditions; and
|
|
●
|
assumptions regarding any of the foregoing.
|
Because these statements involve anticipated events or conditions, forward-looking statements often include words such as “anticipate,” “believe,” “estimate,”
“expect,” “intend,” “plan,” “project,” “target,” “can,” “could,” “may,” “should,” “will,” “would,” or similar expressions.
These forward-looking statements are based upon assessments and assumptions of management in light of historical results and trends, current conditions and potential future developments that often involve judgment, estimates, assumptions and
projections. Forward-looking statements reflect current views about our plans, strategies and prospects, which are based on information currently available.
Although we believe that our plans, intentions and expectations as reflected in or suggested by any forward-looking statements are reasonable, they are not guarantees. Actual results may differ materially from our anticipated results described
or implied in our forward-looking statements, and such differences may be due to a variety of factors. Our business could also be affected by additional factors that are presently unknown to us or that we currently believe to be immaterial to our
business. Important factors which could cause our actual results to differ materially from the forward-looking statements in this report include, but are not limited to, the following items, in addition to
those matters described in Risk Factors and Management’s Discussion and Analysis of Financial Condition and Results of Operations:
|
•
|
The continuing COVID-19 pandemic and its effect on our businesses and results of operations;
|
|
•
|
Competition from national, regional and local retailers of home furnishings;
|
|
•
|
Our failure to anticipate changes in consumer preferences;
|
|
•
|
Importing a substantial portion of our merchandise from foreign sources;
|
|
•
|
Significant fluctuations and volatility in the cost of raw materials and components;
|
|
•
|
Our dependence on third-party producers to meet our requirements;
|
|
•
|
A failure by our vendors to meet our quality control standards or comply with changes to the legislative or regulatory framework regarding product safety;
|
|
•
|
Risks in our supply chain;
|
|
•
|
The effects of labor disruptions or labor shortages;
|
|
•
|
The rise of oil and gasoline prices;
|
|
•
|
Increased transportation costs;
|
|
•
|
Damage to one of our distribution centers;
|
|
•
|
The vulnerability of our information technology infrastructure;
|
|
•
|
Changes in general domestic and international economic conditions such as inflation rates, interest rates, tax rates, unemployment rates, higher labor and healthcare costs, recessions, and changing government policies, laws and
regulations; and
|
|
•
|
Other risks and uncertainties as may be detailed from time to time in our public announcements and Securities and Exchange Commission filings.
|
i
Discussed elsewhere in further detail in this report are some important risks, uncertainties and contingencies which could cause our actual results, performance or achievements to be materially different from any forward-looking statements made
or implied in this report.
Forward-looking statements are only as of the date they are made and they might not be updated to reflect changes as they occur after the forward-looking statements are made. We assume no obligations to update publicly any forward-looking
statements, whether as a result of new information, future events or otherwise. In evaluating forward-looking statements, you should consider these risks and uncertainties, together with the other risks described from time to time in our other
reports and documents filed with the Securities and Exchange Commission, or SEC, and you should not place undue reliance on those statements.
We intend for any forward-looking statements to be covered by, and we claim the protection under, the safe harbor provisions for forward-looking statements contained in the Private Securities Litigation Reform Act of 1995.
ii
ITEM 1. BUSINESS
Unless otherwise indicated by the context, we use the terms “Havertys,” “we,” “our,” or “us” when referring to the consolidated operations of Haverty Furniture Companies, Inc. and subsidiary.
Overview
Havertys is a specialty retailer of residential furniture and accessories. Our founder, J.J. Haverty began the business in 1885 in Atlanta, Georgia with one store and made deliveries using horse-drawn wagons. The Company grew to 18 stores and
was incorporated in September 1929. Anticipating further growth, the Company accessed additional capital through its initial public offering in October 1929.
Havertys has grown to 121 stores in 16 states in the Southern and Midwest regions. All of our retail locations are operated using the Havertys name and we do not franchise our stores. Our brand recognition is very high in the markets we serve,
and consumer surveys indicate Havertys is associated with a high level of quality, fashion, value, and service.
Customers
Havertys customers are typically well-educated women in middle to upper-to-middle income households. They generally own homes in the suburbs and their diverse personalities are reflected in their unique sense of style. These consumers research
and shop online and in-store, often engaging friends or family members in the purchasing process. They are discerning buyers, desiring furnishings that fit their style, but never sacrificing quality. Our marketing, merchandising, stores, online
presence, and customer service are targeted to attract and meet the needs of our distinctive customers.
Merchandise and Revenues
We develop our merchandise selection to meet the diverse taste of our typical “on trend” customer in mind. A wide range of styles from traditional to contemporary are in our core assortment and virtually all of the furniture merchandise we carry
bears the Havertys brand. We also tailor our product offerings to the needs and tastes of the local markets we serve emphasizing more “coastal,” “western” or “urban” looks as appropriate. Our custom upholstery programs and eclectic looks are an
important part of our product mix and allow the on-trend consumer more self-expression.
We have avoided offering lower quality, promotional price-driven merchandise favored by many regional and national chains, which we believe would devalue the Havertys brand with the consumer. We carry nationally well-known mattress product lines
such as Tempur-Pedic®, Serta®, Sealy® and Stearns and Foster®.
Our customers use varying methods to purchase or finance their sales. As an added convenience to our customers, we offer financing by third-party finance companies. Sales financed by the third-party providers are not Havertys’ receivables;
accordingly, we do not have any credit risk or servicing responsibility for these accounts, and there is no credit or collection recourse to Havertys. Slightly less than one-third of our sales are third-party financed. The fees we pay to the
third-party are included in our selling, general, and expenses (“SG&A”) as a selling expense.
1
Stores
As of December 31, 2021, we operated 121 stores serving 85 cities in 16 states with approximately 4.4 million retail square feet. Our stores range in size from 15,000 to 60,000 selling square feet with the average being approximately 35,000
square feet. We strive to have our stores reflect the distinctive style and comfort consumers expect to find when purchasing their home furnishings. The store’s location and curb appeal are important to the middle to upper-middle income consumer
that we target, and attractive facades complement the quality and style of our merchandise. Interior details are also important for a pleasant and inviting shopping experience. We are very intentional in having open shopping spaces and our
disciplined merchandise display ensures uniformity of presentations in-store, online and in our advertising.
We currently have no plans to add stores outside our distribution footprint. The planned expansion of our current distribution capabilities will enable us to consider additional markets that we do not presently serve. We are evaluating certain
existing stores for relocation or closure. We expect an approximate 1% increase in our retail square footage in 2022.
Online Presence
We consider our website an extension of our brick-and-mortar locations and not a separate segment of our business. Most customers will use the internet for inspiration and as a start to their shopping process to view products and prices. Our
website features a variety of helpful tools including a design center with room planners, upholstery customization, and inspired accessories to create shareable “Idea Boards.” A large number of product reviews written by our customers are also
provided, which some consumers find important in the decision-making process.
The next stop in the purchase journey for most consumers is a visit to a store to touch, sit, and see merchandise in person. Our sales consultants also use havertys.com as a tool to further engage our customers while they are in the store. They
may make their purchase in the store or opt to return home and finalize their decisions, place their orders online and set delivery. We limit online sales of our furniture to within our delivery network, and accessories to the continental United
States.
Our website traffic, as expected, increased dramatically due to the COVID-19 pandemic as people spent more time in their homes and were reluctant or not able to shop in our stores. During the early stages of the COVID‑19 pandemic when our stores
were closed, we reassigned a number of our store personnel to serve as online chat agents and our in-home designers shifted to virtual visits. Once our stores reopened, we saw, and have continued to see a rise in the completion of the sales process
online. Our total sales completed online for 2021 increased 28.9% over 2020 and were approximately 4.1% of our total 2021 sales. This level of sales makes our website our highest performing “store.”
We are making investments in 2022 to improve the customer experience on our website. The enhancements include better search functionality, improved navigation, enriched product pages, and faster site speed. We are also implementing a new content
management system, AI driven automation, and improved site reporting to gain insight around customer pathing and content effectiveness.
We believe offering a direct-to-customer business complements our retail store operations as we serve the customer in the method of their choosing and leverage the power of high touch service and online capabilities.
2
Competition
The retail sale of home furnishings is a highly fragmented and competitive business. There has been growth in the e‑commerce channel both from internet only retailers, from start-up furniture retailers and larger more established retailers, and
those with a brick-and-mortar presence. The degree and sources of brick-and-mortar retail competition varies by geographic area. We compete with numerous individual retail furniture stores as well as national and regional chains. Retail stores
opened or operated by furniture manufacturers in an effort to control and protect the distribution prospects of their branded merchandise compete with us in certain markets. Mass merchants, certain department stores, and some electronics and
appliance retailers also have limited furniture product offerings.
We believe Havertys is uniquely positioned in the marketplace, with a targeted mix of merchandise that appeals to customers who are somewhat more affluent than those of promotional price-oriented furniture stores. Our online presence provides
most elements of a seamless, omni-channel approach that many of our competitors do not have or cannot replicate. We consider the expansion of our custom order capabilities, free in-home design service, the tailoring of merchandise on a local market
basis, and the ability to make prompt delivery of orders through maintenance of inventory, significant competitive advantages.
Suppliers and Supply Chain
We buy our merchandise from numerous foreign and domestic manufacturers and importers, the largest ten of which accounted for approximately 43.7% of our product purchases during 2021. Most of our wood products, or “case goods,” are imported from
Asia. Upholstered items are largely produced domestically, with the exception of our leather products which are primarily imported from Asia or Mexico.
We purchase our furniture merchandise produced in Asia through sourcing companies and also buy direct from manufacturers. We have dedicated quality control specialists on-site during production to ensure the items meet our specifications. Our
direct import team works with industry designers and manufacturers in some of the best factories throughout Asia. Approximately 15.9% of our case goods sales and 8.6% of our upholstery sales in 2021 were generated by our direct imports.
The longer lead times required for deliveries from overseas factories and the production of merchandise exclusively for Havertys makes it imperative for us to have both warehousing capabilities and end-to-end supply chain visibility. Our
merchandising team provides input to the automated procurement process in an effort to maintain overall inventory levels within an appropriate range and reduce the number of written sales awaiting product delivery. We use real-time information to
closely follow our import orders from the manufacturing plant through each stage of transit and using this data can more accurately set customer delivery dates prior to receipt of product.
As a result of the continuing COVID-19 pandemic, manufacturers continue to be challenged to ensure safe work environments and have encountered raw material and labor shortages. Product manufactured in Asia is also impacted by shipping capacity
challenges. Each of these factors, in addition to others, has led to significantly constrained and delayed supply chains in the home furnishings industry.
Distribution
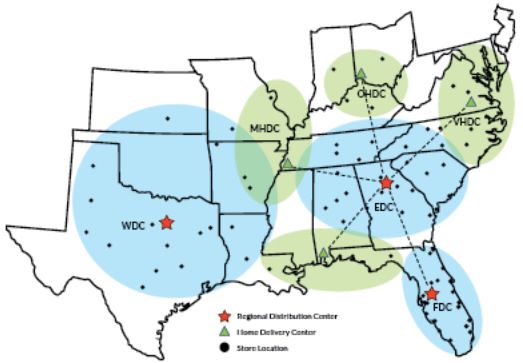
We believe that our distribution and delivery system is one of the best in the retail furniture industry and provides us with a significant competitive advantage. Our distribution system uses a combination of three distribution centers (“DCs”)
and four home delivery centers (“HDCs”). The DCs receive both domestic product and containers of imported merchandise. A warehousing management system using radio frequency scanners tracks each piece of inventory in real time and allows for random
storage in the warehouse and efficient scheduling and changing of the workflow. The DCs are also designed to shuttle prepped merchandise up to 250 miles for next day home deliveries and serve HDCs within a 500-mile radius. The HDCs provide service
to markets within an additional 200 miles. During 2022 we plan to expand our Ohio HDC and convert our Virginia facility to a DC. The conversion will enable us to bring product to this location direct from ports and maintain
3
inventory closer to our customers. We use a third-party to handle over-the-road delivery of product from the DCs to the HDCs and market areas. We use Havertys team members for executing home delivery, and have branded this service “Top Drawer
Delivery,” an important function serving as the last contact with our customers in the purchase process. Operating standards in our warehouse and delivery functions provide measurements for determining staffing needs and increasing productivity. At
various points during 2020 and 2021 due to the COVID-19 pandemic, we had reduced delivery capacity due to fewer personnel. Time between purchase and delivery lengthened from our pre-pandemic average of 3 to 5 days for in stock items to 3 to 5 weeks
when staffing constraints were the most acute and were 1 to 2 weeks by the end of 2020. We have added additional team members and purchases of in stock product were typically delivered within 3 to 5 days by the end of 2021. The disruptions to our
supply chain have resulted in lower inventory and for out-of-stock merchandise delivery times can be 8 to 12 weeks. Our vendor partners for special order products continue to experience delays, but are reducing their backlogs and delivery on these
orders is now 12 to 20 weeks on average.
Human Capital Resources
As of December 31, 2021, Havertys’ total workforce was 2,845: 1,610 in our retail store operations, 989 in our warehouse and delivery points, 183 in our corporate operations, and 63 in our customer-service call centers. None of our team
members is a party to a union contract. See Management’s Discussion & Analysis – Impact of COVID-19 for more information.
Health and Safety
Throughout 2020 and 2021, we carefully followed the various Center for Disease Control guidelines regarding COVID-19 protocols and have established a number of safety procedures, including face covering and physical distance requirements,
enhanced cleaning, encouraging daily self-health checks, voluntary temperature screening stations, and access to virtual primary care physicians at no cost. We also have a multi-disciplinary team coordinating responses to COVID-19 tests due to
illness or exposure and positive COVID-19 tests. As part of that process, we have developed a robust contact tracing program to identify team members who were in close contact with an ill colleague in the workplace.
We care about our teammates, customers, and the communities we serve. We have a strong safety program that focuses on implementing policies and training programs to ensure our team members can leave their job and return home safely, every day.
4
Diversity
Integrity and teamwork are two of our core values. These drive our approach in our everyday operations with our customers, suppliers and teammates and we believe that the best results happen when we work together. At Havertys, we see strength
in America’s many faces, cultures, and colors. Each person offers a unique point of view and presents a fresh perspective. We are committed to diverse representation across all levels of our workforce to reflect the vibrant and thriving diversity
of the communities in which we live and work.
Retention and Development
Our compensation programs are designed to attract, retain, and motivate team members to achieve superior results. Havertys’ total compensation for teammates includes a variety of components including competitive pay consistent with positions,
skill levels, experience, and knowledge. We also offer competitive benefits, including access to healthcare plans, financial and physical wellness programs, paid time off, parental leave and retirement benefits.
We periodically conduct an Employee Engagement Survey (the “Survey”) as a means of measuring employee engagement and satisfaction, as well offering employees the chance to feel heard.
We are committed to supporting our teammates’ continuous development of professional, technical and leadership skills through corporate training programs, access to digital learning resources and through partnerships with local technical
learning institutions. In 2021, Havertys team members consumed approximately 125,000 hours of learning. We also offer the ability for team members to pursue degree programs, professional certificates, and individual courses in strategic fields of
study through our tuition reimbursement program.
Seasonality
Our business is affected by traditional retail seasonality, advertising and promotion programs, and general economic trends. We typically achieve our smallest quarter by revenues in the second quarter and the largest in the fourth quarter. The
“nesting” response generated by COVID-19 created outsized demand beginning in the second quarter of 2020 and, when combined with the strong housing market contributed to the strong sales levels we experienced through 2021.
Trademarks and Domain Names
We have registered our various logos, trademarks and service marks. We believe that our trademark position is adequately protected in all markets in which we do business. In addition, we have registered and maintain numerous internet domain
names including “havertys.com.” Collectively, the logos, trademarks, service marks and domain names that we hold are of material importance to us.
Available Information
Our annual reports on Form 10-K, quarterly reports on Form 10-Q, current reports on Form 8-K, and all amendments to those reports are available free of charge on our website at www.havertys.com as soon as reasonably practicable after
such material is electronically filed with, or furnished to, the Securities and Exchange Commission (“SEC”). The SEC also maintains a website that contains our SEC filings at www.sec.gov.
The following discussion of risk factors contains forward-looking statements. These risk factors may be important to understanding any statement in this annual report on Form 10-K or elsewhere. The following information should be read in
conjunction with Part II, Item 7. “Management’s Discussion and Analysis of Financial Condition and Results of Operations” (MD&A), and the consolidated financial statements and related notes in Part II, Item 8. “Financial Statements and
Supplementary Data” of this annual report on Form 10-K.
5
We routinely encounter and address risks, some of which may cause our future results to be different – sometimes materially different – than we presently anticipate. The following factors, as well as others described elsewhere in this report or
in our other filings with the SEC, that could materially affect our business, financial condition or operating results should be carefully considered. Below, we describe certain important operational and strategic risks and uncertainties, but they
are not the only risks we face. Our reactions to material future developments, as well as our competitors’ reactions to those developments, may also impact our business operations or financial results. If any of the following risks actually occur,
our business, financial condition or operating results may be adversely affected.
Risks Related to the COVID-19 Pandemic
The COVID-19 pandemic has had, and will likely continue to have, a material effect on our business and results of operations.
The COVID-19 pandemic continues to impact numerous aspects of our business, and the continuing long-term impact to our business remains unknown. This is due to the numerous uncertainties that have risen from the pandemic, including the
severity and transmissibility of the disease, the duration of the outbreak, the emergence and spread of variants of concern, actions that may be taken by governmental authorities in response to the disease, the distribution, efficacy and public
acceptance of vaccines, and economic impact of the foregoing.
Despite the uncertainty caused by the COVID-19 pandemic, the retail furniture industry has experienced strong consumer demand. The trend of “nesting” spending has generated additional consumer activity in our industry but has also
significantly strained inventory production and supply chains. Recently, the COVID-19 pandemic has also resulted in increased inflation throughout the world, which has begun to affect the prices at which manufacturers charge home furniture
retailers, as well as the prices that are charged to customers. To the extent such inflation continues, increases, or both, it may reduce our margins and have a material adverse effect on our financial performance. Additionally, the COVID-19
pandemic has caused us to require all team members to follow health guidelines including the wearing of masks and practicing social distancing, and for some team members increased the use of remote work and video meetings, all which could
negatively impact our business and harm productivity and collaboration.
In addition to the above risks, the continuing pandemic and related economic uncertainty may result in prolonged disruption and volatility to our business, cause additional negative impacts of which we are not currently aware and also magnify
other risks associated with our business and operations, including risks associated with our supply chain and sourcing quality merchandise domestically and outside the U.S.; our ability to promptly adjust inventory levels to meet fluctuations in
customer demand; our ability to open new store locations and expand or remodel existing stores; and our ability to hire and train qualified employees to address temporary or sustained labor disruptions or labor shortages. Accordingly, the
COVID-19 pandemic could have a material adverse effect on demand for our products, workforce availability and our results of operations, financial condition, liquidity and cash flows.
Risks Related to Our Business
We face significant competition from national, regional and local retailers of home furnishings.
The retail market for home furnishings is highly fragmented and intensely competitive. We currently compete against a diverse group of retailers, including internet only retailers, regional or independent specialty stores, dedicated franchises
of furniture manufacturers and national department stores. In addition, there are few barriers to entry into our current and contemplated markets, and new competitors may enter our current or future markets at any time. Our existing competitors or
new entrants into our industry may use a number of different strategies to compete against us, including aggressive advertising, pricing and marketing, social media campaigns and extension of credit to customers on terms more favorable than we
offer. Furthermore, some of our competitors have greater financial resources and larger customer bases than we have, and as a result may have a more advanced multichannel platform, be able to adapt quicker to changes in consumer behavior, have
6
attractive customer loyalty programs, and maintain higher profitability in an aggressive low pricing environment. Rapidly evolving technologies are altering the manner in which retailers communicate and transact with customers, led by
internet-based and multichannel retailers that have made significant investments in recent years, including with pricing technology and shipping capabilities.
Competition from any of these sources could cause us to lose market share, revenues and customers, increase expenditures or reduce prices, any of which could have a material adverse effect on our results of operations.
If we fail to successfully anticipate or respond to changes in consumer preferences in a timely manner, our sales may decline.
Our products must appeal to our target consumers whose preferences, tastes and trends cannot be predicted with certainty and are subject to change. We continuously monitor changes in home design trends through attendance at international
industry events and fashion shows, internal marketing research, and regular communication with our retailers and design professionals who provide valuable input on consumer tendencies. However, as with all retailers, our business is susceptible to
changes in consumer tastes and trends. Our success depends upon our ability to anticipate and respond in a timely manner to fashion trends relating to home furnishings. If we fail to successfully identify and respond to these changes, our sales may
decline.
We import a substantial portion of our merchandise from foreign sources. This exposes us to certain risks that include political and economic conditions. Changes in exchange rates or tariffs could impact the price we
pay for these goods, resulting in potentially higher retail prices and/or lower gross profit on these goods.
Based on product costs, approximately 54% of our total furniture purchases (which exclude accessories and mattresses) in 2021 were for goods not produced domestically. All our purchases are denominated in U.S. dollars. As exchange rates between
the U.S. dollar and certain other currencies become unfavorable, the likelihood of price increases from our vendors increases. Some of the products we purchase are also subject to tariffs. If tariffs are imposed on additional products or the tariff
rates are increased our vendors may increase their prices. Such changes, if they occur, could have one or more of the following impacts:
|
•
|
we could be forced to raise retail prices so high that we are unable to sell the products at current unit volumes;
|
|
•
|
if we are unable to raise retail prices commensurately with the cost increases, gross profit as recognized under our LIFO inventory accounting method could be negatively impacted; or
|
|
•
|
we may be forced to find alternative sources of comparable product, which may be more expensive than the current product, of lower quality, or the vendor may be unable to meet our requirements for quality, quantities, delivery
schedules or other key terms.
|
We are dependent upon the ability of our third-party producers to meet our requirements; any failures by these producers, or the unavailability of suitable suppliers at reasonable prices or limitations on our ability
to source from third-party producers may negatively impact our ability to deliver quality merchandise to our customers on a timely basis or result in higher costs or reduced net sales.
We source substantially all of our products from non-exclusive, third-party producers, many of which are located in foreign countries. Although we have long-term relationships with many of our suppliers, we must compete with other companies for
the production capacity of these independent manufacturers. We regularly depend upon the ability of third-party producers to secure a sufficient supply of raw materials, a skilled workforce, adequately finance the production of goods ordered and
maintain sufficient manufacturing and shipping capacity. Although we monitor production and quality in many third-party manufacturing locations, we cannot be certain that we will not experience operational difficulties with our manufacturers, such
as the reduction of availability of production capacity, errors in complying with product specifications, insufficient quality control, failures to meet production deadlines or increases in manufacturing costs. Such difficulties may negatively
impact our ability to deliver quality products to our customers on a timely basis, which may, in turn, have a negative impact on our customer relationships and result in lower net sales.
7
We also require third-party producers to meet certain standards in terms of working conditions, environmental protection and other matters before placing business with them. As a result of costs relating to compliance with these standards, we
may pay higher prices than some of our competitors for products. In addition, failure by our independent manufacturers to adhere to labor or other laws or business practices accepted as ethical, and the potential litigation, negative publicity and
political pressure relating to any of these events, could disrupt our operations or harm our reputation.
Our vendors might fail in meeting our quality control standards or reacting to changes to the legislative or regulatory framework regarding product safety.
All of our vendors must comply with applicable product safety laws and regulations, and we are dependent on them to ensure that the products we buy comply with all safety standards. Any actual, potential or perceived product safety concerns
could expose us to government enforcement action or private litigation and result in recalls and other liabilities. These could harm our brand’s image and negatively affect our business and operating results.
Significant fluctuations in the price, availability and quality of raw materials and components have resulted in increased costs and caused production delays which, if continued, could result in a decline in sales,
either of which could materially adversely impact our earnings.
The primary materials our vendors use to produce and manufacture our products are various woods and wood products, resin, steel, leather, cotton, and certain oil-based products. On a global and regional basis, the sources and prices of those
materials and components are susceptible to significant price fluctuations due to supply/demand trends, transportation costs, government regulations and tariffs, changes in currency exchange rates, price controls, the economic and political
climate, and other unforeseen circumstances. Furthermore, global supply chains have been negatively impacted by COVID-19 shutdowns and shipping delays. These global supply chain challenges could continue and in turn materially adversely impact the
ability of our suppliers to fulfil our orders in a timely manner, it at all, and may lead to increased prices, which we may not be able to pass through to our customers.
Our revenue can be adversely affected by our ability to successfully forecast our supply chain needs and our foreign manufacturers’ ability to comply with international trade rules and regulations.
Optimal product flow is dependent on demand planning and forecasting, production to plan by suppliers, and timely transportation. We often make commitments to purchase products from our vendors in advance of proposed production dates.
Significant deviation from the projected demand for products that we sell may have an adverse effect on our results of operations and financial condition, either from lost sales or lower margins due to the need to reduce prices to dispose of excess
inventory. Disruptions to our supply chain could result in late arrivals of product. This could negatively affect sales due to increased levels of out-of-stock merchandise and loss of confidence by customers in our ability to deliver goods as
promised.
In addition, there is a risk that compliance lapses by our foreign manufacturers could occur which could lead to investigations by U.S. government agencies responsible for international trade compliance. Resulting penalties or enforcement
actions could delay future imports or otherwise negatively impact our business. There also remains a risk that one or more of our foreign manufacturers will not adhere to applicable legal requirements or our compliance standards such as fair labor
standards, the prohibition on child labor and other product safety or manufacturing safety standards. The violation of applicable legal requirements, including labor, manufacturing and safety laws, by any of our manufacturers, the failure of any of
our manufacturers to adhere to our global compliance standards or the divergence of the labor practices followed by any of our manufacturers from those generally accepted in the U.S., could disrupt our supply of products from our manufacturers,
result in potential liability to us and harm our reputation and brand, any of which could negatively affect our business and operating results.
8
Recent supply chain management disruption has had, and could continue to have, a material adverse effect on our results of operations.
Supply chain challenges have been faced by the entire home furnishings industry, including the Company, as a result of COVID-19 related labor shortages and supply chain disruptions. These supply chain disruptions have created significant delays
in our ability to fulfill customer orders and increased backlogs. The receipt of inventory sourced from impacted areas has been slowed or disrupted and our merchandise suppliers are expected to face similar challenges in receiving materials and
fulfilling our orders. In addition, ocean freight capacity issues continue to persist worldwide due to the ongoing global COVID-19 pandemic as there is much greater demand for shipping and reduced capacity and equipment, which has resulted in
recent price increases per shipping container. Streamline ships are charging priority booking fees to allocate space as they have less ships and workers operating. While we continue to manage and evaluate our freight carriers, there is no
indication that shipping container rates will return to historical levels in the near-term and these increases could have a material adverse effect on our consolidated results of operations.
Furthermore, transportation delays, higher oil and gasoline prices, increases on shipping containers rates, more extensive travel restrictions, closures or disruptions of businesses and facilities or social, economic, political or labor
instability in the affected areas, may impact our or our suppliers’ operations and in turn could adversely affect our profitability. We deliver substantially all of our customers’ purchases to their homes. Our distribution system, which utilizes
three DCs and multiple home delivery centers is very transportation dependent to reach the 22 states we deliver to from our stores across 16 Southern and Midwestern states. If transportation costs exceed
amounts we are able to effectively pass on to the consumer, either by higher prices and/or higher delivery charges, then our profitability will suffer.
Because of our limited number of distribution centers, should one become damaged, our operating results could suffer.
We utilize three large distribution centers to flow our merchandise from the vendor to the consumer. This system is very efficient for reducing inventory requirements but makes us operationally vulnerable should one of these facilities become
damaged or experience significant business interruption. If such an interruption were to occur, our ability to deliver our products in a timely manner would likely be impacted.
We rely extensively on information technology systems to process transactions, summarize results, and manage our business. Disruptions in our information technology systems could adversely affect our business and
operating results.
Our ability to operate our business from day to day, in particular our ability to manage our point-of-sale, distribution system and payment information, largely depends on the efficient operation of our computer hardware and software systems. We
use management information systems to communicate customer information, provide real-time inventory information, and to handle all facets of our distribution system from receipt of goods in the DCs to delivery to our customers’ homes. These systems
are subject to damage or interruption from power outages, computer and telecommunications failures, viruses, phishing attempts, cyber‑attacks, malware and ransomware attacks, security breaches, severe weather, natural disasters, and errors by
employees.
The failure of these systems to operate effectively, problems with integrating various data sources, challenges in transitioning to upgraded or replacement systems, difficulty in integrating new systems, or a breach in security of these systems
could adversely impact the operations of our business. Though losses arising from some of these issues would be covered by insurance, interruptions of our critical business information technology systems or failure of our back-up systems could
result in longer production times or negatively impact customers resulting in damage to our reputation and a reduction in sales. If our critical information technology systems or back-up systems were damaged or ceased to function properly, we might
have to make a significant investment to repair or replace them.
9
Successful cyber-attacks and the failure to maintain adequate cyber-security systems and procedures could materially harm our business.
Cyber threats are rapidly evolving and those threats and the means for obtaining access to information in digital and other storage media are becoming increasingly sophisticated. Cyber threats and cyber-attackers, including ransomware attacks,
can be sponsored by countries or sophisticated criminal organizations or be the work of single “hackers” or small groups of “hackers.”
We invest in industry standard security technology to protect the Company’s data and business processes against risk of data security breach and cyber-attack. Our data security management program includes identity, trust, vulnerability and
threat management business processes as well as adoption of standard data protection policies. We measure our data security effectiveness through industry accepted methods. We are continuously installing new and upgrading existing information
technology systems. We use employee awareness training around phishing, malware, and other cyber risks to ensure that the Company is protected, to the greatest extent possible, against cyber risks and security breaches. We are regularly the target
of attempted cyber and other security threats and must continuously monitor and develop our information technology networks and infrastructure to prevent, detect, address and mitigate the risk of unauthorized access, misuse, computer viruses and
other events that could have a security impact. Insider or employee cyber and security threats are increasingly a concern for all companies, including ours. Additionally, we certify our major technology suppliers and any outsourced services through
accepted security certification standards.
Nevertheless, as cyber threats evolve, change and become more difficult to detect and successfully defend against, one or more cyber-attacks might defeat our or a third-party service provider’s security measures in the future and obtain the
personal information of customers, employees or business partners. Employee error or other irregularities may also result in a failure of security measures and a breach of information systems. Moreover, hardware, software or applications we use may
have inherent defects of design, manufacture or operations or could be inadvertently or intentionally implemented or used in a manner that could compromise information security. A security breach and loss of information may not be discovered for a
significant period of time after it occurs. While we have no knowledge of a material security breach to date, any compromise of data security could result in a violation of applicable privacy and other laws or standards, the loss of valuable
business data, or a disruption of our business. In addition, the costs to eliminate or alleviate network security problems, bugs, viruses, worms, malicious software programs and security vulnerabilities could be significant, and our efforts to
address these problems may not be successful, resulting potentially in the theft, loss, destruction or corruption of information we store electronically, as well as unexpected interruptions, delays or cessation of service, any of which could cause
harm to our business operations. Moreover, a security breach involving the misappropriation, loss or other unauthorized disclosure of sensitive or confidential information could give rise to unwanted media attention, materially damage our customer
relationships and reputation, and result in fines, fees, or potential liabilities, which may not be covered by our insurance policies, as well as risk of litigation, each of which could have a material adverse effect on our business, results of
operations and financial condition.
Our business is dependent on certain key personnel; if we lose key personnel or are unable to hire additional qualified personnel, our business may be harmed.
The success of our business depends upon our ability to retain continued service of certain key personnel, and to attract and retain additional qualified key personnel in the future. We face risks related to loss of any key personnel and we also
face risks related to any changes that may occur in key senior leadership executive positions. Any disruption in the services of our key personnel could make it more difficult to successfully operate our business and achieve our business goals and
could adversely affect our results of operation and financial condition. These changes could also increase the volatility of our stock price.
10
Competition for qualified employees and personnel in the retail industry is intense and we may be unable to retain personnel that are important to our business or hire additional qualified personnel. The process of identifying personnel with the
combination of skills and attributes required to carry out our goals is often lengthy. Our success depends to a significant degree upon our ability to attract, retain and motivate qualified management, marketing and sales personnel, and store
managers, and upon the continued contributions of these people. In addition, our operations require the services of qualified and experienced management personnel, with expertise in the areas including information technology and supply chain
management. We cannot assure you that we will be successful in attracting and retaining qualified executives and personnel.
Furthermore, a significant portion of our success depends in part upon our ability to attract, motivate and retain a sufficient number of store and other employees who understand and appreciate our corporate culture and customers. Turnover in
the retail industry is generally high. Excessive employee turnover will result in higher employee costs associated with finding, hiring and training new store employees. If we are unable to hire and
retain store and other personnel capable of consistently providing a high level of customer service, our ability to open new stores and service the needs of our customers may be impaired, the performance of our existing and new stores and
operations could be materially adversely affected and our brand image may be negatively impacted.
Risks Related to Our Industry
An overall decline in the health of the economy and consumer spending may affect consumer purchases of discretionary items, which could reduce demand for our products and materially harm our sales, profitability and
financial condition.
Our business depends on consumer demand for our products and, consequently, is sensitive to a number of factors that influence general consumer spending on discretionary items in particular. Factors influencing consumer spending include general
economic conditions, consumer disposable income, fuel prices, inflation, recession and fears of recession, unemployment, inclement weather, availability of consumer credit, consumer debt levels, conditions in the housing market, interest rates,
sales tax rates and rate increases, sustained periods of inflation, civil disturbances and terrorist activities, foreign currency exchange rate fluctuations, consumer confidence in future economic and political conditions, natural disasters, and
consumer perceptions of personal well‑being and security, including health epidemics or pandemics, such as the COVID-19 pandemic. Prolonged or pervasive economic downturns could slow the pace of new store openings or cause current stores to
temporarily or permanently close. Adverse changes in factors affecting discretionary consumer spending have reduced and may continue to further reduce consumer demand for our products, thus reducing our sales and harming our business and operating
results.
Historically, because customers consider home furnishings to be postponable purchases, the home furnishings industry has been subject to cyclical variations in the general economy and to uncertainty regarding future economic prospects. Should
the current economic recovery falter or the current recovery in housing starts to stall, consumer confidence and demand for home furnishings could deteriorate, which could adversely affect our business through its impact on the performance of our
stores.
None.
11
ITEM 2. PROPERTIES
Stores
Our retail store space at December 31, 2021 totaled approximately 4.4 million square feet for 121 stores. The following table sets forth the number of stores we operated at December 31, 2021 by state:
|
State
|
Number of Stores
|
State
|
Number of Stores
|
|
|
Florida
|
30
|
Maryland
|
4
|
|
|
Texas
|
21
|
Arkansas
|
3
|
|
|
Georgia
|
17
|
Louisiana
|
3
|
|
|
North Carolina
|
8
|
Kentucky
|
2
|
|
|
Virginia
|
8
|
Missouri
|
2
|
|
|
South Carolina
|
7
|
Ohio
|
2
|
|
|
Alabama
|
6
|
Indiana
|
1
|
|
|
Tennessee
|
6
|
Kansas
|
1
|
The 40 retail locations which we owned at December 31, 2021 had a net book value for land and buildings of $65.4 million. The remaining 81 locations are leased by us with various termination dates through 2035 plus renewal options.
Distribution Facilities
We lease all of our distribution facilities except for the Virginia property. Our regional distribution facilities are in the following locations:
|
Location
|
Approximate Square Footage
|
|||
|
Braselton, Georgia
|
808,000
|
|||
|
Coppell, Texas
|
394,000
|
|||
|
Lakeland, Florida
|
335,000
|
|||
|
Colonial Heights, Virginia
|
129,000
|
|||
|
Fairfield, Ohio
|
50,000
|
|||
|
Theodore, Alabama
|
42,000
|
|||
|
Memphis, Tennessee
|
30,000
|
|||
Corporate Facilities
We lease approximately 48,000 square feet on two floors of a suburban mid-rise office building located at 780 Johnson Ferry Road, Suite 800, Atlanta, Georgia.
We believe that our facilities are suitable and adequate for present purposes, and that the productive capacity in such facilities is substantially being utilized. For additional information, see “Management’s Discussion and Analysis of
Financial Condition and Results of Operations” included in this report under Item 7 of Part II.
From time to time, we may become involved in various lawsuits and legal proceedings which arise in the ordinary course of business. However, litigation is subject to inherent uncertainties, and an adverse result in
these or other matters may arise from time to time that may harm our business. We are currently not aware of any such legal proceedings or claims that we believe will have a material adverse effect on our business, financial condition or operating
results.
Not applicable.
12
The following are the names, ages and current positions of our executive officers and, if they have not held those positions for the past five years, their former positions during that period with Havertys or other companies.
|
Name, age and office (as of March 1, 2022) and year elected to office
|
Principal occupation during last five years other than office of the Company currently held
|
||||
|
Clarence H. Smith
|
71
|
Chairman of the Board
Chief Executive Officer
Director
|
2012
2002
1989
|
President and Chief Executive Officer, 2002-March 1, 2021
|
|
|
Steven G. Burdette
|
60
|
President
|
2021
|
Executive Vice President, Operations 2017-March 1, 2021
Executive Vice President, Stores, 2008-2017
|
|
|
J. Edward Clary
|
61
|
Executive Vice President,
and Chief Information Officer
|
2015
|
Senior Vice President, Distribution and Chief Information Officer
2008-2015
|
|
|
John L. Gill
|
58
|
Executive Vice President, Merchandising
|
2019
|
Senior Vice President, Merchandising 2018-2019;
Vice President, Merchandising 2017-2018; Vice President, Operations 2015-2017; Eastern Regional Manager 2016-2018.
|
|
|
Richard B. Hare
|
55
|
Executive Vice President and
Chief Financial Officer
|
2017
|
Senior Vice President,
Finance, Treasurer and Chief Financial Officer of Carmike Cinemas, Inc., 2006-2016
|
|
|
Helen B. Bautista
|
55
|
Senior Vice President, Marketing
|
2021
|
Vice President, Marketing for Havertys, 2019-March 1, 2021;
Senior Vice President Group Account Director, 2018-2019, Vice President Group Account Director 2016-2018, Group Account Director, 2013-2016 all for Fitzco, a McCann World Group Agency
|
|
|
Kelley A. Fladger
|
52
|
Senior Vice President and
Chief Human Resources Officer
|
2019
|
Vice President, Human Resource Services, 2016-2019 and Chief Diversity and Inclusion Officer, 2017-2019 for Perdue Farms, Inc.;
Vice President, People Strategy and Corporate Human Resources 2014-2016 for Belk, Inc.
|
|
13
|
Name, age and office (as of March 1, 2022) and year elected to office
|
Principal occupation during last five years other than office of the Company currently held
|
||||
|
Rawson Haverty, Jr.
|
65
|
Senior Vice President, Real
Estate and Development
Director
|
1988
1992
|
Has held this position for the last five years
|
|
|
Jenny Hill Parker
|
63
|
Senior Vice President, Finance,
and Corporate Secretary
|
2019
|
Senior Vice President, Finance, Treasurer and Corporate Secretary
2010-2019
|
|
|
Janet E. Taylor
|
60
|
Senior Vice President,
General Counsel
|
2010
|
Has held this position for the last five years
|
Rawson Haverty, Jr. and Clarence H. Smith are first cousins.
Our executive officers are elected or appointed annually by the Board of Directors for terms of one year or until their successors are elected and qualified, subject to removal by the Board at any time.
14
PART II
ITEM 5. MARKET FOR THE REGISTRANT’S COMMON EQUITY, RELATED STOCKHOLDER MATTERS AND ISSUER PURCHASES OF EQUITY SECURITIES
Market Information
Our two classes of common stock trade on The New York Stock Exchange (“NYSE”). The trading symbol for the common stock is HVT and for Class A common stock is HVT.A.
Stockholders
Based on the number of individual participants represented by security position listings, there are approximately 12,469 holders of our common stock and 181 holders of our Class A common stock as of February 10,
2022.
Dividends
We have historically paid and expect to continue to pay for the foreseeable future, quarterly cash dividends on our Common Stock and Class A Common Stock. The payment of dividends and the amount are determined by the
Board of Directors and depend upon, among other factors, our earnings, operations, financial condition, capital requirements and general business outlook at the time such dividend is considered. We have paid a cash dividend in each year since 1935.
Our credit agreement includes covenants that may restrict our ability to pay dividends. For more information, see Note 5, “Credit Arrangement,” and Note 9, “Stockholders’ Equity,” in the Notes to Consolidated Financial Statements.
Equity Compensation Plans
For information regarding securities authorized for issuance under our equity compensation plans, see Part III, Item 12, “Security Ownership of Certain Beneficial Owners and Management and Related Stockholder
Matters.”
Issuer Purchases of Equity Securities
In August and November 2021, our Board of Directors authorized additional amounts under a share repurchase program. We made cash payments of $41.8 million for repurchases of our common stock through open market purchases during 2021 and there
is approximately $25.0 million at December 31, 2021 that may yet be purchased under the existing authorization.
The following table presents information with respect to our repurchases of Havertys’ common stock during the fourth quarter of 2021:
| (a) | (b) | (c) | (d) | |||||||||||||
|
Total Number of Shares Purchased
|
Average Price
Paid Per Share
|
Total Number of
Shares Purchased
as Part of Publicly
Announced Plans
or Programs
|
Approximate Dollar
Value of Shares That
May Yet be Purchased
Under the Plans
or Programs
|
|||||||||||||
|
October 1 – October 31
|
—
|
—
|
—
|
$
|
22,321,200
|
|||||||||||
|
November 1 – November 30
|
403,627
|
$ |
33.08
|
403,627
|
$
|
33,970,000
|
||||||||||
|
December 1 – December 31
|
291,000
|
$ |
30.80
|
291,000
|
$
|
25,006,000
|
||||||||||
|
Total
|
694,627
|
694,627
|
||||||||||||||
15
Stock Performance Graph
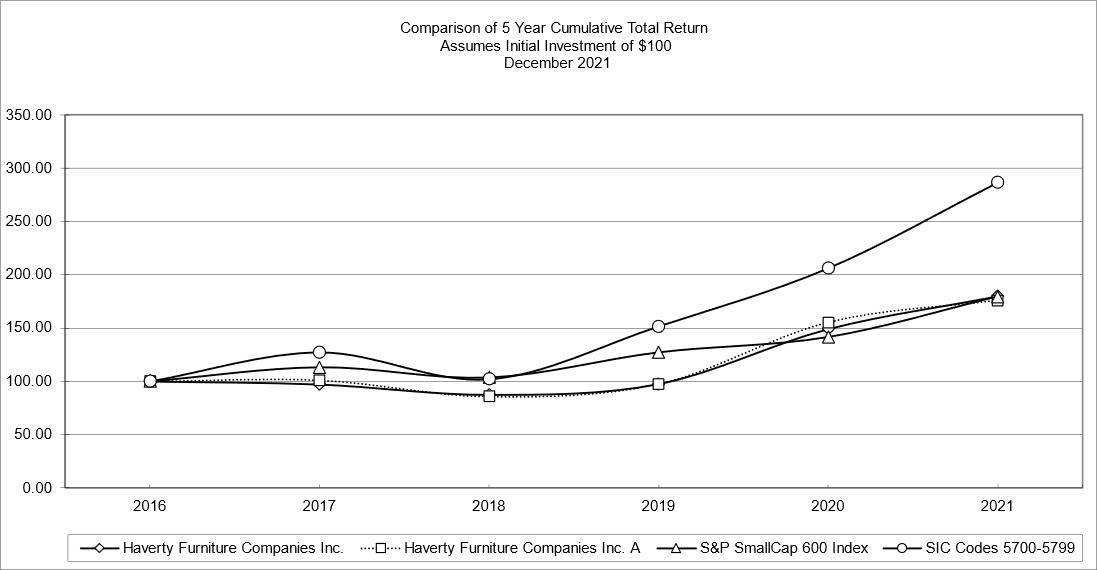
The following graph compares the performance of Havertys’ common stock and Class A common stock against the cumulative return of the NYSE/AMEX/Nasdaq Home Furnishings & Equipment Stores Index (SIC Codes 5700 – 5799) and the S&P
SmallCap 600 Index for the period of five years commencing December 31, 2016 and ended December 31, 2021. The graph assumes an initial investment of $100 on January 1, 2015 and reinvestment of dividends. NOTE: Prepared by Zacks Investment
Research, Inc. Used with permission. All rights reserved. Copyright 1980-2022. Index Data: Copyright Standard and Poor’s, Inc. Used with permission. All rights reserved.
|
2016
|
2017
|
2018
|
2019
|
2020
|
2021
|
|||||||||||||||||||
|
HVT
|
$
|
100.00
|
$
|
97.18
|
$
|
87.46
|
$
|
97.59
|
$
|
149.14
|
$
|
179.89
|
||||||||||||
|
HVT-A
|
$
|
100.00
|
$
|
101.11
|
$
|
85.79
|
$
|
97.65
|
$
|
155.27
|
$
|
175.86
|
||||||||||||
|
S&P SmallCap 600 Index
|
$
|
100.00
|
$
|
113.23
|
$
|
103.63
|
$
|
127.24
|
$
|
141.60
|
$
|
179.58
|
||||||||||||
|
SIC Codes 5700-5799
|
$
|
100.00
|
$
|
127.28
|
$
|
102.02
|
$
|
151.70
|
$
|
206.24
|
$
|
286.79
|
||||||||||||
16
ITEM 6. RESERVED
Overview
Industry
The retail residential furniture industry’s results are influenced by the overall strength of the economy, new and existing housing sales, consumer confidence, spending on large ticket items, interest rates, and availability of credit. These
factors remain tempered by rising consumer debt, home inventory constraints, and tight access to home mortgage credit, all of which provide impediments to industry growth.
Our Business
We sell home furnishings in our retail stores and via our website and record revenue when the products are delivered to our customer. Our products are selected to appeal to a middle to upper-middle income consumer across a variety of styles. Our
commissioned sales team members receive a high level of product training and are provided a number of tools with which to serve our customers. We also have over 120 in‑home designers serving most of our stores. These individuals work with our sales
team members to provide customers additional confidence and inspiration in their furniture purchase journey. We do not outsource the delivery function, something common in the industry, but instead ensure that the “last contact” is handled by a
customer-oriented Havertys delivery team. We are recognized as a provider of high-quality fashionable products and exceptional service in the markets we serve.
Impact of COVID-19
The COVID-19 pandemic continues to impact numerous aspects of our business.
Our sales remain at record levels as we have experienced unprecedented customer demand for our products during the COVID-19 pandemic. Consumers not negatively impacted financially are spending on their homes. Our online shopping and chat
continued to surge during 2021 and outpaced similar activity in 2020. Store traffic remained strong as customers shop online but want to touch, see, and comfort test before purchasing. Consumers are also favoring quality over price and our
average ticket rose in 2021 compared to 2020. Our main priority continues to be the health, safety and well-being of our customers and employees. We continue to invest in supplies for the protection of our employees and customers and increased
the frequency of cleaning and disinfecting our stores. Demand is outpacing product availability in many categories. Manufacturers are challenged to ensure safe work environments and have encountered raw material shortages and transportation
capacity issues. Our supply chain and sales teams, supported by a strong IT infrastructure, are working to communicate with customers and manage delivery expectations.
The long-term impact to our business remains unknown as we are unable to accurately predict the impact that COVID-19 will have due to numerous uncertainties, including the severity and transmissibility of the disease, the duration of the
outbreak, the likelihood of additional variants and resurgences of the outbreak, actions that may be taken by governmental authorities in response to the disease, the distribution, efficacy and public acceptance of vaccines, and unintended
consequences of the foregoing. Furthermore, the continuing pandemic and related economic uncertainty may result in prolonged disruption and volatility to our business and magnify certain risks, including risks associated with our supply chain and
sourcing quality merchandise domestically and outside the U.S.; our ability to promptly adjust inventory levels to meet fluctuations in customer demand; our ability to comply with complex and evolving laws and regulations related to customers’
and employees’ health and safety; our ability to open new store locations and expand or remodel existing stores; and our ability to hire and train qualified employees to address temporary or sustained labor shortages.
At this point, we cannot reasonably estimate the duration of the pandemic’s influence on consumers and the “nesting” economy.
17
Management Objectives
Management is focused on capturing more market share and increasing sales per square foot of showroom space. This growth will be driven by concentrating our efforts on our customers with improved interactions highlighted by new products, high
touch service and better technology. The Company’s strategies for profitability include gross margin focus, targeted marketing initiatives, productivity and process improvements, and efficiency and cost-saving measures. Our focus is to serve our
customers better and distinguish ourselves in the marketplace.
Key Performance Indicators
We evaluate our performance based on several key metrics which include net sales, comparable store sales and written comparable store sales, sales per weighted average square foot, gross profit, selling, general and administrative costs as a
percentage of sales, operating income, cash flow, and earnings per share. The goal of utilizing these measurements is to provide tools in economic decision-making such as store growth, capital allocation and product pricing.
Net sales is the revenues from merchandise sales and related fees, net of expected returns and sales tax. We record our sales when the merchandise is delivered to the customer.
Comparable-store or “comp-store” sales is a measure which indicates the performance of our existing stores and website by comparing the growth in sales in store and online for a particular month over the corresponding month in the prior year.
Stores are considered non-comparable if they were not open during the corresponding month in the prior year or if the selling square footage has been changed by more than 10%. Large clearance sales events from warehouses or temporary locations are
also excluded from comparable store sales. The method we use to compute comp-store sales may not be the same method used by other retailers.
We also track written sales and written comp-store sales. Written sales are when a customer makes a deposit or pays in full, and places an order. Written sales shows the current pace or trend of customer transactions. The lag time between
customers placing orders and delivery grew in 2020 and remained high during 2021 due to demand outpacing merchandise supply and disruptions in supply chain. As a retailer, comp‑store sales and written comp‑store sales are an indicator of relative
customer spending and store performance. Comp-store sales, total written sales and written comp-store sales are intended only as supplemental information and is not a substitute for net sales presented in accordance with US GAAP.
Sales per weighted average (“WAVG”) square foot is calculated by dividing net sales by WAVG square footage. WAVG square footage is a daily WAVG based on the ratio of the days open in a period to the total days in the period.
18
Results of Operations and Non-GAAP Measures
The table and discussion below should be read in conjunction with our consolidated financial statements and related notes included in this report.
|
Statement of Earnings Data
|
Year Ended December 31,
|
|||||||||||||||||||
|
(Dollars in thousands, except per share data)
|
2021
|
2020(1)
|
2019
|
2018
|
2017
|
|||||||||||||||
|
Net sales
|
$
|
1,012,799
|
$
|
748,252
|
$
|
802,291
|
$
|
817,733
|
$
|
819,866
|
||||||||||
|
Gross profit
|
574,625
|
418,994
|
434,488
|
446,542
|
444,923
|
|||||||||||||||
|
Percent of net sales
|
56.7
|
%
|
56.0
|
%
|
54.2
|
%
|
54.6
|
%
|
54.3
|
%
|
||||||||||
|
Selling, general and administrative expenses(2)
|
456,267
|
377,288
|
407,456
|
404,856
|
402,884
|
|||||||||||||||
|
Percent of net sales
|
45.1
|
%
|
50.4
|
%
|
50.8
|
%
|
49.5
|
%
|
49.1
|
%
|
||||||||||
|
Income before income taxes(2)(3)
|
118,535
|
76,731
|
28,724
|
40,408
|
43,223
|
|||||||||||||||
|
Percent of net sales
|
11.7
|
%
|
10.3
|
%
|
3.6
|
%
|
4.9
|
%
|
5.3
|
%
|
||||||||||
|
Net income(2)(3)
|
90,803
|
59,148
|
21,865
|
30,307
|
21,075
|
|||||||||||||||
|
Percent of net sales
|
9.0
|
%
|
7.9
|
%
|
2.7
|
%
|
3.7
|
%
|
2.6
|
%
|
||||||||||
|
Share Data
|
||||||||||||||||||||
|
Diluted earnings per Common share(2)(3)
|
$
|
4.90
|
$
|
3.12
|
$
|
1.08
|
$
|
1.42
|
$
|
0.98
|
||||||||||
|
Cash dividends – per share:
|
||||||||||||||||||||
|
Common Stock(4)
|
$
|
2.97
|
$
|
2.77
|
$
|
0.76
|
$
|
1.72
|
$
|
0.54
|
||||||||||
|
Class A Common Stock(4)
|
$
|
2.79
|
$
|
2.62
|
$
|
0.72
|
$
|
1.63
|
$
|
0.51
|
||||||||||
|
Diluted weighted average common shares outstanding
|
18,543
|
18,932
|
20,261
|
21,295
|
21,599
|
|||||||||||||||
|
Balance Sheet Data
|
||||||||||||||||||||
|
Total assets
|
$
|
686,290
|
$
|
680,372
|
$
|
560,072
|
$
|
440,179
|
$
|
461,329
|
||||||||||
|
Inventories
|
112,031
|
89,908
|
104,817
|
105,840
|
103,437
|
|||||||||||||||
|
Net property and equipment(5)
|
126,099
|
108,366
|
156,534
|
218,852
|
229,215
|
|||||||||||||||
|
Right-of-use lease assets
|
222,356
|
228,749
|
175,474
|
—
|
—
|
|||||||||||||||
|
Lease liabilities
|
230,352
|
233,666
|
179,055
|
—
|
—
|
|||||||||||||||
|
Customer deposits
|
98,897
|
86,183
|
30,121
|
24,465
|
27,813
|
|||||||||||||||
|
Total debt(6)
|
—
|
—
|
—
|
50,803
|
54,591
|
|||||||||||||||
|
Stockholders’ Equity
|
255,970
|
252,967
|
260,503
|
274,629
|
294,142
|
|||||||||||||||
|
Statement of Cash Flows Data
|
||||||||||||||||||||
|
Net cash provided by operating activities
|
$
|
97,242
|
$
|
130,191
|
$
|
63,419
|
$
|
70,392
|
$
|
52,457
|
||||||||||
|
Depreciation and amortization(5)
|
16,304
|
18,207
|
20,596
|
29,806
|
30,516
|
|||||||||||||||
|
Capital expenditures
|
34,090
|
10,927
|
16,841
|
21,473
|
24,465
|
|||||||||||||||
|
Dividends paid
|
52,446
|
50,521
|
15,056
|
35,464
|
11,392
|
|||||||||||||||
|
Share repurchases
|
41,809
|
19,708
|
29,757
|
18,732
|
—
|
|||||||||||||||
|
Other Supplemental Data and Metrics
|
||||||||||||||||||||
|
Number of stores
|
121
|
120
|
121
|
120
|
124
|
|||||||||||||||
|
Retail square footage at year-end
|
4,354
|
4,352
|
4,426
|
4,417
|
4,517
|
|||||||||||||||
|
Sales per WAVG retail square foot ($)
|
232
|
173
|
183
|
185
|
185
|
|||||||||||||||
|
Average ticket ($)(7)
|
2,865
|
2,482
|
2,323
|
2,184
|
2,091
|
|||||||||||||||
|
Net sales increases (%)
|
35.4
|
%
|
(6.7
|
)%
|
(1.9
|
)%
|
(0.3
|
)%
|
(0.2
|
)%
|
||||||||||
|
Comparable store sales increase (%)
|
17.9
|
%
|
5.0
|
%
|
(1.4
|
)%
|
0.3
|
%
|
(1.3
|
)%
|
||||||||||
|
Employees
|
2,845
|
2,766
|
3,425
|
3,418
|
3,551
|
|||||||||||||||
|
(1)
|
Stores were closed and delivery operations were paused for approximately six weeks due to COVID-19.
|
|
(2)
|
Includes impairment loss of $2.4 million, or $1.8 million after tax, on a retail store in 2019 which impacted diluted earnings per share $0.09.
|
|
(3)
|
Includes gain of $31.6 million on a sale-leaseback transaction in 2020 which impacted diluted earnings per share $1.24.
|
|
(4)
|
Includes special dividends of $2.00 for Common Stock and $1.90 for Class A Common Stock paid in the fourth quarter of 2021 and 2020 and $1.00 for Common Stock and $0.95 for Class A Common Stock paid in the
fourth quarter of 2018.
|
|
(5)
|
We adopted ASC 840 effective January 1, 2019. The cumulative effect included a reduction of property and equipment, net of $53,519,000. Amortization of buildings under lease was included in depreciation expense.
|
|
(6)
|
Debt is comprised completely of lease obligations accounted for under ASC 840, prior to adoption of ASU 2016-02.
|
|
(7)
|
Average ticket is calculated by dividing total sales by the number of orders.
|
19
Net Sales
The following outlines our sales and comp-store sales increases and decreases for the periods indicated. (Amounts and percentages may not always add to totals due to rounding.)
|
December 31,
|
|||||||||||||||||||||||||||||||||
|
2021
|
2020
|
2019
|
|||||||||||||||||||||||||||||||
|
Net Sales
|
Comp-Store Sales
|
Net Sales
|
Comp-Store Sales
|
Net Sales
|
Comp-Store Sales
|
||||||||||||||||||||||||||||
|
Period
Ended |
Dollars
in millions |
% Increase
(decrease) over prior period |
% Increase
(decrease) over prior period |
Dollars
in millions |
% Increase
(decrease) over prior period |
% Increase
(decrease) over prior period |
Dollars
in millions |
% Increase
(decrease) over prior period |
% Increase
(decrease) over prior period |
||||||||||||||||||||||||
|
Q1
|
$
|
236.5
|
31.8
|
%
|
11.5
|
%
|
$
|
179.4
|
(4.2
|
)%
|
11.6
|
%
|
$
|
187.2
|
(6.1
|
)%
|
(4.7
|
)%
|
|||||||||||||||
|
Q2
|
250.0
|
127.3
|
46.9
|
110.0
|
(42.7
|
)
|
(15.2
|
)
|
191.9
|
(3.5
|
)
|
(2.3
|
)
|
||||||||||||||||||||
|
Q3
|
260.4
|
19.7
|
17.7
|
217.5
|
3.9
|
4.0
|
209.3
|
(0.6
|
)
|
(0.4
|
)
|
||||||||||||||||||||||
|
Q4
|
265.9
|
10.2
|
9.2
|
241.3
|
12.9
|
13.7
|
213.8
|
2.3
|
1.4
|
||||||||||||||||||||||||
|
Year
|
$
|
1,012.8
|
35.4
|
%
|
17.9
|
%
|
$
|
748.3
|
(6.7
|
)%
|
5.0
|
%
|
$
|
802.3
|
(1.9
|
)%
|
(1.4
|
)%
|
|||||||||||||||
Sales in 2021 reached record levels for each quarter as customer demand remained strong despite ongoing COVID concerns and supply chain challenges. The comparisons for 2020 reflect the impact of our store closures in mid‑March and re-opening on
May 1, and the surge in business that followed. In response to increasing product and freight costs, we raised our retail prices. The impact of the supply chain disruptions is reflected in our sales by merchandise category. Our mattress business,
as a percent of total sales, continues to lag at 8.9% compared to its pre-pandemic level of 11.3%. The impact of the factory closures in Vietnam affected our sales of bedroom furniture, particularly in the fourth quarter, and we expect this may
continue into the second quarter of 2022. Our upholstery suppliers made good strides towards meeting demand and sales in this category in 2021 increased 37.3% over 2020 and as a percent of total sales increased 60 basis points. COVID concerns
continue to affect sales generated by our in-home designers and as a percent of our total sales they remain at the 2020 level of 22.8%.
Our ability to deliver customer orders has improved from 2020 but is still longer than pre-pandemic time frames. Manufacturers are beginning to recover from raw material shortages but are still challenged by worker shortages. Transportation
logistics continue to contribute to the supply chain disruption. Our warehouse and delivery operations are also adjusting to personnel shortages. Time between purchase and delivery lengthened from our pre-pandemic average of 3 to 5 days for in
stock items to 1 to 2 weeks due to staffing constraints. We have added additional team members and purchases of in stock product were generally delivered within 3 to 5 days during the last quarter of 2021. The disruptions to our supply chain have
resulted in lower inventory and for out‑of‑stock merchandise delivery times can be 8 to 12 weeks. Our vendor partners for special order products continue to experience delays, but are reducing their backlogs and delivery on these orders are now 12
to 20 weeks on average.
Sales in 2020 were impacted by COVID-19. Our written sales suffered during the first weeks of March as information and news coverage concerning the pandemic increased. We closed our stores and paused operations mid-March. We enacted our business
continuity plan in April which anticipated continued low levels of sales. Most stores reopened on May 1 with approximately 76% of their original staff, store hours were reduced 17%, and delivery capacity was also reduced. Our business was very
strong upon reopening, total written sales for the two months ended June 30, 2020 were up 13.9% and written comparable store sales were up 17.5% compared to the same two-month period in 2019. Our written sales remained strong during the third
quarter of 2020 with total written sales up 22.8% and written comparable store sales rose 22.6% over the same period in 2019. Our written sales in the fourth quarter were up 16.7% and written comp-store sales rose 17.5%.
Our delivery capacity was reduced as part of our business continuity plan in 2020. Deliveries resumed on May 5 with reduced personnel and capacity and total sales from May 5 through June 30, 2020 were down 13.4% compared with the same period of
2019. Demand quickly began to outpace supply and we worked during the third quarter to increase our inventory levels and delivery capacity. We adjusted our operations during the third quarter, adding additional personnel and worked with our vendors
to accelerate orders.
20
Revenues by product category as a percentage of net sales in 2020 increased over 2019 by 220 basis points in upholstery sales and by 60 basis points in home office due to “nesting” buying, and our mattress business declined 160 basis points due
to supply-chain disruption caused by COVID-19. Our in-home designer sales were hampered during 2020 but were 22.8% of our total sales compared to 25.3% in 2019. Total sales for 2020 decreased $54.0 million or 6.7% compared to 2019. Our comp-store
sales, which includes online sales, increased 5.0% or $32.7 million in 2020 compared to 2019. The remaining $86.8 million of the change was primarily from our store closures in March through April and from new, closed and otherwise non-comparable
stores.
Sales in 2019 declined for the year due to severe supply-chain disruptions as we moved several product lines out of China due to the increased tariffs. Although these changes were not fully resolved until the first quarter of 2020, we did see
improvement late in the third quarter of 2019. Revenues by product category reflected the supply-chain disruption with a drop in case goods sales. Our mattress business saw an increase of 6.5% over 2018 due to customer purchases of new higher
price point offerings. We offer a number of custom upholstery items and sales in this category rose 6.8% in 2019 over 2018. Total sales for 2019 decreased $15.4 million or 1.9% compared to 2018. Comp-store sales decreased 1.4% or $11.6 million in
2019 compared to 2018 and the remaining $3.8 million of the change was from closed, new and otherwise non-comparable stores.
2022 Outlook
We cannot predict the impact of consumer spending on home furnishings post-pandemic. We believe the strong housing market benefits our business as our footprint covers many of the fastest growing markets. We are improving our customers’ online
experience and furthering our targeted marketing. We have well positioned stores, and we offer on-trend merchandise, knowledgeable salespeople, free in-home design service, and special-order capabilities.
Gross Profit
Our cost of goods sold consists primarily of the purchase price of the merchandise together with inbound freight, handling within our distribution centers and transportation costs to the local markets we serve. Our gross profit is primarily
dependent upon vendor pricing, the mix of products sold and promotional pricing activity. Substantially all of our occupancy and home delivery costs are included in selling, general and administrative expenses as is a portion of our warehousing
expenses. Accordingly, our gross profit may not be comparable to those entities that include some of these expenses in cost of goods sold.
Year-to-Year Comparisons
Gross profit as a percentage of net sales was 56.7% in 2021 compared to 56.0% in 2020. The increase of 70 basis points was primarily due to merchandise price increases and disciplined discounting offsetting product cost and freight increases.
The use of the LIFO method generated a $12.3 million charge in 2021 versus $0.6 million in 2020, or a negative 110 basis points impact to the total gross profit change.
Gross profit as a percentage of net sales was 56.0% in 2020 compared to 54.2% in 2019. The increase was primarily due to less discounting and sales promotions and product mix. The use of the LIFO method generated a $0.6 million charge in 2020
versus $1.8 million in 2019. The impact of changes in reserves, including LIFO, contributed approximately 23 basis points to the total gross profit improvement.
2022 Outlook
Our expectations for 2022 are for annual gross profit margins of approximately 56.6% to 57.0%. This assumes changes in merchandise and freight costs and its impact on the LIFO reserve.
Selling, General and Administrative Expenses
SG&A expenses are comprised of five categories: selling, occupancy, delivery and certain warehousing costs, advertising, and administrative. Selling expenses primarily are comprised of compensation of sales team members and sales support
staff, and fees paid to credit card and third-party finance companies. Occupancy costs include rents, depreciation charges, insurance and property taxes, repairs and maintenance expense and utility costs. Delivery costs include personnel, fuel
costs, and depreciation and rental charges for rolling stock.
21
Warehouse costs include supplies, depreciation, and rental charges for equipment. Advertising expenses are primarily media production and space, direct mail costs, market research expenses and agency fees. Administrative expenses are comprised
of compensation costs for store personnel exclusive of sales team members, information systems, executive, accounting, merchandising, advertising, supply chain, real estate and human resource departments.
We classify our SG&A expenses as either variable or fixed and discretionary. Our variable expenses include the costs in the selling and delivery categories and certain warehouse expenses as these amounts will generally move in tandem with
our level of sales. The remaining categories and expenses are classified as fixed and discretionary because these costs do not fluctuate with sales. The following table outlines our SG&A expenses by classification:
|
2021
|
2020
|
2019
|
||||||||||||||||||
|
(In thousands)
|
% of
Net Sales
|
% of
Net Sales
|
% of
Net Sales
|
|||||||||||||||||
|
Variable
|
$
|
173,810
|
17.2
|
%
|
$
|
135,286
|
18.1
|
%
|
$
|
147,415
|
18.4
|
%
|
||||||||
|
Fixed and discretionary
|
282,457
|
27.9
|
242,002
|
32.3
|
260,041
|
32.4
|
||||||||||||||
|
$
|
456,267
|
45.1
|
$
|
377,288
|
50.4
|
%
|
$
|
407,456
|
50.8
|
%
|
||||||||||
Year-to-Year Comparisons
Our SG&A dollars as a percent of sales decreased to 45.1% in 2021 from 50.4% in 2020. We were able to leverage our fixed and discretionary costs as we achieved record sales throughout the year. We increased our advertising spend $9.5 million
in 2021 to $49.3 million. Our occupancy costs increased $3.9 million driven by greater rent expense primarily on the distribution facilities in the sale-leaseback in 2020 and higher utilities and repairs and maintenance partly offset by lower
depreciation expense. Warehouse and transportation expense rose $10.6 million on higher salaries and benefits, temporary labor and $4.2 million in accessorial and demurrage fees. Administrative expense increased $18.9 million primarily from
increased wages and related costs, higher amortization expense on performance stock awards, and increased incentive compensation costs.
Our SG&A dollars as a percent of sales decreased 40 basis points to 50.4% in 2020 from 50.8% in 2019. Our fixed and discretionary expenses fell $18.0 million or 6.9% in 2020 over 2019. This drop was due to actions taken as part of our
business continuity plan. Advertising expenditures decreased approximately $9.4 million. Our occupancy costs were down $5.4 million in 2020 versus 2019 due to rent abatements in 2020 and a $2.4 million impairment charge in 2019. The workforce
reduction in April also contributed to the reduction in our fixed and discretionary costs. Our variable expenses decreased 30 basis points as a percent of sales due to reduced third-party financing costs.
2022 Outlook
Fixed and discretionary type expenses within SG&A are expected to be in the $295.0 to $298.0 million range for 2022. We anticipate higher advertising and marketing costs in 2022, increased compensation and incentive expense, and additional
costs associated with new stores. Fixed and discretionary type expenses are expected to be at similar quarterly levels in 2022 as in 2021, as adjusted for the overall increases.
Variable costs within SG&A for 2022 are expected to be between 17.2% and 17.4% as a percent of sales. This increase is primarily driven by wage inflation and higher delivery costs.
Interest (Income) Expense, Net
We earned $0.1 million less interest income in 2021 than in 2020 due to lower rates and incurred $0.2 million less interest expense under our credit agreement.
Provision for Income Taxes
Our effective tax rate was 23.4% in 2021, 22.9% in 2020 and 23.9% in 2019. The rates vary from the U.S. federal statutory rate primarily due to state income taxes. The rates in 2021 and 2020 also benefitted from the recognition of state quality
jobs credits of $481,000 and $1,527,000, respectively. See Note 7, “Income Taxes” of the Notes to Consolidated Financial Statements for further information about our income taxes.
22
Liquidity and Capital Resources
Cash and Cash Equivalents at End of Year
At December 31, 2021, we had $166.1 million in cash and cash equivalents, and $6.7 million in restricted cash equivalents. See Note 1 to our consolidated financial statements for further discussion of our restricted cash equivalents. We
believe that our current cash position, cash flow generated from operations, funds available from our credit agreement, and access to the long-term debt capital markets should be sufficient for our operating requirements and to enable us to fund
our capital expenditures, dividend payments, and lease obligations through the next several years. In addition, we believe we have the ability to obtain alternative sources of financing. We expect capital expenditures of approximately $37.0
million in 2022.
Long-Term Debt
In May 2020, we entered into the Third Amendment to our Amended and Restated Credit Agreement (as amended, the “Credit Agreement”) with a bank. The Credit Agreement, which matures September 27, 2024, provides for a $60.0 million revolving
credit facility. See Note 5, “Credit Arrangement” of the Notes to Consolidated Financial Statements for information about our Credit Agreement.
Leases
We use operating leases to fund a portion of our real estate, including our stores, distribution centers, and store support space.
On May 18, 2020, we completed a sale and leaseback transaction of three facilities which we initiated in April as part of our business continuity plan. The total sales price for these properties, excluding costs and taxes, was $70.0
million and their net book value was approximately $37.9 million. In August 2021, we purchased one of these facilities. See Note 8, “Leases” of the Notes to Consolidated Financial Statements for further discussion of our operating leases.
Share Repurchases
In August and November 2021, our Board of Directors authorized additional amounts under a share repurchase program. We made cash payments of $41.8 million for repurchases of our common stock through open market purchases during 2021 and there
is approximately $25.0 million at December 31, 2021 that may yet be purchased under the existing authorization.
Cash Flows Summary
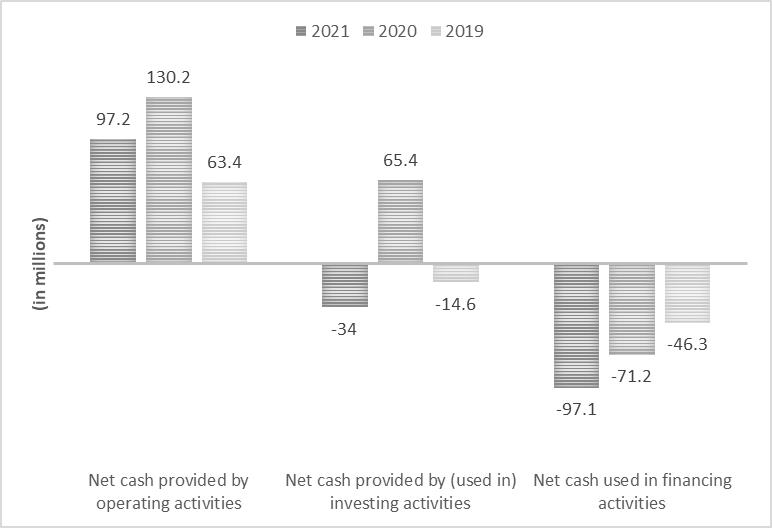
23
Operating Activities. Cash flow generated from operations provides us with a significant source of liquidity. Our operating cash flows result primarily from cash received from our
customers, offset by cash payments we make for products and services, employee compensation, operations, and occupancy costs.
Cash provided by or used in operating activities is also subject to changes in working capital. Working capital at any specific point in time is subject to many variables, including seasonality, inventory selection, the timing of cash receipts
and payments, and vendor payment terms.
Net cash provided by operating activities in 2021 was $97.2 million driven primarily by net income of $90.8 million and non-cash adjustments to net income of $25.5 million consisting primarily of depreciation and amortization and stock-based
compensation expense, and by working capital inflows driven primarily by customer deposits and outflows for inventory turnover and timing of inventory purchases.
Net cash provided by operating activities in 2020 was $130.2 million driven primarily by net income of $59.1 million and non-cash adjustments to net income of $14.0 million, consisting of gains from sales of property and equipment,
depreciation and amortization, stock-based compensation expense and changes in deferred income taxes, and by working capital inflows driven primarily by customer deposits, inventory turnover and timing of inventory purchases.
Investing Activities. Cash used in investing activities in 2021 primarily reflected $34.1 million of capital expenditures.
Cash provided by investing activities in 2020 primarily reflected $76.3 million of proceeds from sale of property and equipment, primarily from the sale-leaseback transaction, net of $10.9 million of capital expenditures.
Financing Activities. Cash used in financing activities in 2021 primarily reflected $52.4 million of cash dividends paid and $41.8 million of share repurchases.
Cash used in financing activities in 2020 primarily reflected $50.5 million of cash dividends paid and $19.7 million of share repurchases.
Contractual Obligations
We have no short-term borrowings or funded debt. The following summarizes our contractual obligations and commercial commitments as of December 31, 2021 (in thousands):
|
Payments Due or Expected by Period
|
||||||||||||||||||||
|
Total
|
Less than
1 Year
|
1-3
Years
|
3-5
Years
|
After 5
Years
|
||||||||||||||||
|
Operating leases(1)
|
$
|
290,696
|
$
|
45,277
|
$
|
78,992
|
$
|
59,622
|
$
|
106,805
|
||||||||||
|
Rent deferrals(2)
|
351
|
131
|
—
|
32
|
188
|
|||||||||||||||
|
Purchase orders
|
201,520
|
201,520
|
—
|
—
|
—
|
|||||||||||||||
|
Total contractual obligations (3)
|
$
|
492,567
|
$
|
246,928
|
$
|
78,992
|
$
|
59,654
|
$
|
106,993
|
||||||||||
|
(1)
|
These amounts are for our undiscounted lease obligations recorded in our consolidated balance sheets, as lease liabilities. For additional information about our leases, refer to Note 8, “Leases”
of the Notes to the Consolidated Financial Statements.
|
|
(2)
|
Lease concessions related to the impact of COVID-19. For additional information about our leases, refer to Note 8, “Leases” of the Notes to the Consolidated Financial Statements.
|
|
(3)
|
The contractual obligations do not include any amounts related to retirement benefits. For additional information about our plans, refer to Note 10, “Benefit Plans” of the Notes to the
Consolidated Financial Statements.
|
24
Store Expansion and Capital Expenditures
We have entered new markets and made continued improvements and relocations of our store base. The following outlines the change in our selling square footage for each of the three years ended December 31 (square footage in thousands):
|
2021
|
2020
|
2019
|
||||||||||||||||||||||
|
Store Activity:
|
#
of Stores |
Square
Footage
|
#
of Stores |
Square
Footage
|
#
of Stores |
Square
Footage
|
||||||||||||||||||
|
Opened
|
2
|
44
|
1
|
28
|
3
|
98
|
||||||||||||||||||
|
Closed
|
1
|
42
|
2
|
102
|
2
|
88
|
||||||||||||||||||
|
Year end balances
|
121
|
4,354
|
120
|
4,352
|
121
|
4,426
|
||||||||||||||||||
The following table summarizes our store activity in 2021 and plans for 2022.
|
Location
|
Opening (Closing) Quarter
Actual or Planned
|
Category
|
|
Myrtle Beach, SC
|
Q-1-21
|
Open-New Market
|
|
The Villages, FL
|
Q-3-21
|
Open
|
|
Dallas, TX
|
Q-3-21
|
Closure
|
|
Austin, TX
|
Q-2-22
|
Open
|
|
Indianapolis, IN
|
Q-3-22
|
Relocation
|
|
Metro DC
|
Q-3-22
|
Open
|
|
Atlanta, GA
|
Q-3-22
|
Closure
|
|
TBA
|
Q-4-22
|
Open
|
These plans and other changes should increase net selling space in 2022 approximately 1% over 2021 assuming the new stores open and existing stores close as planned.
Our investing activities in stores and operations in 2021, 2020 and 2019 and planned outlays for 2022 are categorized in the table below. Capital expenditures for stores in the years noted do not necessarily coincide with the years in which the
stores open.
|
(Approximate in thousands)
|
Proposed 2022
|
2021
|
2020
|
2019
|
||||||||||||
|
Stores:
|
||||||||||||||||
|
New or replacement stores(1)
|
$
|
10,000
|
$
|
7,000
|
$
|
1,000
|
$
|
5,700
|
||||||||
|
Remodels/expansions
|
3,600
|
4,300
|
600
|
500
|
||||||||||||
|
Other improvements
|
5,700
|
4,500
|
3,200
|
4,100
|
||||||||||||
|
Total stores
|
19,300
|
15,800
|
4,800
|
10,300
|
||||||||||||
|
Distribution(1)
|
13,500
|
15,300
|
3,600
|
2,700
|
||||||||||||
|
Information technology
|
4,200
|
3,000
|
2,500
|
3,800
|
||||||||||||
|
Total
|
$
|
37,000
|
$
|
34,100
|
$
|
10,900
|
$
|
16,800
|
||||||||
|
(1)
|
In 2021 we purchased one retail location and one distribution facility that were previously leased.
|
25
Critical Accounting Estimates and Assumptions
Our discussion and analysis is based upon our consolidated financial statements, which have been prepared in accordance with U.S. generally accepted accounting principles. The preparation of these financial statements requires us to make
estimates and judgments that affect the reported amounts of assets, liabilities, revenues and expenses, and related disclosures. We base our estimates on historical experience and on various other assumptions that are believed to be reasonable
under the circumstances, and evaluate our estimates and judgments required by our policies on an ongoing basis and update them as appropriate based on changing conditions.
Accounting estimates are considered critical if both of the following conditions are met: (a) the nature of the estimates or assumptions is material because of the levels of subjectivity and judgment needed to account for matters that are highly
uncertain and susceptible to change and (2) the effect of the estimates and assumptions is material to the financial statements.
We have reviewed our accounting estimates, and none were deemed to be considered critical for the accounting periods presented.
Market risk represents the potential loss arising from adverse changes in the value of financial instruments. The risk of loss is assessed based on the likelihood of adverse changes in fair values, cash flows or future earnings.
In the ordinary course of business, we are exposed to various market risks, including fluctuations in interest rates. Our exposure to interest rate risk relates to the interest income generated by cash, cash equivalents, and interest expense on
the Credit Facility. The primary objective of our investment policy is to preserve principal while maximizing income without significantly increasing risk. We do not believe that an increase or decrease in interest rates of 100 basis points would
have a material effect on our operating results or financial condition. During 2021, we had no outstanding borrowings under our Credit Agreement (as discussed in Note 5 to the Consolidated Financial Statements), which bears interest based on
variable rates.
The report of our independent registered public accounting firm, the Consolidated Financial Statements of Havertys and the Notes to Consolidated Financial Statements, and the supplementary financial information called for by this Item 8, are set
forth on pages F-1 to F-22 of this report. Specific financial statements and supplementary data can be found at the pages listed in the following index:
|
Index
|
Page
|
|
|
Financial Statements
|
||
|
Report of Independent Registered Public Accounting Firm on the Consolidated Financial Statements (PCAOB ID )
|
F-1
|
|
|
Consolidated Balance Sheets
|
F-2
|
|
|
Consolidated Statements of Comprehensive Income
|
F-3
|
|
|
Consolidated Statements of Stockholders’ Equity
|
F-4
|
|
|
Consolidated Statements of Cash Flows
|
F-5
|
|
|
Notes to Consolidated Financial Statements
|
F-6
|
|
|
Schedule II – Valuation and Qualifying Accounts
|
F-22
|
26
ITEM 9. CHANGES IN AND DISAGREEMENTS WITH ACCOUNTANTS ON ACCOUNTING AND FINANCIAL DISCLOSURE
None.
(a) Disclosure Controls and Procedures. Our management has evaluated, with the participation of our Chief Executive Officer (“CEO”) and Chief
Financial Officer (“CFO”), the effectiveness of the design and operation of the Company’s “disclosure controls and procedures” (as defined in Rules 13a-15(e) and 15d-15(e) under the Securities Exchange Act of 1934, as amended) as of the end of the
period covered by this report. Based on that evaluation, our CEO and CFO concluded that our disclosure controls and procedures were effective for the purpose of providing reasonable assurance that the information we must disclose in reports that we
file or submit under the Securities Exchange Act (i) is recorded, processed, summarized and reported within the time periods specified in the SEC’s rules and forms and (ii) is accumulated and communicated to the Company’s management, including its
CEO and CFO, as appropriate to allow timely decisions regarding required disclosures.
(b) Management’s Annual Report on Internal Control over Financial Reporting. Our management is responsible for establishing and maintaining adequate internal control over financial
reporting, as such term is defined in Rule 13a-15(f) of the Exchange Act. Under the supervision and with the participation of our management, including our CEO and CFO, we conducted an evaluation of the effectiveness of our internal control over
financial reporting based upon the framework in Internal Control – Integrated Framework issued by the Committee of Sponsoring Organizations of the Treadway Commission (2013 framework). Based on that
evaluation, our management concluded that our internal control over financial reporting is effective as of December 31, 2021.
Attestation Report of the Independent Registered Public Accounting Firm. Grant Thornton LLP, an independent registered public accounting firm,
has audited the consolidated financial statements included in this annual report on Form 10-K and, as part of their audit, has issued their report, included herein, on the effectiveness of our internal control over financial reporting.
(c) Changes in Internal Control over Financial Reporting. During the fourth quarter of 2021, there were no changes in our internal control over financial reporting that have affected,
or are reasonably likely to materially affect, our internal control over financial reporting.
27
REPORT OF INDEPENDENT REGISTERED PUBLIC ACCOUNTING FIRM
Board of Directors and Stockholders
Haverty Furniture Companies, Inc.
Opinion on internal control over financial reporting
We have audited the internal control over financial reporting of Haverty Furniture Companies, Inc. (a Maryland Corporation) and subsidiary (the “Company”) as of December 31, 2021, based on criteria established in the 2013 Internal Control—Integrated Framework issued by the Committee of Sponsoring Organizations of the Treadway Commission (“COSO”). In our opinion, the Company maintained, in all material respects, effective internal
control over financial reporting as of December 31, 2021, based on criteria established in the 2013 Internal Control—Integrated Framework issued by COSO.
We also have audited, in accordance with the standards of the Public Company Accounting Oversight Board (United States) (“PCAOB”), the consolidated financial statements of the Company as of and for the year ended December 31, 2021, and our
report dated March 1, 2022 expressed an unqualified opinion on those financial statements.
Basis for opinion
The Company’s management is responsible for maintaining effective internal control over financial reporting and for its assessment of the effectiveness of internal control over financial reporting, included in the accompanying Management’s
Annual Report on Internal Control over Financial Reporting. Our responsibility is to express an opinion on the Company’s internal control over financial reporting based on our audit. We are a public accounting firm registered with the PCAOB and are
required to be independent with respect to the Company in accordance with the U.S. federal securities laws and the applicable rules and regulations of the Securities and Exchange Commission and the PCAOB.
We conducted our audit in accordance with the standards of the PCAOB. Those standards require that we plan and perform the audit to obtain reasonable assurance about whether effective internal control over financial reporting was maintained in
all material respects. Our audit included obtaining an understanding of internal control over financial reporting, assessing the risk that a material weakness exists, testing and evaluating the design and operating effectiveness of internal control
based on the assessed risk, and performing such other procedures as we considered necessary in the circumstances. We believe that our audit provides a reasonable basis for our opinion.
Definition and limitations of internal control over financial reporting
A company’s internal control over financial reporting is a process designed to provide reasonable assurance regarding the reliability of financial reporting and the preparation of financial statements for external purposes in accordance with
generally accepted accounting principles. A company’s internal control over financial reporting includes those policies and procedures that (1) pertain to the maintenance of records that, in reasonable detail, accurately and fairly reflect the
transactions and dispositions of the assets of the company; (2) provide reasonable assurance that transactions are recorded as necessary to permit preparation of financial statements in accordance with generally accepted accounting principles, and
that receipts and expenditures of the company are being made only in accordance with authorizations of management and directors of the company; and (3) provide reasonable assurance regarding prevention or timely detection of unauthorized
acquisition, use, or disposition of the company’s assets that could have a material effect on the financial statements.
Because of its inherent limitations, internal control over financial reporting may not prevent or detect misstatements. Also, projections of any evaluation of effectiveness to future periods are subject to the risk that controls may become
inadequate because of changes in conditions, or that the degree of compliance with the policies or procedures may deteriorate.
/s/ GRANT THORNTON LLP
Atlanta, Georgia
March 1, 2022
28
None
Not Applicable
We have adopted a Code of Conduct (the “Code”) for our directors, officers (including our principal executive officer, and principal financial and accounting officer) and team members. The Code is available on our website at www.havertys.com. In the event we amend or waive any provisions of the Code applicable to our principal executive officer or
principal financial and accounting officer, we will disclose the same by filing a Form 8-K. The information contained on or connected to our Internet website is not incorporated by reference into this annual report on Form 10-K and should not be
considered part of this or any other report that we file or furnish to the SEC.
We provide some information about our executive officers in Part I of this report under the heading “Information about our Executive Officers.” The remaining information called for by this item is incorporated by reference to “Proposal 1:
Nominees for Election by Holders of Class A Common Stock and Nominees for Election by Holders of Common Stock,” “Corporate Governance,” “Committees of the Board” and “Certain Relationships and Related Transactions – Delinquent Section 16(a)
Reports” in our 2022 Proxy Statement.
The information contained in our 2022 Proxy Statement with respect to executive compensation and transactions under the heading “Compensation Discussion and Analysis” is incorporated herein by reference in response to this item.
ITEM 12. SECURITY OWNERSHIP OF CERTAIN BENEFICIAL OWNERS AND MANAGEMENT AND RELATED STOCKHOLDER MATTERS
The information contained in our 2022 Proxy Statement with respect to the ownership of common stock and Class A common stock by certain beneficial owners and management, and with respect to our compensation plans under which equity securities
are authorized for issuance under the headings “Ownership by our Directors and Management” and “Equity Compensation Plan Information,” is incorporated herein by reference in response to this item.
For purposes of determining the aggregate market value of our common stock and Class A common stock held by non-affiliates, shares held by all directors and executive officers have been excluded. The exclusion of such shares is not intended to,
and shall not, constitute a determination as to which persons or entities may be “affiliates” as defined under the Securities Exchange Act of 1934.
The information contained in our 2022 Proxy Statement with respect to certain relationships, related party transactions and director independence under the headings “Certain Relationships and Related Transactions” and “Corporate Governance –
Governance Guidelines and Policies – Director Independence” is incorporated herein by reference in response to this item.
29
ITEM 14. PRINCIPAL ACCOUNTING FEES AND SERVICES
The information under the heading “Audit Matters” in our 2022 Proxy Statement is incorporated herein by reference to this item.
PART IV
| (a) |
The following documents are filed as part of this report:
|
(1) Financial Statements.
Consolidated Balance Sheets – December 31, 2021 and 2020.
Consolidated Statements of Comprehensive Income – Years ended December 31, 2021, 2020 and 2019.
Consolidated Statements of Stockholders’ Equity – Years ended December 31, 2021, 2020 and 2019.
Consolidated Statements of Cash Flows – Years ended December 31, 2021, 2020 and 2019.
Notes to Consolidated Financial Statements
(2) Financial Statement Schedule.
The following financial statement schedule of Haverty Furniture Companies, Inc. is filed as part of this Report and should be read in conjunction with the Consolidated Financial Statements:
Schedule II – Valuation and Qualifying Accounts
All other schedules have been omitted because they are inapplicable, or the required information is included in the Consolidated Financial Statements or notes thereto.
(3) Exhibits:
Our SEC File Number is 1-14445 for all exhibits filed with the Securities Exchange Act reports.
|
Exhibit No.
|
Exhibit
|
|
3.1
|
Articles of Amendment and Restatement of the Charter of Haverty Furniture Companies, Inc. effective May 2006 (Incorporated by reference to
Exhibit 3.1 to our 2006 Second Quarter Form 10-Q).
|
|
3.2
|
By-Laws of Haverty Furniture Companies, Inc., as amended and restated effective May 8, 2018 (Incorporated by reference to Exhibit 3.1 to our
Current Report on Form 8-K dated May 10, 2018).
|
|
4.1
|
Description of Securities of the Registrant. (Incorporated by reference to Exhibit 4.1 to our Annual Report on Form
10-K for the fiscal year ended December 31, 2019).
|
30
|
Exhibit No.
|
Exhibit
|
31
|
Exhibit No.
|
Exhibit
|
|
+10.9
|
Amended and Restated Non-Qualified Deferred Compensation Plan, effective as of August 9, 2016 (Incorporated by reference to Exhibit 10.9 to
our 2016 Form 10-K).
|
|
+10.10
|
Top Hat Mutual Fund Option Plan, effective as of January 15, 1999 (Incorporated by reference to Exhibit 10.15 to our 1999 Form
10-K).
|
|
+10.11
|
Form of Restricted Stock Unit Award Notice in connection with the 2014 Long-Term Incentive Compensation Plan (Incorporated by reference to
Exhibit 10.1 to our Current Report on Form 8-K dated February 2, 2018).
|
|
+10.12
|
Form of Restricted Stock Units Award Notice, Form of Performance Restricted Stock Units (EBITDA) Award Notice and Form of Performance Restricted Units (Sales) Award Notice in connection with the 2014 Long-Term Incentive Compensation Plan. (Incorporated by reference to Exhibits 10.1, 10.2 and 10.3 to our Current Report on Form 8-K dated January 29, 2020 |
32
|
Exhibit No.
|
Exhibit
|
|
10.21
|
Lease Agreement dated May 18, 2020 between Haverty Furniture Companies, Inc. as Tenant and HF Coppel TX Landlord, LLC as Landlord (Incorporated
by reference to Exhibit 10.3 to our Current Report on Form 8-K dated May 20, 2020).
|
|
10.22
|
Lease Agreement dated May 18, 2020 between Haverty Furniture Companies, Inc. as Tenant and HF Lakeland FL Landlord, LLC as Landlord (Incorporated
by reference to Exhibit 10.4 to our Current Report on Form 8-K dated May 20, 2020).
|
| *21.1 | Subsidiaries of Haverty Furniture Companies, Inc. |
|
*23.1
|
Consent of Grant Thornton LLP, Independent Registered Public Accounting Firm.
|
|
*31.1
|
Certification pursuant to Rules 13a-14 and 15d-14 under the Securities Exchange Act of 1934, as amended.
|
|
*31.2
|
Certification pursuant to Rules 13a-14 and 15d-14 under the Securities Exchange Act of 1934, as amended.
|
|
#32.1
|
Certifications pursuant to 18 U.S.C. Section 1350.
|
|
101
|
The following financial information from our Report on Form 10-K for the year ended December 31, 2021, formatted in inline XBRL: (i) Consolidated Balance Sheets ended December 31, 2021 and 2020, (ii) Consolidated Statements of
Comprehensive Income for the years ended December 31, 2021, 2020 and 2019, (iii) Consolidated Statements of Stockholders’ Equity for the years ended December 31, 2021, 2020 and 2019, (iv) Consolidated Statements of Cash Flow for the
years ended December 31, 2021, 2020 and 2019, and (v) the Notes to Consolidated Financial Statements.
|
|
104
|
Cover Page Interactive Data File (formatted as Inline XBRL and contained in Exhibit 101).
|
* Filed herewith.
+
Indicates a management contract or compensatory plan or arrangement required to be filed as exhibits pursuant to Item 15(b) of Form 10-K.
#
Furnished herewith.
None.
33
REPORT OF INDEPENDENT REGISTERED PUBLIC ACCOUNTING FIRM
Board of Directors and Stockholders
Haverty Furniture Companies, Inc.
Opinion on the financial statements
We have audited the accompanying consolidated balance sheets of Haverty Furniture Companies, Inc. (a Maryland corporation) and subsidiary (the “Company”) as of December 31, 2021 and 2020, the related consolidated statements of comprehensive
income, stockholders’ equity, and cash flows for each of the three years in the period ended December 31, 2021, and the related notes and financial statement schedule included under Item 15(a) (collectively referred to as the “financial
statements”). In our opinion, the financial statements present fairly, in all material respects, the financial position of the Company as of December 31, 2021 and 2020, and the results of its operations and its cash flows for each of the three
years in the period ended December 31, 2021, in conformity with accounting principles generally accepted in the United States of America.
We also have audited, in accordance with the standards of the Public Company Accounting Oversight Board (United States) (“PCAOB”), the Company’s internal control over financial reporting as of December 31, 2021, based on criteria established in
the 2013 Internal Control—Integrated Framework issued by the Committee of Sponsoring Organizations of the Treadway Commission (“COSO”), and our report dated March 1, 2022 expressed an unqualified opinion.
Basis for opinion
These financial statements are the responsibility of the Company’s management. Our responsibility is to express an opinion on the Company’s financial statements based on our audits. We are a public accounting firm registered with the PCAOB and
are required to be independent with respect to the Company in accordance with the U.S. federal securities laws and the applicable rules and regulations of the Securities and Exchange Commission and the PCAOB.
We conducted our audits in accordance with the standards of the PCAOB. Those standards require that we plan and perform the audit to obtain reasonable assurance about whether the financial statements are free of material misstatement, whether
due to error or fraud. Our audits included performing procedures to assess the risks of material misstatement of the financial statements, whether due to error or fraud, and performing procedures that respond to those risks. Such procedures
included examining, on a test basis, evidence regarding the amounts and disclosures in the financial statements. Our audits also included evaluating the accounting principles used and significant estimates made by management, as well as evaluating
the overall presentation of the financial statements. We believe that our audits provide a reasonable basis for our opinion.
Critical audit matters
Critical audit matters are matters arising from the current period audit of the financial statements that were communicated or required to be communicated to the audit committee and that: (1) relate to accounts or disclosures that are material
to the financial statements and (2) involved our especially challenging, subjective, or complex judgments. We determined that there are no critical audit matters.
/s/ GRANT THORNTON LLP
We have served as the Company’s auditor since 2016.
March 1, 2022
F-1
HAVERTY FURNITURE COMPANIES, INC.
CONSOLIDATED BALANCE SHEETS
| |
December 31,
|
|||||||
|
(In thousands, except per share data)
|
2021
|
2020
|
||||||
|
Assets
|
||||||||
|
Current assets
|
||||||||
|
Cash and cash equivalents
|
$
|
|
$
|
|
||||
|
Restricted cash equivalents
|
|
|
||||||
|
Inventories
|
|
|
||||||
|
Prepaid expenses
|
|
|
||||||
|
Other current assets
|
|
|
||||||
|
Total current assets
|
|
|
||||||
|
Property and equipment, net
|
|
|
||||||
|
Right-of-use lease assets
|
|
|
||||||
|
Deferred income taxes
|
|
|
||||||
|
Other assets
|
|
|
||||||
|
Total assets
|
$
|
|
$
|
|
||||
|
Liabilities and Stockholders’ Equity
|
||||||||
|
Current liabilities
|
||||||||
|
Accounts payable
|
$
|
|
$
|
|
||||
|
Customer deposits
|
|
|
||||||
|
Accrued liabilities
|
|
|
||||||
|
Current lease liabilities
|
|
|
||||||
|
Total current liabilities
|
|
|
||||||
|
Noncurrent lease liabilities
|
|
|
||||||
|
Other liabilities
|
|
|
||||||
|
Total liabilities
|
|
|
||||||
|
Stockholders’ equity
|
||||||||
|
Capital Stock, par value $
|
||||||||
|
Preferred Stock, Authorized –
|
|
|
||||||
|
Common Stock, Authorized –
|
|
|
||||||
|
Convertible Class A Common Stock, Authorized –
|
|
|
||||||
|
Additional paid-in capital
|
|
|
||||||
|
Retained earnings
|
|
|
||||||
|
Accumulated other comprehensive loss
|
(
|
)
|
(
|
)
|
||||
|
Treasury stock at cost – Common Stock (2021 –
|
(
|
)
|
(
|
)
|
||||
|
Total stockholders’ equity
|
|
|
||||||
|
Total liabilities and stockholders’ equity
|
$
|
|
$
|
|
||||
The accompanying notes are an integral part of these consolidated financial statements.
HAVERTY FURNITURE COMPANIES, INC.
CONSOLIDATED STATEMENTS OF COMPREHENSIVE INCOME
|
Year Ended December 31,
|
||||||||||||
|
(In thousands, except per share data)
|
2021
|
2020
|
2019
|
|||||||||
|
Net sales
|
$
|
|
$
|
|
$
|
|
||||||
|
Cost of goods sold
|
|
|
|
|||||||||
|
Gross profit
|
|
|
|
|||||||||
|
Expenses:
|
||||||||||||
|
Selling, general and administrative
|
|
|
|
|||||||||
|
Other expense (income), net
|
|
(
|
)
|
(
|
)
|
|||||||
|
Total expenses
|
|
|
|
|||||||||
|
Income before interest and income taxes
|
|
|
|
|||||||||
|
Interest income, net
|
|
|
|
|||||||||
|
Income before income taxes
|
|
|
|
|||||||||
|
Income tax expense
|
|
|
|
|||||||||
|
Net income
|
$
|
|
$
|
|
$
|
|
||||||
|
Other comprehensive income (loss), net of tax:
|
||||||||||||
|
Defined benefit pension plan adjustments; net of tax expense (benefit) of $
|
$
|
|
$
|
(
|
)
|
$
|
(
|
)
|
||||
|
Comprehensive income
|
$
|
|
$
|
|
$
|
|
||||||
|
Basic earnings per share:
|
||||||||||||
|
Common Stock
|
$
|
|
$
|
|
$
|
|
||||||
|
Class A Common Stock
|
$
|
|
$
|
|
$
|
|
||||||
|
Diluted earnings per share:
|
||||||||||||
|
Common Stock
|
$
|
|
$
|
|
$
|
|
||||||
|
Class A Common Stock
|
$
|
|
$
|
|
$
|
|
||||||
The accompanying notes are an integral part of these consolidated financial statements.
HAVERTY FURNITURE COMPANIES, INC.
CONSOLIDATED STATEMENTS OF STOCKHOLDERS’ EQUITY
|
Year Ended December 31,
|
||||||||||||||||||||||||
| (In thousands, except per share data) |
2021
|
2020
|
2019
|
|||||||||||||||||||||
|
|
Shares
|
Dollars
|
Shares
|
Dollars
|
Shares
|
Dollars
|
||||||||||||||||||
|
Common Stock:
|
||||||||||||||||||||||||
|
Beginning balance
|
|
$
|
|
|
$
|
|
|
$
|
|
|||||||||||||||
|
Conversion of Class A Common Stock
|
|
|
|
|
|
|
||||||||||||||||||
|
Stock compensation transactions, net
|
|
|
|
|
|
|
||||||||||||||||||
|
Ending balance
|
|
|
|
|
|
|
||||||||||||||||||
|
Class A Common Stock:
|
||||||||||||||||||||||||
|
Beginning balance
|
|
|
|
|
|
|
||||||||||||||||||
|
Conversion to Common Stock
|
(
|
)
|
(
|
)
|
(
|
)
|
(
|
)
|
(
|
)
|
(
|
)
|
||||||||||||
|
Ending balance
|
|
|
|
|
|
|
||||||||||||||||||
|
Treasury Stock:
|
||||||||||||||||||||||||
|
Beginning balance (includes
|
(
|
)
|
(
|
)
|
(
|
)
|
(
|
)
|
(
|
)
|
(
|
)
|
||||||||||||
|
Directors’ Compensation Plan
|
|
|
|
|
|
|
||||||||||||||||||
|
Purchases
|
(
|
)
|
(
|
)
|
(
|
)
|
(
|
)
|
(
|
)
|
(
|
)
|
||||||||||||
|
Ending balance
|
(
|
)
|
(
|
)
|
(
|
)
|
(
|
)
|
(
|
)
|
(
|
)
|
||||||||||||
|
Additional Paid-In Capital:
|
||||||||||||||||||||||||
|
Beginning balance
|
|
|
|
|||||||||||||||||||||
|
Stock option and restricted stock issuances
|
(
|
)
|
(
|
)
|
(
|
)
|
||||||||||||||||||
|
Directors’ Compensation Plan
|
|
|
(
|
)
|
||||||||||||||||||||
|
Stock-based compensation
|
|
|
|
|||||||||||||||||||||
|
Ending balance
|
|
|
|
|||||||||||||||||||||
|
Retained Earnings:
|
||||||||||||||||||||||||
|
Beginning balance
|
|
|
|
|||||||||||||||||||||
|
Impact of adoption of new accounting pronouncement
|
|
|
|
|||||||||||||||||||||
|
Net income
|
|
|
|
|||||||||||||||||||||
|
Cash dividends
(Common Stock: 2021 – $
Class A Common Stock: 2021 - $
|
(
|
)
|
(
|
)
|
(
|
)
|
||||||||||||||||||
|
Ending balance
|
|
|
|
|||||||||||||||||||||
|
Accumulated Other Comprehensive Loss:
|
||||||||||||||||||||||||
|
Beginning balance
|
(
|
)
|
(
|
)
|
(
|
)
|
||||||||||||||||||
|
Pension liabilities adjustment, net of taxes
|
|
(
|
)
|
(
|
)
|
|||||||||||||||||||
|
Ending balance
|
(
|
)
|
(
|
)
|
(
|
)
|
||||||||||||||||||
|
Total Stockholders’ Equity
|
$
|
|
$
|
|
$
|
|
||||||||||||||||||
The accompanying notes are an integral part of these consolidated financial statements.
HAVERTY FURNITURE COMPANIES, INC.
CONSOLIDATED STATEMENTS OF CASH FLOWS
|
Year Ended December 31,
|
||||||||||||
|
(In thousands)
|
2021
|
2020
|
2019
|
|||||||||
|
Cash Flows from Operating Activities
|
||||||||||||
|
Net income
|
$
|
|
$
|
|
$
|
|
||||||
|
Adjustments to reconcile net income to net cash
provided by operating activities: |
||||||||||||
|
Depreciation and amortization
|
|
|
|
|||||||||
|
Net loss on asset impairment
|
|
|
|
|||||||||
|
Stock-based compensation
|
|
|
|
|||||||||
|
Deferred income taxes
|
|
(
|
)
|
(
|
)
|
|||||||
|
Net (gain) loss on sale of land, property and equipment
|
(
|
)
|
(
|
)
|
(
|
)
|
||||||
|
Other
|
|
|
|
|||||||||
|
Changes in operating assets and liabilities:
|
||||||||||||
|
Inventories
|
(
|
)
|
|
|
||||||||
|
Customer deposits
|
|
|
|
|||||||||
|
Other assets and liabilities
|
(
|
)
|
(
|
)
|
|
|||||||
|
Accounts payable and accrued liabilities
|
(
|
)
|
|
|
||||||||
|
Net cash provided by operating activities
|
|
|
|
|||||||||
|
Cash Flows from Investing Activities
|
||||||||||||
|
Capital expenditures
|
(
|
)
|
(
|
)
|
(
|
)
|
||||||
|
Proceeds from sale of property and equipment
|
|
|
|
|||||||||
|
Net cash (used in) provided by investing activities
|
(
|
)
|
|
(
|
)
|
|||||||
|
Cash Flows from Financing Activities
|
||||||||||||
|
Proceeds from borrowings under revolving credit facilities
|
|
|
|
|||||||||
|
Payments of borrowings under revolving credit facilities
|
|
(
|
)
|
|
||||||||
|
Net change in borrowings under revolving credit facilities
|
|
|
|
|||||||||
|
Dividends paid
|
(
|
)
|
(
|
)
|
(
|
)
|
||||||
|
Common stock repurchased
|
(
|
)
|
(
|
)
|
(
|
)
|
||||||
|
Taxes on vested restricted shares
|
(
|
)
|
(
|
)
|
(
|
)
|
||||||
|
Net cash used in financing activities
|
(
|
)
|
(
|
)
|
(
|
)
|
||||||
|
(Decrease) increase in Cash, Cash Equivalents and Restricted Cash Equivalents
|
(
|
)
|
|
|
||||||||
|
Cash, Cash Equivalents and Restricted Cash Equivalents at Beginning of Year
|
|
|
|
|||||||||
|
Cash and Cash Equivalents and Restricted Cash Equivalents at End of Year
|
$
|
|
$
|
|
$
|
|
||||||
|
Supplemental Disclosures
|
||||||||||||
|
Cash paid during the period for income taxes, net of refunds
|
$
|
|
$
|
|
$
|
|
||||||
|
Cash paid for interest
|
$
|
|
$
|
|
$
|
|
||||||
The accompanying notes are an integral part of these consolidated financial statements.
Notes to Consolidated Financial Statements
Note 1, Description of Business and Summary of Significant Accounting Policies:
Business:
Haverty Furniture Companies, Inc. (“Havertys,” “we,” “our,” or “us”) is a retailer of a broad line of residential furniture in the middle to
upper-middle price ranges. We have 121 showrooms in 16 states at December 31, 2021. All of our stores are operated using the Havertys name and we do not franchise our stores. We also have an online presence through which our customers can make
purchases. We offer financing through third-party finance companies as well as an internal revolving charge credit plan.
COVID-19:
In an effort to mitigate the spread of COVID‑19 and protect our team members, customers, and communities, in 2020 Havertys closed all of its
stores on March 19 and halted deliveries on March 21, with the expectation at that time of reopening stores on April 2. Affected team members were paid during this period and most corporate personnel transitioned to working remotely. On April 1, we
extended our store closure for another 30 days and furloughed 3,033 team members or approximately 87 % of our workforce. During this period,
we paid the cost of enrolled health benefits of those furloughed. Given the dramatic shock to the economy caused by the pandemic and uncertainty of the ongoing impact, we made a permanent reduction in our workforce of approximately 1,200 team members effective April 30 and extended the furlough of approximately 730 team members until June 1. We reopened 103 of our stores on May 1 and the
remaining 17 were opened by June 20 and deliveries restarted on May 5.
The pandemic continues to disrupt several segments of the economy. Although our stores and other businesses are open, some business sectors
are operating on a reduced scale. Our business has been very strong since reopening. Consumers not negatively impacted financially are spending on their homes. The COVID-19 pandemic is complex and continues to evolve
with sporadic resurgences, new virus variants, and the vaccine rollout. At this point, we cannot reasonably estimate the duration of the pandemic’s influence on consumers and the “nesting” economy. Accordingly, the estimates and
assumptions management made as of December 31, 2021 could change in subsequent interim reports, and it is reasonably possible that such changes could be significant (although the potential effects cannot be estimated at this time). The Company has
evaluated subsequent events through the date the consolidated financial statements covered by this annual report were issued.
Basis of Presentation:
The consolidated financial statements include the accounts of Havertys
and its wholly-owned subsidiary. All significant intercompany accounts and transactions have been eliminated in consolidation.
Use of Estimates:
The preparation of financial statements in conformity with United States of America generally accepted accounting principles (“U.S. GAAP”)
requires management to make estimates and assumptions that affect the amounts reported in the financial statements and accompanying notes. Actual results could differ from those estimates.
Cash and Cash Equivalents:
Cash and cash equivalents include all liquid investments with a maturity date of less than
three months when purchased. Cash equivalents also include amounts due from third-party financial institutions for credit and debit card transactions which typically settle within five days .
Restricted Cash Equivalents:
Our insurance carrier requires us to collateralize a portion of our workers’ compensation obligations. These funds are investments in money
market funds held by an agent. The agreement with our carrier governing these funds is on an annual basis expiring on December 31.
Inventories:
Inventories are stated at the lower of cost or market. Cost is determined using the last-in, first-out (LIFO) method.
Property and Equipment:
Property and equipment are stated at cost less accumulated depreciation and amortization. Depreciation is provided over the estimated useful
lives of the assets using the straight-line method. Leasehold improvements are amortized over the shorter of the estimated useful life or the lease term of the related asset. See Leases below.
Estimated useful lives for financial reporting purposes are as follows:
|
Buildings
|
|
|
Improvements
|
|
|
Furniture and Fixtures
|
|
|
Equipment
|
|
Customer Deposits:
Customer deposits consist of cash collections on sales of undelivered merchandise, customer advance payments, and deposits on credit sales for
undelivered merchandise.
Revenue Recognition:
We recognize revenue from merchandise sales and related service fees, net of expected returns and sales tax, at the time the merchandise is
delivered to the customer. The liability for sales returns, including the impact on gross profit, is estimated based on historical return levels and recognized at the transaction price. We also recognize a return asset, and corresponding adjustment
to cost of sales, for our right to recover the goods returned by the customer, measured at the former carrying amount of the goods, less any expected recovery cost. At each financial reporting date, we assess our estimates of expected returns, refund
liabilities, and return assets. When we receive payment from customers before delivery of merchandise, the amount received is recorded as a customer deposit.
Net sales also include amounts generated by product protection plans. We act as an agent for these sales and the service is provided by a
third-party. Revenue, net of related costs, is recognized at the time the covered merchandise is delivered to the customer. We do not sell gift cards or have a loyalty program.
We internally finance less than 2 %
of sales. We do not adjust the promised consideration for the effects of a significant financing component since receivables from internally financed sales are typically paid within one year of delivery.
We expense sales commissions within SG&A at the time revenue is recognized because the amortization period would be one year or less. We
do not disclose the value of unsatisfied performance obligations because delivery is made within one year of the customer purchase.
Cost of Goods Sold:
Our cost of goods sold includes the direct costs of products sold, warehouse handling and transportation costs.
Selling, General and Administrative Expenses:
Our selling, general and administrative (“SG&A”) expenses are comprised of advertising, selling, occupancy, delivery, administrative costs,
and certain warehouse and transportation related expenses including accessorial and demurrage fees. The costs associated with our purchasing, warehousing, delivery and other distribution costs included in SG&A expense were approximately $94,239 ,000, $71,838 ,000 and $77,668 ,000 in 2021, 2020 and 2019, respectively.
Leases:
On January 1, 2019 we adopted Accounting Standards Update (“ASU”) 2016-02, Leases (Topic 842), using the modified retrospective method and did
not restate prior periods. The adoption of ASU 2016-02 had an immaterial impact on our consolidated statement of income and our consolidated statement of cash flows for the year ended December 31, 2019.
We determine if an arrangement contains a lease in whole or in part at the inception of the contract. Right‑of-use (ROU) assets represent our
right to use an underlying asset for the lease term while lease liabilities represent our obligation to make lease payments arising from the lease. All leases greater than 12 months result in the recognition of a ROU asset and a liability at the
lease commencement date based on the present value of the lease payments over the lease term. As most of our leases do not provide the information required to determine the implicit rate, we use our incremental borrowing rate in determining the
present value of lease payments. Our incremental borrowing rate approximates the rate we would get if borrowing on a collateralized basis based on information available at commencement date. We use the implicit rate when readily determinable.
Our lease terms include all non-cancelable periods and may include options to extend (or to not terminate) the lease when it is reasonably
certain that we will exercise that option. Leases that have a term of 12 months or less at the commencement date are expensed on a straight-line basis over the lease term and do not result in the recognition of an asset or a liability.
Lease expense for operating leases is recognized on a straight-line basis over the lease term. We have lease agreements with lease and
non-lease components, primarily related to real estate and we account for the lease and non-lease components as a single lease component. See Note 8, “Leases,” for additional information.
Advertising Expense:
Advertising costs, which include television, radio, newspaper, digital, and other media advertising, are expensed upon first showing. The total
amount of prepaid advertising costs included in other current assets was approximately $88 ,000 and $327 ,000 at December 31, 2021 and 2020, respectively. We incurred approximately $49,338 ,000, $39,862 ,000 and $49,724 ,000 in advertising expense during 2021, 2020 and 2019, respectively.
Interest Income, net:
We report interest income net of interest expense. Interest income is generated by our cash equivalents and restricted cash equivalents.
Interest expense is comprised of charges incurred related to our credit facility. The total amount of interest expense was approximately $152 ,000,
$391 ,000 and $152 ,000 during
2021, 2020 and 2019, respectively.
Other Income, net:
Other income, net includes any gains or losses on sales of property and equipment and other income or expense items outside of core operations.
On May 18, 2020, Havertys completed a sale and leaseback transaction which generated a gain of $31,600 ,000 and is included in other income.
See Note 8, “Leases,” for additional information. The sale of former retail locations and other operating assets generated additional gains of $3,500 ,000
in 2020 and gains in 2021 and 2019.
Self-Insurance:
We are self-insured, for amounts up to a deductible per occurrence, for losses related to general liability, workers’ compensation and vehicle
claims. We are primarily self-insured for employee group health care claims. We have purchased insurance coverage in order to establish certain limits to our exposure on a per claim basis. We maintain an accrual for these costs based on claims filed
and an estimate of claims incurred but not reported or paid, based on historical data and actuarial estimates. The current portion of these self-insurance reserves is included in accrued liabilities and the non-current portion is included in other
liabilities. These reserves totaled $8,306 ,000 and $7,810 ,000 at December 31, 2021 and 2020, respectively.
Fair Values of Financial Instruments:
The fair values of our cash and cash equivalents, restricted cash and cash equivalents, accounts receivable, accounts payable and customer
deposits approximate their carrying amounts due to their short-term nature. The assets that are related to our self-directed, non-qualified deferred compensation plans for certain executives and employees are valued using quoted market prices, a
Level 1 valuation technique.
Impairment of Long-Lived Assets:
We review long-lived assets for impairment when circumstances indicate the carrying amount of an asset may not be recoverable. If an indicator
of impairment is identified, we evaluate the long-lived assets at the individual property or store level, which is the lowest level at which individual cash flows can be identified. We evaluate right-of-use assets at the same level and exclude
operating lease liabilities when evaluating for impairment. When evaluating assets for potential impairment, we first compare the carrying amount of the asset to the store’s estimated future cash flows (undiscounted and without interest charges). If
the estimated future cash flows are less than the carrying amount of the asset, an impairment loss calculation is prepared. The impairment loss calculation compares the carrying amount of the asset to the estimated fair value of the store’s assets,
which is determined on the basis of fair value for similar assets or discounted future cash flows. If required, an impairment loss is recorded in SG&A expense for the difference in the asset’s carrying value and the asset’s estimated fair value.
An impairment loss of $2,415 ,000 for a retail store was recorded in 2019 and no
The economic disruption due to COVID-19 was determined to be a triggering event during the second quarter of 2020, and as a result, management
assessed its long-term assets, including right-of-use assets for impairment. No impairment loss was required to be recorded.
Earnings Per Share:
We report our earnings per share using the two-class method. The income per share for each class of common stock is calculated assuming 100
Accumulated Other Comprehensive Income (Loss):
Accumulated other comprehensive income (loss) (“AOCI”), net of income taxes, was comprised of unrecognized retirement
liabilities totaling approximately $2,293 ,000 and $2,560 ,000 at December 31, 2021 and 2020, respectively. See Note 11 for the amounts reclassified out of AOCI to SG&A expense related to our supplemental executive retirement plan.
Recently Issued Accounting Pronouncements:
Changes to U.S. GAAP are established by the Financial Accounting Standards Board (“FASB”) in the form of ASUs to the
FASB’s Accounting Standards Codification. We considered the applicability and impact of all ASUs. We assessed and determined none were either applicable or are expected to have minimal impact on our consolidated financial position or results of
operations.
Note 2, Revenues and Segment Reporting:
The following table presents our revenues disaggregated by each major product category and service for each of the last three years (dollars in
thousands, amounts and percentages may not always add due to rounding):
| |
Year Ended December 31,
|
|||||||||||||||||||||||
|
2021
|
2020
|
2019
|
||||||||||||||||||||||
|
Net Sales
|
% of
Net Sales
|
Net Sales
|
% of
Net Sales
|
Net Sales
|
% of Net Sales
|
|||||||||||||||||||
|
Merchandise:
|
||||||||||||||||||||||||
|
Case Goods
|
||||||||||||||||||||||||
|
Bedroom Furniture
|
$
|
|
|
%
|
$
|
|
|
%
|
$
|
|
|
%
|
||||||||||||
|
Dining Room Furniture
|
|
|
|
|
|
|
||||||||||||||||||
|
Occasional
|
|
|
|
|
|
|
||||||||||||||||||
|
|
|
|
|
|
|
|||||||||||||||||||
|
Upholstery
|
|
|
|
|
|
|
||||||||||||||||||
|
Mattresses
|
|
|
|
|
|
|
||||||||||||||||||
|
Accessories and Other (1)
|
|
|
|
|
|
|
||||||||||||||||||
|
$
|
|
|
%
|
$
|
|
|
%
|
$
|
|
|
%
|
|||||||||||||
|
(1)
|
|
Estimated refunds for returns and allowances are recorded based on estimated margin using our historical return patterns. We record estimated
refunds for sales returns on a gross basis and the carrying value of the return asset is presented separately from inventory. Estimated return inventory of $822 ,000
and $853 ,000 at December 31, 2021 and 2020, respectively, is included in the line item “Other current assets” and the estimated refund
liability of $2,447 ,000 and $2,378 ,000
at December 31, 2021 and 2020, respectively, is included in the line item “Accrued liabilities” on the Consolidated Balance Sheets.
We record customer deposits when payments are received in advance of the delivery of merchandise, which totaled $98,897 ,000 and $86,183 ,000 at December 31,
2021 and December 31, 2020, respectively. Of the customer deposit liabilities at December 31, 2020, approximately $179 ,000 has not been
recognized through net sales in the twelve months ended December 31, 2021.
We typically offer our customers an opportunity for us to deliver their purchases and most choose this service. Delivery fees of approximately
$50,002 ,000, $30,824 ,000 and
$34,580 ,000 were charged to customers in 2021, 2020 and 2019, respectively, and are included in net sales. The costs associated with
deliveries are included in selling, general and administrative expenses and were approximately $45,914 ,000, $35,885 ,000, and $39,796 ,000 in 2021, 2020
and 2019, respectively.
We operate within a
reportable segment. We use a market area approach for both financial and operational decision making. Each of these market areas are considered individual operating segments. The individual operating segments all have similar economic
characteristics. The retail stores within the market areas are similar in size and carry substantially identical products selected for the same target customer. We also use the same distribution methods chain-wide.
Note 3, Inventories:
Inventories are measured using the last-in, first-out (LIFO) method of valuation because it results in a better matching of current costs and
revenues. The excess of current costs over our carrying value of inventories was approximately $34,704 ,000 and $22,394 ,000 at December 31, 2021 and 2020, respectively. The use of the LIFO valuation method as compared to the FIFO method had a negative impact on our
cost of goods sold of approximately $12,310 ,000 in 2021, $636 ,000 in 2020 and $1,811 ,000 in 2019. During 2020 and 2019, there were
liquidations of LIFO inventory layers. The effect of the liquidations (included in the preceding LIFO impact amounts) decreased cost of goods sold. The effect of the liquidations during 2020 decreased cost of goods sold by approximately $562 ,000 or $0.03 per diluted share of
common stock and was in 2019. We believe this information is meaningful to the users of these consolidated financial statements
for analyzing the effects of price changes, for better understanding our financial position and for comparing such effects with other companies.
Note 4, Property and Equipment:
Property and equipment are summarized as follows:
|
(In thousands)
|
2021
|
2020
|
||||||
|
Land and improvements
|
$
|
|
$
|
|
||||
|
Buildings and improvements
|
|
|
||||||
|
Furniture and fixtures
|
|
|
||||||
|
Equipment
|
|
|
||||||
|
Construction in progress
|
|
|
||||||
|
|
|
|||||||
|
Less accumulated depreciation
|
(
|
)
|
(
|
)
|
||||
|
Property and equipment, net
|
$
|
|
$
|
|
||||
Note 5, Credit Arrangement:
On May 15, 2020 we entered into the Third Amendment to Amended and Restated Credit Agreement (as amended, the “Credit Agreement”) with a bank
to permit certain sale-leaseback transactions as more fully described in Note 8. Our first borrowings under the facility, since its origination in 2008, was in March 2020 and the $43.8
The Credit Agreement is a $60.0
million revolving credit facility secured by our inventory, accounts receivable, cash, and certain other personal property, and matures on September 27, 2024 . Availability fluctuates based on a borrowing base calculation reduced by outstanding letters of credit. Amounts available to borrow are based on the lesser of the borrowing base or the $60.0 million-line amount. The credit facility contains covenants that, among other things, limit our ability to incur certain types of debt or liens,
enter into mergers and consolidations or use proceeds of borrowing for other than permitted uses. The covenants also limit our ability to pay dividends if unused availability is less than $12.5 million.
We borrowed $43.8 three-month
Euro dollar LIBOR rate plus 1.25 % and on a weighted average basis was approximately 2.37 %. Total interest paid under the Credit Agreement was $0.4
million for the year ended December 31, 2020.
The borrowing base was $29.2 million at December 31, 2021 and there were no outstanding
letters of credit, accordingly, the net availability was $29.2 million.
Note 6, Accrued Liabilities and Other Liabilities:
Accrued liabilities and other liabilities consist of the following:
|
(In thousands)
|
2021
|
2020
|
||||||
|
Accrued liabilities:
|
||||||||
|
Employee compensation, related taxes and benefits
|
$
|
|
$
|
|
||||
|
Taxes other than income and withholding
|
|
|
||||||
|
Self-insurance reserves
|
|
|
||||||
|
Other
|
|
|
||||||
|
$
|
|
$
|
|
|||||
|
Other liabilities:
|
||||||||
|
Self-insurance reserves
|
|
|
||||||
|
Other
|
|
|
||||||
|
$
|
|
$
|
|
|||||
Note 7, Income Taxes:
The provision for income taxes for the years ended December 31 consist of the following:
|
(In thousands)
|
2021
|
2020
|
2019
|
|||||||||
|
Current
|
||||||||||||
|
Federal
|
$
|
|
$
|
|
$
|
|
||||||
|
State
|
|
|
|
|||||||||
|
|
|
|
||||||||||
|
Deferred
|
||||||||||||
|
Federal
|
|
(
|
)
|
(
|
)
|
|||||||
|
State
|
(
|
)
|
(
|
)
|
(
|
)
|
||||||
|
|
(
|
)
|
(
|
)
|
||||||||
|
Total income tax expense
|
$
|
|
$
|
|
$
|
|
||||||
Cares Act
On March 27, 2020, the Coronavirus Aid, Relief, and Economic Security Act (the “CARES Act”) was signed into law. The CARES Act provides
numerous tax provisions and other stimulus measures, including temporary suspension of certain payment requirements for the employer-paid portion of social security taxes, the creation of certain refundable employee retention credits, and technical
corrections from prior tax legislation for tax depreciation of certain qualified improvement property. We elected to defer the employer-paid portion of social security taxes beginning with pay dates on and after April 1, 2020 and through December 31,
2020 and have deferred $1,607 ,000 which is included in accrued liabilities. During 2020, we recorded $2,301 ,000 for refundable employee retention credits reducing selling, general and administrative expenses. We also benefited from the technical correction
for qualified leasehold improvements eligible for 100 % tax bonus depreciation which reduced our 2019 income tax liability by approximately
$2,053 ,000 and we adjusted our deferred income taxes and income taxes receivable accordingly.
The differences between income tax expense in the accompanying Consolidated Financial Statements and the amount computed by applying the
statutory Federal income tax rate are as follows:
|
(In thousands)
|
2021
|
2020
|
2019
|
|||||||||
|
Statutory rates applied to income before income taxes
|
$
|
|
$
|
|
$
|
|
||||||
|
State income taxes, net of Federal tax benefit
|
|
|
|
|||||||||
|
Net permanent differences
|
(
|
)
|
|
|
||||||||
|
Other
|
|
|
(
|
)
|
||||||||
|
Leases
|
|
|
(
|
)
|
||||||||
|
Federal tax credits
|
( |
) | ||||||||||
|
State tax credits
|
(
|
)
|
(
|
)
|
(
|
)
|
||||||
|
$
|
|
$
|
|
$
|
|
|||||||
Our effective tax rate differs from the federal statutory rate primarily due to state income taxes. In 2020 we completed
the computations and recorded in the fourth quarter, state quality jobs credits of $1,527 ,000 generated in 2018, 2019, and 2020.
Deferred income taxes reflect the net tax effects of temporary differences between the carrying amounts of assets and
liabilities for financial reporting purposes and the amounts used for income tax purposes. The amounts in the following table are grouped based on broad categories of items that generate the deferred tax assets and liabilities.
|
(In thousands)
|
2021
|
2020
|
||||||
|
Deferred tax assets:
|
||||||||
|
Property and equipment
|
$
|
|
$
|
|
||||
|
Lease liabilities
|
|
|
||||||
|
Accrued liabilities
|
|
|
||||||
|
Retirement benefits
|
|
|
||||||
|
State tax credits
|
|
|
||||||
|
Other
|
|
|
||||||
|
Total deferred tax assets
|
|
|
||||||
|
Deferred tax liabilities:
|
|
|||||||
|
Inventory related
|
|
|
||||||
|
Right-of-use lease assets
|
|
|
||||||
|
Other
|
|
|
||||||
|
Total deferred tax liabilities
|
|
|
||||||
|
Net deferred tax assets
|
$
|
|
$
|
|
||||
We review our deferred tax assets to determine the need for a valuation allowance. Based on evidence, we concluded that it
is more-likely-than-not that our deferred tax assets will be realized and therefore a valuation allowance is not required.
We file income tax returns in the U.S. federal jurisdiction and various state and local jurisdictions. With respect to
U.S. federal, state and local jurisdictions, with limited exceptions, we are no longer subject to income tax audits for years before 2018.
Uncertain Tax Positions
Interest and penalties associated with uncertain tax positions, if any, are recognized as components of income tax
expense. No amounts for uncertain tax positions were recorded for the years currently open under statute of limitations.
Note 8, Leases:
We have operating leases for retail stores, offices, warehouses, and certain equipment. Our leases have remaining lease terms of between 1 year and 14 years , some of which include options to extend the leases for up to 20 years . We determine if an arrangement is or contains a lease at lease inception. Our leases do not have
any residual value guarantees or any restrictions or covenants imposed by lessors. We have lease agreements for real estate with lease and non-lease components, which are accounted for separately.
In April 2020, the Financial Accounting Standards Board issued guidance allowing entities to make
a policy election to account for lease concessions related to the COVID-19 pandemic as though enforceable rights and obligations for those concessions existed. The election applies to any lessor-provided lease concession related to the impact of
the COVID-19 pandemic, provided the concession does not result in a substantial increase in the rights of the lessor or in the obligations of the lessee. During the year ended December 31, 2020, we received concessions from certain landlords in
the form of rent deferrals of approximately $4.5 million and abatements of approximately $1.8 million. We have elected to account for these rent concessions as though enforceable rights and obligations for those concessions existed in the original lease agreements
and have recorded a non-interest bearing payable for the deferred rent payments.
On May 18, 2020, we completed a sale and leaseback transaction of three facilities which we initiated in April 2020 as part of our business continuity plan. The Coppell, TX location has approximately 394 ,000 distribution square feet used to serve our western stores, 44 ,000 retail square feet, and 20 ,000 square feet of office space used for a call center and general
management purposes. The Lakeland, FL property is a distribution center with approximately 335 ,000 square feet and the Colonial
Heights property is a distribution facility with 129 ,000 square feet. The facilities were leased back to Havertys via 15-year operating lease agreements with renewal options. The total sales price for these properties, excluding costs and taxes, was $70.0 million and their net book value was approximately $37.9
million. The gain of approximately $31.6 million was recognized in the second quarter of 2020 and is included in other income.
In August 2021, we repurchased the Colonial Heights property, that was part of the sale-leaseback
transaction in 2020 for $8.5 million.
As of December 31, 2021, we have entered into two leases for additional retail locations which have not yet commenced and are under construction.
The table below presents the operating lease assets and liabilities recognized on the consolidated balance sheets as
of December 31:
|
(in thousands)
|
2021
|
2020
|
||||||
|
Operating Lease Assets:
|
||||||||
|
Right-of use lease assets
|
$
|
|
$
|
|
||||
|
Operating Lease Liabilities:
|
||||||||
|
Current lease liabilities
|
$
|
|
$
|
|
||||
|
Non-current lease liabilities
|
|
|
||||||
|
Total operating lease liabilities
|
$
|
|
$
|
|
||||
Our leases generally do not provide an implicit rate, and therefore we use our incremental borrowing rate as the
discount rate when measuring operating lease liabilities. The incremental borrowing rate represents an estimate of the interest rate we would incur at lease commencement to borrow an amount equal to the lease payments on a collateralized basis
over the term of the lease.
The weighted-average remaining lease term and weighted-average discount rate for operating leases as of December 31 are:
|
2021
|
2020
|
|||||||
|
Weighted-average remaining lease term
|
|
|
||||||
|
Weighted-average discount rate
|
|
%
|
|
%
|
||||
The table below reconciles the undiscounted future minimum lease payments (displayed by year and in the aggregate)
under noncancelable operating leases with terms of more than one year to the total lease liabilities recognized on the consolidated balance sheet as of December 31, 2021:
|
(in thousands)
|
Operating Leases
|
|||
|
2022
|
$
|
|
||
|
2023
|
|
|||
|
2024
|
|
|||
|
2025
|
|
|||
|
2026
|
|
|||
|
Thereafter
|
|
|||
|
Total undiscounted future minimum lease payments
|
|
|||
|
Less: difference between undiscounted lease payments and discounted operating lease liabilities
|
(
|
)
|
||
|
Total operating lease liabilities
|
$
|
|
||
Certain of our lease agreements for retail stores include variable lease payments, generally
based on sales volume. The variable portion of payments are not included in the initial measurement of the right‑of-use asset or lease liability due to uncertainty of the payment amount and are recorded as lease expense in the period incurred. Certain of our equipment lease agreements include variable lease costs, generally based on usage of the underlying asset (mileage, fuel, etc.). The variable portion of payments are not included in the initial
measurement of the right-of-use asset or lease liability due to uncertainty of the payment amount and are recorded as lease expense in the period incurred.
Components of lease expense which are included in selling, general, and administrative expenses
within our consolidated statements of comprehensive income were as follows:
|
Year Ended December 31,
|
||||||||||||
|
(in thousands)
|
2021
|
2020
|
2019 | |||||||||
|
Operating lease cost
|
$
|
|
$
|
|
$ | |||||||
|
Short-term lease cost
|
|
|
||||||||||
|
Variable lease cost
|
|
|
||||||||||
|
Total lease expense
|
$
|
|
$
|
|
$ | |||||||
Supplemental cash flow information related to leases is as follows:
|
Year Ended December 31,
|
||||||||
|
(In thousands)
|
2021
|
2020
|
||||||
|
Cash paid for amounts included in the measurement of lease liabilities:
|
||||||||
|
Operating cash flows from operating leases
|
$
|
|
$
|
|
||||
|
Right-of-use assets obtained in exchange for lease obligations:
|
||||||||
|
Operating leases
|
$
|
|
$
|
|
||||
Note 9, Stockholders’ Equity:
Common Stock has a preferential dividend rate of at least 105 % of the dividend paid on Class A Common Stock. Class A Common Stock has greater voting rights which include: voting as a separate class for the election of 75 % of the total number of directors and on all other matters subject to shareholder vote, each share of Class A Common Stock has ten votes and votes with the Common Stock as a single class. Class A Common Stock is convertible at the holder’s option at any time into Common Stock on a
1-for-1 basis ; Common Stock is not convertible into Class A Common Stock.
A special cash dividend of $2.00
and $1.00 for Common Stock and $1.90
and $0.95 for Class A Common Stock was paid in the fourth quarter of 2021 and 2020. Total dividends paid on Common Stock were $48,837 ,000, $46,564 ,000 and $13,913 ,000 in 2021, 2020 and 2019, respectively. Total dividends paid on Class A Common Stock were $3,609 ,000, $3,957 ,000 and $1,143 ,000 in 2021, 2020 and 2019, respectively.
Note 10, Benefit Plans:
We have a non-qualified, non-contributory supplemental executive retirement plan (the “SERP”) for employees whose retirement benefits are
reduced due to their annual compensation levels. The SERP was frozen as of December 31, 2015 and no additional benefits were earned or have been accrued after that date. The SERP provides annual benefits amounting to 55 % of final average earnings less benefits payable from Social Security benefits and our former pension plan which was settled in 2014. The SERP limits
the total amount of annual retirement benefits that may be paid to a participant from all sources (former pension plan, Social Security and the SERP) to $125 ,000.
The SERP is not funded so we pay benefits directly to participants.
The following table summarizes information about our SERP.
|
(In thousands)
|
2021
|
2020
|
||||||
|
Change in benefit obligation:
|
||||||||
|
Benefit obligation at beginning of the year
|
$
|
|
$
|
|
||||
|
Interest cost
|
|
|
||||||
|
Actuarial (gains) losses
|
(
|
)
|
|
|||||
|
Benefits paid
|
(
|
)
|
(
|
)
|
||||
|
Benefit obligation at end of year
|
|
|
||||||
|
Change in plan assets:
|
||||||||
|
Employer contribution
|
|
|
||||||
|
Benefits paid
|
(
|
)
|
(
|
)
|
||||
|
Fair value of plan assets at end of year
|
|
|
||||||
|
Funded status of the plan – (underfunded)
|
$
|
(
|
)
|
$
|
(
|
)
|
||
|
Accumulated benefit obligations
|
$
|
|
$
|
|
||||
Amounts recognized in the consolidated balance sheets consist of:
|
(In thousands)
|
2021
|
2020
|
||||||
|
Current liabilities
|
$
|
(
|
)
|
$
|
(
|
)
|
||
|
Noncurrent liabilities
|
(
|
)
|
(
|
)
|
||||
|
$
|
(
|
)
|
$
|
(
|
)
|
|||
The net actuarial loss recognized in accumulated other comprehensive income (loss) before the effect of income taxes was $2,198 ,000 in 2021 and $2,554 ,000 in 2020.
Net pension cost included the following components:
|
(In thousands)
|
2021
|
2020
|
2019
|
|||||||||
|
Interest cost on projected benefit obligation
|
$
|
|
$
|
|
$
|
|
||||||
|
Amortization of actuarial loss
|
|
|
|
|||||||||
|
Net pension costs
|
$
|
|
$
|
|
$
|
|
||||||
The estimated amount that will be amortized from accumulated other comprehensive loss into net periodic cost in 2022 is approximately $217 ,000.
Assumptions
We use a measurement date of December 31 for our SERP plan. Assumptions used to determine net periodic benefit cost for years ended December 31
are as follows:
|
2021
|
2020
|
2019
|
||||||||||
|
Discount rate
|
|
%
|
|
%
|
|
%
|
||||||
|
Rate of compensation increase
|
|
|
|
|||||||||
Assumptions used to determine benefit obligations at December 31 for the SERP are as
follows:
|
2021
|
2020
|
|||||||
|
Discount rate
|
|
%
|
|
%
|
||||
|
Rate of compensation increase
|
|
|
||||||
Cash Flows
The following schedule outlines the expected benefit payments related to the SERP in future years. These expected
benefits were estimated based on the same actuarial assumptions used to determine benefit obligations at December 31, 2021.
|
(In thousands)
|
2022
|
2023
|
2024
|
2025
|
2026
|
2027-2031
|
||||||||||||||||||
|
Benefit Payments
|
$
|
|
$
|
|
$
|
|
$ |
|
$
|
|
$
|
|
||||||||||||
Other Plans
We have an employee savings/retirement (401(k)) plan to which substantially all our employees may contribute. We match employee contributions 100 % up to 4 % of a participant’s
compensation, with a maximum match of $11,600 per participant. We suspended the matching contribution for six weeks during 2020 as part of
our business continuity plan. We expensed employer contributions of approximately $6,046 ,000, $4,069 ,000 and $5,173 ,000 in 2021, 2020 and 2019, respectively.
We offer participation in a self-directed, non-qualified deferred compensation plan to certain executives and employees. The plan allows a
participant to defer a portion of their income. We may also make annual contributions based on the participant’s annual deferral, and our contributions were approximately $74 ,000, $43 ,000 and $61 ,000 in 2021, 2020, and 2019, respectively. The investments for the plan (and its predecessor plan) are held in rabbi trusts and are used to meet the obligations of the plans and precludes
us from using such assets for operating purposes. The plans’ assets totaled approximately $9,184 ,000 and $7,949 ,000 at December 31, 2021 and 2020, respectively, and are included in other assets. The related liability under the plans of approximately $9,201 ,000 and $8,063 ,000 at December 31,
2021 and 2020, respectively, is included in other liabilities.
We offer no post-retirement benefits other than the plans discussed above and no significant post-employment benefits.
17
Note 11, Accumulated Other Comprehensive Loss:
The following summarizes the changes in the balance and the reclassifications out of accumulated other comprehensive loss on our Consolidated
Balance Sheets to the Consolidated Statements of Comprehensive Income:
|
Year Ended December 31,
|
||||||||||||
|
(In thousands)
|
2021
|
2020
|
2019
|
|||||||||
|
Beginning balance
|
$
|
(
|
)
|
$
|
(
|
)
|
$
|
(
|
)
|
|||
|
Other comprehensive income (loss)
|
||||||||||||
|
Defined benefit pension plan:
|
||||||||||||
|
Net gain (loss) during year
|
|
(
|
)
|
(
|
)
|
|||||||
|
Amortization of net loss(1)
|
|
|
|
|||||||||
|
|
(
|
)
|
(
|
)
|
||||||||
|
Tax expense (benefit)
|
|
(
|
)
|
(
|
)
|
|||||||
|
Total other comprehensive income (loss)
|
|
(
|
)
|
(
|
)
|
|||||||
|
Ending balance
|
$
|
(
|
)
|
$
|
(
|
)
|
$
|
(
|
)
|
|||
|
(1)
|
|
Note 12, Stock-Based Compensation Plans:
We have issued and outstanding awards under two
employee compensation plans, the 2021 Long-Term Incentive Plan (the “2021 LTIP Plan”) and the 2014 Long Term Incentive Plan (the “2014 LTIP Plan”). No new awards may be granted under the 2014 LTIP Plan. Grants of stock-settled appreciation rights,
restricted units, and performance units have been made to certain officers and key employees. All equity awards are settled in shares of Common Stock. As of December 31, 2021, approximately 1,500,000 shares were available for awards under the 2021 LTIP Plan.
The following table summarizes our equity award activity during the years ended December 31, 2021, 2020, and 2019:
|
Service-Based
Restricted Stock Awards
|
Performance-Based
Restricted Stock Awards
|
Stock-Settled
Appreciation Rights
|
||||||||||||||||||||||
|
Shares or Units (#)
|
Weighted-Average
Award Price($)
|
Shares or Units(#)
|
Weighted-Average
Award Price ($)
|
Rights(#)
|
Weighted-Average
Award Price($)
|
|||||||||||||||||||
|
Outstanding at December 31, 2018
|
|
|
|
|
|
|
||||||||||||||||||
|
Granted
|
|
|
|
|
|
—
|
||||||||||||||||||
|
Awards vested or rights exercised
|
(
|
)
|
|
(
|
)
|
|
(
|
)
|
|
|||||||||||||||
|
Forfeited
|
(
|
)
|
|
(
|
)
|
|
|
—
|
||||||||||||||||
|
Units forfeited due to performance
|
— | ( |
) | — | ||||||||||||||||||||
|
Outstanding at December 31, 2019
|
|
|
|
|
|
|
||||||||||||||||||
|
Granted
|
|
|
|
|
|
—
|
||||||||||||||||||
|
Awards vested or rights exercised
|
(
|
)
|
|
(
|
)
|
|
(
|
)
|
|
|||||||||||||||
|
Forfeited
|
(
|
)
|
|
(
|
)
|
|
|
—
|
||||||||||||||||
|
Units forfeited due to performance
|
— | ( |
) | — | ||||||||||||||||||||
|
Outstanding at December 31, 2020
|
|
|
|
|
|
—
|
||||||||||||||||||
|
Granted
|
|
|
|
|
|
—
|
||||||||||||||||||
|
Awards vested or rights exercised
|
(
|
)
|
|
(
|
)
|
|
|
—
|
||||||||||||||||
|
Forfeited
|
(
|
)
|
|
|
—
|
|
—
|
|||||||||||||||||
|
Additional units earned due to performance
|
— | — | ||||||||||||||||||||||
|
Outstanding at December 31, 2021
|
|
|
|
|
— | |||||||||||||||||||
|
Restricted units expected to vest
|
|
|
|
|
—
|
—
|
||||||||||||||||||
|
Exercisable at December 31, 2019
|
—
|
—
|
—
|
—
|
|
|
||||||||||||||||||
The total fair value of service-based restricted stock awards that vested in 2021, 2020 and 2019 was approximately $6,069 ,000, $1,798 ,000 and $2,491 ,000, respectively. The aggregate intrinsic value of outstanding restricted stock awards was $6,697 ,000 at December 31, 2021. The restrictions on the service-based awards generally lapse or vest annually, primarily over three-year or four-year periods.
The total fair value of performance-based restricted stock awards that vested in 2021, 2020 and 2019 was approximately $2,046 ,000, $755 ,000 and $1,389 ,000, respectively. The aggregate intrinsic value of outstanding performance awards at December 31, 2021 expected to vest was $11,846 ,000. The performance awards are based on one-year
performance periods but cliff vest in approximately three years from grant date.
The fair value for stock-settled appreciation rights were estimated at the date of grant using a Black‑Scholes pricing model. There were no
stock-settled appreciation rights outstanding at December 31, 2021 and 2020. The total intrinsic value of stock-settled appreciation rights exercised was approximately $18 ,000 in 2020 and $107 ,000 in 2019.
The compensation for all awards is being charged to selling, general and administrative expense over the respective grants’ vesting periods,
primarily on a straight-line basis, and was approximately $8,213 ,000, $4,375 ,000 and $3,435 ,000 in 2021, 2020 and 2019, respectively.
Forfeitures are recognized as they occur. The tax (benefit) expense recognized related to all awards was approximately $(1,011 ,000), $293 ,000 and $98 ,000 in 2021, 2020 and 2019,
respectively. As of December 31, 2021, the total compensation cost related to unvested equity awards was approximately $6,769 ,000 and is
expected to be recognized over a weighted-average period of two years .
Note 13, Earnings Per Share:
The following is a reconciliation of the income (loss) and number of shares used in calculating the diluted earnings per share for Common Stock
and Class A Common Stock (amounts in thousands except per share data):
|
Numerator:
|
2021
|
2020
|
2019
|
|||||||||
|
Common:
|
||||||||||||
|
Distributed earnings
|
$
|
|
$
|
|
$
|
|
||||||
|
Undistributed earnings
|
|
|
|
|
||||||||
|
Basic
|
|
|
|
|||||||||
|
Class A Common earnings
|
|
|
|
|||||||||
|
Diluted
|
$
|
|
$
|
|
$
|
|
||||||
|
Class A Common:
|
||||||||||||
|
Distributed earnings
|
$
|
|
$
|
|
$
|
|
||||||
|
Undistributed earnings
|
|
|
|
|
||||||||
|
$
|
|
$
|
|
$
|
|
|||||||
|
Denominator:
|
2021
|
2020
|
2019
|
|||||||||
|
Common:
|
||||||||||||
|
Weighted average shares outstanding - basic
|
|
|
|
|||||||||
|
Assumed conversion of Class A Common Stock
|
|
|
|
|||||||||
|
Dilutive awards and common stock equivalents
|
|
|
|
|||||||||
|
Total weighted average diluted Common Stock
|
|
|
|
|||||||||
|
Class A Common:
|
||||||||||||
|
Weighted average shares outstanding
|
|
|
|
|||||||||
|
Basic net earnings per share
|
||||||||||||
|
Common Stock
|
$
|
|
$
|
|
$
|
|
||||||
|
Class A Common Stock
|
$
|
|
$
|
|
$
|
|
||||||
|
Diluted net earnings per share
|
||||||||||||
|
Common Stock
|
$
|
|
$
|
|
$
|
|
||||||
|
Class A Common Stock
|
$
|
|
$
|
|
$
|
|
||||||
Note 14, Selected Quarterly Financial Data (Unaudited):
The following is a summary of the unaudited quarterly results of operations for the years ended December 31, 2021 and 2020 (in thousands,
except per share data):
| |
2021 Quarter Ended
|
|||||||||||||||
|
March 31
|
June 30
|
September 30
|
December 31
|
|||||||||||||
|
Net sales
|
$
|
|
$
|
|
$
|
|
$
|
|
||||||||
|
Gross profit
|
|
|
|
|
||||||||||||
|
Income before taxes
|
|
|
|
|
||||||||||||
|
Net income
|
|
|
|
|
||||||||||||
|
Basic net earnings per share:
|
||||||||||||||||
|
Common
|
|
|
|
|
||||||||||||
|
Class A Common
|
|
|
|
|
||||||||||||
|
Diluted net earnings per share:
|
||||||||||||||||
|
Common
|
|
|
|
|
||||||||||||
|
Class A Common
|
|
|
|
|
||||||||||||
|
2020 Quarter Ended
|
||||||||||||||||
|
March 31
|
June 30
|
September 30
|
December 31
|
|||||||||||||
|
Net sales
|
$
|
|
$
|
|
$
|
|
$
|
|
||||||||
|
Gross profit
|
|
|
|
|
||||||||||||
|
Income before taxes
|
|
|
|
|
||||||||||||
|
Net income
|
|
|
|
|
||||||||||||
|
Basic net earnings per share:
|
||||||||||||||||
|
Common
|
|
|
|
|
||||||||||||
|
Class A Common
|
|
|
|
|
||||||||||||
|
Diluted net earnings per share:
|
||||||||||||||||
|
Common
|
|
|
|
|
||||||||||||
|
Class A Common
|
|
|
|
|
||||||||||||
During the quarter ended December 31, 2020, we recognized the benefit of state income tax credits that reduced income tax expense by $1.2 million.
Because of rounding the amounts will not necessarily add to the totals computed for the year. Also because of rounding and the use of the
two-class method in calculating per share data, the quarterly per share data will not necessarily add to the annual totals.
Schedule II – Valuation and Qualifying Accounts
Haverty Furniture Companies, Inc.
|
Column A
|
Column B
|
Column C
|
Column D
|
Column E
|
||||||||||||
|
(In thousands)
|
Balance at
beginning of
period
|
Additions
charged to costs
and expenses
|
Deductions
Describe (1)(2)
|
Balance at
end of period
|
||||||||||||
|
Year ended December 31, 2021:
|
||||||||||||||||
|
Refund on estimated returns and allowances
|
$
|
|
$
|
|
$
|
|
$
|
|
||||||||
|
Year ended December 31, 2020:
|
||||||||||||||||
|
Refund on estimated returns and allowances
|
$
|
|
$
|
|
$
|
|
$
|
|
||||||||
|
Year ended December 31, 2019:
|
||||||||||||||||
|
Reserve for cancelled sales and allowances
|
$
|
|
$
|
|
$
|
|
$
|
|
||||||||
|
(1)
|
|
|
(2)
|
|
SIGNATURES
Pursuant to the requirements of Section 13 or 15(d) of the Securities Exchange Act of 1934, the registrant has duly caused this Report to be signed on its behalf by the undersigned,
thereunto duly authorized, on March 1, 2022.
|
HAVERTY FURNITURE COMPANIES, INC.
|
||
|
By:
|
/s/ CLARENCE H. SMITH
|
|
|
Clarence H. Smith
|
||
|
Chairman of the Board and
Chief Executive Officer
|
||
Pursuant to the requirements of the Securities Exchange Act of 1934, this Report has been signed below by the following persons on behalf of the registrant and in the capacities
indicated, on March 1, 2022.
|
/s/ CLARENCE H. SMITH
|
/s/ RICHARD B. HARE
|
|||
|
Clarence H. Smith
Chairman of the Board and
Chief Executive Officer
(principal executive officer)
|
Richard B. Hare
Executive Vice President and
Chief Financial Officer
(principal financial and accounting officer)
|
|||
|
/s/ L. ALLISON DUKES
|
/s/ VICKI R. PALMER
|
|||
|
L. Allison Dukes
Director
|
Vicki R. Palmer
Director
|
|||
|
/s/ RAWSON HAVERTY, JR.
|
/s/ DEREK G. SCHILLER
|
|||
|
Rawson Haverty, Jr.
Director
|
Derek G. Schiller
Director
|
|||
|
/s/ G. THOMAS HOUGH
|
/s/ AL TRUJILLO
|
|||
|
G. Thomas Hough
Lead Director
|
Al Trujillo
Director
|
|||
|
/s/ MYLLE H. MANGUM
|
||||
|
Mylle H. Mangum
Director
|
34
Serious News for Serious Traders! Try StreetInsider.com Premium Free!
You May Also Be Interested In
- Havertys to Host First Quarter 2024 Earnings Conference Call on May 2, 2024
- PMD Device Solutions Publishes 2023 Annual Report
- Vantage Drilling International Ltd. Schedules First Quarter 2024 Earnings Release Date and Conference Call
Create E-mail Alert Related Categories
SEC FilingsSign up for StreetInsider Free!
Receive full access to all new and archived articles, unlimited portfolio tracking, e-mail alerts, custom newswires and RSS feeds - and more!
