Form 8-K PLUG POWER INC For: Feb 08
UNITED STATES
SECURITIES AND EXCHANGE COMMISSION
Washington, D.C. 20549
FORM 8-K
CURRENT REPORT
Pursuant to Section 13 or 15(d) of the
Securities Exchange Act of 1934
Date of Report (Date of earliest event reported): February 8, 2018
PLUG POWER INC.
(Exact name of registrant as specified in charter)
|
Delaware |
|
1-34392 |
|
22-3672377 |
|
(State or Other |
|
(Commission File Number) |
|
(IRS Employer |
968 Albany Shaker Road, Latham, New York 12110
(Address of Principal Executive Offices) (Zip Code)
(518) 782-7700
(Registrant’s telephone number, including area code)
Check the appropriate box below if the Form 8-K filing is intended to simultaneously satisfy the filing obligation of the registrant under any of the following provisions (see General Instruction A.2. below):
o Written communications pursuant to Rule 425 under the Securities Act (17 CFR 230.425)
o Soliciting material pursuant to Rule 14a-12 under the Exchange Act (17 CFR 240.14a-12)
o Pre-commencement communications pursuant to Rule 14d-2(b) under the Exchange Act (17 CFR 240.14d-2(b))
o Pre-commencement communications pursuant to Rule 13e-4(c) under the Exchange Act (17 CFR 240.13e-4(c))
Indicate by check mark whether the registrant is an emerging growth company as defined in Rule 405 of the Securities Act of 1933 (§230.405 of this chapter) or Rule 12b-2 of the Securities Exchange Act of 1934 (§240.12b-2 of this chapter).
Emerging growth company o
If an emerging growth company, indicate by check mark if the registrant has elected not to use the extended transition period for complying with any new or revised financial accounting standards provided pursuant to Section 13(a) of the Exchange Act. o
Item 2.02 Results of Operations and Financial Condition
On February 8, 2018, Plug Power Inc., a Delaware corporation (the “Company”), released certain preliminary, unaudited financial results for the full year ended December 31, 2017 as part of a business update presentation. A copy of the slide presentation used during the presentation is being furnished as Exhibit 99.1 to this Current Report on Form 8-K and is incorporated by reference in this Item 2.02. A reconciliation of the non-GAAP measures used in the presentation is being furnished as Exhibit 99.2 to this Current Report on Form 8-K and is incorporated herein by reference.
Item 8.01 Other Events
On February 8, 2018, the Company conducted a business update presentation accessible by conference call and webcast. A copy of the slide presentation used during the presentation is being furnished as Exhibit 99.1 to this Current Report on Form 8-K and is incorporated herein by reference. Among other things, the presentation provides certain preliminary, unaudited financial results for the full year ended December 31, 2017, and also conveys the Company’s expectations regarding 2018 performance, the prospect for future growth in revenue, gross margin and free cash flow, and a potential strategic partnership for the China market.
The information in this Current Report on Form 8-K (including exhibits) is being furnished and shall not be deemed “filed” for purposes of Section 18 of the Securities and Exchange Act of 1934, as amended, or otherwise subject to the liabilities of that Section. The information in this Current Report on Form 8-K shall not be incorporated by reference into any registration statement or other document pursuant to the Securities Act of 1933, as amended.
Item 9.01 Financial Statements and Exhibits.
(d) Exhibits.
|
Exhibit Number |
|
Title |
|
|
|
|
|
99.1 |
|
|
|
|
|
|
|
99.2 |
|
SIGNATURES
Pursuant to the requirements of the Securities Exchange Act of 1934, the Registrant has duly caused this report to be signed on its behalf by the undersigned hereunto duly authorized.
|
|
PLUG POWER INC. | |
|
|
| |
|
|
| |
|
Date: February 8, 2018 |
By: |
/s/ Paul Middleton |
|
|
|
Paul Middleton |
|
|
|
Chief Financial Officer |
|
|
| |
Cautionary Note on Forward Looking Statements This communication contains “forward-looking statements” within the meaning of the Private Securities Litigation Reform Act of 1995 that involve significant risks and uncertainties about the Company, including but not limited to statements about the Company’s expectations regarding full year 2018 revenue and Q1 2018 revenue, adjusted gross margin and adjusted EBITDAS, achieving adjusted EBITDAS break even, increasing revenue and gross margin, improving fuel cell stack life, the expansion of fuel cells into additional vehicle markets, the launch of ProGen engines, a potential strategic partnership for the China market, opportunities in the on-road electric vehicle market, and expansion in the hydrogen fueling business. Investors are cautioned that such statements should not be read as a guarantee of future performance or results, and will not necessarily be accurate indications of the times that, or by which, such performance or results will have been achieved. Such statements are subject to risks and uncertainties that could cause actual performance or results to differ materially from those expressed in these statements. In particular, the risks and uncertainties include, among other things, the risk that the Company continues to incur losses and might never achieve or maintain profitability; the risk that the Company will need to raise additional capital to fund its operations and such capital may not be available; the risk that the Company’s lack of extensive experience in manufacturing and marketing products may impact its ability to manufacture and market products on a profitable and large-scale commercial basis; the risk that unit orders will not ship, be installed and/or be converted to revenue, in whole or in part; the risk that a loss of one or more of the Company’s major customers could result in a material adverse effect on the Company’s financial condition; the risk that a sale of a significant number of shares of stock could depress the market price of the Company’s common stock; the risk of potential losses related to any product liability claims or contract disputes; the risk of loss related to an inability to maintain an effective system of internal controls; the Company’s ability to attract and maintain key personnel; the risks related to the use of flammable fuels in the Company’s products; the risk that pending orders may not convert to purchase orders, in whole or in part; the cost and timing of developing, marketing and selling the Company’s products and the Company’s ability to raise the necessary capital to fund such costs; the Company’s ability to obtain financing arrangements to support the sale or leasing of its products and services to customers; the Company’s ability to achieve the forecasted gross margin on the sale of its products; the cost and availability of fuel and fueling infrastructures for the Company’s products; the risk of elimination of government subsidies and economic incentives for alternative energy products; market acceptance of the Company’s products and services, including GenDrive units; the Company’s ability to establish and maintain relationships with third parties with respect to product development, manufacturing, distribution and servicing and the supply of key product components; the cost and availability of components and parts for the Company’s products; the Company’s ability to develop commercially viable products; the Company’s ability to reduce product and manufacturing costs; the Company’s ability to successfully market, distribute and service its products and services internationally; the Company’s ability to improve system reliability for its products; competitive factors, such as price competition and competition from other traditional and alternative energy companies; the Company’s ability to protect its intellectual property; the cost of complying with current and future federal, state and international governmental regulations; the risks associated with potential future acquisitions; the volatility of the Company’s stock price; and other risks and uncertainties referenced in the Company’s public filings with the SEC. For additional disclosure regarding these and other risks faced by the Company, see disclosures contained in the Company’s public filings with the SEC, including the “Risk Factors” section of the Company’s Annual Report on Form 10-K for the year ended December 31, 2016. Investors should consider these factors in evaluating the forward-looking statements included in this communication and not place undue reliance on such statements. The forward-looking statements are made as of the date hereof, and the Company undertakes no obligation to update such statements as a result of new information. This presentation includes certain financial measures that are not in accordance with U.S. Generally Accepted Accounting Principles (GAAP). For disclosure relating to our use of non-GAAP financial measures and a reconciliation of non-GAAP measures to GAAP measures, please see our Current Report on Form 8-K filed with the SEC on February 8, 2018 or go to our website at www.plugpower.com, or directly at http://www.ir.plugpower.com/Financial-Information/SEC-Filings/default.aspx.
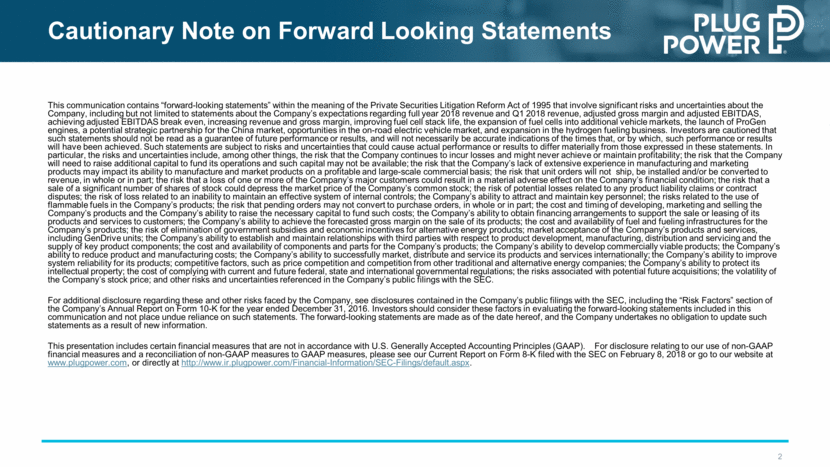
2017 Disappointments Speed of Gross Margin Enhancements Expediting Costs Shortfall due to service and hydrogen costs Cash Position Margin Crunch Working capital to fund growth Bookings Timing to close a third megadeal
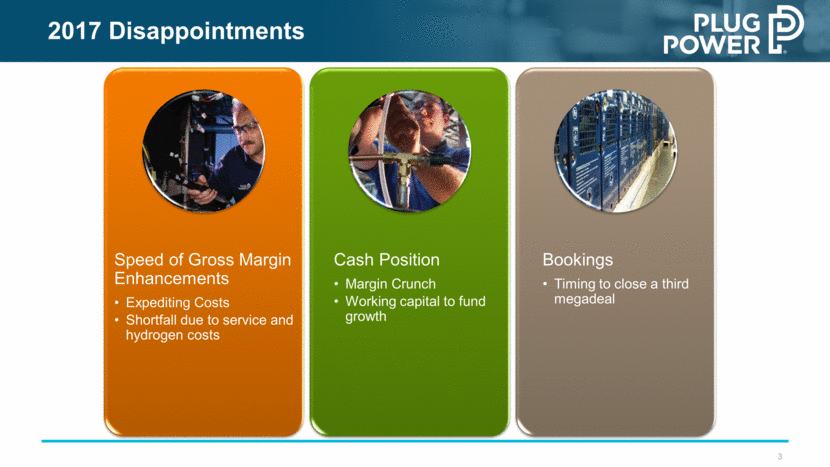
2017 Accomplishments Record Revenue An increase of >50% versus 2016 AMZN Contract $600M Deal with ~ $70M spend in 2017 WMT Contract Planned expansion of over 30 more sites with significantly improved financing Delivery Van Programs DongFeng Federal Express European Expansion Carrefour Colruyt Deployment of >5,200 Plug Power Stacks Continue to Grow Installed Base 20,000 GenDrive units and 60 fueling stations
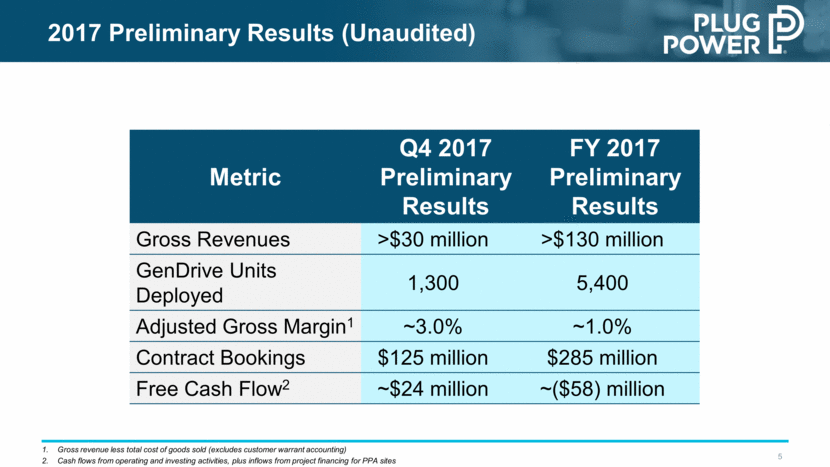
Metric Q4 2017 Preliminary Results FY 2017 Preliminary Results Gross Revenues >$30 million >$130 million GenDrive Units Deployed 1,300 5,400 Adjusted Gross Margin1 ~3.0% ~1.0% Contract Bookings $125 million $285 million Free Cash Flow2 ~$24 million ~($58) million 2017 Preliminary Results (Unaudited) Gross revenue less total cost of goods sold (excludes customer warrant accounting) Cash flows from operating and investing activities, plus inflows from project financing for PPA sites
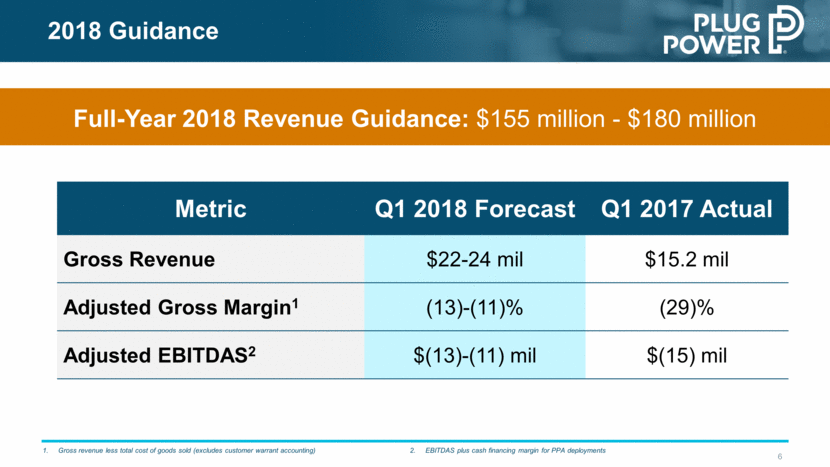
2018 Guidance Full-Year 2018 Revenue Guidance: $155 million - $180 million Gross revenue less total cost of goods sold (excludes customer warrant accounting) EBITDAS plus cash financing margin for PPA deployments Metric Q1 2018 Forecast Q1 2017 Actual Gross Revenue $22-24 mil $15.2 mil Adjusted Gross Margin1 (13)-(11)% (29)% Adjusted EBITDAS2 $(13)-(11) mil $(15) mil
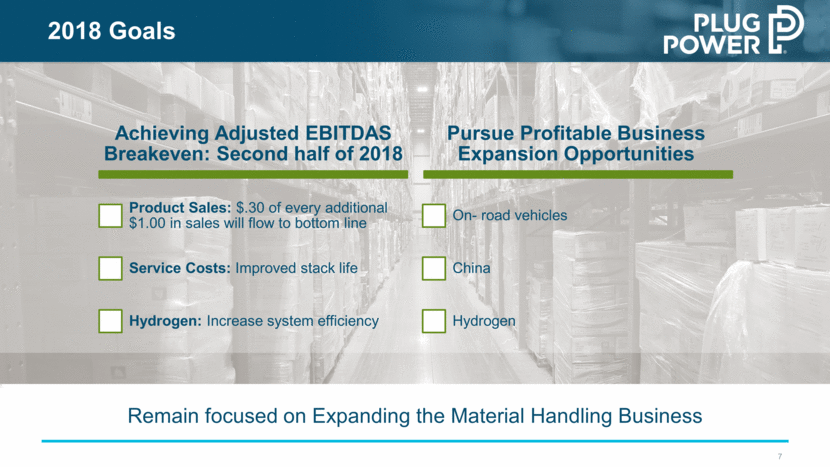
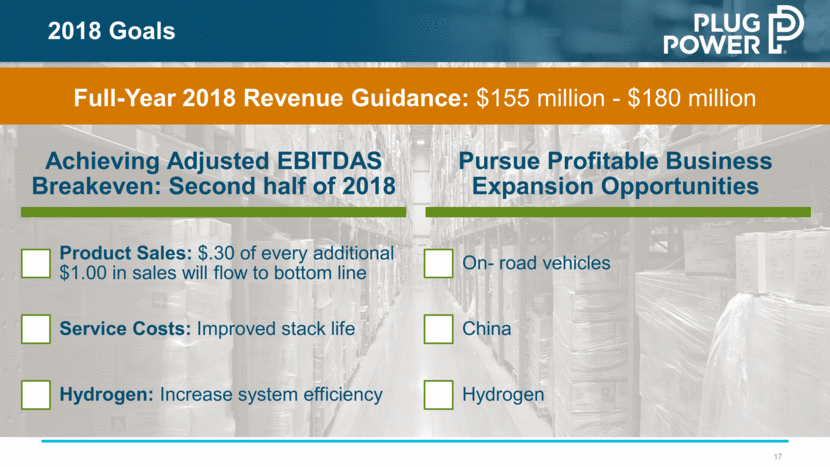
2018 Goals Remain focused on Expanding the Material Handling Business Achieving Adjusted EBITDAS Breakeven: Second half of 2018 Product Sales: $.30 of every additional $1.00 in sales will flow to bottom line Service Costs: Improved stack life Hydrogen: Increase system efficiency Pursue Profitable Business Expansion Opportunities On- road vehicles China Hydrogen
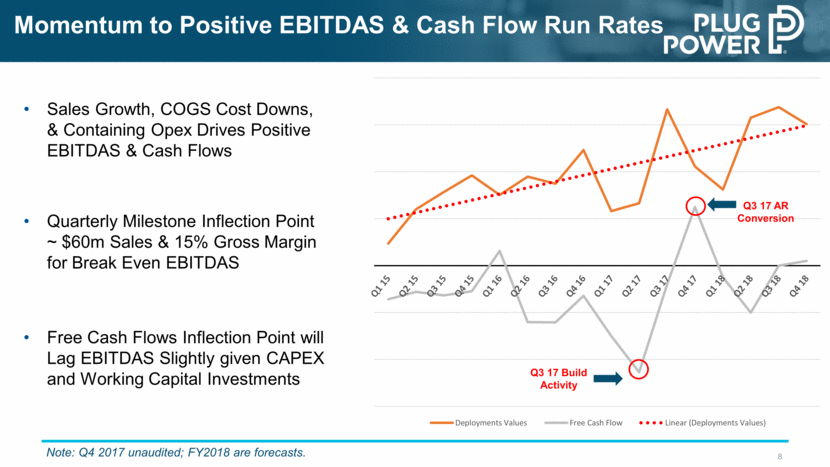
Momentum to Positive EBITDAS & Cash Flow Run Rates Sales Growth, COGS Cost Downs, & Containing Opex Drives Positive EBITDAS & Cash Flows Quarterly Milestone Inflection Point ~ $60m Sales & 15% Gross Margin for Break Even EBITDAS Free Cash Flows Inflection Point will Lag EBITDAS Slightly given CAPEX and Working Capital Investments Q3 17 Build Activity Q3 17 AR Conversion Note: Q4 2017 unaudited; FY2018 are forecasts. Deployments Values Free Cash Flow Linear (Deployments Values)
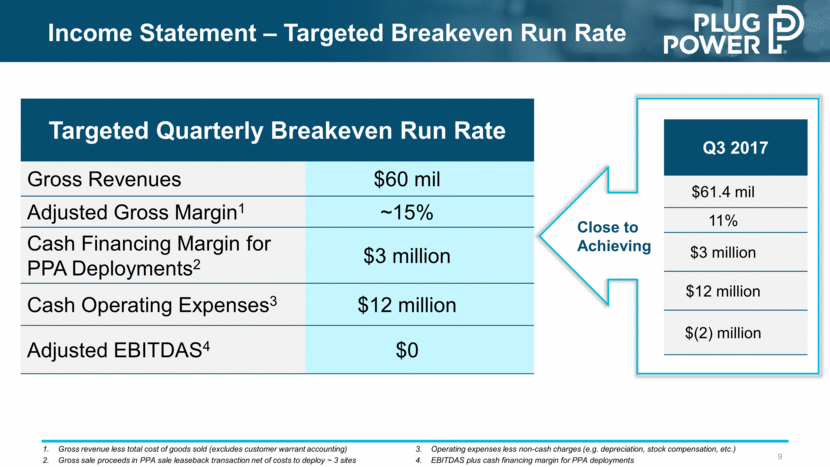
Targeted Quarterly Breakeven Run Rate Gross Revenues $60 mil Adjusted Gross Margin1 ~15% Cash Financing Margin for PPA Deployments2 $3 million Cash Operating Expenses3 $12 million Adjusted EBITDAS4 $0 Income Statement – Targeted Breakeven Run Rate Gross revenue less total cost of goods sold (excludes customer warrant accounting) Gross sale proceeds in PPA sale leaseback transaction net of costs to deploy ~ 3 sites Operating expenses less non-cash charges (e.g. depreciation, stock compensation, etc.) EBITDAS plus cash financing margin for PPA deployments Q3 2017 $61.4 mil 11% $3 million $12 million $(2) million Close to Achieving
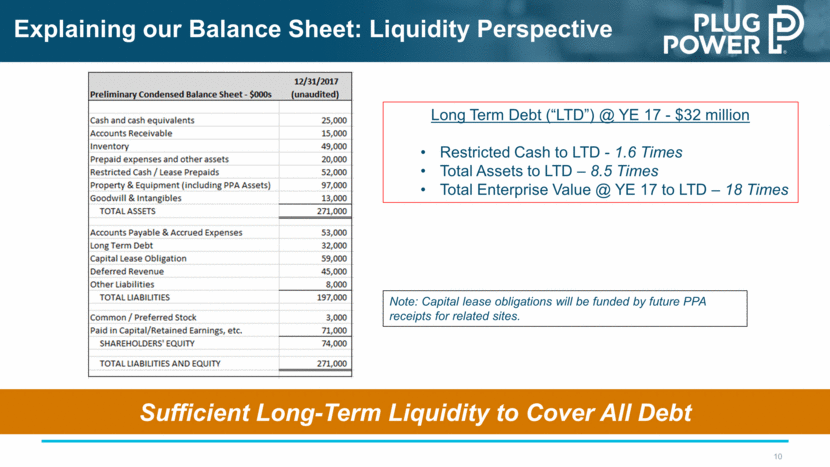
Explaining our Balance Sheet: Liquidity Perspective Long Term Debt (“LTD”) @ YE 17 - $32 million Restricted Cash to LTD - 1.6 Times Total Assets to LTD – 8.5 Times Total Enterprise Value @ YE 17 to LTD – 18 Times Note: Capital lease obligations will be funded by future PPA receipts for related sites. Sufficient Long-Term Liquidity to Cover All Debt
Beyond Material Handling

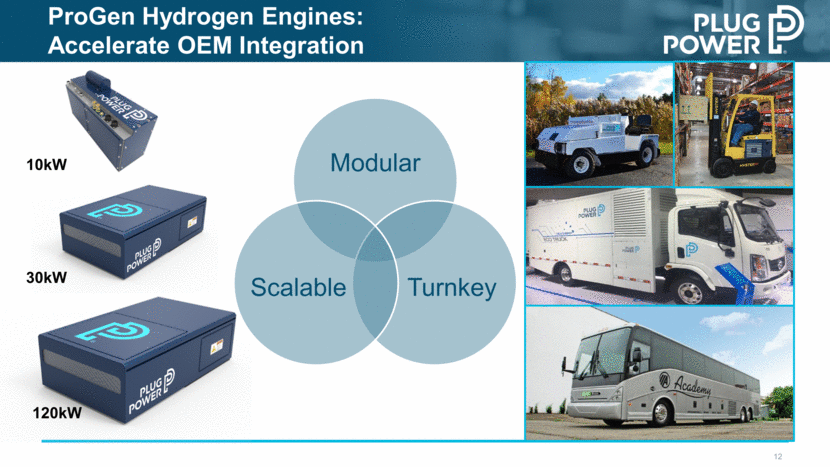
ProGen Hydrogen Engines: Accelerate OEM Integration 120kW 30kW 10kW Modular Turnkey Scalable
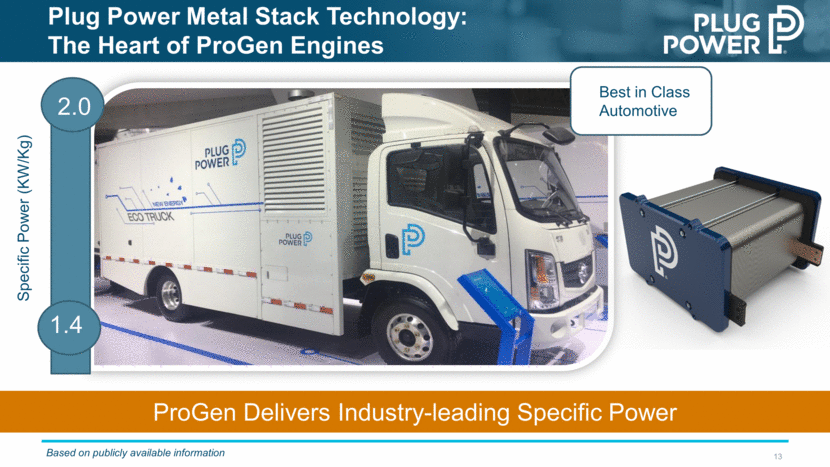
Plug Power Metal Stack Technology: The Heart of ProGen Engines Specific Power (KW/Kg) 2.0 1.4 B Best in Class Automotive Based on publicly available information ProGen Delivers Industry-leading Specific Power
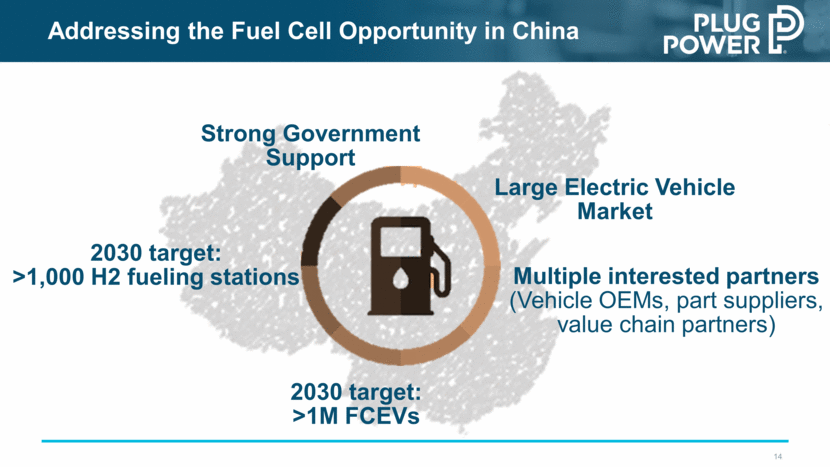
Addressing the Fuel Cell Opportunity in China Large Electric Vehicle Market Multiple interested partners (Vehicle OEMs, part suppliers, value chain partners) 2030 target: >1M FCEVs 2030 target: >1,000 H2 fueling stations Strong Government Support
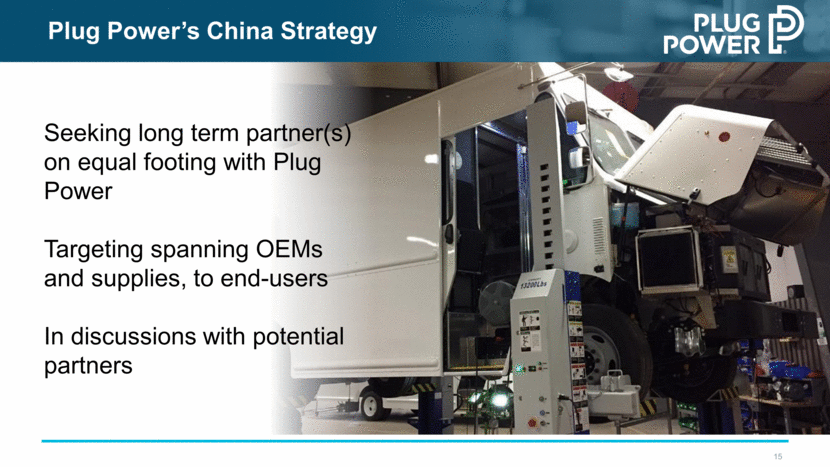
Seeking long term partner(s) on equal footing with Plug Power Targeting spanning OEMs and supplies, to end-users In discussions with potential partners Plug Power’s China Strategy
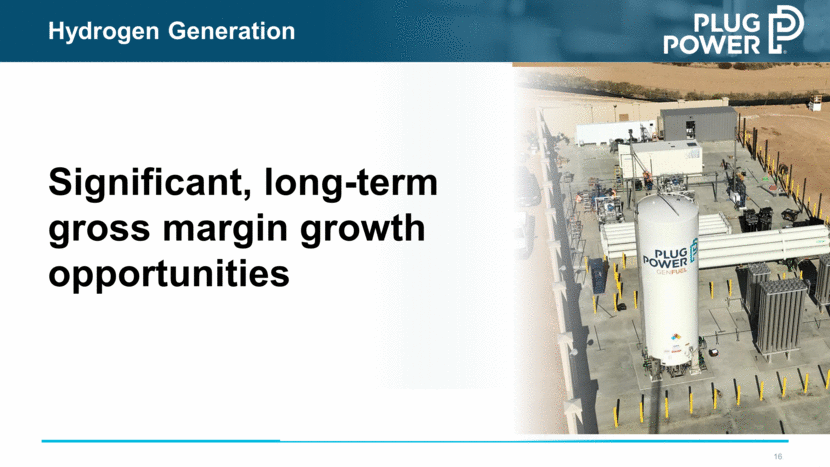
Hydrogen Generation Significant, long-term gross margin growth opportunities
2018 Goals Full-Year 2018 Revenue Guidance: $155 million - $180 million Achieving Adjusted EBITDAS Breakeven: Second half of 2018 Product Sales: $.30 of every additional $1.00 in sales will flow to bottom line Service Costs: Improved stack life Hydrogen: Increase system efficiency Pursue Profitable Business Expansion Opportunities On- road vehicles China Hydrogen
[LOGO]

Plug Power Inc.
Reconciliation of Non-GAAP Financial Measures
(Dollars in 000’s)
|
Reconciliation of Reported Gross Margin to Adjusted Gross Margin |
|
For the three months ended |
|
For the three months ended |
| ||
|
|
|
|
|
|
| ||
|
Gross margin, as reported |
|
-29 |
% |
-32 |
% | ||
|
Provision for common stock warrants |
|
— |
|
42 |
% | ||
|
Adjusted gross margin |
|
-29 |
% |
11 |
% | ||
|
|
|
|
|
|
| ||
|
Reconciliation of Reported Operating Loss to Adjusted EBITDAS |
|
|
|
|
| ||
|
|
|
|
|
|
| ||
|
Operating loss, as reported |
|
$ |
(19,622 |
) |
$ |
(36,381 |
) |
|
Stock-based compensation |
|
2,462 |
|
2,496 |
| ||
|
Depreciation and amortization |
|
2,145 |
|
2,566 |
| ||
|
Walmart financing cash margin |
|
— |
|
3,135 |
| ||
|
Provision for common stock warrants |
|
— |
|
26,057 |
| ||
|
Adjusted EBITDAS |
|
$ |
(15,015 |
) |
$ |
(2,127 |
) |
|
|
|
|
|
|
| ||
|
Reconciliation of Reported Total Operating Expenses to Cash Operating Expenses |
|
|
|
|
| ||
|
|
|
|
|
|
| ||
|
Total operating expenses |
|
|
|
$ |
16,971 |
| |
|
Stock-based compensation |
|
|
|
(2,496 |
) | ||
|
Depreciation and amortization |
|
|
|
(2,566 |
) | ||
|
Cash operating expenses |
|
|
|
$ |
11,909 |
| |
To supplement the Company’s unaudited financial data presented on a generally accepted accounting principles (GAAP) basis, management has used adjusted EBITDAS, adjusted gross margin and cash operating expenses, which are non-GAAP measures. These non-GAAP measures are among the indicators management uses as a basis for evaluating the Company’s financial performance as well as for forecasting future periods. Management establishes performance targets, annual budgets and makes operating decisions based in part upon these metrics. Accordingly, disclosure of these non-GAAP measures provides investors with the same information that management uses to understand the Company’s economic performance year over year. In addition, investors have historically requested and the Company has historically reported these non-GAAP financial measures as a means of providing consistent and comparable information with past reports of financial results. The presentation of this additional information is not meant to be considered in isolation or as a substitute for net income or other measures prepared in accordance with GAAP.
Adjusted EBITDAS, adjusted gross margin and cash operating expenses are not measures of our liquidity or financial performance under GAAP and should not be considered as an alternative to net income or any other performance measure derived in accordance with GAAP, or as an alternative to cash flows from operating activities as a measure of our liquidity. Adjusted EBITDAS is defined as EBITDAS adjusted for cash margin realized on financing PPA deployments. Adjusted gross margin is defined as gross margin adjusted for warrant related charges. Cash operating expenses is defined as total operating expenses less non-cash charges.
While management believes that the non-GAAP financial measures provide useful supplemental information to investors, there are limitations associated with the use of these measures. The measures are not prepared in accordance with GAAP and may not be directly comparable to similarly titled measures of other companies due to potential differences in the exact method of calculation. Further, Adjusted EBITDAS exclude certain expenses, such as depreciation and amortization expense, which represent significant and unavoidable operating costs of our business. Management compensates for these limitations by relying primarily on our GAAP results and by using Adjusted EBITDAS only supplementally and by reviewing the reconciliations of the non-GAAP financial measures to their most comparable GAAP financial measures.
Non-GAAP financial measures are not in accordance with, or an alternative for, generally accepted accounting principles in the United States. The Company’s non-GAAP financial measures are not meant to be considered in isolation or as a substitute for comparable GAAP financial measures, and should be read only in conjunction with the Company’s consolidated financial statements prepared in accordance with GAAP.
Serious News for Serious Traders! Try StreetInsider.com Premium Free!
You May Also Be Interested In
- Plug Power (PLUG) Signs Additional BEDP Contracts for a Total of 4.5GW of Electrolyzers Across Europe and the US
- Plug Power (PLUG) to Make Substantial Advancement in Hydrogen Generation Buildout
- ROSEN, A TRUSTED AND LEADING LAW FIRM, Encourages Plug Power Inc. Investors to Secure Counsel Before Important Deadline in Securities Class Action – PLUG
Create E-mail Alert Related Categories
SEC FilingsSign up for StreetInsider Free!
Receive full access to all new and archived articles, unlimited portfolio tracking, e-mail alerts, custom newswires and RSS feeds - and more!


 Tweet
Tweet Share
Share