




Form 6-K Banco Santander Mexico For: Oct 31

FREE Breaking News Alerts from StreetInsider.com!
StreetInsider.com Top Tickers, 10/20/2026
- Nasdaq climbs as chip and AI-linked stocks bounce back
- U.S. economy is "booming," JPMorgan’s Dimon says
- Musk pledges one share of SpaceX to every U.S. child
- Brent crude edges lower, even after Houthi attacks on Saudi infrastructure
- Prepare to buy the dip as U.S. stock selloff nears its end: Morgan Stanley
 Tweet
Tweet Share
Share E-mail
UNITED STATES
SECURITIES AND EXCHANGE COMMISSION
Washington, D.C. 20549
FORM 6-K
REPORT OF FOREIGN PRIVATE ISSUER PURSUANT TO RULE 13a-16 OR 15d-16 UNDER THE SECURITIES EXCHANGE ACT OF 1934
For the month of October, 2018
Commission File Number: 000-55899
BANCO SANTANDER MÉXICO, S.A., INSTITUCIÓN DE BANCA MÚLTIPLE, GRUPO FINANCIERO SANTANDER MÉXICO
(Exact Name of Registrant as Specified in Its Charter)
Avenida Prolongación Paseo de la Reforma 500
Colonia Lomas de Santa Fe
Delegación Álvaro Obregón
01219, Ciudad de México
(Address of principal executive office)
Indicate by check mark whether the registrant files or will file annual reports under cover of Form 20-F or Form 40-F:
| Form 20-F | X |
Form 40-F | |
Indicate by check mark if the registrant is submitting the Form 6-K in paper as permitted by Regulation S-T Rule 101(b)(1):
| Yes | No | X |
Indicate by check mark if the registrant is submitting the Form 6-K in paper as permitted by Regulation S-T Rule 101(b)(7):
| Yes | |
No | X |
BANCO SANTANDER MÉXICO, S.A., INSTITUCIÓN DE BANCA MÚLTIPLE, GRUPO FINANCIERO SANTANDER MÉXICO
TABLE OF CONTENTS
| ITEM | |
| 1. | Third quarter 2018 earnings release of Banco Santander México, S.A., Institución De Banca Múltiple, Grupo Financiero Santander México
|
| 2. | Third quarter 2018 earnings presenation of Banco Santander México, S.A., Institución De Banca Múltiple, Grupo Financiero Santander México
|
SIGNATURE
Pursuant to the requirements of the Securities Exchange Act of 1934, the registrant has duly caused this report to be signed on its behalf by the undersigned, thereunto duly authorized.
BANCO SANTANDER MÉXICO, S.A., INSTITUCIÓN DE BANCA MÚLTIPLE, GRUPO FINANCIERO SANTANDER MÉXICO
| ||||
| By: | /s/ Hector Chávez Lopez | |||
| Name: | Hector Chávez Lopez | |||
| Title: | Executive Director of Investor Relations | |||
Date: October 31, 2018
Item 1

 | 1 |
TABLE OF CONTENTS
| I. | CEO Message / Key Highlights for the Quarter |
| II. | Summary of 3Q18 Consolidated Results |
| III. | Analysis of 3Q18 Consolidated Results |
| IV. | Relevant Events & Relevant Activities and Transactions |
| V. | Awards & Recognitions |
| VI. | Sustainability and Social Responsibility |
| VII. | Credit Ratings |
| VIII. | 3Q18 Earnings Call Dial-In Information |
| IX. | Analysts Coverage |
| X. | Definition of Ratios |
| XI. | Consolidated Financial Statements |
| XII. | Notes to Consolidated Financial Statements |
| XIII. | Events after the reporting period - Pro forma Financial Statements |
| | 2 |
Banco Santander México Reports Third Quarter 2018 Net Income of Ps.5,096 Million
- Continued focus on profitable growth and execution of investment plan
| - | Strategy based on customer attraction, digitalization, transformation of distribution network and investment in infrastructure |
- Net income growth mainly driven by net interest income, fees and lower provisions
- Strong loan growth across most segments
- Deposits continue to perform well, particularly retail and SME deposits
- Maintaining focus on asset quality
Mexico City – October 31st, 2018, Banco Santander México, S.A., Institución de Banca Múltiple, Grupo Financiero Santander México, as succesor of Grupo Financiero Santander México, S.A.B de C.V. (NYSE: BSMX; BMV: BSMX before SANMEX), (“Banco Santander México” or the “Bank”), today announced financial results for the three-month and nine-month periods ending September 30th, 2018.
Banco Santander México reported net income for 3Q18 of Ps.5,096 million, representing a YoY increase of 25.0% and a QoQ decrease of 1.5%.
| HIGHLIGHTS | ||||||||||||
| Results (Million pesos) | 3Q18 | 2Q18 | 3Q17 | % QoQ | % YoY | 9M18 | 9M17 | % YoY | ||||
| Net interest income | 15,795 | 14,795 | 14,242 | 6.8 | 10.9 | 45,205 | 41,168 | 9.8 | ||||
| Fee and commission, net | 4,271 | 4,262 | 3,934 | 0.2 | 8.6 | 12,602 | 11,700 | 7.7 | ||||
| Core revenues | 20,066 | 19,057 | 18,176 | 5.3 | 10.4 | 57,807 | 52,868 | 9.3 | ||||
| Provisions for loan losses | 5,463 | 4,667 | 5,603 | 17.1 | (2.5) | 15,076 | 15,978 | (5.6) | ||||
| Administrative and promotional expenses | 9,003 | 8,845 | 7,898 | 1.8 | 14.0 | 26,066 | 23,029 | 13.2 | ||||
| Net income | 5,096 | 5,171 | 4,078 | (1.5) | 25.0 | 14,994 | 13,164 | 13.9 | ||||
| Net income per share1 / 3 | 0.75 | 0.76 | 0.05 | (1.3) | — | 2.21 | 0.16 | — | ||||
| Balance Sheet Data (Million pesos) | Sep-18 | Jun-18 | Sep-17 | % QoQ | % YoY | Sep-18 | Sep-17 | % YoY | ||||
| Total assets | 1,375,294 | 1,378,611 | 1,235,081 | (0.2) | 11.4 | 1,375,294 | 1,235,081 | 11.4 | ||||
| Total loans | 680,120 | 652,251 | 613,262 | 4.3 | 10.9 | 680,120 | 613,262 | 10.9 | ||||
| Deposits | 680,143 | 698,118 | 626,641 | (2.6) | 8.5 | 680,143 | 626,641 | 8.5 | ||||
| Shareholders´ equity | 127,385 | 122,520 | 117,346 | 4.0 | 8.6 | 127,385 | 117,346 | 8.6 | ||||
| Key Ratios (%) | 3Q18 | 2Q18 | 3Q17 | bps QoQ | bps YoY | 9M18 | 9M17 | bps YoY | ||||
| Net interest margin | 5.66 | 5.27 | 5.79 | 39 | (13) | 5.48 | 5.44 | 4 | ||||
| Net loans to deposits ratio | 97.00 | 90.56 | 94.60 | 644 | 240 | 97.00 | 94.60 | 240 | ||||
| ROAE | 16.74 | 17.33 | 14.52 | (59) | 222 | 16.41 | 15.63 | 78 | ||||
| ROAA | 1.51 | 1.53 | 1.25 | (2) | 26 | 1.48 | 1.35 | 13 | ||||
| Efficiency ratio | 42.78 | 43.46 | 42.18 | (68) | 60 | 43.04 | 41.23 | 181 | ||||
| Capital ratio | 16.02 | 15.52 | 16.19 | 50 | (17) | 16.02 | 16.19 | (17) | ||||
| NPLs ratio | 2.35 | 2.46 | 2.26 | (11) | 9 | 2.35 | 2.26 | 9 | ||||
| Cost of Risk | 3.37 | 2.94 | 3.72 | 43 | (35) | 3.10 | 3.54 | (44) | ||||
| Coverage ratio | 127.60 | 124.79 | 147.41 | 281 | (1,981) | 127.60 | 147.41 | (1,981) | ||||
| Operating Data | Sep-18 | Jun-18 | Sep-17 | % QoQ | % YoY | Sep-18 | Sep-17 | % YoY | ||||
| Branches | 1,218 | 1,220 | 1,224 | (0.2) | (0.5) | 1,218 | 1,224 | (0.5) | ||||
| Branches and offices2 | 1,385 | 1,376 | 1,375 | 0.7 | 0.7 | 1,385 | 1,375 | 0.7 | ||||
| ATMs | 8,003 | 7,778 | 7,193 | 2.9 | 11.3 | 8,003 | 7,193 | 11.3 | ||||
| Customers | 16,480,106 | 16,231,111 | 15,016,778 | 1.5 | 9.7 | 16,480,106 | 15,016,778 | 9.7 | ||||
| Employees3 | 18,629 | 18,268 | 14,929 | 2.0 | 24.8 | 18,629 | 14,929 | 24.8 | ||||
| Employees - Group | 18,629 | 18,268 | 17,528 | 2.0 | 6.3 | 18,629 | 17,528 | 6.3 | ||||
| 1) Accumulated EPS, net of treasury shares (compensation plan) and discontinued operations. Calculated by using weighted number of shares. | ||||||||||||
| 2) Includes cash desks (espacios select, box select and corner select) and SMEs business centers. Excluding brokerage house offices. | ||||||||||||
| 3) 2017 information refers to Banco Santander México before corporate reorganization. As of 1Q18, all employees from the rest of subsidiaries are already registered at the bank. | ||||||||||||
| | 3 |
Héctor Grisi, Banco Santander México’s Executive President and CEO, commented: “Another quarter of strong performance across the bank again demonstrated the effectiveness of our growth strategy, which has allowed us to attract and retain more retail customers, enhance our product and service offering, and improve our infrastructure and processes.
We delivered robust net income growth, up 25% year-on-year, with ROAE rising to 16.7% for the quarter, driven by strong core earnings growth. This was achieved despite higher costs related to our operational transformation and the implementation of our digitalization strategy to become a more customer centric bank.
Loan portfolio growth remained strong, increasing 11% year-on-year, while we maintained healthy asset quality levels. By leveraging our strong position in commercial banking to attract payroll accounts, we continued to drive growth in high-margin SME, Middle-market and payroll loans. Deposits expanded 9% compared to 3Q17, with individual deposits increasing 16%, reflecting our strategy to attract and retain more retail deposits.
Our loyalty, digitalization and mobile initiatives are improving the customer experience as well as the quality of our retail customer base. We have made more progress on this front, with the number of loyal customers growing nearly 23% year-on-year, while digital and mobile customers increased 32% and 53%, respectively.
Also noteworthy during the quarter was our recent issuance of US$1.3 billion in Tier 2 subordinated preferred capital notes. Simultaneously, we issued a cash tender offer for our outstanding Tier 2 subordinated preferred capital notes due 2024. This was the first cash tender offer of subordinated preferred capital notes in the Mexican market and the first issuance from a Mexican issuer in international markets after the presidential election.
We remain fully focused on executing our various strategic initiatives and I look forward to updating you again on our progress toward becoming a more customer-centric, efficient and profitable bank.”
| | 4 |
SUMMARY OF THIRD QUARTER 2018 CONSOLIDATED RESULTS
Loan portfolio
Banco Santander México’s total loan portfolio, as of 3Q18, increased YoY by 10.9%, or Ps.66,858 million, to Ps.680,120 million, and 4.3%, or Ps.27,869 million, on a sequential basis.
In 3Q18, Banco Santander México saw strong growth in total loans. During the quarter, the Bank maintained its focus on high-margin loans, reflecting Banco Santaner México´s emphasis on profitability. Growth was also achieved by selectively offering low-margin loans, particulary corporate and government loans, and as a result of continued improved performance in mortgages.

Deposits
Deposits, which represent 84.6% of Banco Santander México’s total funding[1], increased 8.5% YoY in 3Q18 and decreased 2.6% sequentially. In turn, demand deposits increased YoY by 4.1% and time deposits by 18.4% YoY, the latter, driven by the higher interest rate environment. The Bank continues to benefit from strong deposit growth of individuals and SMEs, which grew YoY by 16.3% and 15.9%, respectively.
The loans to deposits ratio stood at 97.00% in 3Q18, which compares with 94.60% in 3Q17 and 90.56% in 2Q18, providing Banco Santander México with a comfortable funding position to leverage future growth opportunities.
The contribution of individual deposits to total deposits continue to increase. In 3Q18, individual demand deposits represented 27.8% of total demand deposits compared with 25.5% in 3Q17 and 27.1% in 2Q18. Also during this quarter, individual time deposits represented 31.8% of total time deposits compared with 31.0% in 3Q17 and 31.3% in 2Q18.
1 Total funding includes: deposits, credit instruments issued, bank and other loans and subordinated credit notes.
| | 5 |

Net income
Banco Santander México reported net income for 3Q18 of Ps.5,096 million, representing an increase of 25.0% YoY, reflecting mainly strong performance in the financial margin as well as lower provisions for loan losses. Sequentially, net income decreased 1.5%, due to an increase in administrative and promotional expenses, along with higher provisions for loan losses and a decrease in net gains on financial assets and liabilities.

| Net income statement | ||||||||||||
| Million pesos | % Variation | % Variation | ||||||||||
| 3Q18 | 2Q18 | 3Q17 | QoQ | YoY | 9M18 | 9M17 | 18/17 | |||||
| Net interest income | 15,795 | 14,795 | 14,242 | 6.8 | 10.9 | 45,205 | 41,168 | 9.8 | ||||
| Provisions for loan losses | (5,463) | (4,667) | (5,603) | 17.1 | (2.5) | (15,076) | (15,978) | (5.6) | ||||
| Net interest income after provisions for loan losses | 10,332 | 10,128 | 8,639 | 2.0 | 19.6 | 30,129 | 25,190 | 19.6 | ||||
| Commission and fee income, net | 4,271 | 4,262 | 3,934 | 0.2 | 8.6 | 12,602 | 11,700 | 7.7 | ||||
| Net gain (loss) on financial assets and liabilities | 843 | 1,049 | 311 | (19.6) | 171.1 | 2,180 | 2,359 | (7.6) | ||||
| Other operating income | 134 | 244 | 239 | (45.1) | (43.9) | 570 | 623 | (8.5) | ||||
| Administrative and promotional expenses | (9,003) | (8,845) | (7,898) | 1.8 | 14.0 | (26,066) | (23,029) | 13.2 | ||||
| Operating income | 6,577 | 6,838 | 5,225 | (3.8) | 25.9 | 19,415 | 16,843 | 15.3 | ||||
| Income taxes (net) | (1,481) | (1,667) | (1,147) | (11.2) | 29.1 | (4,421) | (3,679) | 20.2 | ||||
| Net income | 5,096 | 5,171 | 4,078 | (1.5) | 25.0 | 14,994 | 13,164 | 13.9 | ||||
| Effective tax rate (%) | 22.52 | 24.38 | 21.95 | 22.77 | 21.84 | |||||||
| | 6 |
3Q18 vs 3Q17
The 25.0% year-on-year increase in net income was principally driven by:
| i) | A 10.9%, or Ps.1,553 million, increase in net interest income, mainly reflecting the Bank focus on high-margin segments along with higher interest rates; |
| ii) | A 171.1%, or Ps.532 million, increase in net gains on financial assets and liabilities, mainly resulting from market volatility and a low base in 3Q17; |
| iii) | A 8.6%, or Ps.337 million, increase in net commissions and fees, mainly resulting from growth in debit and credit cards, collection services, insurance, foreign trade, account management and investment funds fees; and |
| iv) | A 2.5%, or Ps.140 million, decrease in provisions for loan losses, mostly as a result of good performance in the consumer loan portfolio. |
The increase in net income was partially offset by:
| i) | A 14.0%, or Ps.1,105 million, increase in administrative and promotional expenses, mainly due to higher personnel expenses, professional fees and depreciation and amortization; and |
| ii) | A 43.9%, or Ps.105 million, decrease in other operating income, mostly resulting from higher write-offs, portfolio recovery legal expenses and costs, and provisions for legal and tax contingencies, partly offset by higher recoveries of previously written-off loans. |
Gross operating income
Banco Santander México’s gross operating income for 3Q18 totaled Ps.20,909 million, representing increases of 13.1% YoY and 4.0% QoQ, reflecting strong performance across the board. Sequentially, the strong performance in net interest income, was partly affected by a decline in net gains on financial assets and liabilities, which contributed 4.0% in 3Q18 and 5.2% in 2Q18.
Gross operating income is broken down as follows:
| Breakdown gross operating income (%) | ||||||
| Variation bps | ||||||
| 3Q18 | 2Q18 | 3Q17 | QoQ | YoY | ||
| Net Interest Income | 75.54 | 73.58 | 77.04 | 196 | (150) | |
| Net Commissions and Fees | 20.43 | 21.20 | 21.28 | (77) | (85) | |
| Market related revenue | 4.03 | 5.22 | 1.68 | (119) | 235 | |
| Gross Operating Income* | 100.00 | 100.00 | 100.00 | |||
*Does not include other income
| | 7 |
Return on average equity (ROAE)
ROAE for 3Q18 increased by 222 basis points to 16.74% from 14.52% reported in 3Q17 and decreased by 59 basis points versus 17.33% in 2Q18, reflecting solid growth in total revenues and lower provisions.

| | 8 |
Strategic initiatives and commercial actions
In December 2016, Banco Santander México announced a plan to invest approximately Ps.15 billion between 2017 and 2019, in addition to recurring investments and commercial actions, to achieve the goal of becoming its clients’ principal bank and Mexico’s market leader in sustainable, profitable growth. The execution of this plan remains in progress and continues to be focused on attracting new customers, strengthening customer loyalty, as well as expanding the Bank’s value offering with new products and services.
The investment plan is concentrated on three key initiatives. Details on progress in most relevant programs are described below:
| Ø | Transformation of our distribution network and investment in infrastructure, including next generation technology. |
| § | Continuous improvement of the Bank’s technological platforms and infrastructure, such as the “Spotlight” factory, which develops digital solutions that improve and digitalize products and processes to benefit customers and collaborators. As of the end of the quarter, the Bank has made 57 deliveries while 78 are in pipeline. |
| § | Extending our footprint of full-function ATMs and the ongoing strengthening of CRM capabilities. As of September 30th, the Bank had 672 full-function ATMs in operation, representing 8.4% of total ATMs outstanding (109 more than 2Q18). The goal is to reach 800 such units by year-end. |
| § | According to Banco Santander México’s new distribution model for branches and as part of the commercial program “Movimiento Santander” that was launched at the beginning of the year, 220 branches have been renovated according to the new SmartRed concept, which also contemplates an individualized P&L, as well as, new management tools for branches. The aim is to renovate 300 branches during the year. These branches promote the use of digital and self-service channels. |
| § | Launch of the new branch model “Sucursal Ágil” which specializes in low value transactions and offers a more dynamic service, improving the overall customer experience, by aiming for a max waiting time of 15 minutes. |
| § | Upgrade of “Súper Digital”, with improvements that allow users to open accounts through “Súper Móvil”. This service is aimed at non-banking clients who are digital-oriented and avoid visiting branches. As of the end of the quarter, Banco Santander México has opened more than 100,000 of these accounts. |
| § | In addition, during the quarter, the Bank completed the upgrade of the Interactive Voice Response system in the contact center that will allow it to handle over 80% of the incoming calls. |
| § | Launch of a new Transactional Electronic Banking platform for companies, which roll-over will be gradual. |
| § | Growth of the digital offering via “Súper Móvil”, with new functionalities that offers the option to apply for increases in a credit line or to transfer debt balances from other banks at preferential rates. “Súper Wallet” now includes an option to make purchases with reward points (“Puntos Recompensas”). |
| § | Building loyalty and adding more digital clients, which led to an increase of 23% in loyal and 32% in digital clients at the end of 3Q18. Of note, the number of mobile customers increased 53% in the last 12 months. |
| | 9 |
| Ø | On the retail front, investment initiatives are aimed at boosting customer acquisition, cross-selling, and building loyalty. |
| § | In accordance with the strategy to attract more deposits, the Bank launched “El Gran Premio”, a campaign in which clients can win tickets for Formula 1 racing, and “Super Pagaré 12”, through which customers can obtain an interest rate up to 12% for their investment with a minimum amount of Ps.500,000. |
| § | The new “Seguro de Daños” an insurance product that covers the commercial value of property that offers the best insurance for mortgage loans in the market. |
| § | In order to continue attracting new customers and increasing existing client loyalty, the benefits for Santander Plus customers have been improved with initiatives related to credit loans, insurance, and commercial alliances with retail companies. Santander Plus continues to perform well. Over 4.2 million customers have now enrolled in this program, of which 55% are new. |
| § | The Santander-Aeroméxico co-branded card has also been very successful, with around 900,000 cardholders, of which 37% are new. |
| § | The “Select Me” Program seeks to promote women’s empowerment, including solutions that facilitate their day-to-day and professional development. At the end of 3Q18, there are more than 5,600 active clients. |
| § | Launch of “Crédito Digital para PyMEs” which reduces the approval time for SME loans from 48 hours to 60 minutes, available through two different products, “Crédito Simple” with a term of 12 to 36 months and “Crédito Ágil” for a fixed term of 12 months only. |
| § | Launch of “Solicitud Contrato Agro”, for retail companies. It reduces the time needed to apply for and receive a loan from 22 business days to 6 business days, promoting financing to the agricultural sector in the SME segment. |
| Ø | Additionally, the Bank’s value proposition is complemented by new businesses, such as auto financing, distribution of third-party insurance products to middle-market clients, and the financial inclusion program. |
| § | Launch of “Super Auto”, a car and motorcycle loan financing supported by a digital origination platform that enhances the customer experience by reducing processing and approval times. This is the only digital platform in the market in which client quotes generated at the dealership automatically populate the loan submission file, instantly detonating the loan approval process. As of the end of the quarter, Banco Santander México has loans of more than Ps.480 million through this product. During the quarter, we announced an alliance with Peugeot México intended to become the brand’s main financial partner in auto loans, offering a customized commercial service. |
| § | With regards to the financial inclusion program, “TUIIO”, at the end of September, the Bank had 18 branches in operation in the states of Mexico, Morelos and Guerrero, with more than 12,000 customers, reaching for a loan portfolio in excess of Ps.40 million. |
| Customers | ||||||
| (Thousands) | % Variation | |||||
| Sep 18 | Jun 18 | Sep 17 | QoQ | YoY | ||
| Loyal Customers1 | 2,362 | 2,235 | 1,922 | 5.7 | 22.9 | |
| Digital Customers2 | 2,533 | 2,348 | 1,925 | 7.9 | 31.6 | |
| Santander Plus | 4,296 | 3,869 | 2,552 | 11.0 | 68.3 | |
| Santander - Aeroméxico | 900 | 885 | 747 | 1.6 | 20.4 | |
1 Loyal customers = Clients with non-zero balance and depending on the segment should have between two and four products and between three and ten transactions in the last 90 days.
2 Digital customers = Clients with at least one digital transaction per month in SuperNet or SuperMóvil.
| | 10 |
ANALYSIS OF THIRD QUARTER 2018 CONSOLIDATED RESULTS
(Amounts expressed in millions of pesos, except where otherwise stated)
Loan portfolio
The evolution of the loan portfolio shows solid performance across all of Banco Santander México’s core businesses and with a continued strong focus on profitability.
| Portfolio Breakdown | ||||||
| Million pesos | % Variation | |||||
| 3Q18 | 2Q18 | 3Q17 | QoQ | YoY | ||
| Commercial | 432,114 | 408,339 | 378,782 | 5.8 | 14.1 | |
| Middle-market | 175,567 | 174,750 | 154,630 | 0.5 | 13.5 | |
| Corporates | 97,031 | 86,859 | 85,954 | 11.7 | 12.9 | |
| SMEs | 77,519 | 76,915 | 70,297 | 0.8 | 10.3 | |
|
Government & Financial
Entities
|
81,997 | 69,815 | 67,901 | 17.4 | 20.8 | |
| Individuals | 248,006 | 243,912 | 234,480 | 1.7 | 5.8 | |
| Consumer | 109,471 | 108,800 | 105,596 | 0.6 | 3.7 | |
| Credit Cards | 54,997 | 55,037 | 53,220 | (0.1) | 3.3 | |
| Other Consumer | 54,474 | 53,763 | 52,376 | 1.3 | 4.0 | |
| Mortgages | 138,535 | 135,112 | 128,884 | 2.5 | 7.5 | |
| Total | 680,120 | 652,251 | 613,262 | 4.3 | 10.9 | |

The total loan portfolio rose 10.9%, or Ps.66,858 million YoY, to Ps.680,120 million in 3Q18. On a sequential basis, the total loan portfolio increased 4.3%, or Ps.27,869 million.
Personal loans remain soft as the Bank focuses on further strengthening its payroll franchise. Within the credit card portfolio, at the end of 2017 certain external channels that targeted the open market were closed, in order to improve asset quality in this product category, resulting in slower growth. However, credit card use, remained strong, up 11.8% YoY. Payroll loans increased 12.5% YoY, above market growth. At the same time, middle-market, corporate and SME loans posted solid performance, increasing 13.5%, 12.9% and 10.3% YoY, respectively.
In 3Q18, loans to government and financial entities increased 20.8% YoY and represented 12.1% of the loan book. Corporate loans represented 14.3% of the loan book and rose 12.9%, or Ps.11,077 million YoY, demonstrating solid performance. Sequentially, loans to government and financial entities increased by 17.4%, a result of loans granted to two state-owned companies, while corporate loans increased 11.7%.
| | 11 |
Mortgage loans continued accelerating slightly during the quarter, increasing 7.5% YoY and 2.5% sequentially, supported by new originations through Hipoteca Plus. However, mortgage loans were still affected by the run-off of acquired portfolios, which represented approximately 7.9% of the total mortgage portfolio at the end of the quarter. Excluding this effect, the mortgage portfolio would have increased 9.8% YoY, exceding market growth.
As of 3Q18, middle-market and SMEs loans represented 37.2% of the total loan portfolio and grew twice as fast as individual loans.
| Loan portfolio breakdown | ||||||||
| Million pesos | ||||||||
| 3Q18 | % | 2Q18 | % | 3Q17 | % | |||
| Performing loans | ||||||||
| Commercial | 426,351 | 62.7 | 402,745 | 61.7 | 374,587 | 61.1 | ||
| Individuals | 237,801 | 35.0 | 233,457 | 35.8 | 224,808 | 36.7 | ||
| Consumer | 105,232 | 15.5 | 104,354 | 16.0 | 101,077 | 16.5 | ||
| Credit cards | 52,642 | 7.7 | 52,608 | 8.1 | 50,714 | 8.3 | ||
| Other consumer | 52,590 | 7.7 | 51,746 | 7.9 | 50,363 | 8.2 | ||
| Mortgages | 132,569 | 19.5 | 129,103 | 19.8 | 123,731 | 20.2 | ||
| Total performing loans | 664,152 | 97.7 | 636,202 | 97.5 | 599,395 | 97.7 | ||
| Non-performing loans | ||||||||
| Commercial | 5,763 | 0.8 | 5,594 | 0.9 | 4,195 | 0.7 | ||
| Individuals | 10,205 | 1.5 | 10,455 | 1.6 | 9,672 | 1.6 | ||
| Consumer | 4,239 | 0.6 | 4,446 | 0.7 | 4,519 | 0.7 | ||
| Credit cards | 2,355 | 0.3 | 2,429 | 0.4 | 2,506 | 0.4 | ||
| Other consumer | 1,884 | 0.3 | 2,017 | 0.3 | 2,013 | 0.3 | ||
| Mortgages | 5,966 | 0.9 | 6,009 | 0.9 | 5,153 | 0.8 | ||
| Total non-performing loans | 15,968 | 2.3 | 16,049 | 2.5 | 13,867 | 2.3 | ||
| Total loan portfolio | ||||||||
| Commercial | 432,114 | 63.5 | 408,339 | 62.6 | 378,782 | 61.8 | ||
| Individuals | 248,006 | 36.5 | 243,912 | 37.4 | 234,480 | 38.2 | ||
| Consumer | 109,471 | 16.1 | 108,800 | 16.7 | 105,596 | 17.2 | ||
| Credit cards | 54,997 | 8.1 | 55,037 | 8.4 | 53,220 | 8.7 | ||
| Other consumer | 54,474 | 8.0 | 53,763 | 8.2 | 52,376 | 8.5 | ||
| Mortgages | 138,535 | 20.4 | 135,112 | 20.7 | 128,884 | 21.0 | ||
| Total loan portfolio | 680,120 | 100.0 | 652,251 | 100.0 | 613,262 | 100.0 | ||
The commercial loan portfolio is comprised of loans to business and commercial entities, as well as loans to government entities and financial institutions, and represented 63.5% of the total loan portfolio. Excluding loans to government entities and financial institutions, the commercial loan portfolio accounted for 51.5% of the total loan portfolio.
As of 3Q18, commercial loans increased 14.1% YoY, driven by middle-market companies, corporates and SME loans. Mid-market, corporate and SME loans posted 13.5%, 12.9%, and 10.3% YoY growth rates, respectively. With regard to SME loans, Banco Santander México launched, during the quarter, a new kind of loan to the agricultural sector. This loan targets distribution companies and agribusinesses and reduces the formalization process to 6 days from 22 days. At the same time, the SME portfolio continues to reflect the strategy of targeting mid-to large-sized SMEs while maintaining a risk-return focus and conducting refinancing campaigns with clients that have good credit ratings. Loans to government and financial entities increased 20.8% YoY, a result of loans granted to two state-owned companies.
| | 12 |
The Individuals loan portfolio, comprised of mortgages, consumer and credit card loans, represented 36.5% of the total loan portfolio, and increased 5.8% YoY. Mortgage, credit card and consumer loans, represented 20.4%, 8.1%, and 8.0% of the total loan portfolio, respectively.
Consumer loans increased 4.0% YoY and 1.3% QoQ, reflecting strong performance in payroll loans which increased 12.5% YoY, as the Bank gained traction in its efforts to attract new payroll accounts by leveraging its strong franchise in the corporate and middle-market segments along with its Santander Plus program. Growth in personal loans decreased 5.4% YoY and 1.8% sequentially.
Credit cards loans grew 3.3% YoY and decreased 0.1% sequentially. The YoY growth was mainly driven by more frequent usage of Banco Santander México’s full suite of credit cards. However, this is not fully reflected in loan growth, as a large number of customers continued to pay their balances in full during the quarter. In addition, at the end of 2017, the Bank closed certain external channels in order to improve asset quality. The Santander-Aeroméxico co-branded card continues to perform well, contributing to volume growth.
Finally, mortgage loans continued showing a solid acceleration, increasing 7.5% YoY and 2.5% sequentially, but were still affected by the run-off of acquired portfolios, which represented approximately 7.9% of the total mortgage portfolio. Excluding this effect, the mortgage portfolio would have increased 9.8% YoY.
During the quarter, there was also a strong performance in “Hipoteca Plus”, which was launched in April 2018 and contributed with more than 50% of loans originated. This product rewards new loyal customers with the lowest rate available in the market - 8.59%. “Hipoteca Plus” rewards customers who keep their payroll and other financial products with Banco Santander México.
Total Deposits
Total deposits at the end of 3Q18 were Ps.680,143 million, representing an increase of 8.5% YoY and a decrease of 2.6% sequentially as some corporates withdrew deposits. Demand deposits reached Ps.447,718 million, growing 4.1% YoY and decreasing 4.5% sequentially. Individual demand deposits rose 13.3% YoY, allowing the Bank to improve the deposit mix. Time deposits remained solid and reached Ps.232,425 million, up 18.4% YoY and 1.3% QoQ. Individual time deposits grew 21.7% YoY and 2.8% QoQ, benefiting from a higher interest rate environment.
During the quarter, Banco Santander México launched its “El Gran Premio” campaign, whereby clients receive tickets to “Formula 1” races, as well as another new product called “Súper Pagare 12” through which clients can obtain a rate of up to 12% with a minimum amount of Ps.500,000. In addition, the Bank launched “Santander 360”, to support SME clients in their collection and benefiting their customers. These initiatives are focused on offering innovative products and a client-centric approach for individuals and SMEs and are driving deposit growth resulting in a 16.3% and 15.9% YoY expansion, respectively.


| | 13 |
Net interest income
| Net interest income | |||||||||||
| Million pesos | % Variation | % Variation | |||||||||
| 3Q18 | 2Q18 | 3Q17 | QoQ | YoY | 9M18 | 9M17 | 18/17 | ||||
| Interest on funds available | 801 | 821 | 686 | (2.4) | 16.8 | 2,325 | 1,996 | 16.5 | |||
| Interest on margin accounts | 211 | 220 | 250 | (4.1) | (15.6) | 727 | 859 | (15.4) | |||
| Interest and yield on securities | 5,218 | 4,847 | 4,536 | 7.7 | 15.0 | 14,404 | 13,591 | 6.0 | |||
| Interest and yield on loan portfolio – excluding credit cards | 17,408 | 16,166 | 15,117 | 7.7 | 15.2 | 49,370 | 42,784 | 15.4 | |||
| Interest and yield on loan portfolio related to credit card transactions | 3,472 | 3,500 | 3,199 | (0.8) | 8.5 | 10,152 | 9,299 | 9.2 | |||
| Commissions collected on loan originations | 137 | 149 | 227 | (8.1) | (39.6) | 437 | 704 | (37.9) | |||
| Interest and premium on sale and repurchase agreements and securities loans | 1,581 | 1,814 | 896 | (12.8) | 76.5 | 4,918 | 2,585 | 90.3 | |||
| Interest income | 28,828 | 27,517 | 24,911 | 4.8 | 15.7 | 82,333 | 71,818 | 14.6 | |||
| Daily average interest earnings assets | 1,116,683 | 1,123,177 | 983,170 | (0.6) | 13.6 | 1,099,598 | 1,008,117 | 9.1 | |||
| Interest from customer deposits – demand deposits | (2,715) | (2,576) | (2,510) | 5.4 | 8.2 | (7,673) | (6,345) | 20.9 | |||
| Interest from customer deposits – time deposits | (3,951) | (3,726) | (2,637) | 6.0 | 49.8 | (11,013) | (7,371) | 49.4 | |||
| Interest from credit instruments issued | (671) | (691) | (704) | (2.9) | (4.7) | (2,040) | (2,025) | 0.7 | |||
| Interest on bank and other loans | (1,187) | (972) | (832) | 22.1 | 42.7 | (3,033) | (2,490) | 21.8 | |||
| Interest on subordinated capital notes | (442) | (435) | (509) | 1.6 | (13.2) | (1,306) | (1,332) | (2.0) | |||
| Interest and premium on sale and repurchase agreements and securities loans | (4,067) | (4,322) | (3,477) | (5.9) | 17.0 | (12,063) | (11,087) | 8.8 | |||
| Interest expense | (13,033) | (12,722) | (10,669) | 2.4 | 22.2 | (37,128) | (30,650) | 21.1 | |||
| Daily average interest-bearing liabilities | 993,960 | 998,231 | 887,508 | (0.4) | 12.0 | 974,364 | 924,881 | 5.4 | |||
| Net interest income | 15,795 | 14,795 | 14,242 | 6.8 | 10.9 | 45,205 | 41,168 | 9.8 | |||
Net interest income in 3Q18 totaled Ps.15,795 million, increasing 10.9% YoY, or Ps.1,553 million, and 6.8% or Ps.1,000 million, sequentially.
The 10.9% YoY increase in net interest income resulted from the combined effect of:
| i) | A 15.7%, or Ps.3,917 million, increase in interest income, to Ps.28,828 million, stemming from a 13.6%, or Ps.133,513 million, increase, in average interest-earning assets and a 19 basis point increase in the average interest rate received; and |
| ii) | A 22.2%, or Ps.2,364 million, increase in interest expense, to Ps.13,033 million, resulting from a 12.0%, or Ps.106,452 million increase in interest-bearing liabilities and a 43 basis point increase in the average interest rate paid. |
| | 14 |
Results for the quarter continued to show the benefits of a higher interest rate environment, along with the Bank’s sharp focus on profitability.
The net interest margin ratio (NIM), calculated using daily average interest-earning assets for 3Q18, stood at 5.66%, compared to 5.79% in 3Q17 and 5.27% in 2Q18. The YoY decline in NIM mainly reflects higher interest rates and loan volume growth in high margin loans, partially offset by increased interest rates paid on deposits and repurchase agreements. On a cumulative basis, NIM for 9M18 reached 5.48% - an increase of 4 basis points.

Interest Income
Total average interest earning assets in 3Q18 amounted to Ps.1,116,683 million, increasing 13.6%, or Ps.133,513 million, YoY, mainly driven by 10.8% growth, or Ps.64,135 million, in the average loan portfolio and 59.0% growth, or Ps.29,321 million, in repurchase agreements. Banco Santander México’s interest earning assets are broken down as follows:
| Average Assets (Interest-Earnings Assets) | |||||
| Breakdown (%) | |||||
| 3Q17 | 4Q17 | 1Q18 | 2Q18 | 3Q18 | |
| Loans | 60.3 | 58.9 | 58.9 | 56.7 | 58.9 |
| Securities | 27.0 | 27.2 | 24.1 | 25.1 | 25.0 |
| Funds Available | 4.9 | 6.8 | 6.0 | 7.5 | 7.0 |
| Rep. Agreements | 5.1 | 4.2 | 7.8 | 8.4 | 7.0 |
| Margin accounts | 2.7 | 2.9 | 3.2 | 2.3 | 2.1 |
| Total | 100.0 | 100.0 | 100.0 | 100.0 | 100.0 |
Banco Santander México’s interest income consists mainly of interest from the loan portfolio and commissions on loan origination, which in 3Q18 generated Ps.21,017 million and accounted for 72.9% of total interest income. The remaining interest income of Ps.7,811 million is broken down as follows: 18.1% from investment in securities portfolio, 5.5% from repurchase agreements, 2.8% from funds available, and 0.7% from margin accounts.
Interest income for 3Q18 increased by 15.7%, or Ps.3,917 million YoY, to Ps.28,828 million, mainly reflecting higher interest income from the total loan portfolio, repurchase agreements, investment in securities and funds available, which increased 14.0%, or Ps.2,564 million, 76.5%, or Ps.685 million, 15.0%, or Ps.682 million, and 16.8%, or Ps.115 million, respectively.
| | 15 |
The average interest yield on interest-earning assets in 3Q18 stood at 10.10%, increasing 19 basis points from 9.91% in 3Q17, mainly reflecting a higher interest rate environment, along with a focus on high-margin segments and strong margin discipline. Sequentially, investment in securities and repurchase agreements, contributed to the increase in total interest yield, increasing 41 basis points.
Meanwhile, the average interest rate on the total loan portfolio (excluding credit cards) stood at 11.31%, increasing 37 basis points YoY, supported by volume growth in high-margin portfolios. The average interest rate on the credit card loan portfolio stood at 24.84%, increasing 99 basis points YoY, due to a strategy of raising interest rates and rebalancing towards a more profitable product mix through a customer profiling program launched at the beginning of the year that allows customers to find their ideal credit card. Finally, the average interest rate on repurchase agreements and investment in securities portfolio stood at 7.83% and 7.32%, increasing 77 and 64 basis points, respectively.

| Interest income | |||||||||||
| Million pesos | 3Q18 | 3Q17 | Var YoY | ||||||||
| Average Balance | Interest | Yield (%) | Average Balance | Interest | Yield (%) | Average Balance (%) | Interest (%) | Yield (bps) | |||
| Funds available | 77,748 | 801 | 4.03 | 48,517 | 686 | 5.53 | 60.2 | 16.8 | (150) | ||
| Margin accounts | 23,987 | 211 | 3.44 | 26,340 | 250 | 3.71 | (8.9) | (15.6) | (27) | ||
| Investment in securities | 278,765 | 5,218 | 7.32 | 265,586 | 4,536 | 6.68 | 5.0 | 15.0 | 64 | ||
| Loan portfolio | 657,175 | 20,880 | 12.43 | 593,040 | 18,316 | 12.09 | 10.8 | 14.0 | 35 | ||
| Commissions collected on loan originations | 0 | 137 | n.a. | 0 | 227 | n.a. | n.a. | (39.6) | n.a | ||
| Sale and repurchase agreements and securities loans | 79,008 | 1,581 | 7.83 | 49,687 | 896 | 7.06 | 59.0 | 76.5 | 77 | ||
| Interest income | 1,116,683 | 28,828 | 10.10 | 983,170 | 24,911 | 9.91 | 13.6 | 15.7 | 19 | ||
| | 16 |
As previously explained, the main contributor to interest income growth was the 14.0%, or Ps.2,564 million, increase in interest income from the total loan portfolio. This increase resulted from a 10.8%, or Ps.64,135 million, rise in average loan portfolio volume, and a 28 basis point increase in the average interest rate. Higher interest income from the loan portfolio resulted from the following YoY increases by product:
| § | Commercial +14.1%, or Ps.50,939 million, with a 10.02% interest yield which increased 74 bps. |
| § | Credit Cards +4.2%, or Ps.2,198 million, with a 24.84% interest yield which increased 99 bps. |
| § | Consumer +4.3%, or Ps.2,209 million, with a 24.60% interest yield which increased 32 bps. |
| § | Mortgages +6.9%, or Ps.8,788 million, with a 9.98% interest yield which decreased 31 bps. |
Interest income from repurchase agreements, the second contributor, grew 76.5% or Ps.685 million, which resulted from increases of 59.0%, or Ps.29,321 million, in the average volume, together with a 77 basis point increase in the average interest rate. Interest income from investment in securities grew 15.0%, or Ps.682 million, which resulted from increases of 5.0%, or Ps.13,179 million, in average volume, together with a 64 basis point increase in the average interest rate. Interest income from funds available grew 16.8%, or Ps.115 million, resulting from an increase of 60.2%, or Ps.29,231 million, in average volume, together with a 150 basis point decrease in the average interest rate.
Interest expense
Total average interest-bearing liabilities amounted to Ps.993,960 million, increasing 12.0%, or Ps.106,452 million YoY, driven by increases of 32.8%, or Ps.65,285 million, in time deposits, 4.2%, or Ps.15,543 million, in demand deposits, 6.6%, or Ps.12,781 million, in repurchase agreements, 15.0%, or Ps.7,921 million, in bank and other loans, and 7.8%, or Ps.3,445 million, in credit instruments issued.
Banco Santander México’s interest-bearing liabilities are broken down as follows:
| Average liabilities (interest-bearing liabilities) | |||||
| Breakdown (%) | |||||
| 3Q17 | 4Q17 | 1Q18 | 2Q18 | 3Q18 | |
| Demand deposits | 42.1 | 39.9 | 39.8 | 38.5 | 39.2 |
| Sale and repurchase agreements and securities loans | 21.9 | 22.6 | 21.3 | 22.8 | 20.8 |
| Time deposits | 22.4 | 24.1 | 26.3 | 26.0 | 26.6 |
| Bank and other loans | 6.0 | 6.1 | 5.2 | 5.3 | 6.1 |
| Credit instruments issued | 5.0 | 4.7 | 4.9 | 4.9 | 4.8 |
| Subordinated capital notes | 2.6 | 2.6 | 2.5 | 2.5 | 2.5 |
| Total | 100.0 | 100.0 | 100.0 | 100.0 | 100.0 |
Banco Santander México’s interest expense consists mainly of interest paid on customer deposits and repurchase agreements, which in 3Q18 amounted to Ps.6,666 million and Ps.4,067 million, respectively, and accounted for 51.1% and 31.2% of interest expense. The remaining interest expense of Ps.2,300 million was paid as follows: 9.1% on bank and other loans, 5.1% on credit instruments issued and 3.5% on subordinated debentures.
Interest expense for 3Q18 increased 22.2%, or Ps.2,364 million, to Ps.13,033 million, mainly driven by higher interest expense on time deposits, repurchase agreements, bank and other loans and demand deposits.
The average interest rate on interest-bearing liabilities increased 43 basis points to 5.13% in 3Q18, mainly reflecting increases in the benchmark interest rate, which directly affected the main sources of funding.
| | 17 |
For 3Q18, the average interest rate on the main sources of funding increased as follows:
| § | 149 basis points in bank and other loans, to an average interest rate paid of 7.64%; |
| § | 68 basis points in repurchase agreements, to an average interest rate paid of 7.68%; |
| § | 67 basis points in time deposits, to an average interest rate paid of 5.85%; and |
| § | 10 basis points in demand deposits, to an average interest rate paid of 2.73%. |

| Interest expense | |||||||||||
| Million pesos | 3Q18 | 3Q17 | Var YoY | ||||||||
| Average Balance | Interest | Rate (%) | Average Balance | Interest | Rate (%) | Average Balance (%) | Interest (%) | Rate (bps) | |||
| Demand deposits | 389,325 | 2,715 | 2.73 | 373,782 | 2,510 | 2.63 | 4.2 | 8.2 | 10 | ||
| Time deposits | 264,486 | 3,951 | 5.85 | 199,201 | 2,637 | 5.18 | 32.8 | 49.8 | 67 | ||
| Credit instruments issued | 47,495 | 671 | 5.53 | 44,050 | 704 | 6.25 | 7.8 | (4.7) | (73) | ||
| Bank and other loans | 60,772 | 1,187 | 7.64 | 52,851 | 832 | 6.16 | 15.0 | 42.7 | 148 | ||
| Subordinated capital notes | 24,639 | 442 | 7.02 | 23,162 | 509 | 8.60 | 6.4 | (13.2) | (158) | ||
| Sale and repurchase agreements and securities loans | 207,243 | 4,067 | 7.68 | 194,462 | 3,477 | 7.00 | 6.6 | 17.0 | 68 | ||
| Interest expense | 993,960 | 13,033 | 5.13 | 887,508 | 10,669 | 4.70 | 12.0 | 22.2 | 43 | ||
Increases in customer deposits continue to reflect our focus on offering innovative products and a client-centric approach for individuals and SMEs. The average balance of demand deposits expanded 4.2%, while the high interest rate environment continued to fuel demand for low-risk term instruments, contributing to a 32.8% rise in the average balance of time deposits. This volume growth, together with higher interest rates, resulted in increases of 49.8% and 8.2% in interest paid on time and demand deposits, respectively.
Finally, the 17.0%, or Ps.590 million, increase in interest expenses on repurchase agreements resulted from the combined effect of a 6.6%, or Ps.12,781 million, increase in the average balance, and a 68 basis points increase in the average interest rate paid.
| | 18 |
Provisions for loan losses & asset quality
During 3Q18, provisions for loan losses amounted to Ps.5,463 million, which represented a decrease of 2.5%, or Ps.140 million YoY, and a 17.1% increase, or Ps.796 million, on a sequential basis.
The year-on-year decrease in loan loss reserves was mainly due to better performance of credit card, consumer, SME and mortgage loan portfolios, despite the shift to higher margin segments. In addition, within the credit card portfolio, certain external channels that targeted the open market were closed, in order to improve the Bank’s asset quality. Asset quality within the commercial loan portfolio also improved, benefiting from the clean-up of legacy positions last year, including homebuilders and some corporate loans.
The sequential increase in loan loss reserves is mainly attributed to the increase in volume of the total loan portfolio, lower percentage of guarantees in SMEs from NAFIN in 3Q18 versus 2Q18, and additional provisions for a specific project finance corporate loan.

| Loan loss reserves | ||||||
|
Million pesos
|
% Variation | |||||
| 3Q18 | 2Q18 | 3Q17 | QoQ | YoY | ||
| Commercial | 1,872 | 1,404 | 1,651 | 33.3 | 13.4 | |
| Consumer | 3,252 | 3,004 | 3,814 | 8.3 | (14.7) | |
| Mortgages | 339 | 259 | 137 | 30.9 | 146.5 | |
| Total | 5,463 | 4,667 | 5,603 | 17.1 | (2.5) | |
| Cost of risk (%) | ||||||
| Variation (bps) | ||||||
| 3Q18 | 2Q18 | 3Q17 | QoQ | YoY | ||
| Commercial | 1.84 | 1.42 | 1.78 | 42 | 6 | |
| Consumer | 12.03 | 11.14 | 14.84 | 89 | (281) | |
| Mortgages | 1.01 | 0.78 | 0.43 | 23 | 58 | |
| Total | 3.37 | 2.94 | 3.72 | 43 | (35) | |
| | 19 |
Non-performing loans at the end of 3Q18 increased YoY by Ps.2,101 million, or 15.2%, to Ps.15,968 million, and decreased Ps.81 million, or 0.5% on a sequential basis. The YoY increase, led to a slightly increase in NPL ratio of 2.35% in 3Q18, increasing 9 basis points from 2.26% in 3Q17, and decreasing 11 basis points compared to the 2.46% ratio reported in 2Q18.
The YoY increase in non-performing loans was mainly due to an increase of 37.4%, or Ps.1,568 million, in commercial loans, due to the aforementioned project finance corporate loan, together with a 15.8% increase, or Ps.813 million, in mortgages. The latter increase was due to a deterioration of Banco Santander México’s variable rate mortgage loan product and to legacy positions of acquired portfolios, including INFONAVIT, partly offset by a 6.2% decrease, or Ps.280 million, in consumer loans (including credit cards), mainly due to aforementioned closing of some external channels for credit card placements.
On a sequential basis, Banco Santander México reported a 0.5% decrease, or Ps.81 million, in non-performing loans, which resulted from decreases in the non-performing loan portfolio of consumer (including credit cards) and mortgages loans of Ps.207 million and Ps.43 million, respectively. The decrease was partly offset by an increase of Ps.169 million in commercial loans.
Commercial loan NPLs rose 22 basis points YoY, due to aforementioned project finance corporate loan. At the same time, mortgage loan NPLs increased 31 basis points YoY and decreased 14 basis points sequentially.
NPLs for the consumer loan portfolio (including credit card) decreased 41 basis points YoY, particularly payroll loans which decreased 171 basis points YoY.
The breakdown of the non-performing loan portfolio is as follows: mortgage loans 37.4%, commercial loans 36.1%, and consumer loans (including credit cards) 26.5%.
| Non-Performing loan ratio (%) | ||||||
| Variation (bps) | ||||||
| Sep-18 | Jun-18 | Sep-17 | QoQ | YoY | ||
| Commercial | 1.33 | 1.37 | 1.11 | (4) | 22 | |
| Individuals | ||||||
| Consumer | 3.87 | 4.09 | 4.28 | (22) | (41) | |
| Credit Card | 4.28 | 4.41 | 4.71 | (13) | (43) | |
| Other consumer | 3.46 | 3.75 | 3.84 | (29) | (38) | |
| Mortgages | 4.31 | 4.45 | 4.00 | (14) | 31 | |
| Total | 2.35 | 2.46 | 2.26 | (11) | 9 | |
The above-mentioned variations to non-performing loans led to a NPL ratio of 2.35% in 3Q18, increasing 9 basis points from 2.26% in 3Q17, and decreasing 11 basis points compared to the 2.46% ratio reported in 2Q18.
The current NPL ratio continues to reflect loan portfolio growth combined with Banco Santander México’s stringent credit scoring model and ongoing monitoring of loan portfolio quality.
Finally, the coverage ratio for the quarter stood at 127.60%, a decrease from 147.41% in 3Q17 and increase from 124.79% in 2Q18.
| | 20 |

Commission and fee income, net
| Commission and fee income, net | |||||||||||||
| Million pesos | % Variation | % Variation | |||||||||||
| 3Q18 | 2Q18 | 3Q17 | QoQ | YoY | 9M18 | 9M17 | 18/17 | ||||||
| Commission and fee income | |||||||||||||
| Debit and credit card | 1,979 | 2,019 | 1,748 | (2.0) | 13.2 | 5,920 | 5,084 | 16.4 | |||||
| Account management | 307 | 304 | 259 | 1.0 | 18.5 | 907 | 760 | 19.3 | |||||
| Collection services | 727 | 728 | 631 | (0.1) | 15.2 | 2,152 | 1,950 | 10.4 | |||||
| Investment funds | 397 | 383 | 361 | 3.7 | 10.0 | 1,174 | 1,085 | 8.2 | |||||
| Insurance | 1,152 | 1,295 | 1,094 | (11.0) | 5.3 | 3,475 | 3,295 | 5.5 | |||||
| Purchase-sale of securities and money market transactions | 122 | 141 | 157 | (13.5) | (22.3) | 374 | 500 | (25.2) | |||||
| Checks trading | 58 | 63 | 64 | (7.9) | (9.4) | 182 | 189 | (3.7) | |||||
| Foreign trade | 308 | 304 | 258 | 1.3 | 19.4 | 937 | 809 | 15.8 | |||||
| Financial advisory services | 281 | 417 | 373 | (32.6) | (24.7) | 992 | 1,101 | (9.9) | |||||
| Other | 328 | 395 | 281 | (17.0) | 16.7 | 1,085 | 848 | 27.9 | |||||
| Total | 5,659 | 6,049 | 5,226 | (6.4) | 8.3 | 17,198 | 15,621 | 10.1 | |||||
| Commission and fee expense | |||||||||||||
| Debit and credit card | (793) | (1,102) | (763) | (28.0) | 3.9 | (2,711) | (2,387) | 13.6 | |||||
| Investment funds | 0 | (1) | 0 | 100.0 | 0.0 | (1) | (1) | 0.0 | |||||
| Insurance | (29) | (30) | (27) | (3.3) | 7.4 | (88) | (80) | 10.0 | |||||
| Purchase-sale of securities and money market transactions | (57) | (34) | (50) | 67.6 | 14.0 | (131) | (143) | (8.4) | |||||
| Checks trading | (7) | (6) | (6) | 16.7 | 16.7 | (21) | (18) | 16.7 | |||||
| Foreign trade | 0 | 0 | 0 | 0.0 | 0.0 | 0 | (13) | 100.0 | |||||
| Financial advisory services | (1) | (1) | (1) | 0.0 | 0.0 | (3) | (3) | 0.0 | |||||
| Other | (501) | (613) | (445) | (18.3) | 12.6 | (1,641) | (1,276) | 28.6 | |||||
| Total | (1,388) | (1,787) | (1,292) | (22.3) | 7.4 | (4,596) | (3,921) | 17.2 | |||||
| | 21 |
| Commission and fee income, net | |||||||||||||
| Debit and credit card | 1,186 | 917 | 985 | 29.3 | 20.4 | 3,209 | 2,697 | 19.0 | |||||
| Account management | 307 | 304 | 259 | 1.0 | 18.5 | 907 | 760 | 19.3 | |||||
| Collection services | 727 | 728 | 631 | (0.1) | 15.2 | 2,152 | 1,950 | 10.4 | |||||
| Investment funds | 397 | 382 | 361 | 3.9 | 10.0 | 1,173 | 1,084 | 8.2 | |||||
| Insurance | 1,123 | 1,265 | 1,067 | (11.2) | 5.2 | 3,387 | 3,215 | 5.3 | |||||
| Purchase-sale of securities and money market transactions | 65 | 107 | 107 | (39.3) | (39.3) | 243 | 357 | (31.9) | |||||
| Checks trading | 51 | 57 | 58 | (10.5) | (12.1) | 161 | 171 | (5.8) | |||||
| Foreign trade | 308 | 304 | 258 | 1.3 | 19.4 | 937 | 796 | 17.7 | |||||
| Financial advisory services | 280 | 416 | 372 | (32.7) | (24.7) | 989 | 1,098 | (9.9) | |||||
| Other | (173) | (218) | (164) | (20.6) | 5.5 | (556) | (428) | 29.9 | |||||
| Total | 4,271 | 4,262 | 3,934 | 0.2 | 8.6 | 12,602 | 11,700 | 7.7 | |||||
In 3Q18, net commission and fee income totaled Ps.4,271 million, increasing 8.6% YoY, or Ps.337 million, and 0.2%, or Ps.9 million, QoQ.
The main contributors to net commissions and fees were credit and debit card fees, which accounted for 27.8% of the total, followed by insurance fees and collection services fees, which accounted for 26.3% and 17.0% of total commissions and fees, respectively.
| Commission and fee income, net | ||||||
| Breakdown (%) | ||||||
| 3Q18 | 2Q18 | 3Q17 | 9M18 | 9M17 | ||
| Debit and credit card | 27.8 | 21.5 | 25.0 | 25.5 | 23.1 | |
| Account management | 7.2 | 7.1 | 6.6 | 7.2 | 6.5 | |
| Collection services | 17.0 | 17.1 | 16.0 | 17.1 | 16.7 | |
| Investment funds | 9.3 | 9.0 | 9.2 | 9.3 | 9.3 | |
| Insurance | 26.3 | 29.7 | 27.1 | 26.9 | 27.5 | |
| Purchase-sale of securities and money market transactions | 1.5 | 2.5 | 2.7 | 1.9 | 3.1 | |
| Checks and others | 1.2 | 1.3 | 1.5 | 1.3 | 1.5 | |
| Foreign trade | 7.2 | 7.1 | 6.6 | 7.4 | 6.8 | |
| Financial advisory services | 6.6 | 9.8 | 9.5 | 7.8 | 9.4 | |
| Others | (4.1) | (5.1) | (4.2) | (4.4) | (3.9) | |
| Total | 100.0 | 100.0 | 100.0 | 100.0 | 100.0 |
Net commissions and fees rose 8.6% YoY in 3Q18, mostly as a result of the following increases:
| i) | 20.4%, or Ps.201 million, increase in debit and credit card fees. Fee income was up 13.2%, supported by strong credit card usage; |
| ii) | 15.2%, or Ps.96 million, increase in collection and payments and a 18.5%, or Ps.48 million, increase in account management, mainly a result of Banco Santander México’s continued focus on being an integral part of its clients’ liquidity management efforts, which led to increased transaction activity; |
| iii) | 5.2%, or Ps.56 million, increase in insurance fees, reflecting higher sales of credit-related insurance. The increase was supported by the new property and casualty insurance product that covers the commercial value of real property, and which is the best mortgage insurance related product in the market; |
| iv) | 19.4%, or Ps.50 million, increase in foreign trade fees, mainly driven by higher volume in the retail segment; and |
| | 22 |
| v) | 10.0%, or Ps.36 million, increase in investment funds, due to higher interest rates. |
These positive contributions to net commissions and fees were partly offset by the following decreases:
| i) | 24.7%, or Ps.92 million, decrease in financial advisory services, due to fewer transactions in the market; and |
| ii) | 39.3%, or Ps.42 million, decrease in purchase-sales of securities and money market transactions, mainly a result of a slowdown in corporate activity. |
Net gain (loss) on financial assets and liabilities
| Net gain (loss) on financial assets and liabilities | |||||||||||
| Million pesos | % Variation | % Variation | |||||||||
| 3Q18 | 2Q18 | 3Q17 | QoQ | YoY | 9M18 | 9M17 | 18/17 | ||||
| Valuation | |||||||||||
| Foreign exchange | (246) | 587 | 5,833 | (141.9) | (104.2) | 329 | 4,633 | (92.9) | |||
| Derivatives | 1,753 | 3,435 | 1,435 | (49.0) | 22.2 | 7,855 | 2,839 | 176.7 | |||
| Equity securities | (278) | 520 | (29) | (153.5) | 858.6 | 328 | (39) | 941.0 | |||
| Debt instruments | (145) | (64) | 139 | 126.6 | (204.3) | (1,348) | (139) | 869.8 | |||
| Valuation result | 1,084 | 4,478 | 7,378 | (75.8) | (85.3) | 7,164 | 7,294 | (1.8) | |||
| Purchase / sale of securities | |||||||||||
| Foreign exchange | 388 | (220) | (5,766) | 276.4 | 106.7 | 447 | (4,901) | 109.1 | |||
| Derivatives | (1,197) | (3,227) | (1,392) | (62.9) | (14.0) | (6,346) | (897) | 607.5 | |||
| Equity securities | 355 | 391 | (17) | (9.2) | 2,188.2 | 872 | 42 | 1,976.2 | |||
| Debt instruments | 213 | (373) | 108 | 157.1 | 97.2 | 43 | 821 | (94.8) | |||
| Purchase -sale result | (241) | (3,429) | (7,067) | (93.0) | (96.6) | (4,984) | (4,935) | 1.0 | |||
| Total | 843 | 1,049 | 311 | (19.6) | 171.1 | 2,180 | 2,359 | (7.6) | |||
In 3Q18, Banco Santander México reported a Ps.843 million net gain from financial assets and liabilities, which compares with gains of Ps.311 million in 3Q17 and Ps.1,049 million in 2Q18.
The Ps.843 million net gain from financial assets and liabilities in the quarter is mostly a result of:
| i) | A Ps.1,084 million valuation gain, which resulted from gains of Ps.1,753 million in derivative instruments. This gain was partly offset by a loss of Ps.278 million, Ps.246 million and Ps.145 million in equity securities, foreign exchange and debt instruments, respectively; and |
| ii) | A Ps.241 million purchase-sale loss, principally related to a loss of Ps.1,197 million in derivative instruments. This loss was partly offset by a gain of Ps.388 million, Ps.355 million and Ps.213 million, in foreign exchange instruments, equity securities and debt instruments, respectively. |
| | 23 |
Other operating income
| Other operating income | |||||||||||
| Million pesos | % Variation | % Variation | |||||||||
| 3Q18 | 2Q18 | 3Q17 | QoQ | YoY | 9M18 | 9M17 | 18/17 | ||||
| Recovery of previously written-off loans | 674 | 694 | 530 | (2.9) | 27.2 | 2,181 | 1,991 | 9.5 | |||
| Cancellation of liabilities and reserves | 109 | 112 | 78 | (2.7) | 39.7 | 343 | 241 | 42.3 | |||
| Interest on personnel loans | 71 | 71 | 67 | 0.0 | 6.0 | 212 | 191 | 11.0 | |||
| Allowance for losses on foreclosed assets | (28) | (20) | (28) | (40.0) | 0.0 | (75) | (68) | 10.3 | |||
| Profit from sale of foreclosed assets | 27 | 28 | 20 | (3.6) | 35.0 | 70 | 94 | (25.5) | |||
| Technical advisory services | 10 | 52 | 7 | (80.8) | 42.9 | 66 | 23 | 187.0 | |||
| Portfolio recovery legal expenses and costs | (350) | (345) | (302) | 1.4 | 15.9 | (1,061) | (910) | 16.6 | |||
| Write-offs | (335) | (212) | (163) | 58.0 | 105.5 | (910) | (479) | 90.0 | |||
| Income from sale of loan portfolio | 0 | (12) | 0 | 100.0 | 0.0 | (19) | (635) | (97.0) | |||
| Provision for legal and tax contingencies | (93) | (189) | (67) | (50.8) | 38.8 | (418) | (94) | 344.7 | |||
| Others | 49 | 65 | 97 | (24.6) | (49.5) | 181 | 269 | (32.7) | |||
| Total | 134 | 244 | 239 | (45.1) | (43.9) | 570 | 623 | (8.5) | |||
Other income in 3Q18 totaled Ps.134 million, down from Ps.239 million in 3Q17 and the Ps.244 million reported in 2Q18.
The 43.9%, or Ps.105 million YoY decrease in other income in 3Q18 was mainly driven by higher write-offs of Ps.172 million, an increase in legal costs and expenses related to portfolio recoveries of Ps.48 million, and an increase in provisions for legal and tax contingencies of Ps.26 million. The decrease was partly offset by higher recoveries of previously written-off loans of Ps.144 million.
On a sequential basis, the 45.1% decrease, or Ps.110 million, in other income, was mainly driven by higher write-offs of Ps.123 million and by lower recoveries of previously written-off loans of Ps.20 million. These were partly offset by lower provisions for legal and tax contingencies.
| | 24 |
Administrative and promotional expenses
Administrative and promotional expenses consist of personnel costs such as payroll and benefits, promotion and advertising expenses, and other general expenses. Personnel expenses consist mainly of salaries, social security contributions, bonuses and our long-term incentive plan for the Bank’s executives. Other general expenses are mainly related to technology and systems, administrative services - mainly outsourced in the areas of information technology - taxes and duties, professional fees, contributions to IPAB, rental of properties and hardware, advertising and communication, surveillance and cash courier services and expenses related to maintenance, conservation and repair, among others.
| Administrative and promotional expenses | |||||||||||
| Million pesos | % Variation | % Variation | |||||||||
| 3Q18 | 2Q18 | 3Q17 | QoQ | YoY | 9M18 | 9M17 | 18/17 | ||||
| Salaries and employee benefits | 4,096 | 3,889 | 3,409 | 5.3 | 20.2 | 11,602 | 9,957 | 16.5 | |||
| Credit card operation | 80 | 81 | 86 | (1.2) | (7.0) | 232 | 262 | (11.5) | |||
| Professional fees | 414 | 243 | 275 | 70.4 | 50.5 | 893 | 574 | 55.6 | |||
| Leasehold | 536 | 581 | 506 | (7.7) | 5.9 | 1,706 | 1,505 | 13.4 | |||
| Promotional and advertising expenses | 141 | 247 | 304 | (42.9) | (53.6) | 607 | 746 | (18.6) | |||
| Taxes and duties | 365 | 474 | 299 | (23.0) | 22.1 | 1,263 | 1,077 | 17.3 | |||
| Technology services (IT) | 780 | 721 | 742 | 8.2 | 5.1 | 2,210 | 2,203 | 0.3 | |||
| Depreciation and amortization | 708 | 738 | 632 | (4.1) | 12.0 | 2,141 | 1,850 | 15.7 | |||
| Contributions to IPAB | 796 | 778 | 705 | 2.3 | 12.9 | 2,316 | 2,147 | 7.9 | |||
| Securities transferring | 256 | 337 | 204 | (24.0) | 25.5 | 828 | 650 | 27.4 | |||
| Others | 831 | 756 | 736 | 9.9 | 12.9 | 2,268 | 2,058 | 10.2 | |||
| Total | 9,003 | 8,845 | 7,898 | 1.8 | 14.0 | 26,066 | 23,029 | 13.2 | |||
Banco Santander México’s administrative and promotional expenses are broken down as follows:
| Administrative and promotional expenses | ||||||
| Breakdown (%) | ||||||
| 3Q18 | 2Q18 | 3Q17 | 9M18 | 9M17 | ||
| Salaries and employee benefits | 45.5 | 44.0 | 43.2 | 44.5 | 43.2 | |
| Credit card operation | 0.9 | 0.9 | 1.1 | 0.9 | 1.1 | |
| Professional fees | 4.6 | 2.7 | 3.5 | 3.4 | 2.5 | |
| Leasehold | 6.0 | 6.6 | 6.4 | 6.5 | 6.5 | |
| Promotional and advertising expenses | 1.6 | 2.8 | 3.8 | 2.3 | 3.2 | |
| Taxes and duties | 4.1 | 5.4 | 3.8 | 4.8 | 4.7 | |
| Technology services (IT) | 8.7 | 8.2 | 9.4 | 8.5 | 9.6 | |
| Depreciation and amortization | 7.9 | 8.3 | 8.0 | 8.2 | 8.0 | |
| Contributions to IPAB | 8.8 | 8.8 | 8.9 | 8.9 | 9.3 | |
| Securities transferring | 2.8 | 3.8 | 2.6 | 3.2 | 2.8 | |
| Others | 9.1 | 8.5 | 9.3 | 8.8 | 9.1 | |
| Total | 100.0 | 100.0 | 100.0 | 100.0 | 100.0 | |
Administrative and promotional expenses in 3Q18 totaled Ps.9,003 million, compared to Ps.7,898 million in 3Q17 and Ps.8,845 million in 2Q18, increasing 14.0% YoY and 1.8% QoQ, respectively. These increases reflect the execution of the Bank’s investment plan and commercial initiatives to achieve the goal of becoming clients’ primary bank and Mexico’s market leader in sustainable, profitable growth.
| | 25 |
The 14.0% YoY rise in administrative and promotional expenses was mainly due to the following increases:
| i) | 20.2%, or Ps.687 million, in salaries and employee benefits. This increase was mainly due to increased headcount, principally in the areas of middle-market, SMEs, financial inclusion and in personal who support the retail franchise; |
| ii) | 50.5%, or Ps.139 million, in professional fees; |
| iii) | 12.9%, or Ps.91 million, in contributions to IPAB; |
| iv) | 12.0%, or Ps.76 million, in depreciation and amortization; |
| v) | 22.1%, or Ps.66 million, in taxes and duties; |
| vi) | 25.5%, or Ps.52 million, in securities transferring; and |
| vii) | 5.1%, or Ps.38 million, in technology services. |
The efficiency ratio for the quarter rose 60 basis points YoY and decrease 68 basis points QoQ reaching 42.78%, impacted by the execution of the Bank’s investment plan.
The recurrence ratio for 3Q18 was 51.49%, down from 54.14% in 3Q17 and 108 basis points lower than the 52.57% reported in 2Q18.

Profit before taxes
Profit before taxes in 3Q18 was Ps.6,577 million, reflecting an increase of 25.9% YoY and a decrease of 3.8% QoQ.
Income taxes
In 3Q18, Banco Santander México reported a tax expense of Ps.1,481 million compared to tax expenses of Ps.1,147 million in 3Q17 and Ps.1,667 million in 2Q18. The effective tax rate for the quarter was 22.52%, compared to 21.95% reported in 3Q17 and 24.38% in 2Q18.
| | 26 |

Capitalization and liquidity
| Capitalization | ||||||
| Million pesos | Sep-18 | Jun-18 | Sep-17 | |||
| CET1 | 85,318 | 81,161 | 81,669 | |||
| Tier 1 | 94,661 | 90,987 | 90,730 | |||
| Tier 2 | 24,448 | 26,088 | 23,812 | |||
| Total Capital | 119,109 | 117,074 | 114,542 | |||
| Risk-weighted assets | ||||||
| Credit risk | 559,555 | 556,824 | 540,165 | |||
| Credit, market and operational risk | 743,422 | 754,412 | 707,392 | |||
| Credit risk ratios: | ||||||
| CET1 (%) | 15.25 | 14.58 | 15.12 | |||
| Tier 1 (%) | 16.92 | 16.34 | 16.80 | |||
| Tier 2 (%) | 4.37 | 4.69 | 4.41 | |||
| Capitalization ratio (%) | 21.29 | 21.03 | 21.20 | |||
| Total capital ratios: | ||||||
| CET1 (%) | 11.48 | 10.76 | 11.55 | |||
| Tier 1 (%) | 12.73 | 12.06 | 12.83 | |||
| Tier 2 (%) | 3.29 | 3.46 | 3.37 | |||
| Capitalization ratio (%) | 16.02 | 15.52 | 16.19 |
Banco Santander México’s capital ratio at the end of 3Q18 was 16.02%, compared to 16.19% and 15.52% at the end of 3Q17 and 2Q18, respectively. The 16.02% capital ratio was comprised of 11.48% of fundamental capital (CET1), 1.25% additional capital (AT1) and 3.29% complementary capital (Tier 2).
During the quarter we issued a 10-year Tier 2 subordinated preferred capital note for a total of 1.3 billion dollars. The Bank’s parent company purchased 75% of the issuance. This transaction, was the first international issuance after the Mexican presidential elections, showed strong demand that allowed us to obtain an adequate pricing for our capital base.
Simultaneously, the Bank announced a cash tender offer for outstanding Tier 2 subordinated preferred capital notes due 2024. Existing holders tendered 94.07% of the existing notes.
Both offers were announced during the quarter, but their settlement date was on October 1, 2018.
| | 27 |
As of August 2018, Banco Santander México was classified in Category 1, in accordance with Article 134 bis of the Mexican Banking Law, and remains in this category per the preliminary results dated September 30, 2018, which is the most recent available analysis.
Liquidity coverage ratio (LCR)
Pursuant to the regulatory requirements of Banxico and the Mexican National Banking and Securities Commission (Comisión Nacional Bancaria y de Valores, or “CNBV”), the average Liquidity Coverage Ratio (LCR or CCL by its Spanish acronym) for 3Q18 was 141.45%, compared to 149.26% in 3Q17 and 166.89% in 2Q18. (Please refer to note 24 of this report).
Leverage ratio
In accordance with CNBV regulatory requirements, effective June 14th, 2016, the leverage ratio for September 2018 was 7.10%, 6.89% for June 2018, 7.37% for March 2018, 7.03% for December 2017 and 7.63% for September 2017.
This ratio is based on regulatory guidelines established in the following way: the result of dividing the core capital of conformity with Article 2 Bis 6 (CUB) between adjusted assets in conformity with Article 1, II (CUB).
| | 28 |
RELEVANT EVENTS, TRANSACTIONS AND ACTIVITIES
Relevant Events
Change of corporate name
On October 10, 2018, a modification in the Bank’s corporate name was duly approved such that, from that date, the Bank will be called Banco Santander México, S, A., Institución de Banca Múltiple, Grupo Financiero Santander México. The modification consisted of eliminating the parentheses around the word Mexico.
Settlement of Tier 2 Notes due 2028 in the amount of U.S.$1.3 billion
On October 1, 2018,, Banco Santander México announced the settlement of its 5.950% Tier 2 subordinated preferred capital notes due 2028 (the "Notes") for a total of U.S.$1.3 billion, meeting the capital requirements under Basel III criteria for complementary capital/Tier 2. Banco Santander, S.A. (Spain), the parent company of Banco Santander México, purchased U.S.$975 million, or 75%, of these Notes.
The Notes were offered in the United States of America through a private placement to qualified institutional buyers, in accordance with Rule 144A under the U.S. Securities Act of 1933, as amended (the "Securities Act"), and outside the United States America, in accordance with Regulation S under the Securities Act.
Expiration of cash tender offer for Tier 2 Notes due 2024
On September 26, 2018, Banco Santander México announced the expiration of its previously announced cash tender offer (the “Tender Offer”) for any and all of its outstanding 5.95% Tier 2 subordinated preferred capital notes due 2024 (the “2024 Notes”).
Approximately U.S.$1,221,907,000 in aggregate principal amount of the 2024 Notes subject to the Tender Offer were validly tendered and not validly withdrawn on September 26, 2018, and an additional U.S.$1,000,000 in aggregate principal amount of the 2024 Notes were submitted pursuant to Notice of Guaranteed Delivery procedures.
Banco Santander México settled the 2024 Notes on October 1, 2018.
Extraordinary General Shareholders’ Meeting
On September 10, 2018, Banco Santander México held an Extraordinary General Shareholders’ Meeting where, among other matters, shareholders acknowledged that, on October 26, 2011, the Bank’s Board of Directors approved a limit for the issuance of up to $6.5 billion U.S. dollars of debt.
Further, the shareholders approved a resolution authorizing the Bank to issue subordinated preferred debt that qualified as complementary capital (Tier 2 capital) under capitalization rules in Mexico. The debt would be issued in accordance with the requirements of Annex 1-S and other applicable provisions of the General Provisions Applicable to Credit Institutions (las Disposiciones de Carácter General Aplicables a las Instituciones de Crédito), and with the Circular 3/2012 of Banco de México, and might be issued in Mexico and/or abroad for up to $1.3 billion U.S. dollars or the equivalent in pesos.
Special Shareholders’ Meeting
On July 24, 2018, Banco Santander México held a Special Shareholders’ Meeting and approved members who comprise the Board of Directors listed below:
| Series “F” Non Independent Directors | |
| Marcos Alejandro Martínez Gavica | Chairman |
| Héctor Blas Grisi Checa | Director |
| Rodrigo Echenique Gordillo | Director |
| Francisco Javier García-Carranza Benjumea | Director |
| Rodrigo Brand de Lara | Alternate Director |
| Ángel Rivera Congosto | Alternate Director |
| Didier Mena Campos | Alternate Director |
| Series “F” Independent Directors | |
| Guillermo Güemez García | Director |
| Guillermo Jorge Quiroz Abed | Director |
| | 29 |
| Juan Ignacio Gallardo Thurlow | Alternate Director |
| Eduardo Carredano Fernández | Alternate Director |
| Gina Lorenza Diez Barroso Azcárraga | Alternate Director |
| Series “B” Independent Directors | |
| Antonio Purón Mier y Terán | Director |
| Fernando Benjamín Ruíz Sahagún | Director |
| Alberto Torrado Martínez | Director |
| Joaquín Vargas Guajardo | Director |
| Jesús Federico Reyes Heroles González Garza | Alternate Director |
| Enrique Krauze Kleinbort | Alternate Director |
| Guillermo Francisco Vogel Hinojosa | Alternate Director |
| María de Lourdes Melgar Palacios | Alternate Director |
Relevant Activities
New Transactional Electronic Banking platform for companies
On October 9, 2018, Banco Santander Mexico announced the launch of its new Transactional Electronic Banking platform for companies. This platform offers enhanced safety and simpler and optimized processes to improve the experience of customers in the SME, Middle Market, Institutions, and Corporate & Investment Banking segments.
Launch of digital loans for SMEs
On September 27, 2018, Banco Santander Mexico launched two new types of digital loans for SMEs that offer attractive terms, and that are available through two products: Crédito Simple and Crédito Ágil. With this, the Bank has accelerated the approval process for SME customers to 60 minutes from 48 hours, and plans to grant loans of up to Ps.2,800 million.
Opening of Sucursal Ágil, a new branch model
On September 17, 2018, Banco Santander Mexico announced the launch of Sucursal Ágil, a new branch concept which aims to be a comprehensive service center for processing large quantities of money and operational transactions to improve the customer experience and reducing overcrowding in branches.
New option for Super Wallet allows easy payments with reward points
On September 12, 2018, Banco Santander Mexico launched new and simple functionality for Super Wallet that allows customers to redeem reward points and make purchases with them.
Alliance with Peugeot Mexico’s car brand
On August 23, 2018, Banco Santander México, as part of its Super Auto initiative, announced an alliance with Peugeot Mexico’s car brand, becoming the main financial partner in granting automotive loans to the brand’s customers. This commercial offer includes a convenient initial deposit, no penalty for advance payments, fixed interest rates, terms up to 72 months, direct debit payments and a minimum requirements contract.
Launch of Súper Auto loan
On August 15, 2018, Banco Santander México, as part of its strategic plan, launched Súper Auto, a loan for purchasing cars and motorcycles at competitive rates, which targets individuals (customers and non-customers). Through this product, the Bank enters automotive financing with a platform for origination and quotation that is 100% digital, making it distinct from other products in the market.
Solicitud Contrato Agro for retailers and agribusiness
On August 9, 2018, Banco Santander México announced the launch of Solicitud Contrato Agro, a contract for food retailers and agribusinesses. It improves the formalization of processes and promotes food retail and agricultural loans in the SME segment.
| | 30 |
Relevant Transactions
Structuring agent in loan refinancing for Operadora de Infraestructura Especializada de Guanajuato (OIEGSA)
Banco Santander México participated as structuring agent in a loan refinancing for Operadora de Infraestructura Especializada de Guanajuato (OIEGSA). The Bank contributed Ps.1,496 million out of a total loan of Ps.6,530 million. The loan has a 15-year term and a variable rate.
SUSTAINABILITY AND SOCIAL RESPONSIBILITY
More than 500 homes delivered to victims of earthquakes in Mexico
As of the third quarter, Banco Santander México, along with the civil associations Fideicomiso Provivah and Reforestamos México, had delivered more than 500 homes and restored nine classrooms, benefiting approximately 5,800 victims of last year’s earthquakes in México. These charitable actions were undertaken as part of initiatives implemented to help people with the rebuilding and construction of their homes in the six states of the country most affected by the earthquakes.
XIII Santander’s Award for Business Innovation Edition
On September 13, 2018, Banco Santander México celebrated the XIII Santander’s Award for Business Innovation Edition, which had a total of 1,326 registered projects from public and private universities throughout México. The initiative is supported by the Ministry of Public Education and the leading Mexican business sector organization (Consejo Coordinador Empresarial), among other associations and institutions of higher education. All of these organizations collaborate through Universia and Santander Universidades programs, which are part of the Bank's social commitment.
ISO 14001 environmental re-certification, 2015 version
On August 10, 2018, Banco Santander México achieved environmental re-certification under the international standard ISO 14001: 2015, which it has been held since 2004. The certification is issued by the Spanish Association for Standardization and Certification Company (AENOR) reflects full adherence to the ISO 14001: 2015 standard, and recognizes the Bank's Environmental Management System (EMS). The Bank’s main buildings in the state of Querétaro received this certification in 2018, in addition to the re-certification of the corporate building in Santa Fe, Mexico City.
For more information on Banco Santander México – Sustainable and Socially Responsible Company: https://servicios.santander.com.mx/comprometidos/
| | 31 |
CREDIT RATINGS
On August 14, 2018, Fitch Ratings updated its full report of Banco Santander México.
On July 23, 2018, Fitch Ratings affirmed all Banco Santander México ratings. The rating outlook is stable. On the same date, Fitch Ratings affirmed Santander Consumo ratings.
| Banco Santander México | Fitch Ratings | Moody’s | |
| Global scale | |||
| Foreign currency | |||
| Long term | BBB+ | A3 | |
| Short term | F2 | P-2 | |
| Local currency | |||
| Long term | BBB+ | A3 | |
| Short Term | F2 | P-2 | |
| National scale | |||
| Long term | AAA(mex) | Aaa.mx | |
| Short Term | F1+(mex) | Mx-1 | |
| Rating viability (VR) | bbb+ | N/A | |
| Support | 2 | N/A | |
| Counterparty risk Assessments (CR) | |||
| Long Term | N/A | A2 (cr) | |
| Short Term | N/A | P-1 (cr) | |
| Standalone BCA | N/A | baa2 | |
| Standalone Adjusted BCA | N/A | baa1 | |
| Outlook | Stable | Stable | |
| International Issuances | |||
| Tier 2 Subordinated Capital Notes due 2024 | BBB- | Baa3 | |
| Long-term senior unsecured global notes due 2022 | BBB+ | A3 | |
| Last publication: | 14-Aug-18 | 4-Jun-18 | |
| Perpetual Subordinated Non-Preferred Contingent Convertible Additional Tier 1 Capital Notes (AT1) | |||
| Global Scale | |||
| Foreign currency | |||
| Long term | BB | Ba1 (hyb) | |
| Local currency | |||
| Long term | N/A | Ba1(hyb) | |
| National scale | |||
| Long term | N/A | A1.mx (hyb) | |
| Last publication: | 14-Aug-18 | 4-Jun-18 |
| | 32 |
| Santander Consumo | Fitch Ratings | ||
| National Scale | |||
| Long term | AAA (mex) | ||
| Short Term | F1+ (mex) | ||
| Outlook | Stable | ||
| Last publication: | 14-Aug-18 |
Notes:
§ BCA = Baseline Credit Assessment
§ SR = Support Rating
§ VR = Viability Rating
§ SCP = Standalone Credit Profile
§ CR= Counterparty Risk Assessments
N/A = Not applicable
| | 33 |
3Q18 EARNINGS CALL DIAL-IN INFORMATION
| Date: | Wednesday, October, 31st, 2018 |
| Time: | 8:00 a.m. (MCT); 10:00 a.m. (US ET) |
| Dial-in Numbers: | 1-877-407-4018 US & Canada 1-201-689-8471 International & Mexico |
| Access Code: | Please ask for Santander México Earnings Call |
| Webcast: | http://public.viavid.com/index.php?id=131540 |
| Replay: | Starting: Wednesday, October 31st, 2018 at 1:00 p.m. (US ET) |
| Ending: Wednesday, November 7th, 2018 at 11:59 p.m. (US ET) | |
| ET Dial-in number: 1-844-512-2921 US & Canada; 1-412-317-6671 International & Mexico Access Code: 13683705 |
ANALYST COVERAGE
Actinver, Bank of America Merrill Lynch, Barclays, BBVA, Bradesco, Brasil Plural, Banco BTG Pactual, Citi, Credit Suisse, GBM, Goldman Sachs, HSBC, Invex, Itaú, JP Morgan, Morgan Stanley, Nau Securities, Scotiabank, Signum Research and UBS.
Santander México is covered by the aforementioned analysts. Please note that any opinions, estimates or forecasts regarding the performance of Santander México issued by these analysts reflect their own views, and therefore do not represent the opinions, estimates or forecasts of Santander México or its management. Although Santander México may refer to or distribute such statements, this does not imply that Santander México agrees with or endorses any information, conclusions or recommendations included therein.
DEFINITION OF RATIOS
ROAE: Annualized net income divided by average equity
Efficiency: Annualized administrative and promotional expenses divided by annualized gross operating income (before administrative and promotional expenses and allowances).
Recurrency: Annualized net fees divided by annualized administrative and promotional expenses (net of amortizations and depreciations).
NIM: Financial margin divided by daily average interest earnings assets.
Cost of risk: Annualized provisions for loan losses divided by average loan portfolio
| Note: |
Annualized figures consider
| · | Quarterly ratio = 3Q18x4 |
| · | Average figures are calculated using 3Q17 and 3Q18 |
| | 34 |
ABOUT BANCO SANTANDER MÉXICO (NYSE: BSMX; BMV: BSMX)
Banco Santander México, S.A., Institución de Banca Múltiple, Grupo Financiero Santander México (Banco Santander México), one of Mexico’s leading banking institutions, provides a wide range of financial and related services, including retail and commercial banking, financial advisory and other related investment activities. Banco Santander México offers a multichannel financial services platform focused on mid- to high-income individuals and small- to medium-sized enterprises, while also providing integrated financial services to larger multinational companies in Mexico. As of September 30, 2018, Banco Santander México had total assets of Ps.1,375 billion under Mexican Banking GAAP and more than 16.4 million customers. Headquartered in Mexico City, the Company operates 1,385 branches and offices nationwide and has a total of 18,629 employees.
We, the undersigned under oath to tell the truth declare that, in the area of our corresponding functions, we prepared the information of Banco Santander México contained in this quarterly report, which to the best of our knowledge reasonably reflects its situation.
| HÉCTOR B. GRISI CHECA | DIDIER MENA CAMPOS | |
| Executive President and Chief Executive Officer | Chief Financial Officer | |
| EMILIO DE EUSEBIO SAIZ | JUAN CARLOS GARCÍA CONTRERAS | JUAN RAMÓN JIMÉNEZ LORENZO |
| Deputy General Director Financial Accounting and Control | Executive Director Financial Controller | Chief Audit Executive |
The financial information presented in this report has been obtained from the non-audited financial statements prepared in accordance with accounting principles and regulations prescribed by the CNBV applicable to Credit Institution which are subject to the supervision of the CNBV on accounting procedures, published in the Federal Official Gazette on January 31st, 2011. The exchange rate used to convert foreign currency transactions US$ to Mexican pesos is Ps.18.7231.
INVESTOR RELATIONS CONTACT
Héctor Chávez Lopez – Managing Director - IRO
+ 52 (55) 5269-1925
Investor Relations Team
www.santander.com.mx
| | 35 |
LEGAL DISCLAIMER
Banco Santander México cautions that this presentation may contain forward-looking statements within the meaning of the U.S. Private Securities Litigation Reform Act of 1995. These forward-looking statements could be found in various places throughout this presentation and include, without limitation, statements regarding our intent, belief, targets or current expectations in connection with: asset growth and sources of funding; growth of our fee-based business; expansion of our distribution network; financing plans; competition; impact of regulation and the interpretation thereof; action to modify or revoke our banking license; exposure to market risks including interest rate risk, foreign exchange risk and equity price risk; exposure to credit risks including credit default risk and settlement risk; projected capital expenditures; capitalization requirements and level of reserves; investment in our information technology platform; liquidity; trends affecting the economy generally; and trends affecting our financial condition and our results of operations. While these forward-looking statements represent our judgment and future expectations concerning the development of our business, many important factors could cause actual results to differ substantially from those anticipated in forward-looking statements. These factors include, among other things: changes in capital markets in general that may affect policies or attitudes towards lending to Mexico or Mexican companies; changes in economic conditions, in Mexico in particular, in the United States or globally; the monetary, foreign exchange and interest rate policies of the Mexican Central Bank (Banco de México); inflation; deflation; unemployment; unanticipated turbulence in interest rates; movements in foreign exchange rates; movements in equity prices or other rates or prices; changes in Mexican and foreign policies, legislation and regulations; changes in requirements to make contributions to, for the receipt of support from programs organized by or requiring deposits to be made or assessments observed or imposed by, the Mexican government; changes in taxes and tax laws; competition, changes in competition and pricing environments; our inability to hedge certain risks economically; economic conditions that affect consumer spending and the ability of customers to comply with obligations; the adequacy of allowance for impairment losses and other losses; increased default by borrowers; our inability to successfully and effectively integrate acquisitions or to evaluate risks arising from asset acquisitions; technological changes; changes in consumer spending and saving habits; increased costs; unanticipated increases in financing and other costs or the inability to obtain additional debt or equity financing on attractive terms; changes in, or failure to comply with, banking regulations or their interpretation; and certain other risk factors included in our annual report on Form 20-F. The risk factors and other key factors that we have indicated in our past and future filings and reports, including those with the U.S. Securities and Exchange Commission, could adversely affect our business and financial performance. The words “believe,” “may,” “will,” “aim,” “estimate,” “continue,” “anticipate,” “intend,” “expect,” “forecast” and similar words are intended to identify forward-looking statements. You should not place undue reliance on such statements, which speak only as of the date they were made. We undertake no obligation to update publicly or to revise any forward-looking statements after we distribute this presentation because of new information, future events or other factors. In light of the risks and uncertainties described above, the future events and circumstances discussed herein might not occur and are not guarantees of future performance.
Note: The information contained in this presentation is not audited. Nevertheless, the consolidated accounts are prepared on the basis of the accounting principles and regulations prescribed by the Mexican National Banking and Securities Commission (Comisión Nacional Bancaria y de Valores) for credit institutions, as amended (Mexican Banking GAAP). All figures presented are in millions of Mexican pesos, unless otherwise indicated. Historical figures are not adjusted by inflation.
| | 36 |
CONSOLIDATED FINANCIAL STATEMENTS
Banco Santander México
§ Consolidated balance sheet
§ Consolidated income statement
§ Consolidated statement of changes in total equity
§ Consolidated statement of cash flows
The information contained in this report and the financial statements of the Bank subsidiaries may be consulted on the Internet website: www.santander.com.mx or through the following direct access:
http://www.santander.com.mx/ir/english/financial/quarterly.html
There is also information on Santander México on the CNBV website: https://www.gob.mx/cnbv
| | 37 |
| Consolidated balance sheet | ||||||||
| Million pesos | ||||||||
| 2018 | 2017 | |||||||
| Sep | Jun | Mar | Dec | Sep | Jun | Mar | ||
| Assets | ||||||||
| Funds available | 71,557 | 114,978 | 89,137 | 87,409 | 92,316 | 82,197 | 94,473 | |
| Margin accounts | 2,444 | 3,767 | 2,812 | 2,708 | 3,036 | 3,603 | 2,741 | |
| Investment in securities | 338,954 | 288,369 | 275,640 | 325,369 | 302,720 | 285,339 | 321,258 | |
| Trading securities | 142,546 | 142,468 | 102,458 | 149,089 | 133,101 | 121,481 | 169,957 | |
| Securities available for sale | 185,609 | 135,176 | 162,526 | 165,688 | 159,049 | 152,472 | 139,987 | |
| Securities held to maturity | 10,799 | 10,725 | 10,656 | 10,592 | 10,570 | 11,386 | 11,314 | |
| Debtors under sale and repurchase agreements | 31,850 | 44,757 | 38,500 | 5,472 | 5,547 | 24,786 | 4,930 | |
| Derivatives | 153,190 | 174,983 | 149,144 | 181,667 | 138,851 | 140,887 | 155,764 | |
| Trading purposes | 142,445 | 158,658 | 137,593 | 166,551 | 124,599 | 126,019 | 141,125 | |
| Hedging purposes | 10,745 | 16,325 | 11,551 | 15,116 | 14,252 | 14,868 | 14,639 | |
| Valuation adjustment for hedged financial assets | (10) | (11) | (4) | (36) | 0 | 3 | (16) | |
| Performing loan portfolio | ||||||||
| Commercial loans | 426,351 | 402,745 | 386,451 | 375,177 | 374,587 | 354,992 | 351,639 | |
| Commercial or business activity | 344,354 | 332,930 | 323,025 | 309,341 | 306,686 | 294,325 | 287,596 | |
| Financial entities loans | 17,274 | 13,567 | 13,437 | 16,550 | 13,951 | 10,931 | 13,894 | |
| Government entities loans | 64,723 | 56,248 | 49,989 | 49,286 | 53,950 | 49,736 | 50,149 | |
| Consumer loans | 105,232 | 104,354 | 102,715 | 102,070 | 101,077 | 98,826 | 96,064 | |
| Mortgage loans | 132,569 | 129,103 | 126,484 | 124,952 | 123,731 | 122,601 | 123,071 | |
| Medium and residential | 116,915 | 113,520 | 111,257 | 110,283 | 109,174 | 107,762 | 107,650 | |
| Social interest | 63 | 72 | 83 | 93 | 105 | 118 | 134 | |
| Credits acquired from INFONAVIT or FOVISSSTE | 15,591 | 15,511 | 15,144 | 14,576 | 14,452 | 14,721 | 15,287 | |
| Total performing loan portfolio | 664,152 | 636,202 | 615,650 | 602,199 | 599,395 | 576,419 | 570,774 | |
| Non-performing loan portfolio | ||||||||
| Commercial loans | 5,763 | 5,594 | 5,327 | 5,338 | 4,195 | 4,541 | 5,593 | |
| Commercial or business activity | 5,763 | 5,594 | 5,327 | 5,338 | 4,195 | 4,541 | 5,593 | |
| Consumer loans | 4,239 | 4,446 | 4,156 | 4,794 | 4,519 | 4,171 | 3,850 | |
| Mortgage loans | 5,966 | 6,009 | 5,866 | 5,540 | 5,153 | 4,779 | 4,494 | |
| Medium and residential | 4,797 | 4,922 | 4,897 | 4,762 | 4,376 | 4,032 | 3,763 | |
| Social interest | 12 | 14 | 15 | 18 | 18 | 18 | 17 | |
| Credits acquired from INFONAVIT or FOVISSSTE | 1,157 | 1,073 | 954 | 760 | 759 | 729 | 714 | |
| Total non-performing portfolio | 15,968 | 16,049 | 15,349 | 15,672 | 13,867 | 13,491 | 13,937 | |
| Total loan portfolio | 680,120 | 652,251 | 630,999 | 617,871 | 613,262 | 589,910 | 584,711 | |
| Allowance for loan losses | (20,375) | (20,027) | (19,874) | (20,051) | (20,441) | (20,194) | (19,899) | |
| Loan portfolio (net) | 659,745 | 632,224 | 611,125 | 597,820 | 592,821 | 569,716 | 564,812 | |
| Accrued income receivable from securitization transactions | 125 | 123 | 123 | 121 | 119 | 117 | 118 | |
| Other receivables (net) | 83,641 | 85,393 | 87,424 | 87,562 | 68,245 | 69,292 | 91,223 | |
| Foreclosed assets (net) | 291 | 332 | 455 | 472 | 520 | 464 | 482 | |
| Property, furniture and fixtures (net) | 6,709 | 6,426 | 6,360 | 6,498 | 5,677 | 5,598 | 5,582 | |
| Long-term investment in shares | 90 | 90 | 91 | 91 | 91 | 90 | 125 | |
| Deferred taxes and deferred profit sharing (net) | 18,672 | 19,187 | 19,561 | 20,050 | 18,086 | 19,180 | 19,164 | |
| Deferred charges, advance payments and intangibles | 7,990 | 7,948 | 7,837 | 7,740 | 7,003 | 6,891 | 6,684 | |
| Other | 46 | 45 | 44 | 44 | 49 | 48 | 48 | |
| Total assets | 1,375,294 | 1,378,611 | 1,288,249 | 1,322,987 | 1,235,081 | 1,208,211 | 1,267,388 | |
| | 38 |
| Consolidated balance sheet | ||||||||
| Million pesos | ||||||||
| 2018 | 2017 | |||||||
| Sep | Jun | Mar | Dec | Sep | Jun | Mar | ||
| Liabilities | ||||||||
| Deposits | 727,316 | 746,850 | 711,217 | 692,967 | 670,681 | 663,062 | 640,064 | |
| Demand deposits | 446,484 | 467,485 | 444,728 | 433,128 | 429,200 | 427,079 | 413,960 | |
| Time deposits – general public | 176,426 | 177,424 | 172,341 | 162,465 | 158,369 | 156,315 | 141,177 | |
| Time deposits – money market | 55,999 | 52,043 | 46,832 | 51,044 | 37,982 | 33,334 | 38,255 | |
| Credit instruments issued | 47,173 | 48,732 | 46,117 | 45,113 | 44,040 | 45,269 | 45,615 | |
| Global Account uptake without movements | 1,234 | 1,166 | 1,199 | 1,217 | 1,090 | 1,065 | 1,057 | |
| Bank and other loans | 43,171 | 40,674 | 39,259 | 40,055 | 49,510 | 79,599 | 57,192 | |
| Demand loans | 2,035 | 590 | 656 | 1,520 | 4,440 | 30,024 | 2,643 | |
| Short-term loans | 13,226 | 10,733 | 10,208 | 11,946 | 17,665 | 25,591 | 26,924 | |
| Long-term loans | 27,910 | 29,351 | 28,395 | 26,589 | 27,405 | 23,984 | 27,625 | |
| Creditors under sale and repurchase agreements | 157,528 | 94,087 | 101,085 | 110,149 | 121,012 | 75,301 | 142,449 | |
| Securities Lending | 1 | 1 | 1 | 1 | 0 | 1 | 0 | |
| Collateral sold or pledged as guarantee | 21,088 | 31,492 | 23,084 | 21,132 | 16,767 | 18,276 | 22,770 | |
| Repurchase | 1,597 | 1,911 | 0 | 0 | 0 | 0 | 4,176 | |
| Securities loans | 19,491 | 29,581 | 23,084 | 21,132 | 16,767 | 18,276 | 18,594 | |
| Derivatives | 146,717 | 167,278 | 148,910 | 184,461 | 135,138 | 139,043 | 153,741 | |
| Trading purposes | 140,136 | 157,948 | 140,586 | 173,390 | 127,371 | 133,972 | 148,410 | |
| Hedging purposes | 6,581 | 9,330 | 8,324 | 11,071 | 7,767 | 5,071 | 5,331 | |
| Other payables | 117,943 | 139,354 | 109,159 | 121,914 | 91,387 | 86,475 | 103,956 | |
| Income taxes payable | 28 | 9 | 5 | 33 | 10 | 7 | 3 | |
| Employee profit sharing payable | 211 | 154 | 334 | 273 | 205 | 143 | 308 | |
| Creditors from settlement of transactions | 45,251 | 50,195 | 38,803 | 48,130 | 35,606 | 35,971 | 48,710 | |
| Payable for cash collateral received | 37,216 | 40,235 | 29,572 | 45,024 | 26,196 | 24,708 | 30,107 | |
| Sundry creditors and other payables | 35,237 | 48,761 | 40,445 | 28,454 | 29,370 | 25,646 | 24,828 | |
| Subordinated credit notes | 33,791 | 35,914 | 32,958 | 35,865 | 32,753 | 32,920 | 33,888 | |
| Deferred revenues and other advances | 354 | 441 | 444 | 238 | 487 | 668 | 741 | |
| Total liabilities | 1,247,909 | 1,256,091 | 1,166,117 | 1,206,782 | 1,117,735 | 1,095,345 | 1,154,801 | |
| Paid-in capital | 34,824 | 35,291 | 35,311 | 34,798 | 34,798 | 34,798 | 34,798 | |
| Capital stock | 29,799 | 29,799 | 29,799 | 11,348 | 11,348 | 11,348 | 11,348 | |
| Share premium | 5,025 | 5,492 | 5,512 | 23,450 | 23,450 | 23,450 | 23,450 | |
| Other capital | 92,561 | 87,229 | 86,821 | 81,407 | 82,548 | 78,068 | 77,789 | |
| Capital reserves | 22,315 | 22,315 | 9,515 | 9,515 | 9,515 | 9,515 | 9,515 | |
| Retained earnings | 55,864 | 56,014 | 73,238 | 55,205 | 60,022 | 60,035 | 64,433 | |
| Result from valuation of available for sale securities, net | (774) | (1,174) | (689) | (1,353) | (540) | (1,277) | (1,572) | |
| Result from valuation of cash flow hedge instruments, net | 40 | 41 | (73) | 321 | 327 | 663 | 889 | |
| Cumulative effect of conversion | 9 | 9 | 9 | 9 | 9 | 9 | 9 | |
| Adjustment employees pension fund | 84 | 91 | 43 | 35 | (8) | (22) | (18) | |
| Net income | 14,994 | 9,898 | 4,727 | 17,645 | 13,164 | 9,086 | 4,475 | |
| Non-controlling interest | 29 | 35 | 51 | 30 | 59 | 59 | 58 | |
| Total stockholders’ equity | 127,385 | 122,520 | 122,132 | 116,205 | 117,346 | 112,866 | 112,587 | |
| Total liabilities and stockholders´ equity | 1,375,294 | 1,378,611 | 1,288,249 | 1,322,987 | 1,235,081 | 1,208,211 | 1,267,388 | |
| | 39 |
| Consolidated balance sheet | ||||||||
| Million pesos | ||||||||
| 2018 | 2017 | |||||||
| Sep | Jun | Mar | Dec | Sep | Jun | Mar | ||
| Memorandum accounts | ||||||||
| Contingent assets and liabilities | 61 | 65 | 68 | 65 | 40 | 29 | 25 | |
| Credit commitments | 222,065 | 226,035 | 200,183 | 215,461 | 193,570 | 190,059 | 195,198 | |
| Assets in trust or under mandate | 166,366 | 169,543 | 162,435 | 162,867 | 162,525 | 158,953 | 154,538 | |
| Trusts | 165,123 | 168,089 | 161,095 | 161,706 | 162,390 | 158,778 | 154,363 | |
| Mandates | 1,243 | 1,454 | 1,340 | 1,161 | 135 | 175 | 175 | |
| Assets in custody or under administration | 2,381,418 | 3,209,606 | 3,280,074 | 3,219,980 | 3,261,514 | 3,140,438 | 2,908,188 | |
| Collateral received | 122,316 | 133,931 | 129,060 | 76,618 | 65,735 | 134,576 | 134,814 | |
| Collateral received and sold or pledged as guarantee | 68,652 | 57,487 | 64,647 | 46,221 | 38,371 | 86,291 | 111,183 | |
| Investment banking transactions for third parties (net) | 29,028 | 58,533 | 86,567 | 130,240 | 231,569 | 276,475 | 200,428 | |
| Uncollected interest earned on past due loan portfolio | 883 | 875 | 831 | 799 | 786 | 725 | 1,636 | |
| Other record accounts | 1,608,264 | 1,602,318 | 1,528,317 | 1,621,209 | 1,473,626 | 1,399,631 | 1,376,591 | |
| 4,599,053 | 5,458,393 | 5,452,182 | 5,473,460 | 5,427,736 | 5,387,177 | 5,082,601 | ||
These consolidated financial statements were approved by the Board of Directors and signed on its behalf by
| HÉCTOR B. GRISI CHECA | DIDIER MENA CAMPOS | |
| Executive President and Chief Executive Officer | Chief Financial Officer | |
| EMILIO DE EUSEBIO SAIZ | JUAN CARLOS GARCÍA CONTRERAS | JUAN RAMÓN JIMÉNEZ LORENZO |
| Deputy General Director Financial Accounting and Control | Executive Director Financial Controller | Chief Audit Executive |
The accompanying notes are part of these consolidated financial statements
www.santander.com.mx
| | 40 |
| Consolidated income statement | ||||||||||
| Million pesos | ||||||||||
| 2018 | 2017 | |||||||||
| 9M | 3Q | 2Q | 1Q | 9M | 4Q | 3Q | 2Q | 1Q | ||
| Interest income | 82,333 | 28,828 | 27,517 | 25,988 | 71,818 | 25,415 | 24,911 | 24,174 | 22,733 | |
| Interest expense | (37,128) | (13,033) | (12,722) | (11,373) | (30,650) | (11,568) | (10,669) | (10,668) | (9,313) | |
| Net interest income | 45,205 | 15,795 | 14,795 | 14,615 | 41,168 | 13,847 | 14,242 | 13,506 | 13,420 | |
| Provisions for loan losses | (15,076) | (5,463) | (4,667) | (4,946) | (15,978) | (5,431) | (5,603) | (5,241) | (5,134) | |
| Net interest income after provisions for loan losses | 30,129 | 10,332 | 10,128 | 9,669 | 25,190 | 8,416 | 8,639 | 8,265 | 8,286 | |
| Commission and fee income | 17,198 | 5,659 | 6,049 | 5,490 | 15,621 | 5,398 | 5,226 | 5,333 | 5,062 | |
| Commission and fee expense | (4,596) | (1,388) | (1,787) | (1,421) | (3,921) | (1,465) | (1,292) | (1,330) | (1,299) | |
| Net gain (loss) on financial assets and liabilities | 2,180 | 843 | 1,049 | 288 | 2,359 | 614 | 311 | 1,069 | 979 | |
| Other operating income | 570 | 134 | 244 | 192 | 623 | 422 | 239 | 355 | 29 | |
| Administrative and promotional expenses | (26,066) | (9,003) | (8,845) | (8,218) | (23,029) | (8,186) | (7,898) | (7,806) | (7,325) | |
| Operating income | 19,415 | 6,577 | 6,838 | 6,000 | 16,843 | 5,199 | 5,225 | 5,886 | 5,732 | |
| Current income taxes | (3,581) | (1,258) | (1,332) | (991) | (1,898) | (2,318) | (172) | (1,245) | (481) | |
| Deferred income taxes (net) | (840) | (223) | (335) | (282) | (1,781) | 1,600 | (975) | (30) | (776) | |
| Net income | 14,994 | 5,096 | 5,171 | 4,727 | 13,164 | 4,481 | 4,078 | 4,611 | 4,475 | |
These consolidated financial statements were approved by the Board of Directors and signed on its behalf by
| HÉCTOR B. GRISI CHECA | DIDIER MENA CAMPOS | |
| Executive President and Chief Executive Officer | Chief Financial Officer | |
| EMILIO DE EUSEBIO SAIZ | JUAN CARLOS GARCÍA CONTRERAS | JUAN RAMÓN JIMÉNEZ LORENZO |
| Deputy General Director Financial Accounting and Control | Executive Director Financial Controller | Chief Audit Executive |
The accompanying notes are part of these consolidated financial statements
www.santander.com.mx
| | 41 |
| Consolidated statements of changes in total equity | ||||||||||||||||
| From January 1st to September 30th, 2018 | ||||||||||||||||
| Million pesos | ||||||||||||||||
| Paid-in capital | Other capital | |||||||||||||||
| CONCEPT | Capital stock | Additional paid-in capital | Capital reserves | Retained earnings | Result from valuation of securities available for sale, net | Result from the valuation of cash flow hedge instruments | Cumulative effect from conversion | Measurement defined benefit employees | Net income | Non-controlling interest | Total stockholders' equity | |||||
| BALANCE AS OF DECEMBER 31st, 2017 | 11,348 | 23,450 | 9,515 | 55,205 | (1,353) | 321 | 9 | 35 | 17,645 | 30 | 116,205 | |||||
| MOVEMENTS INHERENT TO THE SHAREHOLDERS' DECISIONS | ||||||||||||||||
| Transfer of prior year's net income | 17,645 | (17,645) | 0 | |||||||||||||
| Capitalization premium on sale of shares | 18,451 | (18,451) | 0 | |||||||||||||
| Dividends declared | (4,279) | (4,279) | ||||||||||||||
| TOTAL | 18,451 | (18,451) | 0 | 13,366 | 0 | 0 | 0 | 0 | (17,645) | 0 | (4,279) | |||||
| MOVEMENTS INHERENT TO THE RECOGNITION OF THE COMPREHENSIVE INCOME | ||||||||||||||||
| Result from valuation of available for sale securities, net | 579 | 579 | ||||||||||||||
| Result from valuation of cash flow hedge instruments, net | (281) | (281) | ||||||||||||||
| Reserve for purchase of Treasury shares | 12,800 | (12,800) | 0 | |||||||||||||
| Recognition of share-based payments | 351 | (42) | 309 | |||||||||||||
| Shares held by treasury | (325) | (325) | ||||||||||||||
| Interest on Subordinated debentures Perpetual Non-Preferred Contingent Convertible | (441) | (441) | ||||||||||||||
| Employee defined benefit measures | 49 | 49 | ||||||||||||||
| Result from sale of custody business | 595 | 595 | ||||||||||||||
| Result from the sale of subsidiaries | (19) | (19) | ||||||||||||||
| Net income | 14,994 | (1) | 14,993 | |||||||||||||
| TOTAL | 0 | 26 | 12,800 | (12,707) | 579 | (281) | 0 | 49 | 14,994 | (1) | 15,459 | |||||
| BALANCE AS OF SEPTEMBER 30th, 2018 | 29,799 | 5,025 | 22,315 | 55,864 | (774) | 40 | 9 | 84 | 14,994 | 29 | 127,385 | |||||
| | 42 |
These consolidated financial statements were approved by the Board of Directors and signed on its behalf by.
| HÉCTOR B. GRISI CHECA | DIDIER MENA CAMPOS | |
| Executive President and Chief Executive Officer | Chief Financial Officer | |
| EMILIO DE EUSEBIO SAIZ | JUAN CARLOS GARCÍA CONTRERAS | JUAN RAMÓN JIMÉNEZ LORENZO |
| Deputy General Director Financial Accounting and Control | Executive Director Financial Controller | Chief Audit Executive |
The accompanying notes are part of these consolidated financial statements
www.santander.com.mx
| | 43 |
| Consolidated statement of cash flows | ||
| From January 1 to September 30th, 2018 | ||
| Million pesos | ||
| OPERATING ACTIVITIES | ||
| Net income | 14,994 | |
| Adjustment for line items that do not require cash flows | ||
| Result from valuation associated with operating activities | (867) | |
| Depreciation of property, furniture and fixtures | 800 | |
| Amortizations of intangible assets | 1,341 | |
| Recognition of share-based payments | 351 | |
| Current and deferred income taxes | 4,421 | |
| Deferred employee profit sharing | (1) | |
| Provisions | 473 | |
| Amortizations of debt issuance expenses | 12 | 6,530 |
| 21,524 | ||
| OPERATING ACTIVITIES | ||
| Margin accounts | 263 | |
| Investment in securities | (22,540) | |
| Debtors under sale and repurchase agreements | (26,378) | |
| Derivatives-asset | 27,154 | |
| Loan portfolio-net | (62,326) | |
| Accrued income receivable from securitization transactions | (4) | |
| Foreclosed assets | 180 | |
| Other operating assets | 6,954 | |
| Deposits | 34,860 | |
| Bank and other loans | 3,115 | |
| Creditors under sale and repurchase agreements | 47,379 | |
| Collateral sold or pledged as guarantee | (44) | |
| Derivatives-liability | (27,154) | |
| Other operating liabilities | (2,805) | |
| Payments of income taxes | (6,283) | |
| Net cash provided by (used in) operating activities | (6,105) | |
| INVESTING ACTIVITIES | ||
| Proceeds from disposal of property, furniture and fixtures | 8 | |
| Payments for acquisition of property, furniture and fixtures | (1,015) | |
| Proceeds from disposal of other long-lived assets | 764 | |
| Payments for acquisition of intangible assets | (1,760) | |
| Net cash provided by (used in) investing activities | (2,003) | |
| FINANCING ACTIVITIES | ||
| Cash payment of dividends | (6,101) | |
| Payments associated with subordinated capital notes | (441) | |
| Payments from associated for purchase of treasury shares | (325) | |
| Net cash used in financing activities | (6,867) | |
| Net decrease in cash and cash equivalents | (14,975) | |
| Adjustment to cash flows for changes in exchange rate | (877) | |
| Funds available at the beginning of the year | 87,409 | |
| Funds available at the end of the year | 71,557 | |
| | 44 |
These consolidated financial statements were approved by the Board of Directors and signed on its behalf by:
| HÉCTOR B. GRISI CHECA | DIDIER MENA CAMPOS | |
| Executive President and Chief Executive Officer | Chief Financial Officer | |
| EMILIO DE EUSEBIO SAIZ | JUAN CARLOS GARCÍA CONTRERAS | JUAN RAMÓN JIMÉNEZ LORENZO |
| Deputy General Director Financial Accounting and Control | Executive Director Financial Controller | Chief Audit Executive |
The accompanying notes are part of these consolidated financial statements
www.santander.com.mx
| | 45 |
NOTES TO CONSOLIDATED FINANCIAL STATEMENTS
§ Significant accounting policies
§ Earnings per share
§ Consolidated balance sheet and consolidated income statement by segment
§ Annex 1. Loan portfolio rating
§ Annex 2. Financial ratios according to CNBV
§ Notes to consolidated financial statements
The information contained in this report and the financial statements of the Bank subsidiaries may be consulted on the Internet website: www.santander.com.mx or through the following direct access:
http://www.santander.com.mx/ir/english/financial/quarterly.html
There is also information on Santander México on the CNBV website: https://www.gob.mx/cnbv
| | 46 |
Significant accounting policies
Changes in Accounting Criteria issued by the National Banking and Securities Commission in 2018
On December 27th, 2017, several amendments were published in the DOF to the Accounting Criteria issued by the CNBV. These modifications will be effective on January 1st, 2019.
The most relevant changes are mentioned as follows:
· Accounting Criteria B-6, Loan portfolio and Accounting Criteria D-2, Income Statement
The Accounting Criteria applicable to credit institutions are adjusted so that they can cancel, in the period in which they occur, the surpluses in the balance of the allowance for loan losses, as well as to recognize the recovery of credits previously cancelled against the item "Allowance for loan losses" in order to be consistent with international accounting standards established in International Financial Reporting Standards (IFRS).
Through a transitory provision, it is indicated that the institutions may choose to apply the aforementioned changes starting the following day after the date of its publication and shall notify the CNBV that such option is exercised, no later than 10 business days after the date in which the anticipated application of the aforementioned changes to the Accounting Criteria begin. As of September 30th, 2018, the Bank has not exercised this option.
· Accounting Criteria A-2, Application of particular rules
Several Mexican Financial Reporting Standards (MFRS) issued by the Mexican Financial Reporting Standards Board (CINIF by its acronym in Spanish) were incorporated to the Accounting Criteria of the CNBV, in order to be applicable to financial institutions.
The Bank is analyzing the effect that the adoption of the aforementioned MFRS will have on its financial information.
The MFRS that are now included in the Accounting Criteria are as follows:
MFRS B-17, Determination of fair value
It establishes the standards for the determination of fair value and related disclosure. It mentions that fair value must be determined by using assumptions that market participants would use when setting the price of an asset or a liability under current market conditions at certain date, including assumptions about the risk. It is established that should be considered the market in which it would take place for an asset or liability that is being valued, if it is monetary and if it is used in combination with other assets or on an independent basis; and the appropriate valuation technique(s) for determining their fair value, as well as maximizing the use of relevant observable inputs and minimizing unobservable inputs.
MFRS C-3, Accounts receivable
It establishes the valuation, presentation and disclosure standards for the initial and subsequent recognition of trade accounts receivable and other accounts receivable in the financial statements of an economic entity. It specifies that accounts receivable that are based on a contract represent a financial instrument.
MFRS C-9, Provisions, contingencies and commitments
It establishes the standards for valuation, presentation and disclosure of liabilities, provisions and commitments, reducing its scope by reallocating the item related to financial liabilities to the MFRS C-19, Financial instruments payable. The definition of liability was modified, eliminating the concept of "unconditional right to avoid" and including the term "probable".
MFRS C-16, Impairment of financial instruments receivable
It establishes the standards for valuation, recognition, presentation and disclosure of impairment losses on financial instruments receivable.
MFRS C-19, Financial instruments payable
It establishes the standards for valuation, presentation and disclosure for the initial and subsequent recognition of accounts payable, borrowings and other financial liabilities in the financial statements of an economic entity. The following concepts
| | 47 |
are introduced to value the financial liabilities: amortized cost and the effective interest method, which is determined based on the effective interest rate. Both the discounts and the costs of issuing a financial liability are deducted from the liability.
MFRS C-20, Financial instruments to collect principal and interest
It establishes the standards for valuation, presentation and disclosure for the initial and subsequent recognition of the financing instruments receivable in the financial statements of an economic entity that carries out financing activities. Discards the concept of intention when acquiring and holding the financial instruments (assets) to determine their classification. Adopts the concept of business model.
MFRS, D-1, Revenue from contracts with customers
It establishes the standards for valuation, presentation and disclosure of the income incurred to fulfill the contracts with clients. The most significant aspects are established for the revenue recognition through the transfer of control, identification of obligations to be fulfilled in a contract, assignment of the amount of the transaction and recognition of collection rights.
MFRS D-2, Costs for contracts with clients
It establishes the standards for valuation, presentation and disclosure of the costs that arise from contracts with clients. Additionally, it establishes the standards for the recognition of costs for contracts with customers, and incorporates the accounting treatment of the costs related to contracts for the construction and manufacture of capital goods, including costs related to customer contracts.
MFRS issued by the CINIF
The CINIF issued the MFRS D-5, Leases, which is effective in 2019. This MFRS introduces a unique model for the recognition of leases by the lessee and requires the leaseholder to recognize the assets and liabilities of all leases with a maturity of more than 12 months, unless the underlying asset is of low value. The lessee is required to recognize a right-of-use asset that represents its right to use the leased underlying asset and a lease liability that represents its obligation to make lease payments.
The Bank is analyzing the effect that this MFRS will have on the financial information, if applicable.
Improvements to MFRS 2018
Starting January 1st, 2018, the Bank prospectively adopted the following Improvements to the MFRS which were issued by the CINIF and were effective on the aforementioned date. These Improvements to the MFRS did not have a significant impact on the financial information presented by the Bank.
Improvements to the MFRS that generate accounting changes
MFRS B-2, Statement of Cash Flows
It is modified to incorporate the requirement of new disclosures about liabilities associated with financing activities.
MFRS B-10, Effects of inflation
The requirement of disclosures about the inflation percentages rates of the economic environment in which an entity operates is incorporated. In addition, it requires the percentage of accumulated inflation rates that were utilized to qualify the economic environment as inflationary or non-inflationary for the current year, the cumulative inflation rate of 3 years (including the two prior years and the current year. The aforementioned requirements will be useful to know the criteria of restatement for the following year.
MFRS C-6, Property, plant and equipment and MFRS C-8, Intangible assets
These standards are modified with the aim of clarifying the meaning of "consumption of future economic benefits of an asset". Additionally, it establishes that is not appropriate a method of depreciation of assets based on the amount of income associated with the use of these assets, because the income may be affected by factors other than the pattern of consumption of economic benefits of the asset.
| | 48 |
MFRS C-14, Transfer and derecognition of financial assets
It establishes that an entity must continue recognizing a transferred asset as it has continuous involvement with it, which must be subsequently recognized according to the applicable standards. The accounting recognition depends on type of asset and its related classification by the entity. However, within the same MFRS, it is mentioned that the fair value adjustments of transferred assets must be recognized in profit or loss, which causes an inconsistency. The CINIF decided to modify this MFRS to eliminate this inconsistency.
Improvements to the MFRS that do not generate accounting changes
MFRS B-7, Business acquisitions
It establishes that the contingent liabilities of the acquired business must be recognized, when it is probable that there will be an outflow of economic resources to settle such liabilities. However, the MFRS C-9, Provisions, contingencies and commitments establishes that contingent items should not be recognized because, by definition, their occurrence is more likely than probable, which seems to be an inconsistency. Therefore, the CINIF modified the wording of MFRS B-7, Business Acquisitions to clarify this inconsistency.
MFRS B-15, Translation of foreign currencies
It is indicated that valuations of assets, liabilities, stockholders' equity, income, costs and expenses are carried out in the functional currency, given that is the basis of the economy of the entity. The aforementioned approach is specified by this modification and avoid confusions.
MFRS C-3, Accounts receivable
It is clarified that this MFRS establishes only the valuation, presentation and disclosure standards for the initial and subsequent recognition of accounts receivable that do not accrue interest, whether the interest is explicit or implicit. Additionally, it specifies that accounts receivable that accrue interest or those without explicit interest, but that are long-term, are within the scope of MFRS C-20, Financial instruments to collect principal and interest.
Application of MFRS D-3, Employee benefits by the Bank
In January 2015, the CINIF issued several amendments to MFRS D-3, Employee Benefits that were effective as of January 1st, 2016. The main effects on the financial information of the Bank are the following:
| · | Discount rate for liabilities - Defined Benefits Obligation (DBO) |
The discount rate to calculate the DBO will be determined by using the market rate of high-quality corporate bonds (in absolute terms), as long as there is a deep market for these bonds. Otherwise, the market rate of the bonds issued by the Federal Government must be used. In addition, it indicates the criteria to be followed to qualify corporate bonds as high-quality and what should be understood as a deep market.
| · | Recognition of the actuarial gain and losses |
The use of the “corridor” approach is eliminated for the deferral of actuarial gains and losses.
The balance of cumulative actuarial gain or losses as of December 31st, 2015 is recognized in ORI in stockholders' equity and in liabilities as of January 1st, 2016.
Any actuarial gains and losses generated starting on January 1st, 2016 will be treated as remeasurements of employee defined benefits and will recognized in ORI within the stockholders' equity and in the liabilities.
| · | Recycling of the actuarial gain and losses |
Actuarial gain and losses recognized in ORI within stockholders' equity must be recycled in the net profit or loss based on the Remaining Useful Life of the Plan (RULP).
| · | Expected return of plan assets |
| | 49 |
The expected return on plan assets will be estimated with the discount rate of the DOB instead of the expected rate of return for those assets.
| · | Cap of the plan assets |
A cap of the plan assets is established by means of determining a Maximum Obligation (MO) of the post-employment benefits, specifying that the excess of resources contributed by the entity does not qualify as plan assets, noting that only those plan assets will be considered those resources that are used to cover benefits to employees over the present value of the total, present and future, accrued and accrued benefits attributable to current employees. Any excess over MO is considered a restricted investment.
| · | Recognition in results of Modifications to the Plan, Reductions of Personnel and Anticipated Liquidations of Obligations. |
In the post-employment benefits all the Labor Cost of the Past Service of the Modifications to the Plan, the Personnel Reductions and the gains or losses due to the Early Settlement of Obligations are immediately recognized in the net profit or loss.
Due to the enactment of the MFRS D-3 on December 31st, 2015, the CNBV issued transitory articles to the Provisions published in the DOF on November 9th, 2015.
These transitory articles establish that credit institutions may recognize the entire balance of plan amendments (past service) and the cumulative balance of the plan’s actuarial gains and losses that were not recognized by entities which used the “corridor” approach progressively, no later than December 31 of each year.
If the option of progressively applying the cumulative balance is selected, the recognition of such balances should begin in 2016, recognizing 20% in such year and another 20% in each of the subsequent years, until reaching 100% over a maximum five-year period. Credit institutions, which elect this option, must report their decision to the CNBV no later than January 31st, 2016.
The remeasurements of gains and losses from the defined benefits plan should be calculated on the total amount of the plan’s gains or losses; that is on the aggregate of the plan’s actuarial gains or losses of the period, and the cumulative balance of those plan’s actuarial gains or losses not recognized on the balance sheet of the credit institutions.
Similarly, if all or part of the residual effect is recognized before the established deadlines, the CNBV must be informed within the 30 calendar days following the date on which the respective accounting record is made. The entities may perform such recognition in advance, if at least 20% or the total residual amount is recognized in the respective year.
The Bank has opted for the progressive application of the balance of the Labor Cost of the Past Service of the Modifications to the Plan and of the accumulated balance of the Gains and Losses of the Plan not recognized as indicated above, in contrast to the provisions of the MFRS B-1, Accounting changes and corrections of errors issued by the CINIF. This decision was reported to the CNBV on January 26th, 2016.
In accordance with the foregoing, the initial effect of the application of MFRS D-3 originated by the accumulated balance of the Gains and Losses of the unrecognized Plan as of December 31, 2015 amounts to Ps.2,771 million. This amount will be recognized in ORI within the capital earned in the item "Remeasurement for defined benefits to employees" as of 2016, recording 20% of said accumulated balance in this year and an additional 20% in each of the subsequent years, until reaching 100% in a period of five-year period. This accumulated balance of actuarial losses not recognized at December 31st, 2015, will be recycled to the income statement for during the RULP, which fluctuates between 7 and 13 years depending on the respective benefit.
As of September 30th, 2018, the Bank recognized an increase of Ps.1,108 million in the area of liability denominated "Sundry creditors and other accounts payable" and a decrease in ORI within capital won in the category of "remeasurements defined benefit to employees " in connection with the application of the above option. This amount of Ps.1,108 million represents 40% of the accumulated balance of gains and losses not recognized Plan as of December 31, 2015.
Should that option not been applied, the Bank had recognized in the consolidated balance sheet as of September 30th, 2018, an increase in the area of liability denominated "Sundry creditors and other accounts payable" and a decrease in ORI within capital won in the category of "remeasurements defined benefit to employees" for Ps.2,771 million.
The Bank has refrained from applying the resulting comparative settings changes reformulation referred to in the MFRS B-1, Accounting Changes and Error Corrections considering that it is impractical to determine the amounts for periods prior to fiscal year 2017 and for the period from January 1st, 2018 to September 30th, 2018, as indicated in that MFRS.
| | 50 |
| Earnings per ordinary share and earnings per diluted share | |||||||||||||
| Million pesos, except shares and earnings per share | |||||||||||||
| SEPTEMBER 2018 | SEPTEMBER 2017 | SEPTEMBER 2016 | |||||||||||
| Shares | Earnings | Shares | Earnings | Shares | Earnings | ||||||||
| Earnings | -weighted- | per share | Earnings | -weighted- | per share | Earnings | -weighted- | per share | |||||
| Earnings per share | 14,994 | 6,776,856,201 | 2.21 | 13,164 | 80,855,403,803 | 0.16 | 11,157 | 80,855,403,803 | 0.14 | ||||
| Treasury stock | 10,138,156 | ||||||||||||
| Diluted earnings per share | 14,994 | 6,786,994,357 | 2.21 | 13,164 | 80,855,403,803 | 0.16 | 11,157 | 80,855,403,803 | 0.14 | ||||
| Plus loss / less (profit): | |||||||||||||
| Discontinued operations | |||||||||||||
| Continued fully diluted earnings per share | 14,994 | 6,786,994,357 | 2.21 | 13,164 | 80,855,403,803 | 0.16 | 11,157 | 80,855,403,803 | 0.14 | ||||
| Balance outstanding shares as of September 30th, 2018 | 6,776,266,479 | ||||||||||||
| | 51 |
| Consolidated Balance Sheet by Segment | |||||||
| Million pesos | |||||||
| As of June 30tH, 2018 | As of June 30th, 2017 | ||||||
| Retail Banking | Corporate & Investment Banking | Corporate Activities | Retail Banking | Corporate & Investment Banking | Corporate Activities | ||
| Assets | |||||||
| Cash and due from banks | 44,947 | 14,315 | 12,295 | 40,850 | 19,161 | 32,305 | |
| Margin Accounts | 0 | 2,444 | 0 | 0 | 3,036 | 0 | |
| Investment in securities | 0 | 139,650 | 199,304 | 0 | 130,775 | 171,945 | |
| Debtors under sale and repurchase agreements | 0 | 31,850 | 0 | 0 | 5,547 | 0 | |
| Derivatives | 0 | 142,445 | 10,745 | 0 | 124,599 | 14,252 | |
| Valuation adjustment for hedged financial assets | 0 | 0 | (10) | 0 | 0 | 0 | |
| Total loan portfolio | 548,004 | 132,116 | 0 | 493,282 | 119,953 | 27 | |
| Allowance for loan losses | (17,996) | (2,379) | 0 | (18,106) | (2,335) | 0 | |
| Loan Portfolio (net) | 530,008 | 129,737 | 0 | 475,176 | 117,618 | 27 | |
| Accrued income receivable from securitization transactions | 0 | 0 | 125 | 0 | 0 | 119 | |
| Other receivables (net) | 205 | 67,854 | 15,582 | 1,686 | 52,752 | 13,807 | |
| Foreclosed assets (net) | 265 | 26 | 0 | 491 | 29 | 0 | |
| Properties, furniture and fixtures (net) | 5,669 | 956 | 84 | 4,804 | 801 | 72 | |
| Long-term investments in shares | 0 | 0 | 90 | 0 | 0 | 91 | |
| Deferred taxes and deferred profit sharing (net) | 0 | 0 | 18,672 | 0 | 0 | 18,086 | |
| Other assets | 1,687 | 1,217 | 5,132 | 1,728 | 910 | 4,414 | |
| Total assets | 582,781 | 530,494 | 262,019 | 524,735 | 455,228 | 255,118 | |
| Liabilities | |||||||
| Deposits | 514,223 | 104,374 | 61,546 | 461,108 | 121,426 | 44,107 | |
| Credit instruments issued | 0 | 5,866 | 41,307 | 0 | 11,074 | 32,966 | |
| Bank and other loans | 12,925 | 2,244 | 28,002 | 17,357 | 2,201 | 29,952 | |
| Creditors under sale and repurchase agreements | 8,221 | 149,307 | 0 | 9,472 | 111,540 | 0 | |
| Securities loan | 0 | 1 | 0 | 0 | 0 | 0 | |
| Collateral sold or pledged as guarantee | 0 | 21,088 | 0 | 0 | 16,767 | 0 | |
| Derivatives | 0 | 140,136 | 6,581 | 0 | 127,371 | 7,767 | |
| Other payables | 33,274 | 82,479 | 2,190 | 28,418 | 61,816 | 1,153 | |
| Subordinated debentures | 0 | 0 | 33,791 | 0 | 0 | 32,753 | |
| Deferred revenues | 354 | 0 | 0 | 487 | 0 | 0 | |
| Total liabilities | 568,997 | 505,495 | 173,417 | 516,842 | 452,195 | 148,698 | |
| Total stockholders' equity | 62,069 | 22,221 | 43,095 | 53,806 | 21,859 | 41,681 | |
| Total liabilities and stockholders' equity | 631,066 | 527,716 | 216,512 | 570,648 | 474,054 | 190,379 | |
| | 52 |
| Income Statement by Segment | |||||||
| Million pesos | |||||||
| 9M18 | 9M17 | ||||||
| Retail Banking | Corporate & Investment Banking | Corporate Activities | Retail Banking | Corporate & Investment Banking | Corporate Activities | ||
| Net interest income | 39,529 | 4,450 | 1,226 | 35,130 | 4,220 | 1,818 | |
| Provisions for loan losses | (14,117) | (959) | 0 | (14,817) | (1,161) | 0 | |
| Net interest income after provisions for loan losses | 25,412 | 3,491 | 1,226 | 20,313 | 3,059 | 1,818 | |
| Commission and fee income (expense), net | 11,347 | 1,390 | (135) | 10,363 | 1,339 | (2) | |
| Net gain (loss) on financial assets and liabilities | 879 | 1,238 | 63 | 658 | 1,761 | (60) | |
| Other operating income (expense) | 704 | 1 | (135) | 304 | 102 | 217 | |
| Administrative and promotional expenses | (22,274) | (3,139) | (653) | (19,894) | (2,616) | (519) | |
| Operating income | 16,068 | 2,981 | 366 | 11,744 | 3,645 | 1,454 | |
Segment information has been prepared according to the classifications used in Santander México at secondary level, based in the type of developed business:
Retail banking
The Retail Banking segment encompasses the entire commercial banking and asset management business. Our Retail Banking segment’s activities include products and services for individuals, private banking clients, SMEs, middle-market corporations and government institutions.
Corporate & Investment Banking
The Corporate & Investment Banking segment reflects the returns on the corporate banking business, including managed treasury departments and the equities business. Our Corporate & Investment Banking segment provides comprehensive products and services relating to finance, guarantees, mergers and acquisitions, equity and fixed income, structured finance, international trade finance, cash management services, collection services and e-banking, including structured loans, syndicated loans, acquisition financing and financing of investment plans, among others.
Corporate activities
The Corporate Activities segment is comprised of all operational and administrative activities that are not assigned to a specific segment or product mentioned above. The Corporate Activities segment includes the financial management division, which manages structural financial risks arising from our commercial activities, mainly liquidity risk and interest rate risk, provides short- and long-term funding for our lending activities and calculates and controls transfer prices for loans and deposits in local and foreign currencies. The financial management division also oversees the use of our resources in compliance with internal and regulatory limits regarding liquidity and regulatory capital requirements.
| | 53 |
| Annex 1. Loan portfolio rating | |||||
| As of September 30, 2018 | |||||
| Million pesos | |||||
| Allowance for loan losses | |||||
| Category | Loan Portfolio | Commercial | Consumer | Mortgages | Total |
| Risk "A" | 689,197 | 2,243 | 1,308 | 191 | 3,742 |
| Risk "A-1" | 605,290 | 1,575 | 480 | 171 | 2,226 |
| Risk "A-2" | 83,907 | 668 | 828 | 20 | 1,516 |
| Risk "B" | 80,713 | 596 | 2,721 | 48 | 3,365 |
| Risk "B-1" | 38,908 | 192 | 1,214 | 13 | 1,419 |
| Risk "B-2" | 22,776 | 155 | 784 | 23 | 962 |
| Risk "B-3" | 19,029 | 249 | 723 | 12 | 984 |
| Risk "C" | 44,244 | 330 | 2,216 | 657 | 3,203 |
| Risk "C-1" | 32,355 | 190 | 984 | 354 | 1,528 |
| Risk "C-2" | 11,889 | 140 | 1,232 | 303 | 1,675 |
| Risk "D" | 11,352 | 1,229 | 2,313 | 689 | 4,231 |
| Risk "E" | 9,268 | 2,329 | 2,950 | 446 | 5,725 |
| Total rated portfolio | 834,774 | 6,727 | 11,508 | 2,031 | 20,266 |
| Provisions created | 20,266 | ||||
| Complementary provisions | 109 | ||||
| Total | 20,375 | ||||
| Notes: | ||
| 1. | The figures used for rating and creation of allowance for loan losses, correspond to the ones as of the last day of the month of the balance sheet as of June 30th, 2018. | |
| 2. |
Loan portfolio is rated according to the methodology issued by the CNBV in chapter V of Title II of the General Rules Applicable to Credit Institutions, can be rated by internal methodology approved by the CNBV.
We use the methodology established by the CNBV, which have been incorporated or modified according to the following schedule:
As of March 2011, the Bank apply the rules for rating the non-revolving consumer and mortgage loan portfolios.
As of September 2011, the Bank apply the rules for rating the states and municipalities loan portfolio.
As of June 2013, the Bank apply the new rules for rating the commercial loan portfolio.
As of June 2014, the Bank apply the new rules for rating the financial institutions loan portfolio.
As of October 2016, the Bank updated the rules for rating the revolving consumer loan portfolio.
As of September 2017, the Bank updated the rules for rating the non-revolving consumer and mortgage loan portfolios.
Credit Institutions use risk ratings: A-1; A-2; B-1; B-2; B-3; C-1; C-2; D and E, to classify allowance for impairment losses according to the portfolio segment and percentage of the provisions representing the outstanding balance of the loan, established in Section Fifth of “De la constitución de reservas y su clasificación por grado de riesgo”, contained in chapter 5 of Title II of such regulation. | |
| | 54 |
| Annex 2. Financial ratios according to CNBV | |||||||
| Percentages | 3Q18 | 2Q18 | 3Q17 | 9M18 | 9M17 | ||
| Past Due Loans Ratio | 2.35 | 2.46 | 2.26 | 2.35 | 2.26 | ||
| Past Due Loans Coverage | 127.60 | 124.79 | 147.41 | 127.60 | 147.41 | ||
| Operative Efficiency | 2.62 | 2.65 | 2.59 | 2.52 | 2.51 | ||
| ROE | 16.31 | 16.91 | 14.17 | 16.00 | 15.25 | ||
| ROA | 1.48 | 1.55 | 1.34 | 1.45 | 1.44 | ||
| Capitalization Ratio | |||||||
| Credit Risk | 21.29 | 21.03 | 21.20 | 21.29 | 21.20 | ||
| Credit, Market and operations risk | 16.02 | 15.52 | 16.19 | 16.02 | 16.19 | ||
| Liquidity | 86.57 | 82.00 | 85.19 | 86.57 | 85.19 | ||
| NIM (Net Interest Margin) | 3.38 | 3.46 | 3.12 | 3.29 | 3.03 | ||
Note: ratios are prepared according to the general rules applicable to financial information of credit institutions, issued by the CNBV, according to Annex 34.
NPL ratio = Balance of past due loans portfolio as of the end of the quarter / Balance of loans portfolio as of the end of the quarter.
Coverage ratio= Balance of provision for loan losses as of the end of the quarter / Balance of past due loans portfolio as of the end of the quarter.
Efficiency ratio = Administration and promotion expenses of the quarter, annualized / Total Average Assets.
ROAE = Annualized quarterly net earnings/ Average stockholders’ equity.
ROAA = Annualized quarterly net earnings /Total average assets.
Breakdown of capitalization ratio: (1)=Net Capital/ Assets subject to credit risk. (2)=Net Capital / Assets subject to credit, market and operation risk.
Liquidity = Current Assets/ Current Liabilities.
Where: Current Assets = Availabilities + securities for trade + securities available for sale.
Current liabilities= Demand deposits + bank loans and loans from other entities, payable on demand, + short term bank loans and loans from other entities.
NIM = Quarterly Net Interest Margin, adjusted by annualized credit risks / Average interest-earning assets.
Where: Average interest-earning assets = availabilities, investments in securities, transactions with securities and derivatives and loan portfolio.
Notes:
Average = ((Balance of the corresponding quarter + balance of the previous quarter) / 2).
Annualized figures = (Flow of the corresponding quarter * 4).
| | 55 |
| Notes to financial statements as of September 30th 2018 | |
| Million pesos, except for number of shares |
| 1. Investment in securities | |
| Financial instruments are constituted as follows: | |
| Book Value | |
| Trading securities: | |
| Bank securities | 4,602 |
| Government securities | 135,049 |
| Shares | 2,895 |
| 142,546 | |
| Securities available for sale: | |
| Government securities | 180,195 |
| Private securities | 4,865 |
| Shares | 549 |
| 185,609 | |
| Securities held until maturity: | |
| Government securities | 7,819 |
| Government securities (special cetes) | 2,980 |
| 10,799 | |
| Total | 338,954 |
| 2. Sale and repurchase agreements | ||
| The sale and repurchase agreements transactions are constituted as follows: | ||
| Net balance | ||
| Debit balances | ||
| Bank securities | 6,756 | |
| Government securities | 23,093 | |
| Private securities | 2,001 | |
| Total | 31,850 | |
| Credit balances | ||
| Bank securities | 4,055 | |
| Government securities | 151,028 | |
| Private securities | 2,445 | |
| Total | 157,528 | |
| (125,678) | ||
| 3. Investment in securities different to government securities | |||
| At September 30th, 2018 the investments in debt securities with the same issuer (other than government), are less than 5% of the Institution’s net capital. | |||
| | 56 |
| 4. Derivatives | |||||
| The nominal value of the different derivative financial instruments agreements for trading and hedging purposes, as of September 30th, 2018, are as follows: | |||||
| Trading | |||||
| Swaps | |||||
| Interest rate | 4,922,451 | ||||
| Cross currency | 931,690 | ||||
|
Equity
|
960 | ||||
| Futures | Buy | Sell | |||
| Interest rate | 610 | 0 | |||
| Foreign currency | 1,616 | 0 | |||
| Index | 0 | 460 | |||
| Forward contracts | |||||
| Foreign currency | 438,196 | 10,257 | |||
| Equity | 1,253 | 1,132 | |||
| Options | Long | Short | |||
| Interest rate | 134,727 | 146,487 | |||
| Foreign currency | 81,722 | 80,711 | |||
| Index | 5,345 | 3,489 | |||
| Equity | 296 | 117 | |||
| Total trading derivatives | 6,518,866 | 242,653 | |||
| Hedging | |||||
| Cash flow | |||||
| Interest rate swaps | 4,000 | ||||
| Cross currency swaps | 22,482 | ||||
| Foreign Exchange Forwards | 69,435 | ||||
| Fair value | |||||
| Interest rate swaps | 6,342 | ||||
| Cross currency swaps | 30,839 | ||||
| Total hedging derivatives | 133,098 | ||||
| Total derivative financial instruments | 6,651,964 | 242,653 | |||
| 5. Performing loan portfolio | |||||||||||||
| The loan portfolio, by type of loan and currency, as of September 30th, 2018, is constituted as follows: | |||||||||||||
| Amount | |||||||||||||
| Pesos | USA Dlls | UDIS | EUROS | GBP | Total | ||||||||
| Commercial or business activity | 285,561 | 55,468 | 0 | 2,504 | 821 | 344,354 | |||||||
| Financial entities | 16,489 | 785 | 0 | 0 | 0 | 17,274 | |||||||
| Government entities | 57,688 | 4,881 | 2,154 | 0 | 0 | 64,723 | |||||||
| Commercial loans | 359,738 | 61,134 | 2,154 | 2,504 | 821 | 426,351 | |||||||
| Consumer loans | 105,232 | 0 | 0 | 0 | 0 | 105,232 | |||||||
| Media and residential | 113,655 | 617 | 2,643 | 0 | 0 | 116,915 | |||||||
| Of social interest | 63 | 0 | 0 | 0 | 0 | 63 | |||||||
| Credits acquired from INFONAVIT or FOVISSSTE | 15,591 | 0 | 0 | 0 | 0 | 15,591 | |||||||
| Mortgage loans | 129,309 | 617 | 2,643 | 0 | 0 | 132,569 | |||||||
| Total performing loan portfolio | 594,279 | 61,751 | 4,797 | 2,504 | 821 | 664,152 | |||||||
| | 57 |
| 6. Non-performing loan portfolio | ||||||||||||
| Amount | ||||||||||||
| Pesos | USA Dlls | UDIS | EUROS | Total | ||||||||
| Commercial or business activity | 3,528 | 2,235 | 0 | 0 | 5,763 | |||||||
| Commercial loans | 3,528 | 2,235 | 0 | 0 | 5,763 | |||||||
| Consumer loans | 4,239 | 0 | 0 | 0 | 4,239 | |||||||
| Media and residential | 4,266 | 96 | 435 | 0 | 4,797 | |||||||
| Of social interest | 12 | 0 | 0 | 0 | 12 | |||||||
| Credits acquired from INFONAVIT or FOVISSSTE | 1,157 | 0 | 0 | 0 | 1,157 | |||||||
| Mortgage loans | 5,435 | 96 | 435 | 0 | 5,966 | |||||||
| Total non-performing loan portfolio | 13,202 | 2,331 | 435 | 0 | 15,968 | |||||||
| The analysis of movements in non-performing loans from December 31st to September 30th, 2018, is as follows: | ||||||||||||
| Balance as of December 31st, 2017 | 15,672 | |||||||||||
| Plus: Transfer from performing loan portfolio to non-performing loan portfolio | 22,840 | |||||||||||
| Collections | ||||||||||||
| Cash | (2,197) | |||||||||||
| Transfer to performing loan portfolio | (5,541) | |||||||||||
| Proceeds from foreclosure proceedings | (121) | |||||||||||
| Write-offs | (14,686) | |||||||||||
| Balance as of September 30th, 2018 | 15,966 | |||||||||||
| 7. Allowance for loan losses | |||||||
| The movement in the allowance for loan losses, from January 1st to September 30th, 2018, is as follows: | |||||||
| Balance as of January 1, 2018 | 20,051 | ||||||
| Allowance for loan losses | 15,074 | ||||||
| Write-offs | (14,686) | ||||||
| Foreign exchange result | (64) | ||||||
| Balance as of September 30th, 2018 | 20,375 | ||||||
| The table below presents a summary of write-offs by type of product as of September 30th, 2018: | |||||||
| Product | Charge-offs | Debit Relieves | Total | % | |||
| First quarter | |||||||
| Commercial loans | 1,386 | 29 | 1,415 | 28 | |||
| Mortgage loans | 136 | 18 | 154 | 3 | |||
| Credit card loans | 1,890 | 53 | 1,943 | 39 | |||
| Consumer loans | 1,435 | 50 | 1,485 | 30 | |||
| Total | 4,847 | 150 | 4,997 | 100 | |||
| Second quarter | |||||||
| Commercial loans | 1,343 | 55 | 1,398 | 30 | |||
| Mortgage loans | 239 | 18 | 257 | 6 | |||
| Credit card loans | 1,639 | 55 | 1,694 | 36 | |||
| Consumer loans | 1,294 | 19 | 1,313 | 28 | |||
| Total | 4,515 | 147 | 4,662 | 100 | |||
| | 58 |
| Third quarter | |||||||
| Commercial loans | 969 | 47 | 1,016 | 20 | |||
| Mortgage loans | 320 | 21 | 341 | 7 | |||
| Credit card loans | 1,874 | 70 | 1,944 | 39 | |||
| Consumer loans | 1,708 | 18 | 1,726 | 34 | |||
| Total | 4,871 | 156 | 5,027 | 100 | |||
| Accumulated 2018 | |||||||
| Commercial loans | 3,698 | 131 | 3,829 | 26 | |||
| Mortgage loans | 695 | 57 | 752 | 5 | |||
| Credit card loans | 5,403 | 178 | 5,581 | 38 | |||
| Consumer loans | 4,437 | 87 | 4,524 | 31 | |||
| Total | 14,233 | 453 | 14,686 | 100 | |||
| 8. Problematic loans |
| Loans portfolio was graded according to the general provisions issued by the National Banking and Securities Commission. The management considers that problematic loans are the ones graded as “D” and “E”, due to their low possibility for the collection of the full amount of principal. |
| 9. Programs of benefits to bank debtors with the support of the Federal Government | |||||||||||||
| Breakdown of special CETES , of which Ps.3,146 million correspond to the early extinction of debtor support programs: | |||||||||||||
| Amount | |||||||||||||
| Government Securities | |||||||||||||
| Special CETES for housing loan debtor support programs | 3,146 | ||||||||||||
| Total securities held to maturity (no reserve) | 3,146 | ||||||||||||
| Minus- | |||||||||||||
| Reserve for Special CETES | (166) | ||||||||||||
| Total securities held to maturity , net | 2,980 | ||||||||||||
| The remaining balance and expiration date of Special Cetes that were not repurchased by the Federal Government and therefore the Bank holds in its balance sheet as of September 30th, 2018, is as follows: | |||||||||||||
| Issue | Trust | Securities Number | Due date | Price (MXN) | Amount | ||||||||
| B4-220707 | 422-9 | 12,762,386 | 07-jul-22 | 110.47 | 1,410 | ||||||||
| B4-270701 | 423-2 | 15,292,752 | 01-jul-27 | 110.47 | 1,689 | ||||||||
| B4-220804 | 431-2 | 440,294 | 04-aug-22 | 101.15 | 45 | ||||||||
| BC-220804 | 431-2 | 71,442 | 04-aug-22 | 34.76 | 2 | ||||||||
| 3,146 | |||||||||||||
| 10. Average interest rates paid on deposits | |||||
| The average interest rates paid on deposits during September 2018, is as follow: | |||||
| Pesos | USD | ||||
| Average balance | 329,496 | 51,734 | |||
| Interest | 7,665 | 8 | |||
| Rate | 3.07% | 0.02% | |||
| | 59 |
| 11. Bank and other loans | |||||
| As of September 30th, 2018, banks and other loans are constituted as follows: | |||||
| Amount |
Average Rate (%) |
Maturity | |||
| Liabilities | |||||
| Loans in pesos | |||||
| Call money | 1,650 | 7.60 | From 1 to 2 days | ||
| Local bank loans | 1,500 | 8.28 | To 10 months | ||
| Public fiduciary funds | 12,446 | 8.13 | From 1 day to 10 years | ||
| Development banking institutions | 22,874 | 8.03 | From 1 day to 20 years | ||
| Total | 38,470 | ||||
| Loans in foreign currency | |||||
| Foreign bank loans | 2,821 | 3.02 | From 1 day to 3 years | ||
| Public fiduciary funds | 1,584 | 2.99 | From 2 days to 7 years | ||
| Development banking institutions | 40 | 6.43 | From 1 to 5 months | ||
| Total | 4,445 | ||||
| Total loans | 42,915 | ||||
| Accrued interests | 256 | ||||
| Total bank and other loans | 43,171 | ||||
| 12. Current and deferred taxes | ||
| Current taxes are composed as follows as of September 30th, 2018 | ||
| Income taxes | 2,887 | |
| Deferred taxes | 456 | (1) |
| Total Bank | 3,343 | |
| Current and-deferred taxes from other subsidiaries | 1,078 | |
| Total Consolidated Bank | 4,421 | |
| (1) Deferred taxes are composed as follows: | ||
| Global provision | (241) | |
| Fixed assets and deferred charges | 51 | |
| Net effect from financial instruments | 1,029 | |
| Accrued liabilities | (202) | |
| Others | (181) | |
| Total Bank | 456 | (1) |
| Allowance for loan losses of subsidiaries, net | 427 | |
| Others, subsidiaries | (43) | |
| Deferred income tax (net), Bank | 840 | |
| As of September 30th, 2018, deferred assets and liabilities are registered at 100% | ||
| Remainder of global provisions and allowances for loan losses | 8,701 | |
| Other | 9,971 | |
| Total deferred income tax (net) | 18,672 | |
| Deferred taxes registered in balance sheet accounts | 18,672 | |
| Deferred taxes registered in memorandum accounts | 0 | |
| | 60 |
| 13. Employee profit sharing | |
| As of September 30th, 2018, the deferred Employee profit sharing “EPS” is compromised as follows: | |
| Deferred EPS asset: | |
| Allowance for loan losses deducting outstanding | 1,351 |
| Fixed assets and deferred charges | 760 |
| Accrued liabilities | 477 |
| Capital losses carryforward | 887 |
| Commissions and interests early collected | 324 |
| Foreclosed assets | 83 |
| Labor obligations | 252 |
| Derivative financial transactions of exchange rate | 810 |
| Deferred EPS asset: | 4,944 |
| Deferred EPS liability: | |
| Net effect from financial instruments | (1,038) |
| Advance payments | (111) |
| Others | (59) |
| Deferred EPS liability | (1,208) |
| Less - Reserve | 0 |
| Deferred EPS asset (net) | 3,736 |
| 14. Capitalization Ratio |
Table I.1
Form for the disclosure of capital of paid-in capital without considering transiency in the application of adjustments in the regulation
| Reference | Capital Description | Capital |
| Level 1 (CET 1) Ordinary capital: Instruments and reserves | ||
| 1 | Ordinary shares that qualify for level 1 Common Capital plus corresponding premium | 34,765 |
| 2 | Earnings from previous fiscal years | 55,864 |
| 3 | Other elements of other comprehensive income (and other reserves) | 36,409 |
| 4 | Capital subject to gradual elimination of level 1 ordinary capital (only applicable for companies that are not lined to shares) | |
| 5 | Ordinary shares issued by subsidiaries held by third parties (amount allowed in level 1 ordinary capital) | |
| 6 | Level 1 ordinary capital before adjustments to regulation | 127,038 |
| Level 1 Ordinary capital: adjustments to regulation | ||
| 7 | Adjustments due to prudential valuation | |
| 8 | Goodwill (net of its corresponding deferred profit taxes debited) | 1,735 |
| 9 | Other intangibles other than rights to mortgage rights (net of its corresponding deferred profit taxes debited) | 5,571 |
| 10 | Deferred taxes to profit credited relying on future income excluding those that derive from temporary differences (net of deferred profit taxes debited) | 0 |
| 11 | Results of valuation of cash flow hedging instruments | 0 |
| 12 | Reserves to be constituted | 0 |
| 13 | Benefits surplus of securitization transactions | 0 |
| 14 | Losses and gains caused for the changes in credit rating of liabilities assessed at a reasonable value | 0 |
| | 61 |
| 15 | Pension plan for defined benefits | 0 |
| 16 | Investments in proprietary shares | 6 |
| 17 | Reciprocal investments in ordinary capital | 0 |
| 18 | Investments in capital of banks, financial institutions and insurance companies out of the reach of the regulation consolidation, net of short eligible positions, wherein the institution does not hold more than 10% of the issued capital (amount that exceeds the 10% threshold) | 60 |
| 19 | Significant investments in ordinary shares of banks, financial institutions and insurance companies out of the scope of the regulation consolidation, nets of eligible short positions, wherein the institutions holds more than 10% of the issued capital (amount that exceeds the 10% threshold) | 0 |
| 20 | Rights for mortgage services (amount exceeding the 10% threshold) | 0 |
| 21 | Deferred taxes assets resulting from temporary differences (amount exceeding the 10% threshold, net of deferred taxes debited) | 6,385 |
| 22 | Amount exceeding the 15% threshold. | |
| 23 | of which: significant investments wherein the institution holds more than 10% of ordinary shares of financial institutions | |
| 24 | of which: rights for mortgage services | |
| 25 | of which: Taxes to profit Deferred credited deriving from temporary differences | |
| 26 | National regulation adjustments | 27,964 |
| A | of which: Other elements of other comprehensive income (and other reserves) | 0 |
| B | of which: investments in subordinated debt | 0 |
| C | of which: profit or increase in the value of assets from the purchase of securitization positions (Originating Institutions) | 0 |
| D | of which: investments in multilateral entities | 0 |
| E | of which: investments in related corporations | 26,729 |
| F | of which: investments in risk capital | 0 |
| G | of which: Stakes on investments funds | 0 |
| H | of which: Funding for the purchase of proprietary shares | 0 |
| I | of which: Transactions in breach of provisions | 0 |
| J | of which: Deferred charges and installments | 993 |
| K | of which: Positions in First Losses Schemes | 0 |
| L | of which: Worker's Deferred Profit Sharing | 0 |
| M | of which: Relevant Related Persons | 0 |
| N | of which: Pension plan for defined benefits | 0 |
| O | of witch: Adjustment for capital acknowledgment | 0 |
| P | of which: investments in Clearing Houses | 241 |
| 27 | Regulation adjustments that apply to level 1 common stock due to level 1 capital shortage and level 2 capital to cover deductions | 0 |
| 28 | Total regulation adjustments to level 1 Common Capital | 41,720 |
| 29 | Level 1 Common Capital (CET1) | 85,318 |
| Level 1 additional capital: instruments | ||
| 30 | Instruments directly issued that qualify as level 1 additional capital, plus premium | 9,344 |
| 31 | of which: Qualify as capital under the applicable accounting criteria | 9,344 |
| 32 | of which: Qualify as liability under the applicable accounting criteria | |
| 33 | Capital instruments directly issued subject to gradual elimination of level 1 additional capital | 0 |
| 34 | Instruments issued of level 1 additional capital and level 1 Common Capital instruments that are not included in line 5 issued by subsidiaries held by third parties (amount allowed at additional level 1) | 0 |
| 35 | of which: instruments issued by subsidiaries subject to gradual elimination | |
| 36 | Level 1 additional capital before regulation adjustments | 9,344 |
| | 62 |
| Level 1 additional capital: regulation adjustments | ||
| 37 | Investments in held instruments of level 1 additional capital | |
| 38 | Investments in reciprocal shares in level 1 additional capital instruments. | |
| 39 | Investments in capital of banks, financial institutions and insurance companies out of the scope of the regulation consolidation, net of short eligible positions, wherein the institution holds more than 10% of the issued capital | |
| 40 | Significant investments in ordinary shares of banks, financial institutions and insurance companies out of the scope of the regulation consolidation, nets of eligible short positions, wherein the institutions holds more than 10% of the issued capital | |
| 41 | National regulation adjustments | 0 |
| 42 | Regulation adjustments that apply to level 1 common stock due to level 1 capital shortage and level 2 capital to cover deductions | |
| 43 | Total regulation adjustments to level 1 additional Common Capital | 0 |
| 44 | Level 1 additional capital (AT1) | 9,344 |
| 45 | Level 1 capital (T1 = CET1 + AT1) | 94,661 |
| Level 2 capital: instruments and reserves | ||
| 46 | Instruments directly issued that qualify as level 2 capital, plus premium | 24,448 |
| 47 | Capital instruments directly issued subject to gradual elimination of level 2 capital. | |
| 48 | Level 2 capital instruments and level 1 Common Capital instruments and level 1 additional capital that has not been included in lines 5 or 34, which have been issued by subsidiaries held by third parties (amount allowed in level 2 completer capital) | 0 |
| 49 | of which: instruments issued by subsidiaries subject to gradual elimination | 0 |
| 50 | Reserves | 0 |
| 51 | Level 2 capital before regulation adjustments | 24,448 |
| Level 2 capital : regulation adjustments | ||
| 52 | Investments in own instruments of level 2 capital | |
| 53 | Reciprocal investments in level 2 capital instruments | |
| 54 | Investments in capital of banks, financial institutions and insurance companies out of the scope of the regulation consolidation, net of short eligible positions, wherein the institution does not hold more than 10% of the issued capital (amount exceeding the 10% threshold) | |
| 55 | Significant investments in ordinary shares of banks, financial institutions and insurance companies out of the scope of the regulation consolidation, nets of eligible short positions, wherein the institutions holds more than 10% of the issued capital | |
| 56 | National regulation adjustments | 0 |
| 57 | Total regulation adjustments to level 2 capital | 0 |
| 58 | Level 2 capital (T2) | 24,448 |
| 59 | Total stock (TC = T1 + T2) | 119,109 |
| 60 | Total Risk Weighted Assets | 743,422 |
| Capital reasons and buffers | ||
| 61 | Level 1 Common Capital (as percentage of assets weighted by total risks) | 11.48% |
| 62 | Level 1 Stock (as percentage of assets weighted by total risks) | 12.73% |
| 63 | Total capital (as percentage of assets weighted by total risks) | 16.02% |
| 64 | Institutional specific buffer (must at least consist of: the level 1 Common Capital requirement plus the capital maintenance buffer, plus the countercyclical buffer, plus D-SIB buffer; expressed as percentage of the total risk weighted assets) | 15.18% |
| 65 | of which: Buffer of capital preservation | 2.50% |
| 66 | of which: Buffer of specific bank countercyclical | |
| 67 | of which: Buffer of systematically important local banks (D-SIB) | 1.20% |
| | 63 |
| 68 | Level 1 Common Capital available for hedging the buffers (as percentage of total risk weighted assets) | 4.48% |
| National minimums (if other than those of Basel 3) | ||
| 69 | National minimum reason of CET1 (if different than the minimum established by Basilea 3) | |
| 70 | National minimum reason of T1 (if different than the minimum established by Basel 3) | |
| 71 | National minimum reason of TC (if different than the minimum established by Basel 3) | |
| Amounts under the deduction thresholds (before weighting by risk) | ||
| 72 | Non-significant investment in the capital of other financial institutions | |
| 73 | Significant investment in the capital of other financial institutions | |
| 74 | Rights for mortgage services (net of Deferred profit taxes debited) | |
| 75 | Deferred profit taxes credited derived from temporary differences (net of Deferred profit taxes debited) | 6,983 |
| Applicable limits to the inclusion of reserves in level 2 capital | ||
| 76 | Eligible reserves to be included in level 2 capital with respect to expositions subject to standardized methodology (prior application of limit) | |
| 77 | Limit in the inclusion of level 2 capital provisions under standardized methodology | |
| 78 | Eligible reserves for its inclusion on level 2 capital regarding exposure subject to credit risks (before the limit application). | |
| 79 | Limit in the inclusion of reserves in level 2 capital under internal rating methodology | |
| Capital instruments subject to gradual elimination (applicable only between January 1, 2018 and January 1, 2022) | ||
| 80 | Current limit of CET1 instruments subject to gradual elimination | |
| 81 | Amount excluded from CET1 due to limit (excess over the limit after amortization and maturity periods) | |
| 82 | Current limit of AT1 instruments subject to gradual elimination | |
| 83 | Amount excluded from AT1 due to limit (excess over the limit after amortization and maturity periods) | |
| 84 | Current limit of T2 instruments subject to gradual elimination | |
| 85 | Amount excluded from T2 due to limit (excess over the limit after amortization and maturity periods) |
I.2
Notes to the disclosure form of paid-in capital without considering transiency in the application of regulatory adjustments
| Reference | Description |
| 1 | Elements of capital contributed pursuant to fraction I item a) numbers 1) and 2) of Article 2 Bis 6 hereof |
| 2 | Results from previous fiscal years and their corresponding updates. |
| 3 | Capital reserves, net result, result per assessment of titles available for sale, accrued effect per conversion, result per assessment of cash flow, result from non-monetary assets holding, and the measuring balance from defined benefits to the employees considering on each concept its updates. |
| 4 | Does not apply. The capital stock of credit institutions in Mexico is represented by representative certificates or shares. This concept only applies for entities where such capital is represented by representative certificates or shares. |
| 5 | Does not apply for the capitalization scope in Mexico which is on a non-consolidated basis. This concept will only apply for entities with a consolidated scope. |
| 6 | Sum of concepts 1 through 5. |
| 7 | Does not apply. In Mexico the use of internal models for calculating capital requirements per market risk is not allowed. |
| 8 | Goodwill, net of owed differed profit taxes pursuant to the provisions of fraction I item n) of Article 2 Bis 6 hereof. |
| | 64 |
| 9 | Intangibles, other than commercial credit, and if applicable to mortgage service rights, net of owed deferred profit taxes, pursuant to the provisions of fraction I item n) of Article 2 Bis 6 hereof. |
| 10* | Credited deferred profit taxes from losses and fiscal credits pursuant to the provisions of fraction I item p) of Article 2 Bis 6 hereof. |
| This is a more conservative approach than the one established by the Basel Committee on Banking Supervision in its document "Basel III: Global legal framework for the reinforcement of banks and banking systems" published on June 2011, given that it does not allow to set off with owed differed profit taxes. | |
| 11 | Result from assessment of cash flow hedging instruments corresponding to hedged entries that are not assessed at reasonable value. |
| 12* | Reserves pending constitution pursuant to the provisions of fraction I item k) of Article 2 Bis 6 hereof. |
| This is a more conservative approach than the one established by the Basel Committee on Banking Supervision in its document "Basel III: Global legal framework for the reinforcement of banks and banking systems" published on June 2011, given that deducts from level 1 common stock the preventive reserves pending constitution, according to the provisions of Chapter V of the Second Title hereof, as well as those constituted charged to accounting accounts that are part of the result entries or shareholders' equity and not only the positive difference between the Aggregate Expected Losses minus the Aggregate Admissible Reserves, in the event the Institutions use methods based in internal qualifications in the determination of their capital requirements. | |
| 13 | Benefits surplus of securitization transactions pursuant to the provisions of fraction I item c) of Article 2 Bis 6 hereof. |
| 14 | Does not apply |
| 15 | Investments made by the benefit pension fund defined corresponding to resources to which the Institution does not have unrestrictive or unlimited access. These investments are considered as net of the plan's liabilities and owed differed taxes to profit that correspond that have not been applied in any other regulatory adjustment. |
| 16* | The amount of investment in any own action the institution acquires : in accordance with the provisions of the Act in accordance with the provisions of section I subsection d) of Article 2 Bis 6 of these provisions ; through rates predicted values of section I subsection e ) of Section 2 Bis 6 of these provisions and through investment in funds established in section I point i) of article 2 bis 6. |
| This treatment is more conservative than the one established by the Committee on Banking Basel Supervision in its document " Basel III : A global regulatory framework for more resilient banks and banking systems " published in June 2011 because the deduction for this concept is made of common equity tier 1 capital , regardless of the level of capital which has been invested | |
| 17* | Investments, in capital of corporations, other than financial entities referred to by item f) of Article 2 Bis 6 hereof, that are in turn, directly or indirectly, shareholders of the institution itself, of the fund |
| This is a more conservative approach to the one established by the Basel Committee on Banking Supervision in its documents "Basel III: Global regulatory framework for the reinforcement of banks and banking systems" published on June 2011 given that the deduction for this concept is made in the level 1 common stock, irrespective of the capital level where it has been invested, and in addition because any type of entity is considered, not only financial entities. |
| | 65 |
| 18* | Investments in shares, where the Institution owns up to 10% of the capital stock of the financial entities referred to by Articles 89 of the Law and 31 of the Law Regulating Financial Groups pursuant to the provisions of fraction I item f) of Article 2 Bis 6 hereof, including those investments made through investment funds referred to by fraction I item i) of Article 2 Bis 6. The previous investments exclude those made in the capital of development and promotion multilateral organizations of an international nature that have a credit Qualification assigned by any of the issuer's Qualifying Institutions, equal or greater than long term Risk Degree 2. |
| This is a more conservative approach to the one established by the Basel Committee on Banking Supervision in its documents "Basel III: Global regulatory framework for the reinforcement of banks and banking systems" published on June 2011 given that the deduction for this concept is made in level 1 common stock, irrespective of the capital level in which it is invested, and additionally because it is deducted from the aggregate amount registered of the investments. | |
| 19* | Investments in shares, where the Institution owns up to 10% of the capital stock of the financial entities referred to by Articles 89 of the Law and 31 of the Law Regulating Financial Groups pursuant to the provisions of fraction I fraction f) of Article 2 Bis 6 hereof, including those investments made through investment funds referred to by fraction I item i) of Article 2 Bis 6. The previous investments exclude those made in development and promotion multilateral organizations of an international nature that have a credit Qualification assigned by any of the issuer's Qualifying institutions, equal or greater than long term Risk Degree 2. |
| This is a more conservative approach to the one established by the Basel Committee on Banking Supervision in its documents "Basel III: Global regulatory framework for the reinforcement of banks and banking systems" published on June 2011 given that the deduction for this concept is made from level 1 common stock, irrespective of the level of capital where it has been investment, and additionally because the aggregate amount registered of investments is deducted. | |
| 20* | Mortgage service s rights shall be deducted from the aggregate amount registered in the event these rights exist. |
| This is a more conservative approach to the one established by the Basel Committee on Banking Supervision in its documents "Basel III: Global regulatory framework for the reinforcement of banks and banking systems" published on June 2011 given that the aggregate amount registered of rights is deducted. | |
| 21 | Deferred taxes assets resulting from temporary differences minus the corresponding owed differed profit taxes not considered to set-off other adjustments, exceeding 10% of the difference between the reference 6 and the sum of references 7 through 20. |
| 22 | Does not apply. Concepts were deducted from the aggregate capital. See notes of references 19, 20 and 21. |
| 23 | Does not apply. Concepts were deducted from the aggregate capital. See note of references 19. |
| 24 | Does not apply. Concepts were deducted from the aggregate capital. See note of reference 20. |
| 25 | Does not apply. Concepts were deducted from the aggregate capital. See note of reference 21. |
| 26 | National adjustments considered as the sum of the following concepts. |
| A. | The sum of the accrued effect for conversion and result for ownership of non-monetary assets considering the amount of each of these concepts with a sign different than the one considered to include them in reference 3, namely, if positive in this concept shall be entered as negatives and vice versa. |
| B. | Investments in subordinated debt instruments, pursuant to the provisions of fraction I item b) of Article 2 Bis 6 hereof. |
| C. | The amount resulting if on account of the purchase of securitization positions, the originating Institutions register a profit or increase in the value of their assets with respect to the assets previously registered in its balance, pursuant to the provisions of fraction I item c) of Article 2 Bis 6 hereof. |
| | 66 |
| D. | Investments in capital of development or promotion multilateral organizations of an international nature pursuant to the provisions of fraction I item f) of Article 2 Bis 6 hereof, that have a credit Qualification assigned by any of the issuer's Qualifying Institutions, equal or better to long term Risk Degree 2. |
| E. | Investments in shares or corporations related to the Institution under the terms of Articles 73, 73 Bis and 73 Bis 1 of the Law, including the amount corresponding to investments in investment funds and investments indices pursuant to the provisions of fraction I item g) of Article 2 Bis 6 hereof. |
| F. | Investments made by development banking institutions in risk capital, pursuant to the provisions of fraction I item h) of Article 2 Bis 6 hereof. |
| G. | Investments in shares, other than fix capital, in listed investment funds wherein the Institutions holds more than 15 per cent of shareholder's equity of the aforementioned investment funds, pursuant to fraction I item i) of Article 2 Bis 6, that have not been considered in the preceding references. |
| H. | Any type of contribution which resources are destined to the purchase of shares in the financial group's holding company, of the other financial entities that comprise the group to which the Institution belongs or of the financial affiliates of the latter pursuant to the provisions of fraction I item l) of Article 2 Bis 6 hereof. |
| I. | Transactions that infringe the provisions, pursuant to the provisions of fraction I item m) of Article 2 Bis 6 hereof. |
| J. | Differed charges and early payments, net of owed differed profit taxes, pursuant to the provisions of fraction I item n) of Article 2 Bis 6 hereof. |
| K. | Positions pertaining to the First Losses Scheme where the risk is preserved or credit protection is provided up to a certain limit of a position pursuant to fraction I item o) of Article 2 Bis 6. |
| L. | Worker's participation in credited differed profits pursuant to fraction I item p) of Article 2 Bis 6 hereof. |
| M. | The added amount of Transactions Subject to Credit Risk owed by Relevant Related Persons pursuant to fraction I item r) of Article 2 Bis 6 hereof. |
| N. | The difference between the investments made by the benefit pension funds defined pursuant to Article 2 Bis 8 minus reference 15. |
| O. | Adjustment for the acknowledgment of Net Capital . The amount shown corresponds to the amount registered in box C1 of the form included in section II hereof. |
| P. | The investments or contributions, directly or indirectly, in the corporation's capital or in the trust estate or other type of similar figures that have the purpose to set off and liquidate Transactions executed in the stock market, except for such corporation's or trust's share in the former pursuant to item f) fraction I of Article 2 Bis 6. |
| 27 | Does not apply. There are no regulatory adjustments for additional level 1 capital nor for ancillary capital. All regulatory adjustments are made from the level 1 common stock. |
| 28 | Sum of lines 7 through 22, plus lines 26 and 27. |
| 29 | Line 6 minus line 28. |
| 30 | The amount corresponding to titles representing the capital stock (including its share sale premium) that had not been considered in Fundamental Capital and Capital Instruments, that meet the conditions established in fraction II of Article 2 Bis 6 hereof. |
| 31 | Amount of line 30 qualified as capital under the applicable accounting standards. |
| 32 | Does not apply. Instruments directly issued that qualify as additional level 1 capital, plus its premium are registered for accounting purposes as capital. |
| 33 | Subordinated obligations computed as Non-Fundamental Capital, pursuant to the provisions of Article Third Transitory of Resolution 50th that amends the general provisions applicable to Credit Institutions, (Resolution 50th) |
| 34 | Does not apply. See note to reference 5. |
| 35 | Does not apply. See note to reference 5. |
| 36 | Sum of lines 30, 33 and 34. |
| | 67 |
| 37* | Does not apply. Deduction is made in aggregate level 1 common capital. |
| 38* | Does not apply. Deduction is made in aggregate level 1 common capital. |
| 39* | Does not apply. Deduction is made in aggregate level 1 common capital. |
| 40* | Does not apply. Deduction is made in aggregate level 1 common capital. |
| 41 | National adjustments considered: |
| Adjustment for the acknowledgment of Net Capital. The amount shown corresponds to the amount registered in box C2 of the form included in section II hereof. | |
| 42 | Does not apply. There are no regulatory adjustments for ancillary capital. All regulatory adjustments are made from the level 1 common stock. |
| 43 | Sum of lines 37 through 42. |
| 44 | Line 36, minus line 43. |
| 45 | Line 29, plus line 44. |
| 46 | The amount corresponding to titles representing the capital stock (including its share sale premium) that had not been considered in Capital Fundamental nor in Non-Fundamental Capital and Capital Instruments, that comply with Exhibit 1-S hereof pursuant to the provisions of Article 2 Bis 7 hereof. |
| 47 | Subordinated obligations computed as ancillary capital, pursuant to the provisions of Article Third Transitory, of Resolution 50th |
| 48 | Does not apply. See note to reference 5. |
| 49 | Does not apply. See note to reference 5. |
| 50 | Preventive estimations for credit risk up to a sum of 1.25% of the assets weighed by credit risk corresponding to the Transactions that use the Standard Method to calculate the capital requirement per credit risk; and the positive difference of the Aggregate Admissible Reserves minus the Aggregate Expected Losses, up to an amount that does not exceed of 0.6 per cent of the assets weighed by credit risk, corresponding to the Transactions wherein the method based in internal qualifications to calculate the capital requirements by credit risk is used, pursuant to fraction III of Article 2 Bis 7. |
| 51 | Sun of lines 46 through 48, plus line 50. |
| 52* | Does not apply. The deduction is made in aggregate of level 1 common stock. |
| 53* | Does not apply. The deduction is made in aggregate of level 1 common stock. |
| 54* | Does not apply. The deduction is made in aggregate of level 1 common stock. |
| 55* | Does not apply. The deduction is made in aggregate of level 1 common stock. |
| 56 | National adjustments considered: |
| Adjustment for the acknowledgment of Net Capital. The amount shown corresponds to the amount registered in box C4 of the form included in section II hereof. | |
| 57 | Sum of lines 52 through 56. |
| 58 | Line 51, minus line 57. |
| 59 | Line 45, plus line 58. |
| 60 | Total Risk Weighted Assets. |
| 61 | Line 29 divided by line 60 (expressed as percentages) |
| 62 | Line 45, divided by line 60 (expressed as percentages) |
| 63 | Line 59 divided by line 60 (expressed as percentages) |
| 64 | To report the percentages amount expressed on lines 61, 65, 66 and 67. |
| 65 | Report 2.5% |
| 66 | Percentage corresponding to the Countercyclical Capital buffer referred to on section c), subsection III, article 2 Bis 5 |
| 67 | The SCCS amount on line 64 (expressed as a percentage of the total risk weighted assets) which is related to the banking institutions’ capital buffer for systemic character, in accordance with section b), subsection III, article 2 Bis 5. |
| 68 | Line 61 minus 7% |
| | 68 |
| 69 | Does not apply. The minimum is the same as established by the Basel Committee on Banking Supervision in its document "Basel III: Global regulatory framework for the reinforcement of banks and banking systems" published in June 2011. |
| 70 | Does not apply. The minimum is the same as established by the Basel Committee on Banking Supervision in its document "Basel III: Global regulatory framework for the reinforcement of banks and banking systems" published in June 2011. |
| 71 | Does not apply. The minimum is the same as established by the Basel Committee on Banking Supervision in its document "Basel III: Global regulatory framework for the reinforcement of banks and banking systems" published in June 2011. |
| 72 | Does not apply. The concept was deducted from the aggregate capital. See note of reference 18. |
| 73 | Does not apply. The concept was deducted from the aggregate capital. See note of reference 19. |
| 74 | Does not apply. The concept was deducted from the aggregate capital. See note of reference 20. |
| 75 | The amount, that does not exceed 10% of the difference between reference 6 and the sum of references 7 through 20, of the credited differed taxes assets resulting from temporary differences minus those corresponding to owed profit taxes not considered to set off other adjustments. |
| 76 | Preventive estimations for credit risk corresponding to the Transactions that use the Standard Method to calculate the capital requirement per credit risk. |
| 77 | 1.25% of weighed assets per credit risk, corresponding to Transactions wherein the Standard Method to calculate the capital requirement by credit risk. |
| 78 | Positive difference of the Aggregate Admissible Reserves minus the Aggregate Expected Losses corresponding to Transactions wherein the method based in internal qualifications to calculate the capital requirement by credit risk is used. |
| 79 | 0.6 per cent of the weighted assets by credit risk, corresponding to Transactions wherein the method based in internal qualifications to calculate the capital requirement by credit risk is used. |
| 80 | Does not apply. There are no instruments subject to transience that compute in level 1 common stock |
| 81 | Does not apply. There are no instruments subject to transience that compute in level 1 common stock |
| 82 | Balance of instruments computed as capital in the basic portion by December 31, 2012 for the corresponding balance limit therein. |
| 83 | Balance of instruments computed as capital in the basic portion by December 31, 2012 minus line 33. |
| 84 | Balance of instruments computed as capital in the complementary portion by December 31, 2012 for the corresponding balance limit therein. |
| 85 | Balance of instruments computed as capital in the basic portion by December 31, 2012 minus line 47. |
Note: * The aforementioned approach is more conservative than the one established by the Basel Committee on Banking Supervision in its document "Basel III: Global regulatory framework for the reinforcement of banks and banking systems" published in June 2011.
Table II.1
Net Capital Ratio of the balance sheet
| Reference of the balance sheet items | Balance sheet items | Amount shown in the balance sheet |
| Assets | 1,352,264 | |
| BG1 | Funds Available | 71,536 |
| BG2 | Margin accounts | 1,594 |
| BG3 | Investment in securities | 338,952 |
| BG4 | Debtors under sale and repurchase agreements | 30,782 |
| | 69 |
| BG5 | Securities loans) | 0 |
| BG6 | Derivatives | 153,188 |
| BG7 | Valuation adjustment for hedged financial assets | -10 |
| BG8 | Total loan portfolio | 615,930 |
| BG9 | Benefits to be received in securitization transactions | 0 |
| BG10 | Other receivables (net) | 84,069 |
| BG11 | Foreclosed assets (net | 158 |
| BG12 | Property, furniture and fixtures (net) | 6,658 |
| BG13 | Long-term investment in shares | 27,930 |
| BG14 | Non current assets held for sale | 0 |
| BG15 | Deferred income taxes (net) | 13,368 |
| BG16 | Other assets (net) | 8,110 |
| Liabilities | 1,225,217 | |
| BG17 | Deposits | 727,989 |
| BG18 | Bank and other loans | 21,785 |
| BG19 | Creditors under sale and repurchase agreements | 157,562 |
| BG20 | Securities loans | 1 |
| BG21 | Collateral sold or pledged as guarantee | 21,088 |
| BG22 | Derivatives | 146,711 |
| BG23 | Valuation adjustment for hedged financial liabilities | 0 |
| BG24 | Creditors from settlement of transactions | 0 |
| BG25 | Other payables, deferred revenues and other advances | 116,075 |
| BG26 | Subordinated debentures outstanding | 33,791 |
| BG27 | Deferred income taxes (net) | 0 |
| BG28 | Deferred revenues and other advances | 215 |
| Shareholders' Equity | 127,047 | |
| BG29 | Paid-in capital | 34,765 |
| BG30 | Other capital | 92,282 |
| Memorandum accounts | 4,219,284 | |
| BG31 | Guarantees granted | 0 |
| BG32 | Contingent assets and liabilities | 60 |
| BG33 | Credit commitments | 134,261 |
| BG34 | Assets in trust or mandate | 165,018 |
| BG35 | Federal Government financial agent | |
| BG36 | Assets in custody or under administration | 2,381,158 |
| BG37 | Collateral received by the entity | 121,249 |
| BG38 | Collateral received and sold or pledged as guarantee | 68,652 |
| BG39 | Investment bank operations on behalf of third parties | 0 |
| BG40 | Uncollected interest earned on past due loan portfolio | 495 |
| BG41 | Other accounts | 1,348,392 |
| | 70 |
Table II.2
Regulatory concepts considered in the calculation of Net Capital components
| Identifier | Regulatory concepts considered for the calculation of Net Capital components | Reference of the format for the disclosure of capital integration of section I hereof | Amount pursuant to the notes of the table Regulatory concepts considered for the calculation of Net Capital components | Reference(s) of balance sheet item and amount related with the regulatory concept considered for the calculation of Net Capital derived from the aforementioned reference |
| Asset | ||||
| 1 | Goodwill | 8 | 1,735 | BG16= 8,110 Minus: deferred charges and advance payments 993; intangibles 5,571; advance payments that are computed as risk assets 418; other assets are computed as risk assets 607 |
| 2 | Intangible assets | 9 | 5,571 | BG16= 8,110 Minus: deferred charges and advance payments 993; intangibles 1,735; advance payments that are computed as risk assets 418; other assets that are computed as risk assets 607 |
| 3 | Deferred income tax from tax losses carryforward and tax credits | 10 | ||
| 4 | Benefits to be received in securitization transactions | 13 | ||
| 5 | Defined benefit pension plan assets with no restriction and unlimited access | 15 | ||
| 6 | Investment in own-equity securities | 16 | 6 | BG3= 338,952 Minus: Reciprocal investments in common capital of financial entities 60; Investments in securities computed as risk assets 338,886 |
| 7 | Reciprocal investments in common capital | 17 | ||
| 8 | Direct investments in the capital of financial entities wherein the institution does not hold more than 10% of the issued capital stock | 18 |
| | 71 |
| 9 | Indirect investment in capital of financial entities wherein the institution does not hold more than 10% of the issued capital stock | 18 | 60 | BG3= 338,952 Minus: Investment in own-equity securities 6; Investments in securities computed as risk assets 388,886 |
| 10 | Direct investments in the capital of financial entities wherein the institution holds more than 10% of the issued capital stock | 19 | ||
| 11 | Indirect investment in capital of financial entities wherein the institution holds more than 10% of the issued capital stock | 19 | ||
| 12 | Deferred income tax from temporary differences | 21 | 6,385 | BG15= 13,368 Minus: Amount computed as risk asset 6,983 |
| 13 | Reserves recognized as complementary capital | 50 | BG8= Total loan portfolio 615,930 | |
| 14 | Investments in subordinated debt | 26 - B | ||
| 15 | Investments in multilateral entities | 26 - D | BG13= 27,930 Minus: Investments in subsidiaries 26,729; Investments in clearing houses 241; Investments in associated companies 109; Other investments that are computed as risk assets 850 | |
| 16 | Investments in associated companies | 26 - E | 26,729 | BG13= 27,930 Minus: Investments in clearing houses 241; Investments in associated companies 109; Other investments that are computed as risk assets 850 |
| 17 | Investments in risk capital | 26 - F | ||
| 18 | Investments in investment corporations | 26 - G | ||
| 19 | Financing for repurchase of own shares | 26 - H | ||
| 20 | Deferred charges and advance payments | 26 - J | 993 | BG16= 8,110 Minus: intangible assets 7,306; others assets that are computed as risk assets 418; other assets are computed as risk assets 607 |
| | 72 |
| 21 | Deferred employee profit sharing (net) | 26 - L | ||
| 22 | Defined benefit pension plan assets | 26 - N | ||
| 23 | Investments in clearing houses | 26 - P | 241 | BG13= 27,930 Minus: Investments in subsidiaries 26,729; Investments in associated companies 109; other investments that are computed as risk assets 850 |
| Liabilities | ||||
| 24 | Deferred income tax related to goodwill | 8 | ||
| 25 | Deferred income tax related to other intangible assets | 9 | ||
| 26 | Provision for defined benefit pension plan with no restriction and unlimited access | 15 | ||
| 27 | Deferred income tax related to defined benefit pension plan | 15 | ||
| 28 | Deferred income tax related to other items | 21 | ||
| 29 | Subordinated liabilities that meets with Exhibit 1-R | 31 | ||
| 30 | Subordinated liabilities subject to transitoriness that compute as basic capital 2 | 33 | ||
| 31 | Subordinated liabilities that meets with Exhibit 1-S | 46 | ||
| 32 | Subordinated obligations subject to transitoriness that compute as complementary capital | 47 | ||
| 33 | Deferred income tax related to deferred charges and advance payments | 26 - J | ||
| Shareholders' Equity | ||||
| 34 | Paid-in capital that meets with Exhibit 1-Q | 1 | 34,765 | BG29 |
| 35 | Retained earnings | 2 | 55,864 | BG30= 92,282 Minus: other items of earned capital 36,409, cumulative effect of conversion 9 |
| 36 | Result from valuation of cash flow hedge instruments | 3 | ||
| 37 | Other items of earned capital | 3 | 36,409 | BG30= 92,282 Minus: Retained earnings 55,864,cumulative effect of conversion 9 |
| 38 | Paid-in capital that meets with Exhibit 1-R | 31 | 9,344 | BG26= 33,791 More: Subordinated debt instruments non-convertible 24,448 |
| | 73 |
| 39 | Paid-in capital that meets with Exhibit 1-S | 46 | 24,448 | BG26= 33,791 More: Subordinated debt instruments convertible 9,344 |
| 40 | Result from valuation of cash flow hedge instruments | 03, 11 | ||
| 41 | Cumulative effect from conversion | 3, 26 - A | ||
| 42 | Result from ownership of non-monetary assets | 3, 26 - A | ||
| Accounts in order | ||||
| 43 | Positions in First Losses Schemes | 26 - K | ||
| Regulatory concepts not considered in the balance sheet | ||||
| 44 | Reserves pending constitution | 12 | ||
| 45 | Profit or increase of the value of assets from the purchase of securitization positions (Originating Institutions) | 26 - C | ||
| 46 | Transactions that breach the provisions | 26 - I | ||
| 47 | Transactions with Relevant Related Persons | 26 - M | ||
| 48 | Repealed |
Table II.3
Notes to table III.2 "Regulatory concepts considered for the calculation of Net Capital components"
| Identifier | Description |
| 1 | Commercial credit. |
| 2 | Intangibles, without including commercial credit. |
| 3 | Credited differed profit taxes originating from fiscal losses and credits. |
| 4 | Benefits regarding the remnant of securitization transactions. |
| 5 | Investments of pension plan for defined benefits without unrestrictive and unlimited access. |
| 6 | Any share that the Institution acquires pursuant to the provisions of the Law, that have not been subtracted; considering those amounts acquired through investments in securities indexes and the amount corresponding to investments in investment funds other than those provided by reference 18. |
| 7 | Investments in shares in corporations other than financial entities referred to by item f) of fraction I of Article 2 Bis 6 hereof, that are in turn, directly or indirectly shareholders of the Institution itself, of the financial group's holding company, of the remaining financial entities that comprise the group to which the Institution belongs or financial affiliates of the latter, considering those investments corresponding to investment funds other than those provided by reference 18. |
| 8 | Direct investments in financial entities capital referred to by Article 89 of the Law and 12 and 8 of the Law Regulating Financial Groups, where the Institution owns more than 10% of the capital thereof. |
| 9 | Direct investments in financial entities capital referred to by Article 89 of the Law and 12 and 8 of the Law Regulating Financial Groups, where the Institution owns more than 10% of the capital thereof. |
| 10 | Direct investments in financial entities capital referred to by Article 89 of the Law and 12 and 8 of the Law Regulating Financial Groups, where the Institution owns more than 10% of the capital thereof. |
| 11 | Indirect investments in financial entities capital referred to by Article 89 of the Law and 12 and 8 of the Law Regulating Financial Groups, where the Institution owns more than 10% of the capital thereof. |
| 12 | Credited differed profit taxes originating from temporary differences. |
| 13 | Preventive estimates for credit risk up to a sum of 1.25% of the weighted assets by credit risk, corresponding to Transactions wherein the Standard Method is used to calculate the capital requirement by credit risk; and the positive difference of the Aggregate Admissible Reserves minus the Aggregate the Expected Losses, up to an amount that does not exceed of 0.6 per cent of the weighted assets by credit risk, corresponding to Transactions where the method based in internal qualifications is used to calculate the capital requirement by credit risk. |
| 14 | Investments in subordinated debt instruments, pursuant to the provisions of fraction I item b) of Article 2 Bis 6 hereof. |
| | 74 |
| 15 | Investments in development or promotion multilateral organizations of an international nature pursuant to the provisions of fraction I item f) of Article 2 Bis 6 hereof that have a credit Qualification assigned by any of the issuer's Qualifying Institutions, equal or greater than long term Risk Degree 2. |
| 16 | Investments in shares of corporations related with the Institution under the terms of Articles 73, 73 Bis and 73 Bis 1 of the Law, including the amount corresponding to investments in investment corporations and investments in indices pursuant to the provisions of fraction I item g) of Article 2 Bis 6 hereof. |
| 17 | Investments made in development banking institutions in risk capital, pursuant to the provisions of fraction I item h) of Article 2 Bis 6 hereof. |
| 18 | Investments in shares, other than fix capital, of listed investment corporations, wherein the Institution holds more than 15 per cent of shareholders' equity of the aforementioned investment corporation, pursuant to fraction I item i) of Article 2 Bis 6, that have not been considered in the previous references. |
| 19 | Any type of contributions which resources are destined to the purchase of shares of the financial group's holding company, of the other financial entities that comprise the group to which the Institution belongs or the latter's financial affiliates, pursuant to the provisions of fraction I item l) of Article 2 Bis 6 hereof. |
| 20 | Differed charges and early payments. |
| 21 | Workers' share in credited differed profits pursuant to fraction I item p) of Article 2 Bis 6 hereof. |
| 22 | Investments of the pension plan for benefits defined that have to be deducted according with Article 2 Bis 8 hereof. |
| 23 | Investments or contributions, directly or indirectly, in the corporation's capital or in trust estate or other type of similar figures that have the purpose of setting off and liquidating Transactions executed in the stock market, unless the share in such corporations or trusts in the former pursuant to item f) fraction I of Article 2 Bis 6. |
| 24 | Owed differed taxes to profit originating from temporary differences related to commercial credit. |
| 25 | Owed differed taxes to profit originated from temporary differences related to other intangibles (other than commercial credit). |
| 26 | Liabilities of the pension plan for benefits defined related to investments of the pension plan for defined benefits. |
| 27 | Owed differed taxes originated from temporary differences related to the pension plan for defined benefits. |
| 28 | Owed differed profit taxes originated from temporary differences other than those of references 24, 25, 27 and 33 |
| 29 | Amount of subordinated obligations that meet with Exhibit 1-R hereof. |
| 30 | Amount of subordinated obligations subject to transience that are computed as Non-Fundamental Capital. |
| 31 | Amount of subordinated obligations that meet with Exhibit 1-S hereof. |
| 32 | Amount of subordinated obligations subject to transience that compute as ancillary capital. |
| 33 | Owed differed profit taxes originated from temporary differences related to differed charges and early payments. |
| 34 | Amount of capital contributed that meets the provisions of Exhibit 1-Q hereof. |
| 35 | Result of the previous fiscal years. |
| 36 | Result for the assessment of cash flow hedging instruments from covered entries assessed at reasonable value. |
| 37 | Net result and result for the assessment of titles available for sale. |
| 38 | Amount of capital contributed that meets the provisions of Exhibit 1-R hereof. |
| 39 | Amount of capital contributed that meets the provisions of Exhibit 1-S hereof. |
| 40 | Result for the assessment of cash flow hedging instruments from covered entries assessed at capitalized cost. |
| 41 | Accrued effect by conversion. |
| 42 | Result for ownership of non-monetary assets. |
| 43 | Positions related with the First Losses Scheme wherein risk is preserved or credit protection provided until certain limit of a position pursuant to fraction I item o) of Article 2 Bis 6. |
| 44 | Reserves pending constitution pursuant to the provisions of fraction I item k) of Article 2 Bis 6 hereof. |
| 45 | The amount resulting if on account of the purchase of securitization positions, the originating Institutions register a profit or an increase in the value of their assets with respect to assets previously registered in its balance, pursuant to the provisions of fraction I item c) of Article 2 Bis 6 hereof. |
| 46 | Transactions that infringe the provisions, pursuant to the provisions of fraction I item m) of Article 2 Bis 6 hereof. |
| 47 | The aggregate amount of Transactions Subject to Credit Risk owed by Relevant Related Persons pursuant to fraction I item r) of Article 2 Bis 6 hereof. |
| | 75 |
Table III.1
Positions exposed to market risks per risk factor
| Concept | Amount of equivalent positions | Capital Requirement |
| Transactions in national currency with nominal rate | 67,668 | 5,413 |
| Transactions with debt instruments in national currency with surtax and reviewable rate | 1,664 | 133 |
| Transactions in national currency with real rate or denominated in UDIs | 6,583 | 527 |
| Transactions in national currency with yield rate referred to the increase of the General Minimum Wage | 12,086 | 967 |
| Positions in UDIs or with yield referred to INPC | 39 | 3 |
| Positions in national currency with yield rate referred to the increase of the General Minimum Wage | 253 | 20 |
| Transactions in foreign currency with nominal rate | 36,630 | 2,930 |
| Positions in foreign currency or with yield indexed to the exchange rate | 9,981 | 798 |
| Positions in shares or with yield indexed to the price of one share or set of shares | 1,727 | 138 |
| Positions in commodities | 0 | 0 |
| Impact Capital requirement for Gamma and Vega | 0 | 0 |
Table III.2
Assets weighted subject to credit risk by risk group
| Concept | Risk weighted assets | Capital Requirement |
| Group I-A (weighted at 0%) | 0 | 0 |
| Group I-A (weighted at 10%) | 0 | 0 |
| Group I-A (weighted at 20%) | 0 | 0 |
| Group I-B (weighted at 2%) | 120 | 10 |
| Group I-B (weighted at 4.0%) | 0 | 0 |
| Group II (weighted at 0%) | 0 | 0 |
| Group II (weighted at 20%) | 0 | 0 |
| Group II (weighted at 50%) | 0 | 0 |
| Group II (weighted at 100%) | 26,785 | 2,143 |
| Group II (weighted at 120%) | 0 | 0 |
| Group II (weighted at 150%) | 0 | 0 |
| Group III (weighted at 2.5%) | 0 | 0 |
| Group III (weighted at 10%) | 1,238 | 99 |
| Group III (weighted at 11.5%) | 1,754 | 140 |
| Group III (weighted at 20%) | 15,741 | 1,259 |
| Group III (weighted at 23%) | 0 | 0 |
| Group III (weighted at 25%) | 40 | 3 |
| Group III (weighted at 28.75%) | 0 | 0 |
| Group III (weighted at 50%) | 25,949 | 2,076 |
| Group III (weighted at 57.5%) | 959 | 77 |
| Group III (weighted at 60%) | 21 | 2 |
| Group III (weighted at 75%) | 0 | 0 |
| Group III (weighted at 100%) | 7,945 | 636 |
| Group III (weighted at 115%) | 0 | 0 |
| Group III (weighted at 120%) | 0 | 0 |
| Group III (weighted at 138%) | 0 | 0 |
| | 76 |
| Group III (weighted at 150%) | 0 | 0 |
| Group III (weighted at 172.5%) | 0 | 0 |
| Group IV (weighted at 0%) | 0 | 0 |
| Group IV (weighted at 20%) | 6,782 | 543 |
| Group V (weighted at 10%) | 0 | 0 |
| Group V (weighted at 20%) | 5,666 | 453 |
| Group V (weighted at 50%) | 0 | 0 |
| Group V (weighted at 115%) | 0 | 0 |
| Group V (weighted at 150%) | 18 | 1 |
| Group VI (weighted at 20%) | 0 | 0 |
| Group VI (weighted at 50%) | 30,150 | 2,412 |
| Group VI (weighted at 75%) | 12,249 | 980 |
| Group VI (weighted at 100%) | 48,046 | 3,844 |
| Group VI (weighted at 120%) | 0 | 0 |
| Group VI (weighted at 150%) | 0 | 0 |
| Group VI (weighted at 172.5%) | 0 | 0 |
| Group VII-A (weighted at 10%) | 0 | 0 |
| Group VII-A (weighted at 11.5%) | 0 | 0 |
| Group VII-A (weighted at 20%) | 12,573 | 1,006 |
| Group VII-A (weighted at 23%) | 0 | 0 |
| Group VII-A (weighted at 50%) | 1,992 | 159 |
| Group VII-A (weighted at 57.5%) | 13,288 | 1,063 |
| Group VII-A (weighted at 100%) | 174,105 | 13,928 |
| Group VII-A (weighted at 115%) | 3,307 | 265 |
| Group VII-A (weighted at 120%) | 0 | 0 |
| Group VII-A (weighted at 138%) | 0 | 0 |
| Group VII-A (weighted at 150%) | 477 | 38 |
| Group VII-A (weighted at 172.5%) | 0 | 0 |
| Group VII-B (weighted at 0%) | 0 | 0 |
| Group VII-B (weighted at 20%) | 729 | 58 |
| Group VII-B (weighted at 23%) | 0 | 0 |
| Group VII-B weighted at 50%) | 0 | 0 |
| Group VII-B weighted at 57.5%) | 0 | 0 |
| Group VII-B (weighted at 100%) | 33,208 | 2,657 |
| Group VII-B (weighted at 115%) | 0 | 0 |
| Group VII-B (weighted at 120%) | 0 | 0 |
| Group VII-B (weighted at 138%) | 0 | 0 |
| Group VII-B (weighted at 150%) | 0 | 0 |
| Group VII-B (weighted at 172.5%) | 0 | 0 |
| Group VIII (weighted at 115%) | 3,650 | 292 |
| Group VIII (weighted at 150%) | 4,100 | 328 |
| Group IX (weighted at 100%) | 74,675 | 5,974 |
| Group IX (weighted at 115%) | 0 | 0 |
| Group IX (weighted at 150%) | 0 | 0 |
| Group X (weighted at 1250%) | 1,137 | 91 |
| Other Assets (weighted at 0%) | 0 | 0 |
| Other Assets (weighted at 100%) | 15,749 | 1,260 |
| Credit Valuation Adjustment on Derivative Operations | 37,103 | 2,968 |
| Re-securitization with Risk Degree 1 (weighted at 20%) | 0 | 0 |
| | 77 |
| Re-securitization with Risk Degree 2 (weighted at 50%) | 0 | 0 |
| Re-securitization with Risk Degree 3 (weighted at 100%) | 0 | 0 |
| Re-securitization with Risk Degree 4 (weighted at 350%) | 0 | 0 |
| Re-securitization with Risk Degree 4, o 5 or Not qualified (weighted at 1250%) | 0 | 0 |
| ReRe-securitization with Risk Degree 1 (weighted at 40%) | 0 | 0 |
| ReRe-securitization with Risk Degree 1 (weighted at 100%) | 0 | 0 |
| ReRe-securitization with Risk Degree 1 (weighted at 225%) | 0 | 0 |
| ReRe-securitization with Risk Degree 1 (weighted at 650%) | 0 | 0 |
| ReRe-securitization with Risk Degree 4, 5 or Not qualified (weighted at 1250%) | 0 | 0 |
Table III.3
Assets weighted subject to operational risk
| Method | Risk weighted Assets | Capital Requirement |
| STANDARD ALTERNATIVE METHOD | 47,237 | 3,779 |
| Average of requirement by market and credit risk of the last 36 months | Average of annual positive net income of the last 36 months | |
| 0 | 50,012 | |
Table IV.1
Main characteristics of titles that are part of the Net Capital
| Reference | Characteristic | Options |
| 1 | Issuer | Banco Santander México, S. A. |
| 2 | ISIN, CUSIP or Bloomberg Identifier | MX00BS030007 |
| 3 | Legal frame | Securities Market Law |
| Regulation treatment | ||
| 4 | Level of capital with transitory | N.A |
| 5 | Level of capital without transitory | Fundamental Capital |
| 6 | Instrument level | Credit Institution without consolidating |
| 7 | Instrument type | Series F Shares |
| 8 | Amount acknowledge of regulatory capital | $15,210,402,155.77 |
| 9 | Instrument's par value | $3.78 |
| 9A | Instrument's currency | Mexican Pesos |
| 10 | Accounting qualification | Capital |
| 11 | Date of issuance | N.A |
| 12 | Instrument´s term | Perpetual |
| 13 | Date of expiration | Without expiration |
| 14 | Early payment clause | No |
| 15 | First date of early payment | N.A |
| 15A | Regulatory or fiscal events | No |
| 15B | Liquidation price of the early payment clause | N.A |
| 16 | Subsequent early payment dates | N.A |
| Yields / Dividends | ||
| 17 | Type of yield/dividend | Variable |
| 18 | Interest rate/dividend | Variable |
| 19 | Cancellation of dividends clause | No |
| 20 | Payment discretion | Mandatory |
| 21 | Interest increase clause | No |
| 22 | Yields/Dividends | Not Accruable |
| 23 | Convertibility of the instrument | N.A |
| 24 | Convertibility conditions | N.A |
| 25 | Degree of convertibility | N.A |
| 26 | Conversion rate | N.A |
| 27 | Instrument convertibility rate | N.A |
| 28 | Type of convertibility financial instrument | N.A |
| | 78 |
| 29 | Instrument issuer | N.A |
| 30 | Write-down clause | No |
| 31 | Conditions for write-down | N.A |
| 32 | Degree of write-down | N.A |
| 33 | Temporality of write-down | N.A |
| 34 | Mechanism for temporary write down | N.A |
| 35 | Subordination position in the event of liquidation | Creditors in general |
| 36 | Breach characteristics | No |
| 37 | Description of breach characteristics | N.A |
Table IV.1.2
Main characteristics of titles that are part of the Net Capital
| Reference | Characteristic | Options |
| 1 | Issuer | Banco Santander México, S. A. |
| 2 | ISIN, CUSIP or Bloomberg Identifier | MX00BS030007 |
| 3 | Legal frame | Securities Market Law |
| Regulation treatment | ||
| 4 | Level of capital with transitory | N.A |
| 5 | Level of capital without transitory | Fundamental Capital |
| 6 | Instrument level | Credit Institution without consolidating |
| 7 | Instrument type | Series B Shares |
| 8 | Amount acknowledge of regulatory capital | $14,588,587,852.93 |
| 9 | Instrument's par value | $3.78 |
| 9A | Instrument's currency | Mexican Pesos |
| 10 | Accounting qualification | Capital |
| 11 | Date of issuance | N.A |
| 12 | Instrument´s term | Perpetual |
| 13 | Date of expiration | Without expiration |
| 14 | Early payment clause | No |
| 15 | First date of early payment | N.A |
| 15A | Regulatory or fiscal events | No |
| 15B | Liquidation price of the early payment clause | N.A |
| 16 | Subsequent early payment dates | N.A |
| Yields / Dividends | ||
| 17 | Type of yield/dividend | Variable |
| 18 | Interest rate/dividend | Variable |
| 19 | Cancellation of dividends clause | No |
| 20 | Payment discretion | Mandatory |
| 21 | Interest increase clause | No |
| 22 | Yields/Dividends | Not Accruable |
| 23 | Convertibility of the instrument | N.A |
| 24 | Convertibility conditions | N.A |
| 25 | Degree of convertibility | N.A |
| 26 | Conversion rate | N.A |
| 27 | Instrument convertibility rate | N.A |
| 28 | Type of convertibility financial instrument | N.A |
| 29 | Instrument issuer | N.A |
| 30 | Write-down clause | No |
| 31 | Conditions for write-down | N.A |
| 32 | Degree of write-down | N.A |
| 33 | Temporality of write-down | N.A |
| 34 | Mechanism for temporary write down | N.A |
| | 79 |
| 35 | Subordination position in the event of liquidation | Creditors in general |
| 36 | Breach characteristics | No |
| 37 | Description of breach characteristics | N.A |
Table IV.1.3
Main characteristics of titles that are part of the Net Capital
| Reference | Characteristic | Options |
| 1 | Issuer | Banco Santander México, S. A., Institución de Banca Múltiple, Grupo Financiero Santander México. |
| 2 | ISIN, CUSIP or Bloomberg Identifier | ISIN | CUSIP | |
| 144A | US05969BAB99 | 05969B AB9 | ||
| Reg S | USP1507SAD91 | P1507S AD9 |
| 3 | Governing Law | The Capital Notes and their corresponding Indenture are governed by, and construed in accordance with, the law of the State of New York. Whether a Trigger Event (leading to a Write-Down) or a Mexican Regulatory Event (leading to a Suspension Period) has occurred is based upon a determination by the applicable Mexican regulator, in accordance with Mexican law (as amended from time to time). Whether a Withholding Tax Event or a Tax Event has occurred is based upon a determination in accordance with Mexican law (or other applicable law in the case of a Withholding Tax Event involving a jurisdiction other than Mexico), as amended from time to time, evidenced by an opinion of a nationally recognized law firm and, if required, a certification by the Issuer. Whether a Capital Event has occurred is determined by the Issuer in accordance with Mexican law (as amended from time to time). The ranking and subordination of the Notes, will be governed by, and construed in accordance with, Mexican law (as amended from time to time). The Issuer will waive any rights it may have under the law of the State of New York not to give effect to any such determination to the fullest extent permitted by applicable law. Any proceedings in respect of the Issuer’s concurso mercantil or bankruptcy will be conducted in accordance with the Mexican Bankruptcy Law, and any merger or consolidation shall be subject to applicable approvals under the Mexican Banking Law and any other applicable Mexican laws, as amended from time to time. |
| Regulatory Treatment | ||
| 4 | Capital category the Capital Note qualifies as, based on Article 3, Transitory, Resolution 50th | N.A. |
| 5 | Capital category the Capital Note qualifies as, based on Annexes 1-Q, 1-R and 1-S | “Tier 2” or Supplementary Capital (Capital Complementario). |
| 6 | Instrument seniority within the Group | Subordinated Debt issued by our Credit Institution. |
| 7 | Type of Instrument | Tier 2 Subordinated Capital Notes. |
| 8 | Amount acknowledged as regulatory capital | $23,902,131,488.00 |
| 9 | Instrument's Face Value | $24,340,030,000.00 (USD $1,300,000,000.00) |
| 9A | Currency | USD. |
| 10 | Accounting Classification | Subordinated Debt. |
| 11 | Issuance Date | December 27, 2013. |
| | 80 |
| 12 | Type of Expiration | Expiration Date. |
| 13 | Expiration Date | January 30, 2024. |
| 14 | Optional Redemption | Subject to certain conditions, the Issuer may redeem the Capital Notes at par plus accrued and unpaid interest due on, or with respect to, the Capital Notes, plus Additional Amounts, if any, (i) in whole or in part, only on the Optional Redemption Date or (ii) in whole at any date by means of the existence a Withholding Tax Event or a Special Event. |
| 15 | Optional Redemption Date | January 30, 2019. |
| 15A | Does the early redemption clause contemplates Regulatory or Fiscal Events? |
Yes.
Withholding Tax Redemption: The Issuer may redeem the Capital Notes at par plus accrued and unpaid interest due on, or with respect to the Capital Notes, plus Additional Amounts, if any, in whole but not in part, prior to the Maturity Date as a result of certain changes in tax law affecting the, and resulting in a higher, withholding tax applicable to interest payments under the Capital Notes, subject to the satisfaction of certain conditions.
Special Event Redemption: The Issuer may redeem the Capital Notes at par plus accrued and unpaid interest due on, or with respect to, the Capital Notes, plus Additional Amounts, if any, in whole but not in part, upon the occurrence of a Special Event (which event happens upon the occurrence of certain changes in capital treatment or tax deductibility of payments under the Capital Notes and the satisfaction of certain conditions). |
| 15B | Liquidation price for an early redemption | Upon an early redemption, Capital Notes would be repaid at par plus accrued and unpaid interest due on, or with respect to, the Capital Notes, plus Additional Amounts, if any. |
| 16 | Subsequent early redemption dates | None, except for early redemptions caused by a Withholding Event or a Special Event, which can be made at any date before Maturity Date. |
| Yields / Dividends | ||
| 17 | Type of Interest Rate | Fixed Rate with only one reset date at the Optional Redemption Date. |
| 18 | Interest Rate | 5.95%. |
| 19 | Dividend Stopper Clause: | Subject to certain exceptions, the Issuer will not be allowed to make certain distributions during a Suspension Period, including (i) dividends or distributions on capital stock, (ii) make any payment of the Issuer’s debt securities that rank pari passu with or junior in right of payment and in liquidation to the Capital Notes; or (iii) make any guaranty payments with respect to any guaranty of the debt securities of its subsidiaries if such guaranty ranks pari passu with or junior in right of payment and in liquidation to the Capital Notes. |
| 20 | Are Interest Payments discretionary? | Interest Payments are Mandatory. |
| 21 | Interest increase / Step-Up clause | No. |
| 22 | Are coupon payments cumulative? |
Cumulative.
The Issuer will have the right to and will defer, but not cancel (except pursuant to a Write-Down), payment of interest and principal due on the Capital Notes, if the CNBV institutes certain corrective measures against the Issuer if the Issuer is classified as Class III (or equivalent classification under any successor provisions) or below under the Mexican Capitalization Requirements. Payments of interest due on the Capital Notes will be cumulative. Subject to the occurrence of one or more Write-Downs, a Suspension Period shall terminate and the payment of interest due on the Capital Notes and payment of principal thereof will resume when the related Mexican Regulatory Event has terminated. |
| 23 | Convertibility of the instrument | N.A. |
| | 81 |
| 24 | Convertibility conditions | N.A. |
| 25 | Degree of convertibility | N.A. |
| 26 | Conversion rate | N.A. |
| 27 | Type of Conversion | N.A. |
| 28 | Type of shares into which the title is converted | N.A. |
| 29 | Issuer of such capital instrument | N.A. |
| 30 | Write-Down Mechanism | Yes. |
| 31 | Write-Down Trigger Events | A “Trigger Event” will be deemed to have occurred if (i) the CNBV publishes a determination, in its official publication of capitalization levels for Mexican banks, that Banco Santander Mexico’s Fundamental Capital Ratio, as calculated pursuant to the applicable Mexican Capitalization Requirements, is equal to or below 4.5%, (ii) both (A) the CNBV notifies Banco Santander Mexico that it has made a determination, pursuant to Article 29 Bis of the Mexican Banking Law, that a cause for revocation of Banco Santander Mexico’s license has occurred resulting from (y Banco Santander Mexico’s non-compliance with corrective measures imposed by the CNBV pursuant to the Mexican Banking Law, or (z) Banco Santander Mexico’s non-compliance with the capitalization requirements set forth in the Mexican Capitalization Requirements and (B) Banco Santander Mexico has not cured such cause for revocation, by (a) complying with such corrective measures, or (b)(1) submitting a capital restoration plan to, and receiving approval of such plan by, the CNBV, (2) pledging to the Mexican governmental authorities, to secure performance of such capital restoration plan, seventy five percent (75%) of the Issuer’s aggregate issued and outstanding shares and (3) not being classified in Class III, IV, or V, or (c) remedying any capital deficiency, in the case of (a), (b) and (c), on or before the 15th business day in Mexico following the date on which the CNBV notifies Banco Santander Mexico of such determination; or (iii) the Financial Stability Committee, which is a committee formed by the CNBV, the Ministry of Finance and Public Credit, the Mexican Central Bank and the Mexican Savings Protection Agency, determines pursuant to Article 122 Bis of the Mexican Banking Law that financial assistance is required by the Issuer to avoid revocation of the Issuer’s license for the Issuer’s failure to comply with corrective measures, comply with capitalization requirements or to satisfy certain liabilities when due, as a means to maintain the solvency of the Mexican financial system or to avoid risks affecting the Mexican payments system and such determination is either made public or notified to Banco Santander Mexico. |
| 32 | Write-Down Amount | “Write-Down Amount” means an (i) amount that would be sufficient, together with any concurrent pro rata write down of any other loss-absorbing instruments issued by us and then outstanding, to return Banco Santander Mexico’s Fundamental Capital to the levels required under Section IX, b), 2 of Annex 1-S of the General Rules Applicable to Mexican Banks, or (ii) if any Write-Down of the Current Principal Amount, together with any concurrent pro rata write down of any other loss-absorbing instruments issued by us and then outstanding, would be insufficient to return Banco Santander Mexico’s Fundamental Capital to the levels required under Section IX, b), 2 of Annex 1-S of the General Rules Applicable to Mexican Banks, the amount necessary to reduce the Current Principal Amount of each outstanding Capital Note to zero. |
| 33 | Write-Up Mechanism | N.A., Write-Down, if applied, will be permanent. |
| 34 | Mechanism for temporary Write-Down | N.A. |
| 35 | Ranking of the Capital Notes in a liquidation event | The Capital Notes constitute subordinated indebtedness, and (i) will be subordinated and junior in right of payment and in liquidation to all of the Issuer’s present and future senior indebtedness, (ii) will rank pari passu with all other unsecured subordinated preferred indebtedness and (iii) will be senior to subordinated non-preferred indebtedness and all classes of the Issuer’s equity or capital stock. |
| | 82 |
| 36 | Does any characteristic of the Capital Notes breach conditions set forth in Annex 1-R, 1-S or 1-Q of the Mexican Banking Law | No. |
| 37 | Specify which characteristics of the Capital Notes breach conditions set forth in Annex 1-R, 1-S or 1-Q of the Mexican Banking Law | N.A. |
Table IV.1.4
Main characteristics of titles that are part of the Net Capital
| Reference | Characteristic | Options |
| 1 | Issuer | Banco Santander México, S. A., Institución de Banca Múltiple, Grupo Financiero Santander México. |
| 2 | ISIN, CUSIP or Bloomberg Identifier |
ISIN: US40053CAA36
CUSIP: 40053C AA3
BMV Ticker: BSMX 17
|
| 3 | Governing Law | The Capital Notes and the Indenture are governed by, and construed in accordance with the laws of New York, except that the ranking and subordination provisions, provisions related to mandatory cancellation of interest, provisions relating to conversion, provisions relating to a withholding tax redemption or a special redemption and the waiver of the right to set-off by the holders of the Capital Notes and by the Trustee acting on behalf of the holders with respect to the Capital Notes will be governed by and construed in accordance with the laws of Mexico. |
| Regulatory Treatment | ||
| 4 | Level of capital with transitory | N.A. |
| 5 | Level of capital without transitory | Tier 1 Capital (Capital Básico No Fundamental). |
| 6 | Instrument level within the Group | Subordinated Debt issued from our Credit Institution. |
| 7 | Type of Instrument | Perpetual Subordinated Non-Preferred Contingent Convertible Additional Tier 1 Capital Notes. |
| 8 | Amount acknowledged as regulatory capital | $9,018,160,682.00 |
| 9 | Instrument's Face Value | $9,361,550,000.00 (USD $500,000,000.00) |
| 9A | Currency | USD. |
| 10 | Accounting Classification | Principal is accounted as debt, coupon payments are accounted as capital. |
| 11 | Issuance Date | December 23, 2016. |
| 12 | Type of Expiration | Perpetuity. |
| 13 | Expiration Date | N.A. |
| 14 | Optional Redemption |
Subject to certain conditions, the Issuer may redeem the Capital Notes at par plus accrued and unpaid interest due on, or with respect to, the Capital Notes, plus Additional Amounts, if any, (i) in whole or in part, only on the Optional Redemption Dates or (ii) in whole at any date by means of the existence a Withholding Tax Event or a Special Event. |
| 15 | First Optional Redemption Date | January 20, 2022. |
| | 83 |
| 15A | Does the early redemption clause contemplates Regulatory or Fiscal Events? |
Yes.
Withholding Tax Redemption: The Issuer may redeem the Capital Notes at par plus accrued and unpaid interest due on, or with respect to the Capital Notes, plus Additional Amounts, if any, in whole but not in part, prior to the Maturity Date as a result of certain changes in tax law affecting the, and resulting in a higher, withholding tax applicable to interest payments under the Capital Notes, subject to the satisfaction of certain conditions.
Special Event Redemption: The Issuer may redeem the Capital Notes at par plus accrued and unpaid interest due on, or with respect to, the Capital Notes, plus Additional Amounts, if any, in whole but not in part, upon the occurrence of a Special Event (which event happens upon the occurrence of certain changes in capital treatment or tax deductibility of payments under the Capital Notes and the satisfaction of certain conditions). |
| 15B | Liquidation price for an early redemption | Upon an early redemption, Capital Notes would be repaid at par plus accrued and unpaid interest due on, or with respect to, the Capital Notes, plus Additional Amounts, if any, |
| 16 | Subsequent early redemption dates |
Every Interest Payment Date after the First Optional Redemption Date.
Early redemptions caused by a Withholding Event or a Special Event, which can be made at any date. |
| Yields / Dividends | ||
| 17 | Type of Interest Rate | Fixed with reset dates on the First Redemption Date and every fifth anniversary thereafter. |
| 18 | Interest Rate | 8.50%. |
| 19 | Dividend Stopper Clause |
Unless the most recent payable accrued interests and any Additional Interest on the Capital Notes have been paid, the Issuer shall not: (i) declare or pay any dividends or distributions on, or redeem, purchase, acquire, or make a liquidation payment with respect to, any of its capital stock; or (ii) make any payment of premium, if any, or interest on or repay, repurchase or redeem any of its Subordinated Non-Preferred Indebtedness. |
| 20 | Are Interest Payments discretionary |
Completely Discretionary.
(a) Interest is payable solely at the Issuer’s discretion, and no amount of interest shall become due and payable in respect of the relevant interest period to the extent that it has been canceled by the Issuer (in whole or in part) at its sole discretion and/or has been canceled as a result of the occurrence and continuation of an Interest Cancellation Event; and (b) a cancellation of interest (in whole or in part) shall not constitute a default. |
| 21 | Interest increase / Step-Up clause | No. |
| 22 | Are Coupon Payments Cumulative? | No. |
| 23 | Convertibility of the instrument | Yes. |
| 24 | Conversion Trigger Events |
A Conversion Trigger Event shall occur:
(i) the Business Day in Mexico following the publication of a determination by the CNBV, in its official publication of capitalization levels for Mexican banks, that Banco Santander México’s Fundamental Capital Ratio, as calculated pursuant to the applicable Mexican Capitalization Requirements, is equal to or below 5.125%;
(ii) if both (A) the CNBV notifies Banco Santander México that it has made a determination, pursuant to Article 29 Bis of the Mexican Banking Law, that a cause for revocation of Banco Santander México’s license has occurred resulting from (x) Banco Santander México’s assets being insufficient to satisfy its liabilities, (y) Banco Santander México’s non-compliance with corrective measures imposed by the CNBV pursuant to the Mexican Banking Law, or (z) Banco Santander México’s non-compliance with the capitalization requirements set forth in the Mexican Capitalization Requirements and (B) Banco Santander México has not cured such cause for revocation, by (x) complying with such corrective measures, or (y)(1) submitting a capital restoration plan to, and receiving approval of such plan by, the CNBV, (2) not being classified in Class III, IV or V, and (3) transferring at least 75% of its shares to an irrevocable trust, or (z) remedying any capital deficiency, in each case, |
| | 84 |
|
on or before the third or seventh calendar day in Mexico, as applicable, following the date on which the CNBV notifies Banco Santander México of such determination; (iii) if the Banking Stability Committee, which is a committee formed by the CNBV, the Ministry of Finance and Public Credit (Secretaría de Hacienda y Crédito Público), Banco de México and the IPAB, determines pursuant to Article 29 Bis 6 of the Mexican Banking Law that, under Article 148, Section II, paragraphs (a) and (b) of the Mexican Banking Law, financial assistance is required by Banco Santander México to avoid revocation of its license because Banco Santander México’s assets are insufficient to satisfy Banco Santander México’s liabilities, or Banco Santander México’s failure to comply with corrective measures, to comply with capitalization requirements, or to satisfy certain liabilities when due, as a means to maintain the solvency of the Mexican financial system or to avoid risks affecting the Mexican payments system and such determination is either made public or notified to Banco Santander México (for the avoidance of doubt, pursuant to Annex 1-R of the general rules applicable to Mexican banks, a Conversion Trigger Event shall occur if financial assistance or other loans shall be granted to the Bank pursuant to Article 148, Section II, paragraphs (a) and (b) of the Mexican Banking Law) | ||
| 25 | Conversion Amount | “Conversion Amount” means: (i) a conversion of the then Current Principal Amount of Capital Notes in an amount that would be sufficient, and together with any concurrent pro rata write-down or conversion of any other Subordinated Non-Preferred Indebtedness issued by Banco Santander México and then outstanding, to return Banco Santander México’s Fundamental Capital Ratio to the then-applicable Fundamental Capital Ratio required by the CNBV in accordance with Section IV, c), 1 of Annex 1-R of the general rules applicable to Mexican banks or any successor regulation; or, if no such amount, together with any such concurrent pro rata write-down or conversion, would be sufficient to so restore Banco Santander México’s Fundamental Capital Ratio to the aforementioned amount, then (ii) conversion of the then Current Principal Amount of Notes in the amount necessary to reduce the principal amount of each outstanding Note to zero. |
| 26 | Conversion Price |
The conversion price shall be, if the Ordinary Shares are: (i) then admitted to trading on the Mexican Stock Exchange, the higher of: (x) the volume weighted average of the Ordinary Shares closing price on the Mexican Stock Exchange for the thirty (30) consecutive Business Days immediately preceding the Conversion Date, with each closing price for the thirty (30) consecutive Business Days being converted from Mexican pesos into U.S. dollars at the then-prevailing exchange rate; or (y) floor price of Ps.20.30 converted into U.S. dollars at the then-prevailing exchange rate; (ii) not then admitted to trading on the Mexican Stock Exchange, the floor price of Ps.20.30 converted into U.S. dollars at the then-prevailing exchange rate. The conversion price shall be subject to certain anti-dilution adjustments. |
| 27 | Type of Conversion | Mandatory. |
| 28 | Type of shares into which the title is converted | Banco Santander México’s Series F shares (common shares). |
| 29 | Issuer of such capital instrument | Banco Santander México, S. A., Institución de Banca Múltiple, Grupo Financiero Santander México. |
| 30 | Write-Down Mechanism | N.A. |
| 31 | Write-Down Trigger Events | N.A. |
| 32 | Write-Down Amount | N.A. |
| 33 | Write-Up Mechanism | N.A. |
| 34 | Mechanism for temporary Write-Down | N.A. |
| 35 | Ranking of the Capital Notes in a liquidation event | The Capital Notes will represent the Issuer’s general, unsecured and subordinated obligations. The Capital Notes constitute Subordinated Non-Preferred Indebtedness and will rank (i) subordinate and junior in right of payment and in liquidation to all of the Issuer’s present and future Senior Indebtedness and Subordinated Preferred Indebtedness, (ii) pari passu without preference among themselves and with all of the |
| | 85 |
| Issuer’s present and future other unsecured Subordinated Non-Preferred Indebtedness and (iii) senior only to all classes of the Issuer’s capital stock. | ||
| 36 | Does any characteristic of the Capital Notes breach conditions set forth in Annex 1-R, 1-S or 1-Q of the Mexican Banking Law | No. |
| 37 | Specify which characteristics of the Capital Notes breach conditions set forth in Annex 1-R, 1-S or 1-Q of the Mexican Banking Law | N.A. |
The information relating to Annex 1-O Capitalization Ratio Santander Consumo, Santander Hipotecario and Inclusión Financiera is available on the website
www.santander.com.mx/ir
Leverage ratio
| Table I.1 | ||
| Integration of the main sources of leverage | ||
| Reference | Item | Sep- 2018 |
| 1 | On-balance sheet items (excluding derivatives and SFTs, but including collateral) | 1,168,293 |
| 2 | (Asset amounts deducted in determining Basel III Tier 1 capital) | (41,720) |
| 3 | Total on-balance sheet exposures (excluding derivatives and SFTs) (sum of lines 1 and 2) | 1,126,573 |
| Derivative exposures | ||
| 4 | Replacement cost associated with all derivatives transactions (i.e. net of eligible cash variation margin) | 44,502 |
| 5 | Add-on amounts for PFE associated with all derivatives transactions | 52,756 |
| 6 | Gross-up for derivatives collateral provided where deducted from the balance sheet assets pursuant to the operative accounting framework | |
| 7 | (Deductions of receivables assets for cash variation margin provided in derivatives transactions) | 0 |
| 8 | (Exempted CCP leg of client-cleared trade exposures) | |
| 9 | Adjusted effective notional amount of written credit derivatives | |
| 10 | (Adjusted effective notional offsets and add-on deductions for written credit derivatives) | |
| 11 | Total derivative exposures (sum of lines 4 to 10) | 97,258 |
| Securities financing transaction exposures | ||
| 12 | Gross SFT assets (with no recognition of netting), after adjusting for sale accounting transactions | 97,836 |
| 13 | (Netted amounts of cash payables and cash receivables of gross SFT assets) | (68,651) |
| 14 | CCR exposure for SFT assets | 3,170 |
| 15 | Agent transaction exposures | |
| 16 | Total securities financing transaction exposures (sum of lines 12 to 15) | 32,355 |
| Other off-balance sheet exposures | ||
| 17 | Off-balance sheet exposure at gross notional amount | 134,261 |
| | 86 |
| 18 | (Adjustments for conversion to credit equivalent amounts) | (57,024) |
| 19 | Off-balance sheet items (sum of lines 17 and 18) | 77,237 |
| Capital and total exposures | ||
| 20 | Tier 1 capital | 94,661 |
| 21 | Total exposures (sum of lines 3, 11, 16 and 19) | 1,333,423 |
| Leverage ratio | ||
| 22 | Basel III leverage ratio | 7.10% |
| Table II.1 | ||
| Comparison total assets and assets adjusted | ||
| Reference | Item | Sep-18 |
| 1 | Total consolidated assets as per published financial statements | 1,352,264 |
| 2 | Adjustment for investments in banking, financial, insurance or commercial entities that are consolidated for accounting purposes but outside the scope of regulatory consolidation | 0 |
| 3 | Adjustment for fiduciary assets recognised on the balance sheet pursuant to the operative accounting framework but excluded from the leverage ratio exposure measure | (41,720) |
| 4 | Adjustments for derivative financial instruments | (55,931) |
| 5 | Adjustment for securities financing transactions | 1,573 |
| 6 | Adjustment for off-balance sheet items | 77,237 |
| 7 | Other adjustments | |
| 8 | Leverage ratio exposure | 1,333,423 |
|
Table III.1
| ||
| Conciliation of total assets and exposure in the balance | ||
| Reference | Item | sep-18 |
| 1 | Total consolidated assets as per published financial statements | 1,352,264 |
| 2 | operative derivative financial instruments | (153,188) |
| 3 | operative securities financing transactions | (30,782) |
| 4 | Trust assets recognized in the balance sheet under the accounting framework, but excluded from the exposure measure of the leverage ratio | 0.00 |
| 5 | On-balance exposure | 1,168,293 |
| Table IV.1 | |||
| Variation of the elements | |||
| Jun-18 | Sep-18 | ||
| Concept/Quarter | T-1 | T | Variation (%) |
| Basic Capital | 90,987 | 94,661 | 4.0 |
| Adjusted assets | 1,319,621 | 1,333,423 | 1.0 |
| Leverage Ratio | 6.89% | 7.10% | |
The information relating to Annex 1-O Leverage Ratio is available on the website
www.santander.com.mx/ir
| | 87 |
| 15. Risk Diversification |
|
Pursuant to the general rules for risk diversification in the performance of borrowing and lending transactions applicable to credit institutions, published in the Federal official Gazette on April 30, 2003, the following information with respect to credit risk transactions as of September 30th, 2018, is provided:
- At September 30th, 2018 did not have financing granted to debtors or groups of individuals representing single common risk is greater the amount of core capital Bank.
- Loans granted to the three major debtors or groups of persons representing a common risk for a total amount of Ps.44,110 million representing the 46.60% of the basic capital of the Bank.
|
16. Internal and external Sources of Liquidity
Financial sources of liquidity in domestic and foreign currency come from the different savings products that Banco Santander México offers to its clients; mainly checking accounts and time deposits.
An additional internal source of liquidity is the collection of fees, interests and principal amounts of the loans that the Bank grants to its clients.
With respect to external sources of liquidity, the Bank has access to the local and foreign capital markets through different alternatives that range from the issuance of senior and subordinated debt as well as the issuance of other debt or equity instruments. Santander México also obtains funding from other institutions including the Mexican Central Bank, development banks, commercial banks, and other institutions.
Banco Santander México may also obtain liquidity via sale and repurchase agreements (short-term repos) over securities it holds in its investment portfolio. Additionally, the Bank could obtain liquidity through the sale of assets.
17. Dividends Policy
Banco Santander México performs the payment of dividends pursuant to the applicable legal, administrative, fiscal and accounting rules, based in the results obtained by Banco Santander México. The payment of dividends is discussed in the Ordinary General Stockholders’ Meeting, which is the body that orders and approves the payment of dividends to the stockholders.
18. Treasury Policies
The activities of Banco Santander México’s treasury are performed pursuant to the following:
| a) | In compliance with the provisions issued by the different authorities of the financial system for bank institutions, such as guidelines for lending and borrowing transactions, accounting rules, liquidity ratios, regulatory matching, capacity of the payment systems, etc. |
| b) | Internal limits for market, liquidity and credit risks that are reviewed and approved by appropriate committees, i.e., there are limits established and independent for treasury activities for the management of the assets and liabilities of the bank with respect to the market and liquidity risk derived from such management, as well as the limits regarding counterparty risk derived from the daily transactions. The treasury is responsible for their activities within the limits allowed to manage their risk. |
| c) | Compliance with the guidelines stipulated by national and international standard agreements regarding transactions performed in markets. |
| d) | Sound market practices. |
| e) | Strategies proposed in the banks internal committees. |
| f) | Compliance with the operation procedures of the institution. |
| 19. Shareholding | ||
| Subsidiaries | % of interest | |
| Santander Consumo, S.A de C.V., SOFOM, E.R. | 99.99 | |
| Santander Vivienda, S.A. de C.V., SOFOM, E.R. | 99.99 | |
| Santander Inclusion Financiera, S.A. de C.V., SOFOM, E.R. | 99.99 | |
| Centro de Capacitación Santander, A.C. | 99.99 | |
| Banco Santander, S.A. F-100740 | 99.99 | |
| Fideicomiso GFSSLPT Banco Santander, S.A. | 89.14 | |
| Santander Servicios Corporativos, S.A. de C.V. | 99.99 | |
| Santander Servicios Especializados, S.A. de C.V. | 99.99 |
| | 88 |
20. Internal Control
The activities of Banco Santander Mexico are governed by the current legislations of the local regulator and for a series of guidelines established by his holding company, Banco Santander, whose headquarters are located in Madrid.
For the compliance of the regulations in force, Santander México has developed and implemented an Internal Control Model (ICM) which includes the participation of the Board of Directors, the statutory advisor, the Audit Committee, the Internal Audit Department, the General Direction, the Internal Control Department, Financial Control Department and the Regulatory Control Department.
The ICM is based in the identification and documentation of the main risks and the annual assessment of the controls that are created to mitigate such risks. ICM guarantees, among other aspects, the design, establishment and updating of measures and controls that promote the compliance with the internal and external regulations, such as the Committee of Sponsoring Organizations of the Tradeway Commission (COSO) guidelines and the proper operation of the financial data processing systems.
The internal control system includes:
The implementation of an organizational structure has allowed the development and growth of the bank. Such structure is constituted as follows:
CEO and General Direction
The following functions report to the President and CEO:
| § | Deputy General of intervention and Management Control |
| § | Deputy General Direction of Technology and Operations |
| § | Executive Direction of Human Resources |
| § | Deputy General Direction of Corporate Resources and Recoveries |
| § | Deputy General Direction of Legal Affairs and Compliance |
| § | Chief Financial Officer |
| § | Vice-president of Commercial Banking: |
| - | Deputy General Direction Network Commercial |
| - | Deputy General Direction of New Business |
| - | Deputy General Direction of Strategy of Business |
| - | Executive Direction of Commercial Planning |
| - | Executive Direction of Transformation Commercial and Innovation |
| - | Executive Direction of Strategy Clients |
| - | Deputy General Direction of Digital Factory |
| § | Deputy General Direction of Corporate & Investment Banking |
| § | Deputy General Direction of Enterprises and Institutions |
| § | Deputy General Direction of Risk |
| § | Deputy General Direction of Public Affairs and Strategy |
| § | Executive Direction of Audit |
The roles and responsibilities of each direction have been stipulated in order to optimize the performance of the activities of Santander México.
The Organization area related to the Executive Direction of Processes and Change Management, via manuals, circulars and bulletins, governs the activities of the bank; likewise, the Regulatory Control Department has established a general Code of Conduct that every employee of Santander México has to follow.
The structure of Santander México includes the constitution of a Board of Directors, which establishes the objectives, the policies and general procedures of Santander México, the appointment of directors and the constitution of committees that are to supervise the development of the activities of Santander México.
| | 89 |
The committees that supervise the development of the entities that constitute Banco Santander México, created and reported to the Board of Directors, are:
| § | Audit Committee |
| § | Corporate Practices, Nominating and Compensation Committee |
| § | Risk Management Committee |
| § | Remuneration Committee |
| § | Communication and Control Committee |
The registration, control and storage of the daily activities of Santander México are carried out by systems mainly designed and focused on the banking and brokerage activity. The common platform for such purposes is known as ALTAIR and it is applied by all the entities in Latin America that are part of Banco Santander (España).
Loans portfolio and transactions of commercial banking of the bank are controlled and registered at ALTAIR. Treasury activities are controlled and registered in computer platforms and the operations are centralized for its accounting registration in ALTAIR. Such platforms comply with the parameters stipulated by the CNBV with respect to reliability and accuracy.
Santander México is regulated by the CNBV, and therefore, the financial statements are prepared according to the accounting practices stipulated by such Commission via the issue of accounting circulars, general official letters and particular official letters regarding the accounting registration of transactions. For such purposes, the accounting system of Santander México has been structured with an accounts catalog stipulated by the Commission, and all the reports come from such system and comply with the applicable provisions.
Within Santander México, there is an independent area of Internal Audit, whose mission is to oversee the compliance, efficacy and efficiency of the internal control systems of the Bank, as well as the reliability and quality of the accounting information.
To achieve so, Internal Audit verifies that the risks inherent to the activity of Santander México are properly covered and the policies stipulated by the Direction, the applicable internal and external regulations and the procedures are observed.
The results of the activities of Internal Audit are reported on regular basis to the General Direction, the Audit Committee and the Board of Directors. Among other issues, the results of the audits performed to the different business units of the companies that constitute Santander México and the follow up of the recommendations provided to the different areas and/ or entities are informed.
Internal Audit has a quality system oriented to the client satisfaction focus on continuous process improvement, which has been subject to a successful Quality Assurance Review (QAR) during 2014.
In summary, Internal Control of Santander México includes the continuous development, implementation and updating of an internal control model where all the areas of the bank have an active role.
During the quarter, there have been no changes to the internal controls and internal audit guidelines.
| 21. Transactions with related parties | |
| Receivable | |
| Funds available | 1,957 |
| Debtors under sale and repurchase agreements | 493 |
| Derivatives (asset) | 58,278 |
| Performing loan portfolio | 4,694 |
| Other receivables, (net) | 4,132 |
| Payable | |
| Time deposits | 2,633 |
| Demand deposits | 820 |
| Credit instruments issued | 1,045 |
| Creditors under sale and repurchase agreements | 30,716 |
| Derivatives (liability) | 32,300 |
| Other payables | 33,501 |
| Subordinated debentures | 28,644 |
| Revenues | |
| Interest | 169 |
| Commissions and fee income | 4,677 |
| Net gain (loss) on financial assets and liabilities | (6,607) |
| Expenses | |
| Interest | 2,674 |
| Administrative expenses | 637 |
| Technical assistance | 1,497 |
| | 90 |
| 22. Interests on loan portfolio |
| As of September 30th, 2018, the consolidated income statement includes, in the item "Interest income " Ps.59,522 million that correspond to interests from the loan portfolio of Banco Santander México, S.A., Santander Consumo, S.A. de C.V. SOFOM E.R. and Santander Vivienda, S.A. de C.V. SOFOM E.R. |
| 23. Integral Risk Management (unaudited) |
Risk management is considered by Banco Santander as a competitive element of strategic nature with the purpose of maximizing the value for the stockholder. This management is defined, from a conceptual and organizational sense, as a comprehensive management of the different risks (market risk, liquidity risk, credit risk, counterparty risk, operative risk, legal risk and technological risk) assumed by Banco Santander for the development of its activities. The management of the risk inherent to transactions is essential for understanding and determining the behavior of the financial condition of Banco Santander and the creation of long-term value.
In order to comply with the provisions regarding the Comprehensive Risk management applicable to credit institutions, issued by the National Banking and Exchange Commission, the Board of Directors agreed to create the Comprehensive Risk Management Committee of Banco Santander, to work pursuant to the rules set by such regulations. This Committee gathers every month and verifies that the transactions are according to the objectives, policies and procedures approved by the Board of Directors for the Comprehensive Risk Management.
The Comprehensive Risk management Committee delegates in the Comprehensive Risk Management Unit the responsibility for the implementation of procedures for the measure, administration and control of risks according to the applicable policies; such Unit has the faculty to authorize amounts greater than the stipulated limits and in such cases, the Board of Directors shall be informed on such deviations.
Market Risk
The Market Risk Management department of the Comprehensive Risk management Unit is responsible for recommending the policies on market risk management of Banco Santander, and to establish the parameters for risk measuring, and to provide reports, analysis and assessments to the senior management, to the Comprehensive Risk management Committee and to the Board of Directors.
The market risk management is to identify measure, monitor and control risks arising from fluctuations in interest rates, exchange rates, prices and other market risk factors in currency, money, capital and derivative markets that are exposed the positions that belong to Banco Santander.
The market risk measurement quantifies the potential variation in the value of the positions as a consequence of changes in the market risk factors.
Depending on the nature of the activities of each business unit, debt and capital instruments are registered as securities for trade, securities available for sale and or securities held to maturity. The main characteristic that identifies securities available for sale is their permanent nature and they are managed as an structural part of the balance sheet. Banco Santander has established provisions that all securities available for sale must fulfill, as well as adequate controls for the compliance of such provisions.
Whenever significant risks are identified, they are measured and limits are allocated in order to assure an adequate control. Global measurement of risk is carried out via a combination of the methodology applied to Portfolios for Trade and to the management of Assets and Liabilities.
Trading Books
In order to measure the risk in a global approach, the methodology of Value at Risk (“VaR”) is used. VaR is defined as the statistical estimate of the potential loss of value of a given position, during certain period and at certain confidence level. VaR provides a universal measure of the level of exposure of the different risk portfolios; it allows the comparison of the risk level assumed in different securities and markets and expresses the level of each portfolio through a unique figure in economic units.
VaR is calculated via historical simulation, with a 521 working-days window (520 percentage changes) and a one-day horizon. The calculation is performed from a series of simulated gains and losses with 1% percentile at constant pesos and with pesos decreasing on an exponential basis, with a decrease factor that is reviewed on annual basis, the most conservative measure is the one to be reported. A confidence level of 99% is assumed.
Note that the historical simulation model is limiting to assume that the recent past represent the near future.
| | 91 |
The Value at Risk as of the end of third quarter of 2018 (unaudited) amounted to:
| Bank | ||
| VaR (Thousands of pesos) |
% | |
| Trading Desks | 88,382.53 | 0.07 |
| Market Making | 77,033.23 | 0.06 |
| Proprietary Trading | 21,460.01 | 0.02 |
| Risk factor | ||
| Interest rate | 87,542.47 | 0.07 |
| Foreign exchange | 48,198.33 | 0.04 |
| Equity | 1,245.09 | 0.00 |
| * % of VaR with respect to Net Capital | ||
The Value at Risk for the average the third quarter of 2018 (unaudited) amounted to:
| Bank | ||
| VaR (Thousands of pesos) |
% | |
| Trading Desks | 100,330.95 | 0.09 |
| Market Making | 80,202.02 | 0.07 |
| Proprietary Trading | 19,545.45 | 0.02 |
| Risk factor | ||
| Interest rate | 94,506.12 | 0.08 |
| Foreign exchange | 55,889.39 | 0.05 |
| Equity | 2,361.32 | 0.00 |
| * % of VaR with respect to Net Capital | ||
Likewise, monthly simulations of gains or losses of portfolios are carried out by revaluating such portfolios under different scenarios (Stress Test). Such estimates are generated using two different methods:
| § | Applying to risk factors the percentage changes observed in certain periods including relevant market turbulences. |
| § | Applying to risk factors changes that depend on the volatility of each risk factor. |
On a monthly basis “back testing” is carried out to compare daily gains and losses that would have been observed is the same positions had been maintained, taking into account only the change in value at risk in order to be able to fine tune the models. Even though these reports are prepared on a monthly basis, they include daily tests.
Assets and Liabilities Management
Commercial banking activities of Banco Santander generate important balance sheet amounts. The Assets and Liabilities Committee (“ALCO”) is responsible for determining the guidelines for the management of financial margin risk, net worth value and liquidity that must be followed by the different commercial portfolios. Pursuant to this approach, the General Direction of Finances has the responsibility to execute the strategies defined by the Assets and Liabilities Committee in order to modify the risk profile of the commercial portfolio by following the corresponding policies. Compliance with information requirements for interest rate, Exchange rate and liquidity risks is fundamental.
As part of the financial management of Banco Santander, sensitivity to Net Interest Income (“NIM”) and Market Value of Equity (“MVE”) of the different balance sheet items is analyzed in comparison to variations in interest rates. This sensitivity is derived from the difference between maturity dates of assets and liabilities and the dates interest rates are modified. The analysis is performed from the classification of each item sensitive to interest rate throughout time, according to their repayment, maturity or contractual modification of the applicable interest rate.
| | 92 |
| Sensitivity NIM | Sensitivity MVE | ||||||||
| Bank | Jul-18 | Aug-18 | Sep-18 | Average | Jul-18 | Aug-18 | Sep-18 | Average | |
| Balance MXN GAP | 31% | 36% | 33% | 33% | 78% | 75% | 76% | 76% | |
| Scenario | (100) bp | (100) bp | (100) bp | N/A | 100 bp | 100 bp | 100 bp | N/A | |
| Balance USD GAP | 68% | 62% | 67% | 66% | 26% | 17% | 20% | 21% | |
| Scenario | (100) bp | (100) bp | (100) bp | N/A | (100) bp | (75) bp | (100) bp | N/A | |
Using simulation techniques, the predictable change of the net interest income and the market value of equity are measured in different interest rate scenarios, and their sensitivity under extreme movement of such scenarios, as of the end of the third quarter of 2018:
| Sensitivity NIM | Sensitivity MVE | ||||||||
| Bank | Scenario | Total | Derivatives | Non Derivatives | Scenario | Total | Derivatives | Non Derivatives | |
| Balance MXN GAP | (100) bp | (488) | (458) | (30) | 100 bp | (3,222) | (119) | (3,103) | |
| Balance USD GAP | (100) bp | (252) | 117 | (369) | (100) bp | (374) | (1,037) | 664 | |
The Assets and Liabilities Committee adopts investment and hedging strategies in order to maintain such sensitivities within the target range.
Limits
Limits are used to control global risk of the financial group derived from each portfolio and books. The structure of limits is used to control exposures and to establish the total risk authorized to business units. These limits are established for VaR, Loss alert, maximum loss, equivalent volume of interest rate, delta equivalent in equity, open foreign currency positions, sensitivity of net interest income and sensitivity of market value of equity.
Liquidity Risk
Liquidity risk is related to the ability of Banco Santander to finance acquired commitments at reasonable market prices, as well as to fulfill business plans with stable financing sources. Risk factors may be external (liquidity crisis) and internal due to excessive concentration of maturities.
Banco Santander carries out a coordinated management of maturities of assets and liabilities, and oversees the maximum timing difference profiles. This monitoring is based in the analysis of maturities of assets and liabilities, both contractual and managerial. Banco Santander realizes a control for the maintenance of a sufficient quantity of liquid assets to guarantee a horizon of survival during a minimum of days facing a scene of stress of liquidity without resorting to additional financing sources. The risk of Liquidity is limited in terms of a minimal period of days established for local, foreign and consolidated currencies. It is necessary to indicate that in the current quarter incidents have not been had in the metrics.
| Million pesos | Total | 1D | 1W | 1M | 3M | 6M | 9M | 1Y | 5Y | >5Y | ||
| Structural GAP | 157,593 | 1,952 | 37,529 | (21,421) | 60,421 | 22,736 | 39,160 | 24,289 | 321,000 | (328,074) | ||
| Non Derivative | 131,603 | 1,952 | 37,474 | (21,672) | 60,329 | 18,822 | 39,284 | 23,349 | 308,402 | (336,337) | ||
| Derivatives | 25,989 | 0 | 55 | 251 | 92 | 3,914 | (124) | 940 | 12,598 | 8,263 |
Credit Risk
Management of credit risk of Grupo Financiero Santander is developed differently for the different segments of clients along the three phases of the credit process: acceptance, follow-up and recovery.
From a global perspective, management of credit risk in Grupo Financiero Santander is responsible for the identification, measurement, integration and assessment of the aggregated risk and the profitability according to such risk; with the purpose of oversee the levels of risk concentration and to adapt them to the limits and objectives previously established.
Risks receiving an individual treatment (risks with companies, Grupo Financiero Santander and financial entities) are identified and taken apart from those other risk that are managed in standardized manner (consumer and mortgages credits to individuals, loans to businesses and small enterprises)
Risks managed on individual basis are subject to a solvency or rating system with a related probability of failure that allows the measuring of the risk for each client and for each transaction from the beginning. The assessment of the client, after
| | 93 |
analyzing other relevant risk factors in different areas, is adjusted according to the special characteristics of the transaction (guarantee, term, etc.,)
Standardized risks require, due to their special characteristics (great number of transactions for relatively low amounts), a different management that allows an efficient process and effective use of resources, so automated decision tools are used (expert and credit scoring systems).
Management of loans to companies is complemented, during the follow-up phase, with the so called “system of special monitoring” that determines the policy to be followed in the management of the risks with companies or groups rated within such category. Different situations of levels of monitoring are identified and generate different actions. A special monitoring grade is given in the case of alert signals, systematic reviews, or specific initiatives promoted by the Risks Department or Internal Audit.
Recovery Units constitute a critical element in the management of irregular risk, in order to minimize the final loss for Grupo Financiero Santander. These units are responsible for a specialized management of the risk from the moment they are classified as irregular risk loans (defaulting payment).
Grupo Financiero Santander has carried out a policy for the selective growth of risk and a strict treatment of late payments and the creation of the corresponding provisions, based in the prudent criteria defined by the Group.
Probability of Default and Expected Losses
Pursuant to the provisions on Comprehensive Risk Management included in the general regulations applicable to credit institutions, as part of the credit risk management, credit institutions must determine the probability of default.
The system allows the calculation of the probability for the different loans portfolios.
| a. | The probability of failure is for “No Retail” portfolios. It is determined via the fine tune of the ratings of clients in a given moment, based in the Monthly Default Rates observed during a period of five years. Such Default Rates are adjusted to an economic cycle of ten years. For “Retail” portfolios, the standard default probabilities set by the Basilea Convention are used. |
| b. | Once the probability of default is determined, the parameters of “severity of Loss” (“LGD”) and “Exposure at Default” (“EAD”) stipulated in Basilea, are taken into consideration. |
Once the abovementioned factors are obtained, the Expected Loss (“PE”) is calculated as follows:
Expected Loss = Probability of Default x Severity of Loss x Exposure at Default
i.e.: PE = PD * LGD * EAD
Counterparty Risk
Included in the credit risk, there is a concept that, due to its characteristics, it requires a special management: the Counterparty Risk.
Counterparty Risk is the risk Banco Santander assumes with governmental entities, financial institutions, corporations, companies and individuals in their treasury activities and correspondent bank activities. The measurement and control of the Credit Risk in Financial Instruments, Counterparty Risk, is carried out by a special unit with an organizational structure independent from the business areas.
The control of Counterparty Risk is performed daily via the Interactive Risk Integrated System (“IRIS”), which informs the credit line available with any counterparty, in any product and any term.
For the control of the counterparty lines, the Equivalent Credit Risk (“REC”) is used. REC is an estimate of the amount Banco Santander may lose in current transactions with certain counterparty, if such counterparty commits a default in any moment until the maturity date of transactions. REC takes into account the Current Credit Exposure, which is defined as the cost to substitute the transaction at market value provided that this value is positive for Banco Santander, and it is measured as the market value of the transaction (“MtM”). In addition, REC includes the Potential Credit Exposure or Potential Additional Risk (“RPA”), which represents the possible evolution of the current credit exposure until maturity, given the characteristics of the transaction and the possible variations in the market factors. The REC Gross considers definitions described above, without considering mitigating by netting or by mitigating collateral.
For the calculation of REC, mitigating factors of the counterparty credit risk are taken into consideration, such as collaterals, netting agreements, among other. The methodology continues to be effective.
| | 94 |
In addition to the Counterparty Risk, there is the Settlement Risk, which is present in every transaction at its maturity date, when the possibility that the counterparty does not comply with its payment obligations arises, once Banco Santander has complied with its obligations by issuing payment directions.
For the process of control for this risk, the Deputy General Direction of Financial Risks oversees on a daily basis the compliance with the limits on counterparty credit risks by product, term and other conditions stipulated in the authorization for financial markets. Likewise, it is the responsible for communicating on a daily bases, the limits, consumptions and any incurred deviation or excess.
On a monthly basis, a report is presented to the Comprehensive Risk Management Committee, with respect to the limits to Counterparty Risks, Issuer Risks and current consumptions. In addition, on a monthly basis, a report is presented to the Global Banking Credit Committee and Retail Credit Committee with respect to incurred excesses and transactions with non authorized customers. In addition, it informs to the Comprehensive Risk Management Committee the calculation of the Expected Loss for current transactions in financial markets at the closing of every month and different scenarios of stress of Expected Loss. All of the above according to the methodologies and assumptions approved by the Comprehensive Risk Management Committee.
Currently, we have approved lines of Counterparty Risks in Banco Santander for the following segments: Mexican Sovereign Risk and Domestic Development Banking, Foreign Financial Institutions, Mexican Financial Institutions, Corporations, Companies Banking-SGC, Institutional Banking, Large Enterprises Unit, Project Finance.
Equivalent Net Credit Risk of the lines of Counterparty Risk and Issuer Risk of Banco Santander for the third quarter of 2018:
| Equivalent Net Credit Risk | ||||
| Millions of U.S. Dollars | ||||
| Segment | Jul-18 | Aug-18 | Sep-18 | Average |
| Sovereign Risk, Development Banking and Financial Institutions | 17,860.82 | 18,870.90 | 19,891.73 | 18,874.48 |
| Corporates | 975.05 | 928.98 | 930.21 | 944.75 |
| Companies | 167.05 | 151.76 | 170.54 | 163.12 |
The equivalent credit risk lines maximum gross counterparty risk of Banco Santander as of the end of the third quarter of 2018, which corresponds to derivative transactions, is distributed depending on the type of derivative:
| Equivalent Gross Credit | |
| Millions of U.S. Dollars | |
| Type of Derivative | End of the third quarter of 2018 |
| Interest Rate Derivatives | 15,727.64 |
| Exchange Rate Derivatives | 37,195.20 |
| Bonds Derivatives | - |
| Equity Derivatives | 140.91 |
| Total | 53,063.76 |
The Expected Loss of Banco Santander at the end of the third quarter of 2018, and the quarterly average of the expected loss of the lines of Counterparty risk and issuer risk of Banco Santander, for the third quarter of 2018 are:
| Expected Loss | ||||
| Millions of U.S. Dollars | ||||
| Segment | Jul-18 | Aug-18 | Sep-18 | Average |
| Sovereign Risk, Development Banking and Financial Institutions | 16.09 | 14.82 | 15.24 | 15.38 |
| Corporates | 2.03 | 1.95 | 1.94 | 1.97 |
| Companies | 3.12 | 2.94 | 3.13 | 3.06 |
The segments of Mexican Financial Institutions and Foreign Financial Institutions are very active counterparties with whom Banco Santander has current positions of financial instruments with Counterparty Credit Risk. It is important to mention that Equivalent Credit Risk is mitigated by netting agreements (ISDA-CMOF) and, in some cases, by collateral agreements (CSA-CGAR) or revaluation agreements with counterparties.
| | 95 |
Respect to total collateral received for derivatives transactions as of the end of the third quarter of 2018:
| Cash collateral | 92.54% |
| Collateral refer to bonds issued by the Mexican Federal Government | 7.46% |
In respect to collateral management in derivatives transactions, counterparty’s positions are valuated according to the frequency established at each collateral agreement. In addition, all credit risk parameters, established at each collateral agreement are considered to obtain the amount of collateral to be delivered or to be received from the counterparty. These amounts, margin calls, will be requested from the counterparty which has the right to receive the collateral, according to the frequency established at the collateral agreement.
The counterparty which receives the margin call, has the right to analyze the valuation and it could result on discrepancies to solve.
In respect to the correlation between the collateral and the counterparty in derivatives transactions, the Institution confirms that, at this time, the eligible collateral consists on government bonds and cash collateral, so as a result, there are no adverse effects due to correlation between the counterparty and the collateral.
In the hypothetical stressed scenario, assuming that the Institution’s credit rating decreases and the impact of this credit rating decrease on the collateral that the Institution would have to deliver, this stressed test confirms that there would not be significant impact; a few of the Thresholds established on the Institution’s collateral agreements are dependent on the Institution’s credit rating.
Legal Risk
Legal Risk is defined as the potential loss due to the failure to comply with the applicable legal and administrative regulations, the issue of administrative and judicial resolutions against Banco Santander and the application of fines, with respect to the transactions carried out by Banco Santander.
Pursuant to the provisions regarding the Comprehensive Risk Management, the following activities are performed: a) Establishment of policies and procedures for analyzing the legal validity and the proper execution of the legal acts. b) estimates of the amount of potential losses derived from judicial or administrative orders against Banco Santander and the possible application of fines c) Analysis of the legal acts governed by a legal system different to the Mexican laws, d) communication to directors and employees on the legal and administrative regulations applicable to transactions and e) the performance, at least on annual basis, of internal legal audits.
Operational Risk
Operational risk is defined as the risk of loss resulting from inadequate or failed internal processes, people and systems or from external events.
The main objective is to avoid or reduce the impact of Operational Risk, through the identification, monitoring and control of the factors that trigger the events of potential loss. Therefore it also requires to establish policies and procedures to operate under the risk exposure that the Bank is willing to accept.
The sound management of risk involves mainly the heads of each Business Unit on the management tools and results; as well as a continuous training to the staff. The pillars on which the operational risks are managed are:
a) Strategic planning and budget: Required activities to define the operational risk profile for Banco Santander Mexico; this includes:
Risk appetite, defined as the level of risk that the Bank is willing to accept
Loss annual budget; ensuring the overview of real losses according to the budget and the deviations, challenging the controls and extenuation measures.
b) Identify, measure and evaluation of the Operational risk; identify risks and the factors that trigger them in the Bank, and estimate the qualitative or/and quantitative impact.
c) Monitoring; The Overview and monitoring of operational risk goal for periodic analysis of available information of risk (type and level) during the normal development of the activities.
d) Extenuation (Mitigation); once the Operational Risk has been assessed, it is required to establish actions to avoid the risk or to mitigate the impact for risk that materialize, develop a cost-benefit study and indicators should be implemented to help us evaluate the effectiveness of these actions.
e) Reporting; the Operational Risk profile and performance of the Operational Risk environment is presented on a regular basis in Bank Committees.
| | 96 |
Banco Santander México had a monthly average loss of Ps.116.9 million pesos for Operational Risk overall as of September 30, 2018.
Since December 2016, Banco Santander México applies the Alternate Standard Approach (ASA) for operational risk capital requirements.
Technological Risk
Technological risk is defined as the potential loss due to damages, discontinuation, alterations or failures derived from the use or dependence on hardware, software, systems, applications, networks and any other data channel distribution for the provision of banking services to the clients of Banco Santander.
Banco Santander has adopted a corporate model for the management of Technological Risks, integrated to the processes of service and support to computing areas in order to identify, oversee, control, mitigate and report the Computing Technology Risks the transaction is exposed to, with the aim of establishing control measures that decrease the probability of risks to occur.
Processes and levels of authorization
Pursuant to internal regulations, all the products and services traded by Banco Santander are approved by the “Comité de Comercialización” and by the “Comité Corporativo de Comercialización”. Those products or services that are modified or extended with respect to their original approval must be approved by the “Comité de Comercialización” and, depending of their relevance, the “Comité Corporaivo de Comercialización” must approve them too.
All areas taking part in the operation of the product or service, depending on the nature of such product or service, as well as the areas responsible for their accounting registration, legal formalization, fiscal treatment, risk assessment, etc. are present in the Committee. All approvals shall be unanimous as there are no authorizations approved by majority of votes. In addition to the Committee’s approval, there are products that require authorizations from local authorities, and therefore, the Committee’s approvals are subject to the authorizations issued by the competent authorities in each case.
Finally, all the approvals shall be authorized by the Comprehensive Risk Management Committee.
Independent Reviews
Banco Santander is subject to the monitoring and supervision of the National Bank and Exchange Commission, the Central Bank of Mexico and the Bank of Spain, and such monitoring and supervision is exercised via follow-up processes, inspection visits, information requests, delivery of documents and reports.
Likewise, periodic reviews are performed by Internal and External Auditors.
General description of the valuation techniques
Derivative financial securities are valued at reasonable value, according to the accounting rules established in the Circular Letter for Credit Institutions issued by the National Banking and Exchange Commission, in Principle B-5 “Derivative Financial Instruments and hedging Transactions” and the provisions in Principle A-2 “Application of specific rules”, and the provisions in the specific rule included in Bulletin C-10 of the Financial Information Rules.
| A. | Methodology of Valuation |
| 1) | Trading purposes |
| a) | Organized Markets |
Valuation is made at the corresponding closing market price. Prices are provided by the supplier of prices.
| b) | Over-the-Counter Markets |
| i) | Derivative financial instruments with optionality. |
In the majority of the cases, a general form of the Black & Scholes model is used. Such model assumes that the underlying product follows a lognormal distribution. For exotic products or when payment depends on the trajectory of any market variable, MonteCarlo simulations are used. In this case, it is assumed that logarithms of the different variables follow a multi-varied normal distribution.
| ii) | Derivative financial instruments with no optionality. |
The valuation technique is to obtain the present value of the estimated future flows.
In all cases, Banco Santander carries out the valuation of its positions and registers the corresponding value. In some cases, a different calculation agent is designated, and such calculation agent may be the counterparty or a third party.
| | 97 |
| 2) | Hedging purposes |
In the performance of its commercial banking activities, Banco Santander has tried to cover the evolution of the financial margin of structured portfolios that are exposed to adverse movements in interest rates. The ALCO, the body responsible for the management of long-term assets and liabilities, has constituted the portfolio via which the Banco Santander achieves such hedge.
An accounting hedge is defined as a transaction that complies with the following conditions:
| a. | A hedge relationship is designated and documented from the beginning in an individual file, where its objective and strategy is established. |
| b. | The hedge is effective for the compensation of variations in the reasonable value or in the cash flows attributed to such risk, according to the risk management documented at the beginning. |
The Management of Banco Santander performs derivative transactions for hedging purposes with swaps.
Derivatives for hedging purposes are valued at market value, and the effect is recognized depending on the type of accounting hedge, pursuant to the following:
| a. | In the case of fair value hedges, they are valued at market value for the risk covered, the primary position and the hedging derivative instrument, and the net effect is registered in the statement of income of the corresponding period. |
| b. | In the case of cash flow hedges, the hedging derivative instrument is valued at market value. The effective portion of the hedge is registered in the comprehensive income account, within the stockholders’ equity, and the ineffective portion is registered in the statement of income. |
Banco Santander ceases the recording of hedges at the maturity date of the derivative, or when such derivative is sold, cancelled or exercised; when the derivative does not reach a high efficiency in compensating the changes in the reasonable value or the cash flows of the covered item, or when Banco Santander decides to cancel the hedge.
It shall be fully evidenced that the hedge fulfills the objective for which derivatives were contracted for. This effectiveness requirement assumes that the hedge must comply with a maximum range of deviation with respect to the initial objective of 80% to 125%.
In order to demonstrate the efficacy of hedges, two tests are to be carried out:
| a) | Forward-looking Test: it is demonstrated that, in the future, the hedge will be within the aforementioned range of deviation. |
| b) | Retrospective Test: This test reviews if, in the past, from its initial date to now, the hedge has been maintained within the allowed range of deviation. |
In the cases of Fair Value Hedges and the Cash Flow Hedges, they are retrospective and forward-looking efficient and within the allowed maximum range of deviation.
| B. | Reference Variables |
The most relevant reference variables are:
Exchange Rates
Interest Rates
Equity
Baskets of equities and stock indexes.
| C. | Frequency of valuation |
Derivative financial instruments for trading and hedging purposes are valued on a daily basis.
Management of internal and external sources of liquidity that may be used for the compliance of requirements related to derivative financial instruments.
Resources are obtained via the National and International Treasury departments.
| | 98 |
Changes in exposure to identified risks, contingencies and events, known or expected, in derivative financial instruments.
At the end of the third quarter of 2016, Banco Santander has no situation or contingency such as changes in the value of the underlying asset or the reference variables, that may cause the use of the derivative financial instruments to be different to their original intended use, a significant change in their scheme or the total or partial loss of the hedge, requiring the Issuer to assume new obligations, commitments or variations in its cash flow or affecting its liquidity (day trade calls), nor contingencies or events known or expected by the Management that may affect future reports.
| Summary of Derivative Financial Instruments |
| Million Pesos as of September 30th, 2018 |
| Derivatives | Underlying Asset | Purposes | Notional |
Fair Value | |
| trading or | Current Quarter | Previous Quarter | |||
| hedging | |||||
| Forwards | Foreign Currency | Trading | 448,454 | 1,901 | 251 |
| Forwards | Equity | Trading | 2,385 | (8) | 0 |
| Futures | Foreign Currency | Trading | 1,616 | 0 | 0 |
| Futures | Market Index | Trading | 460 | 0 | 0 |
| Futures | Interest Rate | Trading | 610 | 0 | 0 |
| Futures | Equity | Trading | 0 | 0 | 0 |
| Options | Equity | Trading | 484 | (61) | 8 |
| Options | Foreign Currency | Trading | 162,433 | (10) | 451 |
| Options | Market Index | Trading | 8,764 | 124 | 82 |
| Options | Interest Rate | Trading | 281,214 | (131) | (201) |
| Swaps | Cross Currency | Trading | 931,690 | 2,177 | 1,897 |
| Swaps | Interest Rate | Trading | 4,922,451 | (1,478) | (1,465) |
| Swaps | Equity | Trading | 960 | (205) | (313) |
| Forwards | Foreign Currency | Hedging | 69,435 | 6,567 | 3,713 |
| Swaps | Cross Currency | Hedging | 53,321 | (2,527) | 3,170 |
| Swaps | Interest Rate | Hedging | 10,342 | 124 | 113 |
Santander México, at the execution of transactions of OTC derivative financial instruments, has Collateral formalized agreements with many of its counterparties, which function as market value guarantee of the derivative transactions, and it is determined based on the exposure of the net position on risk with each opposing party. The managed Collateral consists mainly in cash deposits, whereat there is not a deterioration situation.
During the third quarter of 2018, there have been no derivatives which underlying assets are investments in proprietary shares or stock certificates that represent them.
During the third quarter of 2018, the number or expired derivative financial instruments and closed positions was as follows (unaudited):
| Description | Maturities | Closed Positions | |
| Caps and Floors | 383 | 18 | |
| Equity Forward | 0 | 0 | |
| OTCEquity | 224 | 0 | |
| OTCFx | 1636 | 0 | |
| Swaptions | 8 | 0 | |
| Fx Forward | 1399 | 102 | |
| IRS | 1711 | 1168 | |
| CCS | 69 | 21 |
The amount of day trade calls performed during the quarter was the necessary for covering contributions to organized markets and the requirements in collateral agreements.
During the third quarter of 2018, there were no defaults by counterparties.
| | 99 |
Sensitivity Analysis
Identification of Risks
Sensitivity measures of market risk associated with securities and derivative financial instruments are those that measure the change (sensitivity) of the market value of the financial instrument concerned, when changes in each of the risk factors associated with same occur.
The sensitivity of the value of a financial instrument when changes in market factors occur and is determined by the full instrument revaluation.
The sensitivities are detailed below according to each risk factor and associated historical consumption of the trading book.
The management strategy of the organization is integrated with security positions and derivatives. The latter are used largely to mitigate the market risk of the first. In view of the above, the sensitivities or exposures as described below are both types of instruments considered as a whole.
1. Sensitivity to risk factor “Equity (“Delta EQ”)”
The EQ Delta shows the change in the portfolio's value in relation to changes in the prices of equities.
The EQ Delta calculated for the case of derivative financial instruments considered the relative change of 1% in the prices of the underlying assets in equities, in the case of equities, this considers the relative variation of 1% of market price title.
2. Sensitivity to risk factor “Foreign Exchange”, (“Delta FX”)
The FX Delta shows the change in the portfolio's value in relation to changes in asset prices exchange rate.
The FX Delta calculated for the case of derivative financial instruments considered the relative change of 1% in the prices of the underlying assets of the exchange rate, In the case of currency positions, this considers the relative variation of 1%of the corresponding exchange rate.
3. Sensitivity to risk factor “Volatility” (“Vega”)
Vega sensitivity is the measure resulting from changes in the volatility of the underlying asset (the reference asset). Vega risk is the risk that a change in the volatility of the underlying asset value, that results in a change in the market value of the derivative.
The calculation of Vega sensitivity, considers the absolute change of 1% in the volatility of the underlying asset value.
4. Sensitivity to risk factors “Interest Rate” (“Rho”)
This sensitivity quantifies the change in value of financial instruments for the trading portfolio in the face of a parallel increase in the interest rate curves of a basis point.
The table below presents the sensitivities described above corresponding to the position of the trading portfolio, as of the end of the third quarter of 2018:
| Sensitivity Analysis | ||||||
| Million pesos | ||||||
| Total Rate Sensitivity | ||||||
| Pesos | Other Currencies | |||||
| Sens. a 1 Bp | 0.58 | 8.02 | ||||
| Vega Risk factor | ||||||
| EQ | FX | IR | ||||
| Total | 0.59 | 1.84 | 1.13 | |||
| Delta Risk Factor (EQ and FX) | ||||||
| EQ | FX | |||||
| Total | (0.54) | (2.46) | ||||
| | 100 |
It is considered that the above sensitivity table reflects prudent management of the trading portfolio of Banco Santander with respect to risk factors.
Stress Test for Derivative Financial Instruments
The following are various stress test scenarios considering various scenarios calculated for the trading portfolio of Banco Santander.
| · | Probable scenario |
This scenario was defined based in the movements derived from a standard deviation, with respect to risk factors that have an influence over the valuation of financial instruments. Specifically:
| o | Risk factors of Interest Rate (“IR”), volatility (“Vol”) and rate of Exchange (“FX”) were incremented in a standard deviation. |
| o | Risk factors with respect to stock market (“EQ”) were decreased in a standard deviation. |
| · | Possible scenario |
Under this scenario, as requested in the official letter, risk factors were modified in 25%. Specifically:
| o | Risk factors: IR, Vol and FX were multiplied by 1.25 that means, they were incremented in 25%. |
| o | Risk factor EQ was multiplied by 0.75 that means, it was decreased in 25%. |
| · | Remote scenario |
Under this scenario, as requested in the official letter, risk factors were modified in 50%. Specifically:
| o | Risk factors IR, Vol and FX are multiplied by 1.50, that is, they were incremented in 50%. |
| o | Risk factor EQ was multiplied by 0.5, that is, it was decreased a 50%. |
Effect in the Income Statement
The following table shows the possible income (loss) for the trading portfolio of Banco Santander, in millions of Mexican pesos for each stress scenario, as of the end of the third quarter of 2018:
| Summary of Stress Test | |
| Million pesos | |
| Risk Profile | Stress all factors |
| Probable scenario | (16) |
| Remote scenario | (433) |
| Possible scenario | (123) |
| | 101 |
24. Disclosure of the Liquidity Coverage Ratio
On December 31st, 2014, the Commission and the Central Bank of Mexico published in the Federal Official Gazette, the General Provisions on Liquidity Requirements for multiple banking institutions, which establish liquidity requirements that credit institutions must comply at all times in accordance with the guidelines established by the Committee on Regulation of Bank Liquidity at its meeting held on October 17th, 2014.
These regulations came into effect on January 1st, 2015.
During the third quarter of 2018 the weighted average CCL for the Bank is 141.45%, complying with the Bank´s desired Risk Profile and well above the regulatory minimum established in the regulations.
| Million pesos | Amount unweighted (average) | Weighted amount (average) | ||
| Liquidity Assets | ||||
| 1 | Total high-quality liquid assets | Not applicable | 162,337 | |
| Cash Outflows | ||||
| 2 | Unsecured retail financing | 208,366 | 12,247 | |
| 3 | Stable funding | 171,788 | 8,589 | |
| 4 | Less stable funding | 36,577 | 3,658 | |
| 5 | Unsecured wholesale funding | 380,014 | 145,054 | |
| 6 | Operational deposits | 252,369 | 58,829 | |
| 7 | Non-operational deposits | 106,685 | 65,265 | |
| 8 | Unsecured debt | 20,960 | 20,960 | |
| 9 | Secured wholesale funding | Not applicable | 677 | |
| 10 | Additional requirements: | 195,945 | 43,530 | |
| 11 | Outflows related to derivatives exposures and other collateral requirements | 58,696 | 35,066 | |
| 12 | Outflows related to loss of funding on debt products | 0 | 0 | |
| 13 | Credit and liquidity facilities | 137,249 | 8,464 | |
| 14 | Other contractual funding obligations | 84,460 | 294 | |
| 15 | Other contingent funding obligations | 3,985 | 3,985 | |
| 16 | Total Cash Out | Not applicable | 205,787 | |
| Cash Inflows | ||||
| 17 | Cash inflows secured transactions | 78,559 | 3,134 | |
| 18 | Cash inflows from operations unsecured | 101,319 | 76,371 | |
| 19 | Other cash inflows | 11,382 | 11,382 | |
| 20 | Total Cash Inflows | 191,260 | 90,886 | |
| Total adjusted value | ||||
| 21 | Total of Eligible Liquid Assets | Not applicable | 162,337 | |
| 22 | Total Net Cash Out | Not applicable | 114,901 | |
| 23 | Liquidity Coverage Ratio | Not applicable | 141.45% | |
The presented numbers are subject to review and therefore they might suffer changes.
Notes relating to the Liquidity Coverage Ratio
| a) | Natural days contemplated in the quarterly report. |
| · | 92 days. |
| b) | Main causes of the results of the Liquidity Coverage Ratio and the evolution of its main components; |
| · | During the third quarter, we observed an increase in credit activity which was funded by wholesale financing. |
| c) | Changes of major components within the quarter report. |
| · | During the third quarter, we observed an increase in credit activity which was funded by wholesale financing. |
| d) | Evolution of the composition of the Eligible and Computable Liquid Assets. |
| · | The Bank has a significant proportion of liquid assets comprised by government debt, deposits in Bank of Mexico and cash. |
| | 102 |
| e) | Concentration of funding sources. |
| · | The main sources of funding are diversified by its own nature as: (i) demand deposits; (ii) term deposits, which include retail deposits and the money market (promissory notes with interest payable at maturity), and (iii) repurchase agreements. |
| · | In addition, the Bank has registered programs for local market´s debt issuances and has experience issuing in international markets. |
| f) | Exposures in financial derivative instruments and possible margin calls. |
| · | Performed analyses don’t show any significant vulnerabilities coming from financial derivative instruments. |
| g) | Currency mismatch. |
| · | Performed analyses don’t show any significant vulnerability in Currency mismatch. |
| h) | Description of the level of centralization of liquidity management and interaction between the units of the group. |
| · | Banco Santander Mexico is autonomous in terms of liquidity and capital; it develops its financial plans, liquidity forecast, and analyzes funding requirements for all its subsidiaries. The Bank is responsible for its own "ratings", its issuance program, "road shows", any other activities to keep its ability to access capital markets. The issuance activity is performed without having the guarantee of the parent company. |
| · | The liquidity management of all Bank subsidiaries is centralized. |
| i) | Cash flows and Inflows, if any, that are not captured in this framework, but the institution considers relevant to the liquidity profile. |
| · | The Liquidity Coverage Ratio considers only the inflows and outflows up to 30 days, however the flows that are not contained in the metric are well managed and controlled by the Group. |
Additional notes for the previous quarter
| I. | Quantitative information: |
| a) | The concentration limits for different groups of guarantees received and major sources of financing. |
| · | The Bank has no concentration limits under guarantees received by market operations, as they are mainly composed of government securities and cash. |
| b) | Exposure to liquidity risk and funding needs of the institution, taking into account the legal, regulatory and operational constraints on liquidity transfers. |
| · | Liquidity risk is associated with our capacity to finance the commitments we undertake at reasonable prices, as well as maintaining our ability to carry out our business plans using stable financing sources. Factors that influence liquidity risk may be external, such as a liquidity crisis, or internal, such as an excessive concentration of maturities. |
| · | The measures used to control liquidity risk in balance sheet management are the liquidity gap, liquidity ratios, stress scenarios and liquidity horizons. |
| · | The liquidity horizons metric has been defined to ensure that the Group has sufficient liquid assets to comply with its requirements during a certain period of time, given different stress scenarios. The Group set a 90-day survival horizon for local currency and consolidated balance and a 30-day survival horizon for foreign currency. During the 2Q18, the balance remained above the established limits, and therefore we maintained a sufficient liquidity buffer. |
| 29/06/2018 | Term | Amount | |
| Million pesos | |||
| Consolidated | 90 days | 167,780 | |
| Local Currency | 90 days | 76,566 | |
| Foreign Currency | 30 days | 95,758 | |
| c) | Balance sheet maturity liquidity gap including off balance sheet accounts. |
| · | The table below shows the liquidity gap of our assets and liabilities using maturity dates as of June 29, 2018. The reported amounts include cash flows from interest on fixed and variable rate instruments. The interest on variable rate instruments is determined using the forward interest rates for each period presented. |
| | 103 |
| Million pesos | Total | 0-1 months |
1-3 months
|
3-6 months
|
6-12 months
|
1-3 years
|
3-5 years
|
>5 years
|
Not Sensitive |
| Money Market | 159,230 | 34,800 | 0 | 11 | 10 | 41 | 0 | 0 | 124,367 |
| Loans | 852,310 | 43,295 | 81,251 | 88,190 | 99,999 | 254,442 | 122,620 | 161,808 | 704 |
| Trade Finance | 0 | 0 | 0 | 0 | 0 | 0 | 0 | 0 | 0 |
| Intragroup | 855 | 0 | 0 | 0 | 0 | 0 | 0 | 0 | 855 |
| Securities | 279,096 | 211,901 | 138 | 1,281 | 1,467 | 43,939 | 2,954 | 11,298 | 6,119 |
| Permanent | 11,734 | 0 | 0 | 0 | 0 | 0 | 0 | 0 | 11,734 |
| Other Balance Sheet Assets | 2,537,133 | 0 | 0 | 0 | 0 | 0 | 0 | 0 | 2,537,133 |
| Total Balance Sheet Assets | 3,840,357 | 289,996 | 81,389 | 89,481 | 101,476 | 298,422 | 125,574 | 173,107 | 2,680,912 |
| Money Market | (109,647) | (33,744) | 0 | 0 | 0 | 0 | 0 | 0 | (75,903) |
| Deposits | (655,004) | (263,214) | (24,316) | (16,988) | (12,061) | (19,987) | (11,628) | (306,810) | 0 |
| Trade Finance | 0 | 0 | 0 | 0 | 0 | 0 | 0 | 0 | 0 |
| Intragroup | 0 | 0 | 0 | 0 | 0 | 0 | 0 | 0 | 0 |
| Long-Term Funding | (196,801) | (3,109) | (16,997) | (23,162) | (41,213) | (38,281) | (47,276) | (2,884) | (23,878) |
| Equity | (121,959) | 0 | 0 | 0 | 0 | 0 | 0 | 0 | (121,959) |
| Other Balance Sheet Liabilities | (2,581,367) | 0 | 0 | 0 | 0 | 0 | 0 | 0 | (2,581,367) |
| Total Balance Sheet Liabilities | (3,664,777) | (300,067) | (41,313) | (40,149) | (53,274) | (58,268) | (58,905) | (309,694) | (2,803,107) |
| Total Balance Sheet Gap | 175,579 | (10,072) | 40,076 | 49,331 | 48,203 | 240,154 | 66,669 | (136,587) | (122,195) |
| Total Off-Balance Sheet Gap | 27,681 | (12,544) | 585 | 393 | 9,312 | 5,015 | 5,823 | 3,845 | 15,252 |
| Total Structural Gap | 76,978 | 39,278 | 48,944 | 54,845 | 241,299 | 72,492 | (132,742) | (197,846) | |
| Accumulated Gap | 135,182 | 116,256 | 165,200 | 402,874 | 461,345 | 533,836 | 401,094 | 203,248 | |
| II. | Qualitative information: |
| a) | The way in which liquidity risk is managed within the institution, considering the risk tolerance, the structure and responsibilities for managing liquidity risk, internal liquidity reports, the liquidity risk strategy, policies and practices across business lines and with the board of directors. |
| · | Our general policy regarding liquidity management seeks to ensure that even under adverse conditions, we have enough liquidity to fulfill client needs, maturing liabilities and working capital requirements. The Bank ´s liquidity management is based on analyses of asset and liability maturities, using contractual and management models. |
| · | The Financial Management Area is responsible for executing the strategies and policies established by ALCO in order to modify the risk profile of the Bank, within the limits established by the CAIR who reports to the Board. |
| b) | Financing strategy, including diversification policies, and whether the funding strategy is centralized or decentralized. |
| · | Annually the Financial Plan for the Bank is prepared considering: the projected business growth, the debt maturity profile, risk appetite, expected market conditions, the implementation of diversification policies and regulatory metrics and the analysis of the liquidity buffer. The Financial Plan is the guide used to issue debt or contract term liabilities and aims to maintain adequate liquidity profile. |
| · | The funding strategy of all subsidiaries is centralized. |
| c) | Mitigation techniques of liquidity risk used by the institution. |
| · | The risk mitigation techniques in the Group have a proactive nature. The Financial Plan in addition to the projection exercises and stress test scenarios allows us to anticipate risks and implement measures to ensure that the liquidity profile is adequate. |
| d) | Explanation of how the stress tests are used. |
| · | The Liquidity Stress Test is a Risk Management tool designed to warn the governing committees and areas responsible for making decisions in this area about the potential adverse effects of the liquidity risk the Institution is exposed to. |
| | 104 |
| · | The results of these stress tests aim to identify the impacts prospectively in order to improve planning processes, and help align and calibrate Risk Appetite, Exposure Limits and Levels of Liquidity Risk tolerance. |
| e) | Description of contingent financing plans. |
| · | The plan includes the following elements: type and business model as the starting point. Early Warning Indicators to identify in a timely manner the increase in liquidity risk and the elements that define the crisis scenarios used. Additionally we measure the liquidity shortages that stress scenarios could produce and the available actions considered by the plan to restore liquidity conditions. Actions are prioritized in order to preserve the value of the entity and the stability of the markets. A key aspect of the Plan is the governance process, stating the areas responsible for the different stages involved: activation, execution, communication and maintenance of the Plan. |
| 25. Underlying Assets |
General data and stock market information
Each of the Series of this issue may be related, individually or jointly, pursuant to the provisions of the fourth paragraph of article 66 of the Mexican Exchange Law, to any of the following securities for which, during the last three years and up to date, no material suspensions have occurred in their trading.
The Issuer shall publish on a monthly basis at the Internet site www.santander.com.mx/conocealbanco/títulosopcionales the information regarding the behavior of the Underlying Assets of the Series in effect.
Indexes
| Index | Ticker Symbol |
| Índice de Precios y Cotizaciones | IPC |
| I. | Mexican Stock Exchange Index (IPC) |
The Mexican Stock Exchange IPC Index, is the main indicator of the performance of the Mexican stock market, and provides an indication of the performance of the stock market based on the variations in the prices of a balanced, weighted and representative sample representative of the issuers listed in the Mexican Stock Market, in line with international best practices.
The closing value of IPC is determined by the BMV and it may be consulted at the website www.bmv.com.mx.
GENERAL CHARACTERISTICS OF IPC
Formula:

Where:
It: Index in t time
Pit: Price of i issuer in t time
Qit: Stocks of issuer i in time t
FAFi: Adjustment Factor due to Variable Stocks of issuer i
fi: Adjustment factor due to ex - right of issuer i in time t
i= 1, 2, 3….n
Size of the Sample:
The IPC Index is composed of 35 issuers, and includes the most highly marketable security of each of these issuers and only one security per issuer. The number of components may vary based on corporate events.
Selection Criteria:
The following filters are used in the selection of securities that compose the IPC Index sample:
1º Criterion. Minimum continuous trading time. Those companies having at least 3 calendar months of continuous operation prior to the constituents review will be eligible.
| | 105 |
2º Criterion. Minimum floating shares percentage3. Those companies whose floating shares percentage is at least 12% or their floating market cap is at least 10 thousand million pesos at the selection date will be eligible.
%AFit ≥ 12% and/or
VCFit ≥ 10,000,000,000 pesos
where:
%AFit = Floating shares percentage of stock series i at time t
VCFit = Floating market cap of stock series I at time t
3° Criterion. From the stock series that fulfilled the previous criteria, will be eligible those with a floating Market cap, computed using the volume weighted average Price of the last three months previous to the constituents review, is at least 0.1% of the Market cap, considering the volume weighted average Price of the last three months previous to the constituents review, of the Index constituents list.
VCFi ≥0.1% VCFIPC
where:
VCFi = Floating market cap of stock series i
VCFIPC = Floating market cap of all of the Index’s constituents
4º Criterion. Largest turnover factor. From the stock series that fulfilled the previous criteria, will be eligible the 55 stock series with the largest turnover factor of the last 12 months previous to the constituents review.
In the case of listed companies that make follow-on public offerings, equivalent to, at least, 0.5% of the market capitalization of the Mexican Stock Market Composite Index “IPC CompMx” on the close of the offering date, the median will consider the monthly medians of at least 3 continuous calendar months, previous to the constituents review.
5º Criterion. Joint rating of the following indicators for each of the 55 companies’ stock series that fulfilled the previous criteria:
· Turnover Factor (FRi)
· Floating Market cap (VCFi), considering the volume weighted average Price of the last 12 months previous to the constituents review.
· Median of the monthly medians of the value traded in this Exchange, for the last 12 months. (Median Impi)
In order to choose the 35 companies which will shape up the Index’s constituent list, they shall be rated according to their turnover factor, floating market cap (volume weighted) and the median of the monthly medians of the value traded in the exchange for the last twelve months of their most liquid stock series (except for those listed stocks that made a follow-on public offering, as stated in criterion 4).
If two or more companies have the same final rating, the one with the largest floating market cap will be considered first.
Rating procedure
The 55 companies that fulfilled the prior criteria will be sorted in descending order by their turnover factor, floating market cap and the monthly median of the value traded in the exchange for the last twelve months receiving a rating according to the place they occupy in a consecutive fashion.
| Company | Turnover | Company | Mkt Cap | Company | Value Traded | ||
| Rating | Rating | Rating | |||||
| A | 1 | C | 1 | B | 1 | ||
| B | 2 | A | 2 | C | 55 | ||
| C | 3 | B | 55 | A | 3 | ||
| … | … | … | … | … | … | ||
| N | 55 | N | 20 | N | 34 |
All rates for the three factors are added up and the 35 companies with the smallest rate are selected.
| Company | Turnover | Mkt Cap | Value Traded | Joint | |||
| Rating | Rating | Rating | Rating | ||||
| A | 1 | 2 | 3 | 6 | |||
| B | 2 | 55 | 1 | 58 | |||
| C | 4 | 1 | 55 | 60 | |||
| … | … | … | … | … | |||
| N | 55 | 20 | 34 | 109 |
| | 106 |
Weightings and Floating Market Cap for the most traded stock series of the Companies in the Index’s Constituents’ list
The weighting of each stock series within the Index’s constituent list will be determined by its Floating Market Cap.
The floating shares percentage to calculate the Floating Market Cap will be rounded according to the following buffers:
Floating Shares Percentage Rounding Buffers:

Weighting for each Stock Series of the Companies in the Index’s Constituents’ list

where:
ωi = Weighting of the stock series i in the constituents list
VCFi = Floating Market cap of stock series i
CVFIPC = Floating Market cap of all of the stock series in the Index’s constituents list
Relevant Events Adjustments due to the obligation included in the Article 109 of the Mexican Stock Market Law
Taking in consideration the Index’s calculation formula, changes in the number of registered and floating shares, caused by a relevant event derived by the information obligation that both, individuals and legal entities, have in the assumptions established in the Article 109 of the Mexican Stock Market Law, will affect the weightings.
Maximum Weightings
In order to avoid weightings concentrations, and following the best international practices, the maximum weighting one single stock series can have by the start of the constituent list’s validity period is 25% of the total.
Likewise, the 5 largest stock series in the constituent list, can’t weigh altogether more than 60% of the total.
For the 60% limit, if during the validity of the already adjusted constituent list this same limit is overdrawn for a 45 consecutive trading day’s period, the BMV will make the corresponding adjustment in a proportional manner in order to fulfill the concentration limits condition stipulated for the Index.
Weighting limits in the Constituents’ list
25% capping adjustment for a stock series in the constituents’ list.
Let be the weighting of stock series i in the constituents list,
| | 107 |

such that

with
ωi ≤ 0.25, (i = 1,…, 35)
60% capping adjustment for the 5 largest stock series within the constituent list given the prior condition.
Let be the weighting of the biggest stock series in the constituents list, the following must be satisfied:

For l = 1 , … , 5
If there’s the need to realize adjustments, the surpluses will be proportionally distributed in each of the other stock series.
Constituents List Review and Continuance
The constituents list review for Prices and Quotations Index is made once a year, in August, using data as of July close, and is comes into effect on September first business day.
If there’s any special situation due to corporate events or by the market, the necessary modifications will be carried out according to such event, as explained further in this document, and the market will be timely informed.
The number of issuers on the constituent list may vary if some company performs a spin-off, so that the issuer that is spinning off, as well as the one that has been spun off, will remain in the constituent list until the next constituents revision.
If an issuer is subject to an Acquisition Public Offering, Merger or some other extraordinary event that might imply the cancelation of its listing in BMV, those shares object of such event will be removed from the constituent list the very same day it’s materialized in BMV, and its place will be occupied by a new issuer. The issuer selected for this, will be the best positioned in the last published Selection Filter by BMV in its website (such Filter is calculated and published monthly).
BMV will inform as timely as possible about the changes related to this section.
Constituents List Rebalance
With the purpose of making the index more representative of the market behavior as well as keeping a high replicability, its stock series weightings will be rebalanced quarterly during the constituent’s list validity period, thus being on December, March and June subsequent to the last revision. The maximum weighting rebalance for a single stock series will be carried out quarterly, up and down.
Index Daily Calculation Formula

where:
It= Index level on day t
Pit = Price of the stock series i on day t
Qit = Listed shares in this Exchange of the stock series i on day t
FAFi = Floating shares adjustment factor of stock series i
Fit = Ex rights adjustment factor of stock series i on day t
i = 1, …, 35
Base level: 0.78 as of October 30th, 1978.
| | 108 |
Corporate Adjustments
Taking in consideration the Index’s calculation formula, the changes in the number of registered shares, caused by a relevant event, will affect the weightings of the stock series within the constituent list, whether at its implementation time or at its quarterly rebalances, as the case may be. Below are detailed, in an indicative and non-limitative way, the corporate events that may affect the constituents.

where:
fi = Factor of adjustment required in issuer i.
Aa = Number of shares previous to adjustment
Aa = Number of shares derived from conversion.
Ae = Number of shares to split.
Ap = Number of shares after adjustment.
Ar = Number of shares due to restructuring.
As = Number of subscribed shares.
Pa = Price previous to adjustment
Pp = Price after adjustment.
Ps = Subscription price.
| | 109 |
Sample:
| Ticker | Name | Weight |
| AMXL MM Equity | America Movil SAB de CV | 12.50% |
| FEMSAUBD MM Equity | Fomento Economico Mexicano SAB de CV | 12.30% |
| GFNORTEO MM Equity | Grupo Financiero Banorte SAB de CV | 9.60% |
| CEMEXCPO MM Equity | Cemex SAB de CV | 8.00% |
| TLEVICPO MM Equity | Grupo Televisa SAB | 7.30% |
| WALMEX* MM Equity | Wal-Mart de Mexico SAB de CV | 6.90% |
| GMEXICOB MM Equity | Grupo Mexico SAB de CV | 6.70% |
| ALFAA MM Equity | Alfa SAB de CV | 2.80% |
| GAPB MM Equity | Grupo Aeroportuario del Pacifico SAB de | 2.50% |
| KOFL MM Equity | Coca-Cola Femsa SAB de CV | 2.50% |
| ASURB MM Equity | Grupo Aeroportuario del Sureste SAB de C | 2.40% |
| BSMXB MM Equity | Banco Santander Mexico SA Institucion de | 2.10% |
| GRUMAB MM Equity | Gruma SAB de CV | 1.80% |
| AC* MM Equity | Arca Continental SAB de CV | 1.70% |
| BIMBOA MM Equity | Grupo Bimbo SAB de CV | 1.70% |
| IENOVA* MM Equity | Infraestructura Energetica Nova SAB de C | 1.60% |
| KIMBERA MM Equity | Kimberly-Clark de Mexico SAB de CV | 1.60% |
| MEXCHEM* MM Equity | Mexichem SAB de CV | 1.60% |
| GFINBURO MM Equity | Grupo Financiero Inbursa SAB de CV | 1.50% |
| ELEKTRA* MM Equity | Grupo Elektra SAB DE CV | 1.50% |
| PE&OLES* MM Equity | Industrias Penoles SAB de CV | 1.40% |
| PINFRA* MM Equity | PINFRA | 1.40% |
| OMAB MM Equity | Grupo Aeroportuario del Centro Norte SAB | 1.10% |
| LIVEPOLC MM Equity | El Puerto de Liverpool SAB de CV | 0.90% |
| ALSEA* MM Equity | Alsea SAB de CV | 0.90% |
| GCARSOA1 MM Equity | Grupo Carso SAB de CV | 0.90% |
| GENTERA* MM Equity | Gentera SAB de CV | 0.90% |
| MEGACPO MM Equity | Megacable Holdings SAB de CV | 0.80% |
| CUERVO* MM Equity | Becle SAB de CV | 0.60% |
| VOLARA MM Equity | Controladora Vuela Cia de Aviacion SAB d | 0.60% |
| LAB B | Genomma Lab International SA de CV | 0.50% |
| LALAB MM Equity | Grupo Lala SAB de CV | 0.50% |
| GFREGIO MM Equity | Banregio Grupo Financiero SAB de CV | 0.40% |
| NEMAKA MM Equity | Nemak SAB de CV | 0.30% |
| ALPEKA MM Equity | Alpek SAB de CV | 0.20% |
For more information on this index regarding its background, main characteristics and the criteria for the selection of issuers, please visit www.bmv.com.mx
| | 110 |
Historical Evolution:
| Period | Minimum | Maximum | Average |
| Price | Price | (securities) | |
| 2013 | 39,594.64 | 42,958.82 | 150,797,832.14 |
| 2014 | 37,950.97 | 46,357.24 | 177,201,774.16 |
| 2015 | 40,950.58 | 45,773.31 | 248,954,553.98 |
| 2016 | 40,265.37 | 48,694.90 | 266,369,678.75 |
| 2017 | 45,553.51 | 51,713.38 | 208,716,408.92 |
| 1° Sem. 2016 | 40,265.37 | 46,263.84 | 227,639,466.88 |
| 2° Sem. 2016 | 44,364.17 | 48,694.90 | 304,678,910.07 |
| 1° Sem. 2017 | 45,553.51 | 49,939.47 | 217,685,590.54 |
| 2° Sem. 2017 | 46,973.30 | 51,713.38 | 199,893,463.96 |
| May 2017 | 44,647.37 | 48,358.16 | 210,328,683.61 |
| June 2018 | 45,013.13 | 47,663.20 | 209,840,924.27 |
| July 2018 | 46,653.52 | 49,705.28 | 212,813,769.81 |
| August 2018 | 48,059.06 | 50,416.27 | 209,389,154.58 |
| September 2018 | 48,595.37 | 49,693.21 | 204,140,694.67 |
| October 2018 | 47,444.05 | 49,841.47 | 208,688,944.00 |

Comparison base: September 29, 2013
| | 111 |
Historical Volatility:

Source of Information on Historic Evolution and Volatility: www.bloomberg.com.mx
Quantitative examples that illustrate possible gains or losses
FEM907R DC026

| | 112 |
| Market Price | Observed Price | Payment Rights |
| 0.00 | 0 | 90.00 |
| 9.19 | 5 | 90.00 |
| 18.38 | 10 | 90.00 |
| 27.57 | 15 | 90.00 |
| 36.77 | 20 | 90.00 |
| 45.96 | 25 | 90.00 |
| 55.15 | 30 | 90.00 |
| 64.34 | 35 | 90.00 |
| 73.53 | 40 | 90.00 |
| 82.72 | 45 | 90.00 |
| 91.92 | 50 | 90.00 |
| 101.11 | 55 | 90.00 |
| 110.30 | 60 | 90.00 |
| 119.49 | 65 | 90.00 |
| 128.68 | 70 | 90.00 |
| 137.87 | 75 | 90.00 |
| 147.06 | 80 | 90.00 |
| 156.26 | 85 | 90.00 |
| 165.45 | 90 | 90.00 |
| 174.64 | 95 | 90.00 |
| 183.83 | 100 | 90.00 |
| 193.02 | 105 | 104.25 |
| 202.21 | 110 | 118.50 |
| 211.40 | 115 | 118.50 |
| 220.60 | 120 | 118.50 |
| 229.79 | 125 | 118.50 |
| 238.98 | 130 | 118.50 |
| 248.17 | 135 | 118.50 |
| 257.36 | 140 | 118.50 |
| 266.55 | 145 | 118.50 |
WMX907R DC158

| | 113 |
| Market Price | Observed Price | Payment Rights |
| 0.00 | 0 | 90.00 |
| 2.87 | 5 | 90.00 |
| 5.75 | 10 | 90.00 |
| 8.62 | 15 | 90.00 |
| 11.50 | 20 | 90.00 |
| 14.37 | 25 | 90.00 |
| 17.24 | 30 | 90.00 |
| 20.12 | 35 | 90.00 |
| 22.99 | 40 | 90.00 |
| 25.87 | 45 | 90.00 |
| 28.74 | 50 | 90.00 |
| 31.61 | 55 | 90.00 |
| 34.49 | 60 | 90.00 |
| 37.36 | 65 | 90.00 |
| 40.24 | 70 | 90.00 |
| 43.11 | 75 | 90.00 |
| 45.98 | 80 | 90.00 |
| 48.86 | 85 | 90.00 |
| 51.73 | 90 | 90.00 |
| 54.61 | 95 | 90.00 |
| 57.48 | 100 | 90.00 |
| 60.35 | 105 | 106.45 |
| 63.23 | 110 | 122.90 |
| 66.10 | 115 | 122.90 |
| 68.98 | 120 | 122.90 |
| 71.85 | 125 | 122.90 |
| 74.72 | 130 | 122.90 |
| 77.60 | 135 | 122.90 |
| 80.47 | 140 | 122.90 |
| 83.35 | 145 | 122.90 |
CMX908R DC251

| | 114 |
| Market Price | Observed Price | Payment Rights |
| 8.29 | 70.00 | 85.00 |
| 8.52 | 72.00 | 85.00 |
| 8.76 | 74.00 | 85.00 |
| 9.00 | 76.00 | 85.00 |
| 9.24 | 78.00 | 85.00 |
| 9.47 | 80.00 | 85.00 |
| 9.71 | 82.00 | 85.00 |
| 9.95 | 84.00 | 85.00 |
| 10.18 | 86.00 | 86.00 |
| 10.42 | 88.00 | 88.00 |
| 10.66 | 90.00 | 90.00 |
| 10.89 | 92.00 | 92.00 |
| 11.13 | 94.00 | 94.00 |
| 11.37 | 96.00 | 96.00 |
| 11.60 | 98.00 | 98.00 |
| 11.84 | 100.00 | 100.00 |
| 12.08 | 102.00 | 102.95 |
| 12.31 | 104.00 | 105.90 |
| 12.55 | 106.00 | 108.86 |
| 12.79 | 108.00 | 111.81 |
| 13.02 | 110.00 | 114.76 |
| 13.26 | 112.00 | 117.71 |
| 13.50 | 114.00 | 120.66 |
| 13.73 | 116.00 | 122.14 |
| 13.97 | 118.00 | 122.14 |
| 14.21 | 120.00 | 122.14 |
| 14.44 | 122.00 | 122.14 |
| 14.68 | 124.00 | 122.14 |
| 14.92 | 126.00 | 122.14 |
| 15.16 | 128.00 | 122.14 |
| | 115 |
Hedging Position as of September 28, 2018
HEDDGED INSTRUMENTS
ISSUERS: FEM907R DC026, WMX907R DC158, CMX908R DC251.
| ASSET TYPE | ISSUER / SERIES | NUMER OF TITLES | MARKET QUOTE | BETA COEF. | PERIOD IN MONTHS USED FOR BETA | BETA COEF. (IN CASE OF OPTIONS AND WARRANTS) | DELTA (SECURITIES) | DELTA IN TERMS OF ISSUERS |
| HEDGE | FEMSA UBD | 80,080 | 185.18 | 1.0000 | 12 | 1.000000 | 80,080.0000 | 80,080.0000 |
| HEDGE | WALMEX * | 276,430 | 57.03 | 1.0000 | 12 | 1.000000 | 276,430.0000 | 276,430.0000 |
| HEDGE | CEMEX CPO | 728,416 | 13.14 | 1.0000 | 12 | 1.000000 | 728,416.0000 | 728,416.0000 |
| OBLIGATION | FEM907R DC026 | 250,000 | 98.05 | 1.0000 | 12 | 0.322616 | 80,654.0679 | (80,654.0679) |
| OBLIGATION | WMX907R DC158 | 250,000 | 98.82 | 1.0000 | 12 | 1.105716 | 276,429.0683 | (276,429.0683) |
| OBLIGATION | CMX908R DC251 | 210,000 | 98.54 | 1.0000 | 12 | 3.468647 | 728,415.7691 | (728,415.7691) |
| SUMA DE DELTA EN TÉRMINOS DE EMISORAS | ||
| EMISORA / SERIE | TIPO DE VALOR | TOTAL |
| FEM907R DC026 | OBLIGACIÓN | (80,654.067859) |
| WMX907R DC158 | OBLIGACIÓN | (276,429.068276) |
| CMX908R DC251 | OBLIGACIÓN | (728,415.769090) |
| CEMEX CPO | COBERTURA | 728,416.000000 |
| FEMSA UBD | COBERTURA | 80,080.000000 |
| WALMEX * | COBERTURA | 276,430.000000 |
| Total | (572.905225) | |
| ISSUER | DELTA IN SECURITIES | ORIGINAL BETA | ESTANDAR ERROR | DELTA IN TERMS OF ISSUERS | DELTA HEDGE INTERMS OF ISSUERS | DELTA OBLIGATIONS IN TERMS OF ISSUERS |
| FEM907R DC026 | -574.0679 | 1.000000 | 0.000000 | -574.0679 | 80,080.0000 | -80,654.0679 |
| WMX907R DC158 | 0.9317 | 1.000000 | 0.000000 | 0.9317 | 276,430.0000 | -276,429.0683 |
| CMX908R DC251 | 0.2309 | 1.000000 | 0.000000 | 0.2309 | 728,416.0000 | -728,415.7691 |
| | 116 |
EVENTS AFTER THE REPORTING PERIOD – PRO FORMA FINANCIAL STATEMENTS
| BANCO SANTANDER MÉXICO, S.A. | |||||
| Pro forma Consolidated Balance Sheet | |||||
| Million pesos | |||||
| September 30th 2017 | |||||
| Banco Santander México (Consolidated) | Grupo Financiero Santander México (Individual) | Casa de Bolsa Santander (Individual) | Pro forma Adjustments | Total pro forma consolidated | |
| Assets | |||||
| Funds available | 92,316 | 251 | 15 | 897 | 93,479 |
| Margin accounts | 3,036 | 0 | 0 | 0 | 3,036 |
| Investment in securities | 302,720 | 9,080 | 729 | (10,141) | 302,388 |
| Trading securities | 133,101 | 0 | 697 | (697) | 133,101 |
| Securities available for sale | 159,049 | 0 | 32 | (364) | 158,717 |
| Securities held to maturity | 10,570 | 9,080 | 0 | (9,080) | 10,570 |
| Debtors under sale and repurchase agreements | 5,547 | 600 | 618 | (1,218) | 5,547 |
| Derivatives | 138,851 | 0 | 0 | 0 | 138,851 |
| Trading purposes | 124,599 | 0 | 0 | 0 | 124,599 |
| Hedging purposes | 14,252 | 0 | 0 | 0 | 14,252 |
| Performing loan portfolio | |||||
| Commercial loans | 374,587 | 0 | 0 | 0 | 374,587 |
| Commercial or business activity | 306,686 | 0 | 0 | 0 | 306,686 |
| Financial entities loans | 13,951 | 0 | 0 | 0 | 13,951 |
| Government entities loans | 53,950 | 0 | 0 | 0 | 53,950 |
| Consumer loans | 101,077 | 0 | 0 | 0 | 101,077 |
| Mortgage loans | 123,731 | 0 | 0 | 0 | 123,731 |
| Medium and residential | 109,174 | 0 | 0 | 0 | 109,174 |
| Social interest | 105 | 0 | 0 | 0 | 105 |
| Credits acquired from INFONAVIT or FOVISSSTE | 14,452 | 0 | 0 | 0 | 14,452 |
| Total performing loan portfolio | 599,395 | 0 | 0 | 0 | 599,395 |
| Non-performing loan portfolio | |||||
| Commercial loans | 4,195 | 0 | 0 | 0 | 4,195 |
| Commercial or business activity | 4,195 | 0 | 0 | 0 | 4,195 |
| Consumer loans | 4,519 | 0 | 0 | 0 | 4,519 |
| Mortgage loans | 5,153 | 0 | 0 | 0 | 5,153 |
| Medium and residential | 4,376 | 0 | 0 | 0 | 4,376 |
| Social interest | 18 | 0 | 0 | 0 | 18 |
| Credits acquired from INFONAVIT or FOVISSSTE | 759 | 0 | 0 | 0 | 759 |
| Total non-performing portfolio | 13,867 | 0 | 0 | 0 | 13,867 |
| Total loan portfolio | 613,262 | 0 | 0 | 0 | 613,262 |
| Allowance for loan losses | (20,441) | 0 | 0 | 0 | (20,441) |
| Loan portfolio (net) | 592,821 | 0 | 0 | 0 | 592,821 |
| | 117 |
| Accrued income receivable from securitization transactions | 119 | 0 | 0 | 0 | 119 |
| Other receivables (net) | 68,245 | 59 | 355 | (355) | 68,304 |
| Foreclosed assets (net) | 520 | 0 | 0 | 0 | 520 |
| Property, furniture and fixtures (net) | 5,677 | 0 | 8 | (8) | 5,677 |
| Long-term investment in shares | 91 | 118,311 | 58 | (118,369) | 91 |
| Deferred taxes and deferred profit sharing (net) | 18,086 | 0 | 0 | (12) | 18,074 |
| Deferred charges, advance payments and intangibles | 7,003 | 2 | 6 | (6) | 7,005 |
| Other | 49 | 0 | 174 | (174) | 49 |
| Total assets | 1,235,081 | 128,303 | 1,963 | (129,386) | 1,235,961 |
| Liabilities | |||||
| Deposits | 670,681 | 0 | 0 | (251) | 670,430 |
| Demand deposits | 429,200 | 0 | 0 | 0 | 429,200 |
| Time deposits – general public | 158,369 | 0 | 0 | (251) | 158,118 |
| Time deposits – money market | 37,982 | 0 | 0 | 0 | 37,982 |
| Credit instruments issued | 44,040 | 0 | 0 | 0 | 44,040 |
| Global Account uptake without movements | 1,090 | 0 | 0 | 0 | 1,090 |
| Bank and other loans | 49,510 | 0 | 0 | 0 | 49,510 |
| Demand loans | 4,440 | 0 | 0 | 0 | 4,440 |
| Short-term loans | 17,665 | 0 | 0 | 0 | 17,665 |
| Long-term loans | 27,405 | 0 | 0 | 0 | 27,405 |
| Creditors under sale and repurchase agreements | 121,012 | 0 | 222 | (822) | 120,412 |
| Collateral sold or pledged as guarantee | 16,767 | 0 | 0 | 0 | 16,767 |
| Securities loans | 16,767 | 0 | 0 | 0 | 16,767 |
| Derivatives | 135,138 | 0 | 0 | 0 | 135,138 |
| Trading purposes | 127,371 | 0 | 0 | 0 | 127,371 |
| Hedging purposes | 7,767 | 0 | 0 | 0 | 7,767 |
| Other payables | 91,387 | 219 | 596 | 663 | 92,865 |
| Income taxes payable | 10 | 0 | 0 | 100 | 110 |
| Employee profit sharing payable | 205 | 0 | 0 | 0 | 205 |
| Creditors from settlement of transactions | 35,606 | 0 | 344 | (344) | 35,606 |
| Payable for cash collateral received | 26,196 | 0 | 0 | 0 | 26,196 |
| Sundry creditors and other payables | 29,370 | 219 | 252 | 907 | 30,748 |
| Subordinated credit notes | 32,753 | 9,032 | 0 | (9,080) | 32,705 |
| Deferred taxes | 0 | 12 | 68 | (80) | 0 |
| Deferred revenues and other advances | 487 | 0 | 0 | 0 | 487 |
| Total liabilities | 1,117,735 | 9,263 | 886 | (9,570) | 1,118,314 |
| | 118 |
| Paid-in capital | 34,798 | 48,195 | 500 | (43,089) | 40,404 |
| Historical Capital stock | 8,086 | 25,658 | 500 | (8,584) | 25,660 |
| Restated Capital stock | 3,262 | 10,699 | 0 | (10,699) | 3,262 |
| Share premium | 23,450 | 11,838 | 0 | (23,806) | 11,482 |
| Other capital | 82,548 | 70,845 | 577 | (76,727) | 77,243 |
| Capital reserves | 9,515 | 1,944 | 94 | (2,038) | 9,515 |
| Retained earnings | 60,022 | 56,260 | 431 | (61,924) | 54,789 |
| Result from valuation of available for sale securities, net | (540) | (535) | 7 | 487 | (581) |
| Result from valuation of cash flow hedge instruments, net | 327 | 0 | 0 | 0 | 327 |
| Cumulative effect of conversion | 9 | 0 | 0 | (9) | 0 |
| Adjustment employees pension fund | (8) | (19) | (10) | 28 | (9) |
| Net income | 13,164 | 13,195 | 55 | (13,274) | 13,140 |
| Non-controlling interest | 59 | 0 | 0 | 3 | 62 |
| Total stockholders’ equity | 117,346 | 119,040 | 1,077 | (119,816) | 117,647 |
| Total liabilities and stockholders´ equity | 1,235,081 | 128,303 | 1,963 | (129,386) | 1,235,961 |
| | 119 |
| BANCO SANTANDER MÉXICO, S.A. | |||||
| Pro forma Consolidated Income Statement | |||||
| Million pesos | |||||
| Banco Santander México (Consolidated) | Grupo Financiero Santander México (Individual) | Casa de Bolsa Santander (Individual) | Pro forma Adjustments | Total pro forma consolidated | |
| Interest income | 71,818 | 31 | 1,206 | (1,218) | 71,837 |
| Interest expense | (30,650) | (8) | (1,151) | 1,163 | (30,646) |
| Net interest income | 41,168 | 23 | 55 | (55) | 41,191 |
| Provisions for loan losses | (15,978) | 0 | 0 | 0 | (15,978) |
| Net interest income after provisions for loan losses | 25,190 | 23 | 55 | (55) | 25,213 |
| Commission and fee income | 15,621 | 0 | 446 | (446) | 15,621 |
| Commission and fee expense | (3,921) | (6) | (77) | 77 | (3,927) |
| Net gain (loss) on financial assets and liabilities | 2,359 | 0 | 69 | (69) | 2,359 |
| Other operating income | 623 | (10) | 23 | (24) | 612 |
| Administrative and promotional expenses | (23,029) | (30) | (456) | 456 | (23,059) |
| Operating income | 16,843 | (23) | 60 | (61) | 16,819 |
| Equity in results of associated companies | 0 | 13,218 | 2 | (13,220) | 0 |
| Operating income before income taxes | 16,843 | 13,195 | 62 | (13,281) | 16,819 |
| Current income taxes | (1,898) | 0 | 0 | 0 | (1,898) |
| Deferred income taxes (net) | (1,781) | 0 | (7) | 7 | (1,781) |
| Consolidated net income | 13,164 | 13,195 | 55 | (13,274) | 13,140 |
| Non-controlling interest | |||||
| Net income | 13,164 | 13,195 | 55 | (13,274) | 13,140 |
| | 120 |
Item 2

3Q.18 Earnings Presentation Banco Santander México, S.A., Institución de Banca Múltiple, Grupo Financiero Santander México.
Safe Harbor Statement 2 Banco Santander México cautions that this presentation may contain forward - looking statements within the meaning of the U . S . Private Securities Litigation Reform Act of 1995 . These forward - looking statements could be found in various places throughout this presentation and include, without limitation, statements regarding our intent, belief, targets or current expectations in connection with : asset growth and sources of funding ; growth of our fee - based business ; expansion of our distribution network ; financing plans ; competition ; impact of regulation and the interpretation thereof ; action to modify or revoke our banking license ; exposure to market risks including interest rate risk, foreign exchange risk and equity price risk ; exposure to credit risks including credit default risk and settlement risk ; projected capital expenditures ; capitalization requirements and level of reserves ; investment in our formation technology platform ; liquidity ; trends affecting the economy generally ; and trends affecting our financial condition and our results of operations . While these forward - looking statements represent our judgment and future expectations concerning the development of our business, many important factors could cause actual results to differ substantially from those anticipated in forward - looking statements . These factors include, among other things : changes in capital markets in general that may affect policies or attitudes towards lending to Mexico or Mexican companies ; changes in economic conditions, in Mexico in particular, in the United States or globally ; the monetary, foreign exchange and interest rate policies of the Mexican Central Bank ( Banco de México ) ; inflation ; deflation ; unemployment ; unanticipated turbulence in interest rates ; movements in foreign exchange rates ; movements in equity prices or other rates or prices ; changes in Mexican and foreign policies, legislation and regulations ; changes in requirements to make contributions to, for the receipt of support from programs organized by or requiring deposits to be made or assessments observed or imposed by, the Mexican government ; changes in taxes and tax laws ; competition, changes in competition and pricing environments ; our inability to hedge certain risks economically ; economic conditions that affect consumer spending and the ability of customers to comply with obligations ; the adequacy of allowance for impairment losses and other losses ; increased default by borrowers ; our inability to successfully and effectively integrate acquisitions or to evaluate risks arising from asset acquisitions ; technological changes ; changes in consumer spending and saving habits ; increased costs ; unanticipated increases in financing and other costs or the inability to obtain additional debt or equity financing on attractive terms ; changes in, or failure to comply with, banking regulations or their interpretation ; and certain other risk factors included in our annual report on Form 20 - F . The risk factors and other key factors that we have indicated in our past and future filings and reports, including those with the U . S . Securities and Exchange Commission, could adversely affect our business and financial performance . The words “believe,” “may,” “will,” “aim,” “estimate,” “continue,” “anticipate,” “intend,” “expect,” “forecast” and similar words are intended to identify forward - looking statements . You should not place undue reliance on such statements, which speak only as of the date they were made . We undertake no obligation to update publicly or to revise any forward - looking statements after we distribute this presentation because of new information, future events or other factors . In light of the risks and uncertainties described above, the future events and circumstances discussed herein might not occur and are not guarantees of future performance . Note : The information contained in this presentation is not audited . Nevertheless, the consolidated accounts are prepared on the basis of the accounting principles and regulations prescribed by the Mexican National Banking and Securities Commission ( Comisión Nacional Bancaria y de Valores ) for credit institutions, as amended (Mexican Banking GAAP) . All figures presented are in millions of nominal Mexican pesos, unless otherwise indicated . Historical figures are not adjusted by inflation .

Strong Performance Across the Board Driving Profitable Growth 3 Source: Company filings under CNBV GAAP. Notes: 1) Quarterly ratio = Annualized quarterly opex as percentage of annualized quarterly income before opex (net of allowances) (3Q18*4). Year to date = Annualized cumulative opex as percentage of annualized cumulative income before opex (net of allowances) (9M18/3*4). 2) Quarterly ratio = Annualized quarterly net income as a percentage of average equity (4Q17;3Q18). Loan book up 10.9% YoY Maintain focus on high - margin segment loans +9.7% YoY Low - margin segment growth targeting selective opportunities +12.3% YoY Deposit base up 8.5% YoY; Individual deposits increased 16.3% YoY Individual demand deposits +13.3% YoY Individual term deposits +21.7% YoY Healthy asset quality NPL ratio 2.35% +9 bps Cost of risk 3.37% - 35 bps 3.10% - 44 bps Net income up 25% YoY with robust ROE despite short - term impact of investment plan Efficiency ratio 1 42.78% +60 bps 43.04% +181 bps ROAE 2 16.74% +222 bps 16.41% +78 bps Headway on cultural and digital transformation strategy to become a more customer centric bank to attract new customers and improve retention 3Q18 YoY Var 9M18 YoY Var

Slower System Consumer Loan Growth, while Deposits Maintain Momentum 4 Source: CNBV Banks as of August 2018 in billion pesos. Notes: 1) Includes credit cards, payroll, personal and auto loans. Total Loans Total Deposits Consumer Loans 1 (YoY Growth) Demand Deposits (YoY Growth) 4,578 4,746 4,772 4,978 5,018 9.6% 3Q17 9.8 % 9.4% 4Q17 1Q18 11.6% 2Q18 10.6% Aug’18 YoY Growth 4,477 4,685 4,708 4,923 4,932 4Q17 11.5% 3Q17 11.4% 10.9% 1Q18 11.9% 2Q18 12.4% Aug’18 YoY Growth 7.6% 1Q18 3Q17 4Q17 2Q18 Aug’18 9.0% 8.5% 8.4% 6.7% 2Q18 Aug’18 11.3% 3Q17 8.2% 4Q17 1Q18 10.2% 8.9% 12.2%

Santander México Loan Portfolio Up c.11%; High - Margin Segments Contribute Majority of NII 5 Source: Company filings under CNBV GAAP, in million pesos. Total Loans Loan Portfolio Breakdown 3Q17 4Q17 1Q18 2Q18 3Q18 613,262 617,871 630,999 652,251 680,120 +4.3% +10.9% 3Q18 Var YoY Contribution to: Loans NII Loans High - margin s egments : Middle - market 175,567 13.5% 53.3% 69.4% SMEs 77,519 10.3% Credit cards 54,997 3.3% Consumer 54,474 4.0% 362,557 9.7% Low - margin segments: Corporates 97,031 12.9% 46.7% 30.6% Government & Financial Entities 81,997 20.8% Mortgages 138,535 7.5% 317,563 12.3% Middle - Market 26% Corporates 14% Gov&FinEnt 12% SMEs 12% Mortgage s 20% Credit Cards 8% Consumer 8%

Solid Performance in Payroll Drives Consumer Loans; Accelerating Mortgage Loan Growth 6 Source: Company filings under CNBV GAAP, in million pesos. Market position calculated with CNBV Banks as of August 2018. Notes: 1) Includes payroll, personal and auto loans. Individual Loans 248,006 234,480 3Q17 3Q18 +5.8% 4Q17 2Q18 3Q17 1Q18 3Q18 130,492 128,884 132,350 135,112 138,535 +2.5% +7.5% 2Q18 3Q17 4Q17 1Q18 3Q18 53,220 54,372 53,795 55,037 54,997 - 0.1% +3.3% 3Q18 53,076 3Q17 4Q17 1Q18 2Q18 52,376 53,763 52,492 54,474 +1.3% +4.0% Organic growth accelerating to +9.8% YoY Strongest QoQ volume loan growth of the past 3 years Strong performance of Hipoteca Plus Credit card usage up 12% YoY 3 rd largest market player Rebalanced credit card portfolio towards a more profitable mix Driving more profitable payroll loans, up 12% YoY, above market +4.2 million Santander Plus clients, 55% are new customers Attracting new payroll by leveraging strong position in middle - market and corporates Personal Payroll Mortgages Credit Cards Consumer 1

Loyalty and Digitalization Initiatives Continue Driving Quality of Retail Customer Base 7 Notes: 1) Thousands of customers. 2) Monetary transactions. Figures may vary from those previously reported due to restatements. Loyal Customers 1 Digital Customers 1 Digital Transactions / Total Transactions 2 Mobile Customers 1 1Q18 2Q18 3Q17 4Q17 3Q18 1,922 2,048 2,362 2,145 2,235 +22.9% 1,925 2,091 2,220 2,348 2,533 2Q18 3Q17 4Q17 3Q18 1Q18 +31.6% 1,327 1,508 1,655 1,819 2,036 1Q18 3Q17 4Q17 2Q18 3Q18 +53.4% A loyal customer is 4x more profitable 46% 71% 54% 29% 3Q17 3Q18 10.0% 11.9% Internet Mobile

Selective Growth in Commercial Loans While Maintaining Profitability Focus 8 Source: Company filings under CNBV GAAP, in million pesos. Commercial Loans 432,114 378,782 3Q17 3Q18 +14.1% SMEs Middle - Market Corporates Government & Fin. Ent . 71,752 3Q17 4Q17 1Q18 2Q18 3Q18 70,297 72,947 76,915 77,519 +0.8% +10.3% 3Q18 2Q18 3Q17 4Q17 1Q18 85,954 83,831 90,692 86,859 97,031 +11.7% +12.9% 3Q17 4Q17 2Q18 1Q18 3Q18 154,630 159,096 164,713 174,750 175,567 +0.5% +13.5% 1Q18 3Q18 3Q17 65,836 4Q17 2Q18 67,901 63,426 69,815 81,997 +17.4% +20.8%

Deposit Growth Driven by Client Centric Approach for Individuals and SMEs 9 Total Deposits 67% 31% 1Q18 69% 33% 4Q17 3Q17 33% 67% 67% 33% 2Q18 626,641 34% 66% 680,143 3Q18 Term Demand 647,854 665,100 698,118 - 2.6% +8.5% Demand Deposits 3Q17 447,718 3Q18 430,290 +4.1% +13.3% Individuals Corporate +0.9% Term Deposits 1 3Q17 3Q18 196,351 232,425 +18.4% Total Individuals & SMEs deposits – up 16.3% and 15.9%, respectively Sequential performance impacted by withdrawal of some corporates Commercial focus to attract payrolls continues to drive individual demand deposits, increasing their share of demand deposits by 230 bps YoY Higher interest rates favor term deposit growth Source: Company filings under CNBV GAAP, in millions pesos. Notes: 1) Includes money market. Individuals Corporate +21.7% +16.9%

Strong Balance Sheet, Ample Liquidity and Strong Capital Position 10 Net Loans to Deposits 1 Debt Maturity CET1 and Capitalization Diversified funding sources and strong maturity profile Healthy net loan to deposit ratio below 100% supports growth opportunities LCR 2 of 141.45%, well above 90% Banxico regulatory requirement Tier 1 ratio decreased 10 bps to 12.73% Source: Company filings under CNBV GAAP, in million pesos. Notes: 1) Loans net of allowances divided by total deposits (Demand + Term). 2) LCR = Liquidity Coverage Ratio. 3) Including additional Tier 1 Capital Notes issued in December 2016. 4) 3Q18 is preliminary. 91.88 % 4Q17 3Q17 1Q18 2Q18 94.60% 3Q18 92.28% 90.56% 97.00% 3,170 1,274 8,871 6,409 23,184 24,340 3,000 2021 2027+ 2018 2019 2024 2022 2020 2026 9,362 3 11.55 10.84 11.19 10.76 11.48 AT1 4Q17 3Q17 CET1 1Q18 2Q18 3Q18 4 Tier 2 16.19% 15.73% 15.71% 15.52% 16.02%

NII +10.9% YoY and +6.8% QoQ Driven By Robust Loan Growth, Particularly High - Margin Loans 11 Net Interest Income and NIM 1 NII grew 10.9% YoY, principally due to: ▪ Strong interest income from: Loan portfolio: +13.3% Investment in securities: +15.0% ▪ Benefited from lower sequential costs resulting from funding of investment strategies NIM declined 13 bps YoY to 5.66% Source: Company filings under CNBV GAAP, in million pesos. Notes: 1) Quarterly = Annualized net interest income (3Q18*4) divided by daily average interest earnings assets (3Q18) Year to date = Annualized net interest income (9M18/3*4) divided by daily average interest earnings assets (9M1 8) 5.52 4Q17 5.79 3Q17 5.32 1Q18 5.27 2Q18 5.66 3Q18 14,615 14,242 13,847 14,795 15,795 +6.8% +10.9% 5.44 9M17 5.48 42,205 9M18 41,168 +9.8%

Accelerating Fees Driven by Robust Growth in Credit Cards, Cash Management and Investment Funds 12 Net Commissions and Fees Source: Company filings under CNBV GAAP, in million pesos. Notes: 1) Includes fees from collections and payments, account management, checks, foreign trade and others. 4Q17 4,271 3Q17 1Q18 3Q18 2Q18 3,934 3,933 4,069 4,262 +0.2% +8.6% Cash Management* 29% Credit Cards 28% Insurance 26% Investment Funds 9% Financial advisory services 7% Purchase - sale of securities and money market transactions 1% 11,700 12,602 9M17 9M18 +7.7% Var YoY Var YoY 3Q17 2Q18 3Q18 $$ % 9M17 9M18 $$ % Cash management 1 1,042 1,175 1,220 178 17.1% 3,249 3,601 352 10.8% Credit cards 985 917 1,186 201 20.4% 2,697 3,209 512 19.0% Insurance 1,067 1,265 1,123 56 5.2% 3,215 3,387 172 5.3% Investment funds 361 382 397 36 10.0% 1,084 1,173 89 8.2% Financial advisory services 372 416 280 (92) (24.7%) 1,098 989 (109) (9.9%) Purchase - sale of securities and money market transactions 107 107 65 (42) (39.3%) 357 243 (114) (31.9%) Net commisions and fees 3,934 4,262 4,271 337 8.6% 11,700 12,602 902 7.7%

Gross Operating Income Up 13.1% YoY, Driven by Solid Overall Performance 13 Gross Operating Income 1 Source: Company filings under CNBV GAAP, in million pesos. Notes: 1) Gross operating income does not include other income. 1Q18 2Q18 4Q17 3Q17 3Q18 18,487 18,394 18,972 20,106 20,909 +4.0% +13.1% Net Interest Income 75.5% Net Commissions and Fees 20.4% Market related revenue 4.0% 9M17 9M18 59,987 55,227 +8.6% Var YoY Var YoY 3Q17 2Q18 3Q18 Var $$ Var % 9M17 9M18 Var $$ Var % Net interest income 14,242 14,795 15,795 1,553 10.9% 41,168 45,205 4,037 9.8% Net commissions and fees 3,934 4,262 4,271 337 8.6% 11,700 12,602 902 7.7% Market related revenue 311 1,049 843 532 171.1% 2,359 2,180 (179) (7.6%) Gross Operating Income 18,487 20,106 20,909 2,422 13.1% 55,227 59,987 4,760 8.6%

Healthy Asset Quality: NPLs down and LLRs Up Sequentially as Anticipated 14 Loan Loss Reserves (LLR) Source: Company filings under CNBV GAAP, in million pesos. Notes: 1) Quarterly = Annualized loan loss reserves (3Q18x4) divided by average loans (4Q17,3Q18). Year to date = Annualized loan loss reserves (9M18/3*4) divided by average loans (4Q17,3Q18). 2) Commercial loans include: Mid - Market, SMEs, corporates, financial institutions and government. 2Q18 4Q17 3Q17 1Q18 3Q18 4,667 5,603 5,431 4,946 5,463 +17.1% - 2.5% Cost of Risk 1 3.59% 3Q17 4Q17 1Q18 2Q18 3Q18 3.72% 3.17% 2.94% 3.37% +43bps - 35 bps 15,076 9M17 9M18 15,978 - 5.6% 9M17 9M18 3.54% 3.10% - 44 bps 3Q17 2Q18 3Q18 Var YoY (bps) Var QoQ (bps) Consumer 4.28% 4.09% 3.87% (41) (22) Credit Card 4.71% 4.41% 4.28% (43) (13) Other consumer 3.84% 3.75% 3.46% (38) (29) Mortgages 4.00% 4.45% 4.31% 31 (14) Commercial 2 1.11% 1.37% 1.33% 22 (4) SMEs 2.23% 1.92% 2.00% (23) 8 NPL ratio 2.26% 2.46% 2.35% 9 (11)

Progress on Strategic Initiatives, with Near - Term Impact on Efficiency 15 Administrative & Promotional Expenses Source: Company filings under CNBV GAAP, in million pesos. Notes: 1) Quarterly = Annualized opex (3Q18*4) divided by annualized income before opex (net of allowances) (3Q18*4). Year to date = Annualized opex (9M18/3*4) divided by annualized income before opex (net of allowances) (9M18/3*4). Efficiency 1 3Q17 1Q18 4Q17 2Q18 9,003 3Q18 7,898 8,186 8,218 8,845 +1.8% +14.0% 23,029 9M17 9M18 26,066 +13.2% 4Q17 3Q17 1Q18 2Q18 3Q18 42.78% 42.18% 43.51% 42.88% 43.46% - 68bps +60 bps 9M18 9M17 41.23% 43.04% +181 bps Var YoY Var YoY 3Q17 2Q18 3Q18 $$ % 9M17 9M18 $$ % Personnel 3,409 3,889 4,096 687 20.2% 9,957 11,602 1,645 16.5% Administrative expenses 3,152 3,440 3,403 251 8.0% 9,075 10,007 932 10.3% IPAB 705 778 796 91 12.9% 2,147 2,316 169 7.9% Dep. and amort . 632 738 708 76 12.0% 1,850 2,141 291 15.7% Admin. & promotional expenses 7,898 8,845 9,003 1,105 14.0% 23,029 26,066 3,037 13.2% Expenses Breakdown & Performance

Delivering Robust Net Income Growth up 25% YoY and ROAE of 16.7% 16 Source: Company filings under CNBV GAAP, in million pesos. Notes: 1) Quarterly = Annualized net income (3Q18x4) divided by average equity (4Q17,3Q18). Year to date = Annualized net income (9M18/3*4) divided by average equity (4Q17,3Q18). Net Income ROAE 1 Effective Tax Rate Profit Before Taxes 3Q18 2Q18 3Q17 4Q17 5,171 1Q18 4,078 4,481 4,727 5,096 - 1.5% +25.0% 3Q17 4Q17 1Q18 2Q18 3Q18 15.87% 14.52% 16.04% 17.33% 16.74% - 59bps +222bps 2Q18 4Q17 3Q17 1Q18 3Q18 24.38% 21.95% 13.81% 21.22% 22.52% - 186bps +57bps 4Q17 3Q17 6,577 1Q18 2Q18 3Q18 6,838 5,225 6,000 5,199 - 3.8% +25.9% 9M17 9M18 13,164 14,994 +13.9% 9M17 9M18 15.63% 16.41% +78bps 22.77% 9M17 9M18 21.84% +93bps 19,415 9M17 9M18 16,843 +15.3%

Santander México Revises 2018 Guidance 17 Total Loans Δ 7% - 9% Δ 7% - 9% Total Deposits Δ 9% - 11% Δ 9% - 11% Cost of Risk 3.2% - 3.4% 3.2% - 3.4% Expenses Δ 12% - 14% Δ 12% - 14% Tax Rate 24% - 25% 24% - 25% Net Income Δ 6% - 8% Δ 9% - 11% Metrics 2018 Target 1 Revised 2018 Target 1) Revised on July 26, 2018.

Questions and Answers

19 Annexes

Macroeconomic 20 Source: INEGI, Banxico and Santander *Revised from previous quarter GDP Growth (%) Average Exchange Rate (MXP/USD) Annual Inflation Rate (%) Central Bank Monetary Policy (%, end of year) 2.9 2.1 2.1 2018E 2016 2017 2019E 2020E 1.8 * 2.1 * 18.7 18.9 18.8 18.9 2018E 2016 2017 2019E 2020E 19.1 * 3.4 6.8 3.6 2020E 2016 2017 2018E 2019E 4.5 * 3.5 * 5.75 7.25 2017 2016 2018E 2019E 2020E 8.00 * 7.25 * 6.75 * 19.3 2.4 2.4 4.1 3.4 7.25 6.25 6.00

Consolidated Income Statement 21 3Q18 2Q18 3Q17 % Change QoQ YoY Interest income 28,828 27,517 24,911 4.8 15.7 Interest expense (13,033) (12,722) (10,669) 2.4 22.2 Financial margin 15,795 14,795 14,242 6.8 10.9 Allowance for loan losses (5,463) (4,667) (5,603) 17.1 (2.5) Financial margin after allowance for loan losses 10,332 10,128 8,639 2.0 19.6 Commision and fee income 5,659 6,049 5,226 (6.4) 8.3 Commision and fee expense (1,388) (1,787) (1,292) (22.3) 7.4 Net gain /(loss) on financial assets and liabilities 843 1,049 311 (19.6) 171.1 Other operating income / ( loss ) 134 244 239 (45.1) (43.9) Administrative and promotional expenses (9,003) (8,845) (7,898) 1.8 14.0 Total operating income 6,577 6,838 5,225 (3.8) 25.9 Income taxes (1,481) (1,667) (1,147) (11.2) 29.1 Net income 5,096 5,171 4,078 (1.5) 25.0 Source: Company filings under CNBV GAAP, in million pesos.

Consolidated Balance Sheet 22 Sep - 18 Jun - 18 Sep - 17 % Change QoQ YoY Cash and due from banks 71,557 114,978 92,316 (37.8) (22.5) Margin accounts 2,444 3,767 3,036 (35.1) (19.5) Investment in securities 338,954 288,369 302,720 17.5 12.0 Debtors under sale and repurchase agreements 31,850 44,757 5,547 (28.8) 474.2 Derivatives 153,190 174,983 138,851 (12.5) 10.3 Valuation adjustment for hedged financial assets (10) (11) 0 (9.1) — Total loan portafolio 680,120 652,251 613,262 4.3 10.9 Allowance for loan losses (20,375) (20,027) (20,441) 1.7 (0.3) Loan portafolio (net) 659,745 632,224 592,821 4.4 11.3 Accrued income receivable from securitization transactions 125 123 119 1.6 5.0 Other receivables (net) 83,641 85,393 68,245 (2.1) 22.6 Foreclosed assets (net) 291 332 520 (12.3) (44.0) Property, furniture and fixtures (net) 6,709 6,426 5,677 4.4 18.2 Long - term investment in shares 90 90 91 0.0 (1.1) Deferred taxes (net) 18,672 19,187 18,086 (2.7) 3.2 Deferred charges, advance payments and intangibles 7,990 7,948 7,003 0.5 14.1 Other assets 46 45 49 2.2 (6.1) Total assets 1,375,294 1,378,611 1,235,081 (0.2) 11.4 Deposits 727,316 746,850 670,681 (2.6) 8.4 Bank and other loans 43,171 40,674 49,510 6.1 (12.8) Creditors under sale and repurchase agreements 157,528 94,087 121,012 67.4 30.2 Collateral sold or pledged as guarantee 21,088 31,492 16,767 (33.0) 25.8 Derivatives 146,717 167,278 135,138 (12.3) 8.6 Other payables 117,943 139,354 91,387 (15.4) 29.1 Subordinated debentures 33,791 35,914 32,753 (5.9) 3.2 Deferred revenues 354 441 487 (19.7) (27.3) Total liabilities 1,247,909 1,256,091 1,117,735 (0.7) 11.6 Total stockholders' equity 127,385 122,520 117,346 4.0 8.6 Source: Company filings under CNBV GAAP, in million pesos.
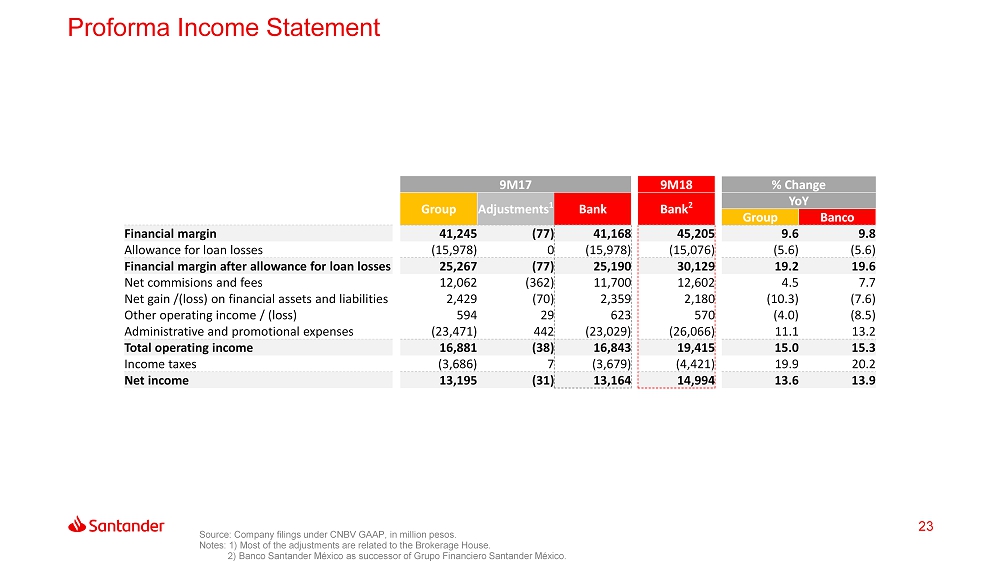
Proforma Income Statement 23 Source: Company filings under CNBV GAAP, in million pesos. Notes: 1) Most of the adjustments are related to the Brokerage House. 2) Banco Santander México as successor of Grupo Financiero Santander México. 9M17 9M18 % Change Group Adjustments 1 Bank Bank 2 YoY Group Banco Financial margin 41,245 (77) 41,168 45,205 9.6 9.8 Allowance for loan losses (15,978) 0 (15,978) (15,076) (5.6) (5.6) Financial margin after allowance for loan losses 25,267 (77) 25,190 30,129 19.2 19.6 Net commisions and fees 12,062 (362) 11,700 12,602 4.5 7.7 Net gain /(loss) on financial assets and liabilities 2,429 (70) 2,359 2,180 (10.3) (7.6) Other operating income / (loss) 594 29 623 570 (4.0) (8.5) Administrative and promotional expenses (23,471) 442 (23,029) (26,066) 11.1 13.2 Total operating income 16,881 (38) 16,843 19,415 15.0 15.3 Income taxes (3,686) 7 (3,679) (4,421) 19.9 20.2 Net income 13,195 (31) 13,164 14,994 13.6 13.9

Thank you . Our purpose is to help people and business prosper. Our culture is based on believing that everything we do should be:
Serious News for Serious Traders! Try StreetInsider.com Premium Free!
You May Also Be Interested In
- Hampton University Museum to Receive Loan of Historic Vessel by Enslaved Ceramicist David Drake from Artist's Descendants
- AO+ Probiotic Topical Mist Returns -- Now in Two New Higher-Concentration Formulas
- Form 8.3 - [ADVANCED MEDICAL SOLUTIONS GROUP PLC - 19 10 2026] - (CGWL)
Create E-mail Alert Related Categories
SEC FilingsSign up for StreetInsider Free!
Receive full access to all new and archived articles, unlimited portfolio tracking, e-mail alerts, custom newswires and RSS feeds - and more!
