

Form 424B2 CREDIT SUISSE AG
 Tweet
Tweet Share
Share
The information in this preliminary pricing supplement is not complete and may be changed. This preliminary pricing supplement is not an offer to sell these securities and it is not soliciting an offer to buy these securities in any jurisdiction where the offer or sale is not permitted.
Subject to completion dated December 16, 2019.
 |
December 2019 |
| Preliminary Pricing Supplement No. A332 | |
| Registration Statement No. 333-218604-02 | |
| Dated December 16, 2019 | |
| Filed pursuant to Rule 424(b)(2) |
STRUCTURED INVESTMENTS
PLUS Based on the Value of a Weighted Basket Consisting of Seven Basket Components due July 6, 2020
Performance Leveraged Upside SecuritiesSM
Principal at Risk Securities
The securities are unsecured obligations of Credit Suisse, will pay no interest and do not guarantee any return of principal at maturity. At maturity, if the Basket has appreciated in value, investors will receive the principal amount of their investment plus leveraged upside performance of the Basket, subject to the Maximum Payment at Maturity. However, if the Basket has depreciated in value, investors will lose 1% for each 1% decline in the level of the Basket from the Initial Basket Level to the Final Basket Level. Under these circumstances, the Payment at Maturity will be less than the principal amount and could be zero. Accordingly, you may lose your entire investment. The securities are for investors who seek an equity component-based return and who are willing to risk their principal and forgo current income and upside above the Maximum Payment at Maturity in exchange for the leverage feature, which applies for a limited range of upside performance of the Basket. Investors may lose their entire investment in the securities.
All payments on the securities, including the repayment of principal, are subject to the credit risk of Credit Suisse.
| KEY TERMS | ||||
| Issuer: | Credit Suisse AG (“Credit Suisse”), acting through its London branch. | |||
| Basket: | Basket Component | Ticker | Initial Component Level | Component Weighting |
| S&P 500® Value Index | SVX <Index> | 25/100 | ||
| VanEck Vectors® Gold Miners ETF | GDX UP <Equity> | 15/100 | ||
| EURO STOXX® Banks Index | SX7E <Index> | 15/100 | ||
| iShares® MSCI Emerging Markets ETF | EEM UP <Equity> | 15/100 | ||
| SPDR® S&P® Oil & Gas Exploration & Production ETF | XOP UP <Equity> | 10/100 | ||
| Tokyo Stock Price Index | TPX <Index> | 10/100 | ||
| Materials Select Sector SPDR® Fund | XLB UP <Equity> | 10/100 | ||
| For more information on the Basket Components, see “The Basket Components” herein. | ||||
| Aggregate Principal Amount: | $ | |||
| Principal Amount: | $10 per security. The securities are offered at a minimum investment of 100 securities at $10 per security (representing a $1,000 investment), and integral multiples of $10 in excess thereof. | |||
| Price to Public: | $10 per security (see “Commissions and Price to Public” below) | |||
| Payment at Maturity: | If the Final Basket Level is greater than the Initial Basket Level, the lesser of (i) the Maximum Payment at Maturity and (ii) an amount calculated as follows: | |||
| $10 + Leveraged Upside Payment | ||||
| In no event will the Payment at Maturity exceed the Maximum Payment at Maturity. | ||||
| If the Final Basket Level is less than or equal to the Initial Basket Level, an amount calculated as follows: | ||||
| $10 × Basket Performance Factor | ||||
| Under these circumstances, the Payment at Maturity will be less than or equal to the principal amount of $10. | ||||
| Leveraged Upside Payment: | $10 × Leverage Factor × Basket Percent Increase | |||
| Listing: | The securities will not be listed on any securities exchange. | |||
| Key Terms continued on the following page | ||||
Investing in the securities involves a number of risks. See “Selected Risk Considerations” beginning on page 7 of this pricing supplement and “Risk Factors” beginning on page PS-3 of any accompanying product supplement.
Neither the Securities and Exchange Commission nor any state securities commission has approved or disapproved of the securities or passed upon the accuracy or the adequacy of this pricing supplement or the accompanying underlying supplement, any product supplement, the prospectus supplement and the prospectus. Any representation to the contrary is a criminal offense.
| Commissions and Price to Public | Price to Public | Underwriting Discounts and Commissions | Proceeds to Issuer |
| Per security | $10 | $0.125(1) | |
| $0.05(2) | $9.825 | ||
| Total | $ | $ | $ |
(1) We or one of our affiliates may pay to Morgan Stanley Smith Barney LLC (“MSSB”) varying discounts and commissions of up to $0.175 per $10 principal amount of securities, of which $0.05 per $10 principal amount of securities will be paid as a structuring fee. For more detailed information, please see “Supplemental Plan of Distribution (Conflicts of Interest)” in this pricing supplement.
(2) Reflects a structuring fee payable to MSSB by Credit Suisse Securities (USA) LLC (“CSSU”) or one of its affiliates of $0.05 for each security.
The agent for this offering, CSSU, is our affiliate. For more information, see “Supplemental Plan of Distribution (Conflicts of Interest)” in this pricing supplement.
Credit Suisse currently estimates the value of each $10 principal amount of the securities on the Trade Date will be between $9.575 and $9.825 (as determined by reference to our pricing models and the rate we are currently paying to borrow funds through issuance of the securities (our “internal funding rate”)). This range of estimated values reflects terms that are not yet fixed. A single estimated value reflecting final terms will be determined on the Trade Date. See “Selected Risk Considerations” in this pricing supplement.
The securities are not deposit liabilities and are not insured or guaranteed by the Federal Deposit Insurance Corporation or any other governmental agency of the United States, Switzerland or any other jurisdiction.
Credit Suisse

PLUS Based on the Value of a Weighted Basket Consisting of Seven Basket Components due July 6, 2020
Performance Leveraged Upside SecuritiesSM
Principal at Risk Securities
| Key Terms continued from previous page: |
| Basket Percent Increase: |
|
Final Basket Level – Initial Basket Level Initial Basket Level |
Basket Performance Factor:
|
|
Final Basket Level Initial Basket Level |
| Initial Component Level: | For each Basket Component, the closing level of such Basket Component on the Trade Date. In the event that the closing level for any Basket Component is not available on the Trade Date, the Initial Component Level for such Basket Component will be determined on the immediately following trading day on which a closing level is available. |
| Final Component Level: | For each Basket Component, the closing level of such Basket Component on the Valuation Date |
| Basket Component Return: | For each Basket Component, the Final Component Level divided by the Initial Component Level. “SVX Component Return” is the Basket Component Return for the S&P 500® Value Index. “GDX Component Return” is the Basket Component Return for the VanEck Vectors® Gold Miners ETF. “SX7E Component Return” is the Basket Component Return for the EURO STOXX® Banks Index. “EEM Component Return” is the Basket Component Return for the iShares® MSCI Emerging Markets ETF. “XOP Component Return” is the Basket Component Return for the SPDR® S&P® Oil & Gas Exploration & Production ETF. “TPX Component Return” is the Basket Component Return for the Tokyo Stock Price Index. “XLB Component Return” is the Basket Component Return for the Materials Select Sector SPDR® Fund. |
| Initial Basket Level: | Set equal to 100 on the Trade Date. |
| Final Basket Level: | 100 x [(SVX Component Return x SVX Component Weighting) + (GDX Component Return x GDX Component Weighting) + (SX7E Component Return x SX7E Component Weighting) + (EEM Component Return x EEM Component Weighting) + (XOP Component Return x XOP Component Weighting) + (TPX Component Return x TPX Component Weighting) + (XLB Component Return x XLB Component Weighting)] |
| Leverage Factor: | 200% |
| Maximum Payment at Maturity: | Expected to be $10.79 per security (107.90% of the principal amount and to be determined on the Trade Date). |
| Trade Date: | Expected to be on or about December 30, 2019 |
| Settlement Date: | Expected to be on or about January 3, 2020 (3 business days after the Trade Date). Delivery of the securities in book-entry form only will be made through The Depository Trust Company. |
| Valuation Date: | June 30, 2020, subject to postponement as set forth in any accompanying product supplement under “Description of the Securities—Postponement of calculation dates.” |
| Maturity Date: | July 6, 2020, subject to postponement as set forth in any accompanying product supplement under “Description of the Securities—Postponement of calculation dates.” If the Maturity Date is not a business day, the Payment at Maturity will be payable on the first following business day, unless that business day falls in the next calendar month, in which case payment will be made on the first preceding business day. |
| CUSIP/ISIN: | 22550K780 / US22550K7809 |
| Distributor: | MSSB. See “Supplemental Plan of Distribution.” |
| Calculation Agent: | Credit Suisse International |
You may revoke your offer to purchase the securities at any time prior to the time at which we accept such offer on the date the securities are priced. We reserve the right to change the terms of, or reject any offer to purchase the securities prior to their issuance. In the event of any changes to the terms of the securities, we will notify you and you will be asked to accept such changes in connection with your purchase. You may also choose to reject such changes in which case we may reject your offer to purchase.
PLUS Based on the Value of a Weighted Basket Consisting of Seven Basket Components due July 6, 2020
Performance Leveraged Upside SecuritiesSM
Principal at Risk Securities
Additional Terms Specific to the Securities
You should read this pricing supplement together with the underlying supplement dated April 19, 2018, the product supplements dated June 30, 2017, the prospectus supplement dated June 30, 2017 and the prospectus dated June 30, 2017, relating to our Medium-Term Notes of which these securities are a part. You may access these documents on the SEC website at www.sec.gov as follows (or if such address has changed, by reviewing our filings for the relevant date on the SEC website):
| • | Underlying Supplement dated April 19, 2018: |
https://www.sec.gov/Archives/edgar/data/1053092/000095010318004962/dp89590_424b2-underlying.htm
| • | Product Supplement No. I–B dated June 30, 2017: |
http://www.sec.gov/Archives/edgar/data/1053092/000095010317006316/dp77781_424b2-ib.htm
| • | Product Supplement No. I-C dated June 30, 2017: |
https://www.sec.gov/Archives/edgar/data/1053092/000095010317006317/dp77785_424b2-ic.htm
| • | Prospectus Supplement and Prospectus dated June 30, 2017: |
http://www.sec.gov/Archives/edgar/data/1053092/000104746917004364/a2232566z424b2.htm
In the event the terms of the securities described in this pricing supplement differ from, or are inconsistent with, the terms described in the underlying supplement, any product supplement, the prospectus supplement or prospectus, the terms described in this pricing supplement will control.
Our Central Index Key, or CIK, on the SEC website is 1053092. As used in this pricing supplement, “we,” “us,” or “our” refers to Credit Suisse.
This pricing supplement, together with the documents listed above, contains the terms of the securities and supersedes all other prior or contemporaneous oral statements as well as any other written materials including preliminary or indicative pricing terms, fact sheets, correspondence, trade ideas, structures for implementation, sample structures, brochures or other educational materials of ours. We may, without the consent of the registered holder of the securities and the owner of any beneficial interest in the securities, amend the securities to conform to its terms as set forth in this pricing supplement and the documents listed above, and the trustee is authorized to enter into any such amendment without any such consent. You should carefully consider, among other things, the matters set forth in “Selected Risk Considerations” in this pricing supplement and “Risk Factors” in any accompanying product supplement, “Foreign Currency Risks” in the accompanying prospectus, and any risk factors we describe in the combined Annual Report on Form 20-F of Credit Suisse Group AG and us incorporated by reference therein, and any additional risk factors we describe in future filings we make with the SEC under the Securities Exchange Act of 1934, as amended, as the securities involve risks not associated with conventional debt securities. You should consult your investment, legal, tax, accounting and other advisors before deciding to invest in the securities.
Prohibition of Sales to EEA Retail Investors
The securities may not be offered, sold or otherwise made available to any retail investor in the European Economic Area. For the purposes of this provision:
(a) the expression “retail investor” means a person who is one (or more) of the following:
(i) a retail client as defined in point (11) of Article 4(1) of Directive 2014/65/EU (as amended, “MiFID II”); or
(ii) a customer within the meaning of Directive 2002/92/EC, where that customer would not qualify as a professional client as defined in point (10) of Article 4(1) of MiFID II; or
(iii) not a qualified investor as defined in Directive 2003/71/EC; and
(b) the expression “offer” includes the communication in any form and by any means of sufficient information on the terms of the offer and the securities offered so as to enable an investor to decide to purchase or subscribe the securities.
| December 2019 | Page 2 |
PLUS Based on the Value of a Weighted Basket Consisting of Seven Basket Components due July 6, 2020
Performance Leveraged Upside SecuritiesSM
Principal at Risk Securities
Investment Summary
Performance Leveraged Upside Securities
Principal at Risk Securities
The PLUS Based on the Value of a Weighted Basket Consisting of Seven Basket Components due July 6, 2020 can be used:
| § | As an alternative to direct exposure to the Basket Components that enhances returns for a certain range of positive performance of the Basket Components, subject to the Maximum Payment at Maturity. |
| § | To enhance returns and potentially outperform the Basket Components in a moderately bullish scenario. |
| § | To achieve similar levels of upside exposure to the Basket Components as a direct investment, subject to the Maximum Payment at Maturity, while using fewer dollars by taking advantage of the Leverage Factor. |
The securities are exposed on a 1:1 basis to the negative performance of the Basket.
| Maturity: | Approximately 6 months. |
| Leverage Factor: | 200% (applicable only if the Final Basket Level is greater than the Initial Basket Level). |
| Maximum Payment at Maturity: | Expected to be $10.79 per security (107.90% of the principal amount and to be determined on the Trade Date). |
| Minimum Payment at Maturity: | None. Investors may lose their entire initial investment in the securities. |
| Coupon: | None. |
| December 2019 | Page 3 |
PLUS Based on the Value of a Weighted Basket Consisting of Seven Basket Components due July 6, 2020
Performance Leveraged Upside SecuritiesSM
Principal at Risk Securities
Key Investment Rationale
The securities offer leveraged exposure to a certain range of positive performance of a weighted basket consisting of seven Basket Components. In exchange for enhanced performance of 200% of the appreciation of the Basket, investors forgo performance above the Maximum Payment at Maturity, which is expected to be $10.79 per security (to be determined on the Trade Date). At maturity, if the Basket has appreciated in value, investors will receive the principal amount of their investment plus leveraged upside performance of the Basket, subject to the Maximum Payment at Maturity. However, if the Basket has depreciated in value, investors will lose 1% for every 1% decline in the level of the Basket from the Initial Basket Level to the Final Basket Level. Under these circumstances, the Payment at Maturity will be less than the principal amount and could be zero. Investors may lose their entire initial investment in the securities. All payments on the securities are subject to the credit risk of Credit Suisse.
| Leveraged Performance | The securities offer investors an opportunity to capture enhanced returns relative to a direct investment in the Basket Components within a certain range of positive performance. |
| Upside Scenario | The Basket increases in value, and, at maturity, you receive a full return of principal as well as 200% of the increase in the value of the Basket, subject to the Maximum Payment at Maturity, which is expected to be $10.79 per security (107.90% of the principal amount and to be determined on the Trade Date). For example, if the Final Basket Level is 3% greater than the Initial Basket Level, the securities will provide a total return of 6% at maturity. |
| Par scenario | The Final Basket Level is equal to the Initial Basket Level. In this case, you receive the principal amount of $10 at maturity. |
| Downside Scenario | The Basket declines in value, and, at maturity, the securities redeem for less than the principal amount by an amount proportionate to the decline in the value of the Basket from the Initial Basket Level to the Final Basket Level. For example, if the Final Basket Level is 30% less than the Initial Basket Level, the securities will redeem at maturity for a loss of 30% of principal at $7, or 70% of the principal amount. There is no minimum Payment at Maturity on the securities, and you could lose your entire investment. |
| December 2019 | Page 4 |
PLUS Based on the Value of a Weighted Basket Consisting of Seven Basket Components due July 6, 2020
Performance Leveraged Upside SecuritiesSM
Principal at Risk Securities
How the Securities Work
The numbers appearing in the sections below have been rounded for ease of analysis.
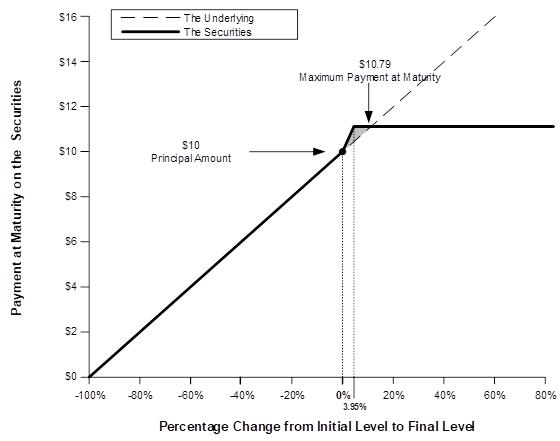
Payoff Diagram
The payoff diagram below illustrates the Payment at Maturity on the securities based on the following terms:
| Principal Amount: | $10 per security |
| Leverage Factor: | 200% |
| Maximum Payment at Maturity: | Expected to be $10.79 per security (107.90% of the principal amount and to be determined on the Trade Date) |
| Minimum Payment at Maturity: | None |
| Securities Payoff Diagram |
 |
See the next page for a description of how the securities work.
| December 2019 | Page 5 |
PLUS Based on the Value of a Weighted Basket Consisting of Seven Basket Components due July 6, 2020
Performance Leveraged Upside SecuritiesSM
Principal at Risk Securities
How it works
| § | Upside Scenario. If the Final Basket Level is greater than the Initial Basket Level, the investor would receive the $10 principal amount plus 200% of the appreciation of the Basket from the Initial Basket Level to the Final Basket Level, subject to the Maximum Payment at Maturity. Under the terms of the securities, an investor will realize the Maximum Payment at Maturity at a Final Basket Level of approximately 103.95% of the Initial Basket Level. |
| § | If the Basket appreciates 2%, the investor would receive a 4% return, or $10.40 per security. |
| § | If the Basket appreciates 40%, the investor would receive only the Maximum Payment at Maturity of $10.79 per security, or 107.90% of the principal amount. |
| § | Par Scenario. If the Final Basket Level is equal to the Initial Basket Level, the investor would receive the $10 principal amount |
| § | Downside Scenario. If the Final Basket Level is less than the Initial Basket Level, the investor would receive an amount that is less than the $10 principal amount, based on a 1% loss of principal for each 1% decline in the Basket. Under these circumstances, the Payment at Maturity will be less than the principal amount per security. There is no minimum Payment at Maturity on the securities. |
| § | If the Basket depreciates 30%, the investor would lose 30% of the investor’s principal and receive only $7 per security at maturity, or 70% of the principal amount. |
| December 2019 | Page 6 |
PLUS Based on the Value of a Weighted Basket Consisting of Seven Basket Components due July 6, 2020
Performance Leveraged Upside SecuritiesSM
Principal at Risk Securities
Selected Risk Considerations
This section describes the most significant risks relating to the securities. For a complete list of risk factors, please see any accompanying product supplement, prospectus and prospectus supplement. Investors should consult their financial and legal advisers as to the risks entailed by an investment in the securities and the suitability of the securities in light of their particular circumstances.
| § | The investment in the securities may result in a loss. The securities do not guarantee any return of your principal amount. You could lose up to $10 per $10 principal amount of securities. If the Final Basket Level is less than the Initial Basket Level, you will lose 1% of your principal for each 1% decline in the level of the Basket from the Initial Basket Level to the Final Basket Level. Any payment on the securities is subject to our ability to pay our obligations as they become due. |
| § | Regardless of the amount of any payment you receive on the securities, your actual yield may be different in real value terms. Inflation may cause the real value of any payment you receive on the securities to be less at maturity than it is at the time you invest. An investment in the securities also represents a forgone opportunity to invest in an alternative asset that generates a higher real return. You should carefully consider whether an investment that may result in a return that is lower than the return on alternative investments is appropriate for you. |
| § | Limited appreciation potential. If the Final Basket Level is greater than the Initial Basket Level, for each $10 principal amount of securities, you will be entitled to receive at maturity the lesser of (i) the Maximum Payment at Maturity and (ii) the sum of $10 and the Leveraged Upside Payment, which will equal the product of (a) $10, (b) the Leverage Factor and (c) the percentage change of the Basket from the Initial Basket Level to the Final Basket Level. The Payment at Maturity will not exceed the Maximum Payment at Maturity, regardless of the appreciation in the level of the Basket, which may be significant. |
| § | Changes in the levels of the Basket Components may offset each other. Movements in the levels of the Basket Components may not correlate with each other. At a time when the level of one of the Basket Components increases, the level of the other Basket Components may not increase as much or may even decline. Therefore, in calculating the Final Basket Level, an increase in the level of one of the Basket Components may be moderated, or more than offset, by a lesser increase or decline in the level of the other Basket Components. Because the S&P 500® Value Index is more heavily weighted than the other Basket Components, a decline in the S&P 500® Value Index will have a disproportionately adverse effect on the value of the Basket and may lead to poor performance even if the other Basket Components perform favorably. |
| § | The Basket Components are not equally weighted. The securities are linked to a basket of seven Basket Components, and the Basket Components have significantly different weights in determining the value of the Basket. The same percentage change in any of the seven Basket Components could therefore have different effects on the Final Basket Level because of the unequal weighting. For example, if the weighting of one Basket Component is greater than the weighting of another Basket Component, a 5% decrease from the Initial Component Level to the Final Component Level of the Basket Component with the greater weighting will have a greater impact on the Final Basket Level than a 5% increase from the Initial Component Level to the Final Component Level of the Basket Component with the lesser weighting. |
| § | The securities are subject to the credit risk of Credit Suisse. Investors are dependent on our ability to pay all amounts due on the securities and, therefore, if we were to default on our obligations, you may not receive any amounts owed to you under the securities. In addition, any decline in our credit ratings, any adverse changes in the market’s view of our creditworthiness or any increase in our credit spreads is likely to adversely affect the value of the securities prior to maturity. |
| § | The securities do not pay interest. We will not pay interest on the securities. You may receive less at maturity than you could have earned on ordinary interest-bearing debt securities with similar maturities, including other of our debt securities, since the Payment at Maturity at maturity is based on the performance of the Basket. Because the Payment at Maturity due at maturity may be less than the amount originally invested in the securities, the return on the securities (the |
| December 2019 | Page 7 |
PLUS Based on the Value of a Weighted Basket Consisting of Seven Basket Components due July 6, 2020
Performance Leveraged Upside SecuritiesSM
Principal at Risk Securities
effective yield to maturity) may be negative. Even if it is positive, the return payable on each security may not be enough to compensate you for any loss in value due to inflation and other factors relating to the value of money over time.
| § | The probability that the Final Basket Level will be less than the Initial Basket Level will depend on the volatility of the Basket Components. “Volatility” refers to the frequency and magnitude of changes in the levels of the Basket Components. The greater the expected volatility with respect to the Basket Components on the Trade Date, the higher the expectation as of the Trade Date that the Final Basket Level could be less than the Initial Basket Level, indicating a higher expected risk of loss on the securities. The terms of the securities are set, in part, based on expectations about the volatility of the Basket Components as of the Trade Date. The volatility of the Basket Components can change significantly over the term of the securities. The levels of the Basket Components could fall sharply, which could result in a significant loss of principal. You should be willing to accept the downside market risk of the Basket Components and the potential to lose a significant amount of your principal at maturity. |
| § | The investment strategy represented by the S&P 500® Value Index may not be successful — The S&P 500® Value Index is designed to measure the full performance of companies included in the S&P 500® Index that exhibit relatively strong value characteristics (determined by reference to (1) book-value-to-price ratio, (2) earnings-to-price ratio and (3) sales-to-price ratio) and relatively weak growth characteristics (determined by reference to earnings-per-share growth, sales-per-share growth and upward share price momentum) and a portion of the performance of companies with more balanced value and growth characteristics (where greater weight is allocated to companies with relatively stronger value characteristics and relatively weaker growth characteristics). There is, however, no assurance that the S&P 500® Value Index will outperform any other index or strategy that tracks U.S. stocks selected using other criteria. A “value” investment strategy is premised on the goal of investing in stocks that are determined to be relatively cheap or “undervalued” under the assumption that the value of those stocks will increase over time as the market comes to reflect the “fair” market value of those stocks. However, the value characteristics referenced by the S&P 500® Value Index may not be accurate predictors of undervalued stocks, and there is no guarantee that undervalued stocks will appreciate. In addition, the S&P 500® Value Index’s selection methodology includes a bias against stocks with strong growth characteristics, and stocks with strong growth characteristics might outperform stocks with weak growth characteristics. It is possible that the stock selection methodology of the S&P 500® Value Index will adversely affect its return and, consequently, the level of the S&P 500® Value Index and the value of your securities. |
| § | The closing level of the EURO STOXX® Banks Index and the Tokyo Stock Price Index will not be adjusted for changes in exchange rates relative to the U.S. Dollar even though the equity securities included in the EURO STOXX® Banks Index and the Tokyo Stock Price Index are traded in foreign currencies and the securities are denominated in U.S. Dollars. The value of your securities will not be adjusted for exchange rate fluctuations between the U.S. Dollar and the currencies in which the equity securities included in the EURO STOXX® Banks Index and the Tokyo Stock Price Index are based. Therefore, if the applicable currencies appreciate or depreciate relative to the U.S. Dollar over the term of the securities, you will not receive any additional payment or incur any reduction in your return, if any, at maturity. |
| § | Foreign securities markets risk. Some or all of the assets included in the VanEck Vectors® Gold Miners ETF, EURO STOXX® Banks Index, Tokyo Stock Price Index and iShares® MSCI Emerging Markets ETF are issued by foreign companies and trade in foreign securities markets. Investments in the securities therefore involve risks associated with the securities markets in those countries, including risks of volatility in those markets, government intervention in those markets and cross shareholdings in companies in certain countries. Also, foreign companies are generally subject to accounting, auditing and financial reporting standards and requirements and securities trading rules different from those applicable to U.S. reporting companies. The equity securities included in the VanEck Vectors® Gold Miners ETF, EURO STOXX® Banks Index, Tokyo Stock Price Index and iShares® MSCI Emerging Markets ETF may be more volatile than domestic equity securities and may be subject to different political, market, economic, exchange rate, regulatory and other risks, including changes in foreign governments, economic and fiscal policies, currency exchange laws or other laws or restrictions. Moreover, the economies of foreign countries may differ favorably or unfavorably from the economy of the United States in such respects as growth of gross national product, rate of inflation, capital reinvestment, resources and self-sufficiency. These factors may adversely affect the values of the equity securities included in the |
| December 2019 | Page 8 |
PLUS Based on the Value of a Weighted Basket Consisting of Seven Basket Components due July 6, 2020
Performance Leveraged Upside SecuritiesSM
Principal at Risk Securities
VanEck Vectors® Gold Miners ETF, EURO STOXX® Banks Index, Tokyo Stock Price Index and iShares® MSCI Emerging Markets ETF, and therefore the performance of such Basket Components and the value of the securities.
| § | The stocks included in the VanEck Vectors® Gold Miners ETF, EURO STOXX® Banks Index, SPDR® S&P® Oil & Gas Exploration & Production ETF and Materials Select Sector SPDR® Fund are concentrated in one particular sector. All of the stocks included in the VanEck Vectors® Gold Miners ETF, EURO STOXX® Banks, SPDR® S&P® Oil & Gas Exploration & Production ETF Index and Materials Select Sector SPDR® Fund are issued by companies in a single sector. As a result, the stocks that will determine the performance of the VanEck Vectors® Gold Miners ETF, EURO STOXX® Banks, SPDR® S&P® Oil & Gas Exploration & Production ETF Index and Materials Select Sector SPDR® Fund are concentrated in a single sector. Although an investment in the securities will not give holders any ownership or other direct interests in the stocks held by the VanEck Vectors® Gold Miners ETF, EURO STOXX® Banks, SPDR® S&P® Oil & Gas Exploration & Production ETF Index and Materials Select Sector SPDR® Fund, the return on an investment in the securities will be subject to certain risks associated with a direct equity investment in companies in a single sector. Accordingly, by investing in the securities, you will not benefit from the diversification which could result from an investment linked to companies that operate in a broader range of sectors. |
| § | Currency exchange risk. Because the prices of the equity securities included in the VanEck Vectors® Gold Miners ETF and iShares® MSCI Emerging Markets ETF are converted into U.S. dollars for purposes of calculating the level of the VanEck Vectors® Gold Miners ETF and iShares® MSCI Emerging Markets ETF, investors will be exposed to currency exchange rate risk with respect to each of the currencies in which the equity securities included in the VanEck Vectors® Gold Miners ETF and iShares® MSCI Emerging Markets ETF trade. Currency exchange rates may be highly volatile, particularly in relation to emerging or developing nations’ currencies and, in certain market conditions, also in relation to developed nations’ currencies. Significant changes in currency exchange rates, including changes in liquidity and prices, can occur within very short periods of time. Currency exchange rate risks include, but are not limited to, convertibility risk, market volatility and potential interference by foreign governments through regulation of local markets, foreign investment or particular transactions in foreign currency. These factors may adversely affect the values of the equity securities included in the VanEck Vectors® Gold Miners ETF and iShares® MSCI Emerging Markets ETF, the level of the VanEck Vectors® Gold Miners ETF and iShares® MSCI Emerging Markets ETF and the value of the securities. |
| § | Emerging markets risk. The iShares® MSCI Emerging Markets ETF is exposed to the political and economic risks of emerging market countries. In recent years, some emerging markets have undergone significant political, economic and social upheaval. Such far-reaching changes have resulted in constitutional and social tensions and, in some cases, instability and reaction against market reforms has occurred. With respect to any emerging market nation, there is the possibility of nationalization, expropriation or confiscation, political changes, government regulation and social instability. There can be no assurance that future political changes will not adversely affect the economic conditions of an emerging market nation. Political or economic instability could have an adverse effect on the performance of the securities. |
| § | There are risks associated with the VanEck Vectors® Gold Miners ETF, iShares® MSCI Emerging Markets ETF, SPDR® S&P® Oil & Gas Exploration & Production ETF and Materials Select Sector SPDR® Fund. Although shares of the VanEck Vectors® Gold Miners ETF, iShares® MSCI Emerging Markets ETF, SPDR® S&P® Oil & Gas Exploration & Production ETF and Materials Select Sector SPDR® Fund (each, a “Reference Fund”) are listed for trading on a national securities exchange and a number of similar products have been traded on various national securities exchanges for varying periods of time, there is no assurance that an active trading market will continue for the shares of the Reference Funds or that there will be liquidity in the trading market. Each Reference Fund is subject to management risk, which is the risk that a Reference Fund’s investment strategy, the implementation of which is subject to a number of constraints, may not produce the intended results. Pursuant to each Reference Fund’s investment strategy or otherwise, its investment advisor may add, delete or substitute the assets held by such Reference Fund. Any of these actions could adversely affect the price of the shares of each Reference Fund and consequently the value of the securities. For additional information on the Reference Funds, see “The Basket Components” herein. |
| § | The performance and market value of each Reference Fund, particularly during periods of market volatility, may not correlate to the performance of its Tracked Index. Each Reference Fund will generally invest in all of the equity securities included in the index tracked by such Reference Fund (each such index, a “Tracked Index”), but may not fully replicate such Tracked Index. There may be instances where a Reference Fund’s investment advisor may choose to |
| December 2019 | Page 9 |
PLUS Based on the Value of a Weighted Basket Consisting of Seven Basket Components due July 6, 2020
Performance Leveraged Upside SecuritiesSM
Principal at Risk Securities
overweight another stock in such Reference Fund’s Tracked Index, purchase securities not included in such Reference Fund’s Tracked Index that such investment advisor believes are appropriate to substitute for a security included in such Tracked Index or utilize various combinations of other available investment techniques. In addition, the performance of each Reference Fund will reflect additional transaction costs and fees that are not included in the calculation of such Reference Fund’s Tracked Index. Finally, because the shares of each Reference Fund are traded on a national securities exchange and are subject to market supply and investor demand, the market value of one share of each Reference Fund may differ from the net asset value per share of such Reference Fund.
During periods of market volatility, securities held by each Reference Fund may be unavailable in the secondary market, market participants may be unable to calculate accurately the net asset value per share of such Reference Fund and the liquidity of such Reference Fund may be adversely affected. This kind of market volatility may also disrupt the ability of market participants to create and redeem shares in each Reference Fund. Further, market volatility may adversely affect, sometimes materially, the prices at which market participants are willing to buy and sell shares of each Reference Fund. As a result, under these circumstances, the market value of shares of each Reference Fund may vary substantially from the net asset value per share of such Reference Fund. For all the foregoing reasons, the performance of each Reference Fund may not correlate with the performance of its Tracked Index. For additional information on the Reference Funds, see “The Basket Components” herein.
| § | Hedging and trading activity. We, any dealer or any of our or their respective affiliates may carry out hedging activities related to the securities, including in the Reference Funds or instruments related to the Basket Components. We, any dealer or our or their respective affiliates may also trade in the Reference Funds or instruments related to the Basket Components from time to time. Any of these hedging or trading activities on or prior to the Trade Date and during the term of the securities could adversely affect our payment to you at maturity. |
| § | The estimated value of the securities on the Trade Date may be less than the Price to Public. The initial estimated
value of your securities on the Trade Date (as determined by reference to our pricing models and our internal funding rate) may
be significantly less than the original Price to Public. The Price to Public of the securities includes any discounts or commissions
as well as transaction costs such as expenses incurred to create, document and market the securities and the cost of hedging our
risks as issuer of the securities through one or more of our affiliates (which includes a projected profit). These costs will be
effectively borne by you as an investor in the securities. These amounts will be retained by Credit Suisse or our affiliates in
connection with our structuring and offering of the securities (except to the extent discounts or commissions are reallowed to
other broker-dealers or any costs are paid to third parties). On the Trade Date, we value the components of the securities in accordance with our pricing models. These include a fixed income component valued using our internal funding rate, and individual option components valued using mid-market pricing. As such, the payout on the securities can be replicated using a combination of these components and the value of these components, as determined by us using our pricing models, will impact the terms of the securities at issuance. Our option valuation models are proprietary. Our pricing models take into account factors such as interest rates, volatility and time to maturity of the securities, and they rely in part on certain assumptions about future events, which may prove to be incorrect. |
Because Credit Suisse’s pricing models may differ from other issuers’ valuation models, and because funding rates taken into account by other issuers may vary materially from the rates used by Credit Suisse (even among issuers with similar creditworthiness), our estimated value at any time may not be comparable to estimated values of similar securities of other issuers.
| § | Effect of interest rate in structuring the securities. The internal funding rate we use in structuring notes such as these securities is typically lower than the interest rate that is reflected in the yield on our conventional debt securities of similar maturity in the secondary market (our “secondary market credit spreads”). If on the Trade Date our internal funding rate is lower than our secondary market credit spreads, we expect that the economic terms of the securities will generally be less favorable to you than they would have been if our secondary market credit spread had been used in structuring the securities. We will also use our internal funding rate to determine the price of the securities if we post a bid to repurchase your securities in secondary market transactions. See “—Secondary Market Prices” below. |
| § | Secondary market prices. If Credit Suisse (or an affiliate) bids for your securities in secondary market transactions, which we are not obligated to do, the secondary market price (and the value used for account statements or otherwise) |
| December 2019 | Page 10 |
PLUS Based on the Value of a Weighted Basket Consisting of Seven Basket Components due July 6, 2020
Performance Leveraged Upside SecuritiesSM
Principal at Risk Securities
may be higher or lower than the Price to Public and the estimated value of the securities on the Trade Date. The estimated value of the securities on the cover of this pricing supplement does not represent a minimum price at which we would be willing to buy the securities in the secondary market (if any exists) at any time. The secondary market price of your securities at any time cannot be predicted and will reflect the then-current estimated value determined by reference to our pricing models and other factors. These other factors include our internal funding rate, customary bid and ask spreads and other transaction costs, changes in market conditions and any deterioration or improvement in our creditworthiness. In circumstances where our internal funding rate is lower than our secondary market credit spreads, our secondary market bid for your securities could be more favorable than what other dealers might bid because, assuming all else equal, we use the lower internal funding rate to price the securities and other dealers might use the higher secondary market credit spread to price them. Furthermore, assuming no change in market conditions from the Trade Date, the secondary market price of your securities will be lower than the Price to Public because it will not include any discounts or commissions and hedging and other transaction costs. If you sell your securities to a dealer in a secondary market transaction, the dealer may impose an additional discount or commission, and as a result the price you receive on your securities may be lower than the price at which we may repurchase the securities from such dealer.
We (or an affiliate) may initially post a bid to repurchase the securities from you at a price that will exceed the then-current estimated value of the securities. That higher price reflects our projected profit and costs that were included in the Price to Public, and that higher price may also be initially used for account statements or otherwise. We (or our affiliate) may offer to pay this higher price, for your benefit, but the amount of any excess over the then-current estimated value will be temporary and is expected to decline over a period of approximately three months.
The securities are not designed to be short-term trading instruments and any sale prior to maturity could result in a substantial loss to you. You should be willing and able to hold your securities to maturity.
| § | Credit Suisse is subject to Swiss regulation. As a Swiss bank, Credit Suisse is subject to regulation by governmental agencies, supervisory authorities and self-regulatory organizations in Switzerland. Such regulation is increasingly more extensive and complex and subjects Credit Suisse to risks. For example, pursuant to Swiss banking laws, the Swiss Financial Market Supervisory Authority (FINMA) may open resolution proceedings if there are justified concerns that Credit Suisse is over-indebted, has serious liquidity problems or no longer fulfills capital adequacy requirements. FINMA has broad powers and discretion in the case of resolution proceedings, which include the power to convert debt instruments and other liabilities of Credit Suisse into equity and/or cancel such liabilities in whole or in part. If one or more of these measures were imposed, such measures may adversely affect the terms and market value of the securities and/or the ability of Credit Suisse to make payments thereunder and you may not receive any amounts owed to you under the securities. |
| § | Lack of liquidity. The securities will not be listed on any securities exchange. Credit Suisse (or its affiliates) intends to offer to purchase the securities in the secondary market but is not required to do so. Even if there is a secondary market, it may not provide enough liquidity to allow you to trade or sell the securities when you wish to do so. Because other dealers are not likely to make a secondary market for the securities, the price at which you may be able to trade your securities is likely to depend on the price, if any, at which Credit Suisse (or its affiliates) is willing to buy the securities. If you have to sell your securities prior to maturity, you may not be able to do so or you may have to sell them at a substantial loss. |
| § | Potential conflicts. We and our affiliates play a variety of roles in connection with the issuance of the securities, including acting as calculation agent and as agent of the issuer for the offering of the securities, hedging our obligations under the securities and determining their estimated value. In performing these duties, the economic interests of us and our affiliates are potentially adverse to your interests as an investor in the securities. For instance, as calculation agent, Credit Suisse International will determine the Initial Component Level and the Payment at Maturity. Moreover, certain determinations made by Credit Suisse International, in its capacity as calculation agent, may require it to exercise discretion and make subjective judgments, such as with respect to the occurrence or non-occurrence of market disruption events and the selection of a successor basket component or calculation of the closing level in the event of a market disruption event or discontinuance of the Basket Components. These potentially subjective determinations may adversely affect the payout to you at maturity, if any. In addition, hedging activities by us or our affiliates on or prior to the Trade Date could potentially increase the Initial Component Level, and therefore, could increase the levels at or above which the Basket Components must close so that you are not exposed to the negative performance of the Basket on the Valuation Date. Further, hedging activities may adversely affect any payment on or the value of the securities. Any profit |
| December 2019 | Page 11 |
PLUS Based on the Value of a Weighted Basket Consisting of Seven Basket Components due July 6, 2020
Performance Leveraged Upside SecuritiesSM
Principal at Risk Securities
in connection with such hedging activities will be in addition to any other compensation that we and our affiliates receive for the sale of the securities, which creates an additional incentive to sell the securities to you.
| § | Unpredictable economic and market factors will affect the value of the securities. The payout on the securities can be replicated using a combination of the components described in “The estimated value of the securities on the Trade Date may be less than the Price to Public.” Therefore, in addition to the levels of the Basket Components, the terms of the securities at issuance and the value of the securities prior to maturity may be influenced by factors that impact the value of fixed income securities and options in general such as: |
| o | the expected and actual volatility of the Basket Components; |
| o | the time to maturity of the securities; |
| o | the dividend rate on the equity securities included in the Basket Components; |
| o | interest and yield rates in the market generally; |
| o | investors’ expectations with respect to the rate of inflation; |
| o | events affecting companies engaged in the industries tracked by the VanEck Vectors® Gold Miners ETF, EURO STOXX® Banks Index, SPDR® S&P® Oil & Gas Exploration & Production ETF and Materials Select Sector SPDR® Fund; |
| o | geopolitical conditions and economic, financial, political, regulatory or judicial events that affect the components included in the Basket Components or markets generally and which may affect the level of the Basket; and |
| o | our creditworthiness, including actual or anticipated downgrades in our credit ratings. |
Some or all of these factors may influence the price that you will receive if you choose to sell your securities prior to maturity. The impact of any of the factors set forth above may enhance or offset some or all of any change resulting from another factor or factors.
| § | No ownership rights relating to the Basket Components. Your return on the securities will not reflect the return you would realize if you actually owned shares of the Reference Funds or the assets that comprise the Basket Components. The return on your investment is not the same as the total return you would receive based on the purchase of shares of the Reference Funds or the assets that comprise the Basket Components. For example, as a holder of the securities, you will not have voting rights or rights to receive cash dividends or other distributions or other rights with respect to shares of the Reference Funds or the assets that comprise the Basket Components. |
| § | Adjustments to the S&P 500® Value Index, the EURO STOXX® Banks Index or the Tokyo Stock Price Index could adversely affect the value of the securities. The publisher of the S&P 500® Value Index, the EURO STOXX® Banks Index or the Tokyo Stock Price Index (each, a “Reference Index”) may add, delete or substitute the component stocks of such Reference Index or make other methodological changes that could change the value of such Reference Index. Any of these actions could adversely affect the value of the securities. The publisher of a Reference Index may also discontinue or suspend calculation or publication of such Reference Index at any time. In these circumstances, Credit Suisse International, as the calculation agent, will have the sole discretion to substitute a successor underlying that is comparable to the discontinued Reference Index. Credit Suisse International could have an economic interest that is different than that of investors in the securities insofar as, for example, Credit Suisse International is permitted to consider Reference Indices that are calculated and published by Credit Suisse International or any of its affiliates. If Credit Suisse International determines that there is no appropriate successor underlying on the Valuation Date, the amount payable at maturity will be based on the value of the Reference Indices, based on the closing prices of the stocks constituting the Reference Indices at the time of such discontinuance, without rebalancing or substitution, |
| December 2019 | Page 12 |
PLUS Based on the Value of a Weighted Basket Consisting of Seven Basket Components due July 6, 2020
Performance Leveraged Upside SecuritiesSM
Principal at Risk Securities
computed by Credit Suisse International as calculation agent in accordance with the formula for calculating the Reference Indices last in effect prior to such discontinuance, as compared to the Initial Basket Level.
| § | Anti-dilution protection is limited. The calculation agent will make anti-dilution adjustments for certain events affecting the Reference Funds. However, an adjustment will not be required in response to all events that could affect the Reference Funds. If an event occurs that does not require the calculation agent to make an adjustment, or if an adjustment is made but such adjustment does not fully reflect the economics of such event, the value of the securities may be materially and adversely affected. See “Description of the Securities—Adjustments” in the relevant product supplement. |
| § | The U.S. federal tax consequences of an investment in the securities are unclear. There is no direct legal authority regarding the proper U.S. federal tax treatment of the securities, and we do not plan to request a ruling from the Internal Revenue Service (the “IRS”). Consequently, significant aspects of the tax treatment of the securities are uncertain, and the IRS or a court might not agree with the treatment of the securities as prepaid financial contracts that are treated as “open transactions.” If the IRS were successful in asserting an alternative treatment of the securities, the tax consequences of the ownership and disposition of the securities, including the timing and character of income recognized by U.S. investors and the withholding tax consequences to non-U.S. investors, might be materially and adversely affected. Moreover, future legislation, Treasury regulations or IRS guidance could adversely affect the U.S. federal tax treatment of the securities, possibly retroactively. |
| December 2019 | Page 13 |
PLUS Based on the Value of a Weighted Basket Consisting of Seven Basket Components due July 6, 2020
Performance Leveraged Upside SecuritiesSM
Principal at Risk Securities
Supplemental Use of Proceeds and Hedging
We intend to use the proceeds of this offering for our general corporate purposes, which may include the refinancing of existing debt outside Switzerland. Some or all of the proceeds we receive from the sale of the securities may be used in connection with hedging our obligations under the securities through one or more of our affiliates. Such hedging or trading activities on or prior to the Trade Date and during the term of the securities (including on any calculation date, as defined in any accompanying product supplement) could adversely affect the value of the Basket Components and, as a result, could decrease the amount you may receive on the securities at maturity. For additional information, see “Supplemental Use of Proceeds and Hedging” in any accompanying product supplement.
| December 2019 | Page 14 |
PLUS Based on the Value of a Weighted Basket Consisting of Seven Basket Components due July 6, 2020
Performance Leveraged Upside SecuritiesSM
Principal at Risk Securities
The Basket Components
S&P 500® Value Index
The S&P 500® Value Index is designed to measure the full performance of companies included in the S&P 500® Index that exhibit relatively strong value characteristics (determined by reference to (1) book-value-to-price ratio, (2) earnings-to-price ratio and (3) sales-to-price ratio) and relatively weak growth characteristics (determined by reference to earnings-per-share growth, sales-per-share growth and upward share price momentum) and a portion of the performance of companies with more balanced value and growth characteristics (where greater weight is allocated to companies with relatively stronger value characteristics and relatively weaker growth characteristics).
The S&P 500® Value Index is a subset of the S&P 500® Index and is a float-adjusted market-capitalization weighted index. S&P Dow Jones allocates the complete float-adjusted market capitalization of the companies included in the S&P 500® Index between the S&P 500® Value Index and the S&P 500® Growth Index based on an assessment of those companies’ respective value and growth characteristics. The market capitalization of companies exhibiting the strongest value characteristics relative to their respective growth characteristics is allocated to the S&P 500® Value Index (approximately 33% of the market capitalization of the S&P 500® Index), and the market capitalization of companies exhibiting the strongest growth characteristics relative to their respective value characteristics (approximately 33% of the market capitalization of the S&P 500® Index) is allocated to the S&P 500® Growth Index. The market capitalization of the remaining companies included in the S&P 500® Index is split between the S&P 500® Value Index and the S&P 500® Growth Index, with more of the market capitalization of companies exhibiting stronger value characteristics relative to their respective growth characteristics being allocated to the S&P 500® Value Index and more of the market capitalization of companies exhibiting the stronger growth characteristics relatively to their respective value characteristics being allocated to the S&P 500® Growth Index.
For additional information about the S&P 500® Value Index, see the information set forth under “The Reference Indices— The S&P Dow Jones Indices—The S&P 500® Index” in the accompanying underlying supplement.
Information as of market close on December 11, 2019:
| Bloomberg Ticker Symbol: | SVX |
| Current Closing Level: | 1252.733 |
| 52 Weeks Ago (on 12/12/2018): | 1052.641 |
| 52 Week High (on 11/27/2019): | 1254.547 |
| 52 Week Low (on 12/24/2018): | 942.574 |
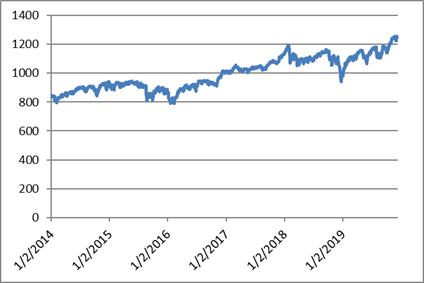
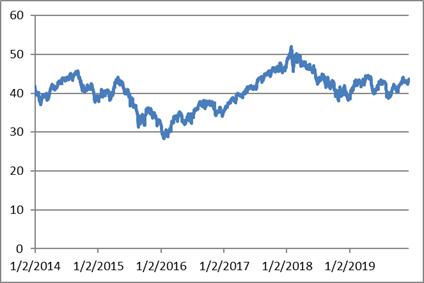
The following graph sets forth the daily closing levels of the S&P 500® Value Index for the period from January 2, 2014 through December 11, 2019. The related table sets forth the published high and low closing levels, as well as end-of-quarter closing levels, of the S&P 500® Value Index for each quarter in the same period. The closing level of the S&P 500® Value Index on December 11, 2019 was 1252.733. We obtained the information in the table and graph below from Bloomberg Financial Markets without independent verification. You should not take the historical values of the S&P 500® Value Index as an indication of its future performance, and no assurance can be given as to the closing level of the S&P 500® Value Index on the Valuation Date.
For additional information about the S&P 500® Value Index, see “The Reference Indices—The S&P Dow Jones Indices—The S&P 500® Index” in the accompanying underlying supplement.
| December 2019 | Page 15 |
PLUS Based on the Value of a Weighted Basket Consisting of Seven Basket Components due July 6, 2020
Performance Leveraged Upside SecuritiesSM
Principal at Risk Securities
|
S&P 500® Value Index Daily Closing Levels January 2, 2014 to December 11, 2019 |
 |
| December 2019 | Page 16 |
PLUS Based on the Value of a Weighted Basket Consisting of Seven Basket Components due July 6, 2020
Performance Leveraged Upside SecuritiesSM
Principal at Risk Securities
| S&P 500® Value Index | High | Low | Period End |
| 2014 | |||
| First Quarter | 860.390 | 793.810 | 860.390 |
| Second Quarter | 900.020 | 840.860 | 894.470 |
| Third Quarter | 911.420 | 868.990 | 891.110 |
| Fourth Quarter | 941.100 | 843.940 | 927.970 |
| 2015 | |||
| First Quarter | 937.940 | 885.530 | 915.870 |
| Second Quarter | 944.410 | 910.940 | 912.401 |
| Third Quarter | 932.160 | 810.100 | 831.710 |
| Fourth Quarter | 906.500 | 831.130 | 876.090 |
| 2016 | |||
| First Quarter | 892.210 | 788.670 | 888.950 |
| Second Quarter | 925.400 | 872.900 | 917.957 |
| Third Quarter | 950.180 | 909.110 | 938.797 |
| Fourth Quarter | 1015.670 | 908.365 | 1001.123 |
| 2017 | |||
| First Quarter | 1057.510 | 999.640 | 1027.883 |
| Second Quarter | 1045.549 | 1005.437 | 1037.134 |
| Third Quarter | 1066.458 | 1023.462 | 1066.458 |
| Fourth Quarter | 1132.272 | 1067.465 | 1126.982 |
| 2018 | |||
| First Quarter | 1195.510 | 1053.922 | 1080.053 |
| Second Quarter | 1112.310 | 1057.578 | 1088.212 |
| Third Quarter | 1164.959 | 1086.579 | 1144.503 |
| Fourth Quarter | 1153.173 | 942.574 | 999.699 |
| 2019 | |||
| First Quarter | 1124.977 | 980.028 | 1114.384 |
| Second Quarter | 1159.855 | 1067.766 | 1151.859 |
| Third Quarter | 1188.202 | 1103.459 | 1176.919 |
| Fourth Quarter (through December 11, 2019) | 1254.547 | 1139.981 | 1252.733 |
| December 2019 | Page 17 |
PLUS Based on the Value of a Weighted Basket Consisting of Seven Basket Components due July 6, 2020
Performance Leveraged Upside SecuritiesSM
Principal at Risk Securities
VanEck Vectors® Gold Miners ETF
We have derived all information contained herein regarding the VanEck Vectors® Gold Miners ETF from publicly available information. Such information reflects the policies of, and is subject to change by, Van Eck Associates Corporation, which maintains and manages the VanEck Vectors® Gold Miners ETF and acts as an investment advisor to the VanEck Vectors® Gold Miners ETF. We have not conducted any independent review or due diligence of any publicly available information with respect to the VanEck Vectors® Gold Miners ETF. The VanEck Vectors® Gold Miners ETF is an exchange-traded fund that seeks to replicate as closely as possible, before fees and expenses, the price and yield performance of the NYSE Arca Gold Miners Index, which is a modified market capitalization weighted index comprised of publicly traded companies involved primarily in the mining of gold and silver.
VanEck Vectors ETF Trust is a registered investment company that consists of numerous separate investment portfolios, including the VanEck Vectors® Gold Miners ETF. Information filed by VanEck Vectors ETF Trust with the SEC under the Securities Exchange Act and the Investment Company Act can be found by reference to its SEC file numbers: 333-123257 and 811-10325. Shares of the VanEck Vectors® Gold Miners ETF are listed on the NYSE Arca under ticker symbol “GDX.” Information from outside sources is not incorporated by reference in, and should not be considered part of, this pricing supplement, the underlying supplement, any accompanying product supplement, the prospectus supplement and the prospectus.
Information as of market close on December 11, 2019:
| Bloomberg Ticker Symbol: | GDX UP |
| Current Closing Level: | $27.71 |
| 52 Weeks Ago (on 12/12/2018): | $20.44 |
| 52 Week High (on 9/4/2019): | $30.95 |
| 52 Week Low (on 12/19/2018): | $19.95 |
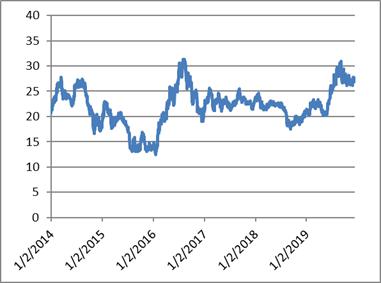
The following graph sets forth the daily closing levels of the VanEck Vectors® Gold Miners ETF for the period from January 2, 2014 through December 11, 2019. The related table sets forth the published high and low closing levels, as well as end-of-quarter closing levels, of the VanEck Vectors® Gold Miners ETF for each quarter in the same period. The closing level of the VanEck Vectors® Gold Miners ETF on December 11, 2019 was $27.71. We obtained the information in the table and graph below from Bloomberg Financial Markets without independent verification. You should not take the historical values of the VanEck Vectors® Gold Miners ETF as an indication of its future performance, and no assurance can be given as to the closing level of the VanEck Vectors® Gold Miners ETF on the Valuation Date.
| December 2019 | Page 18 |
PLUS Based on the Value of a Weighted Basket Consisting of Seven Basket Components due July 6, 2020
Performance Leveraged Upside SecuritiesSM
Principal at Risk Securities
|
VanEck Vectors® Gold Miners ETF Daily Closing Levels January 2, 2014 to December 11, 2019 |
 |
| December 2019 | Page 19 |
PLUS Based on the Value of a Weighted Basket Consisting of Seven Basket Components due July 6, 2020
Performance Leveraged Upside SecuritiesSM
Principal at Risk Securities
| VanEck Vectors® Gold Miners ETF | High | Low | Period End |
| 2014 | |||
| First Quarter | $27.73 | $21.27 | $23.60 |
| Second Quarter | $26.45 | $22.04 | $26.45 |
| Third Quarter | $27.46 | $21.35 | $21.35 |
| Fourth Quarter | $21.94 | $16.59 | $18.38 |
| 2015 | |||
| First Quarter | $22.94 | $17.67 | $18.24 |
| Second Quarter | $20.82 | $17.76 | $17.76 |
| Third Quarter | $17.85 | $13.04 | $13.74 |
| Fourth Quarter | $16.90 | $13.08 | $13.72 |
| 2016 | |||
| First Quarter | $20.86 | $12.47 | $19.98 |
| Second Quarter | $27.70 | $19.53 | $27.70 |
| Third Quarter | $31.32 | $25.45 | $26.43 |
| Fourth Quarter | $25.96 | $18.99 | $20.92 |
| 2017 | |||
| First Quarter | $25.57 | $21.14 | $22.81 |
| Second Quarter | $24.57 | $21.10 | $22.08 |
| Third Quarter | $25.49 | $21.21 | $22.96 |
| Fourth Quarter | $23.84 | $21.42 | $23.24 |
| 2018 | |||
| First Quarter | $24.60 | $21.27 | $21.98 |
| Second Quarter | $23.06 | $21.81 | $22.31 |
| Third Quarter | $22.68 | $17.57 | $18.52 |
| Fourth Quarter | $21.09 | $18.39 | $21.09 |
| 2019 | |||
| First Quarter | $23.36 | $20.31 | $22.42 |
| Second Quarter | $26.17 | $20.17 | $25.56 |
| Third Quarter | $30.95 | $24.58 | $26.71 |
| Fourth Quarter (through December 11, 2019) | $28.36 | $26.19 | $27.71 |
| December 2019 | Page 20 |
PLUS Based on the Value of a Weighted Basket Consisting of Seven Basket Components due July 6, 2020
Performance Leveraged Upside SecuritiesSM
Principal at Risk Securities
EURO STOXX® Banks Index
The EURO STOXX® Banks Index is a free-float market capitalization index that currently includes 25 stocks of banks market sector leaders from 11 Eurozone countries: Austria, Belgium, Finland, France, Germany, Ireland, Italy, Luxembourg, the Netherlands, Portugal and Spain. Not all 11 countries are represented in the EURO STOXX® Banks Index at any given time.
Information as of market close on December 11, 2019:
| Bloomberg Ticker Symbol: | SX7E |
| Current Closing Level: | 93.54 |
| 52 Weeks Ago (on 12/12/2018): | 92.09 |
| 52 Week High (on 4/17/2019): | 103.60 |
| 52 Week Low (on 8/15/2019): | 77.45 |
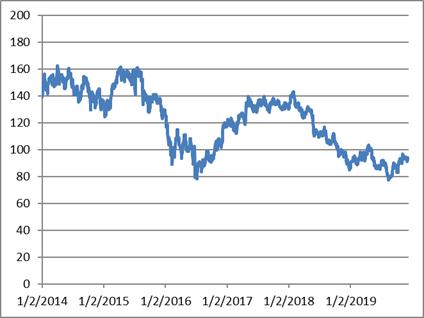
The following graph sets forth the daily closing levels of the EURO STOXX® Banks Index for the period from January 2, 2014 through December 11, 2019. The related table sets forth the published high and low closing levels, as well as end-of-quarter closing levels, of the EURO STOXX® Banks Index for each quarter in the same period. The closing level of the EURO STOXX® Banks Index on December 11, 2019 was 93.54. We obtained the information in the table and graph below from Bloomberg Financial Markets without independent verification. You should not take the historical values of the EURO STOXX® Banks Index as an indication of its future performance, and no assurance can be given as to the closing level of the EURO STOXX® Banks Index on the Valuation Date.
For additional information about the EURO STOXX® Banks Index, see “EURO STOXX® Banks Index” in the accompanying underlying supplement.
|
EURO STOXX® Banks Index Daily Closing Levels January 2, 2014 to December 11, 2019 |
 |
| December 2019 | Page 21 |
PLUS Based on the Value of a Weighted Basket Consisting of Seven Basket Components due July 6, 2020
Performance Leveraged Upside SecuritiesSM
Principal at Risk Securities
| EURO STOXX® Banks Index | High | Low | Period End |
| 2014 | |||
| First Quarter | 156.58 | 139.31 | 155.26 |
| Second Quarter | 162.81 | 145.66 | 146.52 |
| Third Quarter | 154.60 | 135.67 | 149.21 |
| Fourth Quarter | 149.39 | 129.86 | 134.51 |
| 2015 | |||
| First Quarter | 158.53 | 124.29 | 157.65 |
| Second Quarter | 161.70 | 148.38 | 149.91 |
| Third Quarter | 161.45 | 128.04 | 131.34 |
| Fourth Quarter | 141.12 | 123.03 | 127.87 |
| 2016 | |||
| First Quarter | 125.04 | 89.65 | 101.38 |
| Second Quarter | 111.28 | 79.03 | 83.25 |
| Third Quarter | 99.11 | 78.37 | 92.54 |
| Fourth Quarter | 120.34 | 91.84 | 117.67 |
| 2017 | |||
| First Quarter | 127.52 | 111.98 | 127.52 |
| Second Quarter | 139.87 | 118.94 | 131.16 |
| Third Quarter | 139.91 | 127.83 | 138.38 |
| Fourth Quarter | 137.82 | 129.98 | 130.48 |
| 2018 | |||
| First Quarter | 143.05 | 123.72 | 125.69 |
| Second Quarter | 131.97 | 109.41 | 110.45 |
| Third Quarter | 116.73 | 104.16 | 106.55 |
| Fourth Quarter | 106.08 | 84.80 | 87.04 |
| 2019 | |||
| First Quarter | 98.51 | 86.61 | 93.25 |
| Second Quarter | 103.60 | 85.57 | 88.14 |
| Third Quarter | 92.04 | 77.45 | 87.70 |
| Fourth Quarter (through December 11, 2019) | 96.75 | 82.90 | 93.54 |
| December 2019 | Page 22 |
PLUS Based on the Value of a Weighted Basket Consisting of Seven Basket Components due July 6, 2020
Performance Leveraged Upside SecuritiesSM
Principal at Risk Securities
iShares® MSCI Emerging Markets ETF
We have derived all information contained herein regarding the iShares® MSCI Emerging Markets ETF from publicly available information. Such information reflects the policies of, and is subject to change by, BlackRock Fund Advisors, which maintains and manages the iShares® MSCI Emerging Markets ETF and acts as investment advisor to the iShares® MSCI Emerging Markets ETF. We have not conducted any independent review or due diligence of any publicly available information with respect to the iShares® MSCI Emerging Markets ETF. The iShares® MSCI Emerging Markets ETF is an exchange-traded fund that seeks to track the investment results of the MSCI Emerging Markets Index, which is designed to measure equity market performance in the global emerging markets.
iShares, Inc. is a registered investment company that consists of numerous separate investment portfolios, including the iShares® MSCI Emerging Markets ETF. Information filed by iShares, Inc. with the SEC under the Securities Exchange Act and the Investment Company Act can be found by reference to its SEC file numbers: 033-97598 and 811-09102. Shares of the iShares® MSCI Emerging Markets ETF are listed on the NYSE Arca under ticker symbol “EEM.” Information from outside sources is not incorporated by reference in, and should not be considered part of, this pricing supplement or any accompanying underlying supplement, product supplement, the prospectus supplement and the prospectus.
Information as of market close on December 11, 2019:
| Bloomberg Ticker Symbol: | EEM UP |
| Current Closing Level: | $43.68 |
| 52 Weeks Ago (on 12/12/2018): | $40.41 |
| 52 Week High (on 4/17/2019): | $44.59 |
| 52 Week Low (on 12/24/2018): | $38.16 |
The following graph sets forth the daily closing levels of the iShares® MSCI Emerging Markets ETF for the period from January 2, 2014 through December 11, 2019. The related table sets forth the published high and low closing levels, as well as end-of-quarter closing levels, of the iShares® MSCI Emerging Markets ETF for each quarter in the same period. The closing level of the iShares® MSCI Emerging Markets ETF on December 11, 2019 was $43.68. We obtained the information in the table and graph below from Bloomberg Financial Markets without independent verification. You should not take the historical values of the iShares® MSCI Emerging Markets ETF as an indication of its future performance, and no assurance can be given as to the closing level of the iShares® MSCI Emerging Markets ETF on the Valuation Date.
| December 2019 | Page 23 |
PLUS Based on the Value of a Weighted Basket Consisting of Seven Basket Components due July 6, 2020
Performance Leveraged Upside SecuritiesSM
Principal at Risk Securities
|
iShares® MSCI Emerging Markets ETF Daily Closing Levels January 2, 2014 to December 11, 2019 |
 |
| December 2019 | Page 24 |
PLUS Based on the Value of a Weighted Basket Consisting of Seven Basket Components due July 6, 2020
Performance Leveraged Upside SecuritiesSM
Principal at Risk Securities
| iShares® MSCI Emerging Markets ETF | High | Low | Period End |
| 2014 | |||
| First Quarter | $40.99 | $37.09 | $40.99 |
| Second Quarter | $43.95 | $40.82 | $43.23 |
| Third Quarter | $45.85 | $41.56 | $41.56 |
| Fourth Quarter | $42.44 | $37.73 | $39.29 |
| 2015 | |||
| First Quarter | $41.07 | $37.92 | $40.13 |
| Second Quarter | $44.09 | $39.04 | $39.62 |
| Third Quarter | $39.78 | $31.32 | $32.78 |
| Fourth Quarter | $36.29 | $31.55 | $32.19 |
| 2016 | |||
| First Quarter | $34.28 | $28.25 | $34.25 |
| Second Quarter | $35.26 | $31.87 | $34.36 |
| Third Quarter | $38.20 | $33.77 | $37.45 |
| Fourth Quarter | $38.10 | $34.08 | $35.01 |
| 2017 | |||
| First Quarter | $39.99 | $35.43 | $39.39 |
| Second Quarter | $41.93 | $38.81 | $41.39 |
| Third Quarter | $45.85 | $41.05 | $44.81 |
| Fourth Quarter | $47.81 | $44.82 | $47.12 |
| 2018 | |||
| First Quarter | $52.08 | $45.69 | $48.28 |
| Second Quarter | $48.14 | $42.33 | $43.33 |
| Third Quarter | $45.03 | $41.14 | $42.92 |
| Fourth Quarter | $42.93 | $38.00 | $39.06 |
| 2019 | |||
| First Quarter | $43.71 | $38.45 | $42.92 |
| Second Quarter | $44.59 | $39.91 | $42.91 |
| Third Quarter | $43.42 | $38.74 | $40.87 |
| Fourth Quarter (through December 11, 2019) | $44.08 | $40.27 | $43.68 |
| December 2019 | Page 25 |
PLUS Based on the Value of a Weighted Basket Consisting of Seven Basket Components due July 6, 2020
Performance Leveraged Upside SecuritiesSM
Principal at Risk Securities
SPDR® S&P® Oil & Gas Exploration & Production ETF
We have derived all information contained herein regarding the SPDR® S&P® Oil & Gas Exploration & Production ETF from publicly available information. Such information reflects the policies of, and is subject to change by, SSGA Funds Management, Inc., which maintains and manages the SPDR® S&P® Oil & Gas Exploration & Production ETF, and acts as investment advisor to the SPDR® S&P® Oil & Gas Exploration & Production ETF. We have not conducted any independent review or due diligence of any publicly available information with respect to the SPDR® S&P® Oil & Gas Exploration & Production ETF. The SPDR® S&P® Oil & Gas Exploration & Production ETF is an exchange-traded fund that seeks investment results that, before fees and expenses, correspond generally to the total return of the S&P Oil & Gas Exploration & Production Select Industry® Index, which measures the performance of the oil and gas exploration and production segment of the S&P® Total Market Index.
The SPDR® Series Trust is a registered investment company that consists of numerous separate investment portfolios, including the SPDR® S&P® Oil & Gas Exploration & Production ETF. Information filed by the SPDR® Series Trust with the SEC under the Securities Exchange Act and the Investment Company Act can be found by reference to its SEC file numbers: 333-57793 and 811-08839. Shares of the SPDR® S&P® Oil & Gas Exploration & Production ETF are listed on the NYSE Arca under ticker symbol “XOP.” Information from outside sources is not incorporated by reference in, and should not be considered part of, this pricing supplement or any accompanying underlying supplement, product supplement, the prospectus supplement and the prospectus.
Information as of market close on December 11, 2019:
| Bloomberg Ticker Symbol: | XOP UP |
| Current Closing Level: | $21.39 |
| 52 Weeks Ago (on 12/12/2018): | $30.63 |
| 52 Week High (on 4/22/2019): | $32.98 |
| 52 Week Low (on 12/3/2019): | $20.04 |
The following graph sets forth the daily closing levels of the SPDR® S&P® Oil & Gas Exploration & Production ETF for the period from January 2, 2014 through December 11, 2019. The related table sets forth the published high and low closing levels, as well as end-of-quarter closing levels, of the SPDR® S&P® Oil & Gas Exploration & Production ETF for each quarter in the same period. The closing level of the SPDR® S&P® Oil & Gas Exploration & Production ETF on December 11, 2019 was $21.39. We obtained the information in the table and graph below from Bloomberg Financial Markets without independent verification. You should not take the historical values of the SPDR® S&P® Oil & Gas Exploration & Production ETF as an indication of its future performance, and no assurance can be given as to the closing level of the SPDR® S&P® Oil & Gas Exploration & Production ETF on the Valuation Date.
| December 2019 | Page 26 |
PLUS Based on the Value of a Weighted Basket Consisting of Seven Basket Components due July 6, 2020
Performance Leveraged Upside SecuritiesSM
Principal at Risk Securities
|
SPDR® S&P® Oil & Gas Exploration & Production ETF Daily Closing Levels January 2, 2014 to December 11, 2019 |
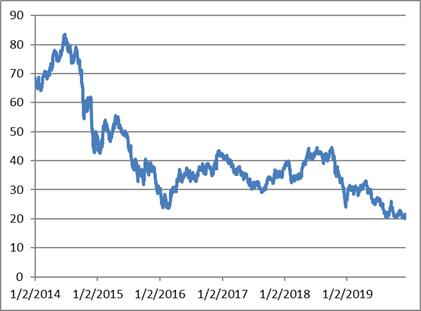 |
| December 2019 | Page 27 |
PLUS Based on the Value of a Weighted Basket Consisting of Seven Basket Components due July 6, 2020
Performance Leveraged Upside SecuritiesSM
Principal at Risk Securities
| SPDR® S&P® Oil & Gas Exploration & Production ETF | High | Low | Period End |
| 2014 | |||
| First Quarter | $71.83 | $64.04 | $71.83 |
| Second Quarter | $83.45 | $71.19 | $82.28 |
| Third Quarter | $82.08 | $68.83 | $68.83 |
| Fourth Quarter | $66.84 | $42.75 | $47.86 |
| 2015 | |||
| First Quarter | $53.94 | $42.55 | $51.66 |
| Second Quarter | $55.63 | $46.43 | $46.66 |
| Third Quarter | $45.22 | $31.71 | $32.84 |
| Fourth Quarter | $40.53 | $28.64 | $30.22 |
| 2016 | |||
| First Quarter | $30.96 | $23.60 | $30.35 |
| Second Quarter | $37.50 | $29.23 | $34.81 |
| Third Quarter | $39.12 | $32.75 | $38.46 |
| Fourth Quarter | $43.42 | $34.73 | $41.42 |
| 2017 | |||
| First Quarter | $42.21 | $35.17 | $37.44 |
| Second Quarter | $37.89 | $30.17 | $31.92 |
| Third Quarter | $34.37 | $29.09 | $34.09 |
| Fourth Quarter | $37.64 | $32.25 | $37.18 |
| 2018 | |||
| First Quarter | $39.85 | $32.38 | $35.22 |
| Second Quarter | $44.22 | $34.03 | $43.06 |
| Third Quarter | $44.52 | $39.10 | $43.29 |
| Fourth Quarter | $44.57 | $24.12 | $26.53 |
| 2019 | |||
| First Quarter | $31.61 | $27.10 | $30.74 |
| Second Quarter | $32.98 | $24.86 | $27.25 |
| Third Quarter | $27.20 | $20.60 | $22.36 |
| Fourth Quarter (through December 11, 2019) | $22.94 | $20.04 | $21.39 |
| December 2019 | Page 28 |
PLUS Based on the Value of a Weighted Basket Consisting of Seven Basket Components due July 6, 2020
Performance Leveraged Upside SecuritiesSM
Principal at Risk Securities
Tokyo Stock Price Index
The Tokyo Stock Price Index is a free float-adjusted market capitalization weighted index developed by the Tokyo Stock Exchange (“TSE”). The component stocks of the Tokyo Stock Price Index consists of all Japanese common stocks listed on the First Section of the TSE. The Tokyo Stock Price Index measures changes in the aggregate market value of these stocks. The component stocks are determined based on market capitalization and liquidity.
Information as of market close on December 11, 2019:
| Bloomberg Ticker Symbol: | TPX |
| Current Closing Level: | 1714.95 |
| 52 Weeks Ago (on 12/12/2018): | 1606.61 |
| 52 Week High (on 12/9/2019): | 1722.07 |
| 52 Week Low (on 12/25/2018): | 1415.55 |
The following graph sets forth the daily closing levels of the Tokyo Stock Price Index for the period from January 2, 2014 through December 11, 2019. The related table sets forth the published high and low closing levels, as well as end-of-quarter closing levels, of the Tokyo Stock Price Index for each quarter in the same period. The closing level of the Tokyo Stock Price Index on December 11, 2019 was 1714.95. We obtained the information in the table and graph below from Bloomberg Financial Markets without independent verification. You should not take the historical values of the Tokyo Stock Price Index as an indication of its future performance, and no assurance can be given as to the closing level of the Tokyo Stock Price Index on the Valuation Date.
|
Tokyo Stock Price Index Daily Closing Levels January 2, 2014 to December 11, 2019 |
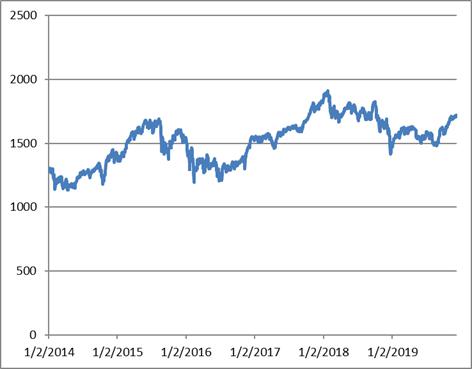 |
| December 2019 | Page 29 |
PLUS Based on the Value of a Weighted Basket Consisting of Seven Basket Components due July 6, 2020
Performance Leveraged Upside SecuritiesSM
Principal at Risk Securities
| Tokyo Stock Price Index | High | Low | Period End |
| 2014 | |||
| First Quarter | 1306.23 | 1139.27 | 1202.89 |
| Second Quarter | 1269.04 | 1132.76 | 1262.56 |
| Third Quarter | 1346.43 | 1228.26 | 1326.29 |
| Fourth Quarter | 1447.58 | 1177.22 | 1407.51 |
| 2015 | |||
| First Quarter | 1592.25 | 1357.98 | 1543.11 |
| Second Quarter | 1679.89 | 1528.99 | 1630.40 |
| Third Quarter | 1691.29 | 1375.52 | 1411.16 |
| Fourth Quarter | 1605.94 | 1442.74 | 1547.30 |
| 2016 | |||
| First Quarter | 1509.67 | 1196.28 | 1347.20 |
| Second Quarter | 1407.50 | 1204.48 | 1245.82 |
| Third Quarter | 1352.67 | 1209.88 | 1322.78 |
| Fourth Quarter | 1552.36 | 1301.16 | 1518.61 |
| 2017 | |||
| First Quarter | 1577.40 | 1506.33 | 1512.60 |
| Second Quarter | 1624.07 | 1459.07 | 1611.90 |
| Third Quarter | 1676.17 | 1590.71 | 1674.75 |
| Fourth Quarter | 1831.93 | 1673.62 | 1817.56 |
| 2018 | |||
| First Quarter | 1911.07 | 1664.94 | 1716.30 |
| Second Quarter | 1815.25 | 1703.80 | 1730.89 |
| Third Quarter | 1822.44 | 1676.20 | 1817.25 |
| Fourth Quarter | 1824.03 | 1415.55 | 1494.09 |
| 2019 | |||
| First Quarter | 1627.59 | 1471.16 | 1591.64 |
| Second Quarter | 1630.68 | 1498.96 | 1551.14 |
| Third Quarter | 1623.27 | 1478.03 | 1587.80 |
| Fourth Quarter (through December 11, 2019) | 1722.07 | 1568.87 | 1714.95 |
| December 2019 | Page 30 |
PLUS Based on the Value of a Weighted Basket Consisting of Seven Basket Components due July 6, 2020
Performance Leveraged Upside SecuritiesSM
Principal at Risk Securities
Materials Select Sector SPDR® Fund
We have derived all information contained herein regarding the Materials Select Sector SPDR® Fund from publicly available information. Such information reflects the policies of, and is subject to change by, SSgA Funds Management, Inc., which maintains and manages the Materials Select Sector SPDR® Fund and acts as investment advisor to the Materials Select Sector SPDR® Fund. We have not conducted any independent review or due diligence of any publicly available information with respect to the Materials Select Sector SPDR® Fund. The Materials Select Sector SPDR® Fund is an exchange-traded fund that seeks investment results that correspond generally to the price and yield performance, before fees and expenses, of the publicly traded equity securities in the Select Sector Materials Index.
The Select Sector SPDR Trust is a registered investment company that consists of eleven separate investment portfolios, including the Materials Select Sector SPDR® Fund. Information filed by the Select Sector SPDR Trust with the SEC under the Securities Exchange Act and the Investment Company Act can be found by reference to its SEC file numbers: 333-57791 and 811-08837. Shares of the Materials Select Sector SPDR® Fund are listed on the NYSE Arca under ticker symbol “XLB.” Information from outside sources is not incorporated by reference in, and should not be considered part of, this pricing supplement or the accompanying underlying supplement, the product supplement, the prospectus supplement and the prospectus.
Information as of market close on December 11, 2019:
| Bloomberg Ticker Symbol: | XLB UP |
| Current Closing Level: | $60.07 |
| 52 Weeks Ago (on 12/12/2018): | $52.33 |
| 52 Week High (on 11/14/2019): | $60.41 |
| 52 Week Low (on 12/24/2018): | $47.34 |
The following graph sets forth the daily closing levels of the Materials Select Sector SPDR® Fund for the period from January 2, 2014 through December 11, 2019. The related table sets forth the published high and low closing levels, as well as end-of-quarter closing levels, of the Materials Select Sector SPDR® Fund for each quarter in the same period. The closing level of the Materials Select Sector SPDR® Fund on December 11, 2019 was $60.07. We obtained the information in the table and graph below from Bloomberg Financial Markets without independent verification. You should not take the historical values of the Materials Select Sector SPDR® Fund as an indication of its future performance, and no assurance can be given as to the closing level of the Materials Select Sector SPDR® Fund on the Valuation Date.
| December 2019 | Page 31 |
PLUS Based on the Value of a Weighted Basket Consisting of Seven Basket Components due July 6, 2020
Performance Leveraged Upside SecuritiesSM
Principal at Risk Securities
|
Materials Select Sector SPDR® Fund Daily Closing Levels January 2, 2014 to December 11, 2019 |
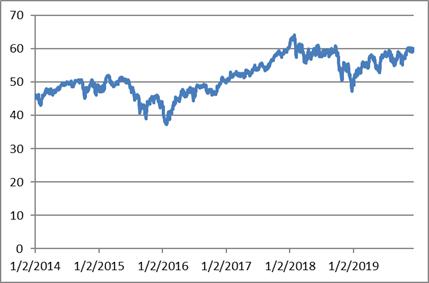 |
| December 2019 | Page 32 |
PLUS Based on the Value of a Weighted Basket Consisting of Seven Basket Components due July 6, 2020
Performance Leveraged Upside SecuritiesSM
Principal at Risk Securities
| Materials Select Sector SPDR® Fund | High | Low | Period End |
| 2014 | |||
| First Quarter | $48.00 | $43.01 | $47.28 |
| Second Quarter | $49.72 | $46.03 | $49.64 |
| Third Quarter | $50.69 | $48.65 | $49.59 |
| Fourth Quarter | $50.67 | $45.11 | $48.58 |
| 2015 | |||
| First Quarter | $52.09 | $46.99 | $48.78 |
| Second Quarter | $51.57 | $48.24 | $48.39 |
| Third Quarter | $48.66 | $38.95 | $39.92 |
| Fourth Quarter | $46.05 | $40.37 | $43.42 |
| 2016 | |||
| First Quarter | $45.44 | $37.30 | $44.81 |
| Second Quarter | $48.45 | $44.23 | $46.34 |
| Third Quarter | $49.36 | $45.52 | $47.75 |
| Fourth Quarter | $51.50 | $46.17 | $49.70 |
| 2017 | |||
| First Quarter | $53.27 | $49.99 | $52.41 |
| Second Quarter | $55.10 | $51.31 | $53.81 |
| Third Quarter | $56.87 | $53.48 | $56.80 |
| Fourth Quarter | $60.64 | $57.42 | $60.53 |
| 2018 | |||
| First Quarter | $64.09 | $55.87 | $56.94 |
| Second Quarter | $61.00 | $55.70 | $58.07 |
| Third Quarter | $60.98 | $57.65 | $57.93 |
| Fourth Quarter | $58.76 | $47.34 | $50.52 |
| 2019 | |||
| First Quarter | $56.14 | $49.34 | $55.50 |
| Second Quarter | $58.50 | $52.75 | $58.50 |
| Third Quarter | $59.46 | $54.95 | $58.20 |
| Fourth Quarter (through December 11, 2019) | $60.41 | $55.13 | $60.07 |
| December 2019 | Page 33 |
PLUS Based on the Value of a Weighted Basket Consisting of Seven Basket Components due July 6, 2020
Performance Leveraged Upside SecuritiesSM
Principal at Risk Securities
The Basket
The following tables and graph are calculated to show the performance of the basket during the period from January 2, 2014 through December 11, 2019, assuming the Basket Components were equally weighted such that the Initial Basket Level was 100 on December 11, 2019.
Information as of market close on December 11, 2019:
| Current Closing Level: | 100 |
| 52 Weeks Ago (on 12/12/2018): | 93.30 |
| 52 Week High (on 4/17/2019): | 100.79 |
| 52 Week Low (on 12/25/2018): | 85.78 |
The second table sets forth the high and low closing levels, as well as end-of-quarter closing levels, of the Basket for each quarter in the same period. We obtained the information in the table and graph below from Bloomberg Financial Markets without independent verification. You should not take the historical values of the Basket as an indication of its future performance, and no assurance can be given as to the closing level of the Basket on the Valuation Date.
|
Basket Daily Closing Levels January 2, 2014 to December 11, 2019 |
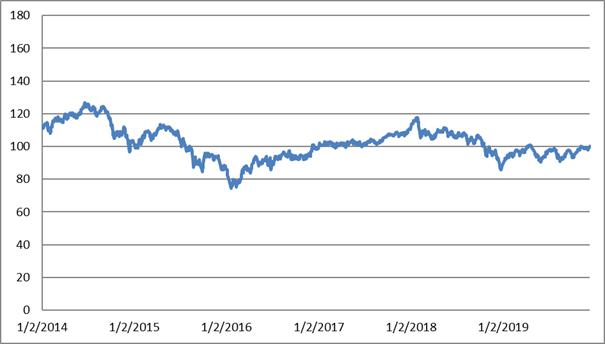 |
| December 2019 | Page 34 |
PLUS Based on the Value of a Weighted Basket Consisting of Seven Basket Components due July 6, 2020
Performance Leveraged Upside SecuritiesSM
Principal at Risk Securities
| Basket | High | Low | Period End |
| 2014 | |||
| First Quarter | 118.60 | 108.01 | 118.60 |
| Second Quarter | 126.58 | 116.62 | 125.34 |
| Third Quarter | 125.96 | 114.14 | 114.14 |
| Fourth Quarter | 114.14 | 96.78 | 102.57 |
| 2015 | |||
| First Quarter | 109.45 | 98.88 | 108.66 |
| Second Quarter | 113.62 | 104.64 | 104.73 |
| Third Quarter | 104.85 | 84.63 | 86.88 |
| Fourth Quarter | 95.82 | 85.57 | 86.88 |
| 2016 | |||
| First Quarter | 88.06 | 74.25 | 85.56 |
| Second Quarter | 94.07 | 83.69 | 91.01 |
| Third Quarter | 97.33 | 89.05 | 94.43 |
| Fourth Quarter | 100.96 | 92.01 | 98.74 |
| 2017 | |||
| First Quarter | 103.07 | 99.13 | 101.93 |
| Second Quarter | 103.91 | 99.38 | 101.23 |
| Third Quarter | 106.50 | 100.91 | 106.50 |
| Fourth Quarter | 110.66 | 106.11 | 110.29 |
| 2018 | |||
| First Quarter | 117.81 | 104.33 | 106.19 |
| Second Quarter | 111.35 | 104.77 | 106.33 |
| Third Quarter | 108.53 | 101.41 | 105.45 |
| Fourth Quarter | 105.62 | 85.78 | 87.77 |
| 2019 | |||
| First Quarter | 98.20 | 90.40 | 98.20 |
| Second Quarter | 100.79 | 90.45 | 97.41 |
| Third Quarter | 98.99 | 91.01 | 94.47 |
| Fourth Quarter (through December 11, 2019) | 100.25 | 93.25 | 100 |
| December 2019 | Page 35 |
PLUS Based on the Value of a Weighted Basket Consisting of Seven Basket Components due July 6, 2020
Performance Leveraged Upside SecuritiesSM
Principal at Risk Securities
United States Federal Tax Considerations
This discussion supplements and, to the extent inconsistent therewith, supersedes the discussion in the accompanying product supplement under “Material United States Federal Income Tax Considerations.”
There are no statutory, judicial or administrative authorities that address the U.S. federal income tax treatment of the securities or instruments that are similar to the securities. In the opinion of our counsel, Davis Polk & Wardwell LLP, a security should be treated as a prepaid financial contract that is an “open transaction” for U.S. federal income tax purposes. However, there is uncertainty regarding this treatment. Moreover, our counsel’s opinion is based on market conditions as of the date of this preliminary pricing supplement and is subject to confirmation on the Trade Date.
Assuming this treatment of the securities is respected and subject to the discussion in “Material United States Federal Income Tax Considerations” in the accompanying product supplement, the following U.S. federal income tax consequences should result:
| § | You should not recognize taxable income over the term of the securities prior to maturity, other than pursuant to a sale or other disposition. |
| § | Upon a sale or other disposition (including retirement) of a security, you should recognize capital gain or loss equal to the difference between the amount realized and your tax basis in the security. Such gain or loss should be short-term capital gain or loss. |
We do not plan to request a ruling from the IRS regarding the treatment of the securities, and the IRS or a court might not agree with the treatment described herein. In particular, the IRS could treat the securities as short-term debt instruments, in which case the tax consequences of ownership and disposition of the securities, including the timing and character of income recognized, could be materially and adversely affected. Moreover, the U.S. Treasury Department and the IRS have requested comments on various issues regarding the U.S. federal income tax treatment of “prepaid forward contracts” and similar financial instruments and have indicated that such transactions may be the subject of future regulations or other guidance. In addition, members of Congress have proposed legislative changes to the tax treatment of derivative contracts. Any legislation, Treasury regulations or other guidance promulgated after consideration of these issues could materially and adversely affect the tax consequences of an investment in the securities, possibly with retroactive effect. You should consult your tax advisor regarding possible alternative tax treatments of the securities and potential changes in applicable law.
Non-U.S. Holders. Subject to the discussions in the next paragraph and in “Material United States Federal Income Tax Considerations” in the accompanying product supplement, if you are a Non-U.S. Holder (as defined in the accompanying product supplement) of the securities, you generally should not be subject to U.S. federal withholding or income tax in respect of any amount paid to you with respect to the securities, provided that (i) income in respect of the securities is not effectively connected with your conduct of a trade or business in the United States, and (ii) you comply with the applicable certification requirements.
As discussed under “Material United States Federal Income Tax Considerations—Non-U.S. Holders Generally—Substitute Dividend and Dividend Equivalent Payments” in the accompanying product supplement, Section 871(m) of the Internal Revenue Code generally imposes a 30% withholding tax on “dividend equivalents” paid or deemed paid to Non-U.S. Holders with respect to certain financial instruments linked to U.S. equities or indices that include U.S. equities. Treasury regulations under Section 871(m), as modified by an IRS notice, exclude from their scope financial instruments issued prior to January 1, 2021 that do not have a “delta” of one with respect to any U.S. equity. Based on the terms of the securities and representations provided by us as of the date of this preliminary pricing supplement, our counsel is of the opinion that the securities should not be treated as transactions that have a “delta” of one within the meaning of the regulations with respect to any U.S. equity and, therefore, should not be subject to withholding tax under Section 871(m). However, the final determination regarding the treatment of the securities under Section 871(m) will be made as of the Trade Date for the securities and it is possible that the securities will be subject to withholding tax under Section 871(m) based on circumstances on that date.
A determination that the securities are not subject to Section 871(m) is not binding on the IRS, and the IRS may disagree with this determination. Moreover, Section 871(m) is complex and its application may depend on your particular
| December 2019 | Page 36 |
PLUS Based on the Value of a Weighted Basket Consisting of Seven Basket Components due July 6, 2020
Performance Leveraged Upside SecuritiesSM
Principal at Risk Securities
circumstances, including whether you enter into other transactions with respect to a U.S. equity to which the securities relate. You should consult your tax advisor regarding the potential application of Section 871(m) to the securities.
If withholding tax applies to the securities, we will not be required to pay any additional amounts with respect to amounts withheld.
FATCA. You should review the section entitled "Material United States Federal Income Tax Considerations—Securities Held Through Foreign Entities" in the accompanying product supplement regarding withholding rules under the “FATCA” regime. The discussion in that section is hereby modified to reflect regulations proposed by the U.S. Treasury Department indicating an intent to eliminate the requirement under FATCA of withholding on gross proceeds of the disposition of affected financial instruments. The U.S. Treasury Department has indicated that taxpayers may rely on these proposed regulations pending their finalization.
You should read the section entitled “Material United States Federal Income Tax Considerations” in the accompanying product supplement. The preceding discussion, when read in combination with that section, constitutes the full opinion of Davis Polk & Wardwell LLP regarding the material U.S. federal tax consequences of owning and disposing of the securities.
You should also consult your tax advisor regarding all aspects of the U.S. federal income and estate tax consequences of an investment in the securities and any tax consequences arising under the laws of any state, local or non-U.S. taxing jurisdiction.
| December 2019 | Page 37 |
PLUS Based on the Value of a Weighted Basket Consisting of Seven Basket Components due July 6, 2020
Performance Leveraged Upside SecuritiesSM
Principal at Risk Securities
Supplemental Plan of Distribution
Under the terms and subject to the conditions contained in a distribution agreement dated May 7, 2007, as amended, which we refer to as the distribution agreement, we have agreed to sell the securities to CSSU. The distribution agreement provides that CSSU is obligated to purchase all of the securities if any are purchased.
CSSU may offer the securities at the offering price set forth on the cover page of this pricing supplement and may receive varying underwriting discounts and commissions of up to $0.175 per $10 principal amount of securities. MSSB and its financial advisors will collectively receive from CSSU varying discounts and commissions of up to $0.175 for each security they sell, of which $0.05 per $10 principal amount of securities reflects a structuring fee. CSSU may reallow some or all of the discount on the principal amount per security on sales of such securities by other brokers or dealers. If all of the securities are not sold at the initial offering price, CSSU may change the public offering price and other selling terms.
An affiliate of Credit Suisse has paid or may pay in the future a fixed amount to broker dealers in connection with the costs of implementing systems to support these securities.
We expect to deliver the securities against payment for the securities on the Settlement Date indicated herein, which may be a date that is greater than two business days following the Trade Date. Under Rule 15c6-1 of the Securities Exchange Act of 1934, as amended, trades in the secondary market generally are required to settle in two business days, unless the parties to a trade expressly agree otherwise. Accordingly, if the Settlement Date is more than two business days after the Trade Date, purchasers who wish to transact in the securities more than two business days prior to the Settlement Date will be required to specify alternative settlement arrangements to prevent a failed settlement.
The agent for this offering, CSSU, is our affiliate. In accordance with FINRA Rule 5121, CSSU may not make sales in this offering to any of its discretionary accounts without the prior written approval of the customer. A portion of the net proceeds from the sale of the securities will be used by CSSU or one of its affiliates in connection with hedging our obligations under the securities.
For further information, please refer to “Underwriting (Conflicts of Interest)” in any accompanying product supplement.
| December 2019 | Page 38 |
Create E-mail Alert Related Categories
SEC FilingsRelated Entities
Credit SuisseSign up for StreetInsider Free!
Receive full access to all new and archived articles, unlimited portfolio tracking, e-mail alerts, custom newswires and RSS feeds - and more!