



LendingTree Analysis Reveals Where Homebuyers are Stretching to Buy
New LendingTree study ranks metros by how far borrowers stretch their budgets to buy a home
 Tweet
Tweet Share
Share E-mail
CHARLOTTE, N.C., Sept. 6, 2018 /PRNewswire/ -- LendingTree®, the nation's leading online loan marketplace, today released a study on where homebuyers are stretching the most to buy a home.
A well-known rule of thumb says that the home price should not exceed three times the buyer's annual income. When a mortgage is used to buy a house, the ratio of amount borrowed to income is the extent to which a borrower is leveraged. This study compares leverage ratios across cities to see where borrowers are stretching the most to purchase a home.
The study used Home Mortgage Disclosure Act (HMDA) data that includes over 7 million mortgages originated in 2017 to calculate the leverage rate of borrowers in the 50 largest cities in America. The median amount borrowed was divided by the median borrower income for all purchases in the HMDA database for 2017.
"Home prices continue to reach new highs, with the most recent data showing prices for existing homes at a median of $276,900 in June; new homes are even more expensive at a median of $302,100," said Tendayi Kapfidze, Chief Economist and report author. "The annual increase in home prices has been outpacing income growth since 2012. As a result, homebuyers have been stretching more and more to purchase their dream homes. Low interest rates have masked this to some extent, as they have subdued the monthly payment, but the recent increase in interest has reduced this mitigating factor."
Kapfidze continued, "Historical data shows that nationally leverage ratios increased from 2.30 in 2014 to 2.56 in 2017 as home prices rose faster than incomes. To rank the cities, we calculated leverage ratios that show how the median homebuyer in each city fared. However, each borrower is unique, and their homebuying capacity depends on additional factors including credit scores, other debt currently held and down payment."
Key findings
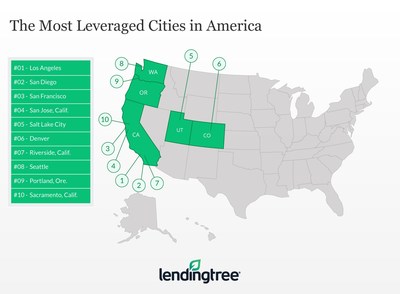
- California is known for its high home prices and high incomes. Unfortunately, the tech boom is not enriching everyone with cash, and 6 of the top 10 cities are in the Golden State, including the top four (Los Angeles, San Diego, San Francisco, and San Jose).
- Los Angeles leads the way for stretched buyers, with the median homebuyer with a mortgage borrowing 3.75 times their annual income.
- San Diego has similar income to Los Angeles, but cheaper homes give it the second highest leverage ratio of 3.62.
- Home prices are much higher in the Bay Area cities which rank 3 and 4 for stretched borrowers, but higher incomes provide some relief and leverage ratios are 3.52 and 3.50 for San Francisco and San Jose.
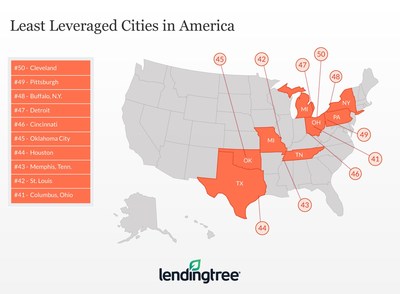
- The more affordable cities are clustered in the Rust Belt and southern U.S. states. Pittsburgh and Cleveland have the lowest leverage ratios at just 2.00 times annual income.
- Houston is the largest city in the bottom 10 and has the highest loan amounts of the affordable cities. High incomes driven by the energy and health care sectors helps it to a benign leverage ratio of 2.17.
The Most Stretched Homebuyers in America
#1 Los AngelesLeverage ratio: 3.75Median mortgage amount: $461,000 Median borrower income: $123,000
#2 San DiegoLeverage ratio: 3.62Median mortgage amount: $442,000 Median borrower income: $122,000
#3 San FranciscoLeverage ratio: 3.52Median mortgage amount: $845,000 Median borrower income: $240,000
The Least Stretched Homebuyers in America
#48 Buffalo, N.Y.Leverage ratio: 2.03Median mortgage amount: $136,000 Median borrower income: $67,000
#49 PittsburghLeverage ratio: 2.00Median mortgage amount: $152,000 Median borrower income: $76,000
#50 ClevelandLeverage ratio: 2.00Median mortgage amount: $142,000 Median borrower income: $71,000
To view the full report, visit: https://www.lendingtree.com/home/most-stretched-homebuyers-in-america/.
|
Top 50 cities ranked by leverage ratio | ||||
|
Rank |
City |
Median Loan Amount |
Median Applicant Income |
Leverage Ratio |
|
1 |
Los Angeles |
$ 461,000 |
$ 123,000 |
3.75 |
|
2 |
San Diego |
$ 442,000 |
$ 122,000 |
3.62 |
|
3 |
San Francisco |
$ 845,000 |
$ 240,000 |
3.52 |
|
4 |
San Jose, Calif. |
$ 648,000 |
$ 185,000 |
3.50 |
|
5 |
Salt Lake City |
$ 249,000 |
$ 72,000 |
3.46 |
|
6 |
Denver |
$ 320,000 |
$ 95,000 |
3.37 |
|
7 |
Riverside, Calif. |
$ 292,000 |
$ 87,000 |
3.36 |
|
8 |
Seattle |
$ 409,000 |
$ 123,000 |
3.33 |
|
9 |
Portland, Ore. |
$ 309,000 |
$ 95,000 |
3.25 |
|
10 |
Sacramento, Calif. |
$ 315,000 |
$ 98,000 |
3.21 |
|
11 |
Washington |
$ 357,000 |
$ 112,000 |
3.19 |
|
12 |
Boston |
$ 374,000 |
$ 118,000 |
3.17 |
|
13 |
Las Vegas |
$ 232,000 |
$ 74,000 |
3.14 |
|
14 |
Miami |
$ 268,000 |
$ 86,000 |
3.12 |
|
15 |
Virginia Beach, Va. |
$ 225,000 |
$ 73,000 |
3.08 |
|
16 |
New York |
$ 358,000 |
$ 120,000 |
2.98 |
|
17 |
Baltimore |
$ 270,000 |
$ 92,000 |
2.93 |
|
18 |
Nashville, Tenn. |
$ 231,000 |
$ 79,000 |
2.92 |
|
19 |
Providence, R.I. |
$ 230,000 |
$ 79,000 |
2.91 |
|
20 |
Phoenix |
$ 221,000 |
$ 76,000 |
2.91 |
|
21 |
Orlando, Fla. |
$ 216,000 |
$ 77,000 |
2.81 |
|
22 |
Richmond, Va. |
$ 214,000 |
$ 77,000 |
2.78 |
|
23 |
Minneapolis |
$ 217,000 |
$ 81,000 |
2.68 |
|
24 |
Jacksonville, Fla. |
$ 195,000 |
$ 73,000 |
2.67 |
|
25 |
Tampa, Fla. |
$ 192,000 |
$ 73,000 |
2.63 |
|
26 |
Atlanta |
$ 206,000 |
$ 79,000 |
2.61 |
|
27 |
Charlotte, N.C. |
$ 204,000 |
$ 79,000 |
2.58 |
|
28 |
Raleigh, N.C. |
$ 233,000 |
$ 91,000 |
2.56 |
|
29 |
Philadelphia |
$ 192,000 |
$ 75,000 |
2.56 |
|
30 |
Chicago |
$ 221,000 |
$ 88,000 |
2.51 |
|
31 |
Birmingham, Ala. |
$ 170,000 |
$ 68,000 |
2.50 |
|
32 |
New Orleans |
$ 195,000 |
$ 79,000 |
2.47 |
|
33 |
San Antonio |
$ 201,000 |
$ 82,000 |
2.45 |
|
34 |
Hartford, Conn. |
$ 196,000 |
$ 80,000 |
2.45 |
|
35 |
Louisville, Ky. |
$ 154,000 |
$ 63,000 |
2.44 |
|
36 |
Austin, Texas |
$ 246,000 |
$ 104,000 |
2.37 |
|
37 |
Dallas |
$ 244,000 |
$ 104,000 |
2.35 |
|
38 |
Kansas City, Mo. |
$ 179,000 |
$ 78,000 |
2.29 |
|
39 |
Indianapolis |
$ 160,000 |
$ 71,000 |
2.25 |
|
40 |
Milwaukee |
$ 183,000 |
$ 82,000 |
2.23 |
|
41 |
Columbus, Ohio |
$ 176,000 |
$ 79,000 |
2.23 |
|
42 |
St.Louis |
$ 162,000 |
$ 74,000 |
2.19 |
|
43 |
Memphis, Tenn. |
$ 166,000 |
$ 76,000 |
2.18 |
|
44 |
Houston |
$ 208,000 |
$ 96,000 |
2.17 |
|
45 |
Oklahoma, City |
$ 155,000 |
$ 72,000 |
2.15 |
|
46 |
Cincinnati |
$ 157,000 |
$ 73,000 |
2.15 |
|
47 |
Detroit |
$ 135,000 |
$ 66,000 |
2.05 |
|
48 |
Buffalo, N.Y. |
$ 136,000 |
$ 67,000 |
2.03 |
|
49 |
Pittsburgh |
$ 152,000 |
$ 76,000 |
2.00 |
|
50 |
Cleveland |
$ 142,000 |
$ 71,000 |
2.00 |
About LendingTreeLendingTree (NASDAQ: TREE) is the nation's leading online marketplace that connects consumers with the choices they need to be confident in their financial decisions. LendingTree empowers consumers to shop for financial services the same way they would shop for airline tickets or hotel stays, comparing multiple offers from a nationwide network of over 500 partners in one simple search, and can choose the option that best fits their financial needs. Services include mortgage loans, mortgage refinances, auto loans, personal loans, business loans, student refinances, credit cards and more. Through the My LendingTree platform, consumers receive free credit scores, credit monitoring and recommendations to improve credit health. My LendingTree proactively compares consumers' credit accounts against offers on our network, and notifies consumers when there is an opportunity to save money. In short, LendingTree's purpose is to help simplify financial decisions for life's meaningful moments through choice, education and support. LendingTree, LLC is a subsidiary of LendingTree, Inc. For more information, go to www.lendingtree.com, dial 800-555-TREE, like our Facebook page and/or follow us on Twitter @LendingTree.
MEDIA CONTACT:Megan Greuling704-943-8208[email protected]

 View original content with multimedia:http://www.prnewswire.com/news-releases/lendingtree-analysis-reveals-where-homebuyers-are-stretching-to-buy-300708115.html
SOURCE LendingTree
Serious News for Serious Traders! Try StreetInsider.com Premium Free!
You May Also Be Interested In
- Hilton Grand Vacations approves new $600M share repurchase plan
- Ipsen completes acquisition of Kartos Therapeutics, strengthening late-stage Oncology pipeline
- Reigniting the Romance of the Night: AVIDLOVE “Feel Every Spark” Unveils the Intimate Code for Date Night
Create E-mail Alert Related Categories
Press ReleasesRelated Entities
TwitterSign up for StreetInsider Free!
Receive full access to all new and archived articles, unlimited portfolio tracking, e-mail alerts, custom newswires and RSS feeds - and more!
