



INRIX: Remote and Hybrid Work Shift Can't Curb Congestion
 Tweet
Tweet Share
Share E-mail
New York City (101 hours) topped the 2023 Global Traffic Scorecard, followed byMexico City andLondon .- Americans lost an average of 42 hours to congestion, up 11% from 2022, costing
$733 per driver. - Midday trips in the
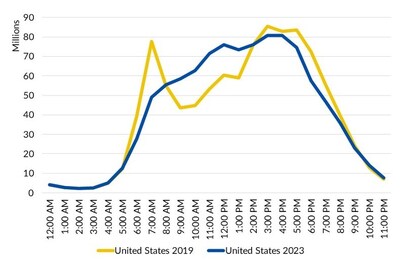
U.S. have increased 23% compared to 2019, with nearly as many trips taken at12:00 PM as there are at5:00 PM . - Trip analysis indicates
10:00 AM to 4:00 PM is the new '9-to-5.' - The most congested road in America was
Orlando's I-4 Westbound fromBeachline Expressway toWestern Beltway , followedLA's I-5 ,I-95 inStamford , andNew York's I-278 .
"Traffic congestion is both a bane and a barometer of economic health; it symbolizes bustling activity yet simultaneously hampers it," said
America's Gridlock is Worse Than Ever
Table 1: 10 Most Congested Urban Areas in the
2023 US | 2023 | Compared | 2023 | 2023 | Downtown | Q1 2024 | |
1 (1) | 101 (105) | 11 % | 11 | -11 % | |||
2 (2) | 96 (87) | 18 % | 11 | -8 % | |||
3 (3) | 89 (78) | -4 % | 19 | -5 % | |||
4 (4) | 88 (78) | -1 % | 10 | -10 % | |||
5 (6) | 70 (66) | 18 % | 14 | -1 % | |||
6 (5) | 69 (67) | 2 % | 11 | -9 % | |||
7 (8) | 63 (52) | -9 % | 11 | -4 % | |||
8 (7) | 62 (55) | 1 % | 17 | -1 % | |||
9 (9) | 61 (51) | -3 % | 16 | -4 % | |||
10 (12) | 58 (46) | -11 % | 17 | -1 % |
In addition to being the most congested urban area,
A New Midday Rush Hour
The uptick in congestion comes alongside the emergence of a new phenomenon: the midday rush hour. As Graph 1 illustrates, morning hourly commute trips in 2023 were down about 12% compared to 2019 and the PM peak (
Overall, the data shows that per hour, nearly the same number of trips start during the midday as the evening commute period, typically the most congested period of the day.
The Most Congested Corridors in the
Across
In
Table 1:
Rank | Urban Area | Road Name | From | To | Peak Hour | 2023 Peak | 2023 |
1 | I-4 W | Beachline Expy | Western Bltwy | 5:00 PM | 31 | 124 | |
2 | Los Angeles, CA | I-5 S | 5:00 PM | 31 | 122 | ||
3 | I-95 N | Sherwood Isl Conn | Warren St | 4:00 PM | 29 | 116 | |
4 | I-95 S | Compo Road S | Indian Field Rd | 8:00 AM | 28 | 111 | |
5 | New York, NY | I-278 W | Tillary St | 4:00 PM | 21 | 82 | |
6 | Miami, FL | I-95 N | NW 46th St | NW 151st St | 5:00 PM | 20 | 82 |
7 | I-93 S | Zakim Bridge | Pilgrim's Hwy | 3:00 PM | 20 | 81 | |
8 | Baton Rouge, LA | I-10 E | N Lobdell Hwy | 4:00 PM | 17 | 70 | |
9 | I-95 N | Indian Field Rd | Compo Road S | 5:00 PM | 17 | 68 | |
10 | I-94 E | 4:00 PM | 17 | 66 |
Congestion Climbs Worldwide
Table 2: 10 Most Congested Cities in the World in 2023
2023 | Urban Area | Country | 2023 Delay | Change from | Change | Downtown | Q1 |
1 (1) |
| 101 | -4 % | 11 % | 11 | -11 % | |
2 (4) | MEX | 96 | 13 % | -11 % | 12 | -5 % | |
3 (2) | 99 | 2 % | 3 % | 10 | -10 % | ||
4 (3) | FRA | 97 | 4 % | 1 % | 10 | -3 % | |
5 (5) | 96 | 10 % | 18 % | 11 | -8 % | ||
6 (6) | TUR | 91 | 12 % | 20 % | 13 | 5 % | |
7 (7) | 89 | 13 % | -4 % | 19 | -5 % | ||
8 (8) | 88 | 14 % | -1 % | 10 | -10 % | ||
9 (13) | ZAF | 83 | 32 % | -10 % | 12 | 7 % | |
10 (16) | IDN | 65 | 33 % | -24 % | 13 | 16 % |
The Road to Combatting Congestion
Access to reliable data is the first step in tackling congestion. Applying big data to create intelligent transportation systems is key to solving urban mobility problems. INRIX data and analytics on mobility, traffic signals, parking and population movement help city planners and engineers make data-based decisions to prioritize spending to maximize benefits and reduce costs now and into the future.
The key findings of the INRIX 2023 Global Traffic Scorecard provide a quantifiable benchmark for governments and cities across the world to measure progress to improve urban mobility and track the impact of spending on smart city initiatives.
Please visit www.inrix.com/scorecard for:
- Full 2023 Global Traffic Scorecard report
- Interactive webpage with data and information for nearly 1,000 cities and 37 countries
- Complete methodology
Notes to Editors:
Data Sources
INRIX aggregates anonymous data from diverse datasets – such as phones, cars, trucks and cities – that leads to robust and accurate insights. The data used in the 2023 Global Traffic Scorecard is the congested or uncongested status of every segment of road for every minute of the day, as used by millions of drivers around the world that rely on INRIX-based traffic services.
Data used to complete the 2023 Scorecard and Q1 Update spans more than 15 months. The Scorecard incorporated three years of historical data to provide a complete year-over-year comparison of congestion and mobility. A multi-year approach enables the identification of trends in the world's largest urban areas and provides a basis for comparison.
Research Methodology
The 2023 Global Traffic Scorecard provides the most up-to-date methodology to better understand movement in urban areas across the world. The 2023 Scorecard continues to include travel delay comparisons, collision trends and last-mile speeds based on the unique commuting patterns within each metro area, yet the latest origin-and-destination patterns accommodate the latest commuting behavior shifts.
Commute times were calculated by looking exclusively at the time it takes to get to and from major employment centers within an urban area from surrounding commuting neighborhoods. Our newest methodology, updated for this Scorecard, more accurately estimates commute distance using actual, observed trips. In general, this has placed downward pressure on commuting delays versus prior Scorecards, as observed trips tended to be shorter than previously estimated.
These changes were run for the years 2019, 2022 and 2023, along with the Q1 Update provided in this document. Q1 update is a special update for this version of the Global Traffic Scorecard and measures the change in average peak period travel times between January-
Economic costs are calculated based on the following hourly values of time, which were based on U.S. Federal Highway Administration's Revised Departmental Guidance on Valuation of Travel Time for Economic Analysis, 2016. Adjusted for inflation, the rates are the following:
The 2023 Scorecard values time lost by analyzing peak speed and free-flow speed data for the busiest commuting corridors and sub areas as identified by origin and destination patterns unique to that area. Total time lost is the difference in travel times experienced during the peak periods compared to free-flow conditions on a per driver basis. In other words, it is the difference between driving during commute hours versus driving at night with little traffic.
About INRIX
Founded in 2004, INRIX pioneered intelligent mobility solutions by transforming big data from connected devices and vehicles into mobility insights. For nearly two decades, INRIX has harnessed machine learning and artificial intelligence to deliver precise and actionable mobility data. This revolutionary approach enabled INRIX to become one of the leading providers of data and analytics into how people move. By empowering cities, businesses, and people with valuable insights, INRIX is helping to make the world smarter, safer, and greener. With partners and solutions spanning across the entire mobility ecosystem, INRIX is uniquely positioned at the intersection of technology and transportation – whether its keeping road users safe, improving traffic signal timing to reduce delay and greenhouse gasses, optimizing last-mile delivery, or helping uncover market insights. Learn more at INRIX.com.

 View original content to download multimedia:https://www.prnewswire.com/news-releases/inrix-remote-and-hybrid-work-shift-cant-curb-congestion-302181067.html
SOURCE INRIX, Inc.
Serious News for Serious Traders! Try StreetInsider.com Premium Free!
You May Also Be Interested In
- Last-Minute Apparel Delivery (2026): Same-Day Options for Outfits, Shoes, and Event Essentials by Consumer365
- Last Chance to Join the Apeing Whitelist Before This Upcoming Crypto Coin Rivals Monero and Ethereum
- Monad Price Prediction Hits a Wall While Smart Wallets Rush Into the Pepeto Presale
Create E-mail Alert Related Categories
PRNewswire, Press ReleasesSign up for StreetInsider Free!
Receive full access to all new and archived articles, unlimited portfolio tracking, e-mail alerts, custom newswires and RSS feeds - and more!
