




Griffin Capital Essential Asset REIT Reports 2019 Second Quarter Results

FREE Breaking News Alerts from StreetInsider.com!
StreetInsider.com Top Tickers, 10/16/2026
- S&P 500 ends higher as traders shift from AI to healthcare
- U.S. producer prices rise by 1.3% month-on-month in September
- Brent steady as US weighs easing sanctions on global 'shadow fleet'
- UBS now expects a third Fed rate hike after hot September inflation print
- Tesla-SpaceX Merger could be announced before December, Barclays says
 Tweet
Tweet Share
Share E-mail
Total Revenue Increased 20 Percent from Second Quarter 2018
New and Renewal Lease Activity Totaling Nearly One Million Square Feet
EL SEGUNDO, Calif.--(BUSINESS WIRE)-- Griffin Capital Essential Asset REIT, Inc. (the “REIT”) announced its results for the quarter ended June 30, 2019. The REIT reported a 20 percent increase in total revenue and a 16 percent increase in AFFO compared to the quarter ended June 30, 2018. Such performance was supported by the recently completed merger announced May 1, 2019, which created a $4.7 billion self-managed REIT and generated significant benefits for shareholders, including substantial cost savings, increased operating efficiencies, and immediate accretion to earnings and cash flows.
This press release features multimedia. View the full release here: https://www.businesswire.com/news/home/20190815005597/en/
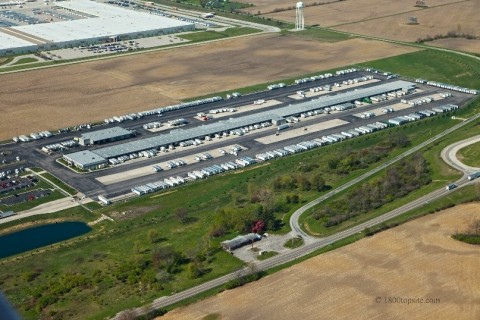
Griffin Capital Essential Asset REIT Reports 2019 Second Quarter Results (Photo: Business Wire)
“The second quarter of 2019 is our first opportunity to demonstrate the financial benefits the REIT is experiencing as a result of the merger,” said Michael Escalante, Chief Executive Officer, of the REIT. “The REIT is now self-managed, resulting in a significant reduction in general and administrative expenses as it is no longer subject to asset management fees, performance fees, and other costs typically incurred by externally-managed REITs.”
Escalante also noted, “In addition to the merger transaction, the REIT’s strong results reflect the continued success of our asset management team in maximizing the value of the REIT’s properties, specifically the execution of almost one million square feet of new and renewed leases.”
During the quarter ended June 30, 2019, the REIT executed new and renewal leases totaling 462,545 and 431,712 square feet, respectively, which included the execution of a new 12-year lease with a Fortune 100 company.
As of June 30, 2019, the REIT’s portfolio(1) consisted of 101 assets encompassing approximately 27.2 million rentable square feet of space in 25 states.
Highlights and Accomplishments in Second Quarter 2019 and Results as of June 30, 2019:
Merger Transaction
- On April 30, 2019, we announced the completion of the merger with the entity formerly known as Griffin Capital Essential Asset REIT, Inc. (“EA-1”). The merger created a $4.7 billion, self-managed REIT, and is generating significant benefits for shareholders, including substantial cost savings, increased operating efficiencies, and immediate accretion to earnings and cash flows.
Portfolio Overview
- The market capitalization of our portfolio as of June 30, 2019 was $4.7 billion(2).
- Our weighted average remaining lease term was approximately 7.6 years with average annual rent increases of approximately 2.2%.
- Our portfolio was 96.3% leased.
- Approximately 64.9% of our portfolio’s net rental revenue(3) was generated by properties leased to tenants and/or guarantors with investment grade credit ratings or whose non-guarantor parent companies have investment grade credit ratings (4).
- The ratio of debt to total real estate acquisition price and debt to total market capitalization as of June 30, 2019 was 45.9% and 41.4%, respectively (1).
Financial Results
- Total revenue was $103.4 million for the quarter ended June 30, 2019 compared to $86.0 million for the quarter ended June 30, 2018.
- Net income attributable to common stockholders was $14.2 million, or $0.06 per basic and diluted share for the quarter ended June 30, 2019, compared to $7.5 million or $0.04 per basic and diluted share for the quarter ended June 30, 2018. The increase during the period was primarily due to the merger.
Non-GAAP Measures
- Adjusted funds from operations, or AFFO, was approximately $38.7 million for the quarter ended June 30, 2019, compared to approximately $33.3 million for the same period in 2018. Funds from operations, or FFO(5), was approximately $49.6 million and $39.1 million for the quarters ended June 30, 2019 and 2018, respectively. Please see the financial reconciliation tables and notes at the end of this release for more information regarding AFFO and FFO.
- Our Adjusted EBITDA, as defined per our credit facility agreement, was approximately $78.4 million for the quarter ended June 30, 2019 with a fixed charge and interest coverage ratio of 3.5X and 4.3X, respectively. Please see the financial reconciliation tables and notes at the end of this release for more information regarding adjusted EBITDA and related ratios.
Leasing Activity
- During the quarter ended June 30, 2019, we executed new and renewal leases totaling 462,545 and 431,712 square feet, respectively, which included the execution of a new 12-year lease with a Fortune 100 e-commerce technology company for 269,000 square feet in Herndon, Virginia, a 12-year lease with American Specialty Health Incorporated for 164,333 square feet in Fort Worth, Texas and a 5-year extension with Bank of America, N.A. for 206,917 square feet in northern Los Angeles, California.
New Credit Facility
- As part of the merger, we entered into a second amended and restated credit agreement ("Second Amended and Restated Credit Agreement") with a syndicate of lenders, under which KeyBank, National Association serves as administrative agent. Pursuant to the Second Amended and Restated Credit Agreement, we were provided with an upsized revolving credit facility with an initial commitment of $750 million, an existing $200 million term loan, a new five-year $400 million term loan and a new seven-year $150 million term loan, which commitments may be increased under certain circumstances up to a maximum total commitment of $2.0 billion. In addition, we entered into a guaranty agreement.
Subsequent Events
- On July 17, 2019, the Heritage Common X Ltd. joint venture sold the Heritage Trace Parkway property located in Fort Worth, Texas for approximately $64 million or a profit of approximately $16 million on a cost to build of $48 million. Our 45% joint venture interest is expected to generate after-tax proceeds of approximately $7.0 million net of closing costs and other closing credits. The carrying value of our joint venture interest on the closing date was approximately $3.3 million. Upon the sale of the joint venture, we recognized a gain of approximately $3.7 million resulting in a 2.1X equity multiple. As of June 30, 2019, we had an ownership interest of approximately 45% in the joint venture.
- On July 30, 2019, we sold the Lynnwood IV land parcel located in Lynnwood, Washington for total proceeds of $1.6 million, less closing costs and other closing credits. The carrying value of the land parcel was approximately $1.3 million. Upon the sale, we recognized a gain of approximately $0.3 million.
About Griffin Capital Essential Asset REIT
Griffin Capital Essential Asset REIT, Inc. is a self-managed, publicly registered, non-traded REIT with a portfolio consisting primarily of single tenant business essential properties throughout the United States, diversified by corporate credit, physical geography, product type, and lease duration. Griffin Capital Essential Asset REIT, Inc.’s portfolio, as of June 30, 2019, consists of 101 office and industrial properties totaling 27.2 million rentable square feet, located in 25 states, representing total REIT capitalization of approximately $4.7 billion.
Additional information is available at www.gcear.com.
This press release may contain certain forward-looking statements within the meaning of Section 27A of the Securities Act of 1933, as amended, and Section 21E of the Securities Exchange Act of 1934, as amended. Such forward-looking statements can generally be identified by our use of forward-looking terminology such as “may,” “will,” “expect,” “intend,” “anticipate,” “estimate,” “believe,” “continue,” or other similar words. Because such statements include risks, uncertainties and contingencies, actual results may differ materially from the expectations, intentions, beliefs, plans or predictions of the future expressed or implied by such forward-looking statements. These risks, uncertainties and contingencies include, but are not limited to: uncertainties relating to changes in general economic and real estate conditions; uncertainties relating to the implementation of our real estate investment strategy; uncertainties relating to financing availability and capital proceeds; uncertainties relating to the closing of property acquisitions; uncertainties related to the timing and availability of distributions; and other risk factors as outlined in the REIT’s Annual Report on Form 10-K and Quarterly Reports on Form 10-Q as filed with the Securities and Exchange Commission (the "SEC"). This is neither an offer nor a solicitation to purchase securities.
______________________________ |
1 Excludes the property information related to the acquisition of an 80% ownership interest in a joint venture with affiliates of Digital Realty Trust, L.P. and 45% ownership interest in the Heritage Common X joint venture property. |
| 2 Total market capitalization includes the outstanding debt balance (excluding deferred financing costs and premium/discounts), plus preferred equity, plus total outstanding shares multiplied by the NAV. Total outstanding shares includes limited partnership units issued and shares issued pursuant to the DRP, net of redemptions. The increase in capitalization is a result of the Mergers on April 30, 2019. Prior period balance was restated due to change in methodology in calculating market capitalization. |
| 3 Net rent is based on (a) the contractual base rental payments assuming the lease requires the tenant to reimburse us for certain operating expenses or the property is self-managed by the tenant and the tenant is responsible for all, or substantially all, of the operating expenses; or (b) contractual rent payments less certain operating expenses that are our responsibility for the 12-month period subsequent to June 30, 2019 and includes assumptions that may not be indicative of the actual future performance of a property, including the assumption that the tenant will perform its obligations under its lease agreement during the next 12 months. |
| 4 Approximately 64.9% of our portfolio's net rental revenue was generated by properties leased to tenants and/or guarantors with investment grade credit ratings or whose non-guarantor parent companies have investment grade ratings or what management believes are generally equivalent ratings. Of the 64.9% investment grade tenant ratings, 57.2% is from a Nationally Recognized Statistical Rating Organization (NRSRO) credit rating, with the remaining 7.7% being from a non-NRSRO, but having a rating that we believe is generally equivalent to an NRSRO investment grade rating. Bloomberg’s default risk rating is an example of a non-NRSRO rating. |
| 5 FFO, as described by the National Association of Real Estate Investment Trusts ("NAREIT"), is adjusted for non-controlling interest and redeemable preferred distributions. |
GRIFFIN CAPITAL ESSENTIAL ASSET REIT, INC. |
|||||||
CONSOLIDATED BALANCE SHEETS |
|||||||
(Unaudited, in thousands, except share amounts) |
|||||||
|
June 30, 2019 |
|
December 31, 2018 |
||||
ASSETS |
|
|
|
||||
Cash and cash equivalents |
$ |
37,537 |
|
|
$ |
48,478 |
|
Restricted cash |
33,451 |
|
|
15,807 |
|
||
Real estate: |
|
|
|
||||
Land |
486,345 |
|
|
350,470 |
|
||
Building and improvements |
3,097,966 |
|
|
2,165,016 |
|
||
Tenant origination and absorption cost |
744,610 |
|
|
530,181 |
|
||
Construction in progress |
25,502 |
|
|
27,697 |
|
||
Total real estate |
4,354,423 |
|
|
3,073,364 |
|
||
Less: accumulated depreciation and amortization |
(603,362 |
) |
|
(538,412 |
) |
||
Total real estate, net |
3,751,061 |
|
|
2,534,952 |
|
||
Investments in unconsolidated entities |
26,034 |
|
|
30,565 |
|
||
Intangible assets, net |
14,828 |
|
|
17,099 |
|
||
Deferred rent |
59,751 |
|
|
55,163 |
|
||
Deferred leasing costs, net |
45,909 |
|
|
29,958 |
|
||
Goodwill |
229,948 |
|
|
229,948 |
|
||
Due from affiliates |
1,638 |
|
|
19,685 |
|
||
Right of use asset |
27,106 |
|
|
— |
|
||
Other assets |
36,712 |
|
|
31,120 |
|
||
Total assets |
$ |
4,263,975 |
|
|
$ |
3,012,775 |
|
LIABILITIES AND EQUITY |
|
|
|
||||
Debt, net |
$ |
1,935,589 |
|
|
$ |
1,353,531 |
|
Restricted reserves |
21,653 |
|
|
8,201 |
|
||
Interest rate swap liability |
23,245 |
|
|
6,962 |
|
||
Distributions payable |
17,123 |
|
|
12,248 |
|
||
Due to affiliates |
12,657 |
|
|
42,406 |
|
||
Below market leases, net |
32,178 |
|
|
23,115 |
|
||
Lease liability |
27,855 |
|
|
— |
|
||
Accrued expenses and other liabilities |
87,828 |
|
|
80,616 |
|
||
Total liabilities |
2,158,128 |
|
|
1,527,079 |
|
||
Commitments and contingencies |
|
|
|
||||
Perpetual convertible preferred shares |
125,000 |
|
|
125,000 |
|
||
Common stock subject to redemption |
37,371 |
|
|
11,523 |
|
||
Noncontrolling interests subject to redemption; 557,189 and 531,161 units as of June 30, 2019 and
|
4,887 |
|
|
4,887 |
|
||
Stockholders’ equity: |
|
|
|
||||
Common Stock, $0.001 par value; 700,000,000 shares authorized; 243,610,554 and 174,470,284
|
244 |
|
|
174 |
|
||
Additional paid-in capital |
2,194,174 |
|
|
1,556,770 |
|
||
Cumulative distributions |
(636,622 |
) |
|
(570,977 |
) |
||
Accumulated earnings |
148,066 |
|
|
128,525 |
|
||
Accumulated other comprehensive loss |
(20,452 |
) |
|
(2,409 |
) |
||
Total stockholders’ equity |
1,685,410 |
|
|
1,112,083 |
|
||
Noncontrolling interests |
253,179 |
|
|
232,203 |
|
||
Total equity |
1,938,589 |
|
|
1,344,286 |
|
||
Total liabilities and equity |
$ |
4,263,975 |
|
|
$ |
3,012,775 |
|
GRIFFIN CAPITAL ESSENTIAL ASSET REIT, INC. |
|||||||||||||||
CONSOLIDATED STATEMENTS OF OPERATIONS |
|||||||||||||||
(in thousands, except share and per share amounts) |
|||||||||||||||
|
Three Months Ended June 30, |
|
Six Months Ended June 30, |
||||||||||||
|
2019 |
|
2018 |
|
2019 |
|
2018 |
||||||||
Revenue: |
|
|
|
|
|
|
|
||||||||
Rental income |
$ |
103,356 |
|
|
$ |
85,991 |
|
|
$ |
179,841 |
|
|
$ |
166,390 |
|
Expenses: |
|
|
|
|
|
|
|
||||||||
Property operating expense |
12,858 |
|
|
11,682 |
|
|
24,374 |
|
|
23,005 |
|
||||
Property tax expense |
9,782 |
|
|
11,140 |
|
|
17,672 |
|
|
22,159 |
|
||||
Asset management fees to affiliates |
— |
|
|
5,947 |
|
|
— |
|
|
11,655 |
|
||||
Property management fees to affiliates |
— |
|
|
2,234 |
|
|
— |
|
|
4,546 |
|
||||
Property management fees to non-affiliates |
882 |
|
|
— |
|
|
1,798 |
|
|
— |
|
||||
General and administrative expenses |
5,656 |
|
|
1,489 |
|
|
10,189 |
|
|
2,931 |
|
||||
Corporate operating expenses to affiliates |
450 |
|
|
848 |
|
|
724 |
|
|
1,682 |
|
||||
Depreciation and amortization |
36,094 |
|
|
31,843 |
|
|
70,871 |
|
|
59,162 |
|
||||
Total expenses |
65,722 |
|
|
65,183 |
|
|
125,628 |
|
|
125,140 |
|
||||
Income before other income and (expenses) |
37,634 |
|
|
20,808 |
|
|
54,213 |
|
|
41,250 |
|
||||
Other income (expenses): |
|
|
|
|
|
|
|
||||||||
Interest expense |
(20,275 |
) |
|
(13,753 |
) |
|
(34,082 |
) |
|
(27,090 |
) |
||||
Management fee revenue from affiliates |
1,627 |
|
|
— |
|
|
6,368 |
|
|
|
|||||
Other (loss) income, net |
(311 |
) |
|
105 |
|
|
1,480 |
|
|
160 |
|
||||
Loss from investment in unconsolidated entities |
(460 |
) |
|
(519 |
) |
|
(1,108 |
) |
|
(1,038 |
) |
||||
Gain from disposition of assets |
— |
|
|
1,158 |
|
|
— |
|
|
1,158 |
|
||||
Net income |
18,215 |
|
|
7,799 |
|
|
26,871 |
|
|
14,440 |
|
||||
Distributions to redeemable preferred shareholders |
(2,047 |
) |
|
— |
|
|
(4,094 |
) |
|
— |
|
||||
Net income attributable to noncontrolling interests |
(1,880 |
) |
|
(280 |
) |
|
(3,077 |
) |
|
(514 |
) |
||||
Net income attributable to controlling interest |
14,288 |
|
|
7,519 |
|
|
19,700 |
|
|
13,926 |
|
||||
Distributions to redeemable noncontrolling interests attributable to common stockholders |
(80 |
) |
|
(88 |
) |
|
(159 |
) |
|
(176 |
) |
||||
Net income attributable to common stockholders |
$ |
14,208 |
|
|
$ |
7,431 |
|
|
$ |
19,541 |
|
|
$ |
13,750 |
|
Net income attributable to common stockholders per share, basic and diluted |
$ |
0.06 |
|
|
$ |
0.04 |
|
|
$ |
0.10 |
|
|
$ |
0.08 |
|
Weighted average number of common shares outstanding, basic and diluted |
226,122,872 |
|
|
167,866,188 |
|
|
200,404,679 |
|
|
169,573,603 |
|
||||
Distributions declared per common share |
$ |
0.16 |
|
|
$ |
0.17 |
|
|
$ |
0.33 |
|
|
$ |
0.34 |
|
GRIFFIN CAPITAL ESSENTIAL ASSET REIT, INC. |
Funds from Operations and Adjusted Funds from Operations |
(in thousands) |
Funds from Operations and Adjusted Funds from Operations
Our management believes that historical cost accounting for real estate assets in accordance with GAAP implicitly assumes that the value of real estate assets diminishes predictably over time. Since real estate values have historically risen or fallen with market conditions, many industry investors and analysts have considered the presentation of operating results for real estate companies that use historical cost accounting to be insufficient.
Management is responsible for managing interest rate, hedge and foreign exchange risks. To achieve our objectives, we may borrow at fixed rates or variable rates. In order to mitigate our interest rate risk on certain financial instruments, if any, we may enter into interest rate cap agreements or other hedge instruments and in order to mitigate our risk to foreign currency exposure, if any, we may enter into foreign currency hedges. We view fair value adjustments of derivatives, impairment charges and gains and losses from dispositions of assets as non-recurring items or items which are unrealized and may not ultimately be realized, and which are not reflective of ongoing operations and are therefore typically adjusted for when assessing operating performance.
In order to provide a more complete understanding of the operating performance of a REIT, the National Association of Real Estate Investment Trusts (“NAREIT”) promulgated a measure known as funds from operations (“FFO”). FFO is defined as net income or loss computed in accordance with GAAP, excluding extraordinary items, as defined by GAAP, and gains and losses from sales of depreciable operating property, adding back asset impairment write-downs, plus real estate related depreciation and amortization (excluding amortization of deferred financing costs and depreciation of non-real estate assets), and after adjustment for unconsolidated partnerships, joint ventures and preferred distributions. Because FFO calculations exclude such items as depreciation and amortization of real estate assets and gains and losses from sales of operating real estate assets (which can vary among owners of identical assets in similar conditions based on historical cost accounting and useful-life estimates), they facilitate comparisons of operating performance between periods and between other REITs. As a result, we believe that the use of FFO, together with the required GAAP presentations, provides a more complete understanding of our performance relative to our competitors and a more informed and appropriate basis on which to make decisions involving operating, financing, and investing activities. It should be noted, however, that other REITs may not define FFO in accordance with the current NAREIT definition or may interpret the current NAREIT definition differently than we do, making comparisons less meaningful.
Additionally, we use Adjusted Funds from Operations (“AFFO”) as a non-GAAP financial measure to evaluate our operating performance. AFFO is a measure used among our peer group, which includes daily NAV REITs. We also believe that AFFO is a recognized measure of sustainable operating performance by the REIT industry. Further, we believe AFFO is useful in comparing the sustainability of our operating performance with the sustainability of the operating performance of other real estate companies.
Management believes that AFFO is a beneficial indicator of our ongoing portfolio performance and ability to sustain our current distribution level. More specifically, AFFO isolates the financial results of our operations. AFFO, however, is not considered an appropriate measure of historical earnings as it excludes certain significant costs that are otherwise included in reported earnings. Further, since the measure is based on historical financial information, AFFO for the period presented may not be indicative of future results or our future ability to pay our dividends. By providing FFO and AFFO, we present information that assists investors in aligning their analysis with management’s analysis of long-term operating activities. As explained below, management’s evaluation of our operating performance excludes items considered in the calculation of AFFO based on the following economic considerations:
- Revenues in excess of cash received, net. Most of our leases provide for periodic minimum rent payment increases throughout the term of the lease. In accordance with GAAP, these contractual periodic minimum rent payment increases during the term of a lease are recorded to rental revenue on a straight-line basis in order to reconcile the difference between accrual and cash basis accounting. As straight-line rent is a GAAP non-cash adjustment and is included in historical earnings, FFO is adjusted for the effect of straight-line rent to arrive at AFFO as a means of determining operating results of our portfolio. By adjusting for this item, we believe AFFO is reflective of the realized economic impact of our leases (including master agreements) that is useful in assessing the sustainability of our operating performance.
- Amortization of stock-based compensation. We have excluded the effect of stock-based compensation expense from our AFFO calculation. Although stock-based compensation expense is calculated in accordance with current GAAP and constitutes an ongoing and recurring expense, such expense is excluded from AFFO because it is not an expense which generally requires cash settlement, and therefore is not used by us to assess the profitability of our operations. We also believe the exclusion of stock-based compensation expense provides a more useful comparison of our operating results to the operating results of our peers.
- Deferred rent. Most of our leases provide for periodic minimum rent payment increases throughout the term of the lease. In accordance with GAAP, these periodic minimum rent payment increases during the term of a lease are recorded on a straight-line basis and create deferred rent. As deferred rent is a GAAP non-cash adjustment and is included in historical earnings, FFO is adjusted for the effect of deferred rent to arrive at AFFO as a means of determining operating results of our portfolio.
- Amortization of in-place lease valuation. Acquired in-place leases are valued as above-market or below-market as of the date of acquisition based on the present value of the difference between (a) the contractual amounts to be paid pursuant to the in-place leases and (b) management's estimate of fair market lease rates for the corresponding in-place leases over a period equal to the remaining non-cancelable term of the lease for above-market leases. The above-market and below-market lease values are capitalized as intangible lease assets or liabilities and amortized as an adjustment to rental income over the remaining terms of the respective leases. As this item is a non-cash adjustment and is included in historical earnings, FFO is adjusted for the effect of the amortization of in-place lease valuation to arrive at AFFO as a means of determining operating results of our portfolio.
- Acquisition-related costs. We were organized primarily with the purpose of acquiring or investing in income-producing real property in order to generate operational income and cash flow that will allow us to provide regular cash distributions to our stockholders. In the process, we incur non-reimbursable affiliated and non-affiliated acquisition-related costs, which in accordance with GAAP are capitalized and included as part of the relative fair value when the property acquisition meets the definition of an asset acquisition or are expensed as incurred and are included in the determination of income (loss) from operations and net income (loss), for property acquisitions accounted for as a business combination. By excluding acquisition-related costs, AFFO may not provide an accurate indicator of our operating performance during periods in which acquisitions are made. However, it can provide an indication of our on-going ability to generate cash flow from operations and continue as a going concern after we cease to acquire properties on a frequent and regular basis, which can be compared to AFFO of other non-listed REITs that have completed their acquisition activity and have similar operating characteristics to ours. Management believes that excluding these costs from AFFO provides investors with supplemental performance information that is consistent with the performance models and analyses used by management.
- Financed termination fee, net of payments received. We believe that a fee received from a tenant for terminating a lease is appropriately included as a component of rental revenue and therefore included in AFFO. If, however, the termination fee is to be paid over time, we believe the recognition of such termination fee into income should not be included in AFFO. Alternatively, we believe that the periodic amount paid by the tenant in subsequent periods to satisfy the termination fee obligation should be included in AFFO.
- Gain or loss from the extinguishment of debt. We use debt as a partial source of capital to acquire properties in our portfolio. As a term of obtaining this debt, we will pay financing costs to the respective lender. Financing costs are presented on the balance sheet as a direct deduction from the carrying amount of that debt liability, consistent with debt discounts and amortized into interest expense on a straight-line basis over the term of the debt. We consider the amortization expense to be a component of operations if the debt was used to acquire properties. From time to time, we may cancel certain debt obligations and replace these canceled debt obligations with new debt at more favorable terms to us. In doing so, we are required to write off the remaining capitalized financing costs associated with the canceled debt, which we consider to be a cost, or loss, on extinguishing such debt. Management believes that this loss is considered an event not associated with our operations, and therefore, deems this write off to be an exclusion from AFFO.
- Unrealized gains (losses) on derivative instruments. These adjustments include unrealized gains (losses) from mark-to-market adjustments on interest rate swaps and losses due to hedge ineffectiveness. The change in the fair value of interest rate swaps not designated as a hedge and the change in the fair value of the ineffective portion of interest rate swaps are non-cash adjustments recognized directly in earnings and are included in interest expense. We have excluded these adjustments in our calculation of AFFO to more appropriately reflect the economic impact of our interest rate swap agreements.
- Dead deal costs. As part of investing in income-producing real property, we incur non-reimbursable affiliated and non-affiliated acquisition-related costs for transactions that fail to close, which in accordance with GAAP, are expensed and are included in the determination of income (loss) from operations and net income (loss). Similar to acquisition-related costs (see above), management believes that excluding these costs from AFFO provides investors with supplemental performance information that is consistent with the performance models and analyses used by management.
For all of these reasons, we believe the non-GAAP measures of FFO and AFFO, in addition to income (loss) from operations, net income (loss) and cash flows from operating activities, as defined by GAAP, are helpful supplemental performance measures and useful to investors in evaluating the performance of our real estate portfolio. However, a material limitation associated with FFO and AFFO is that they are not indicative of our cash available to fund distributions since other uses of cash, such as capital expenditures at our properties and principal payments of debt, are not deducted when calculating FFO and AFFO. The use of AFFO as a measure of long-term operating performance on value is also limited if we do not continue to operate under our current business plan as noted above. AFFO is useful in assisting management and investors in assessing our ongoing ability to generate cash flow from operations and continue as a going concern in future operating periods, and in particular, after the offering and acquisition stages are complete. However, FFO and AFFO are not useful measures in evaluating NAV because impairments are taken into account in determining NAV but not in determining FFO and AFFO. Therefore, FFO and AFFO should not be viewed as a more prominent measure of performance than income (loss) from operations, net income (loss) or to cash flows from operating activities and each should be reviewed in connection with GAAP measurements.
Neither the SEC, NAREIT, nor any other applicable regulatory body has opined on the acceptability of the adjustments contemplated to adjust FFO in order to calculate AFFO and its use as a non-GAAP performance measure. In the future, the SEC or NAREIT may decide to standardize the allowable exclusions across the REIT industry, and we may have to adjust the calculation and characterization of this non-GAAP measure.
Our calculation of FFO and AFFO is presented in the following table for the three and six months ended June 30, 2019 and 2018 (in thousands):
|
Three Months Ended June 30, |
|
Six Months Ended June 30, |
||||||||||||
|
2019 |
|
2018 |
|
2019 |
|
2018 |
||||||||
Net income |
$ |
18,215 |
|
|
$ |
7,799 |
|
|
$ |
26,871 |
|
|
$ |
14,440 |
|
Adjustments: |
|
|
|
|
|
|
|
||||||||
Depreciation of building and improvements |
19,863 |
|
|
14,620 |
|
|
34,630 |
|
|
28,399 |
|
||||
Amortization of leasing costs and intangibles |
16,224 |
|
|
17,216 |
|
|
36,227 |
|
|
30,749 |
|
||||
Equity interest of depreciation of building and improvements - unconsolidated entities |
693 |
|
|
643 |
|
|
1,364 |
|
|
1,277 |
|
||||
Equity interest of amortization of intangible assets - unconsolidated entities |
1,158 |
|
|
1,162 |
|
|
2,316 |
|
|
2,324 |
|
||||
Gain from sale of depreciable operating property |
— |
|
|
(1,158 |
) |
|
— |
|
|
(1,158 |
) |
||||
FFO |
56,153 |
|
|
40,282 |
|
|
101,408 |
|
|
76,031 |
|
||||
Distribution to redeemable preferred shareholders |
(2,047 |
) |
|
— |
|
|
(4,094 |
) |
|
— |
|
||||
Cash distributions to noncontrolling interest |
(4,471 |
) |
|
(1,181 |
) |
|
(9,147 |
) |
|
(2,349 |
) |
||||
FFO, net of noncontrolling interest and redeemable preferred distributions |
$ |
49,635 |
|
|
$ |
39,101 |
|
|
$ |
88,167 |
|
|
$ |
73,682 |
|
Reconciliation of FFO to AFFO: |
|
|
|
|
|
|
|
||||||||
FFO, net of noncontrolling interest and redeemable preferred distributions |
$ |
49,635 |
|
|
$ |
39,101 |
|
|
$ |
88,167 |
|
|
$ |
73,682 |
|
Adjustments: |
|
|
|
|
|
|
|
||||||||
Revenues in excess of cash received, net |
(2,634 |
) |
|
(3,144 |
) |
|
(4,588 |
) |
|
(5,448 |
) |
||||
Amortization of stock-based compensation |
639 |
|
|
— |
|
|
639 |
|
|
— |
|
||||
Deferred rent - ground lease |
293 |
|
|
261 |
|
|
586 |
|
|
261 |
|
||||
Amortization of above/(below) market rent |
(854 |
) |
|
772 |
|
|
(1,768 |
) |
|
528 |
|
||||
Amortization of debt premium/(discount) |
75 |
|
|
8 |
|
|
82 |
|
|
16 |
|
||||
Amortization of ground leasehold interests |
7 |
|
|
7 |
|
|
14 |
|
|
14 |
|
||||
Non-cash lease termination income |
(10,150 |
) |
|
(6,304 |
) |
|
(10,150 |
) |
|
(6,304 |
) |
||||
Financed termination fee payments received |
1,508 |
|
|
1,830 |
|
|
1,508 |
|
|
3,436 |
|
||||
Equity interest of revenues in excess of cash received (straight-line rents) - unconsolidated entities |
(33 |
) |
|
(7 |
) |
|
62 |
|
|
(38 |
) |
||||
Equity interest of amortization of above market rent - unconsolidated entities |
924 |
|
|
739 |
|
|
1,848 |
|
|
1,478 |
|
||||
Performance fee adjustment |
(683 |
) |
|
— |
|
|
(2,604 |
) |
|
— |
|
||||
Implementation of lease accounting guidance |
— |
|
|
— |
|
|
(2,052 |
) |
|
— |
|
||||
AFFO |
$ |
38,727 |
|
|
$ |
33,263 |
|
|
$ |
71,744 |
|
|
$ |
67,625 |
|
GRIFFIN CAPITAL ESSENTIAL ASSET REIT, INC. |
|||||||||||||||
Adjusted EBITDA |
|||||||||||||||
(Unaudited; dollars in thousands) |
|||||||||||||||
|
Three Months Ended June 30, |
|
Six Months Ended June 30, |
||||||||||||
|
2019 |
|
2018 |
|
2019 |
|
2018 |
||||||||
ADJUSTED EBITDA(1): |
|
|
|
|
|
|
|
||||||||
Net income |
$ |
18,215 |
|
|
$ |
7,799 |
|
|
$ |
26,871 |
|
|
$ |
14,440 |
|
Adjustment to net income(2) |
(2,811 |
) |
|
— |
|
|
(5,995 |
) |
|
— |
|
||||
Net income adjusted |
15,404 |
|
|
7,799 |
|
|
20,876 |
|
|
14,440 |
|
||||
Depreciation and amortization |
39,772 |
|
|
31,843 |
|
|
85,083 |
|
|
59,162 |
|
||||
Interest expense |
20,988 |
|
|
13,008 |
|
|
39,578 |
|
|
25,551 |
|
||||
Amortization - Deferred financing costs |
3,603 |
|
|
736 |
|
|
4,730 |
|
|
1,523 |
|
||||
Amortization - Debt premium |
75 |
|
|
7 |
|
|
82 |
|
|
15 |
|
||||
Amortization - In-place lease |
(1,240 |
) |
|
772 |
|
|
(3,317 |
) |
|
528 |
|
||||
Income taxes |
279 |
|
|
(75 |
) |
|
872 |
|
|
141 |
|
||||
Asset management fees |
— |
|
|
5,947 |
|
|
— |
|
|
11,655 |
|
||||
Property management fees to affiliates |
— |
|
|
2,234 |
|
|
— |
|
|
4,546 |
|
||||
Property management fees to non-affiliates |
884 |
|
|
— |
|
|
892 |
|
|
— |
|
||||
Acquisition fees and expenses |
— |
|
|
— |
|
|
379 |
|
|
— |
|
||||
Deferred rent |
(2,993 |
) |
|
(3,144 |
) |
|
(6,079 |
) |
|
(5,448 |
) |
||||
Extraordinary Losses or Gains: |
|
|
|
|
|
|
|
||||||||
Termination fee |
— |
|
|
— |
|
|
— |
|
|
— |
|
||||
Gain on disposition |
— |
|
|
(1,158 |
) |
|
— |
|
|
(1,158 |
) |
||||
Equity percentage of net (income) loss for the Parent’s non-wholly owned direct and indirect subsidiaries |
460 |
|
|
519 |
|
|
1,108 |
|
|
1,038 |
|
||||
Equity percentage of EBITDA for the Parent’s non-wholly owned direct and indirect subsidiaries |
2,417 |
|
|
2,262 |
|
|
4,678 |
|
|
4,448 |
|
||||
|
79,649 |
|
|
60,750 |
|
|
148,882 |
|
|
116,441 |
|
||||
Less: Capital reserves |
(1,299 |
) |
|
(931 |
) |
|
(2,564 |
) |
|
(1,820 |
) |
||||
Adjusted EBITDA (per credit facility agreement) |
$ |
78,350 |
|
|
$ |
59,819 |
|
|
$ |
146,318 |
|
|
$ |
114,621 |
|
|
|
|
|
|
|
|
|
||||||||
Principal paid and due |
$ |
1,632 |
|
|
$ |
1,558 |
|
|
$ |
3,251 |
|
|
$ |
3,319 |
|
Interest expense |
19,132 |
|
|
13,610 |
|
|
37,986 |
|
|
26,645 |
|
||||
Cash dividends on Preferred Stock (including any paid under the 2018 Preferred Documents) |
2,047 |
|
|
— |
|
|
4,094 |
|
|
— |
|
||||
|
$ |
22,811 |
|
|
$ |
15,168 |
|
|
$ |
45,331 |
|
|
$ |
29,964 |
|
|
|
|
|
|
|
|
|
||||||||
Interest Coverage Ratio(3) |
4.10 |
|
|
4.39 |
|
|
3.85 |
|
|
4.30 |
|
||||
Fixed Charge Coverage Ratio(4) |
3.43 |
|
|
3.94 |
|
|
3.23 |
|
|
3.83 |
|
||||
(1) |
Adjusted EBITDA, as defined in our credit facility agreement, is calculated as net income before interest, taxes, depreciation and amortization (EBITDA), plus acquisition fees and expenses, asset and property management fees, straight-line rents and in-place lease amortization for the period, further adjusted for acquisitions that have closed during the quarter and certain reserves for capital expenditures. |
(2) |
Adjustment is a result of combined financial information from EA-1 and us. |
(3) |
Interest coverage is the ratio of interest expense as if the corresponding debt was in place at the beginning of the period to adjusted EBITDA. |
(4) |
Fixed charge coverage is the ratio of principal amortization for the period plus interest expense as if the corresponding debt were in place at the beginning of the period plus preferred unit distributions as if in place at the beginning of the period over adjusted EBITDA. |
View source version on businesswire.com: https://www.businesswire.com/news/home/20190815005597/en/
Investor Services
888-926-2688
Media:
Diana Keary
Senior Vice President
Griffin Capital Company
[email protected]
949-270-9303
Or
Joe Berg
Director
Finsbury
[email protected]
310-633-9446
Source: Griffin Capital Essential Asset REIT, Inc.
Serious News for Serious Traders! Try StreetInsider.com Premium Free!
You May Also Be Interested In
- TNL Mediagene regains Nasdaq bid price compliance, faces equity test
- TheRealReal refinances debt with $150M term loan, extending maturity to 2033
- Regions Reports Earnings of $611 Million and EPS of $0.71 in 3Q 2026
Create E-mail Alert Related Categories
Business Wire, Press ReleasesRelated Entities
KeyBanc, Dividend, Earnings, Definitive Agreement, BofA/Merrill LynchSign up for StreetInsider Free!
Receive full access to all new and archived articles, unlimited portfolio tracking, e-mail alerts, custom newswires and RSS feeds - and more!
