



Deere Reports Third Quarter Net Income of $1.667 Billion
 Tweet
Tweet Share
Share E-mail
Get Alerts DE Hot Sheet
Join SI Premium – FREE
MOLINE, Ill., Aug. 20, 2021 /PRNewswire/ --
- Equipment-division operating margin of 19% demonstrates strong execution in face of supply-chain challenges.
- Full-year earnings forecast raised to range of $5.7 to $5.9 billion, reflecting robust market conditions.
- Strategic investments reinforce focus on delivering customer value.
Deere & Company (NYSE: DE) reported net income of $1.667 billion for the third quarter ended August 1, 2021, or $5.32 per share, compared with net income of $811 million, or $2.57 per share, for the quarter ended August 2, 2020. For the first nine months of the 2021 fiscal year, net income attributable to Deere & Company was $4.680 billion, or $14.86 per share, compared with $1.993 billion, or $6.30 per share, for the same period last year.
Worldwide net sales and revenues increased 29 percent, to $11.527 billion, for the third quarter of 2021 and rose 27 percent, to $32.697 billion, for nine months. Net sales of the equipment operations were $10.413 billion for the quarter and $29.461 billion for nine months, compared with $7.859 billion and $22.612 billion for the same periods last year, respectively.
"Our strong results, driven by essentially all product categories, are a testament to the exceptional efforts of our employees and dealers to keep our factories running and customers served while enduring significant supply-chain pressures," said John C. May, chairman and chief executive officer. "We also made strategic investments in the quarter aligned with our smart industrial strategy. They will further our efforts to help our customers achieve improved profitability, productivity, and sustainability through the effective use of technology."
Company Outlook & Summary
Net income attributable to Deere & Company for fiscal 2021 is forecasted to be in a range of $5.7 billion to $5.9 billion.
"Looking ahead, we expect demand for farm and construction equipment to continue benefiting from favorable fundamentals," May said. "We are, at the same time, excited by the growing engagement with our digital platform, the John Deere Operations Center, as well as continued adoption of precision technologies, which unlock greater value for our customers."
Deere & Company | Third Quarter | Year to Date | |||||||||||||||
$ in millions | 2021 | 2020 | % Change | 2021 | 2020 | % Change | |||||||||||
Net sales and revenues | $ | 11,527 | $ | 8,925 | 29% | $ | 32,697 | $ | 25,809 | 27% | |||||||
Net income | $ | 1,667 | $ | 811 | 106% | $ | 4,680 | $ | 1,993 | 135% | |||||||
Fully diluted EPS | $ | 5.32 | $ | 2.57 | $ | 14.86 | $ | 6.30 | |||||||||
Results in the third quarter and the first nine months of fiscal 2021 and 2020 were impacted by special items. Refer to Note 1 of the financial statements for an overview of the special items. In addition, the third-quarter 2020 net income was unfavorably affected by discrete income-tax adjustments.
Equipment Operations | Third Quarter | ||||||||
$ in millions | 2021 | 2020 | % Change | ||||||
Net sales | $ | 10,413 | $ | 7,859 | 32% | ||||
Operating profit | $ | 1,952 | $ | 1,147 | 70% | ||||
Net income | $ | 1,440 | $ | 628 | 129% | ||||
For a discussion of net sales and operating profit results, see the production and precision agriculture, small agriculture and turf, and construction and forestry sections below.
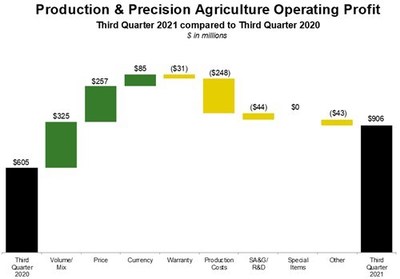
Production & Precision Agriculture | Third Quarter | ||||||||
$ in millions | 2021 | 2020 | % Change | ||||||
Net sales | $ | 4,250 | $ | 3,289 | 29% | ||||
Operating profit | $ | 906 | $ | 605 | 50% | ||||
Operating margin | 21.3% | 18.4% | |||||||
Production and precision agriculture sales increased for the quarter due to higher shipment volumes and price realization. Operating profit rose primarily due to higher shipment volumes / sales mix and price realization. These items were partially offset by higher production costs.
Small Agriculture & Turf | Third Quarter | ||||||||
$ in millions | 2021 | 2020 | % Change | ||||||
Net sales | $ | 3,147 | $ | 2,383 | 32% | ||||
Operating profit | $ | 583 | $ | 337 | 73% | ||||
Operating margin | 18.5% | 14.1% | |||||||
Small agriculture and turf sales for the quarter increased due to higher shipment volumes and price realization. Operating profit increased primarily due to higher shipment volumes / sales mix and price realization. These items were partially offset by higher production costs. Results for the third quarter in fiscal 2021 and 2020 were affected by special items. Refer to Note 1 of the financial statements.

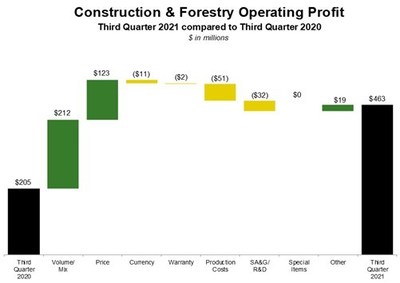
Construction & Forestry | Third Quarter | ||||||||
$ in millions | 2021 | 2020 | % Change | ||||||
Net sales | $ | 3,016 | $ | 2,187 | 38% | ||||
Operating profit | $ | 463 | $ | 205 | 126% | ||||
Operating margin | 15.4% | 9.4% | |||||||
Construction and forestry sales moved higher for the quarter primarily due to higher shipment volumes and price realization. Operating profit increased due to higher shipment volumes / sales mix and price realization, partially offset by higher production costs.
Financial Services | Third Quarter | ||||||||
$ in millions | 2021 | 2020 | % Change | ||||||
Net income | $ | 227 | $ | 183 | 24% | ||||
The increase in financial services net income for the quarter was mainly due to an improvement on operating-lease residual values, as well as income earned on a higher average portfolio, a lower provision for credit losses, and more-favorable financing spreads.
Industry Outlook for 2021 (Annual) | |||||||
Agriculture & Turf | |||||||
U.S. & Canada: | |||||||
Large Ag | Up ~ 25% | ||||||
Small Ag & Turf | Up ~ 10% | ||||||
Europe | Up 10 to 15% | ||||||
South America (Tractors & Combines) | Up ~ 20% | ||||||
Asia | Up significantly | ||||||
Construction & Forestry | |||||||
U.S. & Canada: | |||||||
Construction Equipment | Up 15 to 20% | ||||||
Compact Construction Equipment | Up 20 to 25% | ||||||
Global Forestry | Up ~ 15% |
Deere Segment Outlook (2021) | Currency | Price | |||||
$ in millions | Net Sales | Translation | Realization | ||||
Production & Precision Ag | Up 25 to 30% | +2% | +8% | ||||
Small Ag & Turf | Up ~ 25% | +3% | +5% | ||||
Construction & Forestry | Up ~ 30% | +2% | +5% | ||||
Financial Services | Net Income | $ 850 |
Financial Services. Full-year fiscal 2021 results are expected to benefit from improvement on operating-lease residual values, a lower provision for credit losses, more-favorable financing spreads, and income earned on a higher average portfolio.
John Deere Capital Corporation
The following is disclosed on behalf of the company's financial services subsidiary, John Deere Capital Corporation (JDCC), in connection with the disclosure requirements applicable to its periodic issuance of debt securities in the public market.
Third Quarter | Year to Date | ||||||||||||||||
$ in millions | 2021 | 2020 | % Change | 2021 | 2020 | % Change | |||||||||||
Revenue | $ | 683 | $ | 696 | -2% | $ | 2,015 | $ | 2,115 | -5% | |||||||
Net income | $ | 186 | $ | 146 | 27% | $ | 530 | $ | 271 | 96% | |||||||
Ending portfolio balance | $ | 41,508 | $ | 38,766 | 7% | ||||||||||||
Results in both periods were higher mainly due to income earned on a higher average portfolio, improvement on operating-lease residual values, and more-favorable financing spreads. Additionally, a lower provision for credit losses contributed to the improvement for the first nine months of fiscal 2021. Results for the nine-month period last year also included impairments on lease residual values.
Safe Harbor Statement
Safe Harbor Statement under the Private Securities Litigation Reform Act of 1995: Statements under "Company Outlook & Summary," "Industry Outlook for 2021," "Deere Segment Outlook (2021)," and other forward-looking statements herein that relate to future events, expectations, and trends involve factors that are subject to change and risks and uncertainties that could cause actual results to differ materially. Some of these risks and uncertainties could affect particular lines of business, while others could affect all of the company's businesses.
The company's agricultural equipment businesses are subject to a number of uncertainties, including certain factors that affect farmers' confidence and financial condition. These factors include demand for agricultural products, world grain stocks, weather conditions, soil conditions, harvest yields, prices for commodities and livestock, crop and livestock production expenses, availability of transport for crops, trade restrictions and tariffs (e.g., China), global trade agreements, the level of farm product exports (including concerns about genetically modified organisms), the growth and sustainability of non-food uses for some crops (including ethanol and biodiesel production), real estate values, available acreage for farming, the land ownership policies of governments, changes in government farm programs and policies, international reaction to such programs, changes in and effects of crop insurance programs, changes in environmental regulations and their impact on farming practices, animal diseases (e.g., African swine fever) and their effects on poultry, beef, and pork consumption and prices and on livestock feed demand, crop pests and diseases, and the impact of the COVID pandemic on the agricultural industry including demand for, and production and exports of, agricultural products, and commodity prices.
The production and precision agriculture business is dependent on agricultural conditions, and relies in part on hardware and software, guidance, connectivity and digital solutions, and automation and machine intelligence. Many factors contribute to the company's precision agriculture sales and results, including the impact to customers' profitability and/or sustainability outcomes; the rate of adoption and use by customers; availability of technological innovations; speed of research and development; effectiveness of partnerships with third parties; and the dealer channel's ability to support and service precision technology solutions.
Factors affecting the outlook for the company's small agriculture and turf equipment include agricultural conditions, consumer confidence, weather conditions, customer profitability, labor supply, consumer borrowing patterns, consumer purchasing preferences, housing starts and supply, infrastructure investment, spending by municipalities and golf courses, and consumable input costs.
Factors affecting the sales and results of the company's construction and forestry equipment operations include consumer spending patterns, real estate and housing prices, the number of housing starts, interest rates, commodity prices such as oil and gas, the levels of public and non-residential construction, and investment in infrastructure. Prices for pulp, paper, lumber and structural panels affect sales of forestry equipment.
Many of the factors affecting the production and precision agriculture, small agriculture and turf, and construction and forestry segments have been and may continue to be impacted by global economic conditions, including those resulting from the COVID pandemic and responses to the pandemic taken by governments and other authorities.
All of the company's businesses and its results are affected by general economic conditions in the global markets and industries in which the company operates; customer confidence in general economic conditions; government spending and taxing; foreign currency exchange rates and their volatility, especially fluctuations in the value of the U.S. dollar; interest rates (including the availability of IBOR reference rates); inflation and deflation rates; changes in weather patterns; the political and social stability of the global markets in which the company operates; the effects of, or response to, terrorism and security threats; wars and other conflicts; natural disasters; and the spread of major epidemics (including the COVID pandemic) and government and industry responses to epidemics, such as travel restrictions and extended shut down of businesses.
Uncertainties related to the magnitude and duration of the COVID pandemic may significantly adversely affect the company's business and outlook. These uncertainties include: the duration and impact of any resurgence in COVID cases in any country, state, or region; the emergence, contagiousness, and threat of new and different strains of coronavirus; the availability, acceptance, and effects of vaccines; prolonged reduction or closure of the company's operations, or a delayed recovery in our operations; additional closures as mandated or otherwise made necessary by governmental authorities; disruptions in the supply chain and a prolonged delay in resumption of operations by one or more key suppliers, or the failure of any key suppliers; the company's ability to meet commitments to customers on a timely basis as a result of increased costs and supply challenges; the ability to receive goods on a timely basis and at anticipated costs; increased logistics costs; delays in the company's strategic initiatives as a result of reduced spending on research and development; additional operating costs due to remote working arrangements, adherence to social distancing guidelines and other COVID-related challenges; increased risk of cyber-attacks on network connections used in remote working arrangements; increased privacy-related risks due to processing health-related personal information; legal claims related to personal protective equipment designed, made, or provided by the company or alleged exposure to COVID on company premises; absence of employees due to illness; the impact of the pandemic on the company's customers and dealers, and their delays in their plans to invest in new equipment; requests by the company's customers or dealers for payment deferrals and contract modifications; the impact of disruptions in the global capital markets and/or declines in the company's financial performance, outlook or credit ratings, which could impact the company's ability to obtain funding in the future; and the impact of the pandemic on demand for our products and services as discussed above. It remains unclear when a sustained economic recovery could occur and what a recovery may look like. All of these factors could materially and adversely affect our business, liquidity, results of operations, and financial position.
Significant changes in market liquidity conditions, changes in the company's credit ratings, and any failure to comply with financial covenants in credit agreements could impact access to funding and funding costs, which could reduce the company's earnings and cash flows. Financial market conditions could also negatively impact customer access to capital for purchases of the company's products and customer confidence and purchase decisions, financing and repayment practices, and the number and size of customer delinquencies and defaults. A debt crisis in Europe, Latin America, or elsewhere could negatively impact currencies, global financial markets, social and political stability, funding sources and costs, asset and obligation values, customers, suppliers, demand for equipment, and company operations and results. The company's investment management activities could be impaired by changes in the equity, bond, and other financial markets, which would negatively affect earnings.
The withdrawal of the United Kingdom from the European Union and the perceptions as to the impact of the withdrawal may adversely affect business activity, political stability, and economic conditions in the United Kingdom, the European Union, and elsewhere. The economic conditions and outlook could be further adversely affected by (i) uncertainty regarding any new or modified trade arrangements between the United Kingdom and the European Union and/or other countries, (ii) the risk that one or more other European Union countries could come under increasing pressure to leave the European Union, or (iii) the risk that the euro as the single currency of the Eurozone could cease to exist. Any of these developments, or the perception that any of these developments are likely to occur, could affect economic growth or business activity in the United Kingdom or the European Union, and could result in the relocation of businesses, cause business interruptions, lead to economic recession or depression, and impact the stability of the financial markets, availability of credit, currency exchange rates, interest rates, financial institutions, and political, financial, and monetary systems. Any of these developments could affect our businesses, liquidity, results of operations, and financial position.
Additional factors that could materially affect the company's operations, access to capital, expenses, and results include changes in, uncertainty surrounding, and the impact of governmental trade, banking, monetary, and fiscal policies, including financial regulatory reform and its effects on the consumer finance industry, derivatives, funding costs, and other areas; governmental programs, policies, and tariffs for the benefit of certain industries or sectors; sanctions in particular jurisdictions; retaliatory actions to such changes in trade, banking, monetary, and fiscal policies; actions by central banks; actions by financial and securities regulators; actions by environmental, health, and safety regulatory agencies, including those related to engine emissions, carbon and other greenhouse gas emissions, noise, and the effects of climate change; changes to GPS radio frequency bands or their permitted uses; changes in labor and immigration regulations; changes to accounting standards; changes in tax rates, estimates, laws, and regulations and company actions related thereto; changes to and compliance with privacy regulations; changes to and compliance with economic sanctions and export controls laws and regulations; compliance with U.S. and foreign laws when expanding to new markets and otherwise; and actions by other regulatory bodies.
Other factors that could materially affect the company's results include production, design, and technological innovations and difficulties, including capacity and supply constraints and prices; the loss of or challenges to intellectual property rights, whether through theft, infringement, counterfeiting, or otherwise; the availability and prices of strategically sourced materials, components, and whole goods; delays or disruptions in the company's supply chain or the loss of liquidity by suppliers; disruptions of infrastructures that support communications, operations, or distribution; the failure of customers, dealers, suppliers, or the company to comply with laws, regulations, and company policy pertaining to employment, human rights, health, safety, the environment, sanctions, export controls, anti-corruption, privacy and data protection, and other ethical business practices; events that damage the company's reputation or brand; significant investigations, claims, lawsuits, or other legal proceedings; start-up of new plants and products; the success of new product initiatives or business strategies; changes in customer product preferences and sales mix; gaps or limitations in rural broadband coverage, capacity, and speed needed to support technology solutions; oil and energy prices, supplies, and volatility; the availability and cost of freight; actions of competitors in the various industries in which the company competes, particularly price discounting; dealer practices, especially as to levels of new and used field inventories; changes in demand and pricing for used equipment and resulting impacts on lease residual values; labor relations and contracts; changes in the ability to attract, develop, engage, and retain qualified personnel; acquisitions and divestitures of businesses; greater-than-anticipated transaction costs; the integration of new businesses; the failure or delay in closing or realizing anticipated benefits of acquisitions, joint ventures, or divestitures; the inability to deliver precision technology and agricultural solutions to customers; the implementation of the smart industrial operating model and other organizational changes; the failure to realize anticipated savings or benefits of cost reduction, productivity, or efficiency efforts; difficulties related to the conversion and implementation of enterprise resource planning systems; security breaches, cybersecurity attacks, technology failures, and other disruptions to the company's and suppliers' information technology infrastructure; changes in company-declared dividends and common stock issuances and repurchases; changes in the level and funding of employee retirement benefits; changes in market values of investment assets, compensation, retirement, discount, and mortality rates which impact retirement benefit costs; and significant changes in health care costs.
The liquidity and ongoing profitability of John Deere Capital Corporation and the company's other financial services subsidiaries depend largely on timely access to capital in order to meet future cash flow requirements, and to fund operations, costs, and purchases of the company's products. If general economic conditions deteriorate or capital markets become more volatile, including as a result of the COVID pandemic, funding could be unavailable or insufficient. Additionally, customer confidence levels may result in declines in credit applications and increases in delinquencies and default rates, which could materially impact write-offs and provisions for credit losses.
The company's forward-looking statements are based upon assumptions relating to the factors described above, which are sometimes based upon estimates and data prepared by government agencies. Such estimates and data are often revised. The company, except as required by law, undertakes no obligation to update or revise its forward-looking statements, whether as a result of new developments or otherwise. Further information concerning the company and its businesses, including factors that could materially affect the company's financial results, is included in the company's other filings with the SEC (including, but not limited to, the factors discussed in Item 1A. Risk Factors of the company's most recent annual report on Form 10-K and quarterly reports on Form 10-Q).
DEERE & COMPANYTHIRD QUARTER 2021 PRESS RELEASE(In millions of dollars) Unaudited | |||||||||||||||||
Three Months Ended | Nine Months Ended | ||||||||||||||||
August 1 | August 2 | % | August 1 | August 2 | % | ||||||||||||
2021 | 2020 | Change | 2021 | 2020 | Change | ||||||||||||
Net sales and revenues: | |||||||||||||||||
Production & precision ag net sales | $ | 4,250 | $ | 3,289 | +29 | $ | 11,848 | $ | 9,161 | +29 | |||||||
Small ag & turf net sales | 3,147 | 2,383 | +32 | 9,051 | 6,966 | +30 | |||||||||||
Construction & forestry net sales | 3,016 | 2,187 | +38 | 8,562 | 6,485 | +32 | |||||||||||
Financial services revenues | 902 | 892 | +1 | 2,679 | 2,699 | -1 | |||||||||||
Other revenues | 212 | 174 | +22 | 557 | 498 | +12 | |||||||||||
Total net sales and revenues | $ | 11,527 | $ | 8,925 | +29 | $ | 32,697 | $ | 25,809 | +27 | |||||||
Operating profit: * | |||||||||||||||||
Production & precision ag | $ | 906 | $ | 605 | +50 | $ | 2,557 | $ | 1,391 | +84 | |||||||
Small ag & turf | 583 | 337 | +73 | 1,699 | 718 | +137 | |||||||||||
Construction & forestry | 463 | 205 | +126 | 1,220 | 394 | +210 | |||||||||||
Financial services | 291 | 243 | +20 | 844 | 498 | +69 | |||||||||||
Total operating profit | 2,243 | 1,390 | +61 | 6,320 | 3,001 | +111 | |||||||||||
Reconciling items ** | (85) | (122) | -30 | (312) | (256) | +22 | |||||||||||
Income taxes | (491) | (457) | +7 | (1,328) | (752) | +77 | |||||||||||
Net income attributable to Deere & Company | $ | 1,667 | $ | 811 | +106 | $ | 4,680 | $ | 1,993 | +135 | |||||||
* Operating profit is income from continuing operations before corporate expenses, certain external interest expense, certain foreign exchange gains and losses, and income taxes. Operating profit of the financial services segment includes the effect of interest expense and foreign exchange gains or losses. | |||||||||||||||||
** Reconciling items are primarily corporate expenses, certain external interest expense, certain foreign exchange gains and losses, pension and postretirement benefit costs excluding the service cost component, and net income attributable to noncontrolling interests. | |||||||||||||||||
DEERE & COMPANYSTATEMENT OF CONSOLIDATED INCOMEFor the Three Months Ended August 1, 2021 and August 2, 2020(In millions of dollars and shares except per share amounts) Unaudited | ||||||
2021 | 2020 | |||||
Net Sales and Revenues | ||||||
Net sales | $ | 10,413 | $ | 7,859 | ||
Finance and interest income | 825 | 838 | ||||
Other income | 289 | 228 | ||||
Total | 11,527 | 8,925 | ||||
Costs and Expenses | ||||||
Cost of sales | 7,574 | 5,835 | ||||
Research and development expenses | 394 | 370 | ||||
Selling, administrative and general expenses | 841 | 752 | ||||
Interest expense | 244 | 290 | ||||
Other operating expenses | 324 | 408 | ||||
Total | 9,377 | 7,655 | ||||
Income of Consolidated Group before Income Taxes | 2,150 | 1,270 | ||||
Provision for income taxes | 491 | 457 | ||||
Income of Consolidated Group | 1,659 | 813 | ||||
Equity in income (loss) of unconsolidated affiliates | 8 | (2) | ||||
Net Income | 1,667 | 811 | ||||
Less: Net income attributable to noncontrolling interests | ||||||
Net Income Attributable to Deere & Company | $ | 1,667 | $ | 811 | ||
Per Share Data | ||||||
Basic | $ | 5.36 | $ | 2.59 | ||
Diluted | $ | 5.32 | $ | 2.57 | ||
Average Shares Outstanding | ||||||
Basic | 311.0 | 313.0 | ||||
Diluted | 313.4 | 315.8 | ||||
See Condensed Notes to Interim Consolidated Financial Statements. | ||||||
DEERE & COMPANYSTATEMENT OF CONSOLIDATED INCOMEFor the Nine Months Ended August 1, 2021 and August 2, 2020(In millions of dollars and shares except per share amounts) Unaudited | ||||||
2021 | 2020 | |||||
Net Sales and Revenues | ||||||
Net sales | $ | 29,461 | $ | 22,612 | ||
Finance and interest income | 2,468 | 2,584 | ||||
Other income | 768 | 613 | ||||
Total | 32,697 | 25,809 | ||||
Costs and Expenses | ||||||
Cost of sales | 21,307 | 17,206 | ||||
Research and development expenses | 1,137 | 1,201 | ||||
Selling, administrative and general expenses | 2,448 | 2,467 | ||||
Interest expense | 783 | 969 | ||||
Other operating expenses | 1,033 | 1,199 | ||||
Total | 26,708 | 23,042 | ||||
Income of Consolidated Group before Income Taxes | 5,989 | 2,767 | ||||
Provision for income taxes | 1,328 | 752 | ||||
Income of Consolidated Group | 4,661 | 2,015 | ||||
Equity in income (loss) of unconsolidated affiliates | 21 | (20) | ||||
Net Income | 4,682 | 1,995 | ||||
Less: Net income attributable to noncontrolling interests | 2 | 2 | ||||
Net Income Attributable to Deere & Company | $ | 4,680 | $ | 1,993 | ||
Per Share Data | ||||||
Basic | $ | 14.98 | $ | 6.36 | ||
Diluted | $ | 14.86 | $ | 6.30 | ||
Average Shares Outstanding | ||||||
Basic | 312.4 | 313.3 | ||||
Diluted | 314.9 | 316.4 | ||||
See Condensed Notes to Interim Consolidated Financial Statements. | ||||||
DEERE & COMPANYCONDENSED CONSOLIDATED BALANCE SHEET(In millions of dollars) Unaudited | |||||||||
August 1 | November 1 | August 2 | |||||||
2021 | 2020 | 2020 | |||||||
Assets | |||||||||
Cash and cash equivalents | $ | 7,519 | $ | 7,066 | $ | 8,190 | |||
Marketable securities | 688 | 641 | 640 | ||||||
Receivables from unconsolidated affiliates | 29 | 31 | 26 | ||||||
Trade accounts and notes receivable - net | 5,268 | 4,171 | 5,473 | ||||||
Financing receivables - net | 31,449 | 29,750 | 27,814 | ||||||
Financing receivables securitized - net | 5,401 | 4,703 | 5,469 | ||||||
Other receivables | 1,673 | 1,220 | 1,217 | ||||||
Equipment on operating leases - net | 6,982 | 7,298 | 7,158 | ||||||
Inventories | 6,410 | 4,999 | 5,650 | ||||||
Property and equipment - net | 5,649 | 5,817 | 5,754 | ||||||
Investments in unconsolidated affiliates | 188 | 193 | 199 | ||||||
Goodwill | 3,148 | 3,081 | 2,984 | ||||||
Other intangible assets - net | 1,267 | 1,327 | 1,301 | ||||||
Retirement benefits | 990 | 863 | 1,031 | ||||||
Deferred income taxes | 1,767 | 1,499 | 1,534 | ||||||
Other assets | 2,260 | 2,432 | 2,824 | ||||||
Total Assets | $ | 80,688 | $ | 75,091 | $ | 77,264 | |||
Liabilities and Stockholders' Equity | |||||||||
Liabilities | |||||||||
Short-term borrowings | $ | 10,404 | $ | 8,582 | $ | 9,075 | |||
Short-term securitization borrowings | 5,277 | 4,682 | 5,361 | ||||||
Payables to unconsolidated affiliates | 116 | 105 | 80 | ||||||
Accounts payable and accrued expenses | 11,091 | 10,112 | 9,565 | ||||||
Deferred income taxes | 515 | 519 | 479 | ||||||
Long-term borrowings | 32,280 | 32,734 | 34,037 | ||||||
Retirement benefits and other liabilities | 5,272 | 5,413 | 5,776 | ||||||
Total liabilities | 64,955 | 62,147 | 64,373 | ||||||
Stockholders' Equity | |||||||||
Total Deere & Company stockholders' equity | 15,731 | 12,937 | 12,888 | ||||||
Noncontrolling interests | 2 | 7 | 3 | ||||||
Total stockholders' equity | 15,733 | 12,944 | 12,891 | ||||||
Total Liabilities and Stockholders' Equity | $ | 80,688 | $ | 75,091 | $ | 77,264 | |||
See Condensed Notes to Interim Consolidated Financial Statements. | |||||||||
DEERE & COMPANYSTATEMENT OF CONSOLIDATED CASH FLOWSFor the Nine Months Ended August 1, 2021 and August 2, 2020(In millions of dollars) Unaudited | ||||||
2021 | 2020 | |||||
Cash Flows from Operating Activities | ||||||
Net income | $ | 4,682 | $ | 1,995 | ||
Adjustments to reconcile net income to net cash provided by operating activities: | ||||||
Provision (credit) for credit losses | (17) | 123 | ||||
Provision for depreciation and amortization | 1,569 | 1,614 | ||||
Impairment charges | 50 | 147 | ||||
Share-based compensation expense | 64 | 63 | ||||
Undistributed earnings of unconsolidated affiliates | 4 | (5) | ||||
Credit for deferred income taxes | (271) | (160) | ||||
Changes in assets and liabilities: | ||||||
Trade, notes, and financing receivables related to sales | (444) | 626 | ||||
Inventories | (1,817) | (1) | ||||
Accounts payable and accrued expenses | 742 | (572) | ||||
Accrued income taxes payable/receivable | 34 | 4 | ||||
Retirement benefits | 13 | 88 | ||||
Other | (295) | 135 | ||||
Net cash provided by operating activities | 4,314 | 4,057 | ||||
Cash Flows from Investing Activities | ||||||
Collections of receivables (excluding receivables related to sales) | 14,480 | 13,237 | ||||
Proceeds from maturities and sales of marketable securities | 82 | 70 | ||||
Proceeds from sales of equipment on operating leases | 1,510 | 1,310 | ||||
Cost of receivables acquired (excluding receivables related to sales) | (17,161) | (14,449) | ||||
Acquisitions of businesses, net of cash acquired | (19) | |||||
Purchases of marketable securities | (115) | (91) | ||||
Purchases of property and equipment | (492) | (594) | ||||
Cost of equipment on operating leases acquired | (1,210) | (1,312) | ||||
Collateral on derivatives – net | (189) | 324 | ||||
Other | 12 | (12) | ||||
Net cash used for investing activities | (3,102) | (1,517) | ||||
Cash Flows from Financing Activities | ||||||
Increase in total short-term borrowings | 929 | 170 | ||||
Proceeds from long-term borrowings | 5,877 | 8,331 | ||||
Payments of long-term borrowings | (5,172) | (5,797) | ||||
Proceeds from issuance of common stock | 136 | 111 | ||||
Repurchases of common stock | (1,780) | (263) | ||||
Dividends paid | (761) | (718) | ||||
Other | (80) | (110) | ||||
Net cash provided by (used for) financing activities | (851) | 1,724 | ||||
Effect of Exchange Rate Changes on Cash, Cash Equivalents, and Restricted Cash | 106 | 80 | ||||
Net Increase in Cash, Cash Equivalents, and Restricted Cash | 467 | 4,344 | ||||
Cash, Cash Equivalents, and Restricted Cash at Beginning of Period | 7,172 | 3,956 | ||||
Cash, Cash Equivalents, and Restricted Cash at End of Period | $ | 7,639 | $ | 8,300 | ||
See Condensed Notes to Interim Consolidated Financial Statements. | ||||||
DEERE & COMPANY | |
Condensed Notes to Interim Consolidated Financial Statements | |
(In millions of dollars and shares except per share amounts) Unaudited | |
(1) | 2021 Special ItemsIn the third quarter of 2021, the company sold a closed factory that previously produced small agriculture equipment in China, resulting in a $27 million pretax gain. During the first quarter of 2021, the fixed assets in an asphalt plant factory in Germany were impaired by $38 million, pretax and after-tax. The company also continued to assess its manufacturing locations, resulting in additional long-lived asset impairments of $12 million pretax. The impairments were the result of a decline in forecasted financial performance that indicated it was probable future cash flows would not cover the carrying amount of the net assets. These impairments were offset by a favorable indirect tax ruling in Brazil of $58 million pretax. |
Nine Months Ended August 1, 2021 | |||||||||||||
Expense (benefit): | Production & Precision Ag | Small Ag & Turf | Construction & Forestry | Total | |||||||||
Long-lived asset impairments – Cost of sales | $ | 5 | $ | 3 | $ | 42 | $ | 50 | |||||
Brazil indirect tax – Cost of sales | (53) | (5) | (58) | ||||||||||
Gain on sale – Other income | (27) | (27) | |||||||||||
Total expense (benefit) | $ | (48) | $ | (24) | $ | 37 | $ | (35) | |||||
2020 Special ItemsIn the third quarter of 2020, the company closed a factory producing small agricultural equipment in China. In connection with this closure, a non-cash impairment of other receivables, property, and intangible assets of $9 million pretax and after-tax was recorded and $4 million pretax and after-tax for severance payments. In the second quarter of 2020, the company recorded non-cash asset impairments of $62 million pretax and after-tax of fixed assets of an asphalt plant factory in Germany, $32 million pretax of equipment on operating leases and matured operating lease inventory, and $20 million pretax and after-tax of a minority investment in a construction equipment company headquartered in South Africa. |
Nine Months Ended August 2, 2020 | |||||||||||||
Expense: | Small Ag & Turf | Construction & Forestry | Financial Services | Total | |||||||||
Factory closure – Cost of sales | $ | 13 | $ | 13 | |||||||||
Long-lived asset impairments – Cost of sales | $ | 62 | 62 | ||||||||||
Investments in unconsolidated affiliates impairment – Equity in loss of unconsolidated affiliate | 20 | 20 | |||||||||||
Equipment on operating leases & matured operating lease inventory impairments – Other operating expenses | $ | 32 | 32 | ||||||||||
Total expense | $ | 13 | $ | 82 | $ | 32 | $ | 127 | |||||
2020 DispositionIn the third quarter of 2020, the company reached a definitive agreement to sell its German walk-behind lawn mower business. This transaction closed in the fourth quarter of 2020. A non-cash impairment of $24 million pretax and after-tax was recorded in "Other operating expenses" to write the operations down to realizable value. This activity was included in the company's small agriculture and turf segment. |
2020 Employee-Separation ProgramDuring the first quarter of 2020, the company implemented a voluntary employee-separation program with total pretax expenses as follows: | ||||||||||||||||
Nine Months Ended August 2, 2020 | ||||||||||||||||
Production & Precision Ag | Small Ag & Turf | Construction & Forestry | Financial Services | Total | ||||||||||||
Cost of sales | $ | 21 | $ | 11 | $ | 9 | $ | 41 | ||||||||
Research and development expenses | 8 | 7 | 4 | 19 | ||||||||||||
Selling, administrative and general expenses | 19 | 19 | 14 | $ | 3 | 55 | ||||||||||
Total operating profit impact | $ | 48 | $ | 37 | $ | 27 | $ | 3 | 115 | |||||||
Other operating expenses | 23 | |||||||||||||||
Total expense | $ | 138 | ||||||||||||||
(2) | Prior to November 2, 2020, the operating results of the Wirtgen Group (Wirtgen) were incorporated into the company's consolidated financial statements using a one-month lag period. In the first quarter of 2021, the reporting lag was eliminated resulting in one additional month of Wirtgen activity in the first quarter and the year-to-date period. The effect was an increase to "Net sales" of $270 million, which the company considers immaterial to construction and forestry's annual net sales. Prior period results were not restated. |
(3) | Dividends declared and paid on a per share basis were as follows: |
Three Months Ended | Nine Months Ended | ||||||||||||
August 1 | August 2 | August 1 | August 2 | ||||||||||
2021 | 2020 | 2021 | 2020 | ||||||||||
Dividends declared | $ | .90 | $ | .76 | $ | 2.56 | $ | 2.28 | |||||
Dividends paid | $ | .90 | $ | .76 | $ | 2.42 | $ | 2.28 | |||||
(4) | The calculation of basic net income per share is based on the average number of shares outstanding. The calculation of diluted net income per share recognizes any dilutive effect of share-based compensation. |
(5) | The consolidated financial statements represent the consolidation of all of Deere & Company's subsidiaries. In the supplemental consolidating data in Note 6 to the financial statements, the "Equipment Operations" represents the enterprise without "Financial Services," which include the company's production and precision agriculture operations, small agriculture and turf operations, and construction and forestry operations, and other corporate assets, liabilities, revenues, and expenses not reflected within "Financial Services." |
DEERE & COMPANY(6) SUPPLEMENTAL CONSOLIDATING DATASTATEMENT OF INCOMEFor the Three Months Ended August 1, 2021 and August 2, 2020(In millions of dollars) Unaudited
| ||||||||||||||||||||||||||
EQUIPMENT | FINANCIAL | |||||||||||||||||||||||||
OPERATIONS1 | SERVICES | ELIMINATIONS | CONSOLIDATED | |||||||||||||||||||||||
2021 | 2020 | 2021 | 2020 | 2021 | 2020 | 2021 | 2020 | |||||||||||||||||||
Net Sales and Revenues | ||||||||||||||||||||||||||
Net sales | $ | 10,413 | $ | 7,859 | $ | 10,413 | $ | 7,859 | ||||||||||||||||||
Finance and interest income | 33 | 25 | $ | 867 | $ | 878 | $ | (75) | $ | (65) | 825 | 838 | 2 | |||||||||||||
Other income | 263 | 206 | 96 | 73 | (70) | (51) | 289 | 228 | 3 | |||||||||||||||||
Total | 10,709 | 8,090 | 963 | 951 | (145) | (116) | 11,527 | 8,925 | ||||||||||||||||||
Costs and Expenses | ||||||||||||||||||||||||||
Cost of sales | 7,574 | 5,836 | (1) | 7,574 | 5,835 | 4 | ||||||||||||||||||||
Research and development expenses | 394 | 370 | 394 | 370 | ||||||||||||||||||||||
Selling, administrative and general expenses | 702 | 616 | 141 | 137 | (2) | (1) | 841 | 752 | 4 | |||||||||||||||||
Interest expense | 92 | 91 | 169 | 206 | (17) | (7) | 244 | 290 | 5 | |||||||||||||||||
Interest compensation to Financial Services | 58 | 58 | (58) | (58) | 5 | |||||||||||||||||||||
Other operating expenses | 32 | 94 | 360 | 363 | (68) | (49) | 324 | 408 | 6 | |||||||||||||||||
Total | 8,852 | 7,065 | 670 | 706 | (145) | (116) | 9,377 | 7,655 | ||||||||||||||||||
Income before Income Taxes | 1,857 | 1,025 | 293 | 245 | 2,150 | 1,270 | ||||||||||||||||||||
Provision for income taxes | 425 | 395 | 66 | 62 | 491 | 457 | ||||||||||||||||||||
Income after Income Taxes | 1,432 | 630 | 227 | 183 | 1,659 | 813 | ||||||||||||||||||||
Equity in income (loss) of unconsolidated affiliates | 8 | (2) | 8 | (2) | ||||||||||||||||||||||
Net Income | 1,440 | 628 | 227 | 183 | 1,667 | 811 | ||||||||||||||||||||
Less: Net income attributable to noncontrolling interests | ||||||||||||||||||||||||||
Net Income Attributable to Deere & Company | $ | 1,440 | $ | 628 | $ | 227 | $ | 183 | $ | 1,667 | $ | 811 | ||||||||||||||
The supplemental consolidating data is presented for informational purposes. Transactions between the Equipment Operations and Financial Services have been eliminated to arrive at the consolidated financial statements. | |
1 | The Equipment Operations represents the enterprise without Financial Services. The Equipment Operations includes the company's production and precision agriculture operations, small agriculture and turf operations, construction and forestry operations, and other corporate assets, liabilities, revenues, and expenses not reflected within Financial Services. |
2 | Elimination of Financial Services' interest income earned from Equipment Operations. |
3 | Elimination of Equipment Operations' margin from inventory transferred to equipment on operating leases. |
4 | Elimination of intercompany service fees. |
5 | Elimination of Equipment Operations' interest expense to Financial Services. |
6 | Elimination of Financial Services' lease depreciation expense related to inventory transferred to equipment on operating leases. |
DEERE & COMPANYSUPPLEMENTAL CONSOLIDATING DATA (Continued)STATEMENT OF INCOMEFor the Nine Months Ended August 1, 2021 and August 2, 2020(In millions of dollars) Unaudited
| ||||||||||||||||||||||||||
EQUIPMENT | FINANCIAL | |||||||||||||||||||||||||
OPERATIONS1 | SERVICES | ELIMINATIONS | CONSOLIDATED | |||||||||||||||||||||||
2021 | 2020 | 2021 | 2020 | 2021 | 2020 | 2021 | 2020 | |||||||||||||||||||
Net Sales and Revenues | ||||||||||||||||||||||||||
Net sales | $ | 29,461 | $ | 22,612 | $ | 29,461 | $ | 22,612 | ||||||||||||||||||
Finance and interest income | 95 | 75 | $ | 2,582 | $ | 2,720 | $ | (209) | $ | (211) | 2,468 | 2,584 | 2 | |||||||||||||
Other income | 712 | 597 | 269 | 196 | (213) | (180) | 768 | 613 | 3 | |||||||||||||||||
Total | 30,268 | 23,284 | 2,851 | 2,916 | (422) | (391) | 32,697 | 25,809 | ||||||||||||||||||
Costs and Expenses | ||||||||||||||||||||||||||
Cost of sales | 21,309 | 17,208 | (2) | (2) | 21,307 | 17,206 | 4 | |||||||||||||||||||
Research and development expenses | 1,137 | 1,201 | 1,137 | 1,201 | ||||||||||||||||||||||
Selling, administrative and general expenses | 2,089 | 1,989 | 365 | 483 | (6) | (5) | 2,448 | 2,467 | 4 | |||||||||||||||||
Interest expense | 287 | 237 | 539 | 747 | (43) | (15) | 783 | 969 | 5 | |||||||||||||||||
Interest compensation to Financial Services | 166 | 195 | (166) | (195) | 5 | |||||||||||||||||||||
Other operating expenses | 140 | 186 | 1,098 | 1,187 | (205) | (174) | 1,033 | 1,199 | 6 | |||||||||||||||||
Total | 25,128 | 21,016 | 2,002 | 2,417 | (422) | (391) | 26,708 | 23,042 | ||||||||||||||||||
Income before Income Taxes | 5,140 | 2,268 | 849 | 499 | 5,989 | 2,767 | ||||||||||||||||||||
Provision for income taxes | 1,130 | 632 | 198 | 120 | 1,328 | 752 | ||||||||||||||||||||
Income after Income Taxes | 4,010 | 1,636 | 651 | 379 | 4,661 | 2,015 | ||||||||||||||||||||
Equity in income (loss) of unconsolidated affiliates | 18 | (22) | 3 | 2 | 21 | (20) | ||||||||||||||||||||
Net Income | 4,028 | 1,614 | 654 | 381 | 4,682 | 1,995 | ||||||||||||||||||||
Less: Net income attributable to noncontrolling interests | 2 | 2 | 2 | 2 | ||||||||||||||||||||||
Net Income Attributable to Deere & Company | $ | 4,026 | $ | 1,612 | $ | 654 | $ | 381 | $ | 4,680 | $ | 1,993 | ||||||||||||||
The supplemental consolidating data is presented for informational purposes. Transactions between the Equipment Operations and Financial Services have been eliminated to arrive at the consolidated financial statements. | |
1 | The Equipment Operations represents the enterprise without Financial Services. The Equipment Operations includes the company's production and precision agriculture operations, small agriculture and turf operations, construction and forestry operations, and other corporate assets, liabilities, revenues, and expenses not reflected within Financial Services. |
2 | Elimination of Financial Services' interest income earned from Equipment Operations. |
3 | Elimination of Equipment Operations' margin from inventory transferred to equipment on operating leases. |
4 | Elimination of intercompany service fees. |
5 | Elimination of Equipment Operations' interest expense to Financial Services. |
6 | Elimination of Financial Services' lease depreciation expense related to inventory transferred to equipment on operating leases. |
DEERE & COMPANYSUPPLEMENTAL CONSOLIDATING DATA (Continued)CONDENSED BALANCE SHEET(In millions of dollars) Unaudited
| ||||||||||||||||||||||||||||||||||||||
EQUIPMENT | FINANCIAL | |||||||||||||||||||||||||||||||||||||
OPERATIONS1 | SERVICES | ELIMINATIONS | CONSOLIDATED | |||||||||||||||||||||||||||||||||||
Aug 1 | Nov 1 | Aug 2 | Aug 1 | Nov 1 | Aug 2 | Aug 1 | Nov 1 | Aug 2 | Aug 1 | Nov 1 | Aug 2 | |||||||||||||||||||||||||||
2021 | 2020 | 2020 | 2021 | 2020 | 2020 | 2021 | 2020 | 2020 | 2021 | 2020 | 2020 | |||||||||||||||||||||||||||
Assets | ||||||||||||||||||||||||||||||||||||||
Cash and cash equivalents | $ | 6,638 | $ | 6,145 | $ | 7,440 | $ | 881 | $ | 921 | $ | 750 | $ | 7,519 | $ | 7,066 | $ | 8,190 | ||||||||||||||||||||
Marketable securities | 3 | 7 | 8 | 685 | 634 | 632 | 688 | 641 | 640 | |||||||||||||||||||||||||||||
Receivables from unconsolidated affiliates | 5,942 | 5,290 | 3,619 | $ | (5,913) | $ | (5,259) | $ | (3,593) | 29 | 31 | 26 | 7 | |||||||||||||||||||||||||
Trade accounts and notes receivable - net | 1,127 | 1,013 | 1,251 | 5,319 | 4,238 | 5,595 | (1,178) | (1,080) | (1,373) | 5,268 | 4,171 | 5,473 | 8 | |||||||||||||||||||||||||
Financing receivables - net | 89 | 106 | 111 | 31,360 | 29,644 | 27,703 | 31,449 | 29,750 | 27,814 | |||||||||||||||||||||||||||||
Financing receivables securitized - net | 13 | 26 | 37 | 5,388 | 4,677 | 5,432 | 5,401 | 4,703 | 5,469 | |||||||||||||||||||||||||||||
Other receivables | 1,516 | 1,117 | 1,083 | 171 | 151 | 162 | (14) | (48) | (28) | 1,673 | 1,220 | 1,217 | 8 | |||||||||||||||||||||||||
Equipment on operating leases - net | 6,982 | 7,298 | 7,158 | 6,982 | 7,298 | 7,158 | ||||||||||||||||||||||||||||||||
Inventories | 6,410 | 4,999 | 5,650 | 6,410 | 4,999 | 5,650 | ||||||||||||||||||||||||||||||||
Property and equipment - net | 5,612 | 5,778 | 5,711 | 37 | 39 | 43 | 5,649 | 5,817 | 5,754 | |||||||||||||||||||||||||||||
Investments in unconsolidated affiliates | 166 | 174 | 180 | 22 | 19 | 19 | 188 | 193 | 199 | |||||||||||||||||||||||||||||
Goodwill | 3,148 | 3,081 | 2,984 | 3,148 | 3,081 | 2,984 | ||||||||||||||||||||||||||||||||
Other intangible assets - net | 1,267 | 1,327 | 1,301 | 1,267 | 1,327 | 1,301 | ||||||||||||||||||||||||||||||||
Retirement benefits | 986 | 859 | 972 | 63 | 59 | 59 | (59) | (55) | 990 | 863 | 1,031 | 9 | ||||||||||||||||||||||||||
Deferred income taxes | 1,959 | 1,763 | 1,865 | 59 | 45 | 56 | (251) | (309) | (387) | 1,767 | 1,499 | 1,534 | 10 | |||||||||||||||||||||||||
Other assets | 1,581 | 1,439 | 1,566 | 680 | 994 | 1,260 | (1) | (1) | (2) | 2,260 | 2,432 | 2,824 | ||||||||||||||||||||||||||
Total Assets | $ | 36,457 | $ | 33,124 | $ | 33,778 | $ | 51,647 | $ | 48,719 | $ | 48,869 | $ | (7,416) | $ | (6,752) | $ | (5,383) | $ | 80,688 | $ | 75,091 | $ | 77,264 | ||||||||||||||
Liabilities and Stockholders' Equity | ||||||||||||||||||||||||||||||||||||||
Liabilities | ||||||||||||||||||||||||||||||||||||||
Short-term borrowings | $ | 1,376 | $ | 292 | $ | 853 | $ | 9,028 | $ | 8,290 | $ | 8,222 | $ | 10,404 | $ | 8,582 | $ | 9,075 | ||||||||||||||||||||
Short-term securitization borrowings | 12 | 26 | 37 | 5,265 | 4,656 | 5,324 | 5,277 | 4,682 | 5,361 | |||||||||||||||||||||||||||||
Payables to unconsolidated affiliates | 116 | 104 | 80 | 5,913 | 5,260 | 3,593 | $ | (5,913) | $ | (5,259) | $ | (3,593) | 116 | 105 | 80 | 7 | ||||||||||||||||||||||
Accounts payable and accrued expenses | 10,368 | 9,114 | 8,834 | 1,916 | 2,127 | 2,134 | (1,193) | (1,129) | (1,403) | 11,091 | 10,112 | 9,565 | 8 | |||||||||||||||||||||||||
Deferred income taxes | 371 | 385 | 398 | 395 | 443 | 468 | (251) | (309) | (387) | 515 | 519 | 479 | 10 | |||||||||||||||||||||||||
Long-term borrowings | 8,982 | 10,124 | 10,217 | 23,298 | 22,610 | 23,820 | 32,280 | 32,734 | 34,037 | |||||||||||||||||||||||||||||
Retirement benefits and other liabilities | 5,219 | 5,366 | 5,671 | 112 | 102 | 105 | (59) | (55) | 5,272 | 5,413 | 5,776 | 9 | ||||||||||||||||||||||||||
Total liabilities | 26,444 | 25,411 | 26,090 | 45,927 | 43,488 | 43,666 | (7,416) | (6,752) | (5,383) | 64,955 | 62,147 | 64,373 | ||||||||||||||||||||||||||
Stockholders' Equity | ||||||||||||||||||||||||||||||||||||||
Total Deere & Company stockholders' equity | 15,731 | 12,937 | 12,888 | 5,720 | 5,231 | 5,203 | (5,720) | (5,231) | (5,203) | 15,731 | 12,937 | 12,888 | 11 | |||||||||||||||||||||||||
Noncontrolling interests | 2 | 7 | 3 | 2 | 7 | 3 | ||||||||||||||||||||||||||||||||
Financial Services equity | (5,720) | (5,231) | (5,203) | 5,720 | 5,231 | 5,203 | 11 | |||||||||||||||||||||||||||||||
Adjusted total stockholders' equity | 10,013 | 7,713 | 7,688 | 5,720 | 5,231 | 5,203 | 15,733 | 12,944 | 12,891 | |||||||||||||||||||||||||||||
Total Liabilities and Stockholders' Equity | $ | 36,457 | $ | 33,124 | $ | 33,778 | $ | 51,647 | $ | 48,719 | $ | 48,869 | $ | (7,416) | $ | (6,752) | $ | (5,383) | $ | 80,688 | $ | 75,091 | $ | 77,264 | ||||||||||||||
The supplemental consolidating data is presented for informational purposes. Transactions between the Equipment Operations and Financial Services have been eliminated to arrive at the consolidated financial statements. | |
1 | The Equipment Operations represents the enterprise without Financial Services. The Equipment Operations includes the company's production and precision agriculture operations, small agriculture and turf operations, construction and forestry operations, and other corporate assets, liabilities, revenues, and expenses not reflected within Financial Services. |
7 | Elimination of receivables / payables between Equipment Operations and Financial Services. |
8 | Reclassification of sales incentive accruals on receivables sold to Financial Services. |
9 | Reclassification of net pension assets / liabilities. |
10 | Reclassification of deferred tax assets / liabilities in the same taxing jurisdictions. |
11 | Elimination of Financial Services' equity. |
DEERE & COMPANYSUPPLEMENTAL CONSOLIDATING DATA (Continued)STATEMENT OF CASH FLOWS For the Nine Months Ended August 1, 2021 and August 2, 2020(In millions of dollars) Unaudited | ||||||||||||||||||||||||||
EQUIPMENT | FINANCIAL | |||||||||||||||||||||||||
OPERATIONS1 | SERVICES | ELIMINATIONS | CONSOLIDATED | |||||||||||||||||||||||
2021 | 2020 | 2021 | 2020 | 2021 | 2020 | 2021 | 2020 | |||||||||||||||||||
Cash Flows from Operating Activities | ||||||||||||||||||||||||||
Net income | $ | 4,028 | $ | 1,614 | $ | 654 | $ | 381 | $ | 4,682 | $ | 1,995 | ||||||||||||||
Adjustments to reconcile net income to net cash provided by operating activities: | ||||||||||||||||||||||||||
Provision (credit) for credit losses | 5 | 6 | (22) | 117 | (17) | 123 | ||||||||||||||||||||
Provision for depreciation and amortization | 803 | 787 | 866 | 925 | $ | (100) | $ | (98) | 1,569 | 1,614 | 12 | |||||||||||||||
Impairment charges | 50 | 115 | 32 | 50 | 147 | |||||||||||||||||||||
Share-based compensation expense | 64 | 63 | 64 | 63 | 13 | |||||||||||||||||||||
Undistributed earnings of unconsolidated affiliates | 246 | 257 | (2) | (1) | (240) | (261) | 4 | (5) | 14 | |||||||||||||||||
Credit for deferred income taxes | (218) | (57) | (53) | (103) | (271) | (160) | ||||||||||||||||||||
Changes in assets and liabilities: | ||||||||||||||||||||||||||
Trade, notes, and financing receivables related to sales | (73) | 116 | (371) | 510 | (444) | 626 | 15, 17, 18 | |||||||||||||||||||
Inventories | (1,367) | 387 | (450) | (388) | (1,817) | (1) | 16 | |||||||||||||||||||
Accounts payable and accrued expenses | 860 | (567) | (20) | (38) | (98) | 33 | 742 | (572) | 17 | |||||||||||||||||
Accrued income taxes payable/receivable | 43 | (25) | (9) | 29 | 34 | 4 | ||||||||||||||||||||
Retirement benefits | 8 | 77 | 5 | 11 | 13 | 88 | ||||||||||||||||||||
Other | (200) | 145 | 26 | 89 | (121) | (99) | (295) | 135 | 12, 13, 16 | |||||||||||||||||
Net cash provided by operating activities | 4,185 | 2,855 | 1,445 | 1,442 | (1,316) | (240) | 4,314 | 4,057 | ||||||||||||||||||
Cash Flows from Investing Activities | ||||||||||||||||||||||||||
Collections of receivables (excluding receivables related to sales) | 15,704 | 14,352 | (1,224) | (1,115) | 14,480 | 13,237 | 15 | |||||||||||||||||||
Proceeds from maturities and sales of marketable securities | 4 | 78 | 70 | 82 | 70 | |||||||||||||||||||||
Proceeds from sales of equipment on operating leases | 1,510 | 1,310 | 1,510 | 1,310 | ||||||||||||||||||||||
Cost of receivables acquired (excluding receivables related to sales) | (18,349) | (15,367) | 1,188 | 918 | (17,161) | (14,449) | 15 | |||||||||||||||||||
Acquisitions of businesses, net of cash acquired | (19) | (19) | ||||||||||||||||||||||||
Purchases of marketable securities | (115) | (91) | (115) | (91) | ||||||||||||||||||||||
Purchases of property and equipment | (491) | (591) | (1) | (3) | (492) | (594) | ||||||||||||||||||||
Cost of equipment on operating leases acquired | (1,818) | (1,836) | 608 | 524 | (1,210) | (1,312) | 16 | |||||||||||||||||||
Decrease (increase) in trade and wholesale receivables | (481) | 423 | 481 | (423) | 15 | |||||||||||||||||||||
Collateral on derivatives – net | (4) | (6) | (185) | 330 | (189) | 324 | ||||||||||||||||||||
Other | (14) | (55) | (5) | (46) | 31 | 89 | 12 | (12) | 14, 18 | |||||||||||||||||
Net cash used for investing activities | (524) | (652) | (3,662) | (858) | 1,084 | (7) | (3,102) | (1,517) | ||||||||||||||||||
Cash Flows from Financing Activities | ||||||||||||||||||||||||||
Increase (decrease) in total short-term borrowings | (93) | (32) | 1,022 | 202 | 929 | 170 | ||||||||||||||||||||
Change in intercompany receivables/payables | (624) | (1,468) | 624 | 1,468 | ||||||||||||||||||||||
Proceeds from long-term borrowings | 4,592 | 5,877 | 3,739 | 5,877 | 8,331 | |||||||||||||||||||||
Payments of long-term borrowings | (71) | (179) | (5,101) | (5,618) | (5,172) | (5,797) | ||||||||||||||||||||
Proceeds from issuance of common stock | 136 | 111 | 136 | 111 | ||||||||||||||||||||||
Repurchases of common stock | (1,780) | (263) | (1,780) | (263) | ||||||||||||||||||||||
Dividends paid | (761) | (718) | (240) | (260) | 240 | 260 | (761) | (718) | 14 | |||||||||||||||||
Other | (50) | (86) | (22) | (11) | (8) | (13) | (80) | (110) | 14 | |||||||||||||||||
Net cash provided by (used for) financing activities | (3,243) | 1,957 | 2,160 | (480) | 232 | 247 | (851) | 1,724 | ||||||||||||||||||
Effect of Exchange Rate Changes on Cash, Cash Equivalents, and Restricted Cash | 77 | 95 | 29 | (15) | 106 | 80 | ||||||||||||||||||||
Net Increase (Decrease) in Cash, Cash Equivalents, and Restricted Cash | 495 | 4,255 | (28) | 89 | 467 | 4,344 | ||||||||||||||||||||
Cash, Cash Equivalents, and Restricted Cash at Beginning of Period | 6,156 | 3,196 | 1,016 | 760 | 7,172 | 3,956 | ||||||||||||||||||||
Cash, Cash Equivalents, and Restricted Cash at End of Period | $ | 6,651 | $ | 7,451 | $ | 988 | $ | 849 | $ | 7,639 | $ | 8,300 | ||||||||||||||
The supplemental consolidating data is presented for informational purposes. Transactions between the Equipment Operations and Financial Services have been eliminated to arrive at the consolidated financial statements. | |
1 | The Equipment Operations represents the enterprise without Financial Services. The Equipment Operations includes the company's production and precision agriculture operations, small agriculture and turf operations, construction and forestry operations, and other corporate assets, liabilities, revenues, and expenses not reflected within Financial Services. |
12 | Elimination of depreciation on leases related to inventory transferred to equipment on operating leases. |
13 | Reclassification of share-based compensation expense. |
14 | Elimination of dividends from Financial Services to the Equipment Operations, which are included in the Equipment Operations net cash provided by operating activities, and capital investments in Financial Services from the Equipment Operations. |
15 | Primarily reclassification of receivables related to the sale of equipment. |
16 | Reclassification of lease agreements with direct customers. |
17 | Reclassification of sales incentive accruals on receivables sold to Financial Services. |
18 | Elimination and reclassification of the effects of Financial Services partial financing of the construction and forestry retail locations sales and subsequent collection of those amounts. |
DEERE & COMPANYOTHER FINANCIAL INFORMATION
The company evaluates its business results on the basis of accounting principles generally accepted in the United States. In addition, it uses a metric referred to as Shareholder Value Added (SVA), which management believes is an appropriate measure for the performance of its businesses. SVA is, in effect, the pretax profit left over after subtracting the cost of enterprise capital. The company is aiming for a sustained creation of SVA and is using this metric for various performance goals. Certain compensation is also determined on the basis of performance using this measure. For purposes of determining SVA, each of the equipment segments is assessed a pretax cost of assets, which on an annual basis is approximately 12 percent of the segment's average identifiable operating assets during the applicable period with inventory at standard cost. Management believes that valuing inventories at standard cost more closely approximates the current cost of inventory and the company's investment in the asset. The Financial Services segment is assessed an annual pretax cost of approximately 13 percent of the segment's average equity. The cost of assets or equity, as applicable, is deducted from the operating profit or added to the operating loss of each segment to determine the amount of SVA.
Equipment | Production & | Small Ag | Construction | |||||||||||||||||||||||
For the Nine Months Ended | Operations | Precision Ag | & Turf | & Forestry | ||||||||||||||||||||||
August 1 | August 2 | August 1 | August 2 | August 1 | August 2 | August 1 | August 2 | |||||||||||||||||||
Dollars in millions | 2021 | 2020 | 2021 | 2020 | 2021 | 2020 | 2021 | 2020 | ||||||||||||||||||
Net Sales | $ | 29,461 | $ | 22,612 | $ | 11,848 | $ | 9,161 | $ | 9,051 | $ | 6,966 | $ | 8,562 | $ | 6,485 | ||||||||||
Net Sales - excluding Wirtgen | 20,466 | 9,161 | 6,966 | 4,339 | ||||||||||||||||||||||
Average Identifiable Assets* | ||||||||||||||||||||||||||
With Inventories at LIFO | $ | 16,496 | $ | 16,930 | $ | 6,518 | $ | 6,341 | $ | 3,558 | $ | 3,619 | $ | 6,420 | $ | 6,970 | ||||||||||
With Inventories at LIFO - excluding Wirtgen | 12,916 | 6,341 | 3,619 | 2,956 | ||||||||||||||||||||||
With Inventories at Standard Cost | 17,877 | 18,349 | 7,205 | 7,049 | 3,988 | 4,063 | 6,684 | 7,237 | ||||||||||||||||||
With Inventories at Standard Cost - excluding Wirtgen | 14,335 | 7,049 | 4,063 | 3,223 | ||||||||||||||||||||||
Operating Profit | $ | 5,476 | $ | 2,503 | $ | 2,557 | $ | 1,391 | $ | 1,699 | $ | 718 | $ | 1,220 | $ | 394 | ||||||||||
Operating Profit - excluding Wirtgen | 2,336 | 1,391 | 718 | 227 | ||||||||||||||||||||||
Percent of Net Sales** | 18.6 | % | 11.4 | % | 21.6 | % | 15.2 | % | 18.8 | % | 10.3 | % | 14.2 | % | 5.2 | % | ||||||||||
Operating Return on Assets** | ||||||||||||||||||||||||||
With Inventories at LIFO | 33.2 | % | 18.1 | % | 39.2 | % | 21.9 | % | 47.8 | % | 19.8 | % | 19.0 | % | 7.7 | % | ||||||||||
With Inventories at Standard Cost | 30.6 | % | 16.3 | % | 35.5 | % | 19.7 | % | 42.6 | % | 17.7 | % | 18.3 | % | 7.0 | % | ||||||||||
SVA Cost of Assets** | $ | (1,609) | $ | (1,290) | $ | (648) | $ | (634) | $ | (359) | $ | (366) | $ | (602) | $ | (290) | ||||||||||
SVA** | 3,867 | 1,046 | 1,909 | 757 | 1,340 | 352 | 618 | (63) | ||||||||||||||||||
Financial | ||||||||||||||||||||||||||
For the Nine Months Ended | Services | |||||||||||||||||||||||||
August 1 | August 2 | |||||||||||||||||||||||||
Dollars in millions | 2021 | 2020 | ||||||||||||||||||||||||
Net Income Attributable to Deere & Company | $ | 654 | $ | 381 | ||||||||||||||||||||||
Average Equity | 5,468 | 5,076 | ||||||||||||||||||||||||
Return on Equity | 12.0 | % | 7.5 | % | ||||||||||||||||||||||
Operating Profit | $ | 844 | $ | 498 | ||||||||||||||||||||||
Cost of Equity | (531) | (501) | ||||||||||||||||||||||||
SVA | 313 | (3) | ||||||||||||||||||||||||
* At the beginning of fiscal year 2021, the company reclassified goodwill from the Equipment Operations segments' identifiable assets to corporate assets. Operating return on assets (OROA) and SVA exclude the impact of goodwill. Prior period information has been recast for a consistent presentation. | ||||||||||||||||||||||||||
** Beginning in fiscal year 2021, the results and assets related to the Wirtgen Group (Wirtgen) are included in the calculation of OROA and SVA. Due to integration efforts, the 2020 information did not include Wirtgen's results and assets. Prior period information was not recast for this change, which is consistent with the company's internal presentation. | ||||||||||||||||||||||||||
 View original content to download multimedia:https://www.prnewswire.com/news-releases/deere-reports-third-quarter-net-income-of-1-667-billion-301359603.html
SOURCE Deere & Company
Serious News for Serious Traders! Try StreetInsider.com Premium Free!
You May Also Be Interested In
- Sysco closes C$1.5 billion senior notes offering for Jetro acquisition
- BofA raises AMD target to $720, sees server CPU TAM tripling to $211B by 2030
- CrowdStrike probe closed by US prosecutors without charges
Create E-mail Alert Related Categories
PRNewswire, Press ReleasesRelated Entities
Dividend, Earnings, Housing StartsSign up for StreetInsider Free!
Receive full access to all new and archived articles, unlimited portfolio tracking, e-mail alerts, custom newswires and RSS feeds - and more!
