

Core Lab Reports First Quarter 2021 Results From Continuing Operations:
- COMPANY FIRST QUARTER REVENUE OF $108.4 MILLION; DOWN 4.7% SEQUENTIALLY - FIRST QUARTER GAAP EPS OF $0.18; $0.15, EX-ITEMS; DOWN 15.6% SEQUENTIALLY - COMPANY COMPLETES PREVIOUSLY ANNOUNCED AT-THE-MARKET PROGRAM - CORE REDUCES NET DEBT BY $65.0 MILLION - CORE GENERATES FCF OF $5.2 MILLION - CORE ANNOUNCES Q2 2021 QUARTERLY DIVIDEND
 Tweet
Tweet Share
ShareAMSTERDAM, April 21, 2021 /PRNewswire/ -- Core Laboratories N.V. (NYSE: "CLB US" and Euronext Amsterdam: "CLB NA") ("Core", "Core Lab", or the "Company") reported continuing operations resulted in first quarter 2021 revenue of $108,400,000. Core's operating income was $11,600,000, with earnings per diluted share ("EPS") of $0.18, all in accordance with U.S. generally accepted accounting principles ("GAAP"). Operating income, ex-items, a non-GAAP financial measure, was $12,000,000, yielding operating margins of 11.0% and EPS, ex-items, of $0.15. A full reconciliation of non-GAAP financial measures and year-over-year comparisons are included in the attached financial tables.
Core's CEO, Larry Bruno stated, "In addition to typical seasonality, during which client activity generally decreases from the fourth quarter to the first quarter of the new year, the severe winter storm in February 2021 in the mid-continent region of North America adversely impacted both Reservoir Description and Production Enhancement. On-going pandemic disruptions also posed continuing challenges in the first quarter of 2021, primarily across international operations. Despite the headwinds, Core generated positive earnings and free cash flow in the first quarter of 2021, and remains optimistic regarding the remainder of 2021, as activity in North America progresses and international activity builds momentum."
Liquidity, Free Cash Flow and Dividend
On 17 December 2020, Core Lab announced an At-The-Market ("ATM") equity offering program under which it could sell, from time to time, common shares of the Company up to an aggregate value of $60,000,000. The Company issued 1,658,012 shares at a weighted average share price of $36.19 under the program, which was completed on 10 March 2021. Net proceeds of $59,100,000, after fees and commissions, were used to reduce outstanding debt on the Company's revolving credit facility.
Core continues to focus on generating free cash flow ("FCF"), a non-GAAP financial measure defined as cash from operations less capital expenditures. For the first quarter of 2021, cash from operations was $8,000,000 and capital expenditures were $2,800,000, yielding FCF of $5,200,000, marking another quarter in the Company's long history of generating positive FCF. The financial results of the first quarter of 2021 include costs associated with disruptions and damage to facilities caused by the winter storm that impacted North America in February 2021. Core does not expect the winter storm to cause any residual negative operational effects in the second quarter of 2021.
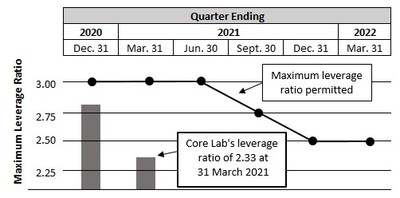
For the first quarter of 2021, after funding the quarterly dividend, free cash was used to reduce the Company's outstanding debt. Including the use of proceeds from the ATM program, net debt was decreased by $65,000,000 or 26%. Core will continue to use free cash to reduce debt for the foreseeable future. As of 31 March 2021, Core Lab's leverage ratio was 2.33, with $214,000,000 of available capacity under the Company's revolving credit facility.
The Company anticipates it will continue to generate free cash flow and reduce net debt, while maintaining ample liquidity and remaining in compliance with all debt covenants.
The following graph summarizes the maximum leverage ratio permitted through 31 March 2022:
On 15 January 2021, Core's Board of Supervisory Directors ("Board") announced a quarterly cash dividend of $0.01 per share of common stock, which was paid on 16 February 2021 to shareholders of record on 25 January 2021. Dutch withholding tax was deducted from the dividend at a rate of 15%.
On 21 April 2021, the Board approved a cash dividend of $0.01 per share of common stock payable in the second quarter of 2021. The second quarter dividend will be payable on Tuesday, 18 May 2021, to shareholders of record on Monday, 3 May 2021. Dutch withholding tax will be deducted from the dividend at a rate of 15%.
Reservoir Description
Reservoir Description revenue in the first quarter of 2021 was $76,500,000, down nearly 9% sequentially due to i) anticipated seasonality in international regions, which historically slows client activity in the first quarter, and ii) the compounding effect of the North America mid-continent winter storm, which impacted lab operations from Canada to the U.S. Gulf coast. Additionally, on-going disruptions associated with COVID-19 negatively impacted client activity and project advancement in parts of Europe, South America, and the Middle East. Operating income for the first quarter of 2021 on a GAAP basis was $10,100,000, while operating income, ex-items, was $10,200,000, down 17% sequentially, yielding operating margins, ex-items, of 13%. While operating margins were negatively impacted by workplace disruptions and additional costs caused by the winter storm, operations were restored in most locations within ten days or less, helping to minimize impact to the quarter.
New international projects for Reservoir Description are spooling up. In the first quarter of 2021, Core Lab, under the direction of Türkiye Petrolleri Anonim Ortaklığı ("TPAO"), was engaged to provide laboratory analyses on conventional core recovered from the Türkali-2 well, located in the deepwater Sakarya Gas Field in the Black Sea. This multi-well analytical program is leveraging Core's proprietary and patented laboratory technologies, as well as Core's extensive global experience evaluating cores from unconsolidated strata. The core analyses will evaluate key geologic, engineering and economic questions in this significant, deepwater, natural gas discovery. Upon arrival at the laboratory, conventional cores were immediately scanned using Core's proprietary Non-Invasive Testing and Reservoir Optimization ("NITROSM") technologies, including proprietary Dual-Energy Computed Tomography ("DECTSM") and High Frequency Spectral Gamma surface logging. The results quickly provided TPAO scientists with lithologic information, as well as a wide range of critical petrophysical parameters for pay delineation. NITROSM deliverables were presented within a week of receiving the core. These initial analyses are being utilized in conjunction with Core's recently expanded, machine learning, artificial intelligence algorithms to refine sample selection for the traditional, time-honored physical measurements program. Core samples are now progressing through the laboratory following consultations between TPAO's and Core Lab's technical teams. Core Lab is pleased to be assisting TPAO in this important natural gas discovery.
Also, in the first quarter of 2021, Core continued work on a large-scale, multi-well, integrated project for a national oil company in the Middle East. This study is evaluating an onshore unconventional reservoir. Leveraging Core's experience in the region and best practices learned from Core's global portfolio of unconventional reservoir studies, a comprehensive laboratory analysis program is underway to evaluate rock types, fracture and deformation characteristics, petrophysical properties, organic content and maturity, as well as geomechanical properties. Core Lab will incorporate these laboratory measured data sets into a fully integrated petrophysical model that will include recommendations on completion strategies.
Industry adoption of Core's proprietary D-CodeSM formation modeling application continued to accelerate during the quarter. This new methodology converts drilling data into calculated geomechanical information. The ability to gain insight into geologic variability along both vertical and horizontal wellbores allows Core's clients to make effective, time-sensitive decisions related to wellbore stability and the identification of completion target intervals. During the first quarter, projects were initiated on conventional and unconventional reservoirs, located in both the U.S. and the Middle East. D-CodeSM identifies key parameters for effective completion strategies, such as the location of fractures and faults, as well as formation pressure and rock variability between stages. This physics-based model is made possible because of Core Lab's unique, proprietary database of rock, fluid and pressure data.
Production Enhancement
Production Enhancement operations, which are focused on complex completions in unconventional, tight-oil reservoirs in the U.S., as well as conventional offshore projects across the globe, posted first quarter 2021 revenue of $31,900,000, up 7% sequentially. Although the North America winter storm negatively impacted February's U.S. land completion activity, the segment's positive sequential performance was the result of continued strength in energetic product sales during the quarter. Operating income on a GAAP basis was $1,600,000, while operating income, ex-items, was $1,800,000, up 53% sequentially. This generated incremental margins of just over 30%, despite inefficiencies caused by the winter storm. Operating margins were 6% for the first quarter of 2021, which improved sequentially by approximately 170 bps.
Recently, Production Enhancement introduced a new, innovative well intervention technology, Core's proprietary Rapid Deployment System ("RDSTM"). RDSTM offers a cost-effective solution for remediating wells with down hole production pumps that may become plugged or inoperable. Compromised subsurface pumps often require the operator to pull a wet, fluid-filled tubing string, which may cause environmental hazards at the wellsite. Conventional remediation methods require mobilizing a wireline unit to the wellsite to perforate and drain the tubing, resulting in lost time and increased cost to the operator. RDSTM achieves the same results without the need for a wireline unit. The highly robust RDSTM can be deployed in wells with high levels of H2S, or in wells that have stimulation acid trapped in the tubing. In both of these scenarios, RDSTM helps to minimize corrosion to the tubulars, downhole tools and wireline cables.
During the first quarter of 2021, a U.S. land-based operator utilized RDSTM to remedy a tubing string filled with fluid containing 15% hydrochloric acid by volume. The fluid became trapped in the tubing when an acid squeeze job failed to break down. RDSTM was deployed and triggered within minutes of being introduced into the wellbore. The acid was displaced through the new perforations, saving the operator the expense of a wireline unit, as well as service charges for acid damage to a wireline cable.
Also, during the first quarter of 2021, Core's completion diagnostics expertise was utilized by a client completing multiple wells in the Spraberry Formation of the Permian Basin. The goal was to assess whether the target interval in the producing well, and a superjacent water-bearing San Andres zone, had been properly isolated by the cement job. The operator had been experiencing losses of both drilling mud and cement when completing these Spraberry producers, along with higher than expected water cut when the wells were brought on production. At the client's request, Core utilized its proprietary SPECTRASTIM™ diagnostic technology to evaluate cement coverage across the two zones of interest. In the same completion operation, SPECTRASTIM™ was also used to trace the drilling mud cement spacer to help identify thief zones in three wells. Core's completion diagnostics engineers were able to confirm the location of the thief zones, along with incomplete cement isolation of the water-bearing San Andres interval. The findings led the operator to change the design of their two-stage cementing program, resulting in more effective zone isolation, decreased water production and reduced water disposal costs.
Return On Invested Capital
The Board and the Company's Executive Management continue to focus on strategies that maximize return on invested capital ("ROIC") and FCF, factors that have high correlation to total shareholder return. Core's commitment to an asset-light business model and disciplined capital stewardship promote capital efficiency and are designed to produce more predictable and superior long-term ROIC.
Global events in 2020 created adverse effects which triggered significant asset impairments for goodwill, intangible assets, inventory and other fixed assets, which further distort underlying financial performance and performance metrics, such as ROIC. The Board has established an internal performance metric of demonstrating superior ROIC performance relative to the oilfield service companies listed as Core's Comp Group by Bloomberg, as we continue to believe superior ROIC will result in higher total return to shareholders. See Bloomberg ROIC and adjusted ROIC in attached financial tables.
Industry and Core Lab Outlook
For 2021, Core will continue to execute its strategic plan with a focus on generating free cash flow and reducing net debt, while maximizing ROIC. Additionally, as part of Core's 2021 strategic focus, the Company will continue to invest in targeted, client-driven technologies that aim to both solve problems and capitalize on Core's growth opportunities. The Company remains well-positioned, with ample liquidity to invest in its global capabilities, to meet the needs of its clients. These capabilities include Core's expanding proprietary databases, along with innovations in artificial intelligence and machine learning, which are the foundation of Core's digital technology transformation.
Core is optimistic about its international growth opportunities throughout the remainder of 2021 as crude oil markets rebound. With Core Lab having more than 70% of its revenue exposed to international activity, the Company remains active on international projects already underway. Core sees momentum building in the international market, which will drive growth opportunities for the Company throughout the remainder of 2021 and beyond; some of these geographic areas include: Turkey, the South Atlantic Margin, Mexico, Qatar and various other areas of the Middle East. While unpredictable disruptions related to COVID-19 are expected to persist in the near to mid-term, Core remains optimistic there will be gradual improvement over the remainder of 2021. Considering the continuing improvement in international activity, Core projects Reservoir Description revenue to be up mid to high single digits, sequentially, for the second quarter of 2021.
Core also expects sequential improvement in U.S. land activity, based in part on a strong recovery in the U.S. frac spread following the winter storm; this positive trend continued into April 2021. As a result, Core Lab projects Production Enhancement revenue to grow by mid to high teens, sequentially, in the second quarter of 2021. Core expects Production Enhancement to continue to track or outperform U.S. land activity levels.
In summary, excluding near-term international challenges related to travel restrictions, Core Lab sees activity levels and financial performance improving throughout the remainder of 2021. Core's growth opportunities are directly related to existing long-term projects returning to normal workflows, as well as expanding client activity and new market penetration, particularly internationally.
The Company's second quarter 2021 guidance is based on projections for underlying operations and excludes gains and losses in foreign exchange. Second quarter 2021 guidance also assumes an effective tax rate of 20%. After fully executing the ATM program, the Company's ordinary share count outstanding was 46,240,481 as of 1 April 2021.
Earnings Call Scheduled
The Company has scheduled a conference call to discuss Core's first quarter 2021 earnings announcement. The call will begin at 7:30 a.m. CDT / 2:30 p.m. CEST on Thursday, 22 April 2021. To listen to the call, please go to Core's website at www.corelab.com.
Core Laboratories N.V. is a leading provider of proprietary and patented reservoir description and production enhancement services and products used to optimize petroleum reservoir performance. The Company has over 70 offices in more than 50 countries and is located in every major oil-producing province in the world. This release, as well as other statements we make, includes forward-looking statements regarding the future revenue, profitability, business strategies and developments of the Company made in reliance upon the safe harbor provisions of Federal securities law. The Company's outlook is subject to various important cautionary factors, including risks and uncertainties related to the oil and natural gas industry, business conditions, international markets, international political climates, public health crises, such as the COVID-19 pandemic, and any related actions taken by businesses and governments, and other factors as more fully described in the Company's most recent Forms 10-K, 10-Q and 8-K filed with or furnished to the U.S. Securities and Exchange Commission. These important factors could cause the Company's actual results to differ materially from those described in these forward-looking statements. Such statements are based on current expectations of the Company's performance and are subject to a variety of factors, some of which are not under the control of the Company. Because the information herein is based solely on data currently available, and because it is subject to change as a result of changes in conditions over which the Company has no control or influence, such forward-looking statements should not be viewed as assurance regarding the Company's future performance. The Company undertakes no obligation to publicly update or revise any forward-looking statement to reflect events or circumstances that may arise after the date of this press release, except as required by law.
Visit the Company's website at www.corelab.com. Connect with Core Lab on Facebook, LinkedIn and YouTube.
CORE LABORATORIES N.V. & SUBSIDIARIES | ||||||||||||||||||||
CONDENSED CONSOLIDATED STATEMENTS OF OPERATIONS | ||||||||||||||||||||
(amounts in thousands, except per share data) | ||||||||||||||||||||
(Unaudited) | ||||||||||||||||||||
Three Months Ended | % Variance | |||||||||||||||||||
March 31,2021 | December 31,2020 | March 31,2020 | vs. Q4-20 | vs. Q1-20 | ||||||||||||||||
REVENUE | $ | 108,383 | $ | 113,749 | $ | 152,400 | (4.7)% | (28.9)% | ||||||||||||
OPERATING EXPENSES: | ||||||||||||||||||||
Costs of services and sales | 84,150 | 87,918 | 115,131 | (4.3)% | (26.9)% | |||||||||||||||
General and administrative expense | 8,461 | (3,692) | 19,567 | NM | (56.8)% | |||||||||||||||
Depreciation and amortization | 4,871 | 4,837 | 5,441 | 0.7% | (10.5)% | |||||||||||||||
Impairments, inventory write-down and other charges | — | 443 | 122,204 | NM | NM | |||||||||||||||
Other (income) expense, net | (721) | 839 | (970) | NM | NM | |||||||||||||||
Total operating expenses | 96,761 | 90,345 | 261,373 | 7.1% | (63.0)% | |||||||||||||||
OPERATING INCOME (LOSS) | 11,622 | 23,404 | (108,973) | (50.3)% | NM | |||||||||||||||
Interest expense | 1,363 | 2,920 | 3,411 | (53.3)% | (60.0)% | |||||||||||||||
Income (loss) from continuing operations before income tax expense | 10,259 | 20,484 | (112,384) | (49.9)% | NM | |||||||||||||||
Income tax expense (benefit) | 2,052 | 6,540 | (4,046) | (68.6)% | NM | |||||||||||||||
Income (loss) from continuing operations | 8,207 | 13,944 | (108,338) | (41.1)% | NM | |||||||||||||||
Income (loss) from discontinued operations, net of income taxes | — | (424) | — | NM | NM | |||||||||||||||
Net income (loss) | 8,207 | 13,520 | (108,338) | (39.3)% | NM | |||||||||||||||
Net income (loss) attributable to non- controlling interest | 102 | (17) | 83 | NM | 22.9% | |||||||||||||||
Net income (loss) attributable to Core Laboratories N.V. | $ | 8,105 | $ | 13,537 | $ | (108,421) | (40.1)% | NM | ||||||||||||
Diluted EPS (loss per share) from continuing operations | $ | 0.18 | $ | 0.31 | $ | (2.44) | (41.9)% | NM | ||||||||||||
Diluted EPS (loss per share) attributable to Core Laboratories N.V. | $ | 0.18 | $ | 0.30 | $ | (2.44) | (40.0)% | NM | ||||||||||||
Weighted average diluted common shares outstanding | 45,964 | 44,958 | 44,447 | 2.2% | 3.4% | |||||||||||||||
Effective tax rate | 20 | % | 32 | % | 4 | % | NM | NM | ||||||||||||
SEGMENT INFORMATION: | ||||||||||||||||||||
Revenue: | ||||||||||||||||||||
Reservoir Description | $ | 76,486 | $ | 83,838 | $ | 102,702 | (8.8)% | (25.5)% | ||||||||||||
Production Enhancement | 31,897 | 29,911 | 49,698 | 6.6% | (35.8)% | |||||||||||||||
Total | $ | 108,383 | $ | 113,749 | $ | 152,400 | (4.7)% | (28.9)% | ||||||||||||
Operating income (loss): | ||||||||||||||||||||
Reservoir Description | $ | 10,051 | $ | 19,426 | $ | 11,062 | (48.3)% | (9.1)% | ||||||||||||
Production Enhancement | 1,560 | 4,495 | (121,299) | (65.3)% | NM | |||||||||||||||
Corporate and Other | 11 | (517) | 1,264 | NM | NM | |||||||||||||||
Total | $ | 11,622 | $ | 23,404 | $ | (108,973) | (50.3)% | NM | ||||||||||||
"NM" means not meaningful | ||||||||||||||||||||
CORE LABORATORIES N.V. & SUBSIDIARIES | ||||||||||||
CONDENSED CONSOLIDATED BALANCE SHEET | ||||||||||||
(amounts in thousands) | ||||||||||||
(Unaudited) | ||||||||||||
% Variance | ||||||||||||
ASSETS: | March 31, 2021 | December 31,2020 | vs. Q4-20 | |||||||||
Cash and cash equivalents | $ | 27,806 | $ | 13,806 | 101.4% | |||||||
Accounts receivable, net | 86,567 | 83,192 | 4.1% | |||||||||
Inventory | 39,117 | 38,151 | 2.5% | |||||||||
Other current assets | 32,327 | 30,699 | 5.3% | |||||||||
Total Current Assets | 185,817 | 165,848 | 12.0% | |||||||||
Property, plant and equipment, net | 113,491 | 115,293 | (1.6)% | |||||||||
Right-of-use assets | 70,295 | 66,385 | 5.9% | |||||||||
Intangibles, goodwill and other long-term assets, net | 214,843 | 221,053 | (2.8)% | |||||||||
Total assets | $ | 584,446 | $ | 568,579 | 2.8% | |||||||
LIABILITIES AND EQUITY: | ||||||||||||
Accounts payable | $ | 25,500 | $ | 23,028 | 10.7% | |||||||
Short-term operating lease liabilities | 12,357 | 11,437 | 8.0% | |||||||||
Other current liabilities | 47,676 | 55,285 | (13.8)% | |||||||||
Total current liabilities | 85,533 | 89,750 | (4.7)% | |||||||||
Long-term debt, net | 208,166 | 259,433 | (19.8)% | |||||||||
Long-term operating lease liabilities | 58,635 | 56,108 | 4.5% | |||||||||
Other long-term liabilities | 86,066 | 87,715 | (1.9)% | |||||||||
Total equity | 146,046 | 75,573 | 93.3% | |||||||||
Total liabilities and equity | $ | 584,446 | $ | 568,579 | 2.8% | |||||||
"NM" means not meaningful | ||||||||||||
CORE LABORATORIES N.V. & SUBSIDIARIES | |||||||||||
CONDENSED CONSOLIDATED STATEMENTS OF CASH FLOWS | |||||||||||
(amounts in thousands) | |||||||||||
(Unaudited) | |||||||||||
Three Months Ended | |||||||||||
March 31, 2021 | December 31, 2020 | March 31, 2020 | |||||||||
CASH FLOWS FROM OPERATING ACTIVITIES | |||||||||||
Income (loss) from continuing operations | $ | 8,207 | $ | 13,944 | $ | (108,338) | |||||
Income (loss) from discontinued operations | — | (424) | — | ||||||||
Net Income (loss) | $ | 8,207 | $ | 13,520 | $ | (108,338) | |||||
Adjustments to reconcile net income (loss) to net cash provided by (used in) operating activities: | |||||||||||
Stock-based compensation | 4,405 | (8,860) | 10,530 | ||||||||
Depreciation and amortization | 4,871 | 4,837 | 5,441 | ||||||||
Deferred income tax | 4,704 | 798 | (7,374) | ||||||||
Impairments, inventory write-down and other charges | — | 443 | 122,204 | ||||||||
Adjustments on sale of discontinued operations | — | 573 | — | ||||||||
Accounts receivable | (3,180) | 1,192 | 4,784 | ||||||||
Inventory | (400) | 4,351 | (2,285) | ||||||||
Accounts payable | 2,265 | 424 | 132 | ||||||||
Other adjustments to net income (loss) | (12,885) | (20,190) | (3,069) | ||||||||
Net cash provided by (used in) operating activities | $ | 7,987 | $ | (2,912) | $ | 22,025 | |||||
CASH FLOWS FROM INVESTING ACTIVITIES | |||||||||||
Capital expenditures | $ | (2,772) | $ | (3,302) | $ | (3,340) | |||||
Proceeds from cash surrender value of company-owned life insurance | — | 11,509 | — | ||||||||
Proceeds (adjustments) from sale of discontinued operations | — | (225) | — | ||||||||
Other investing activities | 1,702 | 465 | (544) | ||||||||
Net cash provided by (used in) investing activities | $ | (1,070) | $ | 8,447 | $ | (3,884) | |||||
CASH FLOWS FROM FINANCING ACTIVITIES | |||||||||||
Repayment of debt borrowings | $ | (119,000) | $ | (31,000) | $ | (20,000) | |||||
Proceeds from debt borrowings | 68,000 | 26,000 | 17,000 | ||||||||
Proceeds from issuance of common stock | 59,139 | — | — | ||||||||
Dividends paid | (446) | (445) | (11,111) | ||||||||
Repurchase of treasury shares | (171) | (1,201) | (1,238) | ||||||||
Other financing activities | (439) | (229) | 6 | ||||||||
Net cash provided by (used in) financing activities | $ | 7,083 | $ | (6,875) | $ | (15,343) | |||||
NET CHANGE IN CASH AND CASH EQUIVALENTS | 14,000 | (1,340) | 2,798 | ||||||||
CASH AND CASH EQUIVALENTS, beginning of period | 13,806 | 15,146 | 11,092 | ||||||||
CASH AND CASH EQUIVALENTS, end of period | $ | 27,806 | $ | 13,806 | $ | 13,890 | |||||
Non-GAAP Information
Management believes that the exclusion of certain income and expenses enables it to evaluate more effectively the Company's operations period-over-period and to identify operating trends that could otherwise be masked by the excluded Items. For this reason, we use certain non-GAAP measures that exclude these Items; and we feel that this presentation provides a clearer comparison with the results reported in prior periods. The non-GAAP financial measures should be considered in addition to, and not as a substitute for, the financial results prepared in accordance with GAAP, as more fully discussed in the Company's financial statement and filings with the Securities and Exchange Commission.
Reconciliation of Operating Income, Income from Continuing Operations and Earnings Per Diluted Share from Continuing Operations | |||||||||||
(amounts in thousands, except per share data) | |||||||||||
(Unaudited) | |||||||||||
Operating Income (loss) from Continuing Operations | |||||||||||
Three Months Ended | |||||||||||
March 31, 2021 | December 31, 2020 | March 31, 2020 | |||||||||
GAAP reported | $ | 11,622 | $ | 23,404 | $ | (108,973) | |||||
Stock compensation 1 | 752 | (11,934) | 6,750 | ||||||||
Inventory write-down | — | 443 | — | ||||||||
Cost reduction and other charges | — | — | 1,155 | ||||||||
Impairments 3 | — | — | 122,204 | ||||||||
Facility exit cost | — | 256 | — | ||||||||
Foreign exchange losses (gains) | (408) | 852 | (576) | ||||||||
Excluding specific items | $ | 11,966 | $ | 13,021 | $ | 20,560 | |||||
Income (loss) from Continuing Operations | |||||||||||
Three Months Ended | |||||||||||
March 31, 2021 | December 31, 2020 | March 31, 2020 | |||||||||
GAAP reported | $ | 8,207 | $ | 13,944 | $ | (108,338) | |||||
Stock compensation 1 | 602 | (11,934) | 6,750 | ||||||||
Inventory write-down | — | 301 | — | ||||||||
Interest rate hedge settlement and restructuring 2 | (1,506) | — | — | ||||||||
Cost reduction and other charges | — | — | 924 | ||||||||
Impairments 3 | — | — | 113,181 | ||||||||
Facility exit cost | — | 174 | — | ||||||||
Impact of higher (lower) tax rate | — | 5,018 | 1,663 | ||||||||
Foreign exchange losses (gains) | (326) | 578 | (461) | ||||||||
Excluding specific items | $ | 6,977 | $ | 8,081 | $ | 13,719 | |||||
Earnings (Loss) Per Diluted Share from Continuing Operations | |||||||||||
Three Months Ended | |||||||||||
March 31, 2021 | December 31, 2020 | March 31, 2020 | |||||||||
GAAP reported | $ | 0.18 | $ | 0.31 | $ | (2.44) | |||||
Stock compensation 1 | 0.01 | (0.27) | 0.15 | ||||||||
Inventory write-down | — | 0.01 | — | ||||||||
Cost reduction and other charges | — | — | 0.02 | ||||||||
Interest rate hedge settlement and restructuring 2 | (0.03) | — | — | ||||||||
Impact on assuming dilution | — | — | 0.02 | ||||||||
Impairments 3 | — | — | 2.53 | ||||||||
Impact of higher (lower) tax rate | — | 0.11 | 0.04 | ||||||||
Foreign exchange losses (gains) | (0.01) | 0.02 | (0.01) | ||||||||
Excluding specific items | $ | 0.15 | $ | 0.18 | $ | 0.31 | |||||
(1) | Three months ended December 31, 2020 includes an adjustment to reverse previously recognized stock compensation expense for shares that were granted but did not vest and were revalued. | |||||||||||
(2) | Three months ended March 31, 2021 includes a credit to interest expense associated with the settlement and restructuring of interest rate hedges. | |||||||||||
(3) | Three months ended March 31, 2020 includes impairment charge for goodwill and intangible assets. | |||||||||||
Segment Information | |||||||||||
(amounts in thousands) | |||||||||||
(Unaudited) | |||||||||||
Operating Income (Loss) from Continuing Operations | |||||||||||
Three Months Ended March 31, 2021 | |||||||||||
Reservoir Description | Production Enhancement | Corporate andOther | |||||||||
GAAP reported | $ | 10,051 | $ | 1,560 | $ | 11 | |||||
Foreign exchange losses | (345) | 1 | (64) | ||||||||
Stock compensation | 516 | 236 | — | ||||||||
Excluding specific items | $ | 10,222 | $ | 1,797 | $ | (53) | |||||
Return on Invested Capital
Return on Invested Capital ("ROIC") is based on Bloomberg's calculation on the trailing four quarters from the most recently reported quarter and the balance sheet of the most recent reported quarter, and is presented based on our belief that this non-GAAP measure is useful information to investors and management when comparing our profitability and the efficiency with which we have employed capital over time relative to other companies. ROIC is not a measure of financial performance under GAAP and should not be considered as an alternative to net income.
ROIC is defined by Bloomberg as Net Operating Profit (Loss) ("NOP") less Cash Operating Tax ("COT") divided by Total Invested Capital ("TIC"), where NOP is defined as GAAP net income before minority interest plus the sum of income tax expense, interest expense, and pension expense less pension service cost and COT is defined as income tax expense plus the sum of the change in net deferred taxes, and the tax effect on interest expense and TIC is defined as GAAP stockholder's equity plus the sum of net long-term debt, allowance for doubtful accounts, net balance of deferred taxes, income tax payable, and other charges.
The Board has established an internal performance metric of demonstrating superior ROIC performance relative to the oilfield service companies listed as Core's Comp Group by Bloomberg. In 2020, Core Lab recorded $133 million in non-cash charges associated with impairment of goodwill, intangible assets and inventory. Excluding these adjustments, Core's calculation of ROIC using Bloomberg's formula was 5.7%.
Reconciliation of ROIC | |||||||||||
(amounts in millions, except for ROIC and WACC data) | |||||||||||
(Unaudited) | |||||||||||
Bloomberg | Effect of non-cashcharges | Excluding non-cash charges | |||||||||
Net operating profit | $ | (77.8) | $ | 133.4 | $ | 55.6 | |||||
Cash operating taxes | 22.7 | 5.4 | 28.1 | ||||||||
Total invested capital | 367.1 | 117.6 | 484.7 | ||||||||
Return on invested capital | (27.4) | % | NM | 5.7 | % | ||||||
Weighted average cost of capital | 9.0 | % | |||||||||
Free Cash Flow
Core uses the non-GAAP measure of free cash flow to evaluate its cash flows and results of operations. Free cash flow is an important measurement because it represents the cash from operations, in excess of capital expenditures, available to operate the business and fund non-discretionary obligations. Free cash flow is not a measure of operating performance under GAAP, and should not be considered in isolation nor construed as an alternative consideration to operating income, net income, earnings per share, or cash flows from operating, investing, or financing activities, each as determined in accordance with GAAP. Free cash flow should not be considered a measure of liquidity. Moreover, since free cash flow is not a measure determined in accordance with GAAP and thus is susceptible to varying interpretations and calculations, free cash flow as presented may not be comparable to similarly titled measures presented by other companies.
Computation of Free Cash Flow | |||||
(amounts in thousands) | |||||
(Unaudited) | |||||
Three Months Ended | |||||
March 31, 2021 | |||||
Net cash provided by operating activities | $ | 7,987 | |||
Capital expenditures | (2,772) | ||||
Free cash flow | $ | 5,215 | |||
![]()
![]() View original content to download multimedia:http://www.prnewswire.com/news-releases/core-lab-reports-first-quarter-2021-results-from-continuing-operations-301274287.html
View original content to download multimedia:http://www.prnewswire.com/news-releases/core-lab-reports-first-quarter-2021-results-from-continuing-operations-301274287.html
SOURCE Core Laboratories N.V.
Serious News for Serious Traders! Try StreetInsider.com Premium Free!
You May Also Be Interested In
- Midday movers: Meta, IBM, Caterpillar fall; Chipotle rises
- Hanmi Financial (HAFC) Announces 1.5M Share Buyback
- Gilead Sciences (GILD) Misses Q1 EPS by 288c
Create E-mail Alert Related Categories
PRNewswire, Press ReleasesRelated Entities
Dividend, Crude Oil, Earnings, Equity OfferingsSign up for StreetInsider Free!
Receive full access to all new and archived articles, unlimited portfolio tracking, e-mail alerts, custom newswires and RSS feeds - and more!
