



Cloudera Reports Fourth Quarter and Fiscal Year 2021 Financial Results
 Tweet
Tweet Share
Share E-mail
Get Alerts CLDR Hot Sheet
Join SI Premium – FREE
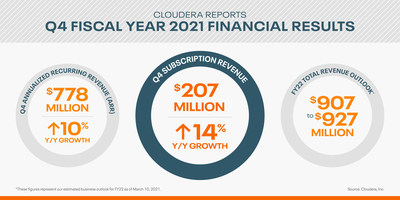
SANTA CLARA, Calif., March 10, 2021 /PRNewswire/ -- Cloudera, Inc. (NYSE: CLDR), the enterprise data cloud company, reported results for its fourth quarter and fiscal year 2021, ended January 31, 2021. Total revenue for the fourth quarter was $226.6 million, an increase of 7% as compared to the fourth quarter of fiscal 2020. Subscription revenue was $206.8 million, an increase of 14% as compared to the fourth quarter of fiscal 2020. Annualized Recurring Revenue grew 10% year-over-year.
"Cloudera Data Platform demonstrated significant momentum in the quarter," said Rob Bearden, chief executive officer, Cloudera. "Customers migrating to CDP increased from about 10% of our customer base at the time we reported Q3 to more than 15% of our customer base today. Most impressively, ARR from CDP now exceeds $60 million of total ARR. The adoption of CDP for hybrid data cloud and data lifecycle use cases is what will drive future growth and we're very happy with this progress to date."
Fourth Quarter Fiscal 2021 Results
- GAAP loss from operations for the fourth quarter of fiscal 2021 was $51.6 million, including an impairment charge of $35.8 million for right-of-use and other lease related assets, compared to $64.4 million for the fourth quarter of fiscal 2020
- Non-GAAP income from operations for the fourth quarter of fiscal 2021 was $50.5 million, compared to $11.0 million for the fourth quarter of fiscal 2020
- Operating cash flow for the fourth quarter of fiscal 2021 was $36.7 million, compared to negative $9.4 million for the fourth quarter of fiscal 2020
- GAAP net loss per share for the fourth quarter of fiscal 2021 was $0.18 per share, compared to $0.22 per share for the fourth quarter of fiscal 2020
- Non-GAAP diluted net income per share for the fourth quarter of fiscal 2021 was $0.15 per share, compared to $0.04 per share for the fourth quarter of fiscal 2020
Fiscal Year 2021 Results
- For fiscal year 2021, total revenue was $869.3 million, an increase of 9% year-over-year
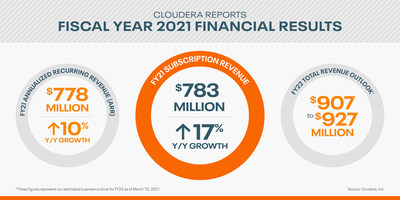
- Subscription revenue for fiscal year 2021 was $782.8 million, an increase of 17% year-over-year
- GAAP loss from operations for fiscal year 2021 was $156.3 million, including an impairment charge of $35.8 million for right-of-use and other lease related assets, compared to $339.8 million for fiscal year 2020
- Non-GAAP income from operations for fiscal year 2021 was $146.8 million, compared to a non-GAAP loss from operations of $39.4 million for fiscal year 2020
- Operating cash flow for fiscal year 2021 was $155.8 million, compared to negative $36.8 million for fiscal year 2020
- GAAP net loss per share for fiscal year 2021 was $0.54 per share, compared to $1.20 per share for fiscal year 2020
- Non-GAAP diluted net income per share for fiscal year 2021 was $0.45, compared to a non-GAAP net loss per share of $0.13 for fiscal year 2020
A reconciliation of GAAP to non-GAAP financial measures has been provided in the financial statement tables included in this press release. An explanation of these measures is also included below under the heading Non-GAAP Financial Measures.
As of January 31, 2021, Cloudera had total cash, cash equivalents, marketable securities and restricted cash of $773.0 million.
Recent Business and Financial Highlights
- Annualized Recurring Revenue at the conclusion of fiscal 2021 was $778 million, representing 10% year-over-year growth
- GAAP subscription gross margin for the quarter was 87%, up from 84% in the fourth quarter of fiscal 2020
- Non-GAAP subscription gross margin for the quarter was 91%, up from 88% in the fourth quarter of fiscal 2020
- Closed a covenant lite, $500 million senior secured term loan
- Repurchased 26 million shares of Cloudera common stock
- CDP Operational Database now available on Amazon Web Services (AWS) and Microsoft Azure
- CDP Public Cloud SOC 2 Type II Certified
- Partnered with NVIDIA to accelerate processing for enterprise data engineering and data science workflows on Cloudera Data Platform
- Launched Applied ML Prototypes, complete ML use cases with pre-built AI apps for CDP Machine Learning
- CDP Data Warehouse delivers better price performance in GigaOm benchmark testing
Business Outlook
The outlook for the first quarter of fiscal 2022, ending April 30, 2021, is:
- Total revenue in the range of $216 million to $218 million
- Subscription revenue in the range of $195 million to $197 million
- Non-GAAP operating income in the range of $28 million to $33 million
- Non-GAAP net income per share in the range of $0.07 to $0.09 per share
- Diluted weighted-average share count of approximately 303 million shares
The outlook for fiscal 2022, ending January 31, 2022, is:
- Total revenue in the range of $907 million to $927 million
- Subscription revenue in the range of $822 million to $832 million
- Non-GAAP operating income in the range of $137 million to $147 million
- Non-GAAP net income per share in the range of $0.35 to $0.39 per share
- Diluted weighted-average share count of approximately 308 million shares
The business outlook is based on the assumption that the recessionary impact of the coronavirus pandemic (COVID-19) will continue at least through Cloudera's first quarter fiscal 2022.
Conference Call and Webcast Information
Cloudera is hosting a conference call for analysts and investors to discuss its fourth quarter fiscal 2021 results and the outlook for its first quarter of fiscal 2022 and full year fiscal 2022 at 2:00 p.m. Pacific Time today. Participants can listen via webcast by visiting the Investor Relations section of Cloudera's website. A replay of the webcast will be available for two weeks following the call.
The conference call can also be accessed as follows:
- Participant Toll Free Number: +1-833-579-0900
- Participant International Number: +1-778-560-2567
- Conference ID: 7339087
About Cloudera
At Cloudera, we believe that data can make what is impossible today, possible tomorrow. We empower people to transform complex data into clear and actionable insights. Cloudera delivers an enterprise data cloud for any data, anywhere, from the Edge to AI. Powered by the relentless innovation of the open source community, Cloudera advances digital transformation for the world's largest enterprises. Learn more at cloudera.com.
Connect with Cloudera
About Cloudera: https://www.cloudera.com/about.html Read our VISION blog: https://blog.cloudera.com and Engineering blog: https://blog.cloudera.com Follow us on Twitter: https://twitter.com/cloudera and LinkedIn: https://www.linkedin.com/company/cloudera Visit us on Facebook: https://www.facebook.com/cloudera See us on YouTube: https://www.youtube.com/user/clouderahadoop Join the Cloudera Community: https://community.cloudera.com Read about our customers' successes: https://www.cloudera.com/about/customers.html
Cloudera and associated marks are trademarks or registered trademarks of Cloudera, Inc. All other company and product names may be trademarks of their respective owners.
Forward-Looking Statements
Statements in this press release that are not historical in nature are forward-looking statements that, within the meaning of the federal securities laws including the safe harbor provisions of the Private Securities Litigation Reform Act of 1995, involve known and unknown risks and uncertainties. Words such as "may", "will", "expect", "intend", "plan", "believe", "seek", "could", "estimate", "judgment", "targeting", "should", "anticipate", "goal" and variations of these words and similar expressions, are also intended to identify forward-looking statements. The forward-looking statements in this press release address a variety of subjects, including statements about our short-term and long-term assumptions, goals and targets, including our "Business Outlook" for our first quarter of fiscal 2022 and our full year fiscal 2022 operating results. Readers are cautioned that actual results could differ materially from those implied by such forward-looking statements due to a variety of factors, including global economic conditions, competitive pressures and pricing declines, intellectual property infringement claims, the impact of and uncertainties related to COVID-19, and other risks or uncertainties that are described under the caption "Risk Factors" in our Annual Report on Form 10-K and our Quarterly Reports on Form 10-Q filed with the Securities and Exchange Commission (SEC), and in our other SEC filings. You can obtain copies of our SEC filings on the SEC's website at www.sec.gov. Additionally, these forward-looking statements, particularly our guidance, involve risk, uncertainties and assumptions, including those related to the impact of COVID-19 on our business and global economic conditions. Many of these assumptions relate to matters that are beyond our control and changing rapidly, including, but not limited to, the timeframes for and severity of the impact of COVID-19 on our customers' purchasing decisions and the length of our sales cycles, particularly for customers in certain industries highly affected by COVID-19. Although we believe the expectations reflected in such forward-looking statements are based upon reasonable assumptions, we can give no assurances that our expectations will be attained. We undertake no obligation to update or revise any forward-looking statements, whether as a result of new information, future events or otherwise.
Non-GAAP Financial Measures
We report all financial information required in accordance with U.S. generally accepted accounting principles (GAAP). To supplement our unaudited and audited condensed consolidated financial statements presented in accordance with GAAP, we use certain non-GAAP measures of financial performance. The presentation of these non-GAAP financial measures is not intended to be considered in isolation from, as a substitute for, or superior to, the financial information prepared and presented in accordance with GAAP, and may be different from non-GAAP financial measures used by other companies. In addition, these non-GAAP measures have limitations in that they do not reflect all of the amounts associated with the results of our operations as determined in accordance with GAAP. The non-GAAP financial measures used by us include non-GAAP cost of revenue-subscription, non-GAAP cost of revenue-services, non-GAAP subscription gross margin, non-GAAP services gross margin, non-GAAP gross margin, non-GAAP gross profit, non-GAAP operating expenses, non-GAAP operating margin, and historical and forward-looking non-GAAP income/loss from operations, non-GAAP net income/loss, and non-GAAP net income/loss per share. These non-GAAP financial measures exclude stock-based compensation, amortization of acquired intangible assets, extraordinary non-cash real estate impairment charges, and acquisition and disposition-related expenses (if any) from our unaudited and audited condensed consolidated statement of operations.
For a description of these items, including the reasons why management adjusts for them, and reconciliations of historical non-GAAP financial measures to the most directly comparable GAAP financial measures, please see the section of the accompanying financial statement tables titled "Use of Non-GAAP Financial Information" as well as the related financial statement tables that precede it. We may consider whether other significant non-recurring items that arise in the future should also be excluded in calculating the non-GAAP financial measures we use.
We believe that these non-GAAP financial measures, when taken together with the corresponding GAAP financial measures, provide meaningful supplemental information regarding our performance by excluding certain items that may not be indicative of our core business, operating results or future outlook. Management uses, and believes that investors benefit from referring to, these non-GAAP financial measures in assessing our operating results, as well as when planning, forecasting and analyzing future periods. We use these non-GAAP financial measures in conjunction with traditional GAAP measures to communicate with our board of directors concerning our financial performance. These non-GAAP financial measures also facilitate comparisons of our performance to prior periods.
Annualized Recurring Revenue
Annualized Recurring Revenue ("ARR") is a performance metric, which we use to assess the health and trajectory of our business. ARR equals the annualized value of recurring subscription contracts with active entitlements as of the end of the period. ARR does not reflect non-recurring partner revenue, subscription revenue with certain related parties, custom engineering, remote operation and management services, or premium add-on support.
CDP ARR is comprised of CDP Public Cloud SKUs, annualized based on quarterly consumption revenue, CDP Private Cloud SKUs, calculated based on the annualized value of recurring subscription agreements with active entitlements as of quarter-end, and legacy SKUs that are otherwise contractually entitled to run CDP.
Cloudera, Inc. Consolidated Statements of Operations (in thousands, except per share data) (unaudited)
| |||||||||||||||
Three Months Ended January 31, | Year Ended January 31, | ||||||||||||||
2021 | 2020 | 2021 | 2020 | ||||||||||||
Revenue: | |||||||||||||||
Subscription | $ | 206,807 | $ | 181,954 | $ | 782,769 | $ | 667,826 | |||||||
Services | 19,756 | 29,766 | 86,489 | 126,365 | |||||||||||
Total revenue | 226,563 | 211,720 | 869,258 | 794,191 | |||||||||||
Cost of revenue:(1) (2) | |||||||||||||||
Subscription | 26,026 | 29,103 | 107,834 | 117,739 | |||||||||||
Services | 17,235 | 27,408 | 81,354 | 114,763 | |||||||||||
Total cost of revenue | 43,261 | 56,511 | 189,188 | 232,502 | |||||||||||
Gross profit | 183,302 | 155,209 | 680,070 | 561,689 | |||||||||||
Operating expenses:(1) (2) | |||||||||||||||
Research and development | 61,681 | 66,994 | 244,507 | 263,566 | |||||||||||
Sales and marketing | 103,654 | 117,884 | 420,501 | 467,541 | |||||||||||
General and administrative (3) | 69,562 | 34,768 | 171,327 | 170,336 | |||||||||||
Total operating expenses | 234,897 | 219,646 | 836,335 | 901,443 | |||||||||||
Loss from operations | (51,595) | (64,437) | (156,265) | (339,754) | |||||||||||
Interest (expense) income, net | (892) | 2,484 | 3,994 | 11,687 | |||||||||||
Other (expense) income, net | (202) | (106) | (3,117) | 185 | |||||||||||
Loss before provision for income taxes | (52,689) | (62,059) | (155,388) | (327,882) | |||||||||||
Provision for income taxes | (2,089) | (2,228) | (7,346) | (8,700) | |||||||||||
Net loss | $ | (54,778) | $ | (64,287) | $ | (162,734) | $ | (336,582) | |||||||
Net loss per share, basic and diluted | $ | (0.18) | $ | (0.22) | $ | (0.54) | $ | (1.20) | |||||||
Weighted-average shares used in computing net loss per share, basic and diluted | 303,526 | 291,193 | 302,522 | 280,772 | |||||||||||
(1) Amounts include stock-based compensation expense as follows (in thousands): | |||||||||||||||
Three Months Ended January 31, | Year Ended January 31, | ||||||||||||||
2021 | 2020 | 2021 | 2020 | ||||||||||||
Cost of revenue – subscription | $ | 4,063 | $ | 4,285 | $ | 15,123 | $ | 16,599 | |||||||
Cost of revenue – services | 2,546 | 4,533 | 11,909 | 17,609 | |||||||||||
Research and development | 18,834 | 19,563 | 72,087 | 75,554 | |||||||||||
Sales and marketing | 13,513 | 17,161 | 55,173 | 63,360 | |||||||||||
General and administrative | 8,068 | 9,994 | 34,643 | 47,232 | |||||||||||
Total stock-based compensation expense | $ | 47,024 | $ | 55,536 | $ | 188,935 | $ | 220,354 | |||||||
(2) Amounts include amortization of acquired intangible assets as follows (in thousands): | |||||||||||||||
Three Months Ended January 31, | Year Ended January 31, | ||||||||||||||
2021 | 2020 | 2021 | 2020 | ||||||||||||
Cost of revenue – subscription | $ | 2,577 | $ | 2,855 | $ | 11,880 | $ | 11,213 | |||||||
Sales and marketing | 16,628 | 17,047 | 66,426 | 68,811 | |||||||||||
Total amortization of acquired intangible assets | $ | 19,205 | $ | 19,902 | $ | 78,306 | $ | 80,024 | |||||||
(3) Amounts include the impairment of real estate lease related right-of-use assets and other long-lived assets of $35.8 million for the three months and year ended January 31, 2021. | |||||||||||||||
Cloudera, Inc.Consolidated Balance Sheets(in thousands)
| |||||||||
January 31,2021 | January 31,2020 | ||||||||
(unaudited) | |||||||||
ASSETS | |||||||||
Current assets: | |||||||||
Cash and cash equivalents | $ | 298,672 | $ | 107,638 | |||||
Marketable securities | 297,721 | 253,361 | |||||||
Accounts receivable, net | 316,098 | 249,971 | |||||||
Deferred contract costs | 53,048 | 54,776 | |||||||
Prepaid expenses and other current assets | 32,382 | 42,155 | |||||||
Total current assets | 997,921 | 707,901 | |||||||
Property and equipment, net | 18,065 | 21,988 | |||||||
Marketable securities, non-current | 173,281 | 122,193 | |||||||
Intangible assets, net | 532,630 | 605,236 | |||||||
Goodwill | 599,291 | 590,361 | |||||||
Deferred contract costs, non-current | 31,170 | 35,260 | |||||||
Operating lease right-of-use assets | 146,424 | 204,642 | |||||||
Other assets | 9,819 | 12,209 | |||||||
TOTAL ASSETS | $ | 2,508,601 | $ | 2,299,790 | |||||
LIABILITIES AND STOCKHOLDERS' EQUITY | |||||||||
Current liabilities: | |||||||||
Accounts payable | $ | 2,713 | $ | 3,858 | |||||
Accrued compensation | 56,643 | 61,826 | |||||||
Other accrued liabilities | 30,196 | 22,297 | |||||||
Operating lease liabilities | 19,574 | 19,181 | |||||||
Contract liabilities | 553,983 | 472,786 | |||||||
Total current liabilities | 663,109 | 579,948 | |||||||
Long-term debt | 487,089 | — | |||||||
Operating lease liabilities, non-current | 169,296 | 192,324 | |||||||
Contract liabilities, non-current | 54,414 | 81,926 | |||||||
Other accrued liabilities, non-current | 6,763 | 7,223 | |||||||
TOTAL LIABILITIES | 1,380,671 | 861,421 | |||||||
STOCKHOLDERS' EQUITY: | |||||||||
Common stock | 15 | 15 | |||||||
Additional paid-in capital | 2,776,690 | 2,923,905 | |||||||
Accumulated other comprehensive income | 580 | 273 | |||||||
Accumulated deficit | (1,649,355) | (1,485,824) | |||||||
TOTAL STOCKHOLDERS' EQUITY | 1,127,930 | 1,438,369 | |||||||
TOTAL LIABILITIES AND STOCKHOLDERS' EQUITY | $ | 2,508,601 | $ | 2,299,790 | |||||
Cloudera, Inc. Consolidated Statements of Cash Flows (in thousands) (unaudited)
| |||||||||||||||
Three Months Ended January 31, | Year Ended January 31, | ||||||||||||||
2021 | 2020 | 2021 | 2020 | ||||||||||||
CASH FLOWS FROM OPERATING ACTIVITIES | |||||||||||||||
Net loss | $ | (54,778) | $ | (64,287) | $ | (162,734) | $ | (336,582) | |||||||
Adjustments to reconcile net loss to net cash provided by (used in) operating activities: | |||||||||||||||
Depreciation and amortization | 22,377 | 23,033 | 89,393 | 92,156 | |||||||||||
Non-cash lease expense | 11,539 | 11,743 | 45,747 | 45,640 | |||||||||||
Impairment of real estate lease related assets | 35,828 | — | 35,828 | — | |||||||||||
Stock-based compensation expense | 47,024 | 55,536 | 188,935 | 220,354 | |||||||||||
Amortization of deferred contract costs | 15,984 | 13,973 | 66,734 | 47,552 | |||||||||||
Other | 1,008 | 23 | 9,395 | (1,880) | |||||||||||
Changes in assets and liabilities: | |||||||||||||||
Accounts receivable | (141,128) | (87,908) | (65,061) | (8,956) | |||||||||||
Prepaid expenses and other assets | (2,357) | (4,526) | 12,151 | (8,280) | |||||||||||
Deferred contract costs | (24,915) | (31,375) | (60,916) | (68,575) | |||||||||||
Accounts payable | (718) | (8,282) | (2,816) | (4,089) | |||||||||||
Accrued compensation | 4,085 | 7,893 | (6,140) | 5,570 | |||||||||||
Other accrued liabilities | 4,634 | (4,795) | 1,187 | 109 | |||||||||||
Operating lease liabilities | (21,291) | (23,161) | (46,022) | (51,059) | |||||||||||
Contract liabilities | 139,360 | 102,717 | 50,141 | 31,214 | |||||||||||
Net cash provided by (used in) operating activities | 36,652 | (9,416) | 155,822 | (36,826) | |||||||||||
CASH FLOWS FROM INVESTING ACTIVITIES | |||||||||||||||
Purchases of marketable securities | (77,515) | (101,755) | (472,715) | (494,252) | |||||||||||
Proceeds from sale of marketable securities | 10,007 | 29,998 | 120,329 | 86,739 | |||||||||||
Maturities of marketable securities | 63,093 | 81,927 | 254,763 | 413,557 | |||||||||||
Cash used in business combinations, net of cash acquired | — | — | (12,358) | (4,500) | |||||||||||
Capital expenditures | (2,748) | (715) | (10,053) | (7,203) | |||||||||||
Net cash (used in) provided by investing activities | (7,163) | 9,455 | (120,034) | (5,659) | |||||||||||
CASH FLOWS FROM FINANCING ACTIVITIES | |||||||||||||||
Proceeds from debt, net of issuance costs | 490,546 | — | 490,546 | — | |||||||||||
Repurchases of common stock | (314,091) | — | (340,065) | — | |||||||||||
Taxes paid related to net share settlement of equity awards | (17,613) | (11,536) | (47,248) | (32,621) | |||||||||||
Proceeds from employee stock plans | 12,873 | 6,031 | 51,064 | 25,664 | |||||||||||
Net cash provided by (used in) financing activities | 171,715 | (5,505) | 154,297 | (6,957) | |||||||||||
Effect of exchange rate changes on cash, cash equivalents and restricted cash | 1,354 | (99) | 949 | (1,607) | |||||||||||
Net increase (decrease) in cash, cash equivalents and restricted cash | 202,558 | (5,565) | 191,034 | (51,049) | |||||||||||
Cash, cash equivalents and restricted cash — Beginning ofperiod | 99,466 | 116,555 | 110,990 | 162,039 | |||||||||||
Cash, cash equivalents and restricted cash — End of period | $ | 302,024 | $ | 110,990 | $ | 302,024 | $ | 110,990 | |||||||
Reconciliation of cash, cash equivalents and restricted cash as shown in the statement of cash flows: | ||||||||
As of January 31, | ||||||||
2021 | 2020 | |||||||
Cash and cash equivalents | $ | 298,672 | $ | 107,638 | ||||
Restricted cash included in Other assets | 3,352 | 3,352 | ||||||
Total cash, cash equivalents and restricted cash | $ | 302,024 | $ | 110,990 | ||||
Cloudera, Inc. Three Months Ended January 31, 2021 GAAP Results Reconciled to Non-GAAP Results (in thousands, except percentage and per share amounts) (unaudited)
| |||||||||||||||||||
GAAP | Stock-Based Compensation Expense | Amortization of Acquired Intangible Assets | Extraordinary Non-Cash RealEstate Impairment Charges | Non-GAAP | |||||||||||||||
Cost of revenue- Subscription | $ | 26,026 | $ | (4,063) | $ | (2,577) | $ | — | $ | 19,386 | |||||||||
Subscription gross margin | 87 | % | 2 | % | 1 | % | — | % | 91 | % | |||||||||
Cost of revenue- Services | 17,235 | (2,546) | — | — | 14,689 | ||||||||||||||
Services gross margin | 13 | % | 13 | % | — | % | — | % | 26 | % | |||||||||
Gross profit | 183,302 | 6,609 | 2,577 | — | 192,488 | ||||||||||||||
Total gross margin | 81 | % | 3 | % | 1 | % | — | % | 85 | % | |||||||||
Research and development | 61,681 | (18,834) | — | — | 42,847 | ||||||||||||||
Sales and marketing | 103,654 | (13,513) | (16,628) | — | 73,513 | ||||||||||||||
General and administrative | 69,562 | (8,068) | — | (35,828) | 25,666 | ||||||||||||||
(Loss) income from operations | (51,595) | 47,024 | 19,205 | 35,828 | 50,462 | ||||||||||||||
Operating margin | (23) | % | 21 | % | 8 | % | 16 | % | 22 | % | |||||||||
Net (loss) income | (54,778) | 47,024 | 19,205 | 35,828 | 47,279 | ||||||||||||||
Net (loss) income per share, basic | (0.18) | 0.16 | 0.06 | 0.12 | 0.16 | ||||||||||||||
Net (loss) income per share, diluted (1) | $ | (0.18) | $ | 0.16 | $ | 0.06 | $ | 0.11 | $ | 0.15 | |||||||||
(1) See below for a reconciliation of weighted-average shares outstanding used to calculate non-GAAP net income per share | |||||||||||||||||||
Cloudera, Inc. Three Months Ended January 31, 2020 GAAP Results Reconciled to Non-GAAP Results (in thousands, except percentage and per share amounts) (unaudited)
| |||||||||||||||
GAAP | Stock-Based Compensation Expense | Amortization of Acquired IntangibleAssets | Non-GAAP | ||||||||||||
Cost of revenue- Subscription | $ | 29,103 | $ | (4,285) | $ | (2,855) | $ | 21,963 | |||||||
Subscription gross margin | 84 | % | 2 | % | 2 | % | 88 | % | |||||||
Cost of revenue- Services | 27,408 | (4,533) | — | 22,875 | |||||||||||
Services gross margin | 8 | % | 15 | % | — | % | 23 | % | |||||||
Gross profit | 155,209 | 8,818 | 2,855 | 166,882 | |||||||||||
Total gross margin | 73 | % | 4 | % | 1 | % | 79 | % | |||||||
Research and development | 66,994 | (19,563) | — | 47,431 | |||||||||||
Sales and marketing | 117,884 | (17,161) | (17,047) | 83,676 | |||||||||||
General and administrative | 34,768 | (9,994) | — | 24,774 | |||||||||||
(Loss) income from operations | (64,437) | 55,536 | 19,902 | 11,001 | |||||||||||
Operating margin | (30) | % | 26 | % | 9 | % | 5 | % | |||||||
Net (loss) income | (64,287) | 55,536 | 19,902 | 11,151 | |||||||||||
Net (loss) income per share, basic | (0.22) | 0.19 | 0.07 | 0.04 | |||||||||||
Net (loss) income per share, diluted (1) | $ | (0.22) | $ | 0.20 | $ | 0.06 | $ | 0.04 | |||||||
(1) See below for a reconciliation of weighted-average shares outstanding used to calculate non-GAAP net income per share | |||||||||||||||
Cloudera, Inc. Twelve Months Ended January 31, 2021 GAAP Results Reconciled to Non-GAAP Results (in thousands, except percentage and per share amounts) (unaudited)
| |||||||||||||||||||
GAAP | Stock-Based CompensationExpense | Amortization of AcquiredIntangible Assets | Extraordinary Non-Cash Real Estate ImpairmentCharges | Non-GAAP | |||||||||||||||
Cost of revenue- Subscription | $ | 107,834 | $ | (15,123) | $ | (11,880) | $ | — | $ | 80,831 | |||||||||
Subscription gross margin | 86 | % | 2 | % | 2 | % | — | % | 90 | % | |||||||||
Cost of revenue- Services | 81,354 | (11,909) | — | — | 69,445 | ||||||||||||||
Services gross margin | 6 | % | 14 | % | — | % | — | % | 20 | % | |||||||||
Gross profit | 680,070 | 27,032 | 11,880 | — | 718,982 | ||||||||||||||
Total gross margin | 78 | % | 3 | % | 1 | % | — | % | 83 | % | |||||||||
Research and development | 244,507 | (72,087) | — | — | 172,420 | ||||||||||||||
Sales and marketing | 420,501 | (55,173) | (66,426) | — | 298,902 | ||||||||||||||
General and administrative | 171,327 | (34,643) | — | (35,828) | 100,856 | ||||||||||||||
(Loss) income from operations | (156,265) | 188,935 | 78,306 | 35,828 | 146,804 | ||||||||||||||
Operating margin | (18) | % | 22 | % | 9 | % | 4 | % | 17 | % | |||||||||
Net (loss) income | (162,734) | 188,935 | 78,306 | 35,828 | 140,335 | ||||||||||||||
Net (loss) income per share, basic | (0.54) | 0.62 | 0.26 | 0.12 | 0.46 | ||||||||||||||
Net (loss) income per share, diluted (1) | $ | (0.54) | $ | 0.62 | $ | 0.25 | $ | 0.12 | $ | 0.45 | |||||||||
(1) See below for a reconciliation of weighted-average shares outstanding used to calculate non-GAAP net income per share | |||||||||||||||||||
Cloudera, Inc. Twelve Months Ended January 31, 2020 GAAP Results Reconciled to Non-GAAP Results (in thousands, except percentage and per share amounts) (unaudited)
| |||||||||||||||
GAAP | Stock-Based CompensationExpense | Amortization of Acquired Intangible Assets | Non-GAAP | ||||||||||||
Cost of revenue- Subscription | $ | 117,739 | $ | (16,599) | $ | (11,213) | $ | 89,927 | |||||||
Subscription gross margin | 82 | % | 2 | % | 2 | % | 87 | % | |||||||
Cost of revenue- Services | 114,763 | (17,609) | — | 97,154 | |||||||||||
Services gross margin | 9 | % | 14 | % | — | % | 23 | % | |||||||
Gross profit | 561,689 | 34,208 | 11,213 | 607,110 | |||||||||||
Total gross margin | 71 | % | 4 | % | 1 | % | 76 | % | |||||||
Research and development | 263,566 | (75,554) | — | 188,012 | |||||||||||
Sales and marketing | 467,541 | (63,360) | (68,811) | 335,370 | |||||||||||
General and administrative | 170,336 | (47,232) | — | 123,104 | |||||||||||
Loss from operations | (339,754) | 220,354 | 80,024 | (39,376) | |||||||||||
Operating margin | (43) | % | 28 | % | 10 | % | (5) | % | |||||||
Net loss | (336,582) | 220,354 | 80,024 | (36,204) | |||||||||||
Net loss per share, basic and diluted | $ | (1.20) | $ | 0.78 | $ | 0.29 | $ | (0.13) | |||||||
Cloudera, Inc. Reconciliation of weighted-average shares used for non-GAAP net income per share (in thousands) (unaudited)
| |||||||||||
Three Months Ended January 31, | Year Ended January 31, | ||||||||||
2021 | 2020 | 2021 | 2020 | ||||||||
Weighted-average shares, basic | 303,526 | 291,193 | 302,522 | 280,772 | |||||||
Effect of dilutive securities: | |||||||||||
Stock options, unvested restricted stock units and ESPP | 8,794 | 16,572 | 12,160 | — | |||||||
Weighted-average shares, diluted | 312,320 | 307,765 | 314,682 | 280,772 | |||||||
Use of Non-GAAP Financial Information
In addition to the reasons stated under "Non-GAAP Financial Measures" above, which are generally applicable to each of the items we exclude from our non-GAAP financial measures, we believe it is appropriate to exclude or give effect to certain items for the following reasons:
- Stock-based compensation expense. We exclude stock-based compensation expense from our non-GAAP financial measures consistent with how we evaluate our operating results and prepare our operating plans, forecasts and budgets. Further, when considering the impact of equity award grants, we focus on overall stockholder dilution rather than the accounting charges associated with such equity grants. The exclusion of the expense facilitates the comparison of results and business outlook for future periods with results for prior periods in order to better understand the long-term performance of our business.
- Amortization of acquired intangible assets. We exclude the amortization of acquired intangible assets from our non-GAAP financial measures. Although the purchase accounting for an acquisition necessarily reflects the accounting value assigned to intangible assets, our management team excludes the GAAP impact of acquired intangible assets when evaluating our operating results. Likewise, our management team excludes amortization of acquired intangible assets from our operating plans, forecasts and budgets. The exclusion of the expense facilitates the comparison of results and business outlook for future periods with results for prior periods in order to better understand the long-term performance of our business.
- Extraordinary non-cash real estate impairment charges. We exclude extraordinary non-cash real estate impairment charges from our non-GAAP financial measures. Extraordinary non-cash real estate impairment charges relate to charges that we incur as a result of activities with respect to our leased office locations. The exclusion of the impairment charges facilitates the comparison of results and business outlook for future periods with results for prior periods in order to better understand the long-term performance of our business.
Cloudera, Inc. Reconciliation of Non-GAAP Financial Guidance (unaudited)
| |||||
Fiscal 2022 | |||||
(in millions) | First Quarter | Full Year | |||
GAAP operating loss | ($42) - ($37) | ($159) - ($149) | |||
Stock-based compensation expense (*) | 52 | 226 | |||
Amortization of acquired intangible assets | 18 | 70 | |||
Non-GAAP operating income | $28 - $33 | $137 - $147 | |||
Fiscal 2022 | |||||
(in millions) | First Quarter | Full Year | |||
GAAP net loss | ($49) - ($43) | ($188) - ($176) | |||
Stock-based compensation expense (*) | 52 | 226 | |||
Amortization of acquired intangible assets | 18 | 70 | |||
Non-GAAP net income | $21 - $27 | $108 - $120 | |||
(*) Stock-based compensation expense is impacted by a number of variables, each of which are inherently difficult to forecast. As a result, the guidance presented above is subject to a number of uncertainties and assumptions that may cause actual results to differ materially. | |||||

 View original content to download multimedia:http://www.prnewswire.com/news-releases/cloudera-reports-fourth-quarter-and-fiscal-year-2021-financial-results-301245024.html
SOURCE Cloudera, Inc.
Serious News for Serious Traders! Try StreetInsider.com Premium Free!
You May Also Be Interested In
- Ardent Health revises 2025 non-GAAP figures after SEC staff talks
- OPAL Fuels files S-3 to renew $199M securities registration
- TOP Financial Group moves global headquarters to Houston, Texas
Create E-mail Alert Related Categories
PRNewswire, Press ReleasesRelated Entities
Twitter, Earnings, Definitive AgreementSign up for StreetInsider Free!
Receive full access to all new and archived articles, unlimited portfolio tracking, e-mail alerts, custom newswires and RSS feeds - and more!
