



A 'silver tsunami' won't solve housing affordability challenges
 Tweet
Tweet Share
Share E-mail
Empty-nest households that could add to inventory aren't where they're needed most
- There is an oversupply of 12.8 million empty-nest homes.
- However, this potential supply is not located in the markets experiencing severe housing shortages.
Pittsburgh ,Buffalo ,Cleveland ,Detroit andNew Orleans have the largest share of empty nest homes.- The highest share of those homes are in
Las Vegas ,Austin ,Los Angeles andRiverside .
"Even if we did see a 'silver tsunami,' a look at the map tells me it wouldn't really move the needle in terms of solving our housing affordability crunch," said Orphe Divounguy, Zillow senior economist. "These empty-nest households are concentrated in more affordable markets, where housing is already more accessible — not in the expensive coastal job centers where young workers are moving and where more homes are most desperately needed."
In 2022, there were roughly 20.9 million empty-nest households nationwide — residents ages 55 or older who have lived in the same home for 10 or more years, have no children at home and have at least two extra bedrooms. That's compared to the 8.1 million families living with nonrelatives in 2022 that were likely in need of their own place. But the supply and the demand don't match up on the map.
Empty-nest households are not where most young workers choose to live
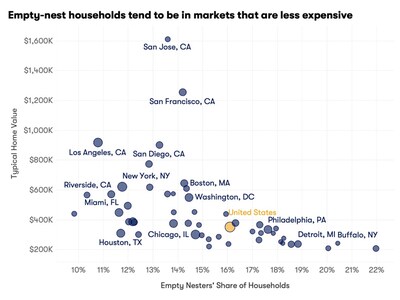
Empty-nest households tend to be in markets that are less expensive. Among the 50 largest
On the other hand, metros with some of the largest shares of millennials and Gen Zers moving in are among the nation's most expensive. Markets where the largest share of recently moved households with members 44 and younger are
As a result, the impact of a future increase in supply coming from the existing housing stock owned by older individuals would likely have a smaller impact on affordability in expensive, high-demand coastal markets.
Rather, the primary fix for affordability challenges remains a strong supply expansion coming from newly built homes. Zillow research shows that housing shortages were the most severe in markets with more land-use restrictions. Along with promoting denser construction, removing barriers to homeownership that aren't related to monthly income — such as credit assistance programs, down payment assistance or help with closing costs — would likely improve access to homeownership.
Metro Area* | Zillow Home | Empty | Under-44 | Recent Under- | Share of Listings |
16 % | 35 % | 25 % | 27 % | ||
12 % | 33 % | 23 % | 11 % | ||
11 % | 35 % | 24 % | 2 % | ||
15 % | 36 % | 26 % | 43 % | ||
12 % | 42 % | 28 % | 28 % | ||
12 % | 41 % | 29 % | 40 % | ||
14 % | 38 % | 29 % | 44 % | ||
18 % | 35 % | 23 % | 51 % | ||
12 % | 30 % | 27 % | 24 % | ||
14 % | 38 % | 25 % | 46 % | ||
14 % | 35 % | 28 % | 12 % | ||
12 % | 38 % | 26 % | 24 % | ||
14 % | 36 % | 28 % | 14 % | ||
11 % | 35 % | 18 % | 13 % | ||
19 % | 32 % | 22 % | 61 % | ||
13 % | 43 % | 30 % | 17 % | ||
16 % | 39 % | 26 % | 51 % | ||
13 % | 39 % | 25 % | 4 % | ||
12 % | 32 % | 26 % | 26 % | ||
13 % | 43 % | 32 % | 23 % | ||
17 % | 35 % | 24 % | 56 % | ||
19 % | 36 % | 21 % | 64 % | ||
12 % | 38 % | 28 % | 22 % | ||
14 % | 38 % | 25 % | 33 % | ||
12 % | 41 % | 30 % | 33 % | ||
14 % | 38 % | 30 % | 18 % | ||
14 % | 35 % | 23 % | 11 % | ||
22 % | 32 % | 22 % | 72 % | ||
17 % | 37 % | 23 % | 53 % | ||
10 % | 48 % | 32 % | 26 % | ||
10 % | 37 % | 24 % | 19 % | ||
16 % | 38 % | 28 % | 51 % | ||
15 % | 41 % | 26 % | 45 % | ||
15 % | 41 % | 24 % | 59 % | ||
20 % | 33 % | 28 % | 57 % | ||
14 % | 38 % | 35 % | 7 % | ||
14 % | 42 % | 28 % | 19 % | ||
17 % | 39 % | 28 % | 44 % | ||
16 % | 32 % | 22 % | 15 % | ||
15 % | 37 % | 26 % | 40 % | ||
17 % | 37 % | 25 % | 46 % | ||
15 % | 42 % | 31 % | 43 % | ||
15 % | 39 % | 24 % | 40 % | ||
16 % | 37 % | 25 % | 48 % | ||
18 % | 36 % | 26 % | 43 % | ||
18 % | 35 % | 24 % | 48 % | ||
18 % | 34 % | 24 % | 37 % | ||
14 % | 45 % | 25 % | 23 % | ||
18 % | 33 % | 25 % | 42 % | ||
20 % | 33 % | 19 % | 64 % | ||
18 % | 36 % | 26 % | 55 % |
*Table ordered by market size
About Zillow Group:
Zillow Group, Inc. (Nasdaq: Z and ZG) is reimagining real estate to make home a reality for more and more people. As the most visited real estate website in
Zillow Group's affiliates, subsidiaries and brands include Zillow®, Zillow Premier Agent®, Zillow Home Loans℠, Zillow Rentals®, Trulia®, Out East®, StreetEasy®, HotPads®, ShowingTime+℠, Spruce®, and Follow Up Boss®.
All marks herein are owned by MFTB Holdco, Inc., a Zillow affiliate. Zillow Home Loans, LLC is an Equal Housing Lender, NMLS #10287 (www.nmlsconsumeraccess.org). © 2024 MFTB Holdco, Inc., a Zillow affiliate.
(ZFIN)

 View original content to download multimedia:https://www.prnewswire.com/news-releases/a-silver-tsunami-wont-solve-housing-affordability-challenges-302323557.html
SOURCE Zillow
Serious News for Serious Traders! Try StreetInsider.com Premium Free!
You May Also Be Interested In
- Best Affordable Luxury Sunglasses (2026): Designer Look Quay Frames Featured Among Stylish Options Without the High Price Tag by Expert Consumers
- Marketing Maven CEO and Founder, Lindsey Carnett, to Keynote Elevate's Inspiring Women in Business Event
- Crypto Breaking News: Apeing’s Top Crypto Presale Brings $0.00055 Pricing as SOL Jumps 15% and BNB Pushes Toward $790
Create E-mail Alert Related Categories
PRNewswire, Press ReleasesSign up for StreetInsider Free!
Receive full access to all new and archived articles, unlimited portfolio tracking, e-mail alerts, custom newswires and RSS feeds - and more!
