




VIZSLA SILVER DELIVERS EXCEPTIONAL ECONOMICS FOR PANUCO IN PRELIMINARY ECONOMIC ASSESSMENT

FREE Breaking News Alerts from StreetInsider.com!
StreetInsider.com Top Tickers, 10/12/2026
- Oil rally pressures S&P, Nasdaq; Microsoft, Salesforce buoy Dow
- Oil prices rise 2% as attacks on Saudi Arabia overshadow Trump's diesel deal
- Will surging equity supply derail the U.S. bull market? Goldman Sachs weighs in
- Broadcom CEO says many AI investors are gamblers
- "Not buying Chipotle": Starbucks squashes blockbuster acquisition speculation
 Tweet
Tweet Share
Share E-mail
Get Alerts VZLA Hot Sheet
Join SI Premium – FREE
NYSE: VZLA TSX-V: VZLA
After-Tax NPV (5%) of
The PEA, completed by Ausenco Engineering Canada ULC ("Ausenco"), supported by Entech Mining Ltd. ("Entech") and SGS Canada Inc. ("SGS"), provides a robust base case assessment for developing Panuco as a long-life, high-margin underground precious metals mine with low initial capital requirements and a fast timeline to production.
"An estimated after-tax NPV (5%) of more than
The Company cautions that the results of the PEA are preliminary in nature and include inferred mineral resources that are considered too speculative geologically to have economic consideration applied to them to be classified as mineral reserves. There is no certainty that the results of the PEA will be realized. Mineral resources that are not mineral reserves do not have demonstrated economic viability.
PEA Webcast
Vizsla Silver will be hosting a webcast to discuss the PEA at
PEA Highlights (Base Case)
- 3,300 tonnes per day ("tpd") production rate for the first three years, expanding to 4,000 tpd in year 4, producing silver-gold doré with an initial mine life of 10.6 years.
- High-grade underground mine with mineralized material1 averaging
US$253 /t NSR value (diluted) comprisingCopala deposit with 5.3 Mt averaging 316g/t Ag, 1.97 g/t Au. - Life of Mine ("LOM") average annual payable production of 15,225 koz AgEq2 per year (9,268 koz Ag per year and 78 koz Au per year).
- Years 1-2 average annual payable production of 20,185 koz AgEq per year (13,756 koz Ag per year and 85 koz Au per year).
- LOM cash costs3 of
US$7.98 /oz payable AgEq on a co-product basis, LOM all-in sustaining costs (AISC4) ofUS$9.40 /oz payable AgEq on a co-product basis. - Initial capital expenditures of
USD$224M . - After-tax NPV (5%) of
US$1,137M and 85.7% IRR atUS$26 /oz Ag andUS$1,975 /oz Au. - After-tax payback period of 9 months.
Notes: | |
1. | Underground mineralized material contains, Indicated and Inferred Resources |
2. | Payable Silver Equivalent (AgEq.) calculated by dividing gross sales revenue by |
3. | Total cash costs consist of operating cash costs plus royalties and offsite (refining & transport) charges |
4. | AISC consist of total cash costs plus sustaining capital |
PEA Overview
The PEA considers two contiguous underground mines, the
The processing throughput capacity of 3,300 tonnes per day for the first three years, expanding to 4,000 tonnes per day in year four, results in an initial mine life of 10.6 years. The PEA leverages
The PEA is derived using the Company's mineral resource estimate published on
General | LOM Total / Avg. |
Gold Price (US$/oz) | 1,975 |
26.00 | |
10.6 | |
Total Processed Feed Tonnes (kt) | 14,607 |
Total Waste Tonnes (kt) | 4,975 |
Production | LOM Total / Avg. |
Head Grade – Ag (g/t) | 228 |
Head Grade – Au (g/t) | 1.90 |
Recovery Rate – Ag (%) to doré | 92.2 % |
Recovery Rate – Au (%) to doré | 93.8 % |
Total Metal Payable – Ag (koz) | 98,697 |
Total Metal Payable – Au (koz) | 835 |
Average Annual Payable Production – Ag (koz) | 9,268 |
Average Annual Payable Production – Au (koz) | 78 |
Average Annual Payable Production – AgEq. (koz) | 15,225 |
Average Annual Payable Production (Yrs 1-2) – AgEq. (koz) | 20,185 |
Operating Costs | LOM Total / Avg. |
47.21 | |
Processing Cost (US$/t Processed) (incl. TSF) | 21.96 |
G&A Cost (US$/t Processed) | 7.24 |
Total Operating Costs (US$/t Processed) | 76.40 |
Cash Costs (Co-Product Basis) (US$/oz Ag)* | 7.98 |
AISC (Co-Product Basis) (US$/oz Ag)** | 9.40 |
Capital Costs | LOM Total / Avg. |
Initial Capital (US$M) | 223.6 |
Expansion Capital (US$M) | 11.1 |
Sustaining Capital (US$M) | 230.2 |
Closure Capital (US$M) | 31.8 |
Salvage Value (US$M) | 9.5 |
Financials | Pre-Tax |
NPV (5%) (US$M) | 1,778 |
IRR (%) | 124.1 % |
Payback (Years) | 0.6 |
Financials | Post-Tax |
NPV (5%) (US$M) | 1,137 |
IRR (%) | 85.7 % |
Payback (Years) | 0.8 |
Post-Tax NPV/Initial Capital | 5.1 |
* Total cash costs consist of operating cash costs plus royalties and offsite (refining & transport) charges |
** AISC consist of total cash costs plus sustaining capital |
Table 1: Panuco PEA Detailed Parameters and Outputs
NPV remains positive for changes of +/-20% in revenue drivers including metal prices, head grade, recovery, initial capital expenditure and operating costs. After-tax economic sensitivities are presented in Tables 2 and 3 below. Additional project sensitivities will be presented in the Technical Report.
Inputs | Sensitivity Summary Post-Tax NPV 5% (US$M) | |||||
(+/-%) | (20.0 %) | (10.0 %) | PEA | 10.0 % | 20.0 % | |
Metal Price | ||||||
Head Grade | ||||||
Recovery | ||||||
Operating Costs | ||||||
Initial Capex | ||||||
Table 2: Sensitivity Summary Post Tax NPV 5% (US$M)
Inputs | Sensitivity Summary Post-Tax IRR (%) | |||||
(+/-%) | (20.0 %) | (10.0 %) | PEA | 10.0 % | 20.0 % | |
Metal Price | 62.9 % | 74.6 % | 85.7 % | 96.3 % | 106.5 % | |
Head Grade | 60.9 % | 73.6 % | 85.7 % | 96.4 % | 106.7 % | |
Recovery | 63.2 % | 74.7 % | 85.7 % | 93.7 % | 94.3 % | |
Operating Costs | 89.7 % | 87.7 % | 85.7 % | 83.6 % | 81.5 % | |
Initial Capex | 105.9 % | 94.8 % | 85.7 % | 78.0 % | 71.6 % | |
Table 3: Sensitivity Summary Post Tax IRR (%)
Mineral Resources
The MRE forms the basis for this PEA. The MRE is based on a total drill database of 822 holes (302,931 metres) completed by Vizsla Silver between
Indicated mineral resources are estimated in the MRE at 9.5 Mt grading 289 g/t silver, 2.41 g/t gold, 0.27% lead, and 0.84% zinc (511 g/t AgEq). The MRE includes indicated mineral resources of 88.2 million ounces ("Moz") of silver, 736 koz of gold, 25.4 kt of lead, and 79.9 kt of zinc (155.8 Moz AgEq).
Inferred mineral resources are estimated in the MRE at 12.2 Mt grading 239 g/t silver, 1.93 g/t gold, 0.29% lead, and 1.03% zinc (433 g/t AgEq). The MRE includes inferred mineral resources of 93.7 Moz of silver, 758 koz of gold, 35.4 kt of lead, and 125.3 kt of zinc (169.6 Moz AgEq).
Classification | Tonnes | Average Grade | Contained Metal | ||||||||||
Ag | Au | Pb | Zn | AgEq | Au Eq | Ag | Au | Pb | Zn | AgEq | AuEq | ||
(Mt) | (g/t) | (g/t) | ( %) | ( %) | (g/t) | (g/t) | (koz) | (koz) | (kt) | (kt) | (koz) | (koz) | |
Indicated | |||||||||||||
4.5 | 380 | 2.46 | 0.08 | 0.15 | 573 | 7.64 | 55,201 | 358 | 3.7 | 6.9 | 83,270 | 1,110 | |
0.6 | 358 | 2.24 | 0.12 | 0.21 | 538 | 7.18 | 7,295 | 46 | 0.7 | 1.3 | 10,953 | 146 | |
Cristiano | 0.2 | 581 | 3.37 | 0.25 | 0.43 | 858 | 11.45 | 3,961 | 23 | 0.5 | 0.9 | 5,851 | 78 |
Copala Area Total | 5.4 | 385 | 2.48 | 0.09 | 0.17 | 580 | 7.74 | 66,457 | 427 | 5.0 | 9.2 | 100,074 | 1,343 |
Napoleon | 3.3 | 162 | 2.39 | 0.52 | 1.73 | 425 | 5.66 | 17,276 | 255 | 17.2 | 57.4 | 45,223 | 603 |
Napoleon HW | 0.4 | 164 | 1.72 | 0.42 | 1.53 | 365 | 4.87 | 2,259 | 24 | 1.8 | 6.5 | 5,029 | 67 |
Luisa | 0.3 | 177 | 2.56 | 0.39 | 2.01 | 459 | 6.12 | 1556 | 22 | 1.1 | 5.5 | 4,027 | 54 |
Josephine | 0.1 | 221 | 2.88 | 0.39 | 1.11 | 492 | 6.56 | 491 | 6 | 0.3 | 0.8 | 1,092 | 15 |
Cruz | 0.0 | 144 | 2.01 | 0.37 | 1.71 | 373 | 4.97 | 153 | 2 | 0.1 | 0.6 | 396 | 5 |
NP Area Total | 4.1 | 164 | 2.34 | 0.50 | 1.72 | 421 | 5.66 | 21,735 | 309 | 20.4 | 70.7 | 55,767 | 743 |
Total Indicated | 9.5 | 289 | 2.41 | 0.27 | 0.84 | 511 | 6.81 | 88,192 | 736 | 25.4 | 79.9 | 155,841 | 2,076 |
Inferred | |||||||||||||
3.2 | 332 | 1.77 | 0.12 | 0.20 | 476 | 6.34 | 33,722 | 179 | 3.7 | 6.2 | 48,320 | 644 | |
1.0 | 365 | 2.04 | 0.22 | 0.39 | 540 | 7.21 | 12,260 | 69 | 2.3 | 4.0 | 18,140 | 242 | |
Cristiano | 0.7 | 443 | 2.54 | 0.15 | 0.29 | 650 | 8.66 | 10,213 | 59 | 1.1 | 2.0 | 14,974 | 200 |
Copala Area Total | 4.9 | 355 | 1.94 | 0.15 | 0.25 | 515 | 6.86 | 56,195 | 307 | 7.1 | 12.3 | 81,434 | 1,081 |
Napoleon | 3.2 | 137 | 1.64 | 0.45 | 1.76 | 342 | 4.57 | 14,045 | 168 | 14.4 | 55.9 | 35,063 | 467 |
Napoleon HW | 0.8 | 220 | 2.17 | 0.59 | 2.02 | 479 | 6.39 | 5,976 | 59 | 5.0 | 17.0 | 13,027 | 174 |
La Luisa | 2.0 | 159 | 2.13 | 0.30 | 1.51 | 386 | 5.15 | 10,439 | 139 | 6.0 | 30.8 | 25,326 | 338 |
Josephine | 0.2 | 161 | 2.05 | 0.33 | 1.00 | 364 | 4.85 | 1161 | 15 | 0.7 | 2.2 | 2,618 | 35 |
Cruz | 0.3 | 170 | 3.75 | 0.31 | 1.48 | 519 | 6.91 | 1698 | 37 | 1.0 | 4.6 | 5,169 | 69 |
NP Area Total | 6.6 | 157 | 1.97 | 0.41 | 1.68 | 383 | 5.10 | 33,319 | 418 | 27.1 | 110.6 | 81,203 | 1,082 |
0.3 | 226 | 1.30 | 0.01 | 0.03 | 325 | 4.33 | 2,038 | 12 | 0.0 | 0.1 | 2,936 | 39 | |
*Animas | 0.4 | 169 | 1.68 | 0.29 | 0.60 | 327 | 4.37 | 2,101 | 21 | 1.1 | 2.3 | 4,074 | 54 |
Total Inferred | 12.2 | 239 | 1.93 | 0.29 | 1.03 | 433 | 5.76 | 93,653 | 758 | 35.4 | 125.3 | 169,647 | 2,261 |
*Animas is | |||||||||||||
Table 4: Mineral Resources Reported at 150 g/t AgEq cut-off (effective date
Capital and Operating Costs
The PEA estimates initial capital requirements of
Sustaining capital is expected to average approximately
The PEA is based on contractor underground mining, which has an estimated LOM cost of
The capital and operating cost estimate was developed in Q3 2024 United States Dollars (US$). The capital cost summary is presented in Table 5 and the operating cost summary is presented in Table 6.
WBS Description | Initial Capital Cost | Sustaining Capital Cost | Expansion Cost | Total Cost |
Mining | 64.5 | 207.7 | 272.3 | |
Process Plant | 63.2 | 7.2 | 70.4 | |
Additional Facilities | 8.7 | 22.4 | 31.1 | |
On-Site Infrastructure | 13.5 | - | - | 13.5 |
Off-Site Infrastructure | 0.8 | - | - | 0.8 |
Total Directs | 150.7 | 230.2 | 7.2 | 388.2 |
Project Indirects | 6.1 | 0.6 | 6.7 | |
Project Delivery | 12.9 | - | 0.7 | 13.7 |
Total Indirects | 19.0 | - | 1.3 | 20.4 |
Owner's Cost | 7.5 | - | 0.4 | 7.9 |
Provisions (Contingency) | 46.3 | 2.1 | 48.5 | |
Closure (Incl. Contingency) | - | 31.8 | - | 31.8 |
Project Totals | 223.5 | 262.0 | 11.1 | 496.7 |
Table 5: Project Capital Cost Estimates (US$M) (totals may differ due to rounding)
Average Annual Costs (US$M) | US$/t Processed | |
Mining | 64.7 | 47.21 |
Process | 29.7 | 21.96 |
G&A | 9.9 | 7.24 |
Total | 104.3 | 76.40 |
Table 6: Project Operating Cost Estimates (US$M) (totals may differ due to rounding)
Mining
The Panuco Project is a collection of silver-gold deposits located in the
Based on the characteristics of the deposit, long-hole stoping ("LHS") was selected as the primary mining method for all deposits, with drift-and-fill ("DAF") selected for the northern portion of the
The mining methods considered for the Panuco Project are proposed to use a combination of cemented rock backfill ("CRF"), uncemented rock backfill, and paste backfill for stope support.
For the preliminary design of the Panuco Project, planned dilution and unplanned rock dilution were accounted for using the Datamine Mineable Shape Optimiser® ("MSO"). Mineralized and unmineralized dilution within MSO was estimated at 52.8% and additional unplanned dilution from backfill dilution, stope development and DAF mining was estimated at 9.2%. Mining recovery of 92% for LHS and 98% for DAF was applied as a factor to the shapes created by MSO within the production schedule.
A Net Smelter Return ("NSR") model was used to estimate the revenue of the mineralized material. Preliminary process recoveries, doré grades, smelting and refining terms, and transportation costs were assumed to determine the NSR value. A Cut-Off Value ("COV") was used to flag material by whether the revenue in a block exceeds the costs of extraction and processing of that block. There were three COVs used to assess mining at
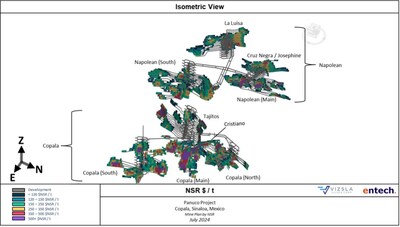
The Fully Costed COV represents the break-even value of mineralized material required to cover all the associated operating and sustaining capital costs of extraction and processing. Fully costed COVs were assumed for
Due to the distance between the various geological deposits, the Panuco Project is separated into two separate underground mines.
Contractor mining is currently proposed for the Panuco Project to minimize upfront capital and achieve higher productivity.
Period | Waste | Development | Stoping | Total Mineralized | Total Mined |
kt | kt | kt | kt | kt | |
YEAR \ TOTAL | 4,974.9 | 2,847.7 | 11,759.1 | 14,606.8 | 19,581.7 |
226.9 | 26.3 | - | 26.3 | 253.2 | |
177.8 | 226.3 | 182.5 | 408.8 | 586.5 | |
497.7 | 193.7 | 596.7 | 790.4 | 1,288.1 | |
710.7 | 169.5 | 1,115.6 | 1,285.1 | 1,995.8 | |
697.0 | 231.2 | 1,166.2 | 1,397.5 | 2,094.4 | |
573.8 | 336.5 | 1,212.6 | 1,549.1 | 2,122.9 | |
401.6 | 395.5 | 1,130.7 | 1,526.2 | 1,927.8 | |
477.0 | 369.4 | 1,035.1 | 1,404.4 | 1,881.5 | |
534.5 | 354.9 | 1,026.3 | 1,381.2 | 1,915.8 | |
491.7 | 387.9 | 1,023.7 | 1,411.7 | 1,903.4 | |
186.2 | 155.8 | 1,243.8 | 1,399.6 | 1,585.8 | |
- | 0.6 | 1,403.4 | 1,404.0 | 1,404.0 | |
- | - | 622.5 | 622.5 | 622.5 |
Table 7: Total and Annual Material Movement Schedule for the Panuco Project
Processing and Metallurgy
Three rounds of metallurgical test work have been completed to date by Vizsla Silver on the main deposits for the Panuco Project dating back to 2021. Flowsheet development, undertaken by Ausenco using samples from the Napoleon,
The PEA envisages a two phased approach to mill development. Phase 1, with an initial throughput of 3,300 tpd, assumes run-of-mine ("ROM") material is crushed and screened before grinding using a ball mill. The ground material reports to the leach circuit for a total of 96 hours. Discharge from the whole ore leaching tank will gravitate to the counter current decantation ("CCD") circuit where leached solids will be cleaned of pregnant solution through a series of counter-current decantation thickeners to facilitate extraction and recovery of silver and gold by cyanide leach -
In Phase 2, the process plant expands to process 4,000 tpd and a flotation and concentrate leaching circuit is introduced to the flowsheet to support improved recoveries from Year 4.
Project Enhancement Opportunities
The PEA demonstrates that
- Continued exploration and infill drilling for conversion of Inferred Mineral Resources to the Measured and Indicated categories.
- Mine scheduling investigations allowing for the further optimization of blending scenarios.
- Supplementary metallurgical optimizations including deposit-wide variability testing and host rock characterization.
- Optimization of the flotation recovery and concentrate quality as well as the leach-
Merrill Crowe process. - Further optimization of tailings and water management infrastructure, including surface geotechnical site investigations, laboratory testing, physical waste characterization, water balance modelling, and engineering studies.
Next Steps (
With the PEA completed, Vizsla Silver is moving forward with a feasibility study for the Panuco Project (the "Feasibility Study"). The Company is targeting completion of the Feasibility Study in the second half of 2025 and intends to make a production decision only following the release of a positive Feasibility Study. There are currently two drill rigs focused on infill drilling to upgrade inferred resources into the indicated category and indicated resources to the measured category, for inclusion in the Feasibility Study reserves.
The fully funded and permitted bulk sample test-mine will commence at
Qualified Persons
In accordance with NI 43-101,
Additionally, a team of independent Qualified Persons (as such term is defined under NI 43-101) at Ausenco, Entech and SGS have led the PEA and have reviewed and verified the technical disclosure in this press release, including:
- Peter Mehrfert,
P.Eng ., of Ausenco is an independent Qualified Person responsible for process and recovery methods, market studies and contracts and economic analysis in the PEA. James Millard ,P.Geo ., of Ausenco is an independent Qualified Person responsible for the environmental and permitting studies in the PEA.Allan Armitage ,P.Eng ., FEC, CET., of SGS is an independent Qualified Person responsible for the Property description and location, mineral resource estimate and discussion of adjacent properties in the PEA.Ramon Mendoza ,P.Eng ., of Entech is an independent Qualified Person responsible for the mining methods and mining cost estimation in the PEA.Ben Eggers ,P. Geo of SGS is an independent Qualified Person responsible for the history, regional geology, exploration and drilling and sampling work in the PEA.
About Vizsla Silver and the Panuco Project
Vizsla Silver's flagship
- Indicated: 9.48 Mt grading 289 g/t silver, 2.41 g/t gold, 0.27% lead, and 0.84% zinc (511 AgEq). The current MRE includes indicated mineral resources of 88.2 Moz of silver, 736 koz of gold, 56 Mlbs of lead, and 176 Mlbs of zinc (155.8 Moz AgEq).
- Inferred: 12.19 Mt grading 239 g/t silver, 1.93 g/t gold, 0.29% lead, and 1.03% zinc (433 g/t AgEq). The current MRE includes inferred mineral resources of 93.7 Moz of silver, 758 koz of gold, 78 Mlbs of lead, and 276 Mlbs of zinc (169.6 Moz AgEq).
About Ausenco
Ausenco is a global diversified engineering, environmental, construction and project management company providing consulting, project delivery and asset management solutions to the resources, energy, and infrastructure sectors. Ausenco's experience in poly-metallic projects ranges from conceptual, pre-feasibility and feasibility studies for new project developments to project execution with EPCM delivery. Ausenco is currently engaged on several global projects with similar characteristics and to the Panuco Project.
Information Concerning Estimates of Mineral Resources
The scientific and technical information in this news release was prepared in accordance with NI 43-101 which differs significantly from the requirements of the U.S. Securities and Exchange Commission (the "SEC"). The terms "measured mineral resource", "indicated mineral resource" and "inferred mineral resource" used herein are in reference to the mining terms defined in the Canadian Institute of Mining, Metallurgy and Petroleum Standards (the "CIM Definition Standards"), which definitions have been adopted by NI 43-101. Accordingly, information contained herein providing descriptions of our mineral deposits in accordance with NI 43-101 may not be comparable to similar information made public by other
You are cautioned not to assume that any part or all of mineral resources will ever be converted into reserves. Pursuant to CIM Definition Standards, "inferred mineral resources" are that part of a mineral resource for which quantity and grade or quality are estimated on the basis of limited geological evidence and sampling. Such geological evidence is sufficient to imply but not verify geological and grade or quality continuity. An inferred mineral resource has a lower level of confidence than that applying to an indicated mineral resource and must not be converted to a mineral reserve. However, it is reasonably expected that the majority of inferred mineral resources could be upgraded to indicated mineral resources with continued exploration. Under Canadian rules, estimates of inferred mineral resources may not form the basis of feasibility or pre-feasibility studies, except in rare cases. Investors are cautioned not to assume that all or any part of an inferred mineral resource is economically or legally mineable. Disclosure of "contained ounces" in a resource is permitted disclosure under Canadian regulations; however, the SEC normally only permits issuers to report mineralization that does not constitute "reserves" by SEC standards as in place tonnage and grade without reference to unit measures.
Canadian standards, including the CIM Definition Standards and NI 43-101, differ significantly from standards in the SEC Industry Guide 7. Effective
Neither TSX Venture Exchange nor its Regulation Services Provider (as that term is defined in policies of the TSX Venture Exchange) accepts responsibility for the adequacy or accuracy of this release.
SPECIAL NOTE REGARDING FORWARD LOOKING STATEMENTS
This news release includes certain "Forward–Looking Statements" within the meaning of the United States Private Securities Litigation Reform Act of 1995 and "forward–looking information" under applicable Canadian securities laws. When used in this news release, the words "anticipate", "believe", "estimate", "expect", "target", "plan", "forecast", "may", "would", "could", "schedule" and similar words or expressions, identify forward–looking statements or information. These forward–looking statements or information relate to, among other things: the exploration, development, and production at
Forward–looking statements and forward–looking information relating to any future mineral production, liquidity, enhanced value and capital markets profile of Vizsla Silver, future growth potential for Vizsla Silver and its business, and future exploration plans are based on management's reasonable assumptions, estimates, expectations, analyses and opinions, which are based on management's experience and perception of trends, current conditions and expected developments, and other factors that management believes are relevant and reasonable in the circumstances, but which may prove to be incorrect. Assumptions have been made regarding, among other things, the price of silver, gold, and other metals; costs of exploration and development; the estimated costs of development of exploration projects; Vizsla Silver's ability to operate in a safe and effective manner and its ability to obtain financing on reasonable terms.
These statements reflect Vizsla Silver's respective current views with respect to future events and are necessarily based upon a number of other assumptions and estimates that, while considered reasonable by management, are inherently subject to significant business, economic, competitive, political and social uncertainties and contingencies. Many factors, both known and unknown, could cause actual results, performance, or achievements to be materially different from the results, performance or achievements that are or may be expressed or implied by such forward–looking statements or forward-looking information and Vizsla Silver has made assumptions and estimates based on or related to many of these factors. Such factors include, without limitation: the Company's dependence on one mineral project; precious metals price volatility; risks associated with the conduct of the Company's mining activities in

 View original content to download multimedia:https://www.prnewswire.com/news-releases/vizsla-silver-delivers-exceptional-economics-for-panuco-in-preliminary-economic-assessment-302204999.html
SOURCE Vizsla Silver Corp.
Serious News for Serious Traders! Try StreetInsider.com Premium Free!
You May Also Be Interested In
- Zhibao Technology signs non-binding deal to explore blockchain equity
- Volato Group secures $1B equity facility for AI infrastructure growth
- Mirum's maralixibat meets primary endpoint in rare liver disease trial
Create E-mail Alert Related Categories
PRNewswire, Press ReleasesSign up for StreetInsider Free!
Receive full access to all new and archived articles, unlimited portfolio tracking, e-mail alerts, custom newswires and RSS feeds - and more!
