



CenterState Bank Corporation Announces First Quarter 2020 Results
(all amounts are in thousands, except per share data, or unless otherwise noted)
 Tweet
Tweet Share
Share E-mail
Get Alerts CSFL Hot Sheet
Join SI Premium – FREE
WINTER HAVEN, Fla., April 23, 2020 /PRNewswire/ -- CenterState Bank Corporation (Nasdaq: CSFL) (the "Company" or "CenterState") announced first quarter 2020 results. Highlights for the period ended March 31, 2020 and selected performance metrics are set forth below.
Earnings Highlights: The Company reported first quarter 2020 net income of $35.4 million compared to $71.1 million for the fourth quarter 2019. Diluted Earnings per Share ("EPS") was $0.28 in the first quarter 2020 compared to $0.56 in the fourth quarter 2019. Return on Average Assets ("ROAA") for the current quarter was 0.82% compared to 1.63% for the fourth quarter 2019 while Return on Tangible Average Common Equity ("ROTCE") (non-GAAP(1)) and adjusted ROTCE (non-GAAP(1)) for the current quarter were each 9.9% compared to 18.8% and 19.1%, respectively, for the fourth quarter 2019.
During the current quarter, the Company repurchased a total of 1.45 million shares or 1.2% of its outstanding shares, resulting in Tangible Book Value per share ("TBV") (non-GAAP(1)) of $12.68 and Tangible Common Equity ("TCE") ratio of 9.1%, after the adoption of CECL on January 1, 2020 and higher Q1 2020 provision for credit losses for loans held for investment and credit loss expense for unfunded commitments. |
- Other Financial Results:
- Adjusted pre-tax pre-provision income (non-GAAP(1)): $90.4 million for the current quarter compared to $95.0 for the fourth quarter 2019 on record revenue(2) of $209.1 million, up $889 or 0.4% from fourth quarter 2019
- Net Interest Margin, tax equivalent ("NIM") (Non-GAAP(1)): decreased 8 bps to 4.17% from the fourth quarter 2019; core NIM excluding all loan accretion (Non-GAAP(1)) of 3.74%, a decrease of 3 bps from the fourth quarter 2019 reflecting, in part, the declining interest rate environment and volatility following the onset of the COVID-19 pandemic
- Non-interest income(3): 1.29% of average assets for the current quarter compared with 1.15% in the fourth quarter 2019
- Efficiency ratio (Non-GAAP(1)): 58.5% reported, 54.9% adjusted for the first quarter 2020 compared to 54.3% and 52.1%, respectively, in the fourth quarter 2019
- Loan growth: loan growth of $43.3 million or 1% annualized
- Deposit growth: non-CD deposits growth of $348 million or 13% annualized; DDA growth of $271 million or 17% annualized
- CECL and Provision for Credit Losses:
- CECL adopted January 1, 2020, with initial Allowance for Credit Losses ("ACL") of $115.3 million, and a $6.0 million reserve for unfunded commitments (reported as other liability on the balance sheet); reflects a combined $80.7 million increase in these reserves at adoption compared to fiscal year-end 2019 levels; the March 31, 2020 ending ACL and reserve for unfunded commitments increased by $125.2 million over the balance at December 31, 2019
- $44.9 million provision for credit losses on loans during the first quarter of 2020, bringing the ACL to $158.7 million, reflecting an increase of 37.7% above the level at adoption; $1.0 million provision for credit losses on unfunded commitments leaving a $7.1 million reserve for unfunded commitments; total expense for reserve build of $45.9 million during the quarter, the vast majority of which was associated with the effects of COVID-19
- Net charge-off of $1,444 in the first quarter 2020 compared to $4,384 in the fourth quarter 2019
- Small Business Administration ("SBA") Paycheck Protection Program ("PPP"): In April 2020, the Company generated over 6,700 loans for a total loan amount over $1.1 billion in the SBA system through April 16, 2020
- Quarterly Dividend Declaration: On April 23rd, 2020, the Board of Directors declared a quarterly cash dividend on the Company's common stock of $0.14 per share. The dividend is payable on May 15th, 2020 to shareholders of record as of May 8th, 2020
Three Months Ended March 31, | |||||||||||
2020 | 2019 | ||||||||||
Adjusted (4) | Adjusted (4) | ||||||||||
Reported | (Non-GAAP) | Reported | (Non-GAAP) | ||||||||
Net income | $35,432 | $35,491 | $44,643 | $49,463 | |||||||
ROAA | 0.82% | 0.82% | 1.47% | 1.63% | |||||||
ROTCE (Non-GAAP)(1) and adjusted ROTCE (Non-GAAP)(1) | 9.9% | 9.9% | 16.8% | 18.5% | |||||||
EPS (diluted) | $0.28 | $0.28 | $0.46 | $0.51 | |||||||
Efficiency ratio, tax equivalent (Non-GAAP)(1) | 58.5% | 54.9% | 58.7% | 52.3% | |||||||
(1) | See reconciliation tables starting on page 9, Explanation of Certain Unaudited Non-GAAP Financial Measures. |
(2) | Revenue is defined as net interest income plus non-interest income. |
(3) | Non-interest income excludes gain or loss on sale of available for sale securities. |
(4) | Performance metrics presented above are adjusted for gain or loss on sale of available for sale securities, merger-related expenses, deferred tax asset write down and other tax benefit adjustments, and amortization of intangible assets, which for the three months ended March 31, 2020, represent direct severance, system terminations, and legal and professional fees, that are not duplicative of current operations, and other items. See reconciliation tables starting on page 9, Explanation of Certain Unaudited Non-GAAP Financial Measures. |
Condensed Consolidated Income Statement (unaudited) | |||||||||||
Condensed consolidated income statements (unaudited) are shown below for the periods indicated. | |||||||||||
Three Months Ended | |||||||||||
Mar. 31, 2020 | Dec. 31, 2019 | Sep. 30, 2019 | Jun. 30, 2019 | Mar. 31, 2019 | |||||||
Interest income | |||||||||||
Loans | $160,675 | $167,685 | $166,479 | $167,676 | $116,285 | ||||||
Investment securities | 14,271 | 13,404 | 13,472 | 14,453 | 14,002 | ||||||
Federal Funds sold and other | 1,813 | 2,783 | 3,974 | 3,124 | 1,995 | ||||||
Total interest income | 176,759 | 183,872 | 183,925 | 185,253 | 132,282 | ||||||
Interest expense | |||||||||||
Deposits | 19,836 | 22,276 | 24,463 | 23,037 | 13,323 | ||||||
Securities sold under agreement to repurchase | 252 | 278 | 293 | 299 | 236 | ||||||
Other borrowed funds | 2,321 | 2,364 | 3,164 | 2,166 | 3,978 | ||||||
Corporate and subordinated debentures | 997 | 1,029 | 1,058 | 1,070 | 570 | ||||||
Interest expense | 23,406 | 25,947 | 28,978 | 26,572 | 18,107 | ||||||
Net interest income | 153,353 | 157,925 | 154,947 | 158,681 | 114,175 | ||||||
Provision for credit losses | 44,914 | 3,048 | 3,692 | 2,792 | 1,053 | ||||||
Net interest income after credit loss provision | 108,439 | 154,877 | 151,255 | 155,889 | 113,122 | ||||||
Gain (loss) on sale of securities available for sale | — | 13 | — | (5) | 17 | ||||||
All other non-interest income | 55,790 | 50,316 | 48,488 | 37,948 | 29,283 | ||||||
Total non-interest income | 55,790 | 50,329 | 48,488 | 37,943 | 29,300 | ||||||
Merger related expenses | 3,051 | 159 | 16,994 | 15,739 | 6,365 | ||||||
All other non-interest expense | 119,721 | 113,250 | 110,042 | 106,250 | 78,108 | ||||||
Total non-interest expense | 122,772 | 113,409 | 127,036 | 121,989 | 84,473 | ||||||
Income before income tax | 41,457 | 91,797 | 72,707 | 71,843 | 57,949 | ||||||
Income tax provision | 6,025 | 20,665 | 17,006 | 16,721 | 13,306 | ||||||
Net income before earnings attributable to noncontrolling interest | 35,432 | 71,132 | 55,701 | 55,122 | 44,643 | ||||||
Earnings attributable to noncontrolling interest | — | — | 603 | 599 | — | ||||||
Net income | $35,432 | $71,132 | $55,098 | $54,523 | $44,643 | ||||||
Net income attributable to CenterState Bank Corporation | $35,424 | $71,109 | $55,077 | $54,502 | $44,620 | ||||||
Earnings per share - Basic | $0.28 | $0.57 | $0.43 | $0.42 | $0.47 | ||||||
Earnings per share - Diluted | $0.28 | $0.56 | $0.43 | $0.42 | $0.46 | ||||||
Dividends per share | $0.14 | $0.11 | $0.11 | $0.11 | $0.11 | ||||||
Average common shares outstanding (basic) | 124,799 | 125,147 | 127,840 | 129,848 | 95,741 | ||||||
Average common shares outstanding (diluted) | 125,341 | 126,082 | 128,739 | 130,768 | 96,501 | ||||||
Common shares outstanding at period end | 124,131 | 125,174 | 126,037 | 129,006 | 95,913 | ||||||
Effective tax rate | 14.53% | 22.51% | 23.59% | 23.47% | 22.96% | ||||||
Note: Certain prior period amounts have been reclassified to conform to the current period presentation format. |
CONDENSED CONSOLIDATED BALANCE SHEETS (unaudited) | ||||||||||
Presented below are condensed consolidated balance sheets for the periods indicated. | ||||||||||
Ending Balance | ||||||||||
Condensed Consolidated Balance Sheets | Mar. 31, 2020 | Dec. 31, 2019 | Sep. 30, 2019 | Jun. 30, 2019 | Mar. 31, 2019 | |||||
Assets | ||||||||||
Cash and due from banks | $685,439 | $326,168 | $598,808 | $399,952 | $256,580 | |||||
Fed funds sold and Fed Reserve Bank deposits | 461,252 | 163,890 | 238,470 | 437,386 | 339,223 | |||||
Trading securities | 8,432 | 4,987 | 4,273 | 651 | — | |||||
Investment securities: | ||||||||||
Available for sale | 2,138,442 | 1,886,724 | 1,779,956 | 1,792,757 | 1,701,396 | |||||
Held to maturity, net of allowance | 195,948 | 202,903 | 207,209 | 210,756 | 214,240 | |||||
Total investment securities | 2,334,390 | 2,089,627 | 1,987,165 | 2,003,513 | 1,915,636 | |||||
Loans held for sale | 188,316 | 142,801 | 125,182 | 95,108 | 49,474 | |||||
Loans: | ||||||||||
Originated loans | 6,331,914 | 5,922,879 | 5,494,738 | 4,888,357 | 4,349,627 | |||||
Acquired loans | 5,544,995 | 5,925,596 | 6,278,686 | 6,667,101 | 3,850,312 | |||||
Purchased Credit Deteriorated ("PCD") loans | 150,322 | 135,468 | 142,982 | 157,303 | 149,456 | |||||
Total gross loans | 12,027,231 | 11,983,943 | 11,916,406 | 11,712,761 | 8,349,395 | |||||
Allowance for credit losses | (158,733) | (40,655) | (41,991) | (40,653) | (40,052) | |||||
Loans, net of allowance | 11,868,498 | 11,943,288 | 11,874,415 | 11,672,108 | 8,309,343 | |||||
Premises, equipment and right of use assets, net | 329,533 | 328,869 | 327,977 | 324,974 | 248,625 | |||||
Goodwill | 1,204,417 | 1,204,417 | 1,204,417 | 1,204,417 | 802,880 | |||||
Core deposit intangible | 87,295 | 91,157 | 95,175 | 99,200 | 63,511 | |||||
Bank owned life insurance | 331,713 | 330,155 | 328,736 | 326,689 | 269,144 | |||||
OREO | 9,942 | 5,092 | 6,558 | 5,881 | 5,981 | |||||
Deferred income tax asset, net | 37,687 | 28,786 | 37,921 | 44,637 | 38,030 | |||||
Market value of derivatives hedged | 831,891 | 273,068 | 367,950 | 229,735 | 130,122 | |||||
Other assets | 217,487 | 209,720 | 223,329 | 192,346 | 159,088 | |||||
Total Assets | $18,596,292 | $17,142,025 | $17,420,376 | $17,036,597 | $12,587,637 | |||||
Liabilities and Equity | ||||||||||
Deposits: | ||||||||||
Non-interest bearing | $4,164,091 | $3,929,183 | $4,081,078 | $3,990,883 | $3,152,251 | |||||
Interest bearing | 2,650,252 | 2,613,933 | 2,430,149 | 2,493,870 | 1,813,028 | |||||
Total checking accounts | 6,814,343 | 6,543,116 | 6,511,227 | 6,484,753 | 4,965,279 | |||||
Money market accounts | 3,519,441 | 3,525,571 | 3,648,449 | 3,569,025 | 2,156,667 | |||||
Savings deposits | 894,332 | 811,150 | 780,052 | 725,124 | 703,949 | |||||
Time deposits | 2,893,383 | 2,256,555 | 2,423,335 | 2,433,183 | 1,921,130 | |||||
Total deposits | 14,121,499 | 13,136,392 | 13,363,063 | 13,212,085 | 9,747,025 | |||||
Federal funds purchased | 255,433 | 379,193 | 259,077 | 276,963 | 303,017 | |||||
Other borrowings | 364,092 | 325,484 | 423,662 | 310,595 | 302,534 | |||||
Reserve for unfunded commitments | 7,110 | — | — | — | — | |||||
Market value of derivatives hedged | 842,451 | 275,033 | 371,889 | 231,735 | 130,790 | |||||
Other liabilities | 135,455 | 129,205 | 144,983 | 114,707 | 76,719 | |||||
Stockholders' equity: | ||||||||||
Common stockholders' equity | 2,870,252 | 2,896,718 | 2,857,702 | 2,878,377 | 2,027,552 | |||||
Noncontrolling interest | — | — | — | 12,135 | — | |||||
Total equity | 2,870,252 | 2,896,718 | 2,857,702 | 2,890,512 | 2,027,552 | |||||
Total Liabilities and Equity | $18,596,292 | $17,142,025 | $17,420,376 | $17,036,597 | $12,587,637 | |||||
Note: Certain prior period amounts have been reclassified to conform to the current period presentation format. |
SELECTED CONSOLIDATED FINANCIAL DATA | ||||||||||
The table below summarizes selected financial data for the periods presented. | ||||||||||
Three Months Ended | ||||||||||
Mar. 31, 2020 | Dec. 31, 2019 | Sep. 30, 2019 | Jun. 30, 2019 | Mar. 31, 2019 | ||||||
Selected financial data | ||||||||||
Return on average assets (annualized) | 0.82% | 1.63% | 1.27% | 1.30% | 1.47% | |||||
Adjusted return on average assets (annualized) (Non-GAAP) (1) | 0.82% | 1.66% | 1.57% | 1.59% | 1.63% | |||||
Return on average common equity (annualized) | 4.94% | 9.80% | 7.56% | 7.63% | 9.05% | |||||
Adjusted return on average common equity (annualized) (Non-GAAP) (1) | 4.95% | 9.95% | 9.34% | 9.31% | 10.03% | |||||
Return on average tangible equity (annualized) (Non-GAAP) (1) | 9.87% | 18.77% | 14.61% | 14.95% | 16.80% | |||||
Adjusted return on average tangible equity (annualized) (Non-GAAP) (1) | 9.88% | 19.05% | 17.85% | 18.04% | 18.54% | |||||
Efficiency ratio (tax equivalent) (Non-GAAP) (1) | 58.5% | 54.3% | 62.3% | 61.9% | 58.7% | |||||
Adjusted efficiency ratio, tax equivalent (Non-GAAP) (1) | 54.9% | 52.1% | 51.9% | 51.7% | 52.3% | |||||
Dividend payout | 50.0% | 19.6% | 25.6% | 26.2% | 23.9% | |||||
Loan / deposit ratio | 85.2% | 91.2% | 89.2% | 88.7% | 85.7% | |||||
Common stockholders' equity (to total assets) | 15.4% | 16.9% | 16.4% | 16.9% | 16.1% | |||||
Common equity per common share | $23.12 | $23.14 | $22.67 | $22.31 | $21.14 | |||||
Common tangible equity per common share (Non-GAAP) (1) | $12.68 | $12.76 | $12.32 | $12.17 | $12.08 | |||||
Common tangible equity (to total tangible assets) (Non-GAAP) (1) | 9.1% | 10.1% | 9.6% | 10.0% | 9.9% | |||||
Tier 1 capital (to average assets) | 9.7% | 9.7% | 9.5% | 9.9% | 10.3% | |||||
(1) | See reconciliation tables starting on page 9, Explanation of Certain Unaudited Non-GAAP Financial Measures. |
IMPACT OF ADOPTION OF CURRENT EXPECTED CREDIT LOSSES ("CECL")
CECL Impact on Adoption Date
The Company adopted CECL effective January 1, 2020. The final adoption model resulted in an increase to ACL as a percentage of total loans by 62 bps. This increase included the reclassification of the credit mark on PCD loans from loan discount to ACL. In addition, the Company recorded a reserve for credit losses on unfunded commitments of $6 million and a reserve for credit losses on held to maturity securities of $10 thousand. The impact to retained earnings, net of deferred taxes, of the increase in ACL, reserve for the unfunded commitments and credit losses on debt securities held to maturity was $48 million, resulting in 28 bps reduction in tangible common equity as a percentage of total tangible assets (non-GAAP). See table on page 12, Explanation of Certain Unaudited Non-GAAP Financial Measures for the impact of CECL adoption on the tangible common equity ratio.
The table below summarizes the CECL impact on ACL as a percentage of total loans.
Loan Balance | Dec. 31, 2019 | ||||
Non-PCD loans | $11,848,475 | ||||
PCD loans | 135,468 | ||||
Total loans | $11,983,943 | ||||
Impact of CECL | |||||
ACL | Dec. 31, 2019 | Adoption | |||
Non-PCD loans | $40,429 | $57,604 | |||
PCD loans | 226 | 17,004 | |||
Total ACL on loans | $40,655 | $74,608 | |||
ACL increase over total loans post CECL implementation | 0.62% | ||||
Loan Portfolio | ||||||||||
The table below summarizes the Company's loan portfolio over the most recent five-quarter ends. | ||||||||||
Ending Balance | ||||||||||
Mar. 31, 2020 | Dec. 31, 2019 | Sep. 30, 2019 | Jun. 30, 2019 | Mar. 31, 2019 | ||||||
Real estate loans | ||||||||||
Residential | $2,580,019 | $2,558,339 | $2,530,119 | $2,536,324 | $1,818,228 | |||||
Commercial | 6,484,256 | 6,406,684 | 6,297,425 | 6,153,379 | 4,481,375 | |||||
Land, development and construction loans | 934,461 | 1,004,578 | 1,061,701 | 1,057,532 | 658,373 | |||||
Total real estate loans | 9,998,736 | 9,969,601 | 9,889,245 | 9,747,235 | 6,957,976 | |||||
Commercial loans | 1,788,282 | 1,762,416 | 1,772,266 | 1,714,121 | 1,181,628 | |||||
Consumer and other loans | 235,259 | 247,407 | 250,225 | 247,049 | 206,754 | |||||
Total loans before unearned fees and costs | 12,022,277 | 11,979,424 | 11,911,736 | 11,708,405 | 8,346,358 | |||||
Unearned fees and costs | 4,954 | 4,519 | 4,670 | 4,356 | 3,037 | |||||
Total Loans | $12,027,231 | $11,983,943 | $11,916,406 | $11,712,761 | $8,349,395 | |||||
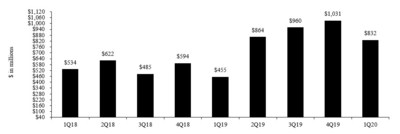
Loan production
DEPOSITS | ||||||||||
Ending Balance | ||||||||||
Deposit mix | Mar. 31, 2020 | Dec. 31, 2019 | Sep. 30, 2019 | Jun. 30, 2019 | Mar. 31, 2019 | |||||
Checking accounts | ||||||||||
Non-interest bearing | $4,164,091 | $3,929,183 | $4,081,078 | $3,990,883 | $3,152,251 | |||||
Interest bearing | 2,650,252 | 2,613,933 | 2,430,149 | 2,493,870 | 1,813,028 | |||||
Savings deposits | 894,332 | 811,150 | 780,052 | 725,124 | 703,949 | |||||
Money market accounts | 3,519,441 | 3,525,571 | 3,648,449 | 3,569,025 | 2,156,667 | |||||
Time deposits | 2,893,383 | 2,256,555 | 2,423,335 | 2,433,183 | 1,921,130 | |||||
Total deposits | $14,121,499 | $13,136,392 | $13,363,063 | $13,212,085 | $9,747,025 | |||||
Non time deposits as percentage of total deposits | 80% | 83% | 82% | 82% | 80% | |||||
Time deposits as percentage of total deposits | 20% | 17% | 18% | 18% | 20% | |||||
Total deposits | 100% | 100% | 100% | 100% | 100% | |||||
NET INTEREST MARGIN
The Company's NIM decreased 8 bps from 4.25% in the previous quarter to 4.17% during the current quarter, primarily as a result of reduced accretion (5 bps) and a decline in loan yields due to a reduction in the federal funds rate and in LIBOR rates. The first quarter 2020 loan accretion of $15,834 impacted NIM by 43 bps, as compared with the previous quarter's $18,093, which increased NIM by 48 bps. Interest earning assets yield excluding loan accretion in the current quarter decreased by 10 bps compared with the previous quarter, which was offset by a decrease of 7 bps in cost of deposits.
The table below summarizes yields and costs by various interest earning asset and interest bearing liability account types for the current quarter, the previous calendar quarter and the same quarter last year.
Three Months Ended | ||||||||||||||||||||
Mar. 31, 2020 | Dec. 31, 2019 | Mar. 31, 2019 | ||||||||||||||||||
Average | Interest | Average | Average | Interest | Average | Average | Interest | Average | ||||||||||||
Balance | Inc/Exp | Rate | Balance | Inc/Exp | Rate | Balance | Inc/Exp | Rate | ||||||||||||
Originated loans (1) | $6,196,409 | $72,890 | 4.73% | $5,819,393 | $71,101 | 4.85% | $4,243,258 | $50,907 | 4.87% | |||||||||||
Acquired loans (1) | 5,733,217 | 76,683 | 5.38% | 6,115,107 | 88,716 | 5.76% | 3,964,231 | 55,561 | 5.68% | |||||||||||
PCD loans | 153,738 | 11,544 | 30.20% | 138,584 | 8,224 | 23.54% | 155,584 | 10,140 | 26.43% | |||||||||||
Taxable securities | 1,895,781 | 12,534 | 2.66% | 1,803,467 | 11,664 | 2.57% | 1,707,002 | 12,286 | 2.92% | |||||||||||
Tax-exempt securities (1) | 220,310 | 1,980 | 3.61% | 221,438 | 1,948 | 3.49% | 220,244 | 1,940 | 3.57% | |||||||||||
Fed funds sold and other | 673,552 | 1,813 | 1.08% | 681,768 | 2,783 | 1.62% | 289,347 | 1,995 | 2.80% | |||||||||||
Total interest earning assets (1) | $14,873,007 | $177,444 | 4.80% | $14,779,757 | $184,436 | 4.95% | $10,579,666 | $132,829 | 5.09% | |||||||||||
Non-interest earnings assets | 2,554,559 | 2,531,319 | 1,747,886 | |||||||||||||||||
Total assets | $17,427,566 | $17,311,076 | $12,327,552 | |||||||||||||||||
Interest bearing deposits | $9,224,690 | $19,836 | 0.86% | $9,207,290 | $22,276 | 0.96% | $6,430,085 | $13,323 | 0.84% | |||||||||||
Fed funds purchased | 300,539 | 1,133 | 1.52% | 304,489 | 1,330 | 1.73% | 259,590 | 1,618 | 2.53% | |||||||||||
Other borrowings | 310,298 | 1,440 | 1.87% | 271,812 | 1,312 | 1.92% | 402,624 | 2,596 | 2.61% | |||||||||||
Corporate and subordinated debentures | 71,348 | 997 | 5.62% | 71,335 | 1,029 | 5.72% | 32,459 | 570 | 7.12% | |||||||||||
Total interest bearing liabilities | $9,906,875 | $23,406 | 0.95% | $9,854,926 | $25,947 | 1.04% | $7,124,758 | $18,107 | 1.03% | |||||||||||
Non-interest bearing deposits | 4,035,991 | 4,081,634 | 3,032,471 | |||||||||||||||||
All other liabilities | 602,056 | 494,914 | 169,912 | |||||||||||||||||
Total equity | 2,882,644 | 2,879,602 | 2,000,411 | |||||||||||||||||
Total liabilities and equity | $17,427,566 | $17,311,076 | $12,327,552 | |||||||||||||||||
Net Interest Spread (1) | 3.85% | 3.91% | 4.06% | |||||||||||||||||
Net Interest Margin (1) | 4.17% | 4.25% | 4.40% | |||||||||||||||||
Cost of Total Deposits | 0.60% | 0.67% | 0.57% | |||||||||||||||||
(1) | Tax equivalent yield (Non-GAAP); see reconciliation tables starting on page 9, Explanation of Certain Unaudited Non-GAAP Financial Measures. |
Note: Certain prior period amounts have been reclassified to conform to the current period presentation format. |
The table below summarizes accretion income for the periods presented.
Three Months Ended | |||||||||
Mar. 31, 2020 | Dec. 31, 2019 | Sep. 30, 2019 | Jun. 30, 2019 | Mar. 31, 2019 | |||||
PCD accretion | $9,157 | $5,908 | $5,418 | $5,248 | $7,904 | ||||
Non-PCD accretion | 6,677 | 12,185 | 8,151 | 10,335 | 4,951 | ||||
Total loan accretion | $15,834 | $18,093 | $13,569 | $15,583 | $12,855 | ||||
The table below compares the unpaid principal balance and the carrying balance (book balance) of the Company's total Acquired and PCD loans at March 31, 2020.
Principal | Carrying | Total Loan | ||||||
Balance | Balance | Discount(1) | Percentage | |||||
Acquired loans | $5,589,475 | $5,544,995 | ($44,480) | 0.8% | ||||
PCD loans | 187,020 | 150,322 | (36,698) | 19.6% | ||||
Total purchased loans | $5,776,495 | $5,695,317 | ($81,178) | 1.4% |
(1) Represents a non-credit discount. |
NON-INTEREST INCOME
Non-interest income increased $5,461 to $55,790 during the current quarter compared to $50,329 in the previous quarter. The increase is mainly attributable to higher interest rate swap and fixed income revenue in the correspondent banking division and mortgage banking revenue. The table below summarizes the Company's non-interest income for the periods indicated.
Condensed Consolidated Non-Interest Income (unaudited) | ||||||||||
Three Months Ended | ||||||||||
Mar. 31, 2020 | Dec. 31, 2019 | Sep. 30, 2019 | Jun. 30, 2019 | Mar. 31, 2019 | ||||||
Correspondent banking revenue | $27,808 | $23,346 | $21,018 | $11,534 | $9,000 | |||||
Mortgage banking revenue | 10,973 | 9,113 | 9,444 | 6,803 | 4,193 | |||||
SBA revenue | 1,403 | 1,785 | 1,411 | 1,252 | 688 | |||||
Wealth management related revenue | 831 | 878 | 801 | 875 | 607 | |||||
Service charges on deposit accounts | 7,522 | 7,993 | 7,990 | 7,507 | 6,678 | |||||
Debit, prepaid, ATM and merchant card related fees | 3,667 | 3,082 | 3,923 | 6,376 | 5,018 | |||||
Other non-interest income | 3,586 | 4,119 | 3,901 | 3,601 | 3,099 | |||||
Subtotal | $55,790 | $50,316 | $48,488 | $37,948 | $29,283 | |||||
Gain (loss) on sale of securities available for sale | — | 13 | — | (5) | 17 | |||||
Total Non-Interest Income | $55,790 | $50,329 | $48,488 | $37,943 | $29,300 | |||||
Note: Certain prior period amounts have been reclassified to conform to the current period presentation format. |
NON-INTEREST EXPENSES
Excluding merger-related expenses, non-interest expense increased $6,471 in the first quarter to $119,721 compared to the previous quarter. The increase was primarily driven by a $4,104 increase in salary, wage and benefit expenses which were largely due to increases of approximately $3.0 million and $1.2 million in health insurance and payroll taxes, respectively. Bank regulatory related expenses increased by $1,084. The Company also recorded $1,027 in credit loss expense for unfunded commitments during the current quarter as a result of increase in potential credit losses resulting from the COVID-19 pandemic. The table below summarizes the Company's non-interest expense for the periods indicated.
Condensed Consolidated Non-Interest Expense (unaudited) | ||||||||||
Three Months Ended | ||||||||||
Mar. 31, 2020 | Dec. 31, 2019 | Sep. 30, 2019 | Jun. 30, 2019 | Mar. 31, 2019 | ||||||
Salaries, wages and employee benefits | $77,077 | $72,973 | $71,352 | $67,516 | $48,393 | |||||
Occupancy expense | 7,346 | 7,267 | 7,729 | 7,752 | 5,602 | |||||
Depreciation of premises and equipment | 4,045 | 4,151 | 3,887 | 3,550 | 2,850 | |||||
Marketing expenses | 2,158 | 1,958 | 1,765 | 1,797 | 2,020 | |||||
Data processing expenses | 5,617 | 5,242 | 5,182 | 5,525 | 3,656 | |||||
Legal, auditing and other professional fees | 2,682 | 2,958 | 2,364 | 2,106 | 1,442 | |||||
Bank regulatory related expenses | 1,807 | 723 | 635 | 2,074 | 1,616 | |||||
Debit, ATM and merchant card related expenses | 1,598 | 1,362 | 1,382 | 1,304 | 1,453 | |||||
Credit related expenses | 944 | 879 | 795 | 760 | 729 | |||||
Amortization of intangibles | 4,535 | 4,552 | 4,229 | 4,435 | 2,814 | |||||
Impairment on bank property held for sale | 31 | 808 | 506 | 315 | 107 | |||||
Credit loss expense for unfunded commitments | 1,027 | — | — | — | — | |||||
Other expenses | 10,854 | 10,377 | 10,216 | 9,116 | 7,426 | |||||
Subtotal | $119,721 | $113,250 | $110,042 | $106,250 | $78,108 | |||||
Merger-related expenses | 3,051 | 159 | 16,994 | 15,739 | 6,365 | |||||
Total Non-Interest Expense | $122,772 | $113,409 | $127,036 | $121,989 | $84,473 | |||||
Note: Certain prior period amounts have been reclassified to conform to the current period presentation format. |
CREDIT QUALITY AND ALLOWANCE FOR CREDIT LOSSES
Non-performing assets ("NPAs") totaled $89,762 at March 31, 2020, compared to $43,870 at December 31, 2019. NPAs as a percentage of total assets increased to 0.48% at March 31, 2020, compared to 0.26% at December 31, 2019 and 0.33% at March 31, 2019. With the adoption of ASC 326 and the new accounting treatment for PCD loans, the Company began to include non-accrual PCD loans in its non-performing assets and related credit metrics starting with the current quarter. Previous periods do not include PCD loans as these loans were not considered non-performing under ASC 310-30.
The table below summarizes selected credit quality data for the periods indicated.
Ending Balance | ||||||||||
Non-Performing Assets (1) | Mar. 31, 2020 | Dec. 31, 2019 | Sep. 30, 2019 | Jun. 30, 2019 | Mar. 31, 2019 | |||||
Non-accrual loans, non-PCD loans | $45,305 | $36,916 | $39,048 | $26,334 | $35,181 | |||||
Non-accrual loans, PCD loans | 33,893 | — | — | — | — | |||||
Past due loans 90 days or more and still accruing interest | 535 | 1,692 | 473 | — | — | |||||
Total non-performing loans ("NPLs") | 79,733 | 38,608 | 39,521 | 26,334 | 35,181 | |||||
Other real estate owned ("OREO") | 9,942 | 5,092 | 6,558 | 5,881 | 5,981 | |||||
Repossessed assets other than real estate | 87 | 170 | 258 | 236 | 313 | |||||
Total non-performing assets | $89,762 | $43,870 | $46,337 | $32,451 | $41,475 | |||||
Three Months Ended | ||||||||||
Mar. 31, 2020 | Dec. 31, 2019 | Sep. 30, 2019 | Jun. 30, 2019 | Mar. 31, 2019 | ||||||
Asset Quality Ratios (1) | ||||||||||
Non-performing loans as percentage of total loans | 0.66% | 0.33% | 0.34% | 0.23% | 0.43% | |||||
Non-performing assets as percentage of total assets | 0.48% | 0.26% | 0.27% | 0.19% | 0.33% | |||||
Non-performing assets as percentage of loans and OREO plus other repossessed assets | 0.75% | 0.37% | 0.39% | 0.28% | 0.51% | |||||
Loans past due 30 thru 89 days and accruing interest as a percentage of total loans | 0.53% | 0.48% | 0.52% | 0.44% | 0.42% | |||||
Allowance for credit losses as percentage of NPLs | 199% | 105% | 106% | 154% | 113% | |||||
Net charge-offs | $1,444 | $4,384 | $2,354 | $2,191 | $771 | |||||
Net charge-offs as a percentage of average loans for the period on an annualized basis | 0.05% | 0.15% | 0.08% | 0.08% | 0.04% | |||||
(1) | The three months ended December 31, September 30, June 30, and March 31, 2019 exclude PCD (formally PCI) loans. |
The ACL totaled $158,733 at March 31, 2020, compared to $40,655 at December 31, 2019, an increase of $118,078 due to the effect of CECL adoption of $74,608, provision for credit losses of $44,914 and net charge-offs of $1,444. The changes in the Company's ACL components between March 31, 2020 and December 31, 2019 are summarized in the table below (unaudited).
Three Months Ended | ||||
Allowance for credit losses (unaudited) | Mar. 31, 2020 | Dec. 31, 2019 | ||
Loans, excluding PCD loans | ||||
Allowance at beginning of period | $40,429 | $41,758 | ||
Effect of adopting ASC 326 (CECL) | 57,604 | — | ||
Charge-offs | (2,350) | (5,324) | ||
Recoveries | 1,201 | 940 | ||
Net charge-offs | (1,149) | (4,384) | ||
Provision for credit losses | 43,919 | 3,055 | ||
Allowance at end of period for loans other than PCD loans | $140,803 | $40,429 | ||
PCD loans | ||||
Allowance at beginning of period | $226 | $233 | ||
Effect of adopting ASC 326 (CECL) | 17,004 | — | ||
Charge-offs | (1,257) | — | ||
Recoveries | 962 | — | ||
Net charge-offs | (295) | — | ||
Provision (recovery) for credit losses | 995 | (7) | ||
Allowance at end of period for | ||||
PCD loans | $17,930 | $226 | ||
Total allowance at end of period | $158,733 | $40,655 | ||
EXPLANATION OF CERTAIN UNAUDITED NON-GAAP FINANCIAL MEASURES
This press release contains financial information determined by methods other than U.S. Generally Accepted Accounting Principles ("GAAP"), including adjusted net income, adjusted pre-tax pre-provision income, adjusted net income per share diluted, adjusted return on average assets, adjusted return on average equity, return on average tangible equity, adjusted return on average tangible equity, adjusted efficiency ratio, adjusted non-interest income, adjusted non-interest expense, adjusted net-interest income, tangible common equity, tangible common equity to tangible assets, common tangible equity per common share, tax equivalent yields on loans, securities and earning assets, and tax equivalent net interest spread and margin, which we refer to "Non-GAAP financial measures." The tables below provide reconciliations between these Non-GAAP measures and net income, interest income, net interest income and tax equivalent basis interest income and net interest income, return on average assets, return on average equity, the efficiency ratio, total stockholders' equity and tangible common equity, as applicable.
Management uses these Non-GAAP financial measures in its analysis of the Company's performance and believes these presentations provide useful supplemental information, and enhance investors' understanding of the Company's core business and performance without the impact of merger-related expenses and provision for credit losses. Management believes it is appropriate to exclude merger-related expenses because those costs are specific to each acquisition, vary based upon the size, complexity and other specifics of each acquisition, and are not indicative of the costs to operate the Company's core business. In addition, management excludes provision for credit losses from pre-tax income to present the periods on a more comparable basis without the effect of the higher provision for credit losses resulting from the adoption of CECL and COVID-19 pandemic.
Non-GAAP measures are also useful in understanding performance trends and facilitate comparisons with the performance of other financial institutions. The limitations associated with operating measures are the risk that persons might disagree as to the appropriateness of items comprising these measures and that different companies might calculate these measures differently. The Company provides reconciliations between GAAP and these Non-GAAP measures. These disclosures should not be considered an alternative to GAAP.
Reconciliation of GAAP to non-GAAP Measures (unaudited): | ||||||||||
Three months ended | ||||||||||
Mar. 31, 2020 | Dec. 31, 2019 | Sep. 30, 2019 | Jun. 30, 2019 | Mar. 31, 2019 | ||||||
Adjusted net income (Non-GAAP) | ||||||||||
Net income (GAAP) | $35,432 | $71,132 | $55,098 | $54,523 | $44,643 | |||||
(Gain) loss on sale of securities available for sale, net of tax | — | (10) | — | 4 | (13) | |||||
Merger-related expenses, net of tax | 2,332 | 122 | 12,939 | 11,962 | 4,833 | |||||
Deferred tax asset write down | — | 987 | — | — | — | |||||
Tax benefit adjustments(1) | (2,273) | — | — | — | — | |||||
Adjusted net income (Non-GAAP) | $35,491 | $72,231 | $68,037 | $66,489 | $49,463 | |||||
Adjusted pre-tax pre-provision income (Non-GAAP) | ||||||||||
Net income (GAAP) | $35,432 | $71,132 | $55,098 | $54,523 | $44,643 | |||||
Income tax provision | 6,025 | 20,665 | 17,006 | 16,721 | 13,306 | |||||
Provision for credit losses | 44,914 | 3,048 | 3,692 | 2,792 | 1,053 | |||||
Credit loss for unfunded commitments | 1,027 | — | — | — | — | |||||
Gross gain (loss) on sale of securities available for sale | — | 13 | — | (5) | 17 | |||||
Gross merger-related expenses | 3,051 | 159 | 16,994 | 15,739 | 6,365 | |||||
Adjusted pre-tax pre-provision income (Non-GAAP) | $90,449 | $95,017 | $92,790 | $89,770 | $65,384 | |||||
Adjusted net income per share - Diluted | ||||||||||
Earnings per share - Diluted (GAAP) | $0.28 | $0.56 | $0.43 | $0.42 | $0.46 | |||||
Effect to adjust for merger-related expenses, net of tax | 0.02 | — | 0.10 | 0.09 | 0.05 | |||||
Effect to adjust for deferred tax asset write down | — | 0.01 | — | — | — | |||||
Effect to adjust for tax benefit adjustments(1) | (0.02) | — | — | — | — | |||||
Adjusted net income per share - Diluted (Non-GAAP) | $0.28 | $0.57 | $0.53 | $0.51 | $0.51 | |||||
Adjusted return on average assets (Non-GAAP) | ||||||||||
Return on average assets (GAAP) | 0.82% | 1.63% | 1.27% | 1.30% | 1.47% | |||||
Effect to adjust for merger-related expenses, net of tax | 0.05% | — | 0.30% | 0.29% | 0.16% | |||||
Effect to adjust for deferred tax asset write down | — | 0.03% | — | — | — | |||||
Effect to adjust for tax benefit adjustments(1) | (0.05)% | — | — | — | — | |||||
Adjusted return on average assets (Non-GAAP) | 0.82% | 1.66% | 1.57% | 1.59% | 1.63% | |||||
(1) | Tax benefit adjustment on net operating loss carryback available under the CARES Act. |
Explanation of Certain Unaudited Non-GAAP Financial Measures (continued) | ||||||||||
Three months ended | ||||||||||
Mar. 31, 2020 | Dec. 31, 2019 | Sep. 30, 2019 | Jun. 30, 2019 | Mar. 31, 2019 | ||||||
Adjusted return on average equity (Non-GAAP) | ||||||||||
Return on average equity (GAAP) | 4.94% | 9.80% | 7.56% | 7.63% | 9.05% | |||||
Effect to adjust for merger and acquisition related expenses, net of tax | 0.33% | 0.02% | 1.78% | 1.68% | 0.98% | |||||
Effect to adjust for deferred tax asset write down | — | 0.13% | — | — | — | |||||
Effect to adjust for tax benefit adjustments(1) | (0.32)% | — | — | — | — | |||||
Adjusted return on average equity (Non-GAAP) | 4.95% | 9.95% | 9.34% | 9.31% | 10.03% | |||||
Return on average tangible equity (non-GAAP) | ||||||||||
Net income (GAAP) | $35,432 | $71,132 | $55,098 | $54,523 | $44,643 | |||||
Amortization of intangibles, net of tax | 3,466 | 3,491 | 3,220 | 3,371 | 2,136 | |||||
Adjusted net income for average tangible equity (Non-GAAP) | $38,898 | $74,623 | $58,318 | $57,894 | $46,779 | |||||
Average stockholders' equity (GAAP) | $2,882,644 | $2,879,606 | $2,902,333 | $2,876,244 | $2,000,411 | |||||
Average noncontrolling interest | — | — | (11,723) | (11,844) | — | |||||
Average goodwill | (1,204,417) | (1,204,417) | (1,204,417) | (1,203,052) | (802,880) | |||||
Average core deposit intangible | (89,175) | (93,355) | (97,483) | (103,369) | (65,116) | |||||
Average other intangibles | (4,275) | (4,644) | (4,682) | (4,602) | (2,934) | |||||
Average tangible equity (Non-GAAP) | $1,584,777 | $1,577,190 | $1,584,028 | $1,553,377 | $1,129,481 | |||||
Return on average tangible equity (annualized) (Non-GAAP) | 9.87% | 18.77% | 14.61% | 14.95% | 16.80% | |||||
Adjusted return on average tangible equity (non-GAAP) | ||||||||||
Return on average tangible equity (Non-GAAP) | 9.87% | 18.77% | 14.61% | 14.95% | 16.80% | |||||
Effect to adjust for merger-related expenses, net of tax | 0.59% | 0.03% | 3.24% | 3.09% | 1.74% | |||||
Effect to adjust for deferred tax asset write down | — | 0.25% | — | — | — | |||||
Effect to adjust for tax benefit adjustments(1) | (0.58)% | — | — | — | — | |||||
Adjusted return on average tangible equity (Non-GAAP) | 9.88% | 19.05% | 17.85% | 18.04% | 18.54% | |||||
Efficiency ratio (tax equivalent) (Non-GAAP) | ||||||||||
Non-interest income (GAAP) | $55,790 | $50,329 | $48,488 | $37,943 | $29,300 | |||||
Net interest income before provision (GAAP) | $153,353 | $157,925 | $154,947 | $158,681 | $114,175 | |||||
Total tax equivalent adjustment | 685 | 564 | 491 | 495 | 547 | |||||
Adjusted net interest income (Non-GAAP) | $154,038 | $158,489 | $155,438 | $159,176 | $114,722 | |||||
Non-interest expense (GAAP) | $122,772 | $113,409 | $127,036 | $121,989 | $84,473 | |||||
Amortization of intangibles | (4,535) | (4,552) | (4,229) | (4,435) | (2,814) | |||||
Merger and acquisition related expenses | (3,051) | (159) | (16,994) | (15,739) | (6,365) | |||||
Adjusted non-interest expense (Non-GAAP) | $115,186 | $108,698 | $105,813 | $101,815 | $75,294 | |||||
Efficiency ratio (tax equivalent) (Non-GAAP) | 58.5% | 54.3% | 62.3% | 61.9% | 58.7% | |||||
Adjusted efficiency ratio, tax equivalent (Non-GAAP) | 54.9% | 52.1% | 51.9% | 51.7% | 52.3% | |||||
(1) | Tax benefit adjustment on net operating loss carryback available under the CARES Act. |
Explanation of Certain Unaudited Non-GAAP Financial Measures (continued) | ||||||||||
Ending Balance | ||||||||||
Mar. 31, 2020 | Dec. 31, 2019 | Sep. 30, 2019 | Jun. 30, 2019 | Mar. 31, 2019 | ||||||
Tangible common equity (Non-GAAP) | ||||||||||
Total common stockholders' equity (GAAP) | $2,870,252 | $2,896,718 | $2,857,702 | $2,878,377 | $2,027,552 | |||||
Goodwill | (1,204,417) | (1,204,417) | (1,204,417) | (1,204,417) | (802,880) | |||||
Core deposit intangible | (87,295) | (91,157) | (95,175) | (99,200) | (63,511) | |||||
Other intangibles | (4,131) | (4,507) | (4,700) | (4,620) | (2,996) | |||||
Common tangible equity (Non-GAAP) | $1,574,409 | $1,596,637 | $1,553,410 | $1,570,140 | $1,158,165 | |||||
Total assets (GAAP) | $18,596,292 | $17,142,025 | $17,420,376 | $17,036,597 | $12,587,637 | |||||
Goodwill | (1,204,417) | (1,204,417) | (1,204,417) | (1,204,417) | (802,880) | |||||
Core deposit intangible | (87,295) | (91,157) | (95,175) | (99,200) | (63,511) | |||||
Other intangibles | (4,131) | (4,507) | (4,700) | (4,620) | (2,996) | |||||
Total tangible assets (Non-GAAP) | $17,300,449 | $15,841,944 | $16,116,084 | $15,728,360 | $11,718,250 | |||||
Common tangible equity to tangible assets (Non-GAAP) | 9.1% | 10.1% | 9.6% | 10.0% | 9.9% | |||||
Common tangible equity per common share (Non-GAAP) | $12.68 | $12.76 | $12.32 | $12.17 | $12.08 | |||||
Three months ended | ||||||||||
Mar. 31, 2020 | Dec. 31, 2019 | Mar. 31, 2019 | ||||||||
Tax equivalent yields (Non-GAAP) | ||||||||||
Originated loans | $72,489 | $70,784 | $50,621 | |||||||
Acquired loans | 76,642 | 88,677 | 55,524 | |||||||
PCD loans | 11,544 | 8,224 | 10,140 | |||||||
Taxable securities | 12,534 | 11,665 | 12,286 | |||||||
Tax-exempt securities | 1,737 | 1,739 | 1,716 | |||||||
Fed funds sold and other | 1,813 | 2,783 | 1,995 | |||||||
Interest income (GAAP) | $176,759 | $183,872 | $132,282 | |||||||
Tax equivalent adjustment for originated loans | 401 | 316 | 286 | |||||||
Tax equivalent adjustment for acquired loans | 41 | 39 | 37 | |||||||
Tax equivalent adjustment for tax-exempt securities | 243 | 209 | 224 | |||||||
Tax equivalent adjustments | 685 | 564 | 547 | |||||||
Interest income (tax equivalent) (Non-GAAP) | $177,444 | $184,436 | $132,829 | |||||||
Net interest income (GAAP) | $153,353 | $157,925 | $114,175 | |||||||
Tax equivalent adjustments | 685 | 564 | 547 | |||||||
Net interest income (tax equivalent) (Non-GAAP) | $154,038 | $158,489 | $114,722 | |||||||
Yield on originated loans | 4.71% | 4.83% | 4.84% | |||||||
Effect from tax equivalent adjustment | 0.02% | 0.02% | 0.03% | |||||||
Yield on originated loans - tax equivalent (Non-GAAP) | 4.73% | 4.85% | 4.87% | |||||||
Yield on acquired loans | 5.38% | 5.75% | 5.68% | |||||||
Effect from tax equivalent adjustment | — | — | — | |||||||
Yield on acquired loans - tax equivalent (Non-GAAP) | 5.38% | 5.76% | 5.68% | |||||||
Yield on tax exempted securities | 3.17% | 3.12% | 3.16% | |||||||
Effect from tax equivalent adjustment | 0.44% | 0.37% | 0.41% | |||||||
Yield on tax exempted securities - tax equivalent (Non-GAAP) | 3.61% | 3.49% | 3.57% | |||||||
Yield on interest earning assets (GAAP) | 4.78% | 4.94% | 5.07% | |||||||
Effect from tax equivalent adjustments | 0.02% | 0.01% | 0.02% | |||||||
Yield on interest earning assets - tax equivalent (Non-GAAP) | 4.80% | 4.95% | 5.09% | |||||||
Net interest spread (GAAP) | 3.83% | 3.90% | 4.04% | |||||||
Effect for tax equivalent adjustments | 0.02% | 0.01% | 0.02% | |||||||
Net interest spread (Non-GAAP) | 3.85% | 3.91% | 4.06% | |||||||
Net interest margin (GAAP) | 4.15% | 4.24% | 4.38% | |||||||
Effect from tax equivalent adjustments | 0.02% | 0.01% | 0.02% | |||||||
Net interest margin - tax equivalent (Non-GAAP) | 4.17% | 4.25% | 4.40% | |||||||
Net interest margin - tax equivalent (Non-GAAP) | 4.17% | 4.25% | 4.40% | |||||||
Effect of loan accretion | (0.43%) | (0.48%) | (0.50%) | |||||||
Net interest margin excluding loan accretion (Non-GAAP) | 3.74% | 3.77% | 3.90% | |||||||
Explanation of Certain Unaudited Non-GAAP Financial Measures (continued) | ||
Adjusted Common Tangible Equity per Common Share (Non-GAAP) post CECL Adoption | ||
Total common stockholders' equity (GAAP) at Dec. 31, 2019 | 2,896,718 | |
Goodwill | (1,204,417) | |
Core deposit intangible | (91,157) | |
Other intangibles | (4,507) | |
Common tangible equity (Non-GAAP) at Dec. 31, 2019 | 1,596,637 | |
CECL impact | (47,751) | |
Adjusted Common tangible equity (Non-GAAP) at Jan. 1, 2020 | 1,548,886 | |
Total assets (GAAP) at Dec. 31, 2019 | 17,142,025 | |
Goodwill | (1,204,417) | |
Core deposit intangible | (91,157) | |
Other intangibles | (4,507) | |
Total tangible assets (Non-GAAP) at Dec. 31, 2019 | 15,841,944 | |
Increase in ACL (excluding PCD loans) | (57,614) | |
Increase in deferred tax asset | 15,947 | |
Adjusted Total tangible assets (Non-GAAP) at Jan. 1, 2020 | 15,800,277 | |
TCE ratio post CECL implementation | 9.80% | |
Actual TCE ratio at Dec. 31, 2019 | 10.08% | |
Net change | (0.28)% | |
About CenterState Bank Corporation
CenterState operates as one of the leading Southeastern regional bank franchises headquartered in the state of Florida. Both CenterState and its nationally chartered bank subsidiary, CenterState Bank, N.A. (the "Bank"), are based in Winter Haven, Florida, between Orlando and Tampa. With over $18 billion in assets, the Bank provides traditional retail, commercial, mortgage, wealth management and SBA services throughout its Florida, Georgia and Alabama branch network and customer relationships in neighboring states. The Bank also has a national footprint, serving clients coast to coast through its correspondent banking division.
For additional information contact John C. Corbett (CEO), Stephen D. Young (COO) or William E. Matthews (CFO) at 863-293-4710.
Forward Looking Statements
Information in this Press Release, other than statements of historical facts, may constitute forward-looking statements, within the meaning of the Private Securities Litigation Reform Act of 1995. These statements include, but are not limited to, statements about the benefits of the proposed merger of South State and CenterState, including future financial and operating results (including the anticipated impact of the transaction on South State's and CenterState's respective earnings and tangible book value), statements related to the expected timing of the completion of the merger, the combined company's plans, objectives, expectations and intentions, and other statements that are not historical facts. Forward-looking statements may be identified by terminology such as "may," "will," "should," "scheduled," "plans," "intends," "anticipates," "expects," "believes," "estimates," "potential," or "continue" or negatives of such terms or other comparable terminology.
All forward-looking statements are subject to risks, uncertainties and other factors that may cause the actual results, performance or achievements of South State or CenterState to differ materially from any results expressed or implied by such forward-looking statements. Such factors include, among others, (1) the risk that the cost savings and any revenue synergies from the merger may not be fully realized or may take longer than anticipated to be realized, (2) disruption to the parties' businesses as a result of the announcement and pendency of the merger, (3) the occurrence of any event, change or other circumstances that could give rise to the termination of the merger agreement, (4) the risk that the integration of each party's operations will be materially delayed or will be more costly or difficult than expected or that the parties are otherwise unable to successfully integrate each party's businesses into the other's businesses, (5) the failure to obtain the necessary approvals by the shareholders of South State or CenterState, (6) the amount of the costs, fees, expenses and charges related to the merger, (7) the ability by each of South State and CenterState to obtain required governmental approvals of the merger (and the risk that such approvals may result in the imposition of conditions that could adversely affect the combined company or the expected benefits of the transaction), (8) reputational risk and the reaction of each company's customers, suppliers, employees or other business partners to the merger, (9) the failure of the closing conditions in the merger agreement to be satisfied, or any unexpected delay in closing the merger, (10) the possibility that the merger may be more expensive to complete than anticipated, including as a result of unexpected factors or events, (11) the dilution caused by South State's issuance of additional shares of its common stock in the merger, (12) a material adverse change in the financial condition of South State or CenterState, (13) general competitive, economic, political and market conditions, (14) major catastrophes such as earthquakes, floods or other natural or human disasters, including infectious disease outbreaks, including the recent outbreak of a novel strain of coronavirus, a respiratory illness, the related disruption to local, regional and global economic activity and financial markets, and the impact that any of the foregoing may have on South State or CenterState and its customers and other constituencies, and (15) other factors that may affect future results of CenterState and South State including changes in asset quality and credit risk; the inability to sustain revenue and earnings growth; changes in interest rates and capital markets; inflation; customer borrowing, repayment, investment and deposit practices; the impact, extent and timing of technological changes; capital management activities; and other actions of the Federal Reserve Board and legislative and regulatory actions and reforms. Additional factors which could affect future results of CenterState and South State can be found in the registration statement on Form S-4, as amended, as well as South State's Annual Report on Form 10-K, as amended, Quarterly Reports on Form 10-Q, and Current Reports on Form 8-K, and CenterState's Annual Report on Form 10-K, Quarterly Reports on Form 10-Q, and Current Reports on Form 8-K, in each case filed with the SEC and available on the SEC's website at http://www.sec.gov. CenterState and South State disclaim any obligation and do not intend to update or revise any forward-looking statements contained in this communication, which speak only as of the date hereof, whether as a result of new information, future events or otherwise, except as required by federal securities laws.
Important Information About the Merger and Where to Find It
South State has filed a registration statement on Form S-4 and an amendment thereto with the SEC to register the shares of South State's common stock that will be issued to CenterState's shareholders in connection with the transaction. The registration statement contains a joint proxy statement of South State and CenterState that also constitutes a prospectus of South State. The registration statement on Form S-4, as amended, was declared effective by the SEC on April 20, 2020, and South State and CenterState commenced mailing the definitive joint proxy statement/prospectus to their respective shareholders on or about April 20, 2020. INVESTORS AND SECURITY HOLDERS ARE URGED TO READ THE REGISTRATION STATEMENT AND DEFINITIVE JOINT PROXY STATEMENT/PROSPECTUS (AS WELL ANY OTHER DOCUMENTS FILED WITH THE SEC IN CONNECTION WITH THE TRANSACTION OR INCORPORATED BY REFERENCE INTO THE DEFINITIVE JOINT PROXY STATEMENT/PROSPECTUS) BECAUSE SUCH DOCUMENTS CONTAIN IMPORTANT INFORMATION REGARDING THE PROPOSED MERGER AND RELATED MATTERS. Investors and security holders may obtain free copies of these documents and other documents filed with the SEC by South State or CenterState through the website maintained by the SEC at http://www.sec.gov or by contacting the investor relations department of South State or CenterState at:
South State Corporation | CenterState Bank Corporation |
520 Gervais Street | 1101 First Street South, Suite 202 |
Columbia, SC 29201-3046 | Winter Haven, FL 33880 |
Attention: Investor Relations | Attention: Investor Relations |
(800) 277-2175 | (863) 293-4710 |
Participants in Solicitation
South State, CenterState and certain of their directors and executive officers may be deemed participants in the solicitation of proxies from the shareholders of each of South State and CenterState in connection with the merger. Information regarding the directors and executive officers of South State and CenterState and other persons who may be deemed participants in the solicitation of the shareholders of South State or of CenterState in connection with the merger is contained in the definitive joint proxy statement/prospectus related to the proposed merger. Information about the directors and executive officers of South State and their ownership of South State common stock can also be found in South State's definitive proxy statement in connection with its 2019 annual meeting of shareholders, as filed with the SEC on March 6, 2019, and other documents subsequently filed by South State with the SEC, including, but not limited to, Amendment No. 1 to South State's Annual Report on Form 10-K/A, as filed with the SEC on March 6, 2020. Information about the directors and executive officers of CenterState and their ownership of CenterState common stock can also be found in CenterState's definitive proxy statement in connection with its 2020 annual meeting of shareholders, as filed with the SEC on March 10, 2020, and other documents subsequently filed by CenterState with the SEC. Additional information regarding the interests of such participants is included in the definitive joint proxy statement/prospectus and other relevant documents regarding the merger filed with the SEC.

 View original content to download multimedia:http://www.prnewswire.com/news-releases/centerstate-bank-corporation-announces-first-quarter-2020-results-301046509.html
SOURCE CenterState Bank Corporation
Serious News for Serious Traders! Try StreetInsider.com Premium Free!
You May Also Be Interested In
- CoStar Group acquires Zonda for $800M, adding new home data
- reAlpha completes $8.5M InstaMortgage acquisition
- Werewolf Therapeutics to merge with Ambros in $150M private placement
Create E-mail Alert Related Categories
PRNewswire, Press ReleasesRelated Entities
Dividend, Earnings, Definitive AgreementSign up for StreetInsider Free!
Receive full access to all new and archived articles, unlimited portfolio tracking, e-mail alerts, custom newswires and RSS feeds - and more!
