



California home sales reach three-year high in November, C.A.R. reports
 Tweet
Tweet Share
Share E-mail
- Existing, single-family home sales totaled 287,940 in November on a seasonally adjusted annualized rate, up 1.9 percent from 282,590 in October and up 2.6 percent from 280,530 in
November 2024 . - November's statewide median home price was
$852,680 , down 3.9 percent from$886,960 in October and essential flat from$852,880 inNovember 2024 . - Year-to-date statewide home sales were up 0.9 percent.
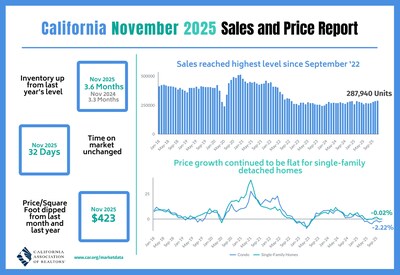
Infographic: https://www.car.org/Global/Infographics/2025-11-Sales-and-Price
Closed escrow sales of existing, single-family detached homes in
Sales increased 1.9 percent from October, rising from 282,590 to 287,940 in November. Compared with a year earlier, November sales were up 2.6 percent from a revised 280,530. Cumulatively, total home sales through the first 11 months of 2025 also remained above last year's level. Nevertheless, November marked the 38th consecutive month in which statewide sales remained below the 300,000-unit benchmark.
Statewide pending home sales in November declined 4.6 percent year over year — marking the first annual drop in four months. Compared to October, pending sales fell sharply by 18 percent, reflecting both typical seasonal factors and heightened mortgage rate volatility amid growing economic concerns. At the county level, pending sales improved from last year in 25 of the 53 counties tracked by C.A.R., with more than half of those counties recording double-digit increases.
"
As market conditions cooled during the off-peak market season, the statewide median home price fell 3.9 percent from
"Mortgage rates are expected to continue declining in 2026, but the decrease is unlikely to be dramatic," said C.A.
Other key points from C.A.R.'s
- At the regional level, only one of the state's major regions recorded a year-over-year increase on non-seasonally adjusted home sales. The Far North stood out with a 2.0 percent gain from a year earlier, while the
San Francisco Bay Area (-3.5 percent),Central Valley (-3.1 percent),Southern California (-3.1 percent), and Central Coast (-2.4 percent) all posted annual sales declines. - At the county level, 25 of the 53 counties tracked by C.A.R. posted year-over-year sales gains in November, with more than half of those counties (16) growing by double digits. Trinity led the gains with a 60.0 percent surge, followed by Imperial (46.7 percent) and
Mendocino (43.3 percent). Meanwhile, 26 counties experienced annual sales declines, including seven that fell by more than 10 percent — led byAmador (-44.9 percent),Madera (-42.6 percent) and Lake (-35.3 percent). - Three of
California's five major regions recorded year-over-year increases in their median home prices. The Far North posted a moderate gain of 2.7 percent fromNovember 2024 , followed bySouthern California with a 1.2 percent increase and the Central Coast region with a slight 0.2 percent uptick. In contrast, theSan Francisco Bay Area experienced the largest annual price decline (-3.2 percent), followed by theCentral Valley (-1.0 percent). - At the county level, 28 of the 53 counties tracked by C.A.R. recorded year-over-year gains in median home price in November.
Del Norte led with a 24.4 percent increase, followed byTehama (22.3 percent) andSiskiyou (16.9 percent). Conversely, 24 counties posted annual price declines, whileSanta Cruz's price was unchanged.Lassen experienced the steepest drop (-26.6 percent), followed bySan Benito (-11.3 percent) and Trinity (-10.3 percent). - Housing inventory in November rose from both the prior month and prior year, as market conditions slowed housing demand and lengthened the time listings stayed on the market. The Unsold Inventory Index was 3.6 months in November, up from 3.2 months in October and 3.3 months in
November 2024 . Total active listings increased from the same month of last year for the 22nd consecutive month, but the annual gain recorded last month was the smallest sinceFebruary 2024 . November marked the seventh straight month of decelerating inventory growth, suggesting that while supply remains elevated, momentum on the supply side is gradually easing as the market moves deeper into the holiday season. - The median number of days it took to sell a
California single-family home was 32 days in November, up from 26 days inNovember 2024 . - C.A.R.'s statewide sales-price-to-list-price ratio* was 98.3 percent in
November 2025 and 99.4 percent inNovember 2024 . - The statewide median price per square foot** for an existing single-family home was
$423 , down from$429 in November a year ago. - The 30-year, fixed-mortgage interest rate averaged 6.24 percent in November, down from 6.81 percent in
November 2024 , according to C.A.R.'s calculations based on Freddie Mac's weekly mortgage survey data.
Note: The County MLS median price and sales data in the tables are generated from a survey of more than 90 associations of REALTORS® throughout the state and represent statistics of existing single-family detached homes only. County sales data is not adjusted to account for seasonal factors that can influence home sales. Movements in sales prices should not be interpreted as changes in the cost of a standard home. The median price is where half sold for more and half sold for less; medians are more typical than average prices, which are skewed by a relatively small share of transactions at either the lower end or the upper end. Median prices can be influenced by changes in cost, as well as changes in the characteristics and the size of homes sold. The change in median prices should not be construed as actual price changes in specific homes.
*Sales-to-list-price ratio is an indicator that reflects the negotiation power of home buyers and home sellers under current market conditions. The ratio is calculated by dividing the final sales price of a property by its original list price and is expressed as a percentage. A sales-to-list ratio with 100 percent or above suggests that the property sold for more than the list price, and a ratio below 100 percent indicates that the price sold below the asking price.
**Price per square foot is a measure commonly used by real estate agents and brokers to determine how much a square foot of space a buyer will pay for a property. It is calculated as the sale price of the home divided by the number of finished square feet. C.A.R. currently tracks price-per-square foot statistics for 53 counties.
Leading the way…® in
| |||||||||
Median Sold Price of Existing Single-Family Homes | Sales | ||||||||
State/Region/County | Nov. 2025 | Oct. 2025 | Nov. 2024 | Price | Price | Sales | Sales | ||
Calif. Single-family home | -3.9 % | 0.0 % | 1.9 % | 2.6 % | |||||
Calif. Condo/Townhomes | 1.5 % | -2.2 % | -21.4 % | -2.0 % | |||||
-2.6 % | 0.1 % | -23.5 % | -2.7 % | ||||||
Central Coast | -3.3 % | 0.2 % | -18.6 % | -2.4 % | |||||
-1.8 % | -1.0 % | -20.3 % | -3.1 % | ||||||
Far North | 2.7 % | 2.7 % | -23.4 % | 2.0 % | |||||
Inland Empire | -2.4 % | -2.5 % | -18.9 % | 0.1 % | |||||
-1.9 % | -3.2 % | -21.9 % | -3.5 % | ||||||
-1.6 % | 1.2 % | -23.4 % | -3.1 % | ||||||
-6.5 % | -7.2 % | -21.0 % | -3.8 % | ||||||
3.4 % | -0.9 % | -20.4 % | 1.1 % | ||||||
Marin | -12.5 % | -9.5 % | -17.7 % | 11.2 % | |||||
3.6 % | 4.1 % | -5.4 % | 25.0 % | ||||||
-2.7 % | 12.6 % | -31.3 % | -9.7 % | ||||||
-8.7 % | -8.8 % | -20.0 % | 6.9 % | ||||||
-0.8 % | 0.2 % | -22.8 % | -16.5 % | ||||||
-2.8 % | -2.8 % | -21.9 % | -8.4 % | ||||||
-2.6 % | -0.5 % | -24.7 % | 5.7 % | ||||||
Imperial | 8.1 % | 11.6 % | 0.0 % | 46.7 % | |||||
-1.9 % | 0.6 % | -27.6 % | -5.4 % | ||||||
Orange | 0.6 % | 1.8 % | -21.9 % | -3.0 % | |||||
-0.8 % | 0.3 % | -20.3 % | -1.8 % | ||||||
1.1 % | -2.5 % | -13.3 % | 10.2 % | ||||||
0.5 % | 1.5 % | -23.6 % | -6.0 % | ||||||
0.8 % | 4.7 % | -24.6 % | 2.3 % | ||||||
Central Coast | |||||||||
-11.2 % | -3.1 % | -30.3 % | -3.9 % | ||||||
-1.6 % | -1.6 % | -13.4 % | -0.6 % | ||||||
12.9 % | 9.6 % | -11.0 % | 0.7 % | ||||||
2.5 % | 0.0 % | -19.7 % | -7.5 % | ||||||
-0.9 % | -0.9 % | -17.4 % | -7.0 % | ||||||
Glenn | 13.8 % | 3.1 % | -23.5 % | 30.0 % | |||||
Kern | 1.5 % | -2.5 % | -28.4 % | -12.3 % | |||||
Kings | 2.1 % | -0.7 % | 1.3 % | 38.6 % | |||||
-6.9 % | 3.0 % | -39.5 % | -42.6 % | ||||||
6.0 % | 6.0 % | -17.2 % | -7.2 % | ||||||
Placer | 0.9 % | 2.4 % | -25.1 % | -2.0 % | |||||
-2.7 % | -2.8 % | -16.6 % | -2.5 % | ||||||
-5.5 % | -11.3 % | -9.7 % | 0.0 % | ||||||
1.9 % | 1.9 % | -21.7 % | 3.5 % | ||||||
Stanislaus | -2.1 % | -1.0 % | -10.4 % | 7.9 % | |||||
-1.9 % | -3.1 % | -27.7 % | 7.1 % | ||||||
Far North | |||||||||
Butte | -2.1 % | -0.3 % | -22.5 % | -8.5 % | |||||
-26.4 % | -26.6 % | -10.5 % | 6.3 % | ||||||
0.0 % | 7.8 % | -29.3 % | 31.8 % | ||||||
Shasta | 5.4 % | 6.4 % | -29.9 % | -1.3 % | |||||
20.6 % | 16.9 % | 10.5 % | 20.0 % | ||||||
4.6 % | 22.3 % | -13.6 % | -5.0 % | ||||||
Trinity | 4.1 % | -10.3 % | -38.5 % | 60.0 % | |||||
Other Calif. Counties | |||||||||
13.4 % | 11.9 % | -41.3 % | -44.9 % | ||||||
7.4 % | 4.5 % | -30.9 % | 2.2 % | ||||||
10.4 % | 24.4 % | -10.5 % | 41.7 % | ||||||
1.5 % | 5.6 % | -30.5 % | -10.8 % | ||||||
0.8 % | -9.9 % | -25.2 % | 4.7 % | ||||||
Lake | -1.5 % | -4.3 % | -50.0 % | -35.3 % | |||||
-13.1 % | -1.3 % | 7.1 % | 15.4 % | ||||||
-2.5 % | 1.5 % | -10.4 % | 43.3 % | ||||||
Mono | -19.0 % | 2.0 % | -27.3 % | 0.0 % | |||||
-2.3 % | -2.4 % | -17.8 % | -6.4 % | ||||||
-9.5 % | 1.1 % | -27.8 % | -23.5 % | ||||||
9.0 % | -3.1 % | -17.1 % | -7.9 % | ||||||
4.0 % | 13.4 % | 0.0 % | 4.2 % | ||||||
-1.1 % | 4.7 % | 4.4 % | 34.0 % | ||||||
r = revised |
| ||||||||||
Unsold Inventory Index | Median Time on Market | |||||||||
State/Region/County | Nov-25 | Oct-25 | Nov-24 | Nov-25 | Oct-25 | Nov-24 | ||||
Calif. Single-family home | 3.6 | 3.2 | 3.3 | 32.0 | 32.0 | 26.0 | ||||
Calif. Condo/Townhomes | 4.4 | 3.9 | 3.6 | 39.0 | 38.0 | 30.0 | ||||
3.9 | 3.4 | 3.6 | 36.0 | 37.0 | 29.0 | |||||
Central Coast | 3.7 | 3.5 | 3.5 | 30.0 | 30.0 | 23.0 | ||||
3.7 | 3.3 | 3.2 | 31.0 | 32.0 | 25.0 | |||||
Far North | 5.2 | 4.5 | 5.0 | 45.0 | 34.0 | 31.5 | ||||
Inland Empire | 4.7 | 4.1 | 4.5 | 42.0 | 44.0 | 38.0 | ||||
2.2 | 2.2 | 2.0 | 25.0 | 22.0 | 20.0 | |||||
3.8 | 3.3 | 3.5 | 35.0 | 35.0 | 28.0 | |||||
1.8 | 2.0 | 1.8 | 14.0 | 14.0 | 14.0 | |||||
2.3 | 2.4 | 2.1 | 22.0 | 19.0 | 17.0 | |||||
Marin | 2.0 | 2.4 | 2.1 | 66.0 | 59.0 | 63.5 | ||||
6.0 | 7.0 | 6.2 | 96.0 | 88.5 | 67.0 | |||||
1.1 | 1.2 | 1.4 | 31.0 | 37.0 | 39.0 | |||||
1.5 | 1.7 | 1.5 | 13.0 | 12.0 | 11.5 | |||||
1.4 | 1.5 | 1.2 | 11.0 | 10.0 | 10.0 | |||||
3.6 | 3.3 | 3.0 | 57.0 | 59.0 | 43.0 | |||||
3.4 | 3.2 | 3.4 | 74.0 | 69.0 | 65.5 | |||||
Imperial | 3.8 | 4.0 | 3.8 | 10.0 | 22.0 | 16.5 | ||||
3.8 | 3.3 | 3.5 | 33.0 | 33.0 | 26.0 | |||||
Orange | 2.9 | 2.7 | 2.7 | 34.0 | 34.0 | 27.0 | ||||
4.6 | 3.9 | 4.5 | 42.0 | 43.0 | 38.0 | |||||
4.9 | 4.6 | 4.8 | 44.0 | 46.0 | 38.0 | |||||
3.2 | 2.9 | 2.9 | 28.0 | 25.0 | 20.0 | |||||
3.5 | 3.0 | 2.9 | 44.0 | 46.0 | 38.0 | |||||
Central Coast | ||||||||||
4.2 | 3.2 | 4.0 | 27.0 | 30.5 | 23.0 | |||||
3.7 | 3.8 | 3.8 | 38.0 | 35.0 | 37.5 | |||||
3.2 | 3.2 | 3.1 | 20.0 | 27.5 | 21.5 | |||||
3.8 | 3.7 | 3.3 | 38.0 | 23.5 | 20.0 | |||||
4.2 | 3.8 | 3.5 | 27.0 | 24.0 | 23.0 | |||||
Glenn | 3.6 | 3.5 | 5.0 | 74.0 | 18.0 | 10.5 | ||||
Kern | 4.0 | 3.2 | 3.2 | 27.5 | 29.0 | 23.0 | ||||
Kings | 3.7 | 3.9 | 2.9 | 16.0 | 26.5 | 27.0 | ||||
7.2 | 4.6 | 4.3 | 49.0 | 46.0 | 39.0 | |||||
3.7 | 3.0 | 2.9 | 34.0 | 32.0 | 33.0 | |||||
Placer | 3.3 | 2.9 | 3.0 | 41.0 | 37.0 | 27.0 | ||||
2.9 | 2.9 | 2.5 | 28.0 | 32.0 | 23.5 | |||||
4.5 | 4.7 | 4.6 | 36.5 | 19.0 | 26.5 | |||||
4.0 | 3.4 | 3.8 | 34.0 | 41.0 | 27.0 | |||||
Stanislaus | 3.5 | 3.5 | 3.4 | 32.0 | 30.0 | 26.0 | ||||
4.3 | 3.3 | 3.9 | 31.5 | 33.0 | 25.5 | |||||
Far North | ||||||||||
Butte | 4.0 | 3.3 | 3.2 | 33.0 | 24.0 | 25.5 | ||||
5.7 | 5.6 | 5.9 | 87.0 | 40.0 | 55.5 | |||||
3.6 | 3.7 | 6.4 | 115.0 | 76.0 | 93.0 | |||||
Shasta | 5.4 | 4.4 | 5.0 | 35.0 | 30.0 | 23.5 | ||||
5.1 | 6.4 | 5.7 | 52.0 | 46.0 | 54.0 | |||||
6.6 | 6.5 | 6.5 | 66.0 | 72.5 | 41.0 | |||||
Trinity | 13.9 | 9.1 | 17.8 | 63.5 | 64.0 | 72.0 | ||||
Other Calif. | ||||||||||
10.5 | 6.6 | 4.7 | 84.0 | 65.0 | 62.0 | |||||
6.5 | 5.1 | 7.6 | 56.0 | 58.0 | 43.5 | |||||
5.6 | 5.1 | 7.0 | 51.0 | 75.0 | 39.5 | |||||
5.1 | 4.2 | 4.5 | 55.0 | 53.5 | 43.0 | |||||
6.0 | 4.9 | 6.0 | 56.0 | 44.0 | 30.0 | |||||
Lake | 13.7 | 7.8 | 7.7 | 71.0 | 64.5 | 66.0 | ||||
7.8 | 8.9 | 8.1 | 21.0 | 67.0 | 27.0 | |||||
8.8 | 8.6 | 11.0 | 85.0 | 117.0 | 108.0 | |||||
Mono | 3.9 | 2.8 | 2.9 | 61.0 | 50.0 | 114.0 | ||||
4.0 | 3.9 | 4.3 | 51.0 | 59.0 | 37.5 | |||||
4.2 | 3.6 | 3.2 | 34.0 | 43.0 | 23.0 | |||||
6.4 | 6.0 | 5.2 | 74.5 | 81.5 | 24.0 | |||||
3.4 | 2.7 | 3.7 | 40.0 | 43.5 | 20.5 | |||||
3.7 | 4.6 | 5.5 | 42.0 | 47.0 | 34.0 | |||||
r = revised |

 View original content to download multimedia:https://www.prnewswire.com/news-releases/california-home-sales-reach-three-year-high-in-november-car-reports-302643631.html
SOURCE CALIFORNIA ASSOCIATION OF REALTORS® (C.A.R.)
Serious News for Serious Traders! Try StreetInsider.com Premium Free!
You May Also Be Interested In
- Larry Ellison Cancels His Plan to Sell Oracle Stock
- Sustainable Wood Building Products for Commercial Applications
- CoinYatra.com: An India-Focused Crypto Platform for INR Trading and Digital Assets
Create E-mail Alert Related Categories
PRNewswire, Press ReleasesRelated Entities
Pending Home SalesSign up for StreetInsider Free!
Receive full access to all new and archived articles, unlimited portfolio tracking, e-mail alerts, custom newswires and RSS feeds - and more!
