




Bridging the Data Gap: Commercial Freight Insights from Five Key U.S. Bridges

FREE Breaking News Alerts from StreetInsider.com!
StreetInsider.com Top Tickers, 10/6/2026
- S&P 500, Nasdaq on track for record closing highs as focus turns to earnings
- Oil prices fall nearly 2% as Middle East supply concerns ease
- U.S. 10-year yield climb revives dotcom-era parallels: UBS weighs in
- Goldman flags 2 key market risks if a climb in yields persists
- Shell CEO says Middle East oil flows reach 80% of prewar levels
 Tweet
Tweet Share
Share E-mail
Harsh events increase by 1750% during one 2-week bridge closure
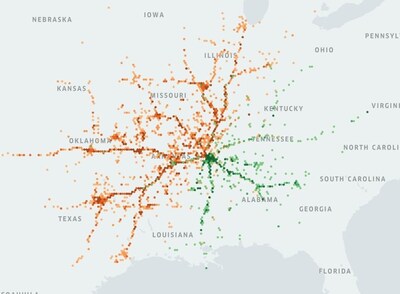
Geotab ITS provided a snapshot into what can be expected with a longer term replacement project and 2026 planned closure of the
- The closure of the
Memphis-Arkansas Bridge for two weeks inJune 2024 led to increased traffic volume and travel times on theHernando de Soto Bridge , with a 70.8% increase in travel time into TN and a 13.9% increase into AR during peak hours. - The other key state bridge, the
Hernando de Soto Bridge (which already handles 63% of all trips between the states) saw an increase of 61% in trip counts and total vehicle counts rose by 23%. - Total harsh event counts peaked at
3 p.m. , with 74 total harsh events recorded during the hour for vehicles traveling intoTennessee . This represents a 1,750% increase in harsh events observed on theHernando de Soto Bridge during the closure compared to when theMemphis-Arkansas Bridge was open. - Heavier traffic congestion along the
Hernando de Soto Bridge could result in disruptions to commercial vehicle movement intoTexas ,Oklahoma ,Ohio ,Georgia ,Louisiana ,Indiana , andMissouri .
"Bridges are critical to communities whether they connect cities, states or large regional hubs and definitely need to be cared for, maintained and replaced. Using our commercial vehicle freight data, we conducted analyses of five important bridges across
In its bridge analysis report, Geotab ITS studied the widespread effects of potential closures to show organizations how they can form better transportation plans with real world data. The study focused on five major
- The upcoming construction on the
Vincent Thomas Bridge will likely cause delays for vehicles directly headed to and from thePort of L.A ., but the farther-reaching impacts to the rest of the region need to be examined. Throughway traffic that uses this bridge as an important primary highway within this high-congestion area will be affected, resulting in commuter delays and likely supply chain setbacks. - Multi Purpose Vehicles (MPV), which represents around 30% of the vehicle type breakdown, and heavy duty trucks (HDT), which represents around 28% of the vehicle type breakdown, will likely be the most impacted by the bridge closures. Those vehicles represent 27% local, 23% regional, and 18% traffic by vocation.
The George Washington Bridge spansNew Jersey andNew York and is often referred to as the busiest bridge in the world. It is a two-way suspension bridge with 14 vehicle lanes, and it handles nearly 59% of all trips betweenNew York andNew Jersey . It is predominantly used by long haul and regional vehicles, with traffic peaking at5-6am into NY and12-1pm into NJ.- Our analysis revealed a notable correlation between severe weather events and the bridge's traffic patterns. The sharp increase in "danger probability" (a measure of generally how dangerous a route is in terms of collision probability) during a winter storm underscores the heightened risk of accidents under such conditions.
- As one of the primary routes for vehicles entering the
U.S. orCanada , theAmbassador Bridge connectsDetroit andWindsor and serves as an essential roadway for both passenger and commercial vehicle movement. In 2022, the bridge was home to over 260,000 commercial vehicle trips, with 60% of those trips being taken by heavy-duty, long-haul vehicles. - During a six-day protest that shut down the bridge in 2022, closure impacts were likely felt in cities such as
Montreal ,Toronto ,Columbus andChicago - Based on our origin and destination analysis, impacts extended as far south as
Nashville ,Cincinnati andCharleston . Drivers who were forced to take alternate routes experienced increased drive times and heavier arterial road congestion.
- Prior to its collapse in March of 2024, our data indicates that the bridge experienced over 4.2 million CMV trips across it, and more than 510,000 CMV vehicles annually.
- The aftermath of the collapse and subsequent recovery efforts resulted in the following predictable delays:
- Traffic rerouting through the
Baltimore Harbor Tunnel resulted in average drive time increases to 24%, while vehicles taking the Fort McHenry saw drive times rise to 15%. - By our estimation, roughly 53% of previous trips across the FSK bridge redirected through the
Fort McHenry Tunnel , approximately 10% traveled through theBaltimore Harbor Tunnel , and about 32% used either the Beltway orBaltimore City routes. - Approximately 5% of previous FSK trips stopped going through the
Baltimore area altogether.
"Our data and data insights from our bridge analyses helped us assess the key aspects of a transportation network's integrity: infrastructure resiliency, roadway safety and transportation efficiency. Each of the bridges we studied provided us with unique viewpoints ranging from how extra traffic could impact alternate routes reasonably handle, how motorist safety is impacted through changing driver behaviors such as harsh acceleration and harsh braking and, the impact of movement of goods and services en route to their destinations and how far out closures could extend to. All of this data insight can be very helpful in anticipating and planning for bridge construction and making better transportation decisions that focus on safety, resilience and efficiency, " concluded Nate.
At Geotab ITS, we help governments develop smarter resiliency plans.
Geotab ITS's strong reputation and vast data resources uniquely position us to analyze the impact of these bridges. With 80 billion daily data points from over four million vehicles, we are a leader in transportation insights. Data-driven bridge resiliency plans help minimize disruptions to daily commutes.
Our data insights provide valuable context, such as vehicle classes and vocations, enabling cities and states to create plans that support last-mile and long-haul deliveries and prevent bridge disruptions from impacting supply chains. Efficient transit drives economic prosperity, and understanding the commercial ramifications of potential bridge disruptions helps regions enhance their preparedness.
About Geotab ITS
Geotab ITS is a leading provider of advanced mobility insights and solutions for public and commercial sectors across
 View original content to download multimedia:https://www.prnewswire.com/news-releases/bridging-the-data-gap-commercial-freight-insights-from-five-key-us-bridges-302274991.html
SOURCE Geotab Inc.
Serious News for Serious Traders! Try StreetInsider.com Premium Free!
You May Also Be Interested In
- Ether.fi Deploys MoonPay's Full Infrastructure Stack to Bring Money In, Around, and Out of a Self-Custodial Neobank
- Greenberg Traurig Represents Opifex-Synergy in Acquisition of ECCO Equipment
- Cibola County Commissioners Support In-Situ Recovery of Uranium Technology
Create E-mail Alert Related Categories
PRNewswire, Press ReleasesSign up for StreetInsider Free!
Receive full access to all new and archived articles, unlimited portfolio tracking, e-mail alerts, custom newswires and RSS feeds - and more!
