

Superior Energy Services Announces Third Quarter 2021 Results and Conference Call
 Tweet
Tweet Share
ShareGet Alerts WTTR Hot Sheet
Overall Analyst Rating:
NEUTRAL (
Dividend Yield: 2.5%
Revenue Growth %: -10.6%
Join SI Premium – FREE
HOUSTON, Dec. 02, 2021 (GLOBE NEWSWIRE) -- Superior Energy Services, Inc. (the “Company”) filed its Form 10-Q for the period ending September 30, 2021 on December 2, 2021. In accordance with the Company’s Shareholders Agreement, it will host a conference call with shareholders on Monday, December 6, 2021.
Mike McGovern, Executive Chairman of the Board and Principal Executive Officer, commented, “The Company’s third quarter is reflective of a significant step along our transformation journey. We completed the exit of our fluids management business, announced the sale of our service rig business, and continued the sales of our pressure pumping assets. We expect to complete our exit from the US Land service business by the end of the year. The new Superior is well positioned to capitalize on opportunities in our higher margin business lines as we move forward into 2022.”
McGovern added, “In addition to our dedicated focus on the earnings of the business, our divestitures support another strategic goal to have a continuously improving ESG program. In 2021 alone we’ve exited our water hauling and storage businesses and land service rig operations. Divesting these businesses has significantly reduced our truck and trailer fleet which will reduce our overall carbon footprint. We continue to have active dialogue with customers who are focused on ESG performance and accountability within their own supply chain. Superior’s ESG focus is well aligned with the future needs of our industry.”
Third Quarter 2021 Results
The Company reported a loss from operations for the third quarter of 2021 of $44.0 million on revenue of $178.6 million. This compares to a loss from operations of $36.5 million for the second quarter of 2021 on revenues of $165.9 million. In the third quarter of 2020, the Company reported a loss from operations of $59.4 million on revenues of $136.0 million.
Adjusted EBITDA (a non-GAAP measure) of $31.4 million for the quarter was up slightly compared to $30.0 million in second quarter 2021 and up significantly from a negative EBITDA in the third quarter 2020. Refer to page 10 for a Reconciliation of Adjusted EBITDA to GAAP results.
The valuation process under fresh start accounting caused certain fully depreciated assets to be assigned an estimated fair value of $282.1 million and remaining useful life of less than 36 months. Depreciation expense for the first, second and third quarters of 2021 was $45.6 million, $57.3 million and $56.9 million respectively. Depreciation expense for the fourth quarter is expected to be approximately $50.7 million, and $75.1 million and $46.5 million for the years ended December 31, 2022 and 2023, respectively.
Third Quarter 2021 Geographic Breakdown
U.S. land revenue was $32.3 million in the third quarter of 2021, an increase of 17% compared with revenue of $27.6 million in the second quarter of 2021. U.S. offshore revenue was $51.8 million in the third quarter of 2021, a decrease of 3% compared with revenue of $53.5 million in the second quarter of 2021. International revenue of $94.6 million increased by 11%, as compared to revenue of $84.9 million in the second quarter of 2021.
Segment Reporting
The Rentals segment revenue in the third quarter of 2021 was $76.2 million, a 13% increase from second quarter 2021 revenue of $67.2 million. The Well Services segment revenue in the third quarter of 2021 was $102.4 million, a 4% increase from the second quarter 2021 revenue of $98.7 million.
Discontinued Operations
The Company reported a net loss from discontinued operations for the third quarter of 2021 of $5.2 million on revenue of $17.0 million. This compares to a net loss from discontinued operations for the second quarter of 2021 of $19.4 million on revenue of $45.1 million.
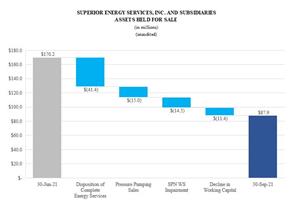
At the end of the third quarter 2021, assets held for sale totaled $87.9 million compared to $170.2 million at the end of the second quarter of 2021. The reduction in assets held for sale relate primarily to the disposition of our subsidiary Complete Energy Services, pressure pumping asset sales, impairments related to the assets of SPN Well Services and a decline in discontinued operations working capital. The Company expects the majority of the remaining assets held for sale to be disposed of during the fourth quarter of 2021. Approximately $26.8 million of assets held for sale at the end of the third quarter relate to various real estate holdings across US basins that we expect to monetize in 2022. Refer to page 6 for a bridge of second quarter assets held for sale to third quarter.
Total cash proceeds received from the sale of non-core assets through November 30, 2021 are $76.1 million.
Liquidity
As of November 30, 2021, the Company had cash, cash equivalents, and restricted cash of approximately $370.9 million and availability remaining under our ABL Credit Facility of approximately $79.3 million, assuming continued compliance with the covenants under our ABL Credit Facility.
As of November 30, 2021, the Company owned 3.6 million shares of Select Energy Services Class A common stock (NYSE: WTTR).
Conference Call Information
The Company will host a conference call on Monday, December 6, 2021 at 10:00 a.m. Eastern Time. To listen to the call via a live webcast, please visit Superior’s website at ir.superiorenergy.com and use access code 1516637. You may also listen to the call by dialing in at 1-877-800-3682 in the United States and Canada or 1-615-622-8047 for International calls and using access code 1516637. The call will be available for replay until December 31, 2021 on Superior’s website at ir.superiorenergy.com. If you are a shareholder and would like to submit a question, please email your question beforehand to Wendell York at [email protected].
About Superior Energy Services
Superior Energy Services serves the drilling, completion and production-related needs of oil and gas companies worldwide through a diversified portfolio of specialized oilfield services and equipment that are used throughout the economic life cycle of oil and gas wells. For more information, visit: www.superiorenergy.com.
Forward-Looking Statements
This press release contains, and future oral or written statements or press releases by the Company and its management may contain, certain forward-looking statements within the safe harbor provisions of the Private Securities Litigation Reform Act of 1995. Generally, the words “expects,” “anticipates,” “targets,” “goals,” “projects,” “intends,” “plans,” “believes,” “seeks” and “estimates,” variations of such words and similar expressions identify forward-looking statements, although not all forward-looking statements contain these identifying words. All statements other than statements of historical fact regarding the Company’s financial position, financial performance, depreciation expense, liquidity, strategic alternatives (including dispositions and the timing thereof), market outlook, future capital needs, capital allocation plans, business strategies and other plans and objectives of our management for future operations and activities are forward-looking statements. These statements are based on certain assumptions and analyses made by the Company’s management in light of its experience and prevailing circumstances on the date such statements are made. Such forward-looking statements, and the assumptions on which they are based, are inherently speculative and are subject to a number of risks and uncertainties, including but not limited to conditions in the oil and gas industry and the availability of third party buyers, that could cause the Company’s actual results to differ materially from such statements. These forward-looking statements rely on a number of assumptions concerning future events and are subject to a number of uncertainties and factors, many of which are outside the control of the Company, which could cause actual results to differ materially from such statements.
While the Company believes that the assumptions concerning future events are reasonable, it cautions that there are inherent difficulties in predicting certain important factors that could impact the future performance or results of its business.
These forward-looking statements are also affected by the risk factors, forward-looking statements and challenges and uncertainties described in the Company’s Form 10-K for the year ended December 31, 2020 and Forms 10-Q filed on September 30, 2021, October 29, 2021 and December 3, 2021 and those set forth from time to time in the Company’s other periodic filings with the Securities and Exchange Commission, which are available at www.superiorenergy.com. Except as required by law, the Company expressly disclaims any intention or obligation to revise or update any forward-looking statements whether as a result of new information, future events or otherwise.
| SUPERIOR ENERGY SERVICES, INC. AND SUBSIDIARIES | |||||||||||||||||||
| CONDENSED CONSOLIDATED STATEMENTS OF OPERATIONS | |||||||||||||||||||
| (in thousands, except per share data) | |||||||||||||||||||
| (unaudited) | |||||||||||||||||||
| Three months ended | Nine months ended | ||||||||||||||||||
| September 30, | June 30, | September 30, | |||||||||||||||||
| 2021 | 2020 | 2021 | 2021(1) | 2020 | |||||||||||||||
| Revenues | $ | 178,583 | $ | 135,976 | $ | 165,892 | $ | 496,246 | $ | 521,797 | |||||||||
| Cost of revenues | 124,973 | 87,074 | 103,579 | 326,193 | 318,013 | ||||||||||||||
| Depreciation, depletion, amortization and accretion | 59,208 | 28,163 | 59,018 | 166,614 | 89,052 | ||||||||||||||
| General and administrative expenses | 33,671 | 51,440 | 32,308 | 95,469 | 164,957 | ||||||||||||||
| Restructuring and other expenses | 4,712 | 25,746 | 7,438 | 21,803 | 27,033 | ||||||||||||||
| Reduction in value of assets | - | 2,929 | - | - | 19,451 | ||||||||||||||
| Loss from operations | (43,981 | ) | (59,376 | ) | (36,451 | ) | (113,833 | ) | (96,709 | ) | |||||||||
| Other income | |||||||||||||||||||
| Interest income (expense), net | 647 | (24,800 | ) | 535 | 1,596 | (74,698 | ) | ||||||||||||
| Reorganization items, net | - | - | - | 335,560 | - | ||||||||||||||
| Other income (expense) | (6,224 | ) | (1,399 | ) | 2,570 | (8,604 | ) | (4,810 | ) | ||||||||||
| Income (loss) from continuing operations before income taxes | (49,558 | ) | (85,575 | ) | (33,346 | ) | 214,719 | (176,217 | ) | ||||||||||
| Income taxes benefit | 9,518 | (1,815 | ) | 1,747 | (44,453 | ) | 12,345 | ||||||||||||
| Net income (loss) from continuing operations | (40,040 | ) | (87,390 | ) | (31,599 | ) | 170,266 | (163,872 | ) | ||||||||||
| Loss from discontinued operations, net of tax | (5,161 | ) | (69,914 | ) | (19,400 | ) | (34,319 | ) | (138,002 | ) | |||||||||
| Net income (loss) | $ | (45,201 | ) | $ | (157,304 | ) | $ | (50,999 | ) | $ | 135,947 | $ | (301,874 | ) | |||||
(1) Combines results from Predecessor periods prior to our emergence from bankruptcy on February 2, 2021 and Successor periods subsequent to emergence which is a non-GAAP financial measure. For further information regarding the breakdown of results, see our Quarterly Report on Form 10-Q for the nine months ended September 30, 2021.
No earnings per share information is presented due to the change in reporting entity as a result of our emergence from bankruptcy in the first quarter of 2021.
| SUPERIOR ENERGY SERVICES, INC. AND SUBSIDIARIES | |||||||
| CONDENSED CONSOLIDATED BALANCE SHEETS | |||||||
| (in thousands) | |||||||
| (unaudited) | |||||||
| September 30, | December 31, | ||||||
| 2021 | 2020 | ||||||
| ASSETS | |||||||
| Current assets: | |||||||
| Cash and cash equivalents | $ | 258,024 | $ | 188,006 | |||
| Accounts receivable, net | 174,065 | 158,516 | |||||
| Income taxes receivable | - | 8,891 | |||||
| Prepaid expenses | 26,881 | 31,793 | |||||
| Inventory and other current assets | 78,630 | 86,198 | |||||
| Investment in equity securities | 18,684 | - | |||||
| Assets held for sale | 87,922 | 242,104 | |||||
| Total current assets | 644,206 | 715,508 | |||||
| Property, plant and equipment, net | 403,473 | 408,107 | |||||
| Operating lease right-of-use assets | 28,871 | 33,317 | |||||
| Goodwill | - | 138,677 | |||||
| Notes receivable | 75,564 | 72,129 | |||||
| Restricted cash | 79,560 | 80,179 | |||||
| Intangible and other long-term assets, net | 24,109 | 53,162 | |||||
| Total assets | $ | 1,255,783 | $ | 1,501,079 | |||
| LIABILITIES AND STOCKHOLDERS’ EQUITY (DEFICIT) | |||||||
| Current liabilities: | |||||||
| Accounts payable | $ | 56,500 | $ | 50,330 | |||
| Accrued expenses | 109,054 | 114,777 | |||||
| Liabilities held for sale | 23,241 | 46,376 | |||||
| Total current liabilities | 188,795 | 211,483 | |||||
| Decommissioning liabilities | 173,132 | 134,436 | |||||
| Operating lease liabilities | 20,608 | 29,464 | |||||
| Deferred income taxes | 32,396 | 5,288 | |||||
| Other long-term liabilities | 70,355 | 123,261 | |||||
| Liabilities subject to compromise | - | 1,335,794 | |||||
| Total liabilities | 485,286 | 1,839,726 | |||||
| Total stockholders’ equity (deficit) | 770,497 | (338,647 | ) | ||||
| Total liabilities and stockholders’ equity (deficit) | $ | 1,255,783 | $ | 1,501,079 | |||
The graph “SUPERIOR ENERGY SERVICES, INC. AND SUBSIDIARIES - ASSETS HELD FOR SALE” is available at https://www.globenewswire.com/NewsRoom/AttachmentNg/35a906b2-4dae-42f2-bc2d-92ff6b1e9dcc
| Assets Held For Sale Bridge | |||||
| June 30, 2021 to September 30, 2021 | |||||
| (in millions) | |||||
| $170.2 | Q2 Assets Held for Sale | ||||
| ($41.4) | Disposition of Complete Energy Services | ||||
| ($15.0) | Pressure Pumping Sales | ||||
| ($14.5) | SPN WS Impairment | ||||
| ($11.4) | Decline in Working Capital | ||||
| $87.9 | Q3 Assets Held for Sale | ||||
| Assets Held For Sale | |||||
| Three months ended September 30, 2021 | |||||
| $26.8 | Real Estate | ||||
| $8.5 | SPN Well Services Assets | ||||
| $26.8 | Pressure Pumping and Excluded Assets (Machinery and Equip) | ||||
| $62.1 | Total PP&E | ||||
| $17.9 | Current Assets ($11M A/R) | ||||
| $7.9 | Right of Use (Lease Assets) and other | ||||
| $87.9 | Total Assets Held for Sale | ||||
| SUPERIOR ENERGY SERVICES, INC. AND SUBSIDIARIES | |||||||
| CONDENSED CONSOLIDATED STATEMENTS OF CASH FLOWS | |||||||
| (in thousands) | |||||||
| (unaudited) | |||||||
| Nine months ended | |||||||
| September 30, | |||||||
| 2021(1) | 2020 | ||||||
| Cash flows from operating activities | |||||||
| Net income (loss) | $ | 135,947 | $ | (301,874 | ) | ||
| Adjustments to reconcile net income (loss) to net cash provided by operating activities | |||||||
| Depreciation, depletion, amortization and accretion | 200,257 | 113,313 | |||||
| Reduction in value of assets | 26,905 | 129,042 | |||||
| Reorganization items, net | (354,279 | ) | - | ||||
| Other non-cash items | 20,727 | 17,627 | |||||
| Changes in operating assets and liabilities | 12,652 | 60,489 | |||||
| Net cash from operating activities | 42,209 | 18,597 | |||||
| Cash flows from investing activities | |||||||
| Payments for capital expenditures | (28,482 | ) | (37,408 | ) | |||
| Proceeds from sales of assets | 58,781 | 44,097 | |||||
| Net cash from investing activities | 30,299 | 6,689 | |||||
| Cash flows from financing activities | |||||||
| Other | (3,419 | ) | (12,340 | ) | |||
| Net cash from financing activities | (3,419 | ) | (12,340 | ) | |||
| Effect of exchange rate changes on cash | 311 | (378 | ) | ||||
| Net change in cash, cash equivalents and restricted cash | 69,400 | 12,568 | |||||
| Cash, cash equivalents and restricted cash at beginning of period | 268,184 | 275,388 | |||||
| Cash, cash equivalents and restricted cash at end of period | $ | 337,584 | $ | 287,956 | |||
(1) Combines results from Predecessor periods prior to our emergence from bankruptcy on February 2, 2021 and Successor periods subsequent to emergence which is a non-GAAP financial measure. For further information regarding the breakdown of results, see our Quarterly Report on Form 10-Q for the nine months ended September 30, 2021.
| SUPERIOR ENERGY SERVICES, INC. AND SUBSIDIARIES | |||||||||||
| REVENUE BY GEOGRAPHIC REGION BY SEGMENT | |||||||||||
| (in thousands, except per share data) | |||||||||||
| (unaudited) | |||||||||||
| Three months ended | |||||||||||
| September 30, | June 30, | ||||||||||
| 2021 | 2020 | 2021 | |||||||||
| U.S. land | |||||||||||
| Rentals | $ | 25,627 | $ | - | $ | 20,789 | |||||
| Well Services | 6,638 | - | 6,781 | ||||||||
| Drilling Products and Services | - | 10,459 | - | ||||||||
| Production Services | - | 383 | - | ||||||||
| Technical Solutions | - | 4,694 | - | ||||||||
| Total U.S. land | 32,265 | 15,536 | 27,570 | ||||||||
| U.S. offshore | |||||||||||
| Rentals | 28,997 | - | 26,890 | ||||||||
| Well Services | 22,756 | - | 26,574 | ||||||||
| Drilling Products and Services | - | 26,242 | - | ||||||||
| Production Services | - | 6,630 | - | ||||||||
| Technical Solutions | - | 15,740 | - | ||||||||
| Total U.S. offshore | 51,753 | 48,612 | 53,464 | ||||||||
| International | |||||||||||
| Rentals | 21,593 | - | 19,558 | ||||||||
| Well Services | 72,972 | - | 65,300 | ||||||||
| Drilling Products and Services | - | 19,301 | - | ||||||||
| Production Services | - | 39,948 | - | ||||||||
| Technical Solutions | - | 12,579 | - | ||||||||
| Total International | 94,565 | 71,828 | 84,858 | ||||||||
| Total Revenues | $ | 178,583 | $ | 135,976 | $ | 165,892 | |||||
(1) Combines results from Predecessor periods prior to our emergence from bankruptcy on February 2, 2021 and Successor periods subsequent to emergence. For further information regarding the breakdown of results, see our Quarterly Report on Form 10-Q for the three months ended March 31, 2021.
| SUPERIOR ENERGY SERVICES, INC. AND SUBSIDIARIES | |||||||
| SEGMENT HIGHLIGHTS | |||||||
| (in thousands) | |||||||
| (unaudited) | |||||||
| Three months ended | |||||||
| September 30, | June 30, | ||||||
| 2021 | 2021 | ||||||
| Revenues | |||||||
| Rentals | $ | 76,217 | $ | 67,237 | |||
| Well Services | 102,366 | 98,655 | |||||
| Corporate and other | - | - | |||||
| Total Revenues | $ | 178,583 | $ | 165,892 | |||
| Loss from Operations | |||||||
| Rentals | $ | (6,046 | ) | $ | (9,232 | ) | |
| Well Services | (18,229 | ) | (5,226 | ) | |||
| Corporate and other | (19,706 | ) | (21,993 | ) | |||
| Total loss from Operations | $ | (43,981 | ) | $ | (36,451 | ) | |
| Adjusted EBITDA | |||||||
| Rentals | $ | 35,595 | $ | 32,851 | |||
| Well Services | 8,894 | 9,987 | |||||
| Corporate and other | (13,042 | ) | (12,833 | ) | |||
| Total loss from Operations | $ | 31,447 | $ | 30,005 | |||
We define EBITDA as income (loss) from continuing operations adjusted for the impact of depreciation, depletion, amortization and accretion, interest and income taxes. Additionally, our definition of Adjusted EBITDA adjusts for the impact of reorganization items and restructuring and other expenses, other income/expense and other adjustments.
| SUPERIOR ENERGY SERVICES, INC. AND SUBSIDIARIES | |||||||||||
| RECONCILIATION OF ADJUSTED EBITDA | |||||||||||
| (in thousands) | |||||||||||
| (unaudited) | |||||||||||
| Three months ended | |||||||||||
| September 30, | June 30, | ||||||||||
| 2021 | 2020 | 2021 | |||||||||
| Net income (loss) from continuing operations | $ | (40,040 | ) | $ | (87,390 | ) | $ | (31,599 | ) | ||
| Depreciation, depletion, amortization and accretion | 59,208 | 28,163 | 59,018 | ||||||||
| Interest (income) expense, net | (647 | ) | 24,800 | (535 | ) | ||||||
| Income taxes | (9,518 | ) | 1,815 | (1,747 | ) | ||||||
| Restructuring and other expenses | 4,712 | 25,746 | 7,438 | ||||||||
| Reduction in value of assets | - | 2,929 | - | ||||||||
| Other (income) expense | 6,224 | 1,399 | (2,570 | ) | |||||||
| Other adjustments (1) | 11,508 | ||||||||||
| Adjusted EBITDA | $ | 31,447 | $ | (2,538 | ) | $ | 30,005 | ||||
We define EBITDA as income (loss) from continuing operations adjusted for the impact of depreciation, depletion, amortization and accretion, interest and income taxes. Additionally, our definition of Adjusted EBITDA adjusts for the impact of reorganization items and restructuring and other expenses, other income/expense and other adjustments.
(1) Other adjustments relate to costs associated with our Transformation Project which are included in cost of revenues in our condensed consolidated statements of operations. These costs primarily relate to shut down costs incurred at certain locations and include severance of personnel and the write-down of inventory.
| SUPERIOR ENERGY SERVICES, INC. AND SUBSIDIARIES | |||||||||||||||
| RECONCILIATION OF ADJUSTED EBITDA BY SEGMENT | |||||||||||||||
| (in thousands) | |||||||||||||||
| (unaudited) | |||||||||||||||
| Three months ended September 30, 2021 | |||||||||||||||
| Well | Corporate | Consolidated | |||||||||||||
| Rentals | Services | and Other | Total | ||||||||||||
| Loss from continuing operations | $ | (6,046 | ) | $ | (18,229 | ) | $ | (19,706 | ) | $ | (43,981 | ) | |||
| Depreciation, depletion, amortization and accretion | 41,641 | 15,615 | 1,952 | 59,208 | |||||||||||
| Restructuring and other expenses | - | - | 4,712 | 4,712 | |||||||||||
| Other adjustments (1) | - | 11,508 | - | 11,508 | |||||||||||
| Adjusted EBITDA | $ | 35,595 | $ | 8,894 | $ | (13,042 | ) | $ | 31,447 | ||||||
| Three months ended June 30, 2021 | |||||||||||||||
| Well | Corporate | Consolidated | |||||||||||||
| Rentals | Services | and Other | Total | ||||||||||||
| Loss from continuing operations | $ | (9,232 | ) | $ | (5,226 | ) | $ | (21,993 | ) | $ | (36,451 | ) | |||
| Depreciation, depletion, amortization and accretion | 42,083 | 15,213 | 1,722 | 59,018 | |||||||||||
| Restructuring and other expenses | - | - | 7,438 | 7,438 | |||||||||||
| Adjusted EBITDA | $ | 32,851 | $ | 9,987 | $ | (12,833 | ) | $ | 30,005 | ||||||
We define EBITDA as income (loss) from continuing operations adjusted for the impact of depreciation, depletion, amortization and accretion, interest and income taxes. Additionally, our definition of Adjusted EBITDA adjusts for the impact of reorganization items and restructuring and other expenses, other income/expense and other adjustments.
(1) Other adjustments relate to costs associated with our Transformation Project which are included in cost of revenues in our condensed consolidated statements of operations. These costs primarily relate to shut down costs incurred at certain locations and include severance of personnel and the write-down of inventory.
FOR FURTHER INFORMATION CONTACT:Wendell York, VP – IR, Corporate Development & Treasury1001 Louisiana St., Suite 2900Houston, TX 77002Investor Relations, [email protected], (713) 654-2200

![]()
Serious News for Serious Traders! Try StreetInsider.com Premium Free!
You May Also Be Interested In
- Alphabet stock surges 11% to record high on Q1 earnings beat, first-ever dividend
- Åsa Vilsson new CFO at Elanders
- Composition of the Nomination Committee of Orion Corporation
Create E-mail Alert Related Categories
Globe Newswire, Press ReleasesRelated Entities
Bankruptcy, EarningsSign up for StreetInsider Free!
Receive full access to all new and archived articles, unlimited portfolio tracking, e-mail alerts, custom newswires and RSS feeds - and more!
