

Rogers Sugar Reports Second Quarter 2021 Results, Maintains Higher Volumes Outlook for Sugar and Maple Business Segments for Fiscal 2021
 Tweet
Tweet Share
ShareMONTREAL, May 06, 2021 (GLOBE NEWSWIRE) -- Rogers Sugar Inc.’s (“our,” “we”, “us” or “Rogers”) (TSX: RSI) today reported second quarter fiscal 2021 results with consolidated adjusted EBITDA of $21.4 million and $49.0 million for the current quarter and the first six months of the year, respectively.
"Providing consistent, reliable supply is vital for our customers and we have strategically added operational flexibility to allow us to consistently meet their needs,” said John Holliday, President and Chief Executive Officer of Rogers and Lantic Inc. "This foresight has allowed us to successfully navigate prior unexpected events, including COVID-19, and this quarter allowed us to maintain our full-year sugar outlook, despite some weather-related losses for our beet sugar production. We continue to expect our full year fiscal 2021 results to be strong, with sugar sales remaining higher than last year and the impact of our production improvements in our Maple business driving stronger profitability".
| Second Quarter 2021 Consolidated Highlights(unaudited) | Q2 2021 | Q2 2020 | YTD 2021 | YTD 2020 | ||||
| Financials ($000s) | ||||||||
| Revenues | 215,929 | 199,126 | 439,769 | 408,442 | ||||
| Adjusted gross margin(1) | 27,407 | 23,612 | 63,859 | 60,138 | ||||
| Adjusted EBITDA(1) | 21,375 | 16,522 | 49,022 | 46,749 | ||||
| Net earnings | 10,778 | 965 | 24,551 | 16,929 | ||||
| per share (basic) | 0.1 | 0.01 | 0.24 | 0.16 | ||||
| per share (diluted) | 0.1 | 0.01 | 0.23 | 0.16 | ||||
| Adjusted net earnings(1) | 7,751 | 4,036 | 19,999 | 18,134 | ||||
| Adjusted net earnings per share (basic)(1) | 0.07 | 0.04 | 0.19 | 0.17 | ||||
| Trailing twelve months free cash flow(1) | 46,670 | 35,588 | 46,670 | 35,588 | ||||
| Dividends per share | 0.09 | 0.09 | 0.18 | 0.18 | ||||
| Volumes | ||||||||
| Sugar (metric tonnes) | 183,749 | 175,226 | 374,189 | 363,605 | ||||
| Maple Syrup (thousand pounds) | 14,214 | 12,893 | 29,106 | 25,686 | ||||
| (1) See “Cautionary statement on Non-GAAP Measures” section of this press release for definition and reconciliation to GAAP measures. | ||||||||
- Consolidated adjusted EBITDA for the second quarter of 2021 was $21.4 million, up 29.4% from the same quarter last year, driven by higher adjusted EBITDA in both the Sugar and Maple segments in the current quarter. Adjusted EBITDA for the first six months of 2021 was $49.0 million, up 4.9% from the same period in 2020, largely as a result of improved adjusted EBITDA in the Maple segment;
- Adjusted EBITDA in the Sugar segment was $17.0 million in the second quarter, an increase of $3.2 million or 22.8% from the same quarter last year, largely due to higher revenue partly offset by higher operating costs and higher warehousing costs;
- Sales volumes in the Sugar segment increased by 4.9% to 183,749 metric tonnes in the second quarter, as stronger industrial, liquid and export volumes were partly offset by a reduction in consumer volumes;
- As a result of unfavourable weather conditions in October 2020, a portion of the current year’s Taber beet crop was damaged, reducing the quantity and quality of the beet processed in the second quarter of 2021. The issue encountered in fiscal 2021 reduced the expected sugar production from Taber by 9,000 metric tonnes. The current year issue was not as severe as the similar issue encountered in 2020 whereby half of the overall sugar beet crop was lost due to unfavourable weather;
- Adjusted EBITDA in the Maple segment was $4.4 million in the second quarter, an increase of $1.7 million or 63.2% from the same quarter last year as a result of higher customer demand and improved margin;
- Maple segment volumes increased by 10.2% to 14,214 pounds in the quarter, driven by strong demand from retail customers;
- Free cash flow for the trailing 12 months ended April 3, 2021 was $46.7 million, an increase of $11.1 million from the same period last year;
- In the second quarter of 2021, we distributed $0.09 per share to our shareholders for a total amount of $9.3 million;
- On April 30, 2021, Lantic issued $100 million in senior guaranteed Notes under a note purchase agreement as a private placement with certain institutional investors. The proceeds of the issuance were used to refinance existing debt. The Notes carry an interest rate of 3.49% and are due on April 30, 2031 with interest payable semi-annually in arrears; and
- On May 5, 2021, the Board of Directors declared a quarterly dividend of $0.09 per share, payable on July 13, 2021.
Sugar
| Second Quarter 2021 Sugar Highlights(unaudited) | Q2 2021 | Q2 2020 | YTD 2021 | YTD 2020 | ||||
| Financials ($000s) | ||||||||
| Revenues | 155,961 | 143,609 | 315,419 | 298,424 | ||||
| Adjusted gross margin(1) | 21,793 | 19,210 | 52,489 | 49,985 | ||||
| Per metric tonne ($/ mt) (1) | 118.6 | 109.63 | 140.27 | 137.47 | ||||
| Administration and selling expenses | 5,771 | 5,577 | 13,039 | 11,148 | ||||
| Distribution costs | 3,623 | 3,997 | 8,692 | 7,225 | ||||
| Adjusted EBITDA(1) | 17,010 | 13,847 | 39,741 | 39,967 | ||||
| Volumes (metric tonnes) | ||||||||
| Total volume | 183,749 | 175,226 | 374,189 | 363,605 | ||||
| (1) See “Cautionary statement on Non-GAAP Measures” section of this press release for definition and reconciliation to GAAP measures. | ||||||||
In the second quarter of fiscal 2021, revenue increased by 8.6%, compared to the same period last year driven by higher volumes and increased pricing.
Sugar volume increased by 4.9% in the second quarter 2021 compared to the same quarter last year as stronger industrial, liquid and export volumes were partly offset by a reduction in consumer volumes.
- Export volumes contributed the largest increase in the quarter, largely due to higher beet sugar sales to the United States in 2021 under the Canadian United States Mexico Agreement quota (“CUSMA”).
- Total domestic volume remained largely unchanged; however, we experienced a shift between the industrial, consumer and liquid segments. Industrial and liquid volumes increased compared to last year as customer demand remained firm and delayed industrial orders from the first quarter were filled in the second quarter. In the second quarter, consumer volumes lowered, returning closer to pre-COVID levels as consumer pantry loading reduced compared to last year, resulting in retailers holding higher inventory levels than expected.
Adjusted gross margin increased by $2.6 million in the current quarter compared to the same quarter last year mainly as a result of higher sugar sales margin of $1.2 million and increased by-product net contribution of $2.9 million. This favourable variance was partially offset by higher processing costs of $1.5 million. The higher costs were related to the Vancouver plant and were mainly due to a variation in the mix of products sold resulting from the transfer of production from Taber to Vancouver. The transfer of production was necessary to mitigate supply issues at the Taber facility. On a per unit basis, adjusted gross margin for the second quarter was at $118.60 per metric tonnes, higher that last year by $8.97 per metric tonnes. The increase was mainly due to higher volume in the current year, reflecting higher customer demand and increased pricing in 2021 compared to 2020.
As a result of unfavourable weather conditions in October 2020, a portion of the current year’s Taber beet crop was damaged, reducing the quantity and quality of the beet processed in the second quarter of 2021. The issue encountered in fiscal 2021 reduced the expected sugar production from Taber by 9,000 metric tonnes. The current year issue was not as severe as the similar issue encountered in 2020 whereby half of the overall sugar beet crop was lost due to unfavourable weather. In both fiscal years, we continued to meet customer demand, despite the uncontrollable crop shortfall as our Vancouver cane sugar facility was used to backfill the shortfall from the Taber facility. The direct impact on adjusted gross margin of the crop issues on the Taber operations is expected to amount to $ 4.0 million in 2021. In connection with this issue, $2.1 million was recognized in the second quarter of 2021.
Adjusted EBITDA for the second quarter increased by $3.2 million compared to the same period last year, largely as a result of higher adjusted gross margin, and lower distribution costs as costs associated with reconfiguring our supply chain to compensate for the crop shortfall this quarter were lower compared the same quarter last year.
Maple Products
| Second Quarter 2021 Maple Highlights(unaudited) | Q2 2021 | Q2 2020 | YTD 2021 | YTD 2020 | ||||
| Financials ($000s) | ||||||||
| Revenues | 59,968 | 55,517 | 124,350 | 110,018 | ||||
| Adjusted gross margin(1) | 5,614 | 4,402 | 11,370 | 10,153 | ||||
| As a percentage of revenues (%) (1) | 9.40% | 7.90% | 9.10% | 9.20% | ||||
| Administration and selling expenses | 2,185 | 2,883 | 4,515 | 5,582 | ||||
| Distribution costs | 721 | 875 | 1,334 | 1,672 | ||||
| Adjusted EBITDA(1) | 4,365 | 2,675 | 9,281 | 6,782 | ||||
| Volumes (thousand pounds) | ||||||||
| Total volume | 14,214 | 12,893 | 29,106 | 25,686 | ||||
| (1) See “Cautionary statement on Non-GAAP Measures” section of this press release for definition and reconciliation to GAAP measures. | ||||||||
Revenues for the second quarter of the current fiscal year were $4.5 million higher than the same period last year due to ongoing strong demand, driven partially by the COVID-19 pandemic and an aggressive marketing strategy.
Adjusted gross margin for the current quarter was $1.2 million higher than the comparable period last year, driven by a combination of lower costs from improved operational efficiency and higher sales margin from sustained marketing efforts. Improved profitability was also reflected in our adjusted gross margin percentage, increasing by 150 basis points to 9.4% in the current quarter, up from 7.9% in the same quarter last year.
Adjusted EBITDA for the second quarter of fiscal 2021 increased by $1.7 million than the comparable period last year, due mainly to increased adjusted gross margin and lower administration and selling expenses, largely driven by a reduction of sales and marketing expenses related to trade shows and promotions as well as lower employee compensation and benefits costs. Adjusted EBITDA was also positively impacted by lower distribution costs mainly as a result of a reduction in net freight costs from favourably negotiated agreements.
OUTLOOK
The health and safety of our employees remains our top priority. We are closely following all COVID-19 public health authority recommendations and have enhanced safety protocols in place. To date our plants have operated without any disruption during the COVID-19 pandemic; however, the uncertainty and increased demand volatility make it difficult to estimate the impact on future sale volumes, operations and financial results. We are closely monitoring the situation and will continue to adapt quickly to the changing circumstances.
We remain optimistic for the outlook of both the Sugar and Maple segments in fiscal 2021, despite of market uncertainty and additional costs related to the COVID-19 pandemic. Regardless of an additional week of operations in fiscal 2020, we anticipate volumes to exceed prior year levels in both segments, which is expected to result in improved financial performance for 2021 compared to 2020. Fiscal 2021 includes 52 weeks of operations while 2020 had 53 weeks, providing additional volumes in fiscal 2020 of approximately 14,000 metric tonnes for the Sugar Segment and 1,000,000 lbs for the Maple Segment.
Sugar
Our full year fiscal 2021 sales volumes guidance remains unchanged at approximately 776,000 metric tonnes, an increase of 15,000 metric tonnes over fiscal 2020, despite the impact of the crop shortfall in Taber, and an extra week of operations in 2020. We continue to expect our Sugar segment to achieve improved financial performance in fiscal 2021over fiscal 2020.
- Industrial and liquid volumes are expected to increase by approximately 15,000 metric tonnes in 2021, due to the addition of new liquid customers.
- Consumer volumes are expected to decrease by 5,000 metric tonnes in 2021 as the effect of COVID-19 on the retail market subsides in the later part of the current year.
- Export volumes are expected to increase by approximately 5,000 metric tonnes driven by new export quotas including the CUSMA special quotas that took effect on July 1, 2020.
The 2021 adjusted EBITDA for the Sugar segment is expected to benefit from the increase in beet sugar production at the Taber facility as compared to last year. Our 2020 beet harvest campaign was completed, despite weather-related crop losses, with an estimated production of 119,000 metric tonne of beet sugar, approximately 9,000 metric tonnes lower than expected; but 48,000 metric tonnes higher than last year.
Maintenance programs for the remaining quarters of 2021 are expected to follow the trend of previous years for each facility. For the remainder of 2021, we expect distribution costs to be lower than last year as the impact of the current year crop shortfall in Taber was not as severe as last year’s crop issue, requiring less backfill of customer orders from our Vancouver facility.
Our capital spending expectation for the year is between $20 million and $25 million, with approximately a quarter of these funds allocated to return-on-investment projects.
We are continuing to work with our strategic partner, Doux-Matok, to advance a unique sugar reduction solution based on cane sugar to food companies in North America. Although this is a small portion of the sweetener market, we believe this could provide a competitive offering in this niche market.
Maple Products
We expect to see ongoing strong performance in our Maple segment in fiscal 2021. The improvements in sales margins and increased operational efficiencies evident in the first six months, are expected to continue throughout the year. Sales margins are expected to improve as the impact of successful contract negotiations with new and existing customers are coming into effect gradually. In addition, we expect the ongoing optimization at our manufacturing facilities and efficiency improvements at our new Granby facility and existing Dégelis plant to continue to drive lower operating costs in 2021.
While we expect the COVID-19 related demand we have seen over the past few quarters to temper in the second half of 2021, we expect that firm underlying demand for maple syrup, combined with our improved margins and lower cost structure will result in improved financial performance for fiscal 2021, compared to 2020.
Capital investments are expected to be significantly lower for the Maple segment in 2021, following the completion of our capital projects in 2020 and the resulting increase in our production capacity.
See Cautionary statement on forward-looking information and NON-GAAP measure sections.
A full copy of Rogers second quarter 2021, including management’s discussion and analysis and unaudited condensed consolidated interim financial statements, can be found at www.LanticRogers.com.
Conference Call and Webcast
Rogers will host a conference call to discuss its second quarter fiscal 2021 results on May 6, 2021 starting at 8:00a.m. ET. To participate, please dial 1-877-223-4471. A recording of the conference call will be accessible shortly after the conference, by dialing 1-800-585-8367, access code 3194049#. This recording will be available until May 13, 2021. A live audio webcast of the conference call will also be available via www.LanticRogers.com. About Rogers Sugar
Rogers is a corporation established under the laws of Canada. The Corporation holds all of the common shares of Lantic and its administrative office is in Montréal, Québec. Lantic operates cane sugar refineries in Montreal, Québec and Vancouver, British Columbia, as well as the only Canadian sugar beet processing facility in Taber, Alberta. Lantic also operate a custom blending and packaging operation and distribution center in Toronto, Ontario. Lantic’s sugar products are marketed under the “Lantic” trademark in Eastern Canada, and the “Rogers” trademark in Western Canada and include granulated, icing, cube, yellow and brown sugars, liquid sugars and specialty syrups. Lantic owns all of the common shares of TMTC and its head office is headquartered in Montréal, Québec. TMTC operates bottling plants in Granby, Dégelis and in St-Honoré-de-Shenley, Québec and in Websterville, Vermont. TMTC’s products include maple syrup and derived maple syrup products supplied under retail private label brands in over fifty countries and are sold under various brand names, such as L.B. Maple Treat, Great Northern, Decacer and Highland Sugarworks.
For more information about Rogers please visit our website at www.LanticRogers.com.
Cautionary Statement Regarding forward-looking information
This report contains Statements or information that are or may be “forward-looking statements” or “forward-looking information” within the meaning of applicable Canadian securities laws. Forward-looking statements may include, without limitation, statements and information which reflect the current expectations of the Company with respect to future events and performance. Wherever used, the words “may,” “will,” “should,” “anticipate,” “intend,” “assume,” “expect,” “plan,” “believe,” “estimate,” and similar expressions and the negative of such expressions, identify forward-looking statements.
Although this is not an exhaustive list, Rogers cautions investors that statements concerning the following subjects are, or are likely to be, forward-looking statements:
- future prices of raw sugar
- natural gas costs
- the opening of special refined sugar quotas in the United States (“U.S.”)
- beet production forecasts
- growth of the maple syrup industry
- the status of labour contracts and negotiations
- the level of future dividends
- the status of government regulations and investigations
- the impact of the COVID-19 pandemic on the Corporation and its operations.
Forward-looking statements are based on estimates and assumptions made by Rogers in light of its experience and perception of historical trends, current conditions and expected future developments, as well as other factors that we believe are appropriate and reasonable in the circumstances, including with respect to the continuity of its operations despite the COVID-19 pandemic, but there can be no assurance that such estimates and assumptions will prove to be correct. Forward-looking statements involve known and unknown risks, uncertainties and other factors that may cause actual results or events to differ materially from those anticipated in such forward-looking statements. Actual performance or results could differ materially from those reflected in the forward-looking statements, historical results or current expectations. Readers should also refer to the section “Risks and Uncertainties” of the second quarter MD&A for additional information on risk factors and other events that are not within our control. These risks are also referred to in Rogers Annual Information Form in the “Risk Factors” section.
Although we believe that the expectations and assumptions on which forward-looking information is based are reasonable under the current circumstances, readers are cautioned not to rely unduly on this forward-looking information as no assurance can be given that it will prove to be correct. Forward-looking information contained herein is made as at the date of this press release and Rogers does not undertake any obligation to update or revise any forward-looking information, whether as a result of events or circumstances occurring after the date hereof, unless so required by law.
Cautionary Statement Regarding non-GAAP measures
In analyzing results, we supplement the use of financial measures that are calculated and presented in accordance with IFRS with a number of non-GAAP financial measures. A non-GAAP financial measure is a numerical measure of a company’s performance, financial position or cash flow that excludes (includes) amounts, or is subject to adjustments that have the effect of excluding (including) amounts, that are included (excluded) in most directly comparable measures calculated and presented in accordance with IFRS. Non-GAAP financial measures are not standardized; therefore, it may not be possible to compare these financial measures with the non-GAAP financial measures of other companies having the same or similar businesses. We strongly encourage investors to review the audited consolidated financial statements and publicly filed reports in their entirety, and not to rely on any single financial measure.
We use these non-GAAP financial measures in addition to, and in conjunction with, results presented in accordance with IFRS. These non-GAAP financial measures reflect an additional way of viewing aspects of the operations that, when viewed with the IFRS results and the accompanying reconciliations to corresponding IFRS financial measures, may provide a more complete understanding of factors and trends affecting our business. See “Non-GAAP measures” section at the end of the second quarter MD&A for the current quarter for additional information.
Financial Report Q2 2021
This Management’s Discussion and Analysis (“MD&A”) of Rogers Sugar Inc.’s (“Rogers”, “RSI” or “our,” “we”, “us”) dated May 5, 2021 should be read in conjunction with the unaudited condensed consolidated interim financial statements and related notes for the three- and six-month periods ended April 3, 2021, as well as the audited consolidated financial statements and MD&A for the year ended October 3, 2020. The quarterly unaudited condensed consolidated interim financial statements and any amounts shown in this MD&A were not reviewed nor audited by our external independent auditors. This MD&A refers to Rogers, Lantic Inc. (“Lantic”) (Rogers and Lantic together referred as the “Sugar segment”), The Maple Treat Corporation (“Maple Treat”) and Highland Sugarworks Inc. (“Highland”) (the latter two companies together referred to as “TMTC” or the “Maple segment”).
Management is responsible for preparing the MD&A. This MD&A has been reviewed and approved by the Audit Committee of Rogers and its Board of Directors.
OUR BUSINESS
Rogers has a long history of providing high quality sugar products to the Canadian market and has been operating since 1888.
Lantic, Rogers wholly owned subsidiary, operates cane sugar refineries in Montreal, Québec and Vancouver, British Columbia, as well as the only Canadian sugar beet processing facility in Taber, Alberta. Lantic’s sugar products are marketed under the “Lantic” trademark in Eastern Canada, and the “Rogers” trademark in Western Canada and include granulated, icing, cube, yellow and brown sugars, liquid sugars and specialty syrups. We also operate a custom blending and packaging operation and distribution center in Toronto, Ontario.
Maple Treat operates bottling plants in Granby, Dégelis and in St-Honoré-de-Shenley, Québec and in Websterville, Vermont. Maple Treat’s products include maple syrup and derived maple syrup products supplied under retail private label brands in over fifty countries and are sold under various brand names, such as L.B. Maple Treat, Great Northern, Decacer and Highland Sugarworks.
Our Business has two distinct segments - Sugar – which includes refined sugar and by-products and Maple – which includes maple syrup and maple derived products.
UPDATE ON COVID-19
The ongoing COVID-19 pandemic has negatively impacted the global economy, disrupted financial markets and supply chain, significantly restricted business travel and interrupted business activity.
Our business is considered an essential service by the government and as such, our plants have continued to operate at usual capacity. We have established extensive protection measures and protocols to ensure the health and safety of our employees. COVID-19 could have a material effect on our business as it relates to customer demand, supply and delivery chain, operations, financial market volatility, pension and benefits liabilities and other economic fundamentals. For the second quarter and the first six month of 2021, we incurred direct costs amounting to $0.8 million and $1.8 million respectively in relation to COVID-19. These costs were largely due to increased health and safety measures implemented across all production facilities.
The effect of COVID-19 on our business may continue for an extended period and the ultimate impact will depend on future developments that are uncertain and cannot be predicted, including and without limitations, the duration and severity of the pandemic, the duration of the government support measures, the effectiveness of the actions taken to contain and treat the disease and the length of time it takes for normal economic and operating conditions to resume.
BUSINESS HIGHLIGHTS
- Consolidated adjusted EBITDA for the second quarter of 2021was $21.4 million, up 29.4% from the same quarter last year, driven by higher adjusted EBITDA in both the Sugar and Maple segments in the current quarter. Adjusted EBITDA for the first six months of 2021 was $49.0 million, up 4.9% from the same period in 2020, largely as a result of improved adjusted EBITDA in the Maple segment;
- Adjusted EBITDA in the Sugar segment was $17.0 million in the second quarter, an increase of $3.2 million or 22.8% from the same quarter last year, largely due to higher revenue partly offset by higher operating costs and higher warehousing costs;
- Sales volumes in the Sugar segment increased by 4.9% to 183,749 metric tonnes in the second quarter, as stronger industrial, liquid and export volumes were partly offset by a reduction in consumer volumes;
- As a result of unfavourable weather conditions in October 2020, a portion of the current year’s Taber beet crop was damaged, reducing the quantity and quality of the beet processed in the second quarter of 2021. The issue encountered in fiscal 2021 reduced the expected sugar production from Taber by 9,000 metric tonnes. The current year issue was not as severe as the similar issue encountered in 2020 whereby half of the overall sugar beet crop was lost due to unfavourable weather;
- Adjusted EBITDA in the Maple segment was $4.4 million in the second quarter, an increase of $1.7 million or 63.2% from the same quarter last year as a result of higher customer demand and improved margin;
- Maple segment volumes increased by 10.2% to 14,214 pounds in the quarter, driven by strong demand from retail customers;
- Free cash flow for the trailing 12 months ended April 3, 2021 was $46.7 million, an increase of $11.1 million from the same period last year;
- In the second quarter of 2021, we distributed $0.09 per share to our shareholders for a total amount of $9.3 million;
- On April 30, 2021, Lantic issued $100 million in senior guaranteed Notes under a note purchase agreement as a private placement with certain institutional investors. The proceeds of the issuance were used to repay existing debt. The Notes carry an interest rate of 3.49% and are due on April 30, 2031 with interest payable semi-annually in arrears; and
- On May 5, 2021, the Board of Directors declared a quarterly dividend of $0.09 per share, payable on July 13, 2021.
SELECTED FINANCIAL DATA AND HIGHLIGHTS
| (unaudited) (In thousands of dollars, except volume and per share information) | Q2 2021 | Q2 2020 | YTD 2021 | YTD 2020 | ||||
| Sugar (metric tonnes) | 183,749 | 175,226 | 374,189 | 363,605 | ||||
| Maple syrup (000 pounds) | 14,214 | 12,893 | 29,106 | 25,686 | ||||
| Total revenues | 215,929 | 199,126 | 439,769 | 408,442 | ||||
| Gross Margin | 31,451 | 19,390 | 70,064 | 58,436 | ||||
| Adjusted gross margin(1) | 27,407 | 23,612 | 63,859 | 60,138 | ||||
| Results from operating activities | 19,151 | 6,058 | 42,483 | 32,809 | ||||
| Adjusted results from operating activities(1) | 15,107 | 10,280 | 36,278 | 34,511 | ||||
| Adjusted EBITDA(1) | 21,375 | 16,522 | 49,022 | 46,749 | ||||
| Net earnings | 10,778 | 965 | 24,551 | 16,929 | ||||
| per share (basic) | 0.10 | 0.01 | 0.24 | 0.16 | ||||
| per share (diluted) | 0.10 | 0.01 | 0.23 | 0.16 | ||||
| Adjusted net earnings(1) | 7,751 | 4,036 | 19,999 | 18,134 | ||||
| Adjusted net earnings per share (basic)(1) | 0.07 | 0.04 | 0.19 | 0.17 | ||||
| Trailing twelve months free cash flow(1) | 46,670 | 35,588 | 46,670 | 35,588 | ||||
| Dividends per share | 0.09 | 0.09 | 0.18 | 0.18 | ||||
| (1) See “Non-GAAP Measures” section for definition and reconciliation to GAAP measures. | ||||||||
Revenue and Adjusted EBITDA: https://www.globenewswire.com/NewsRoom/AttachmentNg/80311927-e0b5-46e1-b136-7c34890e0a2f
Adjusted Net Earnings and Free Cash Flow TTM: https://www.globenewswire.com/NewsRoom/AttachmentNg/c3c97675-3081-4ecf-99e0-65f7173b87d9
Adjusted results
In the normal course of business, we use derivative financial instruments consisting of sugar futures, foreign exchange forward contracts, natural gas futures and interest rate swaps. We have designated our natural gas futures and our interest rate swap agreements entered into in order to protect us against natural gas prices and interest rate fluctuations as cash flow hedges. Derivative financial instruments pertaining to sugar futures and foreign exchange forward contracts are marked-to-market at each reporting date and are charged to the consolidated statement of earnings. The unrealized gains/losses related to natural gas futures and interest rate swaps are accounted for in other comprehensive income. The amount recognized in other comprehensive income is removed and included in net earnings under the same line item in the consolidated statement of earnings and comprehensive income as the hedged item, in the same period that the hedged cash flows affect net earnings, reducing earnings volatility related to the movements of the valuation of these derivatives hedging instruments.
We believe that our financial results are more meaningful to management, investors, analysts, and any other interested parties when financial results are adjusted by the gains/losses from financial derivative instruments. These adjusted financial results provide a more complete understanding of factors and trends affecting our business. This measurement is a non-GAAP measurement. See “Non-GAAP measures” section.
We use the non-GAAP adjusted results of the operating company to measure and to evaluate the performance of the business through our adjusted gross margin, adjusted results from operating activities, adjusted EBITDA, adjusted net earnings, adjusted net earnings per share and trailing twelve months free cash flow. In addition, we believe that these measures are important to our investors and parties evaluating our performance and comparing such performance to past results. We also use adjusted gross margin, adjusted EBITDA, adjusted results from operating activities and adjusted net earnings when discussing results with the Board of Directors, analysts, investors, banks and other interested parties. See “Non-GAAP measures” section.
OUR RESULTS ARE ADJUSTED AS FOLLOWS:
| Income (loss)(In thousands of dollars) | Q2 2021 | Q2 2020 | ||||||||
| Sugar | Maple Products | Total | Sugar | Maple Products | Total | |||||
| Mark-to-market on: | ||||||||||
| Sugar futures contracts | 1,462 | - | 1,462 | (2,825 | ) | - | (2,825 | ) | ||
| Foreign exchange forward contracts | 526 | 794 | 1,320 | (991 | ) | (1,258 | ) | (2,249 | ) | |
| Total mark-to-market adjustment on derivatives | 1,988 | 794 | 2,782 | (3,816 | ) | (1,258 | ) | (5,074 | ) | |
| Cumulative timing differences | 2,642 | (1,380 | ) | 1,262 | 1,255 | (418 | ) | 837 | ||
| Adjustment to cost of sales | 4,630 | (586 | ) | 4,044 | (2,561 | ) | (1,676 | ) | (4,237 | ) |
| Amortization of transitional balance to cost of sales and changes in fair value of expired contracts for cash flow hedges | - | - | - | 15 | - | 15 | ||||
| Total adjustment to costs of sales | 4,630 | (586 | ) | 4,044 | (2,546 | ) | (1,676 | ) | (4,222 | ) |
| Income (loss)(In thousands of dollars) | YTD 2021 | YTD 2020 | |||||||||
| Sugar | Maple Products | Total | Sugar | Maple Products | Total | ||||||
| Mark-to-market on: | |||||||||||
| Sugar futures contracts | 1,041 | - | 1,041 | (337 | ) | - | (337 | ) | |||
| Foreign exchange forward contracts | 3,823 | 1,892 | 5,715 | (1,522 | ) | (1,003 | ) | (2,525 | ) | ||
| Total mark-to-market adjustment on derivatives | 4,864 | 1,892 | 6,756 | (1,859 | ) | (1,003 | ) | (2,862 | ) | ||
| Cumulative timing differences | 1,411 | (1,962 | ) | (551 | ) | 1,745 | (607 | ) | 1,138 | ||
| Adjustment to cost of sales | 6,275 | (70 | ) | 6,205 | (114 | ) | (1,610 | ) | (1,724 | ) | |
| Amortization of transitional balance to cost of sales and changes in fair value of expired contracts for cash flow hedges | - | - | - | 22 | - | 22 | |||||
| Total adjustment to costs of sales | 6,275 | (70 | ) | 6,205 | (92 | ) | (1,610 | ) | (1,702 | ) | |
Fluctuations in the mark-to-market adjustment on derivatives are due to the price movements in #11 world raw sugar and foreign exchange variations.
We recognize cumulative timing differences, as a result of mark-to-market gains or losses, only when sugar is sold to a customer. The gains or losses on sugar and related foreign exchange paper transactions are largely offset by corresponding gains or losses from the physical transactions, namely sale and purchase contracts with customers and suppliers.
The above described adjustments are added to or deducted from the mark-to-market results to arrive at the total adjustment to cost of sales. For the three- and six-months periods ended on April 3, 2021, the total cost of sales adjustment is a gain of $4.0 million and $6.2 million, respectively, to be deducted from the consolidated results versus a loss of $4.2 million and $1.7 million to be added to the consolidated results for the comparable periods last year, respectively.
See the “Non-GAAP measures” section for more information on these adjustments.
SEGMENTED INFORMATION
| Segmented Results (In thousands of dollars) | Q2 2021 | Q2 2020 | |||||||
| Sugar | Maple Products | Total | Sugar | Maple Products | Total | ||||
| Revenues | 155,961 | 59,968 | 215,929 | 143,609 | 55,517 | 199,126 | |||
| Gross margin | 26,423 | 5,028 | 31,451 | 16,664 | 2,726 | 19,390 | |||
| Administration and selling expenses | 5,771 | 2,185 | 7,956 | 5,577 | 2,883 | 8,460 | |||
| Distribution costs | 3,623 | 721 | 4,344 | 3,997 | 875 | 4,872 | |||
| Results from operating activities | 17,029 | 2,122 | 19,151 | 7,090 | (1,032 | ) | 6,058 | ||
| Adjustment to cost of sales(2) | (4,630 | ) | 586 | (4,044 | ) | 2,546 | 1,676 | 4,222 | |
| Adjusted Gross margin(1) | 21,793 | 5,614 | 27,407 | 19,210 | 4,402 | 23,612 | |||
| Adjusted results from operating activities(1) | 12,399 | 2,708 | 15,107 | 9,636 | 644 | 10,280 | |||
| Adjusted EBITDA(1) | 17,010 | 4,365 | 21,375 | 13,847 | 2,675 | 16,522 | |||
| Additional information: | |||||||||
| Addition to property, plant and equipment, intangible assets, and right-of-use assets | 6,905 | 367 | 7,272 | 4,267 | 2,250 | 6,517 | |||
| (1) See “Non-GAAP Measures” section for definition and reconciliation to GAAP measures | |||||||||
| (2) See “Adjusted results” section | |||||||||
| Segmented Results (In thousands of dollars) | YTD 2021 | YTD 2020 | ||||||
| Sugar | Maple Products | Total | Sugar | Maple Products | Total | |||
| Revenues | 315,419 | 124,350 | 439,769 | 298,424 | 110,018 | 408,442 | ||
| Gross margin | 58,764 | 11,300 | 70,064 | 49,893 | 8,543 | 58,436 | ||
| Administration and selling expenses | 13,039 | 4,515 | 17,554 | 11,148 | 5,582 | 16,730 | ||
| Distribution costs | 8,692 | 1,334 | 10,027 | 7,225 | 1,672 | 8,897 | ||
| Results from operating activities | 37,033 | 5,450 | 42,483 | 31,520 | 1,289 | 32,809 | ||
| Adjustment to cost of sales(2) | (6,275 | ) | 70 | (6,205 | ) | 92 | 1,610 | 1,702 |
| Adjusted Gross margin(1) | 52,489 | 11,370 | 63,859 | 49,985 | 10,153 | 60,138 | ||
| Adjusted results from operating activities(1) | 30,758 | 5,520 | 36,278 | 31,612 | 2,899 | 34,511 | ||
| Adjusted EBITDA(1) | 39,741 | 9,281 | 49,022 | 39,967 | 6,782 | 46,749 | ||
| Additional information: | ||||||||
| Addition to property, plant and equipment, intangible assets, and right-of-use assets | 13,348 | 478 | 13,826 | 8,569 | 12,922 | 21,491 | ||
| (1) See “Non-GAAP Measures” section for definition and reconciliation to GAAP measures | ||||||||
| (2) See “Adjusted results” section | ||||||||
Sugar
REVENUES
| Q2 2021 | Q2 2020 | ∆ | YTD 2021 | YTD 2020 | ∆ | |
| (In thousands of dollars) | 155,961 | 143,609 | 12,352 | 315,419 | 298,424 | 16,995 |
Sugar Volume Variance and Sugar Volumes: https://www.globenewswire.com/NewsRoom/AttachmentNg/f88f87f0-c632-4491-8f5a-566bb72c9fc2
In the second quarter and first six months of fiscal 2021, revenue increased by 8.6% and 5.7% respectively, compared to the same periods last year driven by higher volumes and increased pricing.
Sugar volume increased by 4.9% in the second quarter 2021 compared to the same quarter last year as stronger industrial, liquid and export volumes were partly offset by a reduction in consumer volumes.
- Export volumes contributed the largest increase in the quarter, largely due to higher beet sugar sales to the United States in 2021 under the Canadian United States Mexico Agreement quota (“CUSMA”).
- Total domestic volume remained largely unchanged; however, we experienced a shift between the industrial, consumer and liquid segments. Industrial and liquid volumes increased compared to last year as customer demand remained firm and delayed industrial orders from the first quarter were filled in the second quarter. In the second quarter, consumer volumes lowered, returning closer to pre-COVID levels as consumer pantry loading reduced compared to last year resulting in retailers holding higher inventory levels than expected.
In the first six months of 2021, sugar volume totaled 374,189 metric tonnes, an increase of 2.9% compared to the same period last year, as stronger liquid and export volumes were partly offset by a reduction in industrial and consumer volumes.
- Export volumes also contributed the largest increase in the first six months of 2021, largely due to higher beet sugar sales to the United States under the CUSMA quota.
- Domestic volumes remained overall consistent as compared to last year. However, we experienced a shift between the industrial, consumer and liquid segments. The reduction in the industrial volume was due to the volatility in demand related to COVID-19, while the increase in the liquid volume was due to higher volume from new and existing customers. Finally, we noted that the retail consumer volumes returned closer to pre-COVID levels in the second quarter of 2021, as explained above.
GROSS MARGIN
| Q2 2021 | Q2 2020 | ∆ | YTD 2021 | YTD 2020 | ∆ | |||||
| (In thousands of dollars, except per metric tonne information) | ||||||||||
| Gross margin | 26,423 | 16,664 | 9,759 | 58,764 | 49,893 | 8,871 | ||||
| Total adjustment to cost of sales(2) | (4,630 | ) | 2,546 | (7,176 | ) | (6,275 | ) | 92 | (6,367 | ) |
| Adjusted gross margin(1) | 21,793 | 19,210 | 2,583 | 52,489 | 49,985 | 2,504 | ||||
| Adjusted gross margin per metric tonne(1) | 118.60 | 109.63 | 8.97 | 140.27 | 137.47 | 2.80 | ||||
| Included in Gross margin:Depreciation of property, plant and equipment and right-of-use assets | 3,799 | 3,744 | 55 | 7,575 | 7,422 | 15 | ||||
| (1) See “Non-GAAP Measures” section for definition and reconciliation to GAAP measures | ||||||||||
| (2) See “Adjusted results” section | ||||||||||
Gross margins were $26.4 million and $58.8 million for the three and six months ended April 3, 2021 and include a gain of $4.6 and $6.3 million, respectively, for the mark-to-market of derivative financial instruments. For the same periods last year, gross margins were $16.7 million and $49.9 million, respectively, with a mark-to-market loss of $2.5 million and $0.1 million.
Adjusted gross margin was $21.8 million and $52.5 million for the second quarter and for the first six months of 2021, respectively, as compared to $19.2 million and $50.0 million in the same periods of 2020.
Adjusted gross margin increased by $2.6 million in the current quarter compared to the same quarter last year mainly as a result of higher sugar sales margin of $1.2 million and increased by-product net contribution of $2.9 million. This favourable variance was partially offset by higher processing costs of $1.5 million. The higher costs were related to the Vancouver plant and were mainly due to a variation in the mix of products sold resulting from the transfer of production from Taber to Vancouver. The transfer of production was necessary to mitigate supply issues at the Taber facility. On a per unit basis, adjusted gross margin for the second quarter was at $118.60 per metric tonnes, higher that last year by $8.97 per metric tonnes. The increase was mainly due to higher volume in the current year, reflecting higher customer demand and increased pricing in 2021 compared to 2020.
As a result of unfavourable weather conditions in October 2020, a portion of the current year’s Taber beet crop was damaged, reducing the quantity and quality of the beet processed in the second quarter of 2021. The issue encountered in fiscal 2021 reduced the expected sugar production from Taber by 9,000 metric tonnes. The current year issue was not as severe as the similar issue encountered in 2020 whereby half of the overall sugar beet crop was lost due to unfavourable weather. In both fiscal years, we continued to meet customer demand, despite the uncontrollable crop issues as our Vancouver cane sugar facility was used to backfill the shortfall from the Taber facility. The direct impact on adjusted gross margin of the crop shortfall on the Taber operations is expected to amount to $ 4.0 million in 2021. In connection with this issue, $2.1 million was recognized in the second quarter of 2021.
Adjusted gross margin for the first six months of 2021 was $2.5 million higher than the comparable period last year, mainly due to higher adjusted gross margin in the second quarter of 2021, as explained above. On a per unit basis, for the first six months of 2021, adjusted gross margin amounted to $140.27 per metric tonnes compared to $137.47 per metric tonnes. The variance of $2.80 per metric tonnes was due to the issue mentioned above’ partially offset by higher contribution in the first quarter of 2020 compared to 2021.
Adjusted Gross Margin: https://www.globenewswire.com/NewsRoom/AttachmentNg/25eb7f26-8b74-4bf6-b653-ade5013ccfb2
OTHER EXPENSES
| Q2 2021 | Q2 2020 | ∆ | YTD 2021 | YTD 2020 | ∆ | ||
| (In thousands of dollars) | |||||||
| Administration and selling expenses | 5,771 | 5,577 | 194 | 13,039 | 11,148 | 1,891 | |
| Distribution costs | 3,623 | 3,997 | (374 | ) | 8,692 | 7,225 | 1,467 |
| Included in Administration and selling expenses:Depreciation of property, plant and equipment and right-of-use assets | 405 | 210 | 195 | 627 | 419 | 208 | |
| Included in Distribution costs:Depreciation of right-of-use assets | 407 | 257 | 150 | 781 | 514 | 267 | |
In the second quarter, administration and selling expenses remained largely unchanged compared to the same quarter last year, with both periods including direct expenditures related to COVID-19 health and safety costs. Due to the timing of the COVID-19 pandemic, the impact was lower in the second quarter of 2020; however, the current quarter also includes the recognition of prior-period government support in relation to various programs, including tax credits. Distribution costs decreased by 9.4% as costs associated with reconfiguring our supply chain to compensate for the crop shortfall this quarter were lower compared the same quarter last year.
For the first six months of 2021, administration and selling expenses were $1.9 million higher than the comparable period last year, mainly due to incremental COVID-19 related cost of $1.8 million incurred in the first two quarters of 2021. Distribution cost increased by $1.5 million compared to the first six months of 2020 largely driven by additional logistical costs incurred to support our supply chain in the first quarter of 2021 as strong demand in the fourth quarter of fiscal 2020 resulted in lower than typical inventory levels at the beginning of fiscal year 2021.
RESULTS FROM OPERATING ACTIVITIES AND ADJUSTED EBITDA
| Q2 2021 | Q2 2020 | ∆ | YTD 2021 | YTD 2020 | ∆ | |||||
| (In thousands of dollars) | ||||||||||
| Results from operating activities | 17,029 | 7,090 | 9,939 | 37,033 | 31,520 | 5,513 | ||||
| Total adjustment to cost of sales (2) | (4,630 | ) | 2,546 | (7,176 | ) | (6,275 | ) | 92 | (6,367 | ) |
| Adjusted results from operating activities(1) | 12,399 | 9,636 | 2,763 | 30,758 | 31,612 | (854 | ) | |||
| Depreciation of property, plant and equipment, right-of-use assets, and amortization of intangible assets | 4,611 | 4,211 | 400 | 8,983 | 8,355 | 628 | ||||
| Adjusted EBITDA(1) | 17,010 | 13,847 | 3,163 | 39,741 | 39,967 | (226 | ) | |||
| (1) See “Non-GAAP Measures” section for definition and reconciliation to GAAP measures | ||||||||||
| (2) See “Adjusted results” section | ||||||||||
Results from operating activities for the second quarter and the first six months of 2021 were $17.0 million and $37.0 million respectively, an increase from $7.1 million and $31.5 million in the same periods last year. These results include gains and losses from the mark-to-market of derivative financial instruments, as well as timing differences in the recognition of any gains and losses on the liquidation of derivative instruments. In addition, non-cash depreciation and amortization expense also had a negative impact on the results from operating activities.
Adjusted results from operating activities in the second quarter of 2021 were $2.8 million higher than the same period last year, mainly due to higher adjusted gross margin as explained above. Adjusted results from operating activities for the first six months of 2021 were $0.9 million lower than the same period last year as higher adjusted gross margin was offset by higher distribution costs and administration and selling expenses.
Adjusted EBITDA for the second quarter increased by $3.2 million compared to the same period last year, largely as a result of higher adjusted gross margin. Adjusted EBITDA for the first six months was largely unchanged compared to the same period last year as higher EBITDA in the second quarter of 2021 compensated for the lower EBITDA in the first quarter of 2021, mainly explained by higher distribution costs and administration and selling expenses.
Maple Products
REVENUES
| Q2 2021 | Q2 2020 | ∆ | YTD 2021 | YTD 2020 | ∆ | |
| (In thousands of dollars, except volume) | ||||||
| Volume (000 pounds) | 14,214 | 12,893 | 1,321 | 29,106 | 25,686 | 3,420 |
| Revenues | 59,968 | 55,517 | 4,451 | 124,350 | 110,018 | 14,332 |
Maple Volumes and Adjusted Gross Margin: https://www.globenewswire.com/NewsRoom/AttachmentNg/f6198030-7610-43f9-afd9-bf0582044d95
Revenues for the second quarter and the first six month of the current fiscal year were $4.5 million and $14.3 million higher than the same periods last year due to ongoing strong demand driven partially by the COVID-19 pandemic and an aggressive sales and marketing strategy.
GROSS MARGIN
| Q2 2021 | Q2 2020 | ∆ | YTD 2021 | YTD 2020 | ∆ | |||||||
| (In thousands of dollars, except adjusted gross margin rate information) | ||||||||||||
| Gross margin | 5,028 | 2,726 | 2,302 | 11,300 | 8,543 | 2,757 | ||||||
| Total adjustment to cost of sales(2) | 586 | 1,676 | (1,090 | ) | 70 | 1,610 | (1,540 | ) | ||||
| Adjusted gross margin(1) | 5,614 | 4,402 | 1,212 | 11,370 | 10,153 | 1,217 | ||||||
| Adjusted gross margin percentage(1) | 9.4 | % | 7.9 | % | 1.5 | % | 9.1 | % | 9.2 | % | (0.1 | )% |
| Included in Gross margin:Depreciation of property, plant and equipment and right-of-use assets | 785 | 786 | (11 | ) | 1,767 | 1,489 | 278 | |||||
| (1) See “Non-GAAP Measures” section for definition and reconciliation to GAAP measures | ||||||||||||
| (2) See “Adjusted results” section | ||||||||||||
Gross margin was $5.0 million and $11.3 million for the three and six months ended in the current fiscal year and include a loss of $0.6 and $0.1 million, respectively, for the mark-to-market of derivative financial instruments. For the same periods last year, gross margin was $2.7 million and $8.5 million, respectively, with a mark-to-market loss of $1.7 million and $1.6 million.
Adjusted gross margin for the current quarter was $1.2 million higher than the comparable period last year, driven by a combination of lower costs from improved operational efficiency and higher sales margin from sustained marketing efforts. Improved profitability was also reflected in our adjusted gross margin percentage, increasing by 150 basis points to 9.4% in the current quarter, up from 7.9% in the same quarter last year.
Adjusted gross margin was $1.2 million higher for the first six months of 2021 compared to last year, driven by the increase in adjusted gross margin in Q2 2021 as explained above.
Other expenses
| Q2 2021 | Q2 2020 | ∆ | YTD 2021 | YTD 2020 | ∆ | |||
| (In thousands of dollars) | ||||||||
| Administration and selling expenses | 2,185 | 2,883 | (698 | ) | 4,515 | 5,582 | (1,067 | ) |
| Distribution costs | 721 | 875 | (154 | ) | 1,334 | 1,672 | (338 | ) |
| Included in Administration and selling expenses:Amortization of intangible assets | 872 | 875 | 7 | 1,747 | 1,750 | (3 | ) | |
Administration and selling expenses were $0.7 million and $1.1 million lower than the second quarter and the first six months of last year, respectively, due to a reduction of sales and marketing expenses related to trade shows and promotions as well as lower employee compensation and benefits costs. Distribution costs decreased by $0.2 million and $0.3 million compared to the second quarter and the first six months of last year, respectively, largely driven by a reduction in net freight costs from favourable negotiated agreements.
RESULTS FROM OPERATING ACTIVITIES AND ADJUSTED EBITDA
| Q2 2021 | Q2 2020 | ∆ | YTD 2021 | YTD 2020 | ∆ | ||||
| (In thousands of dollars) | |||||||||
| Results from operating activities | 2,122 | (1,032 | ) | 3,154 | 5,450 | 1,289 | 4,162 | ||
| Total adjustment to cost of sales(2) | 586 | 1,676 | (1,090 | ) | 70 | 1,610 | (1,540 | ) | |
| Adjusted results from operating activities(1) | 2,708 | 644 | 2,064 | 5,520 | 2,899 | 2,621 | |||
| Non-recurring expenses: | |||||||||
| Other one-time non-recurring items | - | 370 | (370 | ) | 247 | 644 | (397 | ) | |
| Depreciation and amortization | 1,657 | 1,661 | (4 | ) | 3,514 | 3,239 | 275 | ||
| Adjusted EBITDA(1) | 4,365 | 2,675 | 1,690 | 9,281 | 6,782 | 2,499 | |||
| (1) See “Non-GAAP Measures” section for definition and reconciliation to GAAP measures | |||||||||
| (2) See “Adjusted results” section | |||||||||
Results from operating activities for the second quarter and the first six months of 2021 were $2.1 million and $5.5 million respectively, compared to $(1.0) million and $1.3 million in the same periods last year. These results include gains and losses from the mark-to-market of derivative financial instruments, as well as timing differences in the recognition of any gains and losses on the liquidation of derivative instruments.
Certain non-cash items and non-recurring expenses had an impact on the results from operating activities. As such, Management believes that the Maple segment’s financial results are more meaningful to management, investors, analysts, and any other interested parties when financial results are adjusted for the above-mentioned items. Other non recurrent items in the second quarter and the first six months of 2020 were mainly costs associated with having two locations in Granby.
Adjusted results from operating activities for the current quarter and the first six months of 2021 were $2.1 million and $2.6 million higher than the comparable periods last year, due to increased adjusted gross margin and lower administration and selling expenses as well as lower distribution costs, as explained above.
Adjusted EBITDA for the second quarter and the first six months of fiscal 2021 increased by $1.7 million and $2.5 million, respectively due to higher adjusted gross margins and lower administration and selling expenses as well as lower distribution cost, as explained above.
OUTLOOK
The health and safety of our employees remains our top priority. We are closely following all COVID-19 public health authority recommendations and have enhanced safety protocols in place. To date our plants have operated without any disruption during the COVID-19 pandemic; however, the uncertainty and increased demand volatility make it difficult to estimate the impact on future sale volumes, operations and financial results. We are closely monitoring the situation and will continue to adapt quickly to the changing circumstances.
We remain optimistic for the outlook of both the Sugar and Maple segments in fiscal 2021, despite of market uncertainty and additional costs related to the COVID-19 pandemic. Regardless of an additional week of operations in fiscal 2020, we anticipate volumes to exceed prior year levels in both segments, which is expected to result in improved financial performance for 2021 compared to 2020. Fiscal 2021 has 52 weeks of operations while 2020 had 53 weeks, providing additional volumes in fiscal 2020 of approximately 14,000 metric tonnes for the Sugar Segment and 1,000,000 lbs for the Maple Segment.
Sugar
Our full year fiscal 2021 sales volumes guidance remains unchanged at approximately 776,000 metric tonnes, an increase of 15,000 metric tonnes over fiscal 2020, despite the impact of the crop shortfall in Taber, and an extra week of operations in 2020. We continue to expect our Sugar segment to achieve improved financial performance in fiscal 2021over fiscal 2020.
- Industrial and liquid volumes are expected to increase by approximately 15,000 metric tonnes in 2021, due to the addition of new liquid customers.
- Consumer volumes are expected to decrease by 5,000 metric tonnes in 2021 as the effect of COVID-19 on the retail market subsides in the later part of the current year.
- Export volumes are expected to increase by approximately 5,000 metric tonnes driven by new export quotas including the CUSMA special quotas that took effect on July 1, 2020.
The 2021 adjusted EBITDA for the Sugar segment is expected to benefit from the increase in beet sugar production at the Taber facility as compared to last year. Our 2020 beet harvest campaign was completed, despite weather-related crop losses, with an estimated production of 119,000 metric tonne of beet sugar, approximately 9,000 metric tonnes lower than expected; still 48,000 metric tonnes higher that last year.
Maintenance programs for the remaining quarters of 2021 are expected to follow the trend of previous years for each facility. For the remainder of 2021, we expect distribution costs to be lower than last year as the impact of the current year crop shortfall in Taber was not as severe as last year’s crop issue, requiring less backfill of customer orders from our Vancouver facility.
Our capital spending expectation for the year is between $20 million and $25 million, with approximately a quarter of these funds allocated to return-on-investment projects.
We are continuing to work with our strategic partner, Doux-Matok, to advance a unique sugar reduction solution based on cane sugar to food companies in North America. Although this is a small portion of the sweetener market, we believe this could provide a competitive offering in this niche market.
Maple Products
We expect to see ongoing strong performance in our Maple segment in fiscal 2021. The improvements in sales margins and increased operational efficiencies evident in the first six months, are expected to continue throughout the year. Sales margins are expected to improve as the impact of successful contract negotiations with new and existing customers are coming into effect gradually. In addition, we expect the ongoing optimization at our manufacturing facilities and efficiency improvements at our new Granby facility and existing Dégelis plant to continue to drive lower operating costs in 2021.
While we expect the COVID-19 related demand we have seen over the past few quarters to temper in the second half of 2021, we expect that firm underlying demand for maple syrup, combined with our improved margins and lower cost structure will result in improved financial performance for fiscal 2021, compared to 2020.
Capital investments are expected to be significantly lower for the Maple segment in 2021, following the completion of our capital projects in 2020 and the resulting increase in our production capacity.
See “Forward Looking Statements” section and “Risks and Uncertainties” section.
CONSOLIDATED RESULTS AND SELECTED FINANCIAL INFORMATION
| Q2 2021 | Q2 2020 | YTD 2021 | YTD 2020 | ||
| (unaudited)(In thousands of dollars, except volume and per share information) | |||||
| Sugar (metric tonnes) | 183,749 | 175,226 | 374,189 | 363,605 | |
| Maple syrup (000 pounds) | 14,214 | 12,893 | 29,106 | 25,686 | |
| Total revenues | 215,929 | 199,126 | 439,769 | 408,442 | |
| Gross margin | 31,451 | 19,390 | 70,064 | 58,436 | |
| Adjusted Gross Margin(1) | 27,407 | 23,612 | 63,859 | 60,138 | |
| Results from operating activities | 19,151 | 6,058 | 42,483 | 32,809 | |
| Adjusted results from operating activities(1) | 15,107 | 10,280 | 36,278 | 34,511 | |
| Adjusted EBITDA(1) | 21,375 | 16,522 | 49,022 | 46,749 | |
| Net finance costs | 4,383 | 4,504 | 9,079 | 9,385 | |
| Income tax expense | 3,990 | 589 | 8,853 | 6,495 | |
| Net earnings | 10,778 | 965 | 24,551 | 16,929 | |
| per share (basic) | 0.10 | 0.01 | 0.24 | 0.16 | |
| per share (diluted) | 0.10 | 0.01 | 0.23 | 0.16 | |
| Adjusted net earnings(1) | 7,751 | 4,036 | 19,999 | 18,134 | |
| per share (basic)(1) | 0.07 | 0.04 | 0.19 | 0.17 | |
| Dividends per share | 0.09 | 0.09 | 0.18 | 0.18 | |
| (1) See “Non-GAAP Measures” section for definition and reconciliation to GAAP measures | |||||
Total revenues
Revenues increased by $16.8 million and $31.3 million for the second quarter and for the first six months of 2021, respectively versus comparable periods last year. Revenue increased due to increased sales volumes and higher prices in both the Sugar and Maple products segments.
Gross margin
Excluding the mark-to-market of derivative financial instruments, adjusted gross margin for the second quarter of the current year increased by $3.8 million, which is mainly explained by an increase in adjusted gross margin rate for both segments. For the Sugar segment, the adjusted gross margin per metric tonnes was higher by $8.97 per metric tonnes, due to higher sales volume and improved sales margins. For the Maple segment, the adjusted gross margin percentage was higher by 1.5% mainly due to improved sales margins and lower costs.
For the first six months of 2021, adjusted gross margin was $3.7 million higher than the first half of fiscal 2020 mainly driven by the increase in the second quarter of 2021, as explained above.
Results from operating activities
Excluding the mark-to-market of derivative financial instruments, adjusted results from operating activities for the current quarter amounted to $15.1 million compared to $10.3 million in the same quarter last year, an increase of $4.8 million. For the first six months of 2021, adjusted results from operating activities were $36.3 million compared to $34.5 million, representing an increase of $1.8 million. The improvement in both periods was mainly driven by higher contribution from both segments in the current quarter and by higher results from the Maple segment in the first half of 2021; partially offset by lower results from the Sugar segment.
Net finance costs
| Q2 2021 | Q2 2020 | ∆ | YTD 2021 | YTD 2020 | ∆ | |||
| (In thousands of dollars) | ||||||||
| Interest expense on convertible unsecured subordinated debentures | 2,102 | 2,073 | 29 | 4,140 | 4,171 | (31 | ) | |
| Interest on revolving credit facility | 1,644 | 1,829 | (185 | ) | 3,356 | 3,529 | (173 | ) |
| Amortization of deferred financing fees | 297 | 297 | - | 593 | 593 | - | ||
| Other interest expense | 340 | 305 | 35 | 990 | 1,092 | (102 | ) | |
| Net finance costs | 4,383 | 4,504 | (121 | ) | 9,079 | 9,385 | (306 | ) |
Net finance costs consisted of interest paid under the revolving credit facility, as well as interest expense on the convertible unsecured subordinated debentures and other interest.
For the second quarter and first six months of the current year, net finance costs were $0.1 million and $0.3 million lower than the comparable periods last year, respectively, which is mainly due to lower interest rate on the revolving credit facility partially offset by higher average balance of the outstanding amount under this facility.
Other interest expense pertains mainly to interest payable to the Producteurs et Productrices Acericoles du Quebec (“PPAQ”) on syrup purchases, in accordance with the PPAQ payment terms and interest accretion on discounted lease obligations.
Taxation
| Q2 2021 | Q2 2020 | ∆ | YTD 2021 | YTD 2020 | ∆ | ||||
| (In thousands of dollars) | |||||||||
| Current | 3,479 | 2,874 | 605 | 8,255 | 8,304 | (49 | ) | ||
| Deferred | 511 | (2,285 | ) | 2,796 | 598 | (1,809 | ) | 2,407 | |
| Income tax expense | 3,990 | 589 | 3,401 | 8,853 | 6,495 | 2,358 | |||
The variation in current and deferred tax expense period-over-period is consistent with the variation in earnings before income taxes in fiscal 2021.
Deferred income taxes reflect temporary differences, which result primarily from the difference between depreciation claimed for tax purposes and depreciation amounts recognized for financial reporting purposes, employee future benefits and derivative financial instruments. Deferred income tax assets and liabilities are measured using the enacted or substantively enacted tax rates anticipated to apply to income in the years in which temporary differences are expected to be realized or reversed. The effect of a change in income tax rates on future income taxes is recognized in income in the period in which the change occurs.
Net earnings
Net earnings in the second quarter and for the first six months fiscal 2021 were $9.8 million and $7.6 million higher than the comparative periods of fiscal 2020, respectively. Net earnings increased largely as a result of the after-tax impact of the period-over-period variation of the gains and losses on the mark-to-market of derivative financial instruments and an increase in results from operating activities for both segments in the second quarter and the first six months of 2021.
Summary of Quarterly Results
The following is a summary of selected financial information of the unaudited condensed consolidated interim financial statements and non-GAAP measures of the Company for the last eight quarters:
| (In thousands of dollars, except for volume and per share information) | QUARTERS(2) (3) | |||||||||||||||
| 2021 | 2020 | 2019 | ||||||||||||||
| Second | First | Fourth | Third | Second | First | Fourth | Third | |||||||||
| Sugar Volume (MT) | 183,749 | 190,440 | 225,396 | 172,054 | 175,226 | 188,379 | 196,903 | 180,824 | ||||||||
| Maple products volume (000 pounds) | 14,214 | 14,892 | 13,181 | 14,313 | 12,893 | 12,792 | 10,163 | 9,325 | ||||||||
| Total revenues | 215,929 | 223,840 | 246,212 | 206,147 | 199,126 | 209,316 | 207,572 | 191,448 | ||||||||
| Gross margin | 31,451 | 38,613 | 37,890 | 29,873 | 19,390 | 39,046 | 29,073 | 30,741 | ||||||||
| Adjusted gross margin(1) | 27,407 | 36,452 | 40,065 | 25,915 | 23,612 | 36,526 | 29,026 | 26,231 | ||||||||
| Results from operations | 19,151 | 23,332 | 22,829 | 12,372 | 6,058 | 26,751 | (32,800 | ) | 18,570 | |||||||
| Adjusted results from operations(1) | 15,107 | 21,171 | 25,004 | 8,414 | 10,280 | 24,231 | 17,153 | 14,060 | ||||||||
| Adjusted EBITDA | 21,375 | 27,647 | 31,231 | 14,279 | 16,522 | 30,227 | 22,215 | 18,792 | ||||||||
| Net earnings (loss) | 10,778 | 13,773 | 12,952 | 5,538 | 965 | 15,964 | (40,021 | ) | 10,432 | |||||||
| Per share - basic | 0.10 | 0.13 | 0.13 | 0.05 | 0.01 | 0.15 | (0.38 | ) | 0.10 | |||||||
| Per share - diluted | 0.10 | 0.13 | 0.12 | 0.05 | 0.01 | 0.14 | (0.38 | ) | 0.10 | |||||||
| Adjusted net earnings(1) | 7,751 | 12,248 | 14,551 | 2,560 | 4,036 | 14,098 | 9,910 | 7,033 | ||||||||
| Per share - basic | 0.07 | 0.12 | 0.14 | 0.02 | 0.04 | 0.13 | 0.09 | 0.07 | ||||||||
| Per share - diluted | 0.07 | 0.11 | 0.14 | 0.02 | 0.04 | 0.13 | 0.09 | 0.07 | ||||||||
| Sugar - Adjusted gross margin rate per MT(1) | 118,60 | 161.18 | 157.51 | 120.45 | 109.63 | 163.37 | 123.71 | 116.97 | ||||||||
| Maple - Adjusted gross margin percentage(1) | 9.4 | % | 8.9 | % | 7.90 | % | 8.40 | % | 7.90 | % | 10.6 | % | 9.70 | % | 11.20 | % |
| (1) See “Non-GAAP Measures” section for definition and reconciliation to GAAP measures | ||||||||||||||||
| (2) All quarters are 13 weeks with the exception of the fourth quarter of 2020 which is 14 weeks | ||||||||||||||||
| (3) The first and second quarters of 2021 and the 2020 quarters results include the impacts from the adoption of IFRS 16 Leases as discussed in note 3 (h) of the 2020 audited consolidated financial statements. As is permitted with this new standard, comparative information has not been restated and, therefore, may not be comparable | ||||||||||||||||
Historically the first quarter (October to December) of the fiscal year is the best quarter of the sugar segment for adjusted gross margins and adjusted net earnings due to the favourable sales mix associated with an increased proportion of consumer sales during that period of the year. At the same time, the second quarter (January to March) historically has the lowest volume as well as an unfavourable customer mix, resulting in lower revenues, adjusted gross margins and adjusted net earnings. The historical trend for adjusted gross margin and adjusted net earnings was different for the last three quarters of 2020 and for the two quarters of 2021 due to the volatility in customer volumes related to COVID-19.
Usually, there is minimal seasonality in the Maple products segment. However, for the last two quarters of 2020 and the two quarters of 2021, we experienced higher sales volume partially attributable to increased demand from COVID-19.
Financial condition
| (In thousands of dollars) | April 3, 2021 | March 28, 2020 | October 3, 2020 | |||
| Total assets | $ | 860,305 | $ | 817,385 | $ | 887,144 |
| Total non-current liabilities | 443,871 | 431,575 | 448,128 | |||
The increase in total assets in the current fiscal quarter compared to the same quarter prior year is mainly due to higher inventory of $38.4 million, higher property, plant and equipment of $11.9 million and higher deferred tax assets of $6.2 million, partially offset by a reduction of trade receivable of $11.1 million.
Non-current liabilities for the current fiscal quarter also increased compared to the same quarter 2020 due mainly to an increase in employee benefits liabilities of $7.3 million, mostly as a result of a change in pension actuarial assumptions and an increase in deferred taxes liabilities of $11.6 million. This was partially offset by a reduction in derivative financial instruments liabilities.
Liquidity
Cash flow generated by Lantic is paid to Rogers by way of dividends and return of capital on the common shares and by the payment of interest on the subordinated notes of Lantic held by Rogers, after taking a reasonable reserve for capital expenditures, debt reimbursement and working capital. The cash received by Rogers is used to pay administrative expenses, interest on the convertible debentures, income taxes and dividends to its shareholders. Lantic had no restrictions on distributions of cash arising from the compliance of financial covenants for the year.
| Q2 2021 | Q2 2020 | YTD 2021 | YTD 2020 | |||||||||
| (In thousands of dollars) | ||||||||||||
| Net cash flow from operating activities | 9,687 | 6,599 | 4,981 | 20,709 | ||||||||
| Cash flow used in financing activities | (10,328 | ) | (2,294 | ) | 6,637 | (9,613 | ) | |||||
| Cash flow used in investing activities | (7,715 | ) | (6,062 | ) | (12,096 | ) | (10,411 | ) | ||||
| Effect of changes in exchange rate on cash | 25 | 552 | (19 | ) | 433 | |||||||
| Net increase (decrease) in cash | (8,331 | ) | (1,205 | ) | (497 | ) | 1,118 | |||||
Cash flow from operating activities for the current quarter increased by $3.1 million compared to the same quarter last year, which is mainly due to an increase in earnings before interests and taxes of $13.0 million and a reduction in interest paid of $4.0 million, partially offset by a negative non-cash working capital variation of $14.6 million. For the first six months of 2021, cash flow from operating activities decreased by $15.7 million, which is mainly explained by a negative non-cash working capital variation of $24.2 million, partially offset by an increase in earnings before interests and taxes of $9.7 million.
The negative variation in cash flow used in financing activities of $8.0 million for the current quarter compared to the same quarter last year is mainly attributable to a reduction of $13.6 million in borrowings from the revolving credit facility and the bank overdraft, partially offset by a reduction in share repurchases under the Normal Course Issuer Bid (“NCIB”) of $5.4 million. For the first six months of 2021, cash flow used in financing activities had a positive variance of $16.3 million, explained mainly by an increase of $10.4 million in borrowings from the revolving credit facility and the bank overdraft and a reduction in share repurchases under the NCIB of $6.5 million.
The cash outflow used in investing activities for the current quarter and the first six months of 2021 were $1.7 million higher, compared to the same periods last year. The variances were mainly related to timing of capital expenditures.
In order to provide additional information, the Company believes it is appropriate to measure free cash flow that is generated by the operations of the Company. Free cash flow is a non-GAAP measure and is defined as cash flow from operations excluding changes in non-cash working capital, mark-to-market and derivative timing adjustments and financial instruments’ non-cash amounts, and including capital expenditures, net of operational excellence capital expenditures, and the payment of capital leases.
FREE CASH FLOW
| Trailing twelve months | ||||
| (In thousands of dollars) | 2021 | 2020 | ||
| Cash flow from operations | 48,855 | 73,288 | ||
| Adjustments: | ||||
| Changes in non-cash working capital | 23,122 | (13,367 | ) | |
| Mark-to-market and derivative timing adjustments | (7,916 | ) | (1,979 | ) |
| Amortization of transitional balances | (138 | ) | (1,192 | ) |
| Financial instruments non-cash amount | 5,932 | (1,699 | ) | |
| Capital expenditures and intangible assets | (27,838 | ) | (27,532 | ) |
| Value added capital expenditures | 9,707 | 10,288 | ||
| Payment of leases obligation | (5,054 | ) | (2,063 | ) |
| Deferred financing charges | (156 | ) | ||
| Free cash flow(1) | 46,670 | 35,588 | ||
| Declared dividends | 37,275 | 37,634 | ||
| Share repurchased | 80 | 7,096 | ||
| (1) See “Non-GAAP Measures” section for definition and reconciliation to GAAP measures. | ||||
Free Cash Flow: https://www.globenewswire.com/NewsRoom/AttachmentNg/ea8c37ed-f5c7-481e-afdb-63f2f92f54fc
Free cash flow for the trailing twelve months ending on April 3, 2021 amounted to $46.7 million, representing an increase of $11.1 million compared to the same period last year. This increase in free cash flow is mainly due to an increase in EBITDA of $7.1 million and lower taxes and interest paid of $5.4 million and $1.4 million, respectively. This variance was partially offset by an increase in capital lease payment during the period and higher capital expenditures.
Capital and intangible assets expenditures, net of value added capital expenditures, increased by $0.9 million compared to last year’s rolling twelve months due mainly to timing in spending. Free cash flow is not reduced by value added capital expenditures, as these projects are not necessary for the operation of the plants but are undertaken because of the operational savings that are realized once the projects are completed.
Financing charges are paid when a new debt financing agreement is completed, and such charges are deferred and amortized over the term of that debt. The cash used in the year to pay for such fees is therefore not available and as a result is deducted from free cash flow.
Payments made for capital leases are deducted from free cash flow as such cash flow is no longer reflected as a reduction in cash flow from operation and is therefore not available.
The Board of Directors declared a quarterly dividend of 9.0 cents per common share every quarter, totalling 36.0 cents for both trailing twelve months periods. The slight decrease in declared dividends for 2021 is due to a reduction in the number of shares outstanding as a result of the purchase and cancellation of shares under the NCIB.
Changes in non-cash operating working capital represent year-over-year movements in current assets, such as accounts receivable and inventories, and current liabilities, such as accounts payables. Movements in these accounts are due mainly to timing in the collection of receivables, receipts of raw sugar and payment of liabilities. Increases or decreases in such accounts are due to timing issues and therefore do not constitute free cash flow. Such increases or decreases are financed from available cash or from our available credit facility of $265.0 million. Increases or decreases in bank indebtedness are also due to timing issues from the above and therefore do not constitute available free cash flow.
The combined impact of the mark-to-market and derivative timing adjustments, amortization of transitional balances and financial instruments non-cash positive amount of $2.1 million for the current rolling twelve months does not represent cash items as these contracts will be settled when the physical transactions occur, which is the reason for the adjustment to free cash flow.
Contractual obligations
There are no material changes in the contractual obligations table disclosed in the Management’s Discussion and Analysis of the October 3, 2020 Annual Report.
As at April 3, 2021, Lantic had commitments to purchase a total of 1,302,000 metric tonnes of raw sugar, of which 292,879 metric tonnes had been priced for a total dollar commitment of $121.4 million.
On April 7, 2021, we signed a two-year extension to the existing agreement with Alberta Sugar Beets Growers, which commits us to purchase the 2021 and 2022 crops.
Capital resources
Lantic has a total of $265.0 million of available working capital from which it can borrow at prime rate, LIBOR rate or under bankers’ acceptances, plus 20 to 250 basis points, based on achieving certain financial ratios. As at April 3, 2021, a total of $470.3 million of assets have been pledged as security for the revolving credit facility, compared to $426.6 million as at March 28, 2020; including trade receivables, inventories and property, plant and equipment.
As at April 3, 2021, $225.0 million had been drawn from the working capital facility and $1.5 million in cash was also available.
Cash requirements for working capital and other capital expenditures are expected to be paid from available cash resources and funds generated from operations. Management believes that the unused credit under the revolving facility is adequate to meet its expected cash requirements.
As at April 3, 2021, Lantic was in compliance with all the covenants under its revolving credit facility.
On April 30, 2021, Lantic issued a private placement of $100 million in the form of senior guaranteed Notes under a note purchase agreement entered into with certain institutional investors. The Notes are guaranteed and rank pari pasu with our existing revolving credit facility. The Notes are due on April 30, 2031. The interest of the Notes was set at 3.49% and the interest will be payable semi-annually in arrears in equal installments on April 30th and October 30th of each year, commencing on October 30, 2021. The proceeds received from the private placement on April 30th were used to refinance existing credit facility indebtedness.
OUTSTANDING SECURITIES
A total of 103,536,923 shares were outstanding as at April 3, 2021 and May 5, 2021, respectively (103,554,993 as at March 28, 2020).
On June 1, 2020, Rogers received approval from the Toronto Stock Exchange to proceed with a Normal Course Issuer Bid (“2020 NCIB”), under which it may purchase up to 1,500,000 common shares. In addition, Rogers entered into an automatic share purchase agreement with Scotia Capital Inc. in connection with the 2020 NCIB. Under the agreement, Scotia may acquire, at its discretion, common shares on the Rogers’ behalf during certain “black-out” periods, subject to certain parameters as to price and number of shares. The 2020 NCIB commenced on June 3, 2020 and may continue to June 2, 2021. No shares have been purchased under the 2020 NCIB as of April 3, 2021.
On May 22, 2019, Rogers received approval from the Toronto Stock Exchange to proceed with a Normal Course Issuer Bid (“2019 NCIB”), under which it may purchase up to 1,500,000 common shares. The 2019 NCIB commenced on May 24, 2019 and terminated on March 30, 2020, whereby all common shares had been purchased. Under the 2019 NCIB, the Company purchased 1,500,000 common shares having a book value of $1.4 million for a total cash consideration of $7.1 million. All shares purchased were cancelled.
RISK AND UNCERTAINTIES
Rogers’ business and operations are substantially affected by many factors, including prevailing margins on refined sugar and its ability to market sugar and maple products competitively, sourcing of raw material supplies, weather conditions, operating costs and government programs and regulations.
Risk factors in our business and operations are discussed in the Management’s Discussion and Analysis of our Annual Report for the year ended October 3, 2020. This document is available on SEDAR at www.sedar.com or on our website at www.LanticRogers.com.
NON-GAAP MEASURES
In analyzing results, we supplement the use of financial measures that are calculated and presented in accordance with IFRS with a number of non-GAAP financial measures. A non-GAAP financial measure is a numerical measure of a company’s performance, financial position or cash flow that excludes (includes) amounts or is subject to adjustments that have the effect of excluding (including) amounts, that are included (excluded) in most directly comparable measures calculated and presented in accordance with IFRS. Non-GAAP financial measures are not standardized; therefore, it may not be possible to compare these financial measures with the non-GAAP financial measures of other companies having the same or similar businesses. We strongly encourage investors to review the audited consolidated financial statements and publicly filed reports in their entirety, and not to rely on any single financial measure.
We use these non-GAAP financial measures in addition to, and in conjunction with, results presented in accordance with IFRS. These non-GAAP financial measures reflect an additional way of viewing aspects of the operations that, when viewed with the IFRS results and the accompanying reconciliations to corresponding IFRS financial measures, may provide a more complete understanding of factors and trends affecting our business.
The following is a description of the non-GAAP measures used by the Company in the MD&A:
- Adjusted gross margin is defined as gross margin adjusted for:
- “the adjustment to cost of sales”, which comprises the mark-to-market gains or losses on sugar futures, foreign exchange forward contracts and embedded derivatives as shown in the notes to the consolidated financial statements and the cumulative timing differences as a result of mark-to-market gains or losses on sugar futures, foreign exchange forward contracts and embedded derivatives as described below; and
- “the amortization of transitional balance to cost of sales for cash flow hedges”, which is the transitional marked-to-market balance of the natural gas futures outstanding as of October 1, 2016 amortized over time based on their respective settlement date until all existing natural gas futures have expired, as shown in the notes to the consolidated financial statements.
- Adjusted results from operating activities is defined as results from operating activities adjusted for the adjustment to cost of sales, the amortization of transitional balances to cost of sales for cash flow hedges.
- Adjusted EBITDA is defined as adjusted results from operating activities adjusted to add back depreciation and amortization expenses, goodwill impairment, the Sugar segment acquisition costs and the Maple segment non-recurring expenses.
- Adjusted net earnings is defined as net earnings adjusted for the adjustment to cost of sales, the amortization of transitional balances to cost of sales for cash flow hedges, the amortization of transitional balance to net finance costs and the income tax impact on these adjustments. Amortization of transitional balance to net finance costs is defined as the transitional marked-to-market balance of the interest rate swaps outstanding as of October 1, 2016, amortized over time based on their respective settlement date until all existing interest rate swaps agreements have expired, as shown in the notes to the consolidated financial statements.
- Adjusted gross margin rate per MT is defined as adjusted gross margin of the Sugar segment divided by the sales volume of the Sugar segment.
- Adjusted gross margin percentage is defined as the adjusted gross margin of the Maple segment divided by the revenues generated by the Maple segment.
- Adjusted net earnings per share is defined as adjusted net earnings divided by the weighted average number of shares outstanding.
- Free cash flow is defined as cash flow from operations excluding changes in non-cash working capital, mark-to-market and derivative timing adjustments, amortization of transitional balances, financial instruments non-cash amount, and includes deferred financing charges, funds received from stock options exercised, capital and intangible assets expenditures, net of operational excellence capital expenditures, and payments of capital leases.
In the MD&A, we discuss the non-GAAP financial measures, including the reasons why we believe these measures provide useful information regarding the financial condition, results of operations, cash flows and financial position, as applicable. We also discuss, to the extent material, the additional purposes, if any, for which these measures are used. These non-GAAP measures should not be considered in isolation, or as a substitute for, analysis of the Company’s results as reported under GAAP. Reconciliations of non-GAAP financial measures to the most directly comparable IFRS financial measures are as follows:
RECONCILIATION OF NON-GAAP FINANCIAL MEASURES TO IFRS FINANCIAL MEASURES
| Q2 2021 | Q2 2020 | |||||||||
| Consolidated results (In thousands of dollars) | Sugar | Maple Products | Total | Sugar | Maple Products | Total | ||||
| Gross margin | 26,423 | 5,028 | 31,451 | 16,664 | 2,726 | 19,930 | ||||
| Total adjustment to the cost of sales(1) | (4,630 | ) | 586 | (4,044 | ) | 2,546 | 1,676 | 4,222 | ||
| Adjusted Gross Margin | 21,793 | 5,614 | 27,407 | 19,210 | 4,420 | 23,612 | ||||
| Results from operating activities | 17,029 | 2,122 | 19,151 | 7,090 | (1,032 | ) | 6,058 | |||
| Total adjustment to the cost of sales(1) | (4,630 | ) | 586 | (4,044 | ) | 2,546 | 1,676 | 4,222 | ||
| Adjusted results from operating activities | 12,399 | 2,708 | 15,107 | 9,636 | 644 | 10,280 | ||||
| Results from operating activities | 17,029 | 2,122 | 19,151 | 7,090 | (1,032 | ) | 6,058 | |||
| Total adjustment to the cost of sales(1) | (4,630 | ) | 586 | (4,044 | ) | 2,546 | 1,676 | 4,222 | ||
| Depreciation of property, plant and equipment, amortization of intangible assets and right-of-use assets | 4,611 | 1,657 | 6,268 | 4,211 | 1,661 | 5,872 | ||||
| Maple Segment non-recurring costs | - | - | - | - | 370 | 370 | ||||
| Adjusted EBITDA | 17,010 | 4,365 | 21,375 | 13,847 | 2,675 | 16,522 | ||||
| Net earnings | 10,778 | 965 | ||||||||
| Total adjustment to the cost of sales(1) | (4,044 | ) | 4,222 | |||||||
| Amortization of transitional balance to net finance costs(1) | - | (65 | ) | |||||||
| Income taxes on above adjustments | 1,017 | (1,086 | ) | |||||||
| Adjusted net earnings | 7,751 | 4,036 | ||||||||
| Net earnings per share (basic) | 0.10 | 0.01 | ||||||||
| Adjustment for the above | (0.03 | ) | 0.03 | |||||||
| Adjusted net earnings per share (basic) | 0.07 | 0.04 | ||||||||
| (1) See “Adjusted results” section | ||||||||||
| YTD 2021 | YTD 2020 | ||||||||
| Consolidated results (In thousands of dollars) | Sugar | Maple Products | Total | Sugar | Maple Products | Total | |||
| Gross margin | 58,764 | 11,300 | 70,064 | 49.893 | 8,543 | 58,436 | |||
| Total adjustment to the cost of sales(1) | (6,275 | ) | 70 | (6,205 | ) | 92 | 1,610 | 1,702 | |
| Adjusted Gross Margin | 52,489 | 11,370 | 63,859 | 49,985 | 10,153 | 60,138 | |||
| Results from operating activities | 37,033 | 5,450 | 42,483 | 31,520 | 1,289 | 32,809 | |||
| Total adjustment to the cost of sales(1) | (6,275 | ) | 70 | (6,205 | ) | 92 | 1,610 | 1,702 | |
| Adjusted results from operating activities | 30,758 | 5,520 | 36,278 | 31,612 | 2,899 | 34,511 | |||
| Results from operating activities | 37,033 | 5,450 | 42,483 | 31,520 | 1,289 | 32,809 | |||
| Total adjustment to the cost of sales(1) | (6,275 | ) | 70 | (6,205 | ) | 92 | 1,610 | 1,702 | |
| Depreciation of property, plant and equipment, amortization of intangible assets and right-of-use assets | 8,983 | 3,514 | 12,497 | 8,355 | 3,239 | 11,594 | |||
| Maple Segment non-recurring costs | - | 247 | 247 | - | 644 | 644 | |||
| Adjusted EBITDA | 39,741 | 9,281 | 49,022 | 39,967 | 6,782 | 46,749 | |||
| Net earnings | 24,551 | 16,929 | |||||||
| Total adjustment to the cost of sales(1) | (6,205 | ) | 1,702 | ||||||
| Amortization of transitional balance to net finance costs(1) | - | (131 | ) | ||||||
| Income taxes on above adjustments | 1,653 | (366 | ) | ||||||
| Adjusted net earnings | 19,999 | 18,134 | |||||||
| Net earnings per share (basic) | 0.24 | 0.16 | |||||||
| Adjustment for the above | (0.05 | ) | 0.01 | ||||||
| Adjusted net earnings per share (basic) | 0.19 | 0.17 | |||||||
| (1) See “Adjusted results” section | |||||||||
CRITICAL ACCOUNTING ESTIMATES
For the second quarter and the first six month of fiscal 2021, there were no significant changes in the critical accounting estimate as disclosed in our Management’s Discussion and Analysis of the October 3, 2020 Annual Report.
CHANGES IN ACCOUNTING PRINCIPLES AND PRACTICES NOT YET ADOPTED
A number of new standards, and amendments to standards and interpretations, are not yet effective and have not been applied in preparing the unaudited consolidated interim financial statements for the second quarter of 2021. Management has reviewed such new standards, proposed amendments and does not anticipate that they will have a material impact on Rogers’ financial statements. Refer to note 3 (b) of the unaudited condensed interim financial statements and to note 3 (q) of the 2020 audited consolidated financial statements for details.
CONTROLS AND PROCEDURES
In accordance with Regulation 52-109 respecting certification of disclosure in issuers’ interim filings, the Chief Executive Officer and Chief Financial Officer have designed or caused it to be designed under their supervision, disclosure controls and procedures (“DC&P”).
In addition, the Chief Executive Officer and Chief Financial Officer have designed or caused it to be designed under their supervision internal controls over financial reporting (“ICFR”) to provide reasonable assurance regarding the reliability of financial reporting and the preparation of financial statements for external purposes.
The Chief Executive Officer and Chief Financial Officer have evaluated whether or not there were any changes to Rogers’ ICFR during the six-month period ended April 3,2021 that have materially affected, or are reasonably likely to materially affect, Rogers’ ICFR. No such changes were identified through their evaluation.
FORWARD-LOOKING STATEMENTS
This report contains Statements or information that are or may be “forward-looking statements” or “forward-looking information” within the meaning of applicable Canadian securities laws. Forward-looking statements may include, without limitation, statements and information which reflect the current expectations of the Company with respect to future events and performance. Wherever used, the words “may,” “will,” “should,” “anticipate,” “intend,” “assume,” “expect,” “plan,” “believe,” “estimate,” and similar expressions and the negative of such expressions, identify forward-looking statements.
Although this is not an exhaustive list, Rogers cautions investors that statements concerning the following subjects are, or are likely to be, forward-looking statements:
- future prices of raw sugar
- natural gas costs
- the opening of special refined sugar quotas in the United States (“U.S.”)
- beet production forecasts
- growth of the maple syrup industry
- the status of labour contracts and negotiations
- the level of future dividends
- the status of government regulations and investigations
- the impact of the COVID-19 pandemic on the Corporation and its operations.
Forward-looking statements are based on estimates and assumptions made by Rogers in light of its experience and perception of historical trends, current conditions and expected future developments, as well as other factors that we believe are appropriate and reasonable in the circumstances, including with respect to the continuity of its operations despite the COVID-19 pandemic, but there can be no assurance that such estimates and assumptions will prove to be correct. Forward-looking statements involve known and unknown risks, uncertainties and other factors that may cause actual results or events to differ materially from those anticipated in such forward-looking statements. Actual performance or results could differ materially from those reflected in the forward-looking statements, historical results or current expectations. Readers should also refer to the section “Risks and Uncertainties” in this MD&A for additional information on risk factors and other events that are not within our control. These risks are also referred to in Rogers’ Annual Information Form in the “Risk Factors” section.
Although we believe that the expectations and assumptions on which forward-looking information is based are reasonable under the current circumstances, readers are cautioned not to rely unduly on this forward-looking information as no assurance can be given that it will prove to be correct. Forward-looking information contained herein is made as at the date of this MD&A and Rogers does not undertake any obligation to update or revise any forward-looking information, whether as a result of events or circumstances occurring after the date hereof, unless so required by law.
The complete financial statements are available at the following link: http://ml.globenewswire.com/Resource/Download/e1720ffc-a10f-4d4f-b648-9d3cb1002ff6
For further information Mr. Jean-Sébastien CouillardVice President of Finance, Chief Financial Officer and Corporate SecretaryPhone: (514) 940-4350 Email: [email protected]
![]()
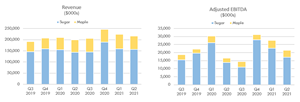
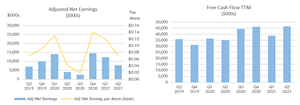
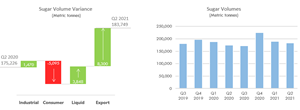
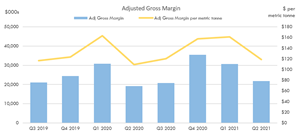
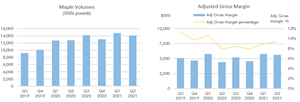
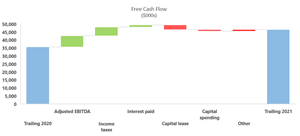
Serious News for Serious Traders! Try StreetInsider.com Premium Free!
You May Also Be Interested In
- IBM tumbles on soft Q1 revenue; announces HashiCorp $6.4bn acquisition
- YPF SA reports
- ADSK INVESTOR ALERT: ROSEN, TOP RANKED INVESTOR COUNSEL, Encourages Autodesk, Inc. Investors to Secure Counsel Before Important Deadline in Securities Class Action First Filed by the Firm – ADSK
Create E-mail Alert Related Categories
Globe Newswire, Press ReleasesRelated Entities
Dividend, Earnings, Definitive AgreementSign up for StreetInsider Free!
Receive full access to all new and archived articles, unlimited portfolio tracking, e-mail alerts, custom newswires and RSS feeds - and more!
